
 Submit a Paper
 Propose a Special lssue
 Open Access
ARTICLE

Heating the Future: Solar Hot Water Collectors for Energy-Efficient Homes in Sweden
1 Energy and Environment Research Center, ShK.C., Islamic Azad University, Shahrekord, Iran
2 Department of Civil Engineering, Ro.C., Islamic Azad University, Tehran, Iran
3 Faculty of Engineering, Shahrekord University, Shahrekord, Iran
* Corresponding Author: Mehdi Jahangiri. Email:
(This article belongs to the Special Issue: Solar and Thermal Energy Systems)
Energy Engineering 2026, 123(2), 6 https://doi.org/10.32604/ee.2025.070190
Received 10 July 2025; Accepted 03 November 2025; Issue published 27 January 2026
 View Full Text
 Download PDF
Abstract
The technical, economic, and environmental performance of solar hot-water (SWH) systems for Swedish residential apartments—where approximately 80% of household energy is devoted to space heating and sanitary hot-water production—was assessed. Two collector types, flat plate (FP) and evacuated tube (ET), were simulated in TSOL Pro 5.5 for five major cities (Stockholm, Göteborg, Malmö, Uppsala, Linköping). Climatic data and cold-water temperatures were sourced from Meteonorm 7.1, and economic parameters were derived from recent national statistics and literature. All calculations explicitly accounted for heat losses from collectors, storage tanks, and internal and external piping systems, and established solar-fraction equations and NPV methodology were applied. Sensitivity analyses were conducted to determine optimal collector area and hot-water storage volume. Additionally, a Monte Carlo uncertainty analysis (10,000 iterations, ±10%) and break-even subsidy/carbon-credit assessments were performed. The discount rate for NPV calculations was set at 0% for capital interest with a 5% reinvestment return over a 25-year lifespan. The highest annual solar heat yield (8017.5 kWh) was obtained in Malmö with 32 m2 of ET collectors, meeting 52.7% of total heating demand. Annual CO2 emissions were avoided by FP and ET systems by approximately ~9.07 and ~10.55 tonnes, respectively. Economic analysis showed that no payback was achieved without government allowance; however, at a $0.05/m2 allowance, positive NPV was exhibited at all stations. Lower levelized heat costs were delivered by FP systems, while ET systems demonstrated consistent superiority under climatic and economic variability according to the Monte Carlo analysis. Optimal design parameters were identified as 32 collectors and a 1680 L heating buffer tank, and Sankey diagrams highlighted collector losses as the dominant inefficiency. It was concluded that properly designed SWH systems, when supported by targeted subsidies, can significantly reduce fossil-fuel demand and CO2 emissions in Swedish residential buildings. This work provides the first city-specific technical–economic–environmental dataset for Sweden, establishes a foundation for a national solar-heating atlas, and informs policymaking toward 100% renewable energy targets; beyond the baseline evaluation, explicit subsidy and carbon-price thresholds, quantified uncertainty ranges, and loss-flow visualizations are also provided, reinforcing the robustness and policy relevance of the findings.Keywords
World energy demand is expected to triple by the end of the 21st century [1]. This has spurred a rapid transition in the energy sector, with a growing reliance on renewable energy sources due to the limitations of conventional fuels in terms of both resource availability and efficiency [2]. Among these renewables, solar energy stands out for its abundant supply [3]. Solar energy serves a multitude of functions, including drying products such as vegetables and fruits, heating water, and treating saltwater, among others, employing an array of affordable tools. The solar water heater (SWH) system transforms solar energy into thermal energy. SWHs find utility in diverse household applications, encompassing water heating, cooling, space heating, and more. SWHs are innovative in design, have lower operating temperatures and fewer mechanical components, and are easy to build [4]. Approximately half of the world’s total final energy consumption is attributed to heat consumption within residential and industrial sectors [5]. Buildings stand as significant energy consumers and contributors to CO2 emissions, constituting 40% of the EU’s total energy consumption. Within residential areas of EU countries, space heating and domestic hot water (DHW) alone can make up to 80% of final energy consumption [6]. Despite this, a substantial 84% of heating and cooling energy in the EU still relies on fossil fuels, with only a modest 16% sourced from renewable energy [7]. In order to meet the climate and energy objectives outlined in the Paris Agreement, as well as international and national energy policies, efforts to enhance decarbonization and energy efficiency cannot solely focus on the electricity sector. It’s imperative to also expedite the transition within the heating sector [8]. Providing solar heating for low-temperature applications (below 95°C) has the potential to serve as a significant contributor to the integration of renewable energy sources in the future energy landscape. Projections suggest that by 2050, this sector could represent over 16% of the global final energy consumption for low-temperature heat, equivalent to 16.5 EJ [9]. In numerous European nations, the collective solar thermal potential is approximated to range between 3% and 12% of the overall heat production [10]. Fig. 1 illustrates the distribution of solar heat collectors across various continents [11].
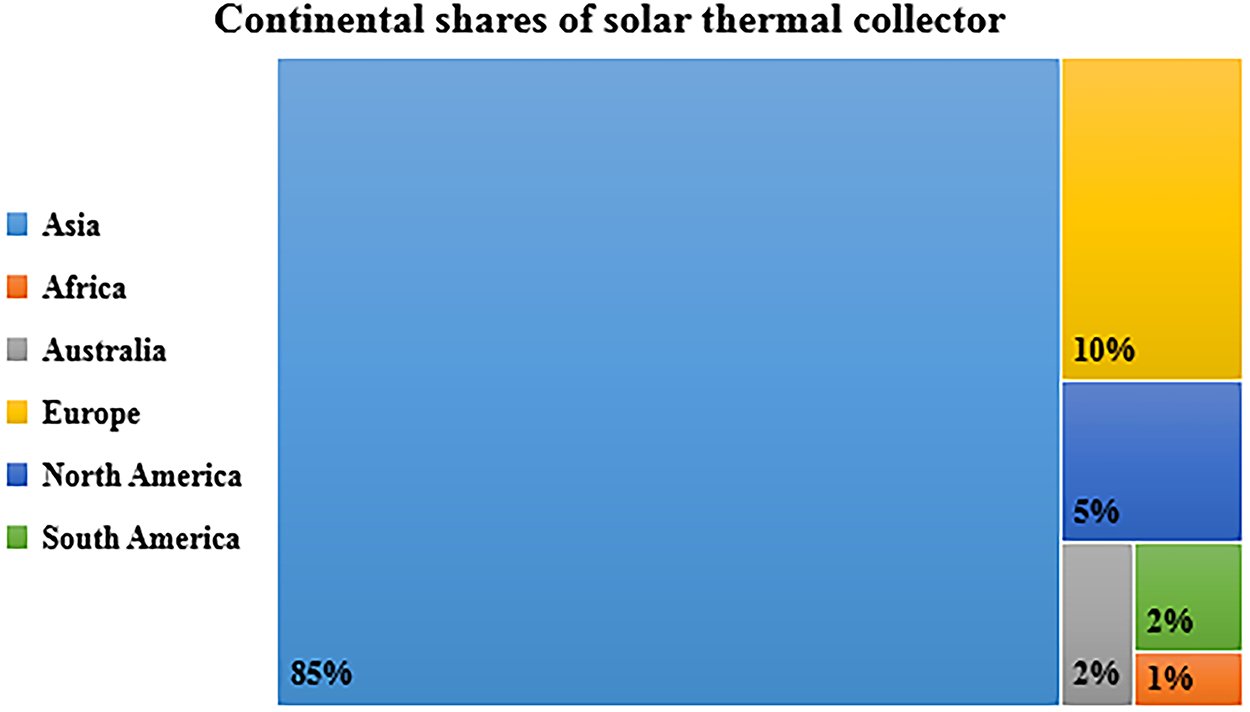
Figure 1: The proportion (in percentage) of solar thermal collectors across different continents [11]. Proportion of solar thermal collector installations by continent (%), based on international market data for 2019. Data represent all collector types (FP, ET, unglazed) and are not site-specific
Sweden, situated in northern Europe, shares borders with Norway to the west and north, Finland to the east, and is connected to Denmark via the Öresund Strait in the southwest. Covering an area of 450,295 km2, Sweden stands as the largest country in Northern Europe, the third-largest within the European Union, and the fifth-largest across the continent. The capital of Sweden is Stockholm, and the country has a total population of 10.4 million [12]. Sweden’s reliance on imported fossil fuels has seen a notable decrease since the 1970s. The percentage of total energy supply derived from fossil fuels such as coal, coke, crude oil, and petroleum products dropped from 81% in 1970 to 27% in 2017. Sweden has set ambitious policy objectives, aiming for 100% renewable energy by 2040 and net carbon neutrality by 2045 [13]. Electricity stands out as the most costly energy source in Sweden [14], and the nation boasts one of the world’s highest per capita electricity consumption rates, at 15,000 kWh per person per year. This is largely due to relatively high heating expenses stemming from cold weather, with 60% of residential energy allocated to space heating and DHW [15]. As indicated by Table 1 and Fig. 2, renewable energy’s share in Sweden reached 1774 ktoe by 2019 [16]. Fig. 3 provides insights into the present status of the solar energy market in Sweden, its projected development, and potential enhancement strategies [17,18].
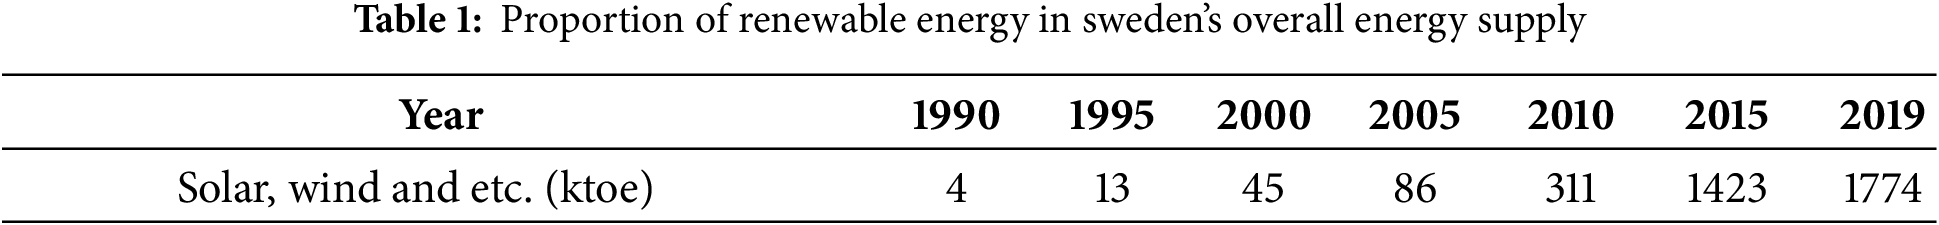
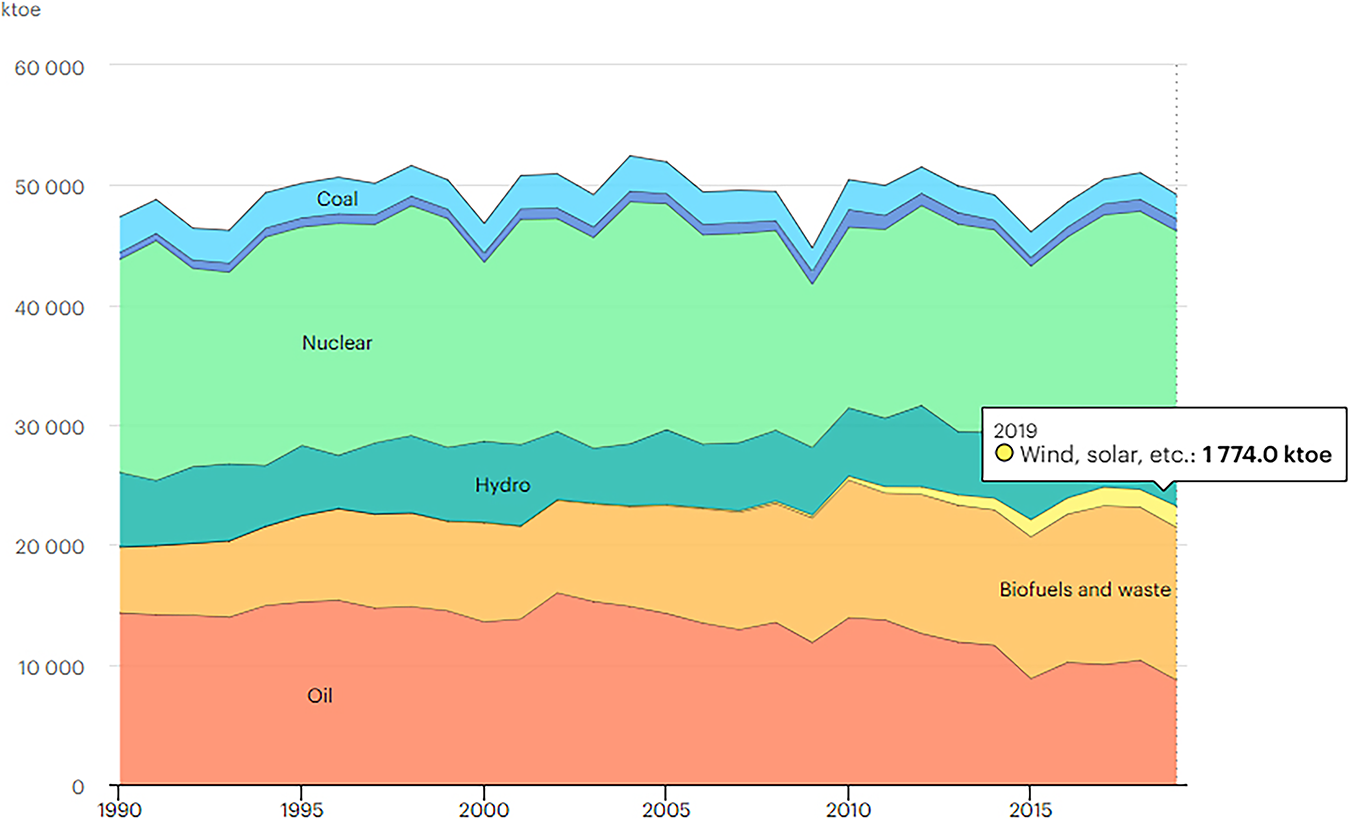
Figure 2: Total energy supply by source, Sweden 1990–2019 [16]. Total annual energy supply in Sweden by source (1990–2019), including renewables (solar, wind, hydro, biomass) and fossil fuels. Period: historical national statistics from IEA
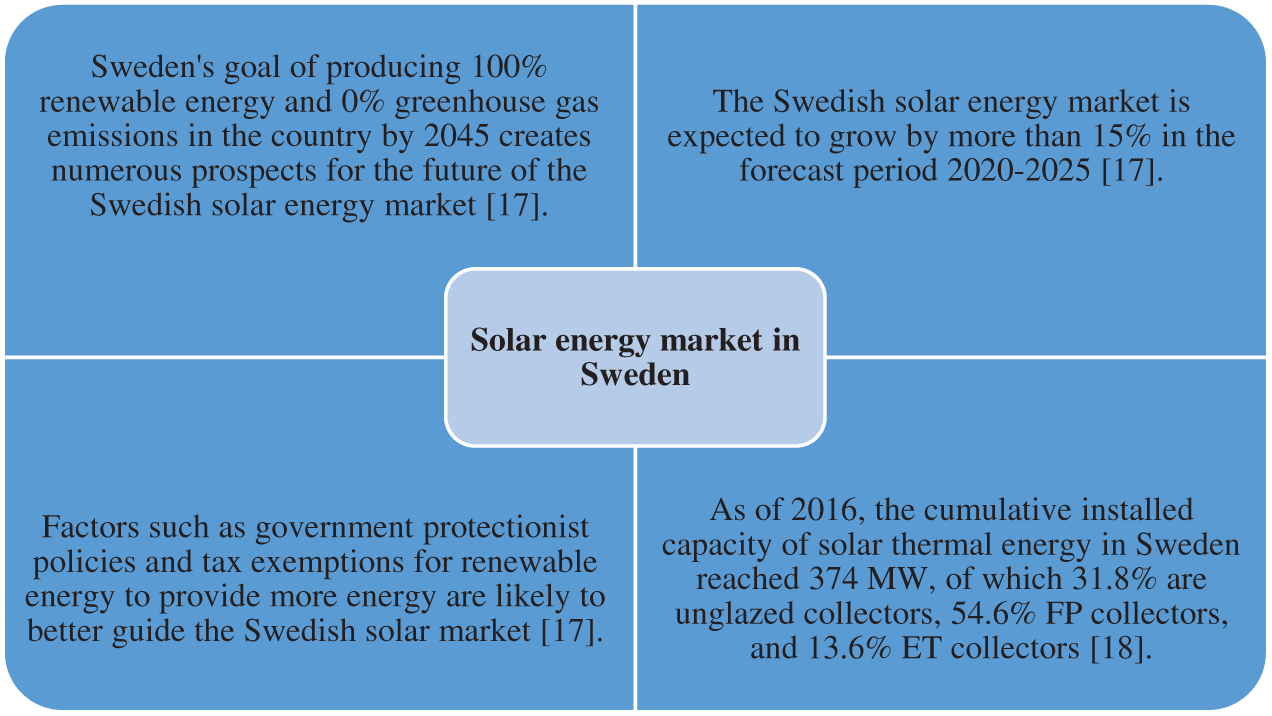
Figure 3: Solar energy market in Sweden [17,18]. Swedish solar energy market growth (2010–2019) and projections to 2030. Market sizes expressed as installed collector area per year (m2). Data apply nationally, not to individual simulation sites
Fig. 4 illustrates the levels of global horizontal solar radiation in Sweden [19]. It’s worth noting that moving from the north to the south of the country correlates with an increase in solar radiation. Consequently, the maximum average annual global radiation reaches approximately 1100 kWh/m2 in the southern regions and around 900 kWh/m2 in the northern areas [20].
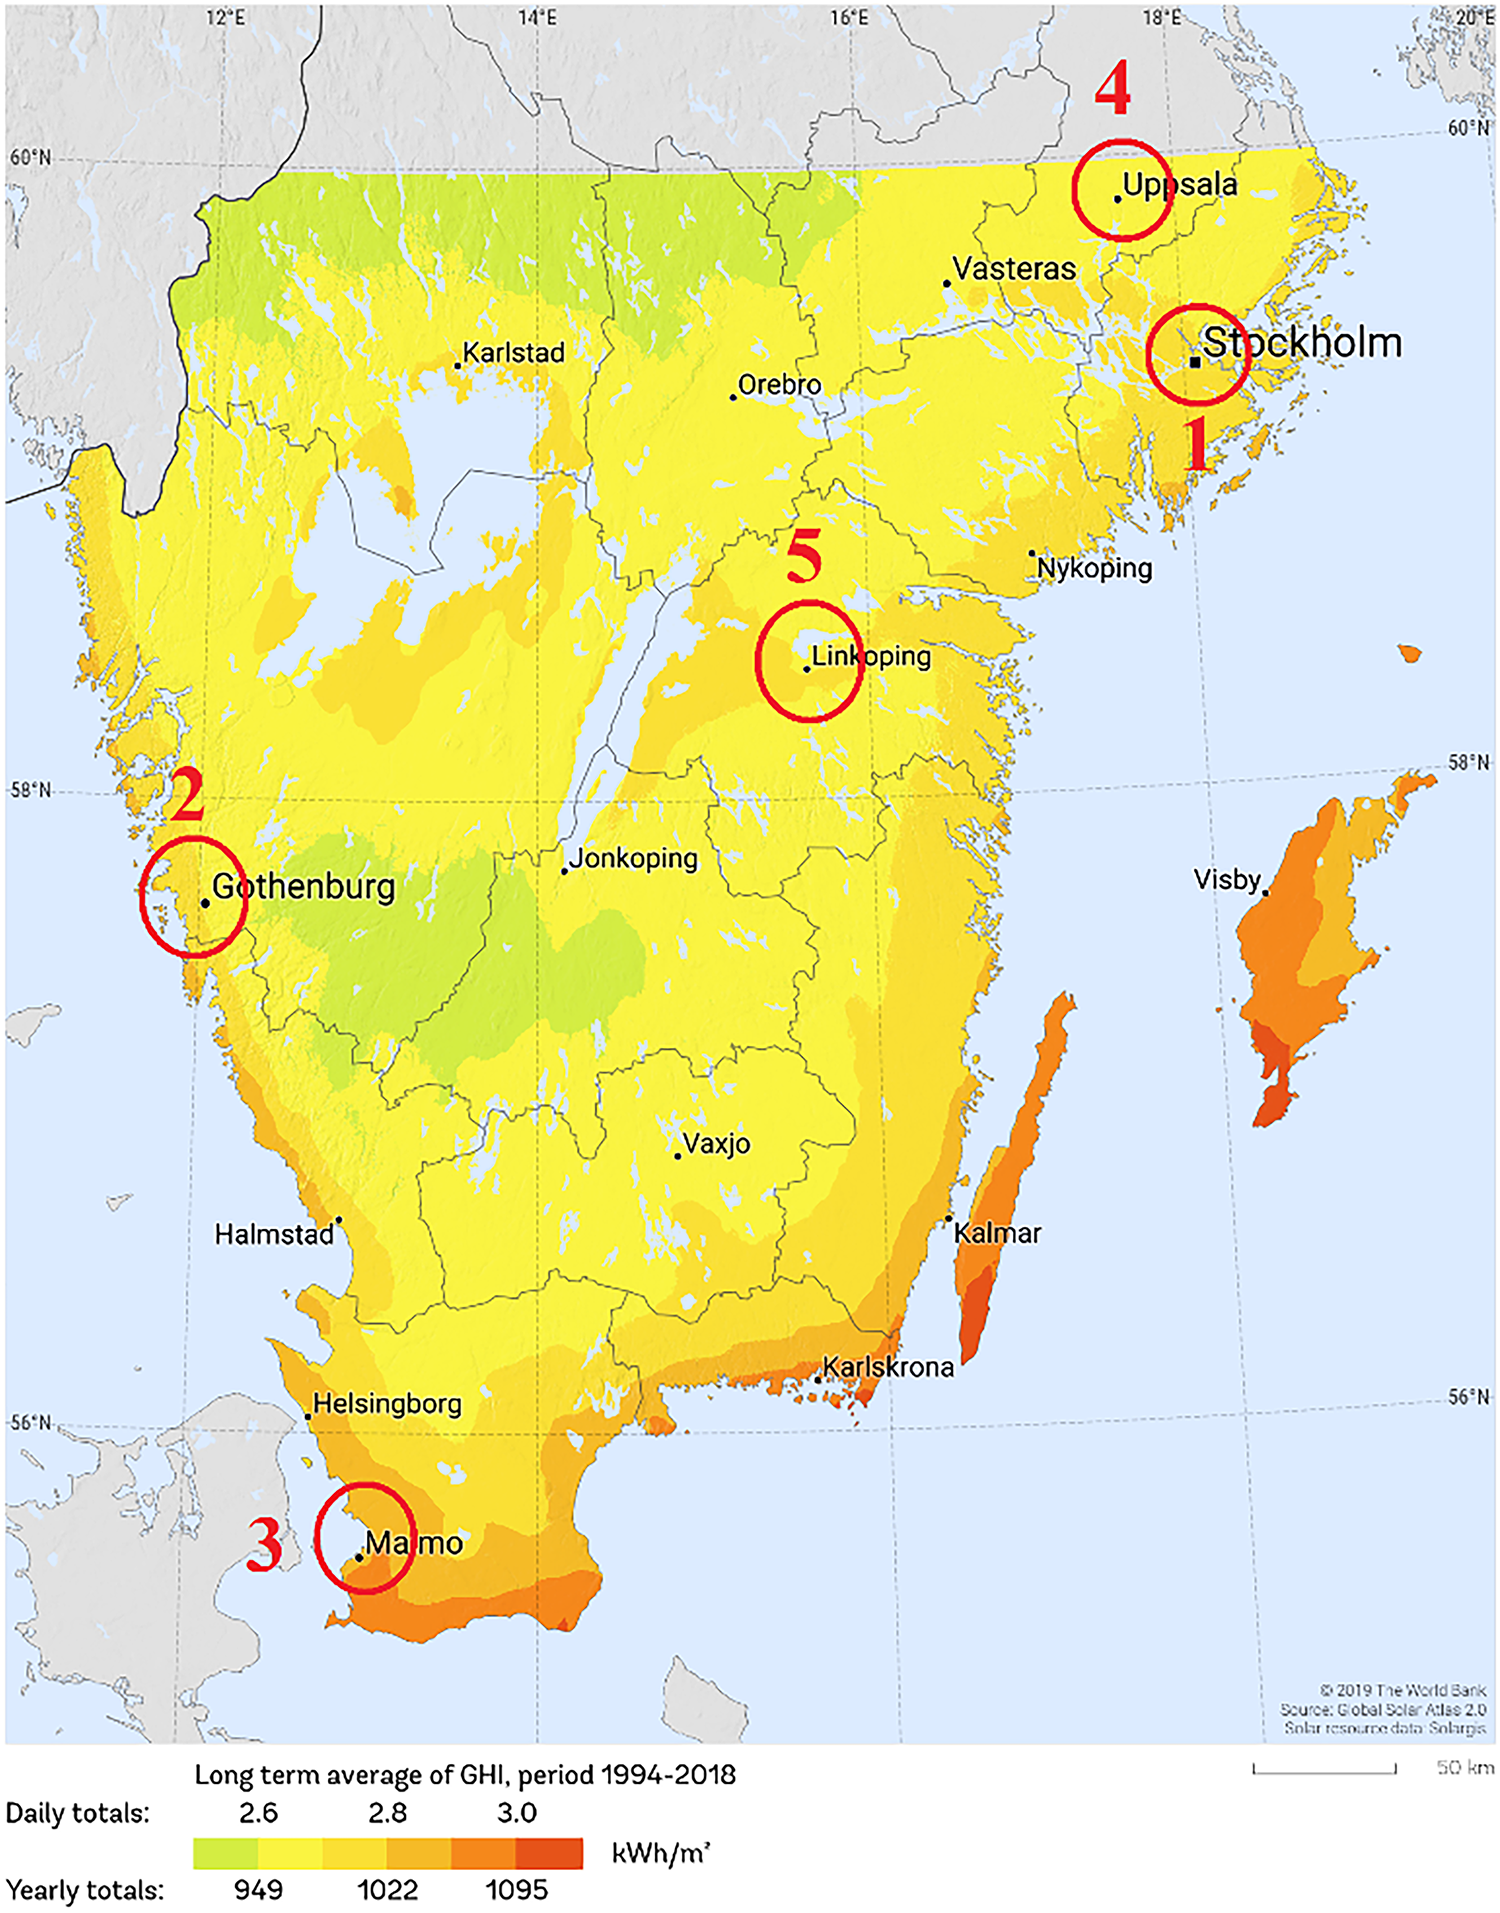
Figure 4: Global horizontal irradiation in Sweden [19]. Average annual Global Horizontal Irradiation (GHI) in Sweden (kWh/m2), 1994–2018 mean values, derived from SOLARGIS site
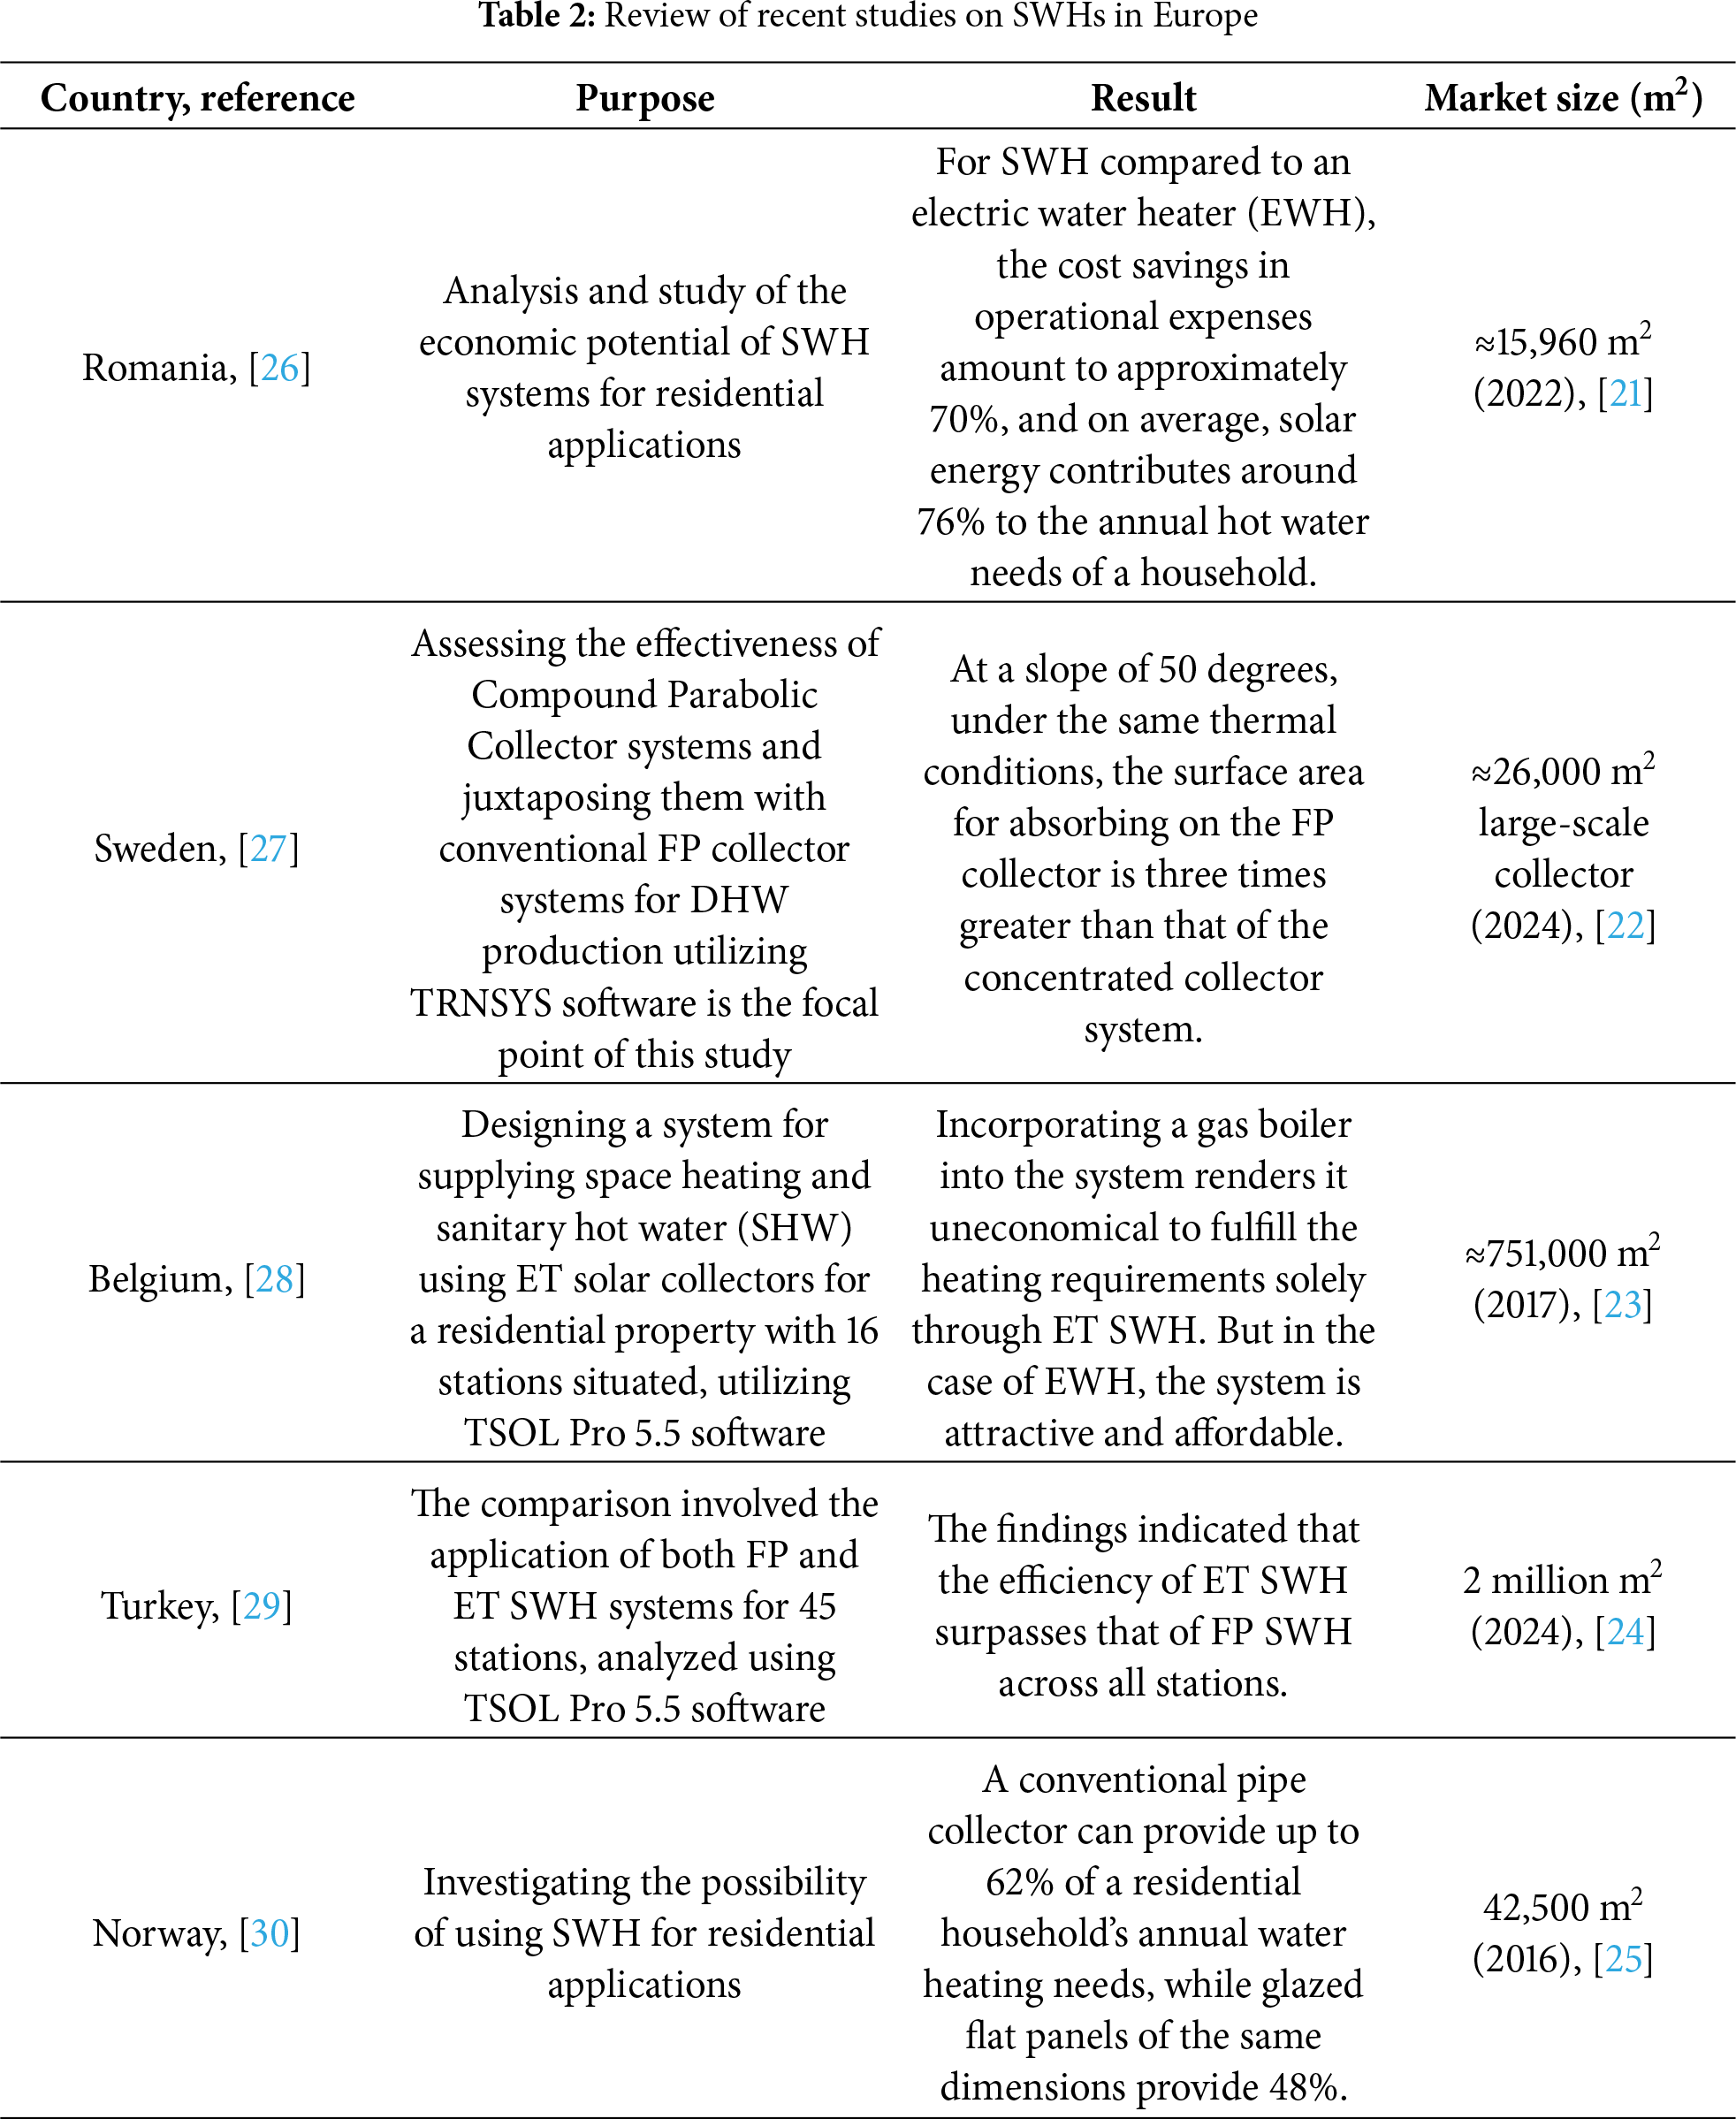
Table 2 summarizes recent research on the utilization of SWHs in Europe. It is evident that there has been limited exploration in this field. Therefore, the need for a comprehensive study of the major cities in Sweden in order to find the potential of each city and help produce a solar heating atlas for Sweden seems necessary. Table 2 also examines the market size for the installation of various types of solar heating collectors [21–25]. The reported market sizes represent the most recent available data for installed solar-thermal collector areas (m2) in each country, reflecting the current scale of SWH deployment across selected countries in Europe.
Comparative studies in neighboring Nordic countries reinforce the novelty of the present work. In Norway, recent research has examined the integration of renewable-based systems in island and cold climate contexts, focusing on flexibility and decarbonization strategies rather than city-scale SWH performance [31]. In Denmark, most advances have concentrated on large-scale solar thermal integration within 4th generation district heating and smart energy systems, emphasizing system flexibility, seasonal storage, and integration with broader smart grids rather than stand-alone residential applications [32,33]. While Sweden has had some performance assessments of combined photovoltaic/thermal concepts under local climate conditions [34], these analyses have been limited in spatial coverage and technology scope. Unlike these studies, the present research delivers a multi-city, system-level energy–economic–environmental evaluation for Swedish residential apartments using both FP and ET collectors. This approach addresses spatial and technological variability within Sweden’s climatic and policy context, thereby filling a documented gap in the Nordic solar heating literature.
Guided by the literature and contextual gaps, this study is designed to address three interrelated research questions:
(i) What is the optimal collector sizing for different climatic regions in Sweden to maximize solar fraction without compromising economic feasibility?
(ii) What is the optimal storage volume for space heating and DHW that balances performance gain against capital cost?
(iii) How sensitive is the overall system performance and economic viability to different levels of government subsidy allowances?
By answering these questions through detailed simulation, techno-economic analysis, and sensitivity assessment, this paper aims to provide a robust and scalable evidence base for Sweden’s national solar heating strategy.
Despite significant research on SWH systems in Europe, there has been no comprehensive, city-specific evaluation for Sweden that jointly considers technical performance, economic feasibility under varying subsidy levels, and environmental impact [35,36]. Previous Nordic studies have primarily focused on Norwegian island grids, Danish district-heating networks, or limited site sample sizes, leaving a gap in understanding the optimal design and policy needs for Swedish residential buildings. This study addresses that gap by (i) quantifying the optimal collector sizing and storage volume for five major Swedish cities, (ii) assessing the sensitivity of system economics to government subsidies and carbon pricing, and (iii) benchmarking energy and CO2 savings against comparable European contexts. The resulting dataset and analysis provide the first integrated technical–economic–environmental baseline for SWH deployment in Sweden, supporting both municipal planning and the development of a national solar heating atlas.
The present approach lies in the fact that it provides design- and policy-relevant insights that conventional frameworks generally do not capture. Most existing studies focus on single-site or purely technical analyses, whereas the present work offers:
• A multi-city, multi-climate comparison across five representative Swedish locations, highlighting spatial variability in solar fraction, CO2 savings, and economics.
• A fully integrated techno-economic–environmental framework, combining useful heat output, avoided emissions, and investment profitability in one consistent model.
• The derivation of explicit break-even thresholds—both in terms of subsidy allowance (A*) and carbon credit price (P*CO2)—which directly inform policymakers about the minimum support levels required for viability.
• A Monte Carlo uncertainty analysis that quantifies the robustness of results against variability in irradiation, subsidies, and collector efficiency, thereby providing confidence intervals instead of single deterministic outcomes.
• A policy-oriented design interpretation, showing not only which collector type performs better technically (ET vs. FP), but also under which financial and climatic conditions each technology becomes economically justified.
In this way, the approach moves beyond existing frameworks by linking system design parameters (collector number, tank volume, technology type) with economic thresholds and environmental benefits under uncertainty. This integration provides actionable guidance for both engineers and policymakers that traditional single-dimensional studies cannot deliver.
2.1 Stations under Study and Required Data
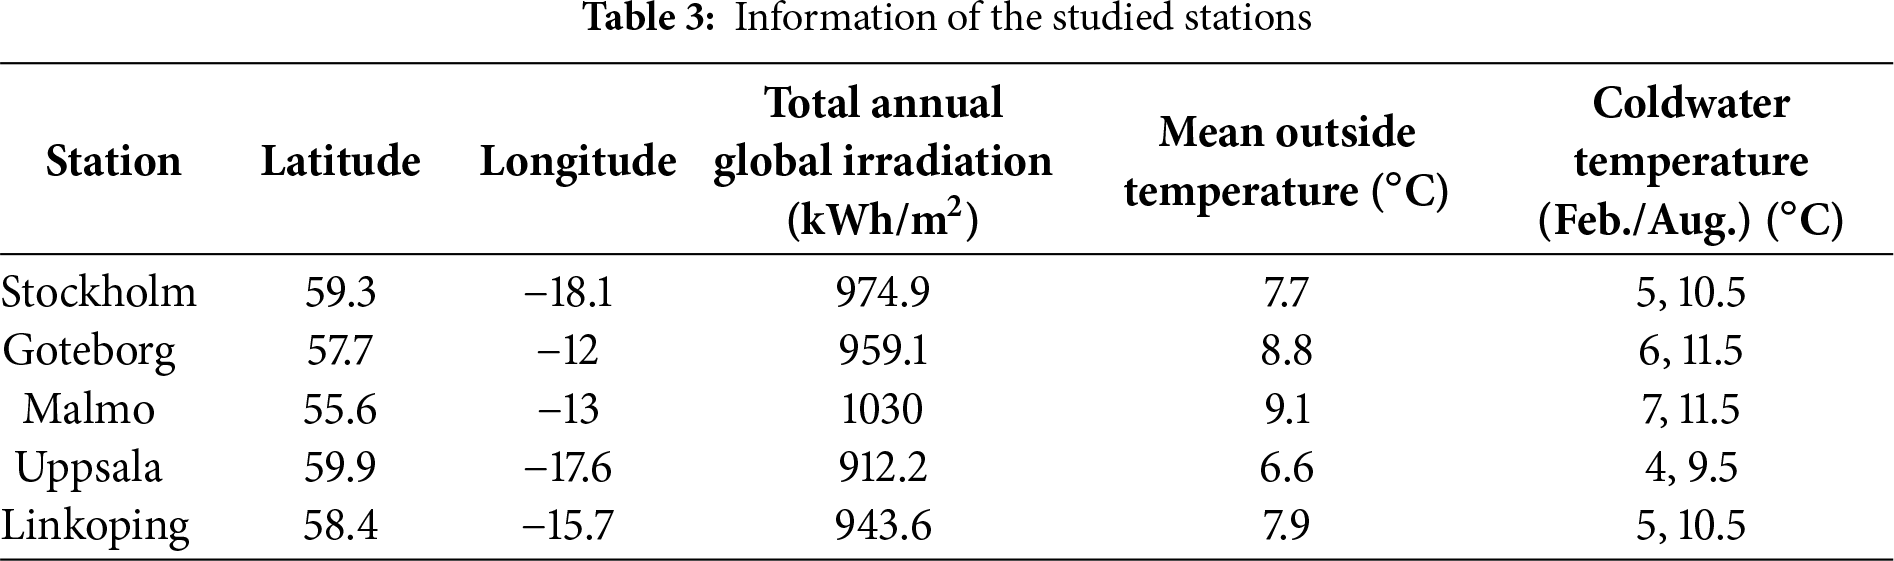
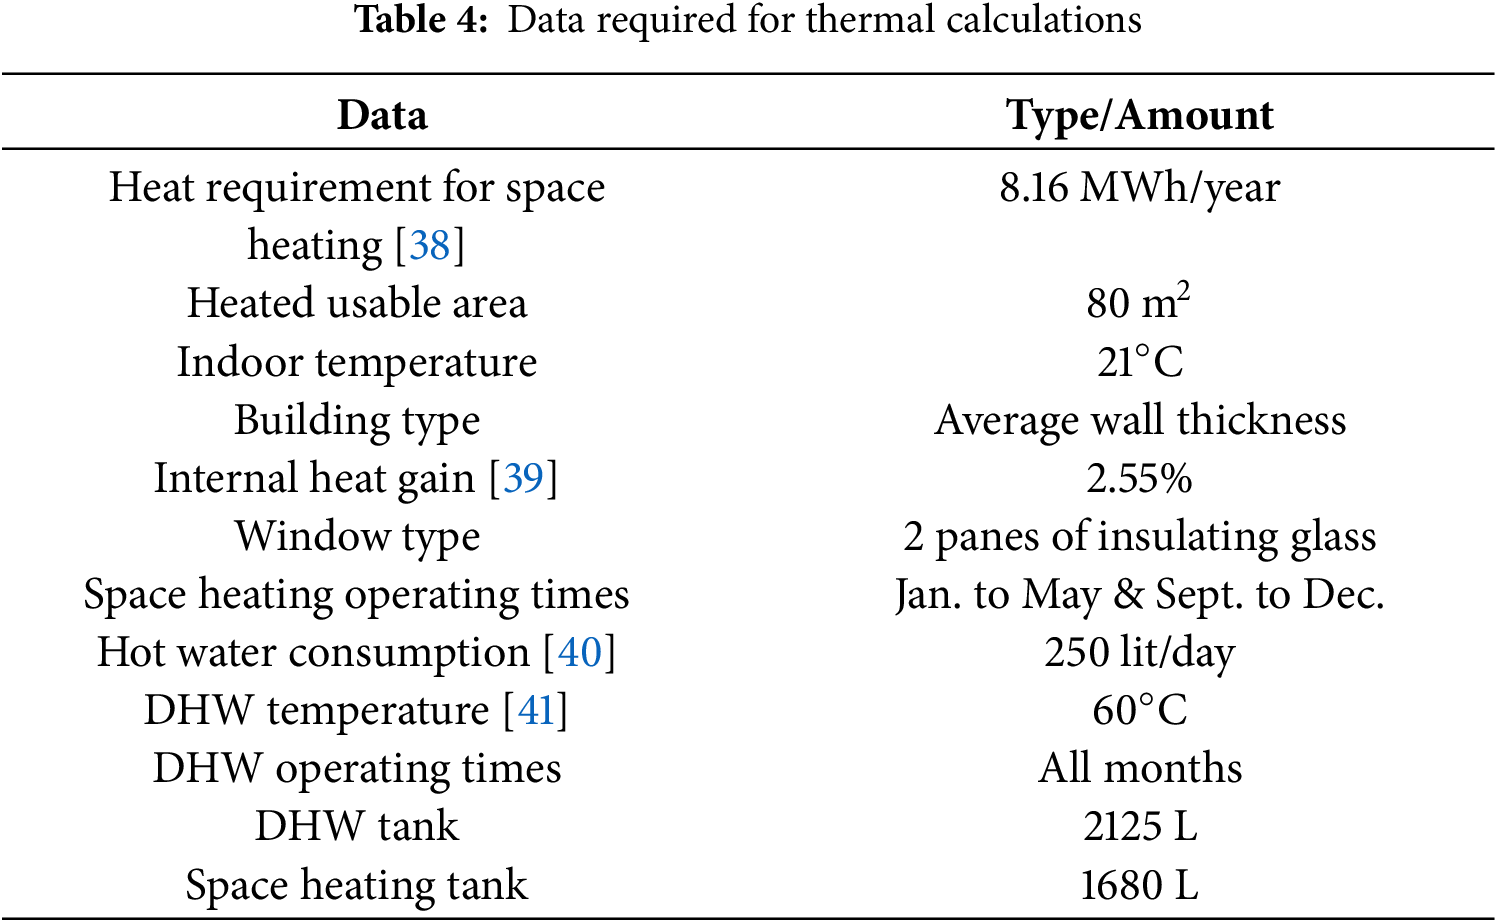
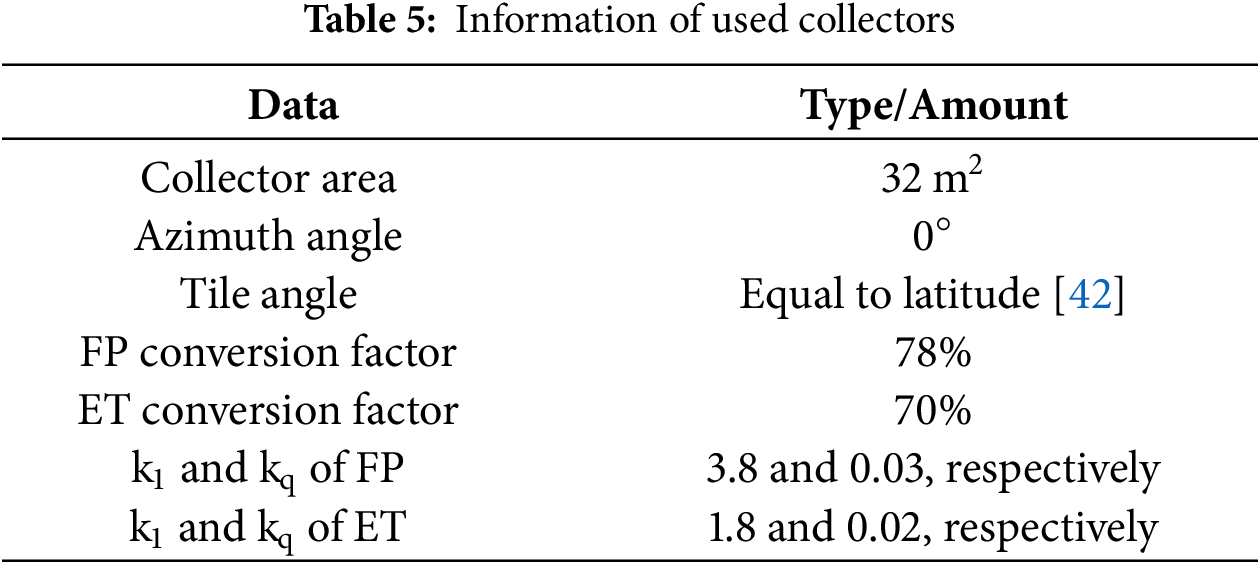
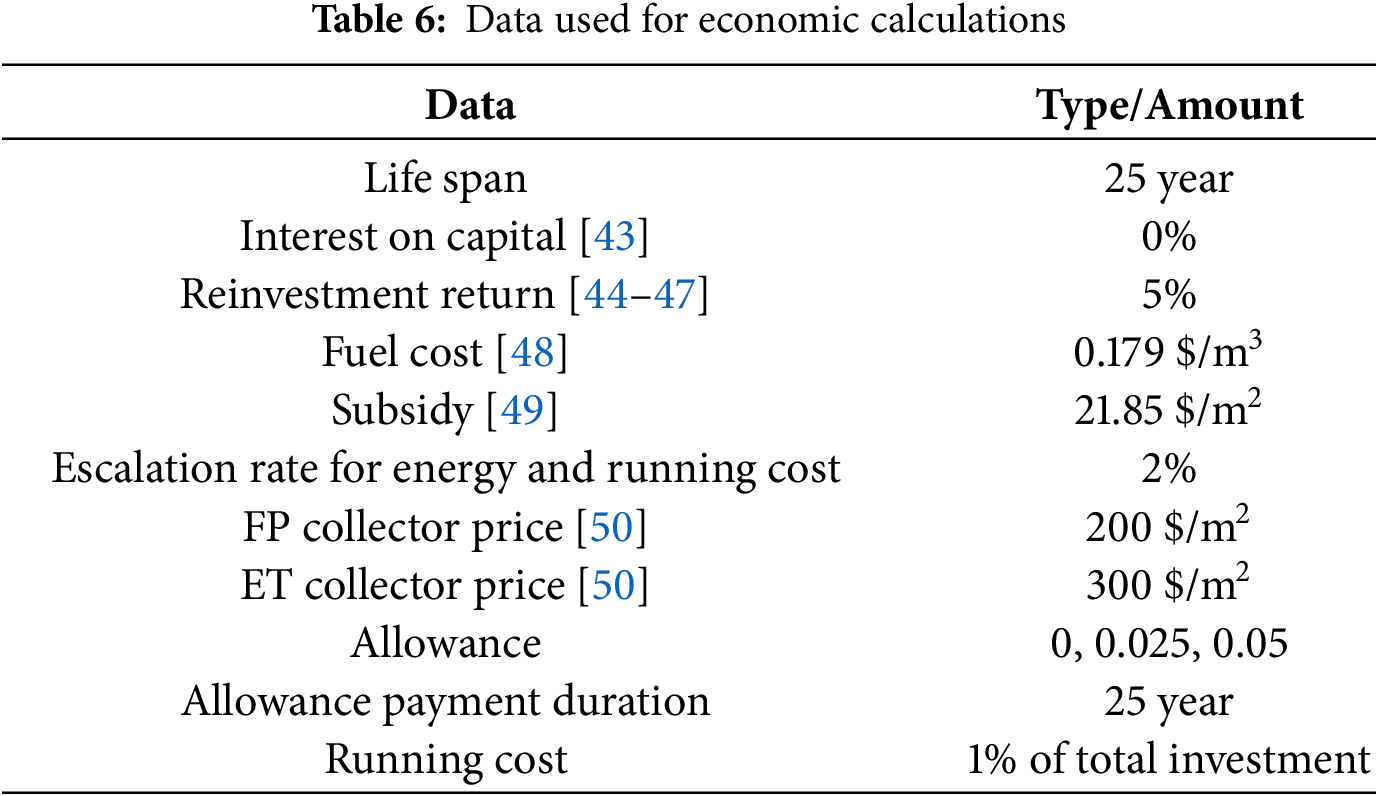
Fig. 4 displays the positions of the stations analyzed on the Swedish solar map. These stations represent the five largest cities in Sweden [37]. Climatic data, water temperatures of the pipeline network and geographical coordinates for these stations are obtained from Meteonorm 7.1 software and summarized in Table 3. The data necessary for calculating space heating and SHW consumption are provided in Table 4. Additionally, details regarding the SWHs utilized are outlined in Table 5. The economic information of the heating systems used is given in Table 6.
2.2 The Studied System and Governing Equations
TSOL Pro 5.5 software is solar heating systems simulation software that allows the user to dynamically calculate system performance over a one-year period. Optimal design, accurate calculations, economic efficiency calculations, and having weather information of 8000 points around the world are other benefits of this software. The software has the ability to simulate 200 different systems and configurations that are available in its database. Users can also manually design their desired system [51].
The diagram illustrating the system being analyzed is depicted in Fig. 5. As commonly understood, the objective is to supply space heating and SHW utilizing SWHs, with a gas boiler serving as a backup. Two tanks of 2125 and 1680 liters have been used for SHW and space heating, respectively.
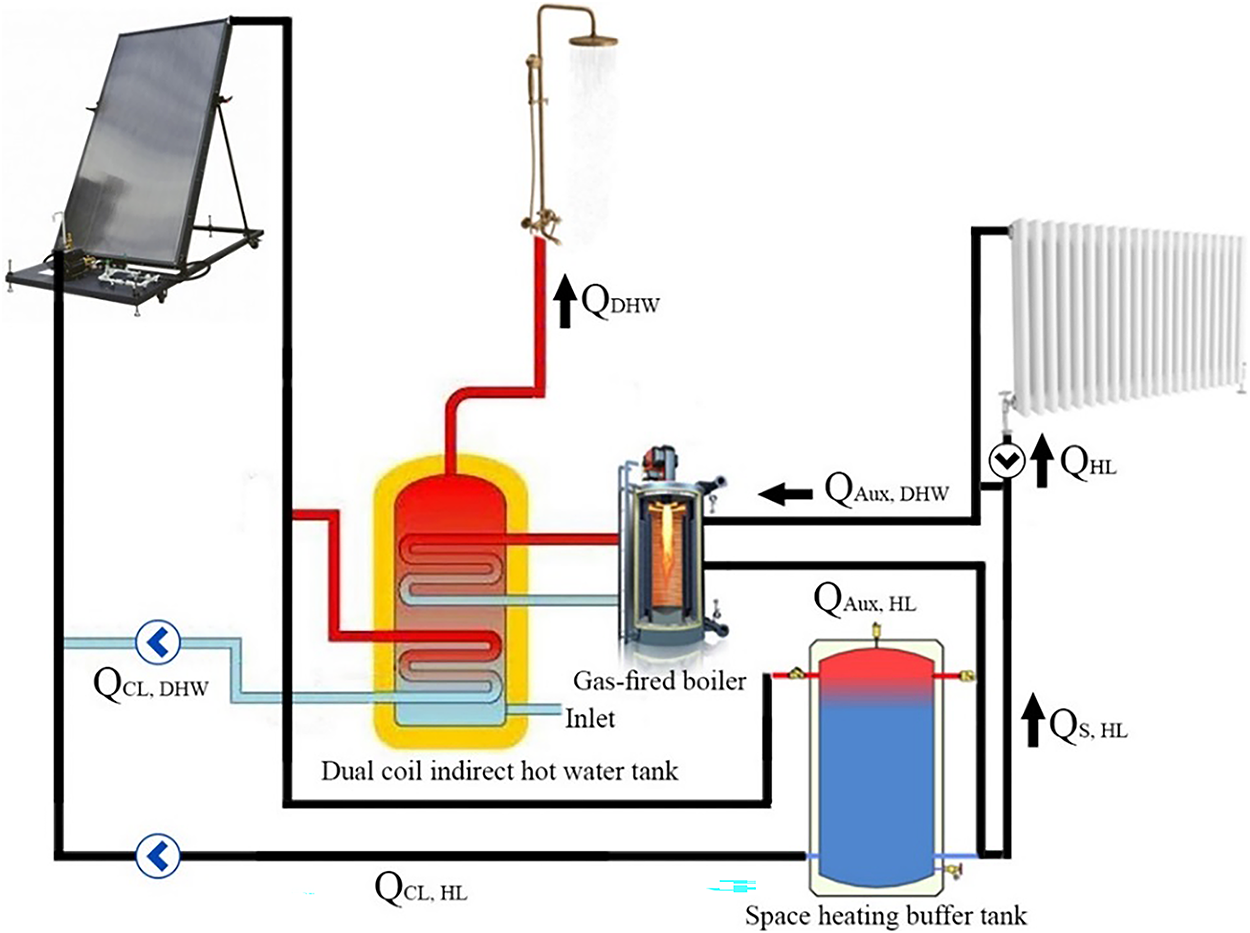
Figure 5: Schematic of SWH system employed for space heating and SHW. Schematic of the simulated SWH system for space heating and DHW. The configuration—32 m2 FP or ET collectors, tilt = latitude, azimuth = 0°, two buffer tanks-was modelled under 12-month climate conditions for each of the five Swedish stations
Direct radiation data can be accessed from the Meteonorm 7.1 software database, which furnishes climate information for TSOL Pro 5.5 software. Additionally, diffuse radiation data are computed using Eqs. (1)–(3), contingent upon the air clearness coefficient [52]. By combining direct and diffuse radiation onto the surface of collector, all of incident radiation on the surface of collector is determined.
The energy balance rate for solar collectors is calculated from Eq. (4). Also, the parameters of total solar fraction, solar fraction for DHW, and solar fraction for space heating are calculated from Eqs. (5) to (7), respectively [53].
The basis of economic calculations in the present study is the Net present value (NPV), which is computed by subtracting the total revenue and price of the SWH system. The amount of total revenue and cost parameters of the SWH system are calculated from Eqs. (8) and (9) [54].
For each parameter x, the simulated values were generated using the following normal distribution:
where μx is the mean value of the baseline data for parameter x, σx = α⋅μx is the standard deviation, defined as a fraction of the mean, α = 0.10 is the uncertainty factor (10%), N = 10,000 is the number of Monte Carlo iterations, and xi is the simulated sample drawn from the normal distribution in iteration i.
With this definition, each simulation generates a random value from the normal distribution centered on the mean of the baseline data. Repeating this process 10,000 times yields an uncertainty distribution for each parameter. From the resulting set {xi}, key statistical indicators such as the mean, standard deviation, median, and the 95% confidence interval can be derived:
To evaluate the uncertainty of SWH system simulations, the Monte Carlo method was employed. Three key parameters were selected as the primary outputs of the model: Total Solar Fraction (%), CO2 Emission Avoided (kg/year), and Cost of Solar Energy ($/kWh). For each parameter, the mean value obtained from the TSOL software simulations was calculated, and a normal distribution centered on this mean was defined. The standard deviation of each distribution was set equal to 10% of the mean in order to reflect reasonable variability due to climatic, economic, and modeling uncertainties. From each distribution, 10,000 random samples were drawn, and the resulting statistical distribution of outputs was analyzed. This process enabled the extraction of indicators such as mean, standard deviation, median, and 95% confidence intervals for each output.
The necessity of this analysis is justified from several perspectives. First, the energy–environmental and economic simulation results of solar systems are inherently influenced by variations in climate (solar irradiance, ambient temperature), operating conditions (energy demand profiles, auxiliary boiler capacity), and economic uncertainties (interest rates, capital costs). Without uncertainty evaluation, analysis based solely on mean values may present an incomplete picture of system performance. Second, the Monte Carlo method, as one of the most established tools in energy engineering and multi-criteria decision-making, allows for the quantification of risks and variability in results. Third, reporting confidence intervals alongside point estimates provides decision-makers and policymakers with a more robust foundation for selecting technologies (FP or ET), not merely based on best-case outcomes but by considering result stability and sensitivity to input variations.
In summary, applying the Monte Carlo method with a normal distribution assumption of ±10% around the mean establishes a systematic framework for identifying uncertainties and enhancing the reliability of simulation results. This approach ensures that the comparative evaluation of collectors across Swedish cities is analyzed not only from technical and economic perspectives but also in terms of performance robustness and risk, which is essential for the design and policy-making of renewable energy systems.
2.2.3 NPV–Subsidy Analysis and Break-Even Carbon Pricing
One of the main objectives of this study is to provide a comprehensive techno-economic and environmental assessment of SWH systems under the diverse climatic conditions of Sweden. In particular, examining the direct relationship between supportive subsidies and the economic profitability of these systems through the NPV indicator is of critical importance, as it determines the level of support required to achieve cost-effective deployment of the technology. On the other hand, in situations where direct subsidies are limited or infeasible, the role of carbon policies and CO2 emission pricing becomes essential as a complementary or alternative instrument. Therefore, the combined analysis of the NPV–allowance relationship and the calculation of the break-even carbon credit price provides a clear perspective on different policy pathways to support the diffusion of solar heating systems.
In this context, NPV values were first calculated for five representative Swedish cities using two collector types—FP and ET—across different levels of subsidy, and the variation of NPV with allowance was analyzed. The break-even subsidy threshold (A∗) was then derived as the point at which NPV becomes zero. Subsequently, for cases where NPV remained negative, the value of avoided CO2 emissions over the lifetime of the systems (25 years at a discount rate of 5%) was computed, and on this basis the break-even carbon credit price (
For these analyses, the following set of equations was employed, representing the computation of NPV (Eq. (12)), the linear modeling of NPV–allowance (Eq. (13)), the derivation of the break-even subsidy threshold (Eq. (14)), the present value of avoided CO2 emissions (Eq. (15)), and the calculation of the break-even CO2 credit price (Eq. (16)).
where NPV is NPV of the investment, CFt is net cash flow in year t (energy savings or revenue minus costs), r is discount rate (here 5%), and n is economic lifetime of the system (25 years).
where A is subsidy allowance (as a percentage of capital cost), α is intercept of the regression (NPV at zero allowance), and β is slope (change in NPV per 1% change in allowance).
where A∗ is break-even subsidy; the allowance level at which NPV = 0.
where
where
The Internal Rate of Return (IRR) is one of the most important tools for the economic evaluation of projects, as it represents the actual rate of return on investment independent of currency units and project scale. In renewable energy systems (such as solar water-heating systems), the IRR serves as a direct measure for assessing the economic attractiveness of a project compared to bank interest rates or alternative investment returns. The internal rate of return is defined as the discount rate (r = IRR) at which the NPV of all cash flows equals zero.
2.3 Methodological Assumptions and Limitations
While the present study adopts a rigorous simulation-based framework using TSOL Pro 5.5 and Meteosyn 7.1 data, it inevitably relies on several simplifying assumptions and is subject to certain methodological limitations. Explicitly stating these aspects is essential to ensure transparency and to delineate the scope within which the results should be interpreted. The following points summarize the key assumptions made in the modeling process, as well as the main limitations that may influence the generalizability of the findings.
• Fixed domestic hot-water demand profiles, without capturing intra-day or seasonal variability in user behavior.
• Climatic data from Meteosyn 7.1, which represent averaged historical conditions and do not account for inter-annual variability or future climate change.
• A uniform economic lifetime of 25 years and discount rate of 5% applied across all sites, which may not fully reflect local financing conditions.
• System design restricted to FP and ET collectors, without hybridization with PVT panels or integration with heat pumps.
• Results based on TSOL Pro 5.5 simulations; no field validation data were available for cross-check.
• Long-term degradation, freezing risk, and maintenance costs were not explicitly modeled.
• These assumptions, while common in simulation-based SWH research, should be borne in mind when interpreting the results. Future work should address these limitations by incorporating dynamic demand profiles, field validation, hybrid system configurations, and climate-scenario analyses.
Fig. 6 indicates the results of the change of the solar fraction parameter with the change in the number of solar collectors. Based on the findings, it is evident that for the number of collectors of 32, the solar fraction provided for a residential house is 40%, which seems to be optimal. Because, for example, to achieve a 50% solar fraction, the number of solar cells must be doubled compared to a 40% solar fraction, which is not economically viable. The situation is much worse for achieving a solar fraction of 55%, and the number of solar collectors must be quadrupled compared to solar fraction equal to 40%. Therefore, considering that the available space on the roof to install SWH should be considered, it seems logical to select 32 solar collectors to perform calculations. The optimal condition in Fig. 6 corresponds to achieving a relatively high solar fraction with a limited number of collectors—i.e., the point of diminishing returns where further collector additions provide negligible gains. It should be noted that to facilitate comparison the results of various stations with each other, the parameters of Tables 4–6 are assumed to be the same for all stations.
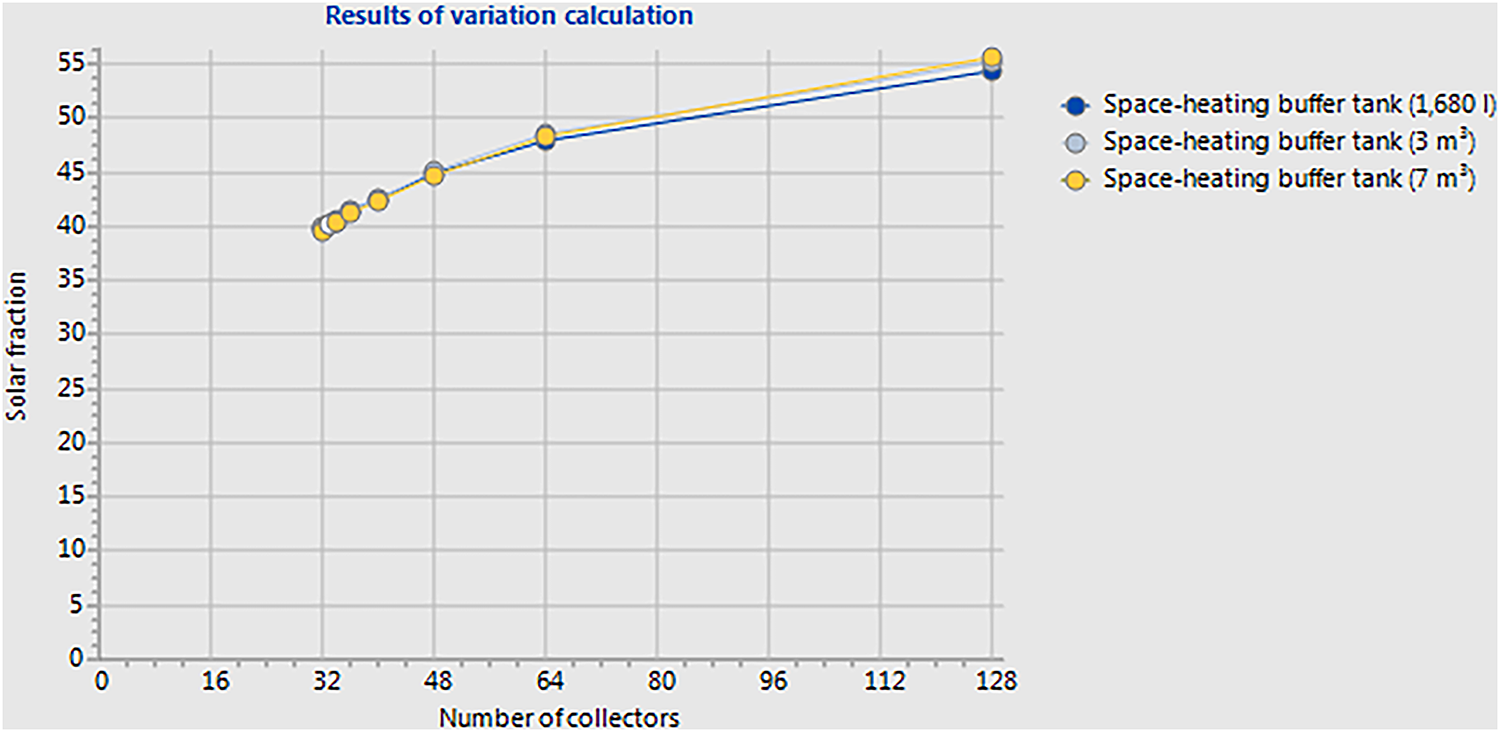
Figure 6: Results of sensitivity analysis in terms of number of collectors for the total solar fraction parameter
Fig. 7 shows the results of the study to find the best and most suitable volume for the hot water storage tank required for space heating. From the findings, it becomes evident that a 1680-liter volume is optimal for the hot water storage reservoir needed for space heating. This choice is advantageous because, even with fewer solar collectors, the system’s efficiency and total solar fraction remain comparable to that of larger tanks.
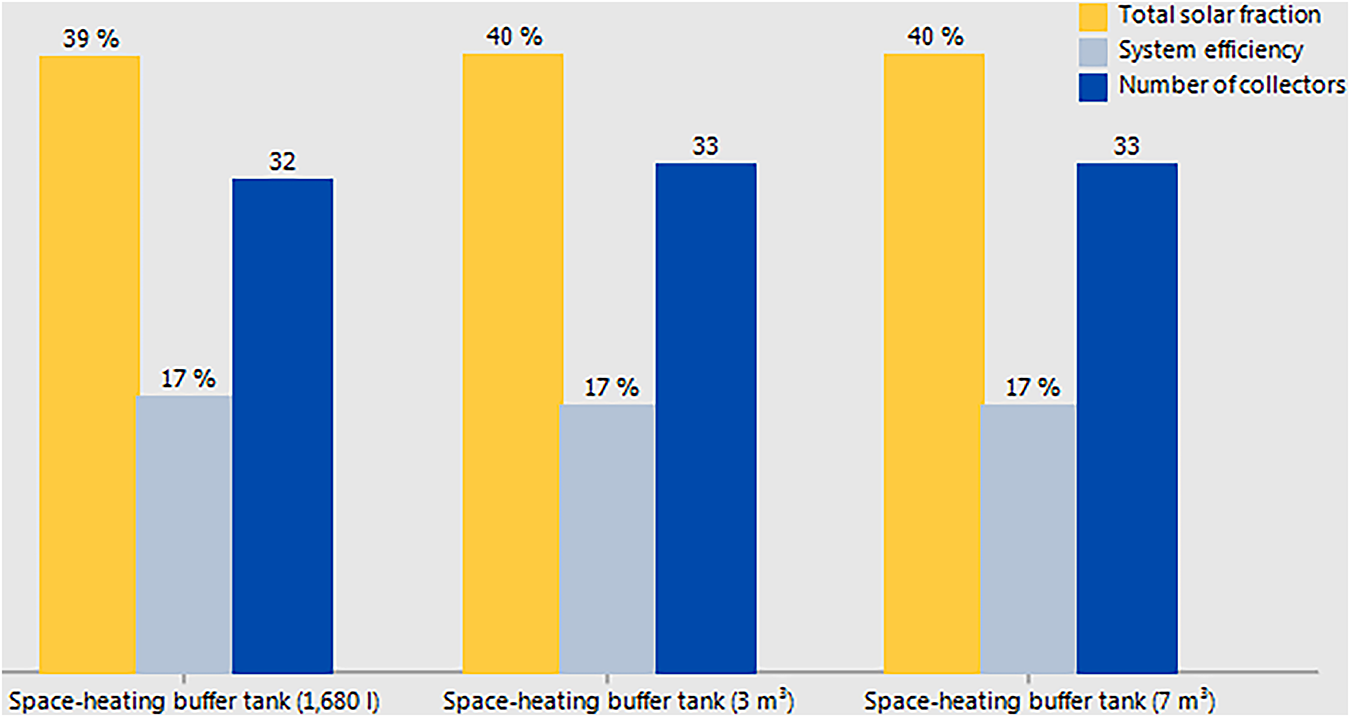
Figure 7: Results of finding the most suitable volume for the hot water storage reservoir required for space heating
Table 7 shows the results of energy analysis and pollutant emission analysis for 5 stations and two types of FP collectors and vacuum tubes. The first thing that can be seen about the results is that more heat is generated by ET solar collectors compared to FP solar collectors. In total, 5959.2 kWh more heat is generated by ET SWHs compared to FP SWHs. The results show that the highest solar heat production is related to Malmo with 8017.5 kWh/year and ET collector and the lowest solar heat production with 5855.2 kWh/year is related to Uppsala station and FP collector. The highest total solar fraction is related to Malmo station, where FP collectors provide 45% of the total heat demand and ET collectors provide 52.7% of the total heat demand. A total of 8071.2 kWh/year of solar thermal energy for space heating and 24,000 kWh/year of solar heat for the production of SHW by FP collectors have been produced in 5 stations under study. These values are 10,795.9 and 27,234.5 for ET collectors, respectively. Comparison of the absolute heat yields indicates that, averaged across all stations, ET collectors deliver approximately 5.95 MWh/year more useful heat than FP collectors, corresponding to an average gain of ~18.6% in annual thermal output, as now presented in both absolute and relative terms in the energy–environmental tables. This performance advantage is primarily the result of significantly lower thermal loss coefficients (k0, kq in Eq. (4), following ISO 9806 standard definitions) and a higher incidence angle modifier (IAM) in ET designs, which improve efficiency under low ambient temperatures and diffuse irradiation conditions. The cylindrical absorber geometry combined with partial vacuum insulation reduces both convective and radiative losses, thereby lowering overall optical–thermal degradation. Conversely, FP collectors experience greater sensitivity to high temperature differentials (ΔT) between the absorber and ambient air, particularly during winter months in Nordic climates. Together, these optical and thermal mechanisms explain the consistent ~15%–20% performance gap observed across all stations in this study.
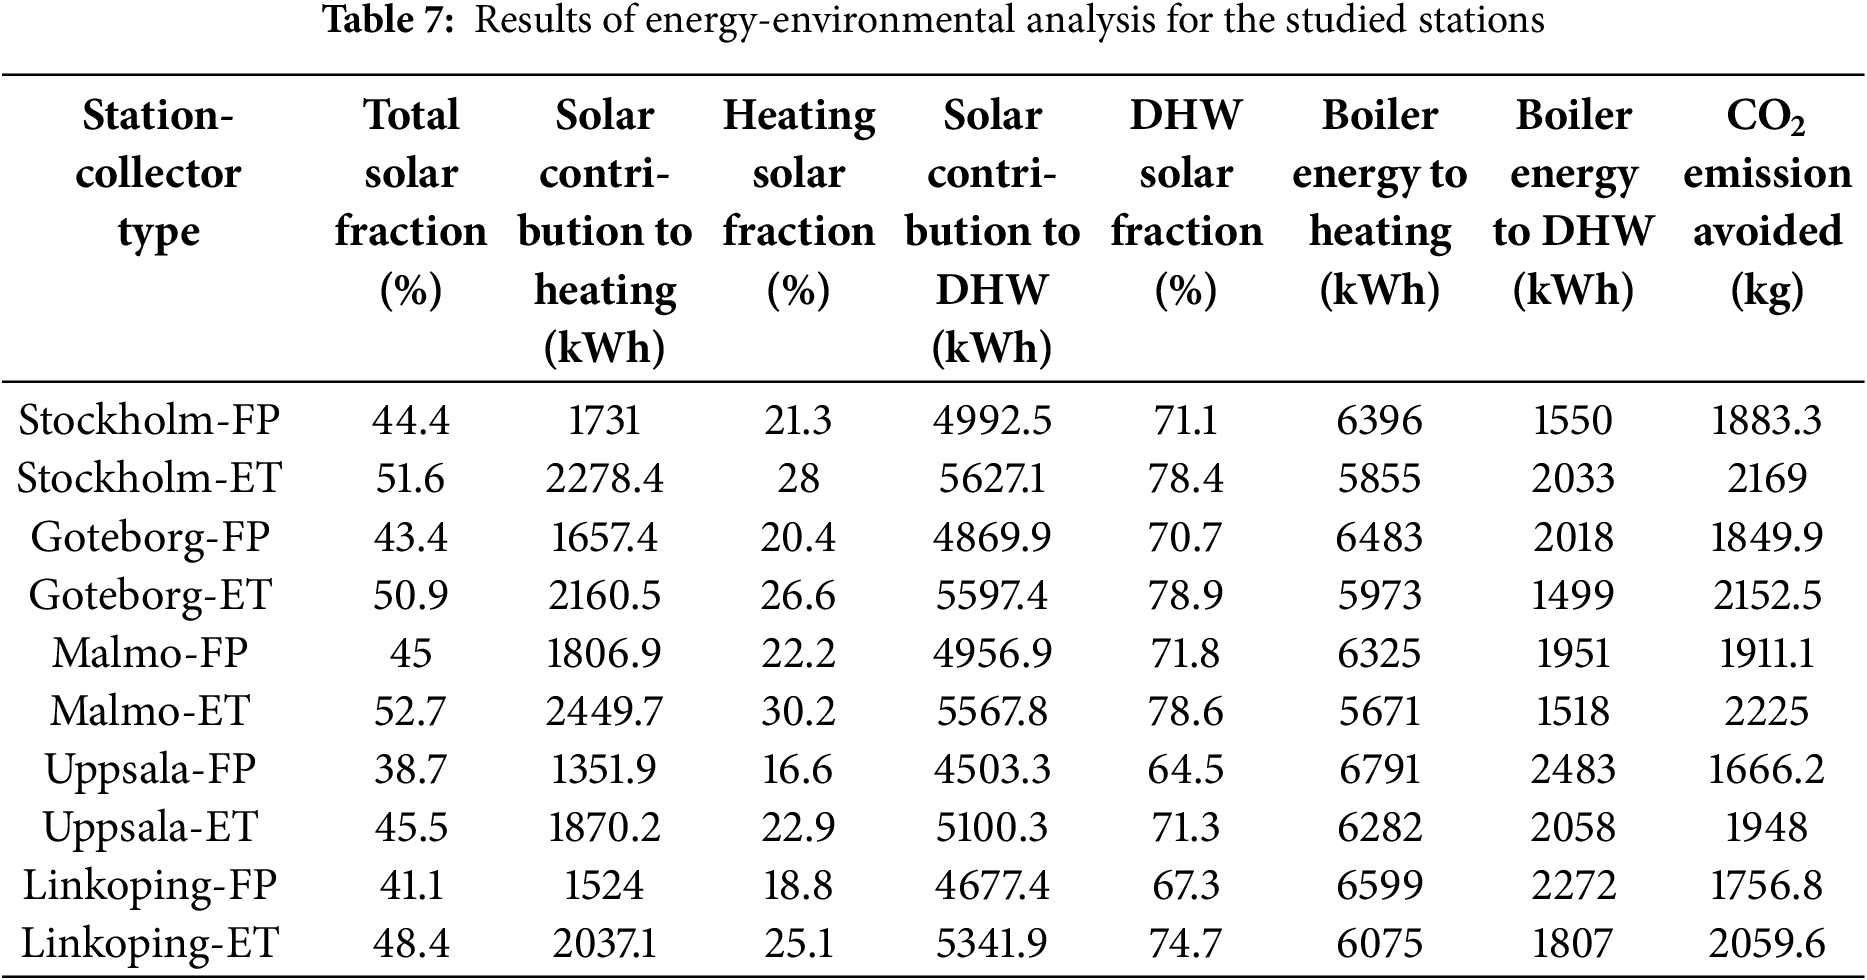
The predominant proportion of heat demand necessary for space heating by FP SWHs and ET SWHs is 22.2% and 30.2%, respectively. The highest percentage of hot water supply required for sanitary purposes by FP SWHs and ET SWHs is 71.8% and 78.6%, respectively. Due to the production of heat by solar collectors and the non-consumption of fossil fuels, 9067.3 kg of CO2 emissions are prevented annually in the studied stations when using FP collectors. This value is 10,554.1 kg when using ET collectors. Also due to the fact that solar collectors do not meet 100% of the heat needs, there is a lack of heat in the surveyed stations annually 32,594 kWh for space heating and 10,274 kWh for SHW when using FP SWHs, which must be provided by the auxiliary gas boiler. These values are 29,856 and 8915 kWh for ET SWHs, respectively.
Based on the findings presented in Table 7, the average heat supply for the investigated stations using FP and ET collectors stands at 42.5% and 49.8%, respectively. FP SWHs produce an average of 1614 kWh/year of thermal energy required for space heating and 4800 kWh/year of heat for hygienic water heating, which are 2159 and 5447 kWh/year for ET SWHs, respectively.
Table 8 presents the outcomes of an economic analysis across various parameter values of the allowance parameter and for all 5 stations examined. Drawing from the findings, it can be asserted that if the allowance is equal to zero, there will be no return on investment at any station and for any type of collector. According to the results, for FP collectors with an allowance equal to $0.025, the system has NPV positive and the minimum and maximum payback times will be for Malmo station (19.8 years) and Uppsala station (23.4 years), respectively. Importantly, there is no return on investment for ET collectors, even for an allowance of $0.025. For allowance of $0.05, for all stations and both types of collectors used, the system will have a positive NPV and there will be a payback time. Also, the findings indicate that the price per kWh of solar heat by FP SWHs is less than the ET SWHs. The highest price per kWh of solar generation of $0.069 is related to the ET collector at Uppsala station, which was obtained for allowance equal to zero.
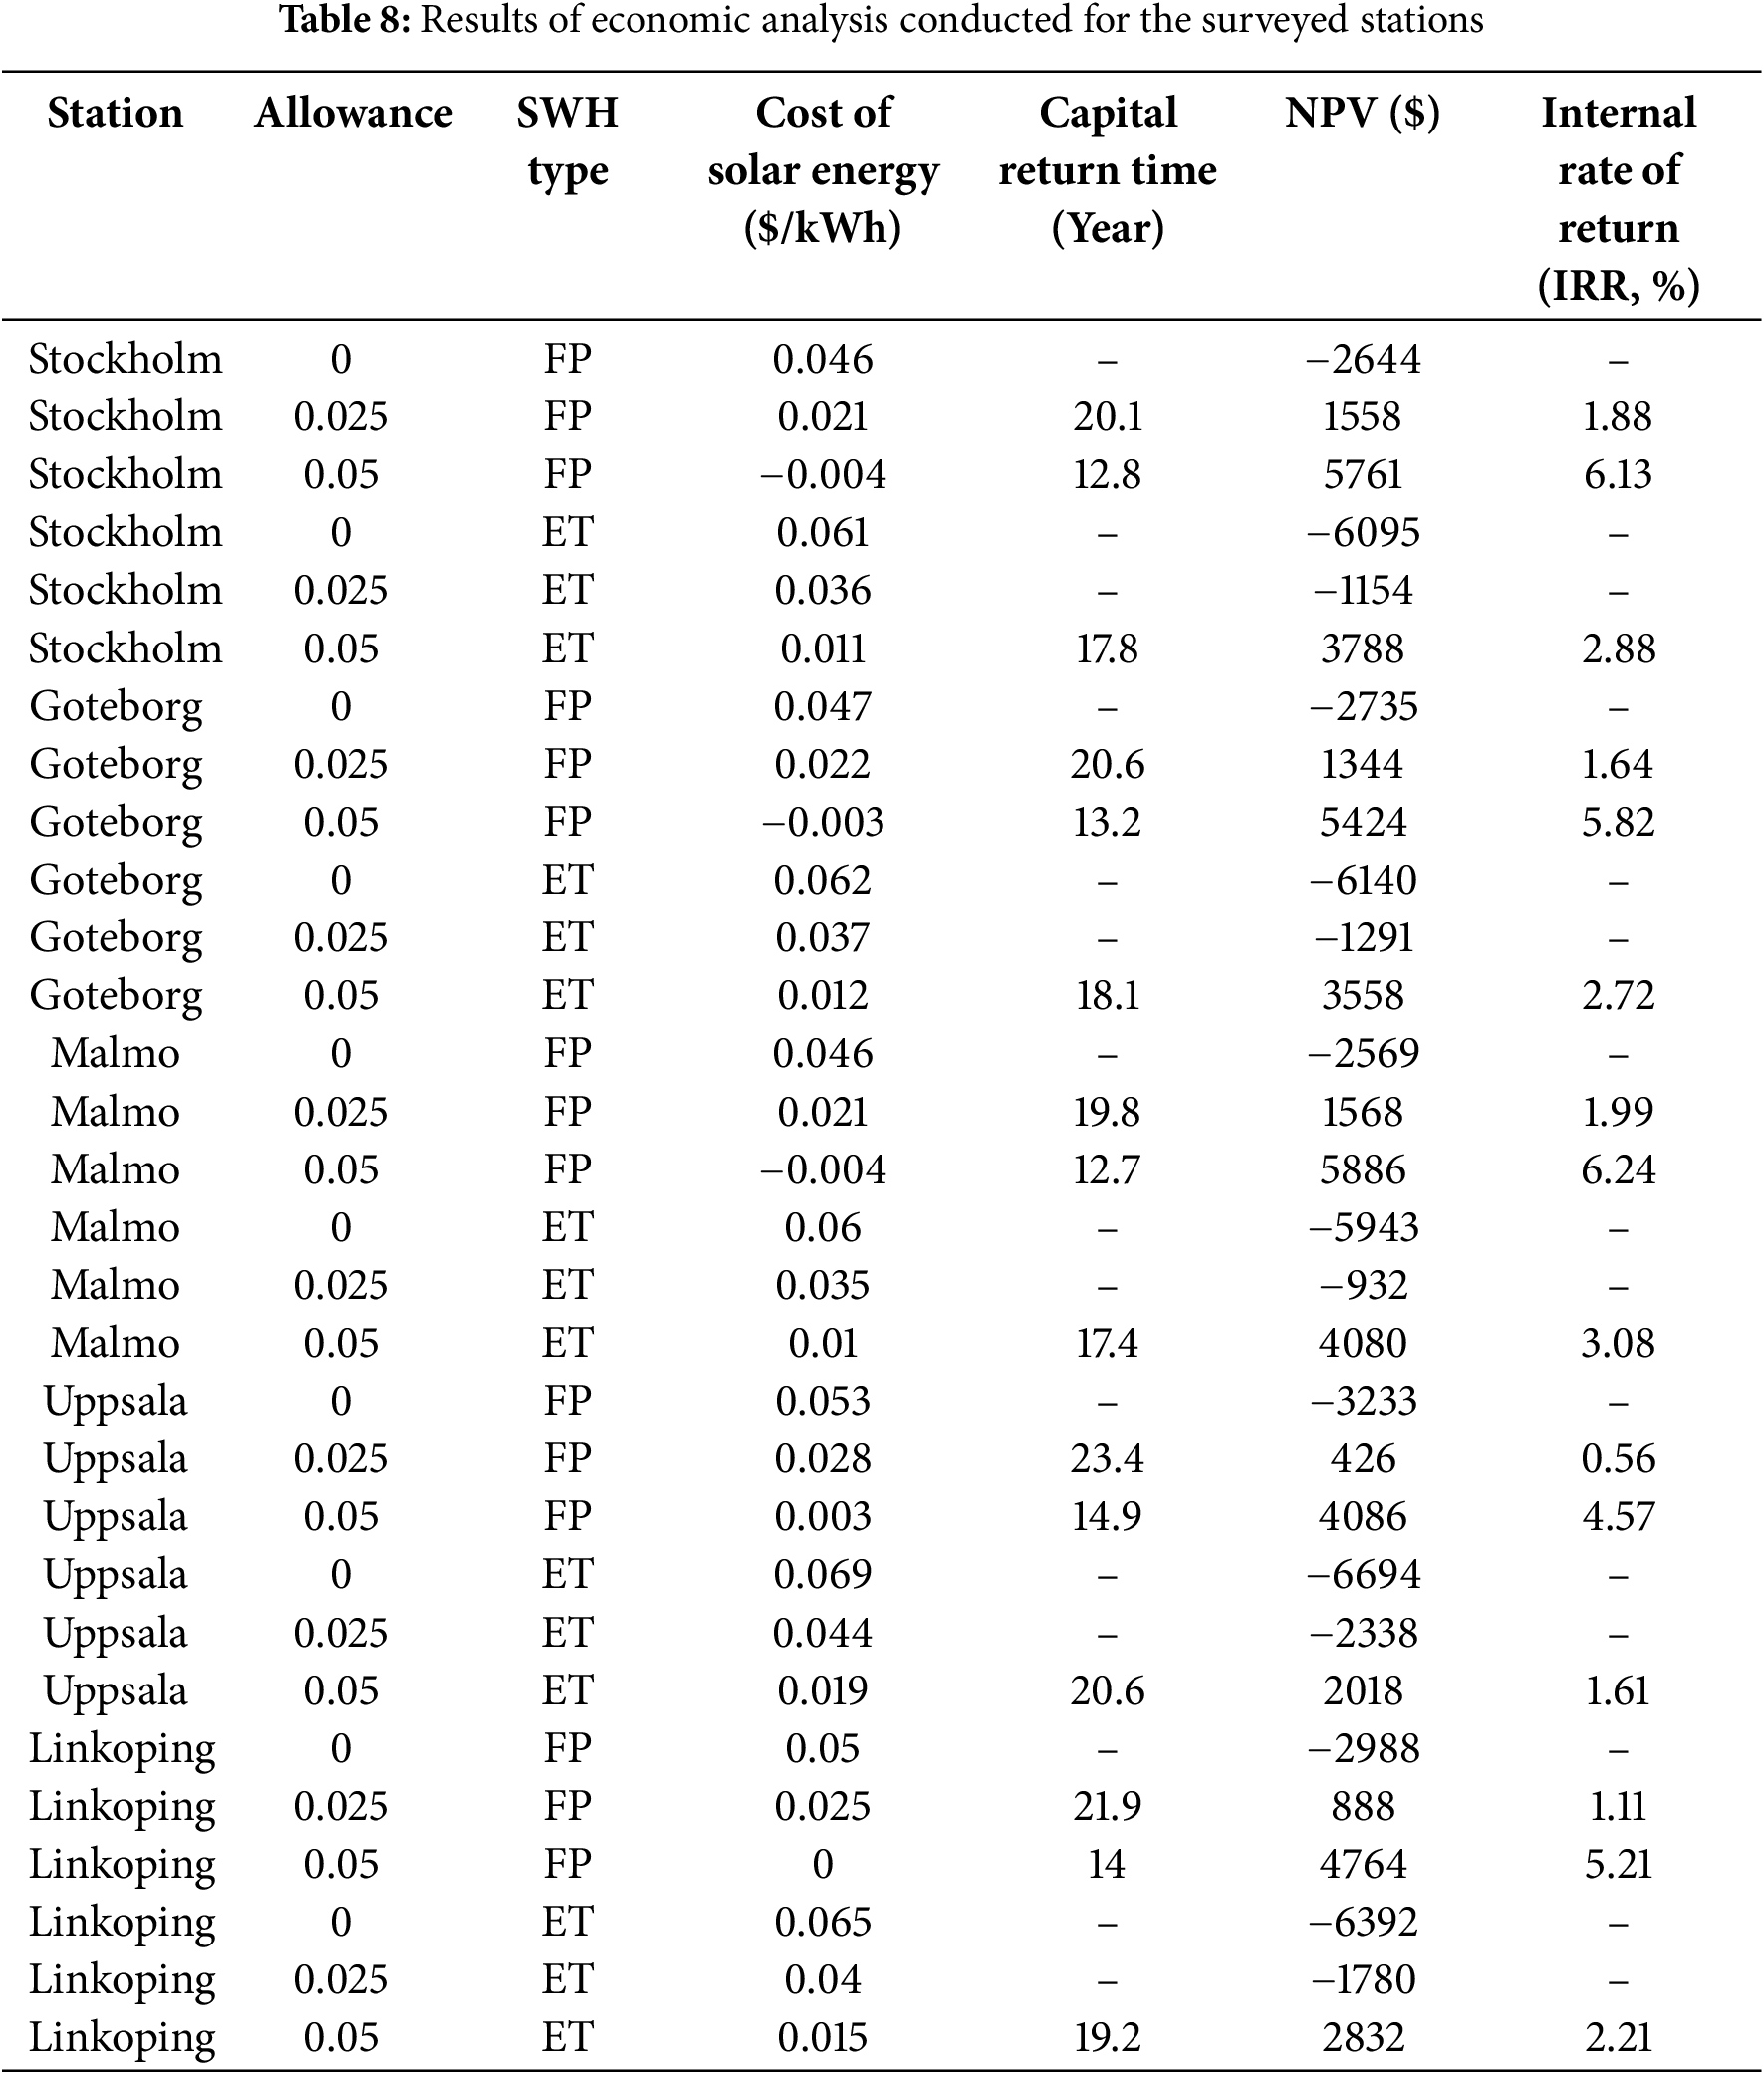
To complement the existing economic indicators, the IRR was additionally calculated for all stations and allowance levels. The IRR represents the discount rate at which the NPV of all cash flows becomes zero and therefore provides a direct and intuitive measure for comparing the investment profitability of solar thermal systems. The calculated values are summarized in Table 8. As expected, the results show a consistent trend in which the IRR increases with the allowance level, since higher financial support improves the project’s cash-flow balance. For FP systems, the IRR ranges from approximately 1%–2% at an allowance of 0.025 to about 5%–6% at an allowance of 0.05, indicating a moderate but positive investment return when a limited subsidy is applied. The highest IRR values were observed for Malmö–FP (6.24%), Stockholm–FP (6.13%), and Göteborg–FP (5.82%), corresponding to more favorable solar radiation conditions and stronger economic performance. In contrast, Uppsala and Linköping exhibit lower IRRs, reflecting their lower solar irradiation and smaller annual savings. For ET systems, the IRR values are generally lower than those of FP systems, varying between approximately 1.5%–3% at the highest allowance level (0.05). This behavior is consistent with the NPV and LCOH trends, as increasing the allowance level transforms negative or undefined NPV values into positive ones and reduces LCOH, thereby moving the project toward economic feasibility. From an investment perspective, an IRR of about 5%–6% under Swedish conditions can be considered close to the economic attractiveness threshold, especially when compared with low-risk investment benchmarks such as government bonds (~3%). Accordingly, the results indicate that FP systems in southern cities like Malmö and Stockholm can reach economic feasibility under moderate support levels (around 5%), whereas ET systems require higher subsidies or incentive mechanisms to achieve similar profitability. Overall, the inclusion of the IRR parameter completes and strengthens the economic evaluation by integrating the cash-flow-based (NPV) and cost-based (LCOH) results into a unified performance metric. This analysis provides a clearer quantitative and qualitative understanding of how financial support mechanisms influence the profitability and investment attractiveness of solar water-heating systems under Swedish climatic conditions.
Table 9 presents the influence of the discount rate on the main economic indicators of the SWH systems, namely the NPV, the Capital Return Time, and the Levelized Cost of Heat (LCOH), for both FP and ET collectors across five Swedish stations. The sensitivity analysis was performed for discount rates of 3% and 5% to evaluate the effect of financing conditions on project profitability.
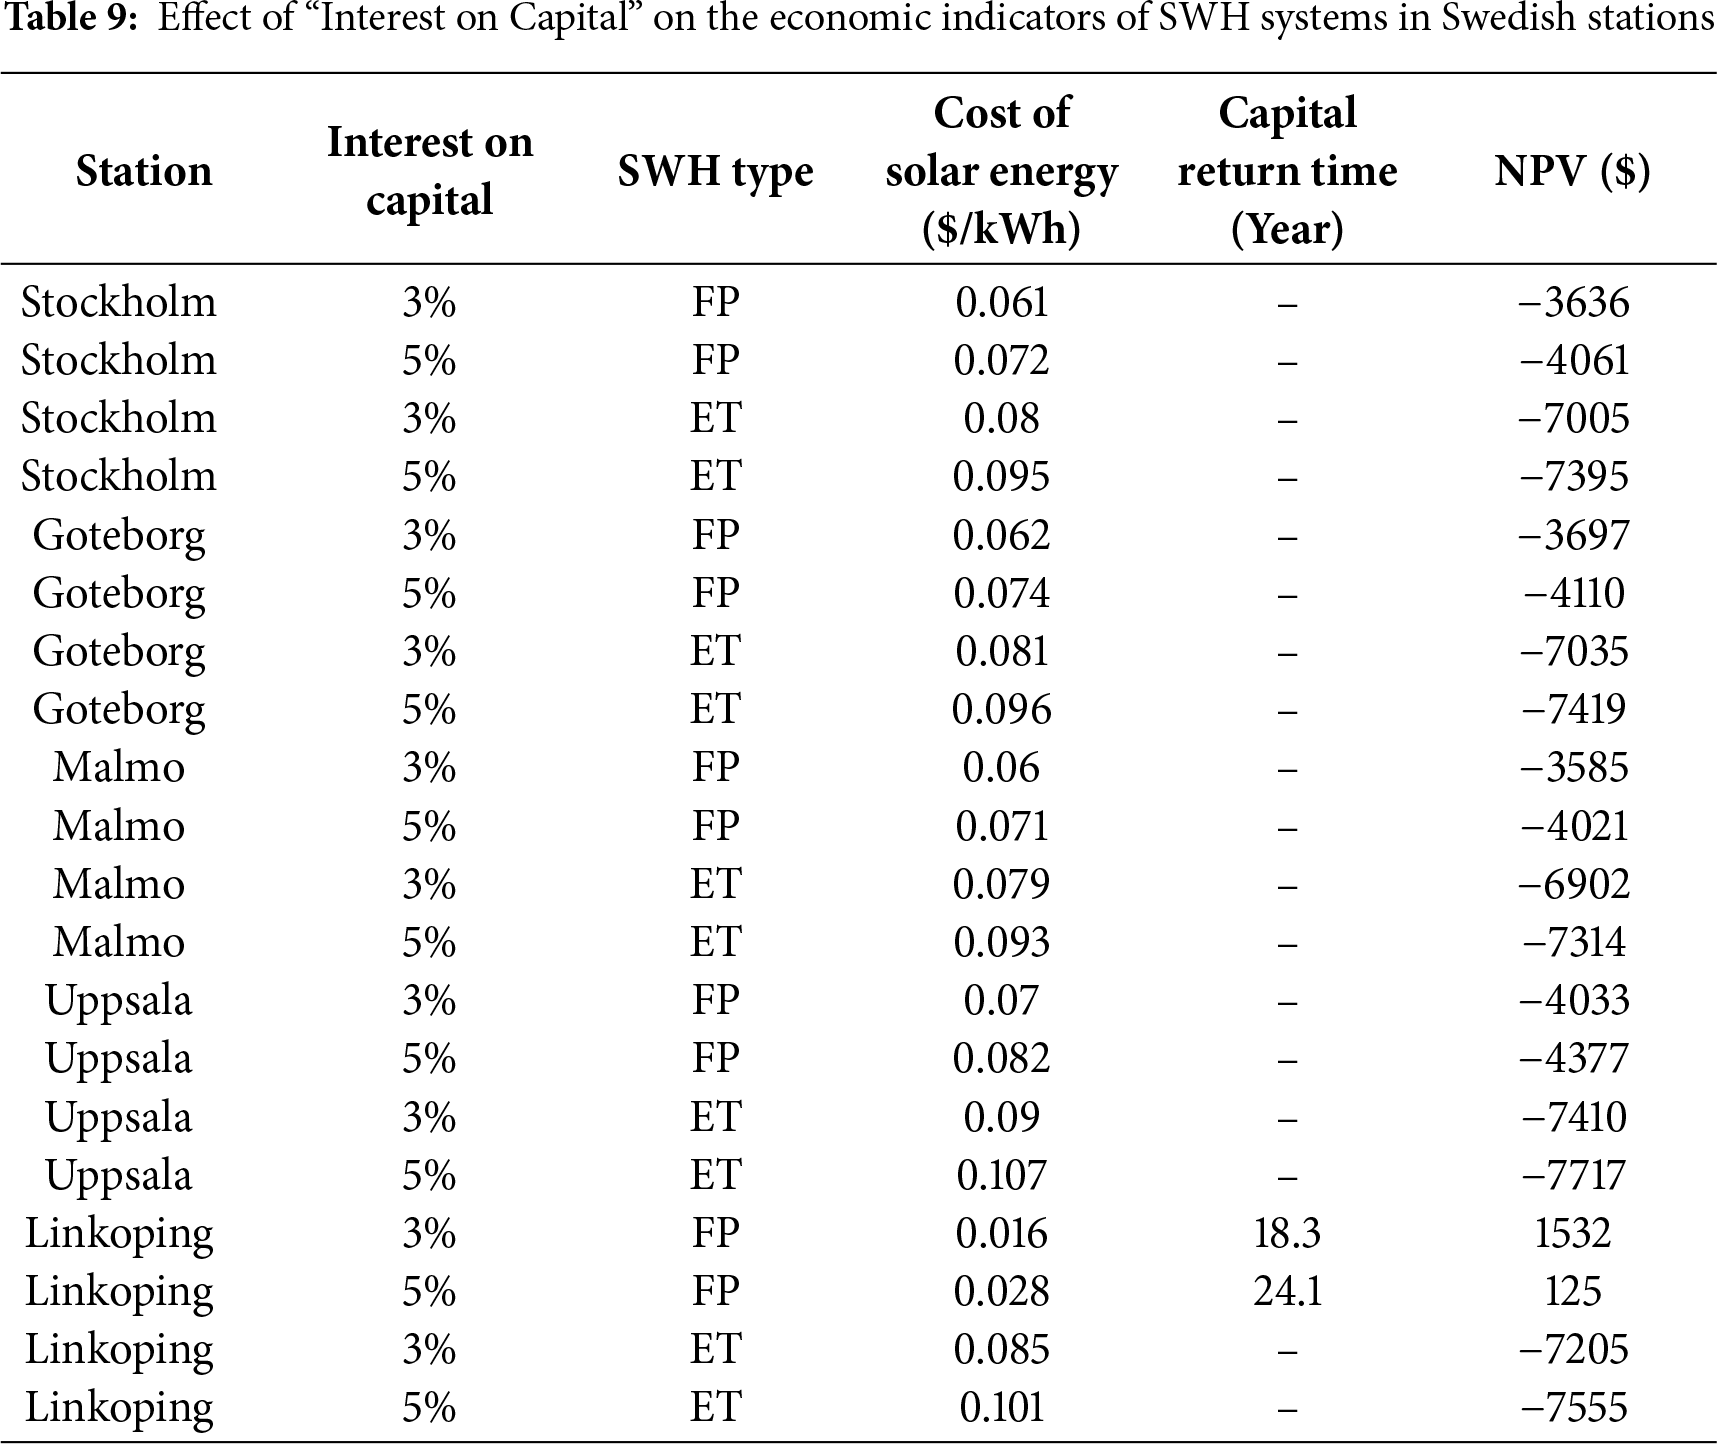
As expected, the results show a clear trend in which an increase in the discount rate leads to a reduction in NPV and a corresponding rise in the LCOH. For all locations and system types, the NPV values are lower at 5% compared with 3%, with an average decrease of approximately 400–500 USD for FP systems and about 350–400 USD for ET systems. This reduction is economically logical since higher discount rates reduce the present value of future cash flows. The only exception is observed in Linköping–FP, where the NPV remains positive (1532 USD at 3%) and approaches zero (125 USD at 5%), indicating that this configuration is economically viable under low-interest conditions and near break-even at moderate interest rates.
The payback period is also strongly influenced by the discount rate. It could only be meaningfully calculated for the Linköping–FP system, yielding 18.3 years at 3% and 24.1 years at 5%. The increase in payback time with a higher discount rate confirms the expected inverse relationship between financing cost and investment attractiveness. For other stations, the NPV remained negative; hence, the discounted payback period could not be determined.
Regarding the cost of generated solar heat, LCOH increases consistently with the discount rate in all scenarios. The obtained values range from 0.060 to 0.082 USD/kWh for FP systems and 0.079 to 0.107 USD/kWh for ET systems, representing an average increase of 15%–20% when moving from 3% to 5%. This indicates that the long-term cost competitiveness of solar water heating systems is sensitive to financial parameters, particularly in high-latitude climates where annual solar yields are modest.
From a comparative perspective, FP systems demonstrate superior economic performance in all locations due to their lower investment costs, despite their slightly lower thermal efficiency compared to ET systems. Among all cities, Linköping–FP exhibits the best overall performance, achieving a positive NPV and the lowest LCOH, which identifies it as the most economically attractive site under the evaluated conditions. Conversely, Uppsala shows the weakest performance, with the lowest NPVs and highest LCOH values for both technologies, primarily reflecting its lower solar irradiation and higher operational losses.
Overall, the results confirm a consistent and interpretable behavior: increasing the discount rate reduces NPV, lengthens the payback period, and increases the LCOH. The ranking of the stations and technologies remains unchanged, implying stable economic relationships across different financing scenarios. The findings suggest that under Swedish conditions—characterized by low interest rates and relatively high energy prices—flat-plate systems in southern cities such as Linköping and Malmö can approach economic feasibility, whereas evacuated-tube systems would require additional financial support or incentives to achieve similar profitability.
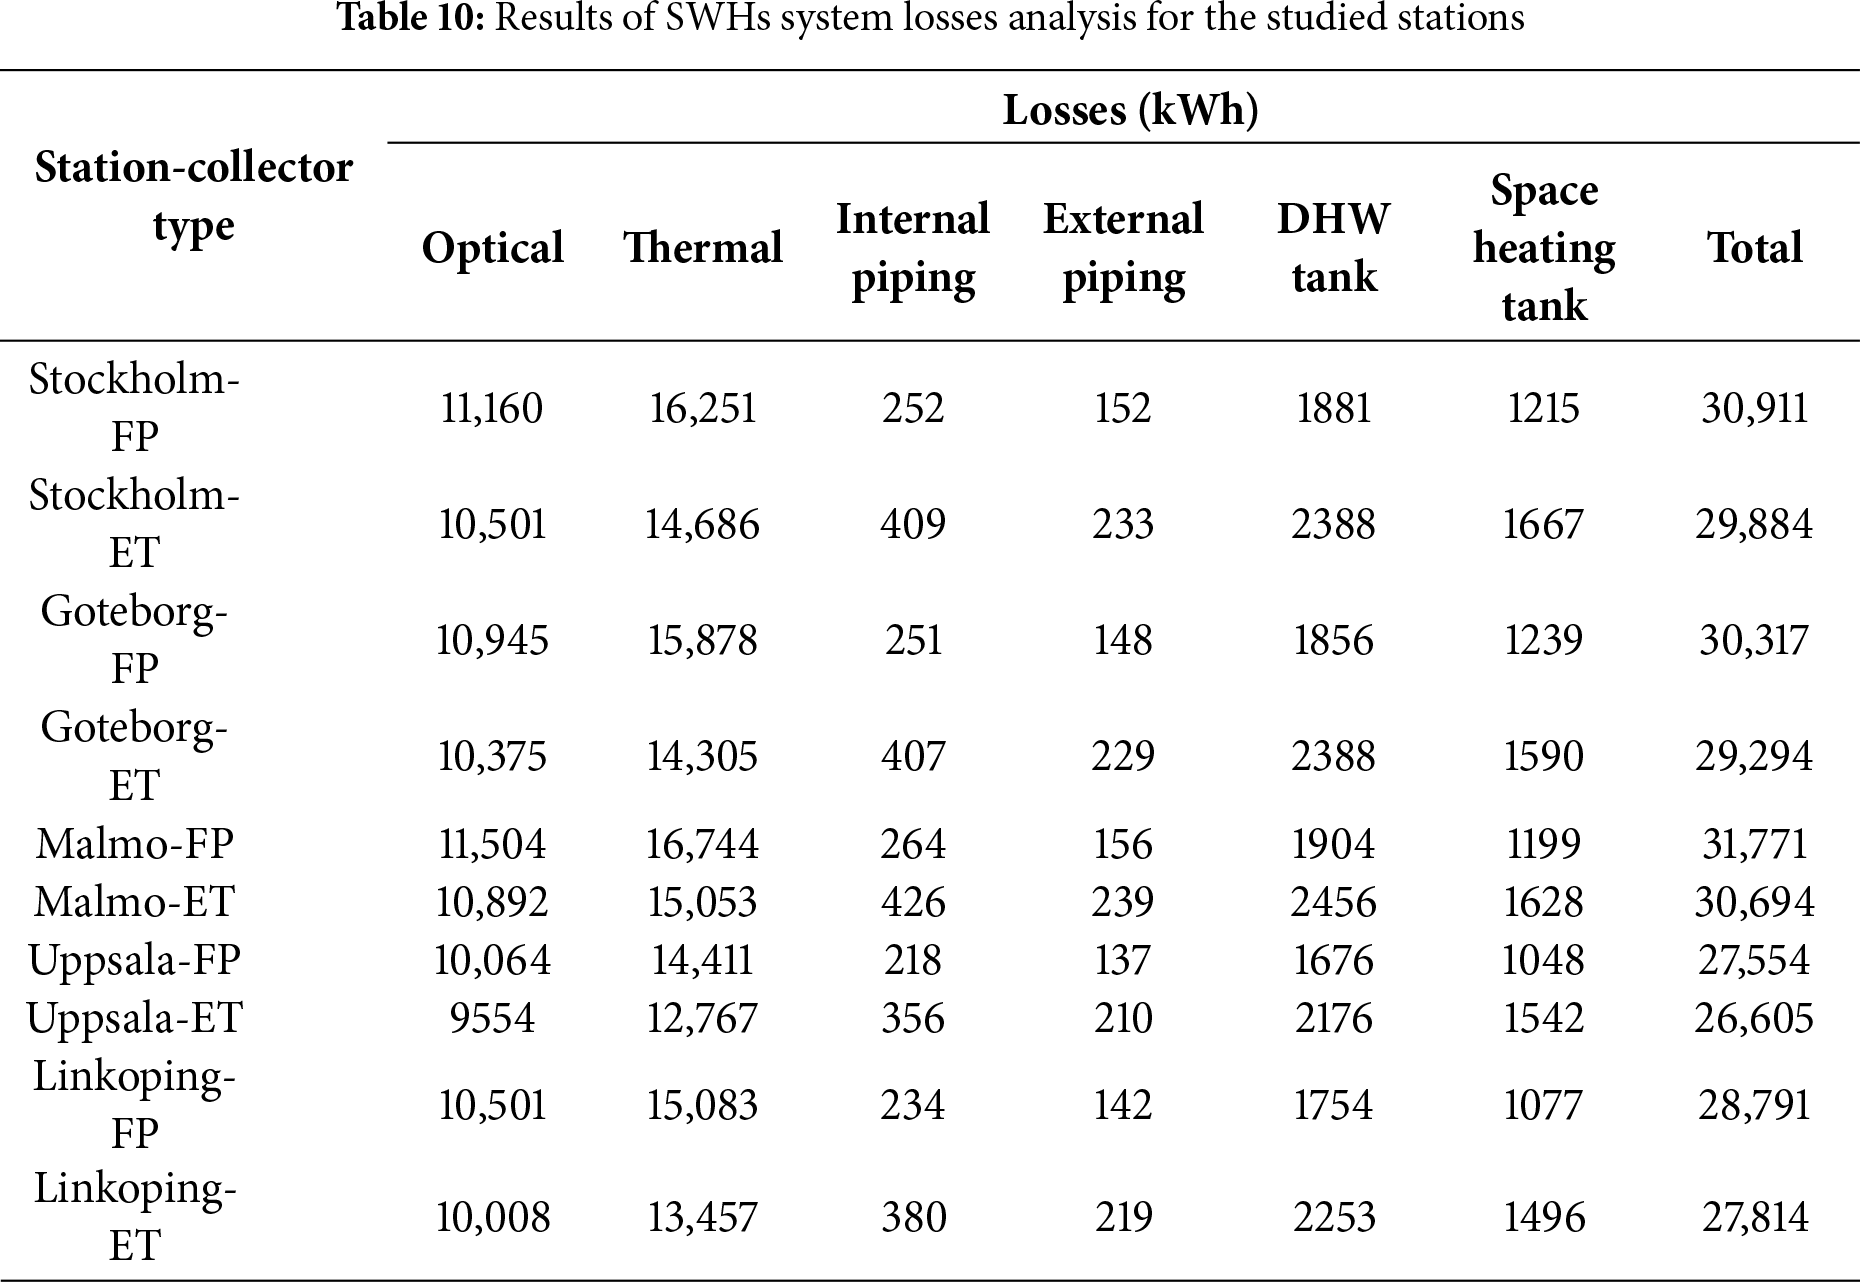
Table 10 provides information on all losses of different parts of the SWH system for 5 stations studied and 2 types of collectors used. Optical losses, thermal losses, internal and external piping losses of the building, and losses in hot water storage tanks, are among the losses under study for one year. From the results, it is evident that the main losses are related to the losses of collectors, then the losses in the hot water tanks rank second in the assessment and the lowest losses are related to the piping system. The highest losses are the heat losses of the collectors and the lowest losses are related to the piping system outside the building. It should be noted that the reason for more losses of the internal piping system compared to the external piping system is that the length of the internal piping is about 10 times the length of the external piping. Also, in comparing the losses of tanks with each other, the SHW water tank consumed has more losses than the space heating tank because it has both a larger volume and more heat. The highest and lowest total losses with 31,771 and 26,605 kWh/year are regarding the utilization of FP collectors in Malmo and ET collectors in Uppsala, respectively. According to the findings of Table 10 and the data of Table 3, the highest and lowest losses are in Malmo and Upsala, respectively, because the main optical and thermal losses are directly related to the amount of radiation received to the collector level. Another important point is that the losses of ET collectors are about 1000 kWh less per year compared to FP collectors for all stations under study, which is contingent upon the specific technology employed and the difference between their thermal and optical loss coefficients.
Malmö was selected for detailed analysis because among the five investigated cities it exhibited the highest total solar fraction, making it the most representative case for illustrating and comparing the energy flow and loss pathways of the two collector technologies. The Sankey diagrams for Malmö in Fig. 8 provide a detailed visualization of the energy balance and major loss pathways for both FP and ET configurations. In both cases, total annual irradiation on the collector surface was almost identical (~36,986 kWh). However, the distribution of losses and useful gains differs significantly.
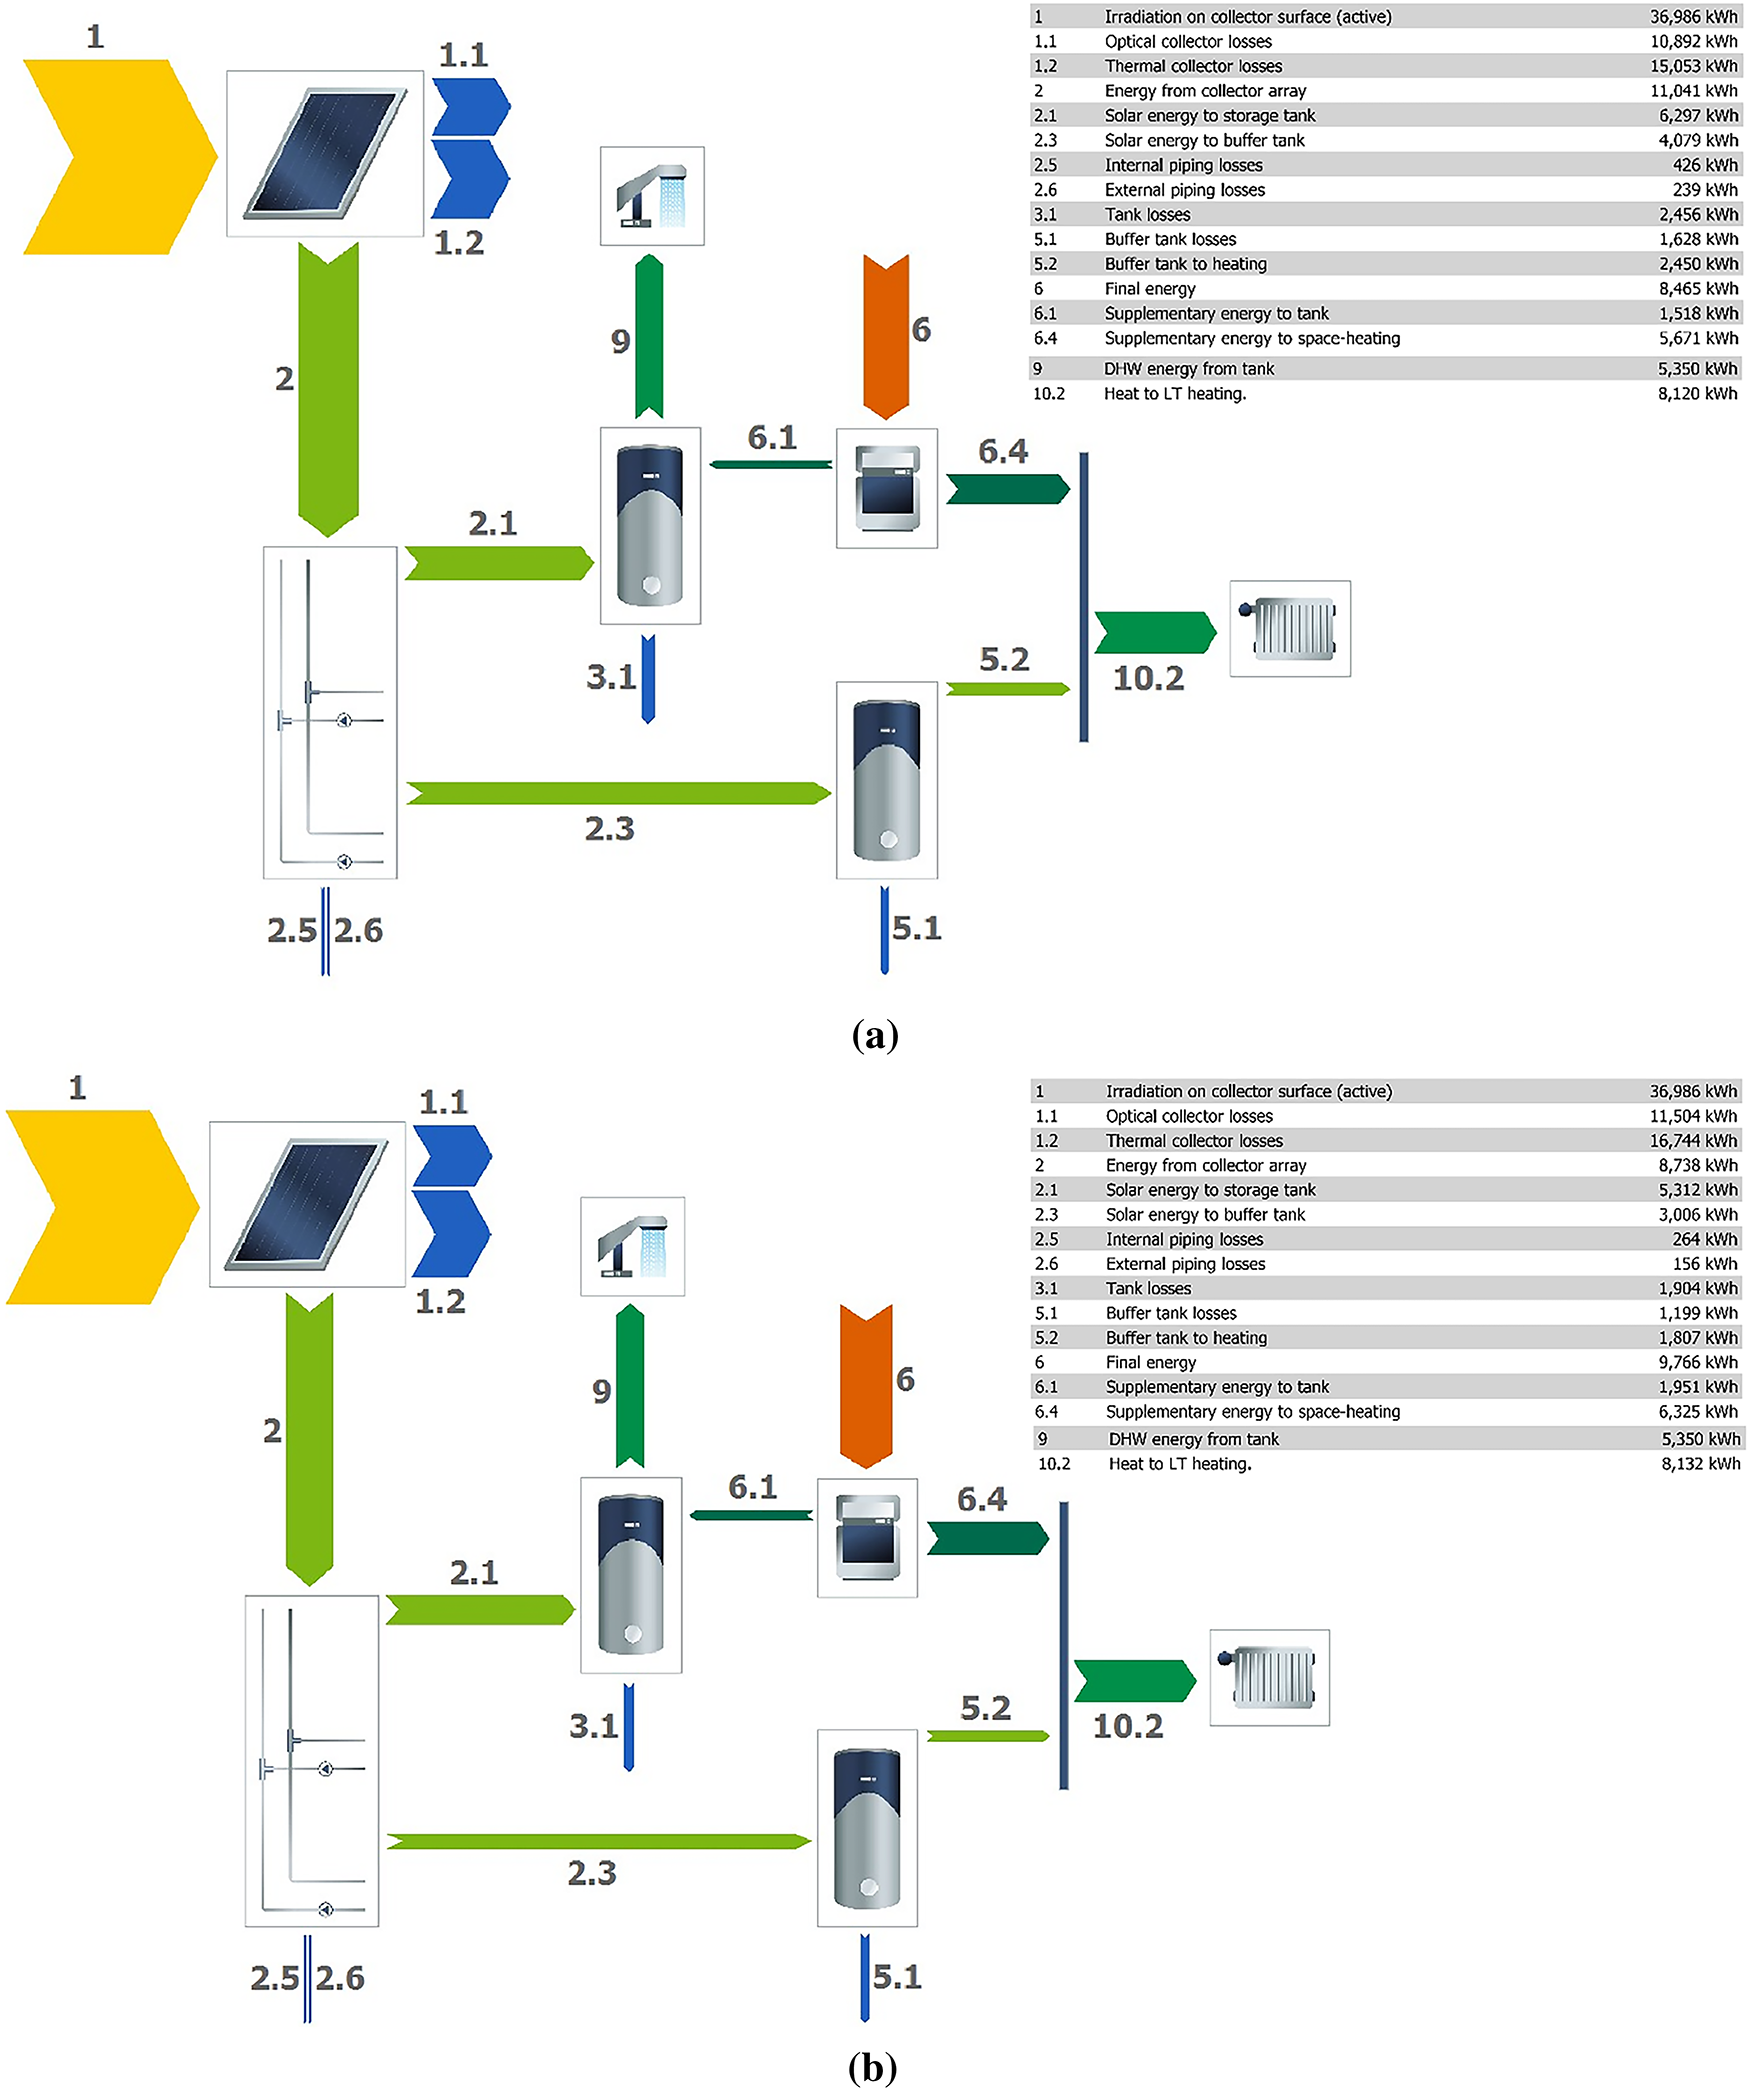
Figure 8: Sankey diagram of energy flows for Malmo (a) ET collector (b) FP collector
For the FP system, optical and thermal collector losses are comparatively higher (≈11,504 and 16,744 kWh, respectively), which leads to a lower share of energy transferred from the collector array (≈8738 kWh). Tank and buffer losses are moderate (~1900 and ~1200 kWh), and the final useful energy delivered to DHW and space heating reaches ≈9766 kWh. The overall solar fraction is ~45%.
In contrast, the ET system exhibits reduced thermal losses at the collector level (≈15,053 kWh compared to 16,744 kWh in FP) and improved optical performance. As a result, more energy is available at the collector output (≈11,041 kWh). While storage and piping losses are somewhat higher due to greater energy throughput, the final useful energy delivered rises to ≈8465 kWh, corresponding to a higher total solar fraction of ~52.7%.
Qualitatively, these diagrams emphasize the superior thermal insulation and incidence-angle performance of ET collectors, which translate into higher solar contributions despite higher initial costs. FP systems, while cheaper, show larger proportional losses at the collector stage, which constrain their performance under Malmö’s climatic conditions. The Sankey visualization therefore reinforces the quantitative results, clearly illustrating how system design affects energy flow, efficiency, and final solar fraction.
To bolster the credibility of the parametric analysis and to clarify its novelty in the Swedish context, a targeted validation was carried out against peer-reviewed TSOL/TRNSYS studies from comparable Nordic and European climates. Annual useful heat, thermal loss coefficients, and economic implications under comparable system sizes and financial assumptions were considered. First, it was found that ET delivers higher useful heat than FP in cold/diffuse conditions, in agreement with TRNSYS comparisons that report a systematic ET advantage (on the order of 15%–20% in yearly yield, climate-dependent) [55]. This direction of change is further echoed by large, multi-site TSOL analyses in Turkey in which FP and ET are compared across 45 locations, consistently reporting higher ET performance and thus providing a broad external check on relative yields and rankings under a common commercial tool (TSOL Pro 5.5) [29]. For a strictly Nordic climate, an Inland Norway assessment indicated that tubular collectors can cover ~62% of a household’s annual DHW demand vs. ~48% for glazed FP of the same size, corroborating both the sign and practical magnitude of ET’s advantage when ambient temperatures are low and irradiation is more diffuse [30].
Second, the thermal loss coefficients used in the simulations fall within ranges documented for Danish and Nordic practice (e.g., typical FP values with k1 in the ~3–4 W/m2·K band and kq below ~0.02 W/m2·K2, with ET exhibiting lower effective losses due to vacuum insulation). This supports the interpretation that ET’s higher seasonal yield in Sweden is driven by reduced convective/radiative losses and better incidence-angle behavior at low ambient temperatures [56]. Complementary Swedish work using TRNSYS in Lund further demonstrated that advanced optics can surpass conventional FP in solar fraction at similar tilts, reinforcing the physical link between optical/thermal parameters and seasonal gains in high-latitude contexts [27,57].
Finally, when financial assumptions are harmonized (25-year lifetime, 5% discount rate), the implications for viability derived from external studies are consistent with the present results: FP tends to achieve positive economics under lighter support (lower effective allowance), whereas ET—despite higher capital expenditures (CAPEX)—becomes competitive once support or carbon credit levels cross technology-specific thresholds. This pattern mirrors the break-even allowance A* and break-even carbon price
As illustrated in Fig. 9, the Monte Carlo analysis reveals the comparative uncertainty ranges for Total Solar Fraction, CO2 Emission Avoided, and the Cost of Solar Energy across the five Swedish cities for both FP and ET collectors.
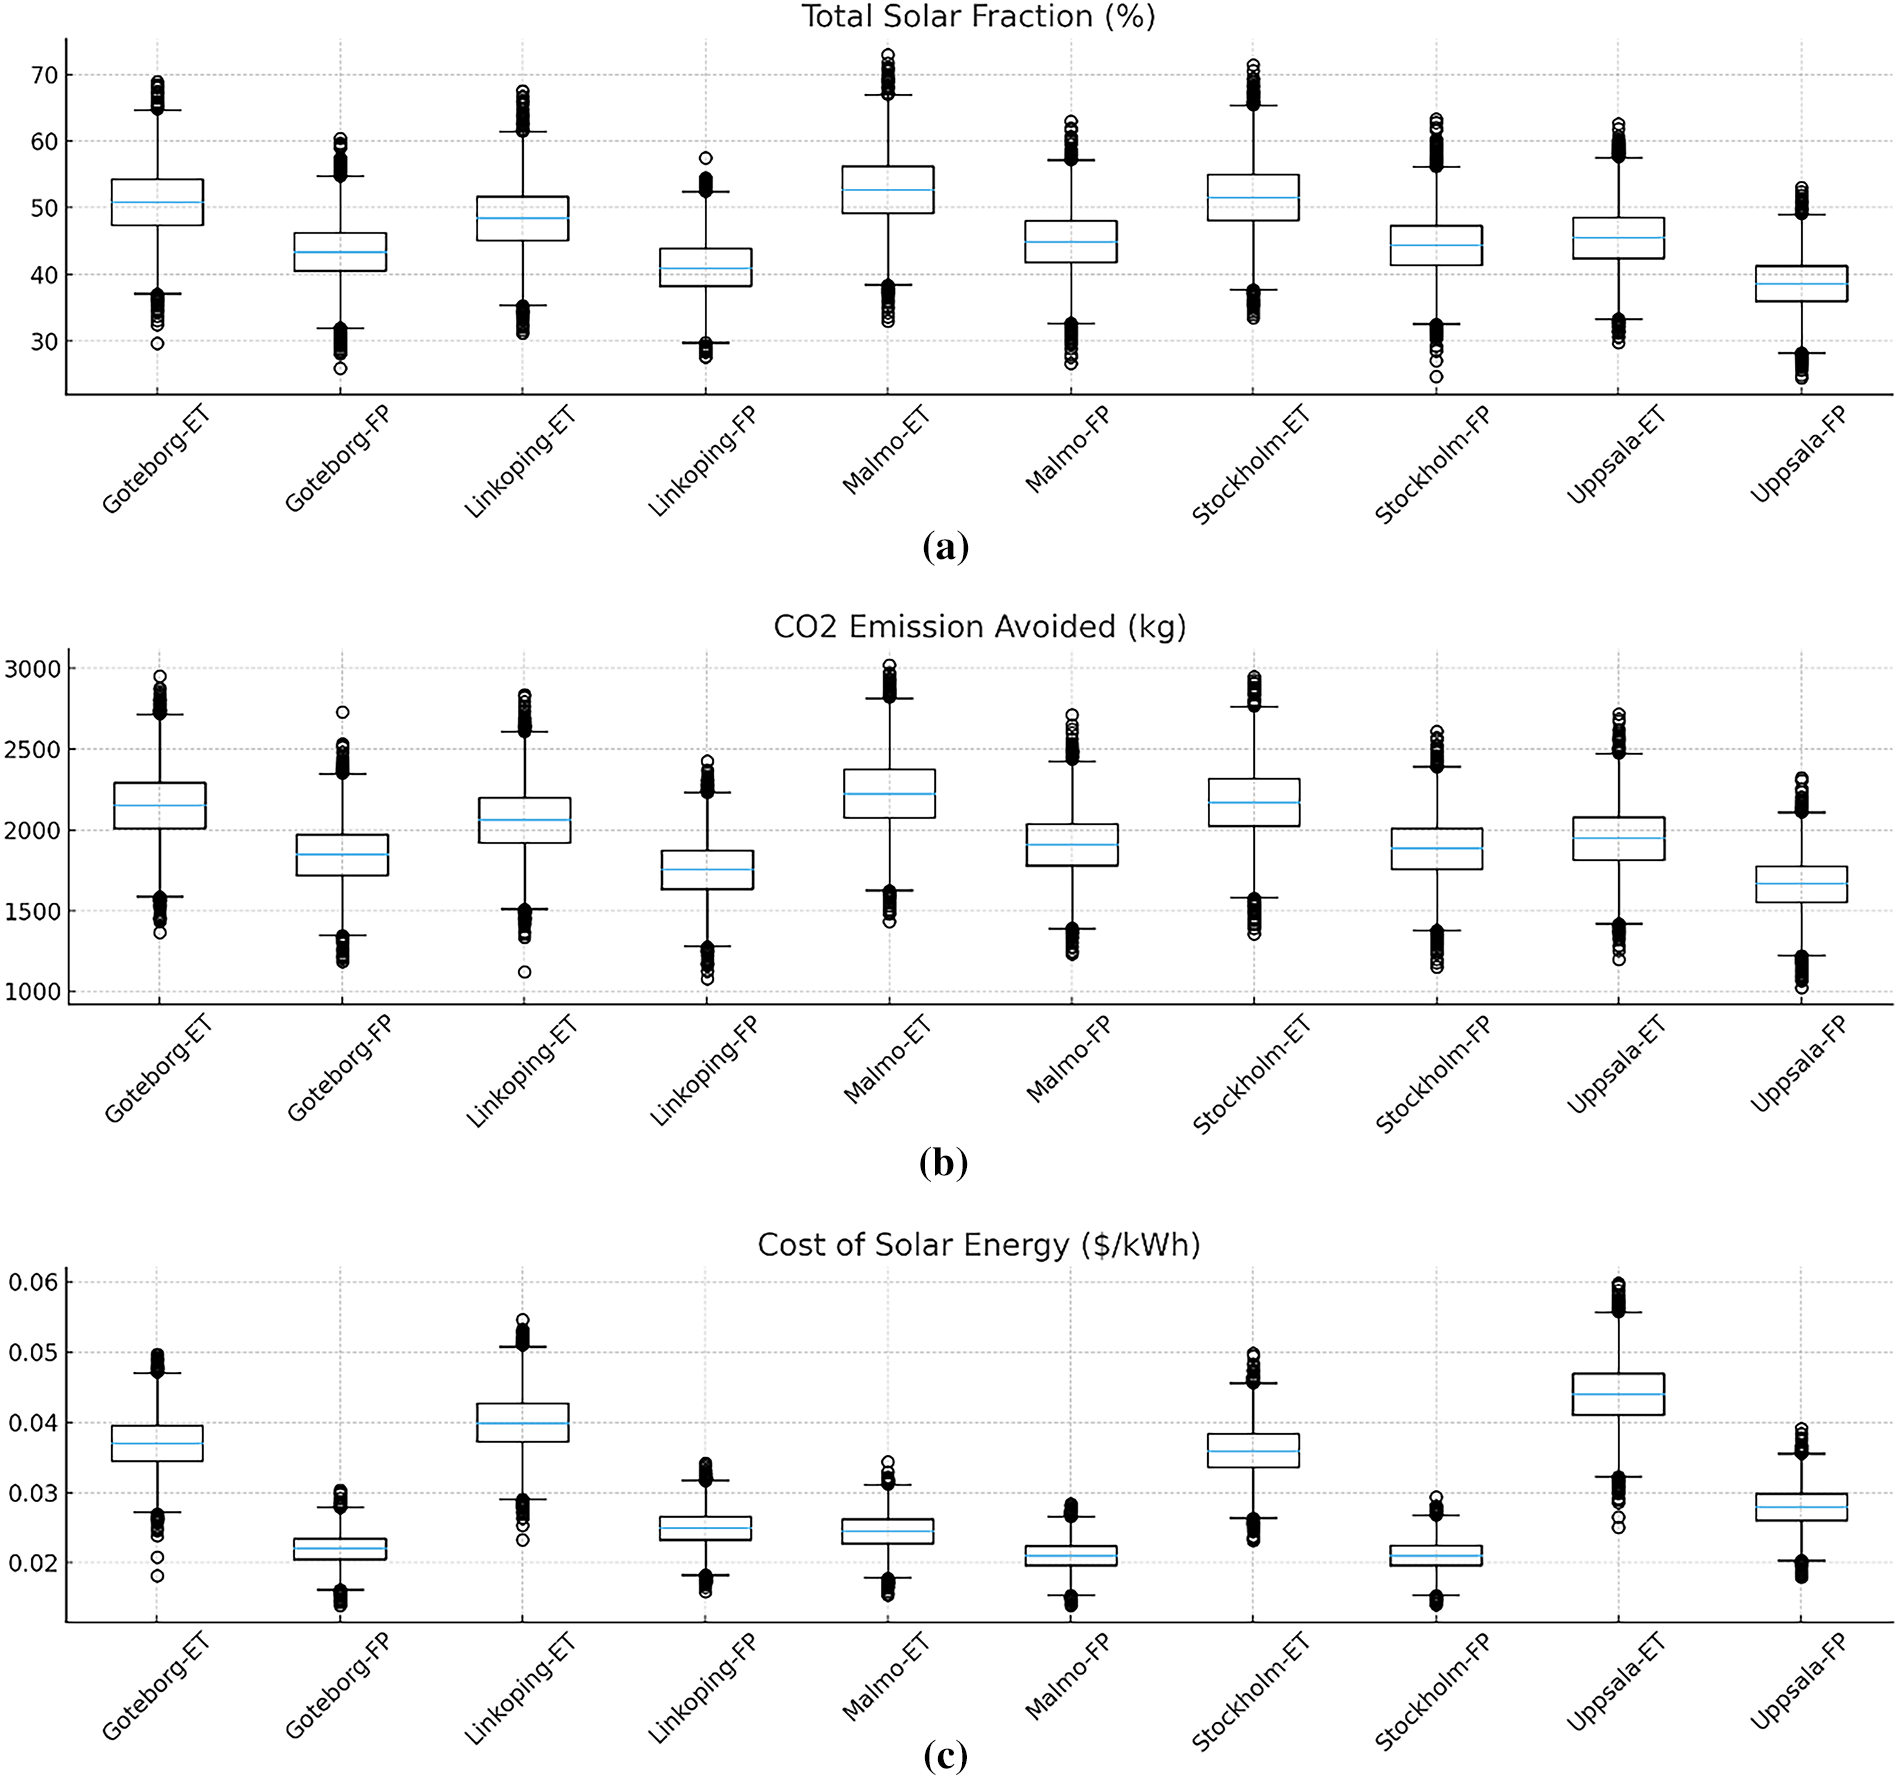
Figure 9: Monte Carlo uncertainty analysis of key performance indicators for SWH systems across five Swedish cities: (a) Total solar fraction (%), (b) CO2 Emission avoided (kg/year), and (c) Cost of solar energy ($/kWh), comparing FP and ET collectors
The results of Total Solar Fraction (TSF, %) indicate that the best performances were recorded for Malmo-ET (≈52.7%, ±5.2), Stockholm-ET (≈51.7%, ±5.2), and Goteborg-ET (≈50.9%, ±5.1), while Uppsala-ET (≈45.4%, ±4.6) and Linkoping-ET (≈48.4%, ±4.8) ranked lower. In all cities, ET collectors outperform FP collectors, but the superiority ranges between 6.7 and 7.8 percentage points (not “more than 10 percentage points” as sometimes assumed). Technically, the advantage of ET arises from its superior absorption of oblique solar radiation and reduced convective heat losses at lower ambient temperatures. However, due to climatic variations and differences in DHW/heating demand profiles, the magnitude of this superiority differs across cities. Overall, Malmo shows the best performance, followed by Stockholm and Goteborg, while Uppsala exhibits the weakest values.
The pattern of CO2 Emission Avoided (kg) is consistent with the solar fraction results. Malmo-ET (~2225 kg, ±222) achieves the highest CO2 mitigation, followed by Stockholm-ET (~2166 kg, ±216) and Goteborg-ET (~2150 kg, ±217). Across all five cities, the difference between ET and FP in terms of avoided CO2 is approximately +280 to +316 kg. This increase is a direct consequence of the higher amount of solar energy displacing fossil fuel use. Moreover, the uncertainty in CO2 avoided is slightly larger than in TSF, since in addition to energy variability, the results are also sensitive to the reference emission factors used.
For the Cost of Solar Energy ($/kWh), the economic picture is clear: in all cities, FP collectors are cheaper than ET collectors. The mean cost for FP falls in the range of ≈0.021–0.028 $/kWh (with the lowest observed in Malmo-FP ≈0.021 and Stockholm-FP ≈0.021), whereas ET collectors range between ≈0.0245–0.044 $/kWh, with the least favorable outcome in Uppsala-ET (≈0.0441). The ET–FP cost difference is about +0.015 $/kWh for most cities, except in Malmo where the gap is smaller (≈+0.0035 $/kWh). This implies that although ET is superior in terms of energy and environmental performance, it generally results in higher levelized energy costs. From a qualitative perspective, this outcome stems from the higher CAPEX of ET systems and the influence of financing conditions, which are not always fully offset by the additional heat yield; only in Malmo does the outstanding energy performance narrow the cost gap substantially.
Comparative synthesis: From an energy and environmental perspective, ET collectors consistently outperform FP collectors, with the top three performing cases being Malmo, Stockholm, and Goteborg. From an economic standpoint, FP remains the more cost-effective choice, and the justification for ET deployment depends largely on policy-driven constraints, environmental targets, or the valuation of non-economic benefits. Accordingly, if the primary objective is maximization of solar contribution and CO2 mitigation, ET is the preferred option; if minimization of levelized cost is the main criterion, FP is the rational choice—particularly in Stockholm and Goteborg. Ultimately, Malmo demonstrates the best overall performance, with the greatest potential alignment between energy/environmental benefits and economic feasibility due to its relatively smaller ET–FP cost gap. This analysis highlights quantitative (means and ranges), qualitative (technical reasoning), and comparative (city-to-city and technology-to-technology) insights, providing a robust foundation for informed technology selection and sustainable policy-making in the deployment of SWH systems across Sweden’s diverse climates.
Fig. 10 illustrates the variation of NPV with subsidy allowance for FP and ET collectors across five representative Swedish cities. As observed, in all locations and for both collector types, NPV increases almost linearly with allowance, indicating the direct and proportional effect of subsidies in reducing the effective capital cost of the systems. The dashed red line in each plot represents the break-even subsidy threshold (A*), where NPV equals zero.
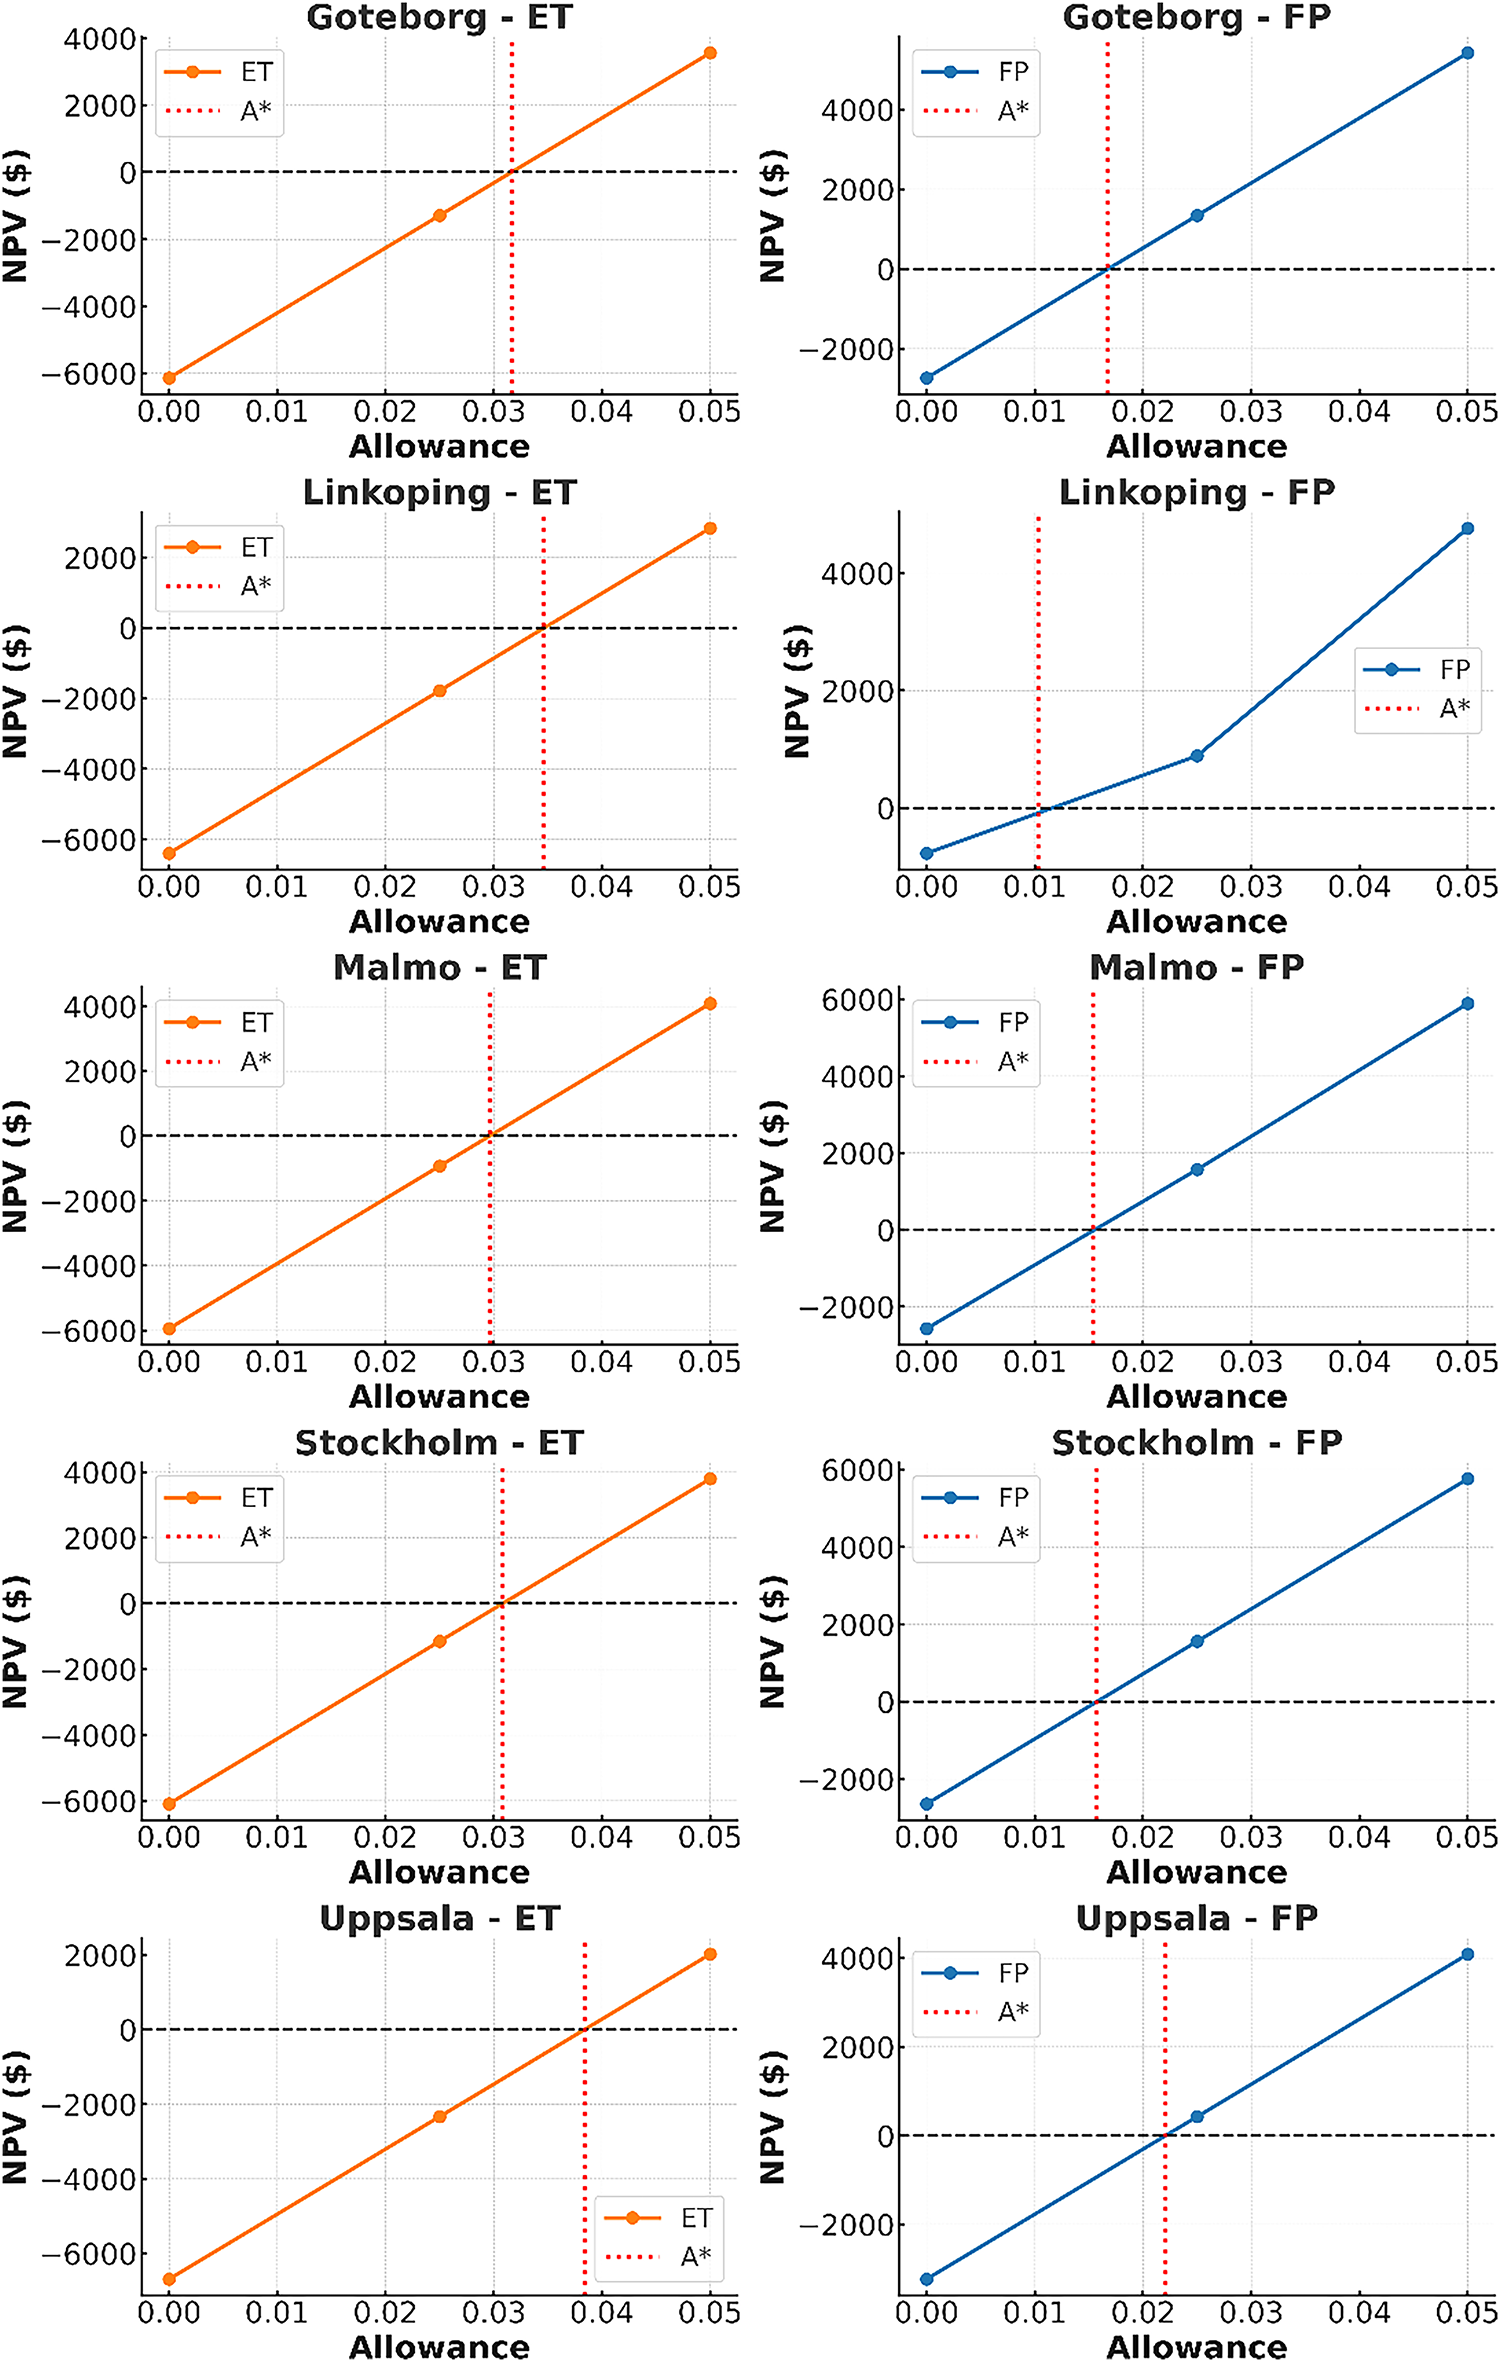
Figure 10: NPV versus subsidy allowance for FP and ET collectors across five Swedish cities (break-even thresholds indicated)
A comparison between FP and ET shows that although ET collectors deliver on average approximately 5.95 MWh/year more useful thermal energy (equivalent to ~18.6% higher heat output), their higher initial capital cost results in lower starting NPV values and requires higher subsidy levels to achieve profitability. In contrast, FP collectors, due to their lower CAPEX, consistently display lower break-even thresholds and reach positive NPV earlier across all cities.
Quantitatively, the slopes of the NPV–allowance curves range between 150–250 € per 1% allowance, meaning that a 1% increase in allowance leads to a gain of about 150–250 € in NPV, depending on city and collector type. Break-even thresholds for FP are found in the range of ≈1.0%–2.2%, whereas ET systems exhibit higher thresholds of ≈3.0%–3.8%. These results clearly indicate that FP systems achieve profitability more quickly, while ET systems, once above their higher break-even allowance, can generate greater long-term economic value due to their higher thermal yield.
From a policy perspective, these findings imply that FP systems are less dependent on direct financial support under current conditions, while ET systems require stronger subsidies or complementary mechanisms to become competitive. Where sufficient subsidies cannot be provided, carbon credits may serve as a viable alternative; calculations indicate that a carbon price in the range of 20–40 $/tCO2 could offset the economic deficit of systems with negative NPV. Overall, Fig. 10 underscores the importance of tailoring support policies to both technology type and climatic conditions of each city in order to maximize economic and environmental effectiveness.
Fig. 11 presents the break-even carbon credit price for five cities and both collector technologies. The results reveal that this price varies between approximately 30 and 165 $/tCO2, depending on climatic and technological context. In Göteborg, the break-even price was about 105 $/t for FP and 122 $/t for ET, reflecting ET’s higher reliance on carbon credit support. In Linköping, the contrast is particularly striking: FP reaches profitability at only 31 $/t, while ET requires around 140 $/t. In Malmö, the values are closer, at about 95 $/t for FP and 109 $/t for ET. A similar pattern is observed in Stockholm, with FP requiring 100 $/t and ET 118 $/t. Finally, Uppsala displays the highest thresholds, with FP and ET requiring 137 $/t and 165 $/t, respectively.
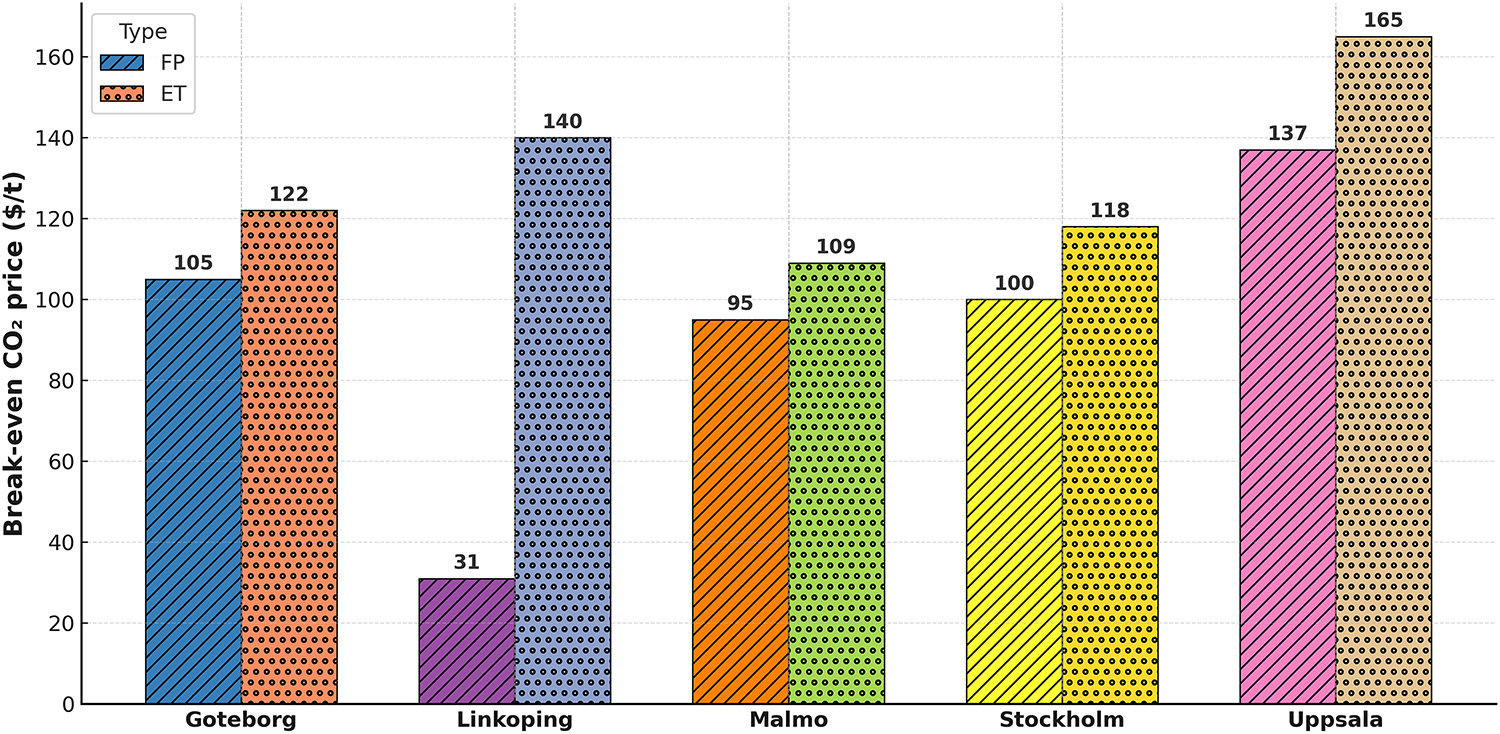
Figure 11: Break-even CO2 credit price across Swedish cities for FP and ET collectors
In comparative terms, FP consistently requires lower carbon credit prices across all cities, a reflection of its lower initial capital cost. Nevertheless, ET systems, despite requiring higher carbon credit levels to reach profitability, deliver about 18.6% greater thermal performance and thus hold stronger potential once economic deficits are offset. These results imply that under relatively low carbon price scenarios FP represents the more economically viable and lower-risk option, while at higher carbon prices (exceeding ~120 $/t), ET systems become economically justified and, due to their higher efficiency, offer more sustainable long-term benefits.
Aligning the outcomes of this study with the United Nations Sustainable Development Goals (SDGs) is essential, as it highlights the broader societal and environmental relevance of SWH systems beyond technical performance, linking them directly to global agendas for clean energy, sustainable urban development, and climate action. The present work aligns with SDG 7 (Affordable and Clean Energy) by quantifying pathways to increase the share of renewable heat in residential sectors, SDG 11 (Sustainable Cities and Communities) by addressing localized solar heating solutions across multiple Swedish cities, and SDG 13 (Climate Action) by evaluating CO2 mitigation potential and the role of carbon pricing. These connections underline the broader societal relevance of the study and reinforce the importance of SWH systems within global sustainability and decarbonization agendas.
Table 11 compares the results of the present study with the values reported in climatologically comparable references. For quantitative validation, two main indicators were considered: the domestic hot-water solar fraction (DHW-SF) and the collector thermal yield (kWh/m2-year).
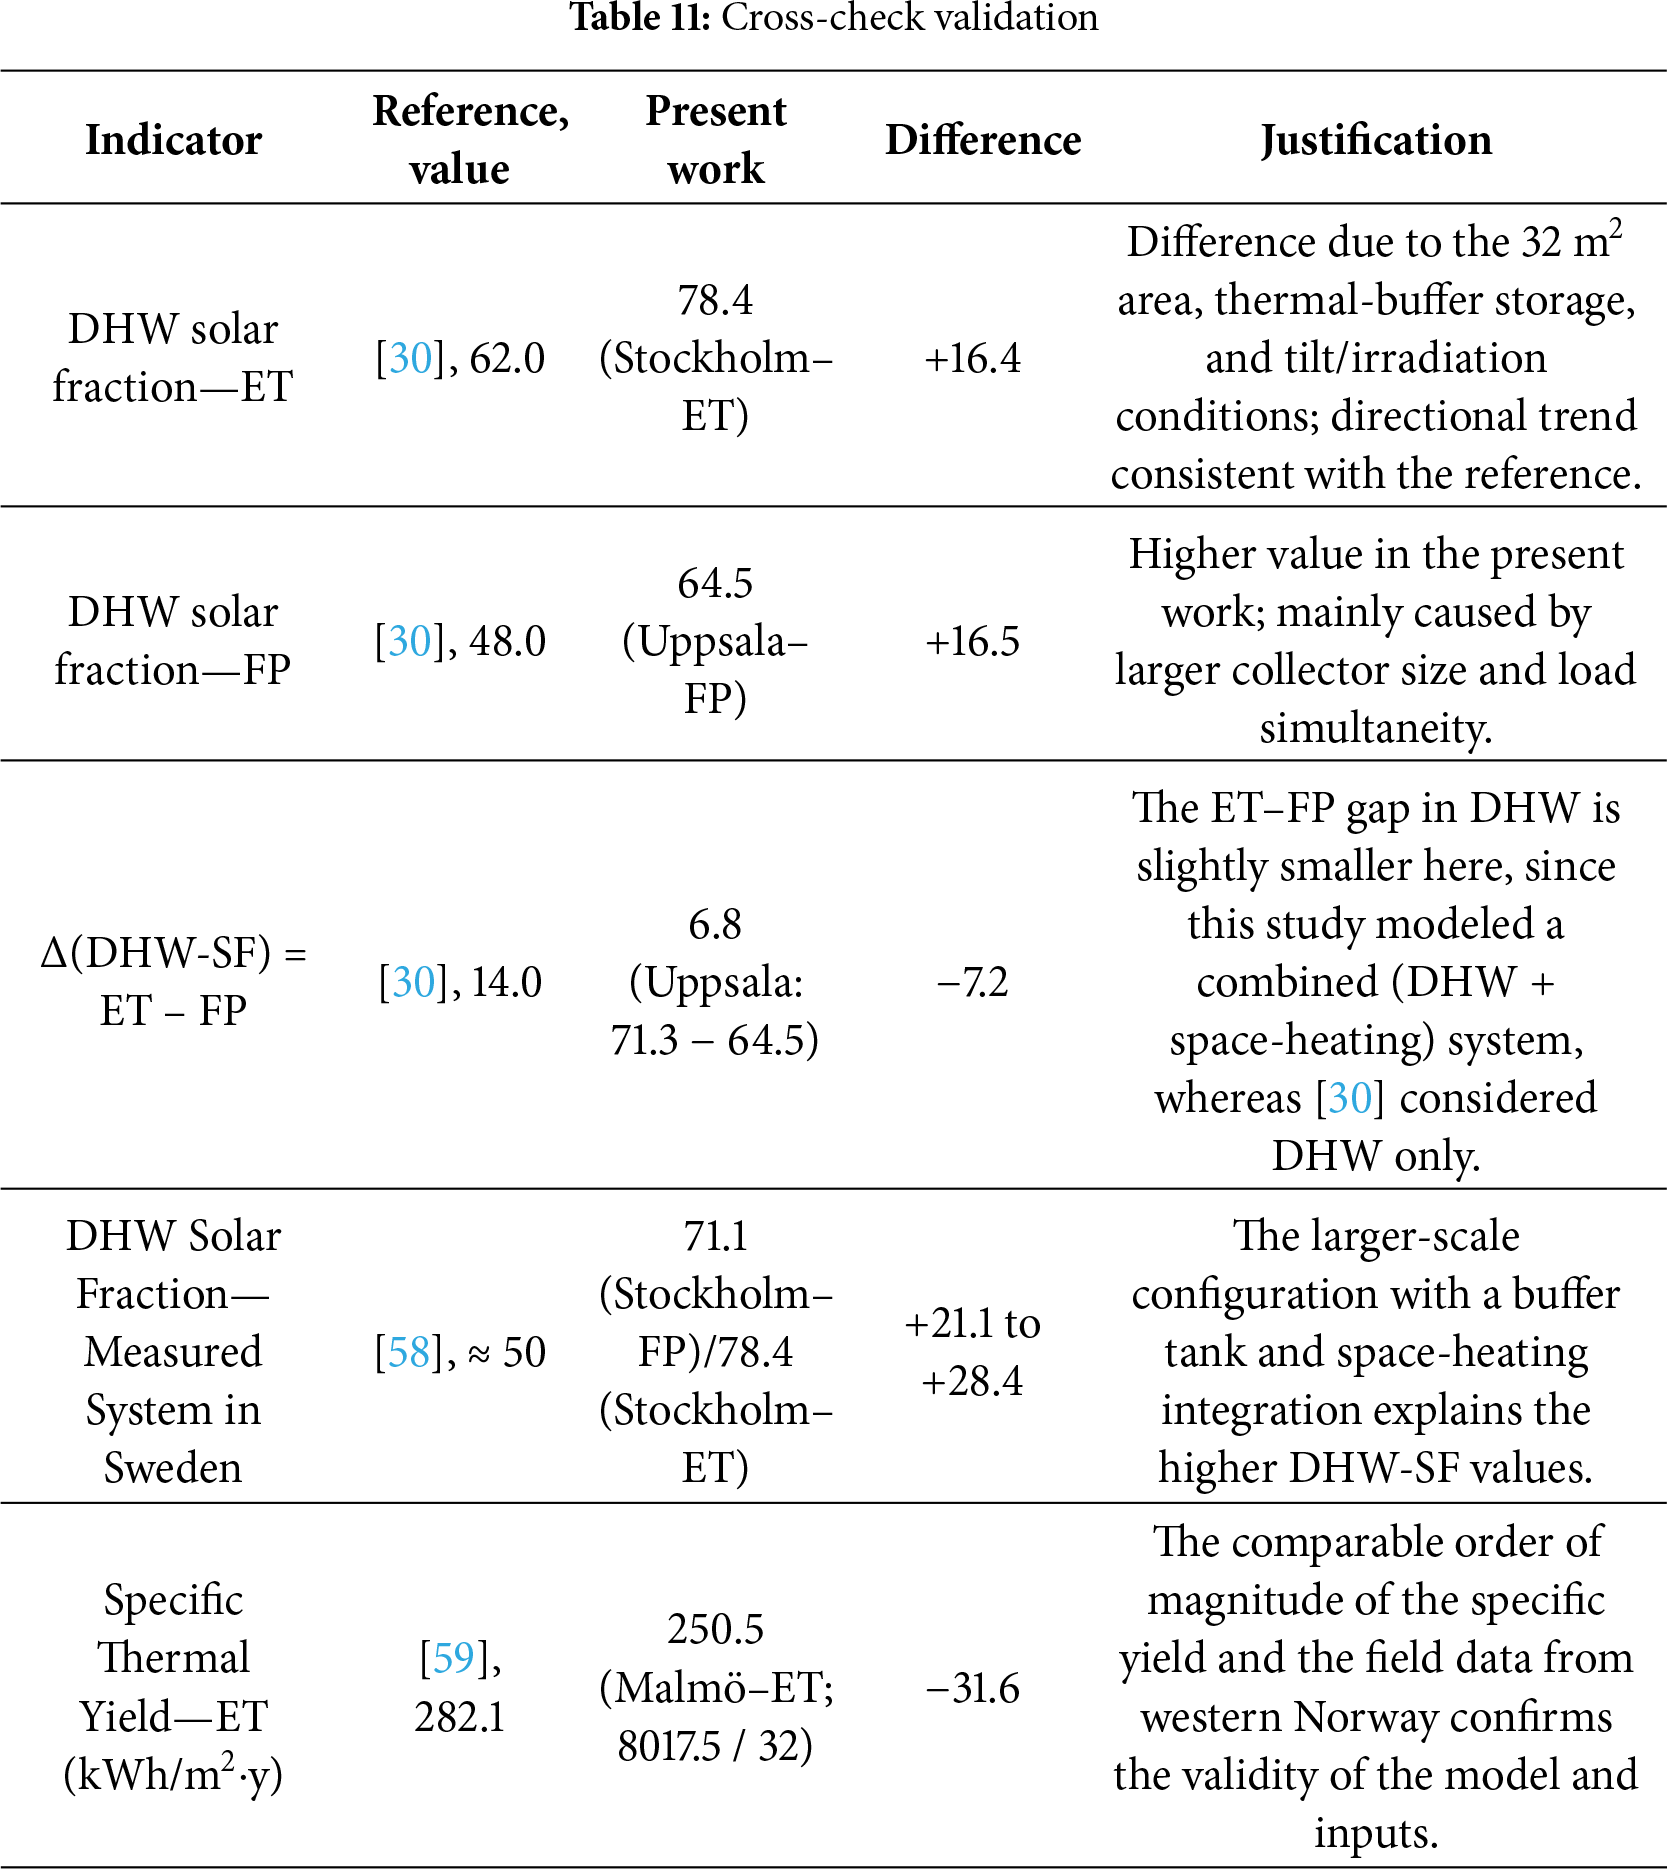
The reference values for inland Norway were taken from the study of Hagos et al. [30], while a field-measurement study in Sweden by Bernardo et al. [58] was used for national benchmarking.
In addition, an independent field investigation on an evacuated-tube solar collector in western Norway was employed for quality control of the specific thermal yield [59].
Hagos et al. [30] reported that an evacuated-tube collector can supply approximately 62% of the an-nual DHW demand, while a flat-plate collector of equal area covers around 48%.
In the present study, the DHW-SF for Stockholm reached 78.4% (ET) and 71.1% (FP) (see Table 7), meaning that the obtained values are higher than those in the reference, yet the technological trend (ET > FP) remains consistent. The main reasons for these elevated values are the larger collector surface (32 m2), the presence of thermal-buffer storage for space heating, and optimized tilt and control parameters. Furthermore, Hagos et al. [30] reported a 14-percentage-point difference in DHW-SF between ET and FP collectors. In Uppsala, the corresponding difference obtained here is 6.8, which is smaller than the reference. This reduction arises because the present system was designed as a combi-system (DHW + heating), meaning part of the ET advantage manifests in the space-heating loop, while [30] evaluated DHW only.
A field study in southern Sweden measured an average DHW-SF of about 50% [58]. The current values for Stockholm are 71.1% (FP) and 78.4% (ET). The higher figures are justified by the larger collector area, the presence of buffer storage, and the combined (DHW + heating) load. Nevertheless, the consistency in performance ranking—particularly the superiority of ET over FP—confirms the coherence of results.
The field experiment in western Norway reported roughly 2200 kWh per year for a 7.8 m2 evacuated-tube array, equivalent to ≈282 kWh/m2-year [59]. For Malmö–ET in the present work, the total useful annual energy equals 8017.5 kWh (5567.8 for DHW + 2449.7 for heating), corresponding to ≈250.5 kWh/m2-year for 32 m2.
This agreement in magnitude demonstrates strong climatic-technical consistency and supports the reliability of the simulation model and boundary conditions. Table 11 evidences that (a) the performance advantage of ET over FP in this work aligns with previous studies; (b) numeric discrepancies are fully explainable through system size, buffer inclusion, and mixed load conditions; and (c) the achieved thermal yield lies within the range of field-measured performance for northern-European climates.
Choosing the right SWH system relies on a variety of factors such as the heating needs, design, and site of the building. Considering the lack of an extensive study on the use of FP and ET water heaters in Sweden, present work aimed to assess how these systems contribute to fulfilling the heat needs of residential apartments. This study represents the first multi-city, system-level evaluation of SWH in Sweden that integrates energy, environmental, and economic dimensions under diverse climatic conditions. By quantifying subsidy break-even thresholds and carbon credit prices, and by incorporating Monte Carlo uncertainty analysis, the work provides robust insights into the trade-offs between FP and ET collectors. These contributions not only highlight the technological and policy significance of solar thermal deployment in Sweden but also establish a transferable framework for future studies in other Nordic and European contexts. Dynamic analyses were performed over a period of one year by TSOL Pro 5.5 software. The study areas were 5 major cities in Sweden and the parameters of the study were space heating, domestic sanitary water heating, use of auxiliary gas boiler, prevention of CO2 emissions, NPV parameter, and price per kWh of solar heat. The key findings, Recommendations, Implications and Limitations and Assumptions of this study are as follows:
• Key Findings
(i) The optimal collector number (≈32 units corresponding to ~40% solar fraction).
(ii) The optimal storage tank volume (≈1680 L).
(iii) The comparative energy and environmental performance of FP vs. ET collectors (with ET showing ~18.6% higher annual useful heat and ~1500–2000 kWh greater space-heating contributions).
(iv) The quantified CO2 emission reductions and loss distribution across different subsystems.
(v) The results of the Monte Carlo uncertainty analysis, which demonstrated that ET consistently outperforms FP across all five cities despite variability in solar irradiation, subsidy levels, and collector efficiency; the uncertainty ranges were ±4%–5% for TSF, ±280–316 kg CO2/year for avoided emissions, and modest variations in LCOH, with FP remaining more cost-effective while ET provided higher environmental benefits.
• Recommendations
(i) the minimum subsidy thresholds required for positive NPV (≈1.0%–2.2% for FP and ≈3.0%–3.8% for ET).
(ii) the higher economic competitiveness of FP under low-support scenarios.
(iii) the role of carbon credits (≈30–165 $/tCO2 depending on site and technology) in offsetting negative NPVs.
(iv) the greater long-term sustainability potential of ET systems in high solar-fraction regions (e.g., Malmö) when adequate policy support is provided.
• Limitations
(i) domestic hot-water demand was modeled as an average static load rather than dynamic daily/seasonal profiles.
(ii) seasonal variability in solar availability may influence real-world performance beyond the modeled averages.
(iii) grid CO2 emission factors were assumed to be constant, while future grid decarbonization will alter the environmental benefits of solar thermal systems.
• Future works
(i) extending the analysis to incorporate dynamic hot-water usage profiles.
(ii) evaluating hybrid photovoltaic/thermal (PVT) systems to jointly deliver electricity and heat.
(iii) exploring integration with heat-pump systems to maximize seasonal efficiency.
(iv) assessing the sensitivity of results to different scenarios of future grid decarbonization and carbon-pricing pathways.
• Implications
(i) System design implications: Optimal system sizing balances solar fraction and cost-effectiveness, while technology choice (FP vs. ET) should be adapted to local climatic and demand conditions.
(ii) Policy implications: The derived subsidy break-even thresholds (A*) and carbon credit prices (P*CO2) provide actionable benchmarks for policymakers to design targeted support schemes. FP collectors reach viability under lighter subsidies, whereas ET requires stronger support but delivers higher energy and CO2 savings.
(iii) Environmental implications: ET systems consistently achieve ~18.6% higher thermal yield and avoid ~10%–15% more CO2 emissions than FP, highlighting their potential role in emission-reduction strategies despite higher CAPEX.
(iv) Economic implications: Monte Carlo results show that while ET has higher levelized costs, its economic deficit can be offset by subsidies of ≈3%–4% or carbon prices above ≈120 $/tCO2, guiding future incentive design.
(v) Future research implications: The framework can be extended to hybrid systems (e.g., PVT, heat pump–SWH integration) and to dynamic demand or grid-decarbonization scenarios, broadening the scope of solar thermal deployment in Nordic contexts.
Acknowledgement: We would like to acknowledge the academic and institutional support provided by Islamic Azad University, which created the conditions necessary for conducting this study.
Funding Statement: The authors declare that no funds, grants, or other forms of financial support were received for the preparation of this manuscript.
Author Contributions: Mehran Karimi: Literature collection and visualization. Hesamodin Heidarigoujani: Initial draft writing, methodology. Mehdi Jahangiri: Conceptualization, supervision, and final review. Milad Torabi Anaraki: Data organization, preparation of tables and figures. Daryosh Mohamadi Janaki: Editing, formatting, and references verification. All authors reviewed the results and approved the final version of the manuscript.
Availability of Data and Materials: The authors confirm that all data and materials used in this study are openly available and have been appropriately referenced in the manuscript.
Ethics Approval: Not applicable.
Conflicts of Interest: The authors state that they have no competing interests that could have influenced the content or conclusions of this manuscript.
References
1. Sarsam WS, Kazi SN, Badarudin A. A review of studies on using nanofluids in flat-plate solar collectors. Sol Energy. 2015;122:1245–65. doi:10.1016/j.solener.2015.10.032. [Google Scholar] [CrossRef]
2. Shukla DL, Modi KV. A technical review on regeneration of liquid desiccant using solar energy. Renew Sustain Energy Rev. 2017;78:517–29. doi:10.1016/j.rser.2017.04.103. [Google Scholar] [CrossRef]
3. Singh S, Anand A, Shukla A, Sharma A. Environmental, technical and financial feasibility study of domestic solar water heating system in India. Sustain Energy Technol Assess. 2021;43:100965. doi:10.1016/j.seta.2020.100965. [Google Scholar] [CrossRef]
4. Modi K, Shukla D, Bhargav B, Devaganiya J, Deshle R, Dhodi J, et al. Efficacy of organic and inorganic nanofluid on thermal performance of solar water heating system. Clean Eng Technol. 2020;1:100020. doi:10.1016/j.clet.2020.100020. [Google Scholar] [CrossRef]
5. IEA. Key world energy statistics. Paris, France: International Energy Agency; 2018 [cited 2025 Oct 31]. Available from: https://www.iea.org/data-and-statistics/data-product/world-energy-statistics. [Google Scholar]
6. Eurostat. Share of fuels in the final energy consumption in the residential sector, 2016 (%). 2018. [cited 2018 Mar 21]. Available from: https://ec.europa.eu/eurostat/statistics-explained/index.php?title=File:Share_of_fuels_in_the_final_energy_consumption_in_the_residential_sector_for_space_heating,_2016_(%25).png&oldid=378642/. [Google Scholar]
7. Tian Z, Zhang S, Deng J, Fan J, Huang J, Kong W, et al. Large-scale solar district heating plants in Danish smart thermal grid: developments and recent trends. Energy Convers Manag. 2019;189:67–80. doi:10.1016/j.enconman.2019.03.071. [Google Scholar] [CrossRef]
8. Adamo A, Martin H, Hoz JDL, Rubio J. A review of worldwide strategies for promoting high-temperature heat pumps. Appl Sci. 2025;15(2):839. doi:10.3390/app15020839. [Google Scholar] [CrossRef]
9. IEA. Technology roadmap solar heating and cooling. Paris, France: International Energy Agency; 2012. [Google Scholar]
10. Mathiesen BV, Hansen K. The role of solar thermal in future energy systems: country cases for Germany, Italy, Austria and Denmark. Aalborg, Denmark: Aalborg University; 2017. [Google Scholar]
11. Gautam A, Chamoli S, Kumar A, Singh S. A review on technical improvements, economic feasibility and world scenario of solar water heating system. Renew Sustain Energy Rev. 2017;68:541–62. doi:10.1016/j.rser.2016.09.104. [Google Scholar] [CrossRef]
12. Wikipedia. [cited 2020 Mar 10]. Available from: https://en.wikipedia.org/wiki/Sweden/. [Google Scholar]
13. IRENA. Innovative solutions for 100% renewable power in Sweden. Abu Dhabi, United Arab Emirates: International Renewable Energy Agency; 2020. [Google Scholar]
14. Tang O, Rehme J, Cerin P, Huisingh D. Hydrogen production in the Swedish power sector: considering operational volatilities and long-term uncertainties. Energy Policy. 2021;148(1):111990. doi:10.1016/j.enpol.2020.111990. [Google Scholar] [CrossRef]
15. Guevara-Stone L. How Malmö, Sweden is Leading Way on Sustainability. 2014 [cited 2014 Sept 24]. Available from: https://reneweconomy.com.au/malmo-sweden-leading-way-70597/. [Google Scholar]
16. IEA. Sweden, Energy System of Sweden. Paris, France: International Energy Agency; 2018. [cited 2018 Apr 4]. Available from: https://www.iea.org/countries/sweden/. [Google Scholar]
17. Mordor Intelligence. Sweden Solar Energy Market—Growth, Trends, COVID-19 Impact, and Forecasts (2021–2026). 2020 [cited 2020 May 12]. Available from: https://www.mordorintelligence.com/industry-reports/sweden-solar-energy-market/. [Google Scholar]
18. IEA SHC. Status of solar heating/cooling and solar buildings—2020, status of the market for solar thermal systems. 2020 [cited 2020 Dec 10]. Available from: https://www.iea-shc.org/countries/sweden/report/. [Google Scholar]
19. SOLARGIS. Solar resource maps of Sweden. 2021 [cited 2021 Apr 17]. Available from: https://solargis.com/maps-and-gis-data/download/sweden/. [Google Scholar]
20. Kjellsson E. Solar collectors combined with ground-source heat pumps in dwellings analyses of system performance. Lund, Sweden: Lund University; 2009. p. 1–168. [Google Scholar]
21. Solar heat markets in europe: trends and market statistics 2020, © 2025 solar heat Europe; 2021 Dec [cited 2025 Oct 9]. Available from: https://solarheateurope.eu/wp-content/uploads/2022/03/Solar_Heat_Market_2021_final_single_pages.pdf. [Google Scholar]
22. Nguyen T, Danielski I, Ahlgren B, Nair G. Effects of solar thermal energy on district heating systems: the case of parabolic trough collectors in a high-latitude region. Sustain Energy Fuels. 2024;8(17):3964–75. doi:10.1039/D4SE00607K. [Google Scholar] [CrossRef]
23. ABC du Solaire Thermique, Renouvelle. 2025 [cited 2025 Oct 9]. Available from: https://www.renouvelle.be/fr/outils/abc-du-solaire-thermique. [Google Scholar]
24. Türkiye’s special role in the global solar thermal market, © 2025, Solar Thermal World. 2025 [cited 2025 Oct 9]. Available from: https://solarthermalworld.org/news/turkiyes-special-role-in-the-global-solar-thermal-market. [Google Scholar]
25. Solvarmeanlegg i Norge, Asplan Viak. 2025 [cited 2025 Oct 9]. Available from: https://static1.squarespace.com/static/597512eb579fb3d3de0207aa/t/598064afebbd1a89a61bb0c8/1501586613164/Solvarmeanlegg%2Bi%2BNorge.pdf. [Google Scholar]
26. Şerban A, Bărbuţă-Mişu N, Ciucescu N, Paraschiv S, Paraschiv S. Economic and environmental analysis of investing in solar water heating systems. Sustainability. 2016;8(12):1286. doi:10.3390/su8121286. [Google Scholar] [CrossRef]
27. Bernardo LR, Davidsson H, Karlsson B. Performance evaluation of a high solar fraction CPC-collector system. J Environ Eng. 2011;6(3):680–92. doi:10.1299/jee.6.680. [Google Scholar] [CrossRef]
28. Kalbasi R, Jahangiri M, Mosavi A, Dehshiri SJH, Dehshiri SSH, Ebrahimi S, et al. Finding the best station in Belgium to use residential-scale solar heating, one-year dynamic simulation with considering all system losses: economic analysis of using ETSW. Sustain Energy Technol Assess. 2021;45(8):101097. doi:10.1016/j.seta.2021.101097. [Google Scholar] [CrossRef]
29. Siampour L, Vahdatpour S, Jahangiri M, Mostafaeipour A, Goli A, Shamsabadi AA, et al. Techno-enviro assessment and ranking of Turkey for use of home-scale solar water heaters. Sustain Energy Technol Assess. 2021;43:100948. doi:10.1016/j.seta.2020.100948. [Google Scholar] [CrossRef]
30. Hagos DA, Gebremedhin A, Zethraeus B. Solar water heating as a potential source for inland Norway energy mix. J Renew Energy. 2014;2014:968320. doi:10.1155/2014/968320. [Google Scholar] [CrossRef]
31. Hoseinzadeh S, Garcia DA, Huang L. Grid connected renewable energy systems flexibility in Norway islands’ decarbonization. Renew Sustain Energy Rev. 2023;185:113658. doi:10.1016/j.rser.2023.113658. [Google Scholar] [CrossRef]
32. Østergaard PA, Johannsen RM, Lund H, Mathiesen BV. Latest Developments in 4th generation district heating and smart energy systems. Int J Sustain Energy Plan Manag. 2021;31:1–4. doi:10.5278/ijsepm.6432. [Google Scholar] [CrossRef]
33. Tschopp D, Tian Z, Berberich M, Fan J, Perers B, Furbo S. Large scale solar thermal systems in leading countries: a review and comparative study of Denmark, China, Germany and Austria. Appl Energy. 2020;270:114997. doi:10.1016/j.apenergy.2020.114997. [Google Scholar] [CrossRef]
34. Bernardo LR, Perers B, Håkansson H, Karlsson B. Performance evaluation of low concentrating photovoltaic/thermal systems: a case study from Sweden. Sol Energy. 2011;85(7):1499–510. doi:10.1016/j.solener.2011.04.006. [Google Scholar] [CrossRef]
35. Barbosa RR, Schultz HS, da Costa Garcia L, Martins DD, Carvalho M. Economic and greenhouse gas assessments for two hot water industrial systems: solar vs. natural gas. Clean Eng Technol. 2022;6:100365. doi:10.1016/j.clet.2021.100365. [Google Scholar] [CrossRef]
36. Barbosa RR, Carvalho M. A step by step design guide for a solar water heating system considering thermal losses. Rev De Eng Térmica. 2019;18(2):26–37. doi:10.5380/reterm.v18i2.70784. [Google Scholar] [CrossRef]
37. Statista. 2015. Sweden: the largest cities in 2015. [cited 2021 May 14]. Available from: https://www.statista.com/statistics/375475/largest-cities-in-sweden/. [Google Scholar]
38. Odyssee-Mure. Heating consumption per m2 and per dwelling, sectoral profile—households. 2020 [cited 2021 May 14]. Available from: https://www.odyssee-mure.eu/publications/efficiency-by-sector/households/heating-consumption-per-m2.html/. [Google Scholar]
39. Kemna R. Average EU building heat load for HVAC equipment. Brussels, Belgium: European Commission; 2014. Final report. [Google Scholar]
40. Lundh M, Wäckelgård E, Ellegård K. Design of hot water user profiles for Swedish conditions. In: Proceedings of ISES World Congress 2007. Vol. 1. Berlin/Heidelberg, Germany: Springer; 2008. p. 2074–8. doi:10.1007/978-3-540-75997-3_421. [Google Scholar] [CrossRef]
41. Swedish Energy Agency. Water and water heater. 2015 [cited 2021 May 14]. Available from: https://www.energimyndigheten.se/en/sustainability/households/other-energy-consumption-in-your-home/water-and-water-heater/. [Google Scholar]
42. Pahlavan S, Jahangiri M, Alidadi Shamsabadi A, Khechekhouche A. Feasibility study of solar water heaters in Algeria, a review. J Sol Energy Res. 2018;3(2):135–46. [Google Scholar]
43. Trading Economics. Interest Rate, ASIA [cited 2021 May 14]. Available from: https://tradingeconomics.com/country-list/interest-rate?continent=asia/. [Google Scholar]
44. Mata É, Sasic Kalagasidis A, Johnsson F. Cost-effective retrofitting of Swedish residential buildings: effects of energy price developments and discount rates. Energy Effic. 2015;8(2):223–37. doi:10.1007/s12053-014-9287-1. [Google Scholar] [CrossRef]
45. Hansson SO, Lilieqvist K, Björnberg KE, Johansson MV. Time horizons and discount rates in Swedish environmental policy: who decides and on what grounds? Futures. 2016;76:55–66. doi:10.1016/j.futures.2015.02.007. [Google Scholar] [CrossRef]
46. Jamet S. Enhancing the cost-effectiveness of climate change mitigation policies in Sweden. Paris, France: OECD; 2011. p. 1–40. OECD Economics Department Working Papers No. 841. doi:10.1787/5kghxkjv0j5k-en. [Google Scholar] [CrossRef]
47. Cost-Benefit Analysis (NOU 2012: 16Government.no. 2012 [cited 2025 Sept 1]. Available from: https://www.regjeringen.no/en/dokumenter/nou-2012-16/id700821. [Google Scholar]
48. Global Petrol Price. Natural Gas Prices. 2020. [cited 2021 May 14]. Available from: https://www.globalpetrolprices.com/natural_gas_prices/. [Google Scholar]
49. Abdollahiarpanahi S, Jahangiri M, Shahgholian S, Taheri M. Finding the best station in Canada for Using residential scale solar heating: a multicriteria decision-making analysis. Int Trans Electr Energy Syst. 2024;2024(1):8843981. doi:10.1155/etep/8843981. [Google Scholar] [CrossRef]
50. Energypedia. Solar Water Heater [cited 2021 May 14]. Available from: https://energypedia.info/wiki/Solar_Water_Heater#Evacuated_Tube_Collector/. [Google Scholar]
51. Jahangiri M, Alidadi Shamsabadi A, Saghaei H. Comprehensive evaluation of using solar water heater on a household scale in Canada. J Renew Energy Environ. 2018;5(1):35–42. doi:10.30501/JREE.2018.88491. [Google Scholar] [CrossRef]
52. Jahangiri M, Akinlabi ET, Sichilalu SM. Assessment and modeling of household-scale solar water heater application in Zambia: technical, environmental, and energy analysis. Int J Photoenergy. 2021;2021(1):6630338. doi:10.1155/2021/6630338. [Google Scholar] [CrossRef]
53. Taheri M, Shahgholian S, Jahangiri M, Salehi M. Harnessing solar power for eco and enviro friendly water park heating: case study of Hawana water park. J Eng. 2025;2025(1):1755066. doi:10.1155/je/1755066. [Google Scholar] [CrossRef]
54. Rezapour S, Jahangiri M, Ghadiri Shahrezaie A, Goli A, Yadollahi Farsani R, Issakhov A, et al. Dynamic simulation and ranking of using residential-scale solar water heater in Iran. J Environ Eng Landsc Manag. 2022;30(1):30–42. doi:10.3846/jeelm.2022.15483. [Google Scholar] [CrossRef]
55. Greco A, Gundabattini E, Gnanaraj DS, Masselli C. A comparative study on the performances of flat plate and evacuated tube collectors deployable in domestic solar water heating systems in different climate areas. Climate. 2020;8(6):78. doi:10.3390/cli8060078. [Google Scholar] [CrossRef]
56. Danish Energy Agency. Technology data for individual heating plants solar thermal. Copenhagen, Denmark: DEA; 2025 [cited 2025 Sept 7]. Available from: https://ens.dk/en/analyses-and-statistics/technology-data-individual-heating-plants. [Google Scholar]
57. Bernardo LR, Davidsson H, Karlsson B. Retrofitting domestic hot water heaters for solar water heating systems in single-family houses in a cold climate: a theoretical analysis. Energies. 2012;5(10):4110–31. doi:10.3390/en5104110. [Google Scholar] [CrossRef]
58. Bernardo LR, Davidsson H, Andersson E. Retrofitted solar domestic hot water systems for Swedish single-family houses, evaluation of a prototype and life-cycle cost analysis. Energies. 2016;9(11):953. doi:10.3390/en9110953. [Google Scholar] [CrossRef]
59. Popsueva V, Lopez AFO, Kosinska A, Nikolaev O, Balakin BV. Field study on the thermal performance of vacuum tube solar collectors in the climate conditions of Western Norway. Energies. 2021;14(10):2745. doi:10.3390/en14102745. [Google Scholar] [CrossRef]
Cite This Article
 Copyright © 2026 The Author(s). Published by Tech Science Press.
This work is licensed under a Creative Commons Attribution 4.0 International License , which permits unrestricted use, distribution, and reproduction in any medium, provided the original work is properly cited.
 Downloads
 Citation Tools
.png&oldid=378642/)