
 Submit a Paper
 Propose a Special lssue
 Open Access
ARTICLE

Numerical Simulation of Cross-Layer Propagation Mechanisms for Hydraulic Fractures in Deep Coal-Rock Formations
1 Research Institute of Petroleum Engineering Technology, SINOPEC Jiangsu Oilfield Company, Yangzhou, 225009, China
2 School of Petroleum Engineering, China University of Petroleum (East China), Qingdao, 266580, China
* Corresponding Author: Zhirong Jin. Email:
Energy Engineering 2026, 123(2), 16 https://doi.org/10.32604/ee.2025.070750
Received 23 July 2025; Accepted 12 September 2025; Issue published 27 January 2026
 View Full Text
 Download PDF
Abstract
Hydraulic fracturing serves as a critical technology for reservoir stimulation in deep coalbed methane (CBM) development, where the mechanical properties of gangue layers exert a significant control on fracture propagation behavior. To address the unclear mechanisms governing fracture penetration across coal-gangue interfaces, this study employs the Continuum-Discontinuum Element Method (CDEM) to simulate and analyze the vertical propagation of hydraulic fractures initiating within coal seams, based on geomechanical parameters derived from the deep Benxi Formation coal seams in the southeastern Ordos Basin. The investigation systematically examines the influence of geological and operational parameters on cross-interfacial fracture growth. Results demonstrate that vertical stress difference, elastic modulus contrast between coal and gangue layers, interfacial stress differential, and interfacial cohesion at coal-gangue interfaces are critical factors governing hydraulic fracture penetration through these interfaces. High vertical stress differences (>3 MPa) inhibit interfacial dilation, promoting predominant cross-layer fracture propagation. Reduced interfacial stress contrasts and enhanced interfacial cohesion facilitate fracture penetration across interfaces. Furthermore, smaller elastic modulus contrasts between coal and gangue correlate with increased interfacial aperture. Finally, lower injection rates effectively suppress vertical fracture propagation in deep coal reservoirs. This study elucidates the characteristics and mechanisms governing cross-layer fracture propagation in coal–rock composites with interbedded partings, and delineates the dynamic evolution laws and dominant controlling factors involved. The findings provide critical theoretical insights for the optimization of fracture design and the efficient development of deep coalbed methane reservoirs.Keywords
China possesses abundant coalbed methane (CBM) resources. According to the national CBM resource assessment prediction, the total geological resources of CBM stored in different regions and at varying depths are approximately 80 × 1012 m3. Among these, deep coalbed methane (at depths exceeding 2000 m) accounts for about 40.47 × 10¹² m3, representing over half of the total resources and indicating vast development potential [1–4]. However, compared to mid-shallow coal reservoirs, deep coal-rock formations exhibit distinct characteristics including high in-situ stress, low permeability, well-developed natural weaknesses (such as bedding planes and cleats), and strong heterogeneity. These properties result in rapid production decline in single wells and poor economic returns [5,6]. In this context, hydraulic fracturing serves as a key enabler for unlocking deep coalbed methane resources, with its core objective being to interconnect natural fractures within coal reservoirs via engineered fractures, thereby establishing high-conductivity flow pathways that facilitate dewatering-induced gas recovery through reservoir pressure depletion, ultimately enhancing gas desorption kinetics and production capacity [7–9].
The widely developed gangue layers in the deep coal seams of the Benxi Formation, southeastern Ordos Basin, display a vertically stacked and laterally discontinuous spatial pattern. Composed mainly of carbonaceous mudstone, siltstone, and thin limestone interbeds, these layers possess distinct rock mechanical properties, stress conditions, and permeability compared to the coal seams. These differences play a key role in controlling the vertical growth of hydraulic fractures. Therefore, effective containment of fracture height is crucial for successful coalbed methane (CBM) production in such reservoirs [10–12]. Regarding hydraulic fracture vertical propagation, domestic and international researchers have conducted extensive studies through physical experiments and numerical simulations. Daneshy et al. [13] performed hydraulic fracture interlayer propagation experiments using sandstone-limestone composite specimens, revealing that higher interfacial cementation strength facilitates fracture penetration across layer interfaces. Zhao and Chen [14] established a critical criterion for hydraulic fracture propagation behavior at interlayer interfaces based on rock fracture mechanics theory, mechanically explaining the causes of interfacial slippage. Tan Peng et al. [15] conducted true triaxial hydraulic fracturing physical simulation tests to investigate parameters such as in-situ stress contrast, elastic modulus contrast, and coal cleat systems on fracture propagation across coal-sandstone interfaces. Tian et al. [16] employed ABAQUS software to establish a two-dimensional fluid-solid coupling finite element model incorporating natural cleat networks and globally embedded cohesive zone models (CZM). This model simulated the effects of cleat orientation, cleat density, coal-mudstone length ratio, and injection rate on hydraulic fracture propagation behavior. Ren et al. [17] and Xu et al. [18] utilized numerical simulation methods to study the influence of fracturing fluid injection rate and viscosity on vertical fracture propagation. Their results demonstrated that higher injection rates and viscosities significantly promote vertical fracture extension. Huang et al. [19] combined true triaxial hydraulic fracturing experiments with numerical simulations to investigate the impact of coal bedding planes on hydraulic fracture propagation. Their findings indicated that the dip angle of coal bedding planes exerts a more significant influence on fracture propagation than the maximum principal stress, while optimized injection rates facilitate the formation of complex hydraulic fracture networks. Current research on hydraulic fracture penetration in coal formations primarily focuses on single coal seams and shallow to medium-depth sand-coal composite interfaces. These studies exhibit limitations in characterizing the complex interfacial mechanical behavior and stress response characteristics of deep multilayered formations. Furthermore, there is scarce reported research on the influence of bedding planes at deep coal-gangue interfaces on the laws governing hydraulic fracture penetration.
Based on previous research, this study employs mechanical parameters derived from deep coal seams in the Benxi Formation along the southeastern margin of the Ordos Basin. A two-dimensional numerical model for the vertical propagation of hydraulic fractures at deep coal-interlayer interfaces was constructed using the Continuum-Discontinuum Element Method (CDEM). Following model validation, the influence of geological parameters (in-situ stress, interlayer stress, cohesion, and Young’s modulus) and engineering parameters (fracturing fluid injection rate) on cross-layer fracture propagation was systematically investigated. Through this study, the influence of deep coal gangue layer and weak bedding structure on the longitudinal propagation of cracks is systematically revealed, which can provide a theoretical basis for the optimal control of fracture height in the field fracturing process, so as to promote the effective formation of complex fracture network in coal and rock strata.
2 Numerical Methods and Constitutive Models
2.1 Continuum-Discontinuum Element Method
In CDEM numerical simulations, the computational framework is composed of two primary components: blocks and interfaces (Fig. 1). Blocks, which may consist of one or multiple finite elements, are used to represent the continuous behavior of materials. An interface is defined as the common boundary between two adjacent blocks and captures discontinuous material behavior. Interfaces in CDEM include both real and virtual types. Real interfaces occur at physical contacts between blocks, while virtual interfaces arise from the discretization boundaries between finite elements within a single block. Although virtual interfaces share the same constitutive models as real interfaces, they differ in their parameter assignments. Finite elements within blocks are interconnected by springs located at shared nodes. When a spring element meets predefined fracture criteria, its rupture dynamically propagates alterations in contact forces and displacements. This method allows for accurate simulation of crack propagation in materials.
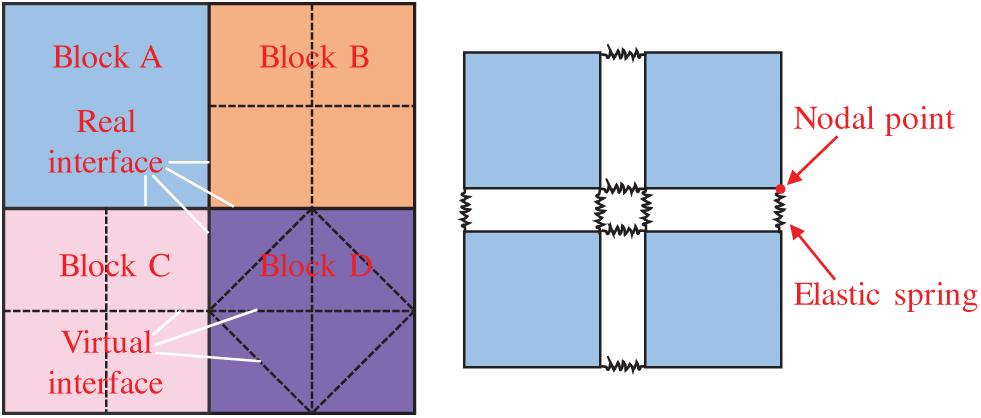
Figure 1: Schematic diagram of CDEM numerical model
The core governing particle motion equation in CDEM is [20]:
where
The governing equation for nodal motion calculation is:
where
2.2 Hydro-Mechanical Coupled Fracture Propagation Computational Model
CDEM is a numerical methodology grounded in the Generalized Lagrangian Formulation. It facilitates accurate simulation of dynamic stress evolution in continuous media and captures discontinuous mechanical behaviors during fracture propagation through a coupled finite-discrete element framework. By incorporating a fluid flow model into the solid mechanical formulation, an elastic-damage-fracture constitutive model for hydraulic fracture propagation is established within the CDEM framework [21]. The porous flow computation employs the same nodal discretization as the solid domain. Fracture elements are incorporated at interfaces where discontinuities exist. The stress field in the continuum region is resolved through solid finite element analysis, while fracture networks are represented by establishing fluid conduits along fracture elements located at the contact surfaces between solid elements. This coupled formulation enables complete modeling of fluid flow within both existing joints and actively propagating fractures.
2.2.1 Elastic-Damage-Fracture Constitutive Model
This research employs an elastic-damage-fracture constitutive model to simulate the mechanical behavior of rock masses. Within this framework, a linear elastic constitutive relationship is applied to each finite element. The input parameters for the linear elastic model include the elastic modulus, Poisson’s ratio, tensile strength, and internal friction angle. At the virtual interfaces, a damage-fracture constitutive model is utilized. The input parameters for this interfacial model comprise the contact normal stiffness, contact tangential stiffness, internal friction angle, tensile strength, tensile fracture energy, and shear fracture energy.
The incremental formulation of the linear elastic constitutive relationship for elements is expressed as [22]:
where
At virtual interfaces, a maximum tensile stress criterion with linear strength-softening and a Mohr–Coulomb model are employed to represent the damage and fracture behavior. The corresponding normal and tangential contact forces at these interfaces are then resolved for the next time step using an incremental formulation [23].
where
The occurrence of tensile failure is assessed based on whether the following condition is satisfied:
Then tensile failure is identified, requiring recalibration of the normal contact force and tensile resistance:
where
The determination of shear failure occurrence is conducted using Eq. (9), if:
Upon occurrence of shear failure in the spring, the tangential contact force and cohesive force require revision to the following:
where
Based on Eqs. (6)–(10), the constitutive curves for normal and tangential directions at virtual interfaces can be plotted, as illustrated in Fig. 2.
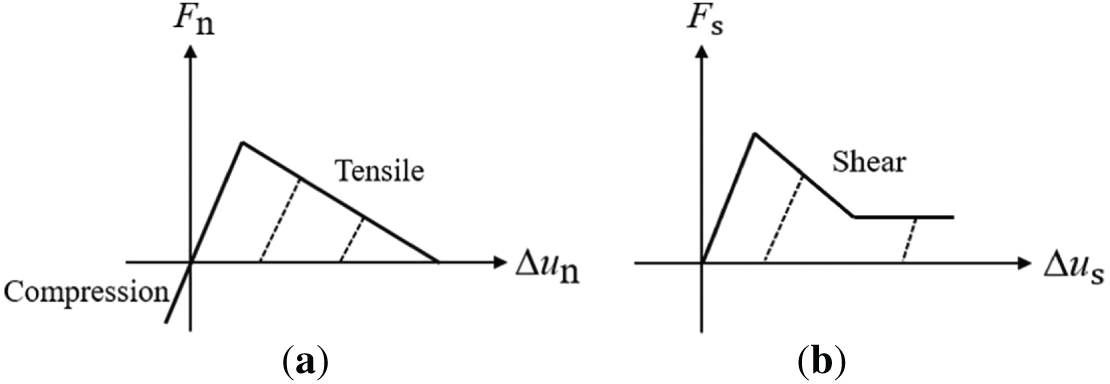
Figure 2: Constitutive curves at virtual interfaces. (a) Normal constitutive curves; (b) Tangential constitutive curves
2.2.2 The Principle of Seepage-Stress Coupling in Fracture Networks
During hydraulic fracturing, fracture seepage is modeled using finite element-based seepage networks coupled with solid mechanical formulations. The interaction between the stress field and the seepage field is facilitated by the coupling of virtual interfaces with the fracture flow pathways [24]. Specifically, fracture seepage applies fluid pressure onto the virtual interfaces, while the deformation of the surrounding rock—induced through these interfaces—regulates fracture apertures, thereby governing the subsequent seepage behavior.
Fluid flow through fractures adheres to Darcy’s law:
where
Cubic Law states that the fluid flow rate per unit width through a fracture is proportional to the cube of the fracture aperture [25]. The proportionality constant depends on the fluid viscosity and the pressure gradient acting across the fracture:
where
The total flow rate of fluid passing through the fracture can be calculated based on the product of the seepage flow rate per unit width and the fracture spacing:
where
According to Cubic Law, for single-phase Newtonian fluid undergoing laminar flow within a fracture, the volumetric flow rate per unit time is expressed as follows:
where
Based on Eqs. (13) and (14), the permeability can be expressed as:
The seepage velocity within the fracture can be represented by:
where k denotes the fracture permeability coefficient, m2/(Pa·s).
When saturation equals 1, the fracture permeability coefficient can be calculated using Eqs. (11) and (16), expressed as:
As illustrated in Fig. 3, when solving fracture flow fields using the Finite Volume Method (FVM), fluid pressure and saturation are stored at the grid nodes of computational cells, while fluid velocity is defined at cell centroids [26].
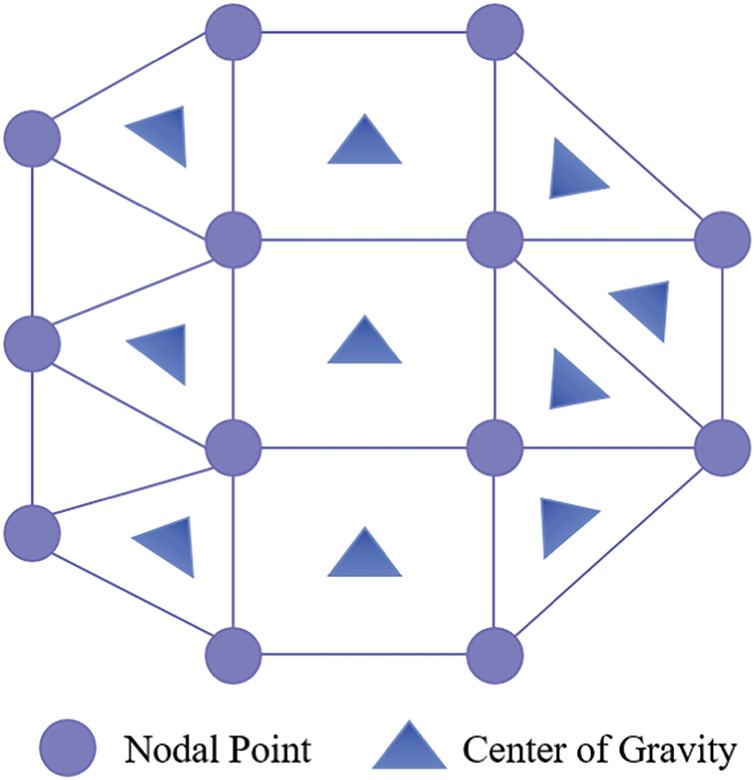
Figure 3: Schematic diagram of planar fracture element
According to the divergence theorem, the mathematical expression for nodal seepage velocity is formulated as:
where
The nodal flow rate is derived from the above as:
where
Based on seepage theory and mass conservation at nodes, the total seepage flow rate at a node is expressed as:
The nodal saturation is computed from the nodal flow rate in Eq. (20):
When the fluid saturation at a computational node reaches unity (indicating fully saturated conditions), the seepage pressure at that node can be determined by solving the nodal flow Eq. (20) and saturation Eq. (21) simultaneously.
The total nodal pressure is then defined as:
where
In the coupled analysis of the fracture seepage field and the solid stress field, fluid pressure within the fracture is applied as boundary conditions along the interface between adjacent solid elements. Conversely, the aperture along this shared boundary is computed to determine both the fracture opening and the permeability coefficient, which subsequently updates the properties of the corresponding fracture seepage elements. As illustrated in Fig. 4, edge r and edge d of solid element α are adjacent to edge m and edge h of solid element β, with fracture elements q and f sandwiched in between.
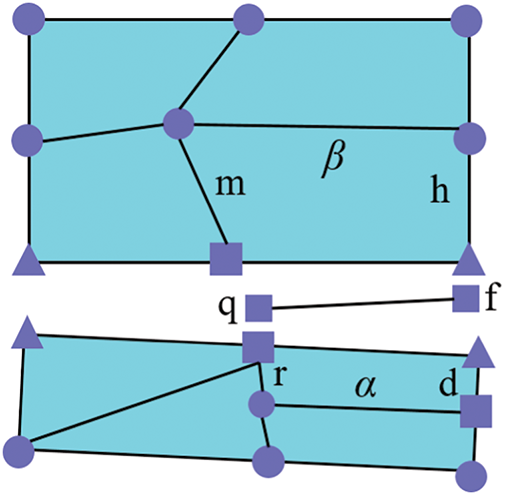
Figure 4: Schematic diagram of coupling between solid elements and fracture elements
The nodal pressures exerted by fracture elements on the four nodes (m, h, r, d) of the solid element can be expressed as:
where
When solid boundary displacement changes, the aperture of the fracture element will be significantly affected. This relationship can be quantitatively described as:
where
2.2.3 Crack Propagation Criterion
In CDEM, adjacent blocks are linked by spring elements that transfer contact forces. The mechanical interactions at each contact are resolved into normal and tangential components. According to Hooke’s Law [27], the relative displacement between nodes at both ends of a contact spring is linearly related to the contact stress. Therefore, the incremental method is used to express the normal and tangential relative displacements at the next time step:
where
Hydraulic fracture initiation is characterized by the transition from continuous element boundaries to discontinuous fracture surfaces. The failure is governed by either the maximum tensile stress criterion or the Mohr–Coulomb criterion. The rupture criterion requires evaluation of three stress components: the stresses on both sides of the element, the normal stress acting on the element boundary, and the tangential stress along it. If any stress component reaches the critical failure threshold defined by Eqs. (27) or (28), the material element is judged to undergo fracture failure, and a corresponding hydraulic fracture is simulated:
where
If the spring satisfies the maximum tensile stress criterion in Eq. (27), the spring undergoes tensile fracture, and the spring force must be corrected as:
If the spring satisfies the Mohr-Coulomb shear failure criterion in Eq. (28), the spring undergoes shear failure, and the spring force must be modified as:
After spring element fracture occurs, the fracture aperture can be calculated from the displacement difference between the two nodes connected by the spring:
where
2.3 Computational Model for Hydraulic Fracture Propagation in Deep Coal Rock
2.3.1 Two-Dimensional Numerical Simulation Model for Fracture Height Propagation Considering Bedding Planes
Based on the GDEM software platform, this study utilizes its integrated CDEM method to construct a numerical model for hydraulic fracturing in deep coal rock, simulating the cross-layer propagation process of hydraulic fractures at the coal rock-parting interface. Tecplot 360 is employed as the post-processing software.
To investigate the influence of bedding planes and formation parameters on the fracture height propagation mechanism, a two-dimensional hydraulic fracturing simulation model considering bedding planes is established, as shown in Fig. 5 The model has a width of 60 m in the X-direction and a height of 80 m in the Y-direction, comprising three blocks and two contact surfaces. Tetrahedral elements are used for meshing. Considering both computational accuracy and simulation efficiency, the mesh size in both X and Y directions is set to 2 m, totaling 1200 block elements. In the Y direction, the top and bottom of the model are coal gangue layers with a thickness of 30 m each, and the middle is coal rock layer with a thickness of 20 m. The contact surface between the top coal gangue layer and the coal rock layer is set as the upper layer. The contact surface between the bottom coal gangue layer and the coal rock layer is set as the lower layer, and the spacing between the upper and lower layers is 20 m. During simulation calculations: For the stress field, the minimum horizontal stress
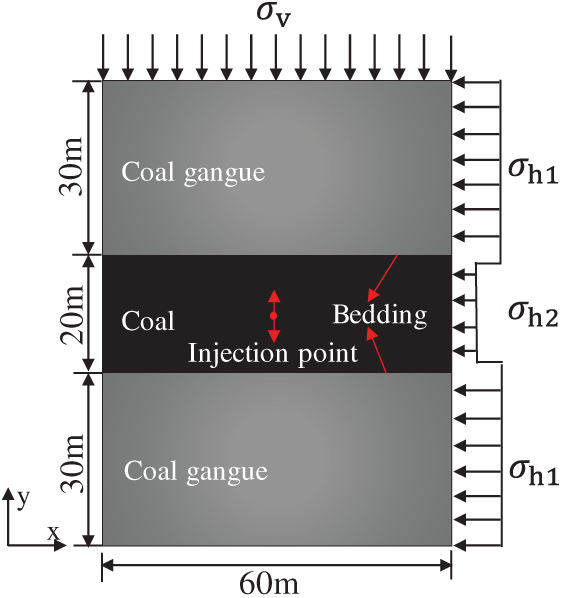
Figure 5: Schematic diagram of a 2D hydraulic fracturing model for deep coal-rock reservoirs
2.3.2 Model Parameter Selection
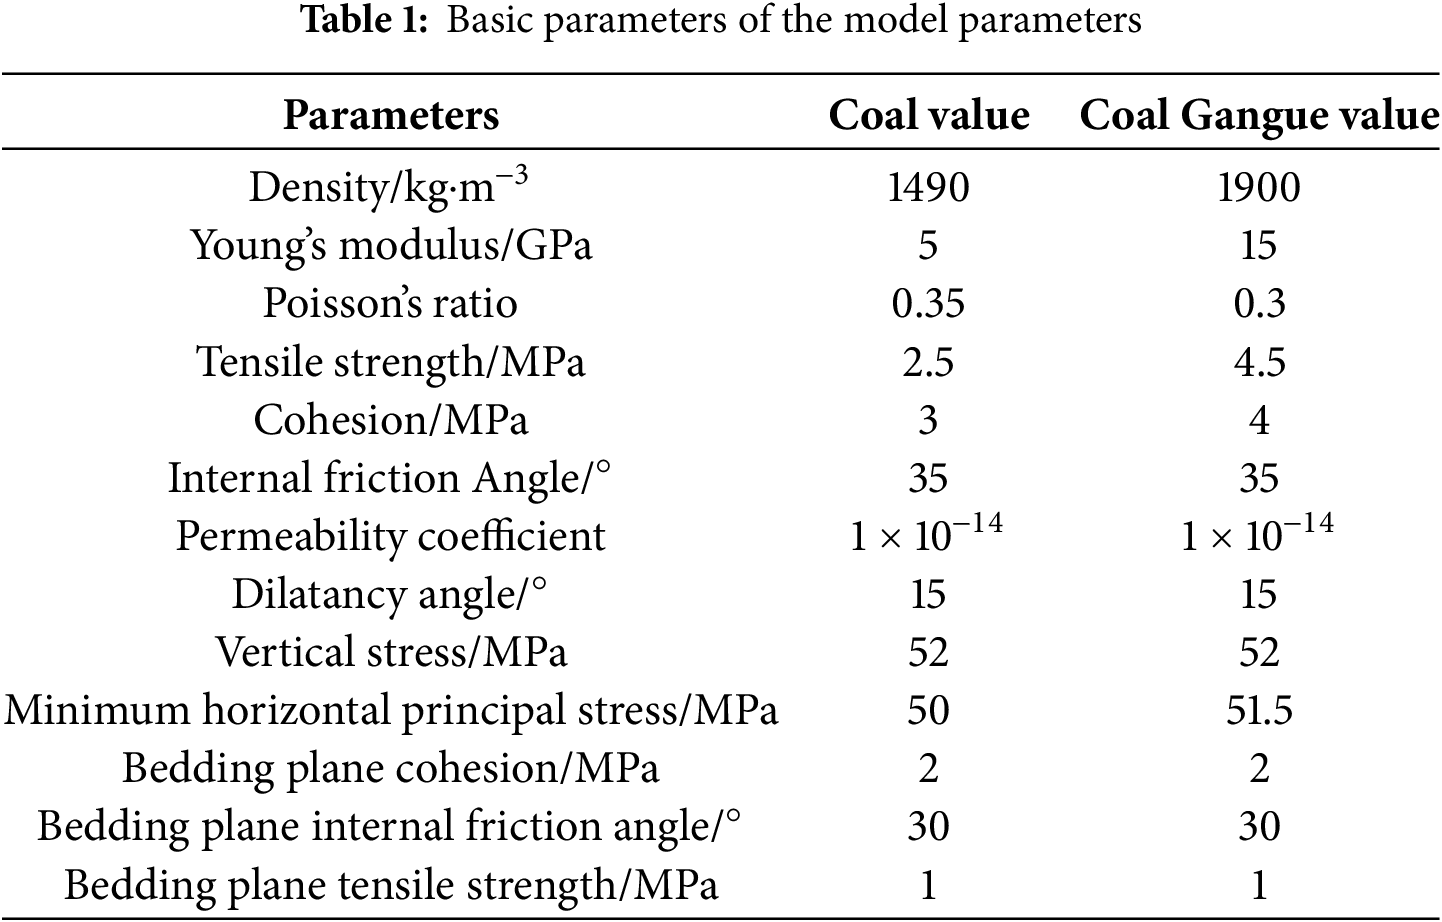
Geomechanical parameters for the computational model were determined based on actual geological data from the No. 8 coal seam within the Taiyuan Formation along the southeastern margin of the Ordos Basin, with specific values provided in Table 1. Fracturing fluid parameters included an injection rate of 0.003 m2/s, a viscosity of 2.5 mPa·s, and a density of 1000 kg/m3.
2.3.3 Model Correctness Verification
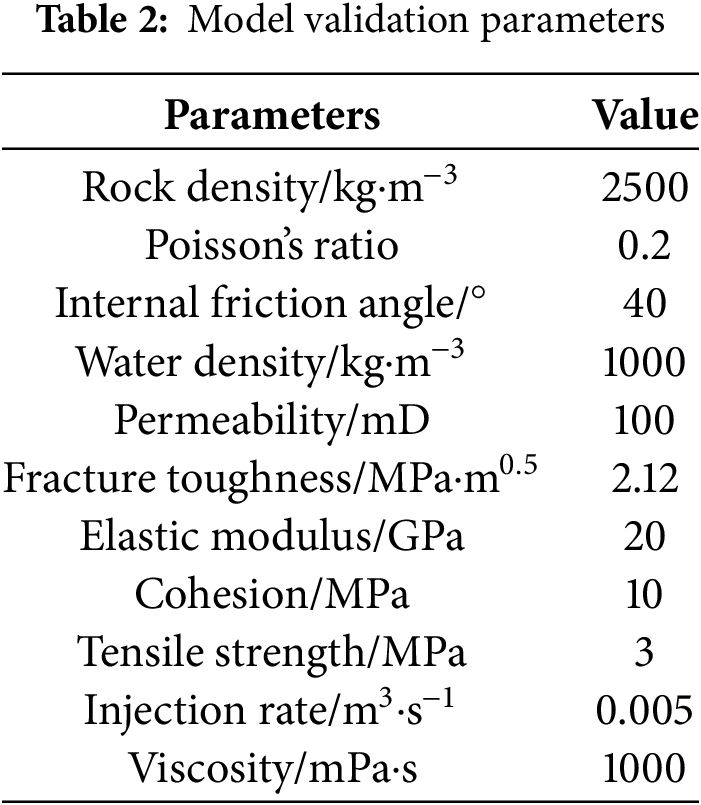
Building upon the theoretical framework of the Penny-shaped model, this study validates the accuracy of the fracture propagation model and grid convergence by comparing numerical solutions with classical analytical solutions. The benchmark model used for verification, depicted in Fig. 6, has dimensions of 30 m × 30 m × 20 m, with a constant-rate injection point located at its geometric center. Detailed parameters are summarized in Table 2.
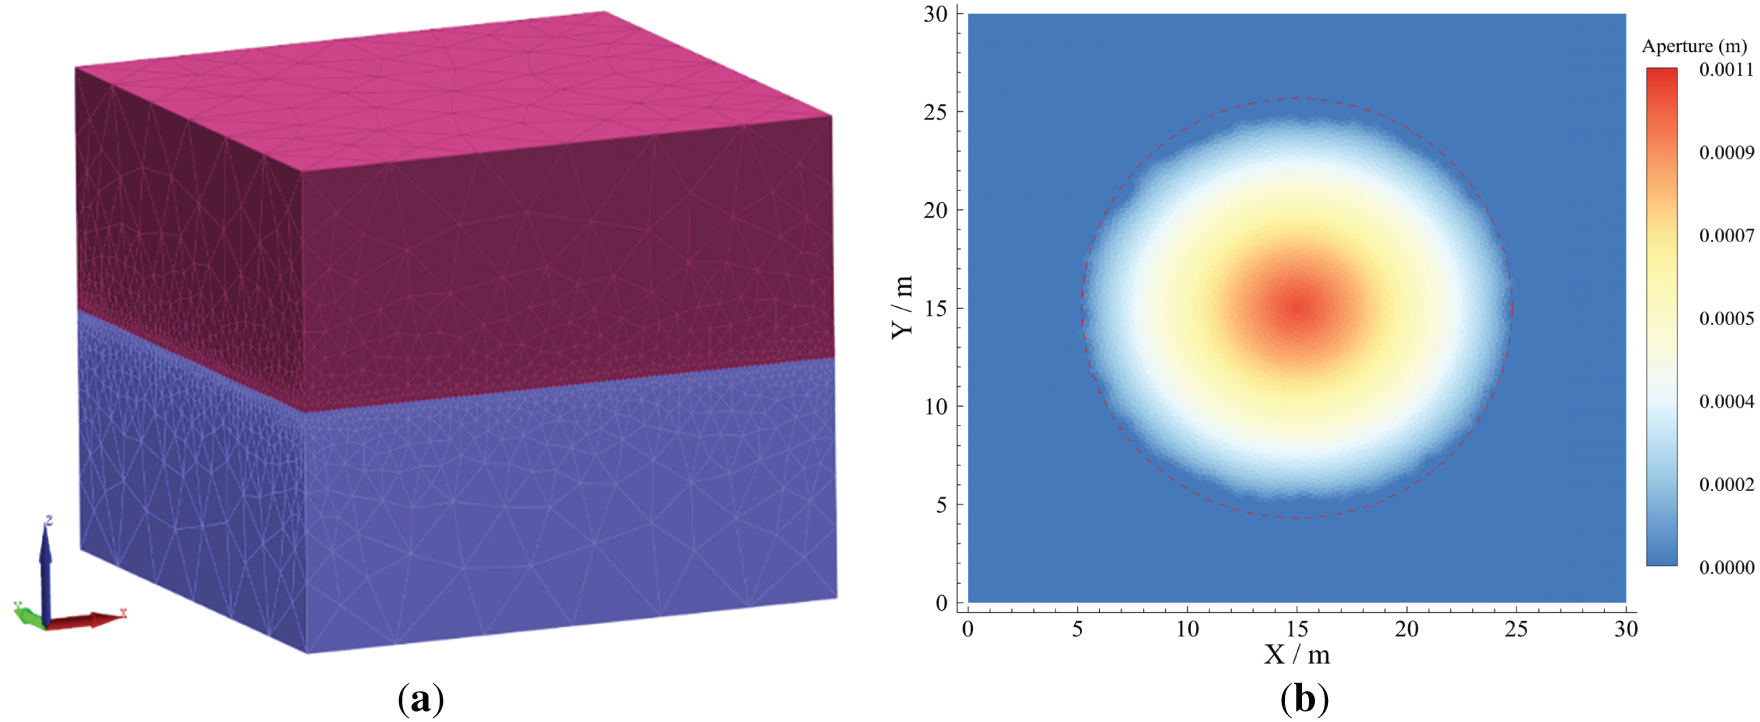
Figure 6: Schematic diagram of the validation of the numerical model of CDEM hydraulic fracturing fracture extension: (a) Schematic diagram of fracture propagation numerical model validation; (b) Numerical simulation results diagram of Penny-shaped fracture
In the Penny-shaped model, the dimensionless toughness parameter
where
With an injection rate of 0.005 m3/s, a fluid viscosity of 0.001 Pa·s, and an injection time of 22 s, the value of
A comparison between numerical and analytical solutions is presented in Fig. 7. Specifically, Fig. 7a depicts the evolution of fracture length over time, and Fig. 7b shows the variation of fracture aperture along the radial direction. Throughout the fracture propagation simulation, the average relative error between the numerical and analytical solutions remains within 10% for both fracture length and aperture, indicating strong agreement. These results confirm the accuracy of the fracture propagation model developed in this study.
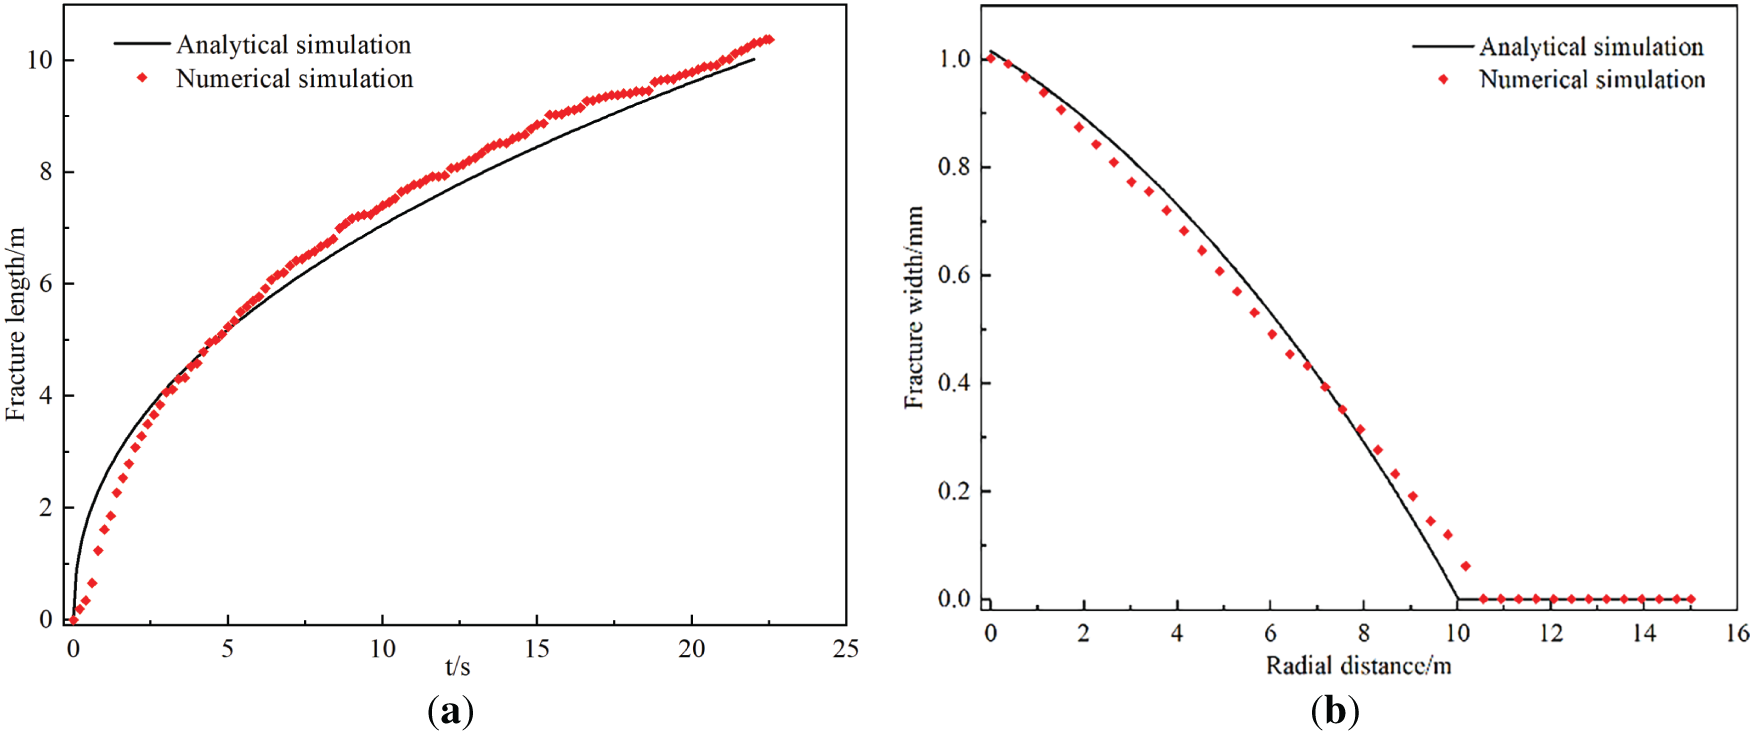
Figure 7: Results comparison diagram of fracture propagation numerical simulation and analytical solutions. (a) Fracture length vs. time evolution curve; (b) Fracture width vs. radial distance curve
3 Numerical Simulation Results Analysis
3.1 Influence of Vertical Stress Difference
Under constant other parameters with fixed minimum horizontal principal stress, altering only the vertical principal stress examines vertical stress difference’s influence on hydraulic fracture vertical propagation in deep coal-rock. Fig. 8 shows simulations for vertical principal stresses of 52, 53, 55, and 57 MPa (corresponding vertical stress differences: 2, 3, 5, 7 MPa). Increasing vertical stress difference drives three fracture propagation stages: fractures captured then diverted along bedding planes, fractures confined within coal-rock reservoirs by bedding plane constraints, and fractures penetrating interlayer interfaces into partings.
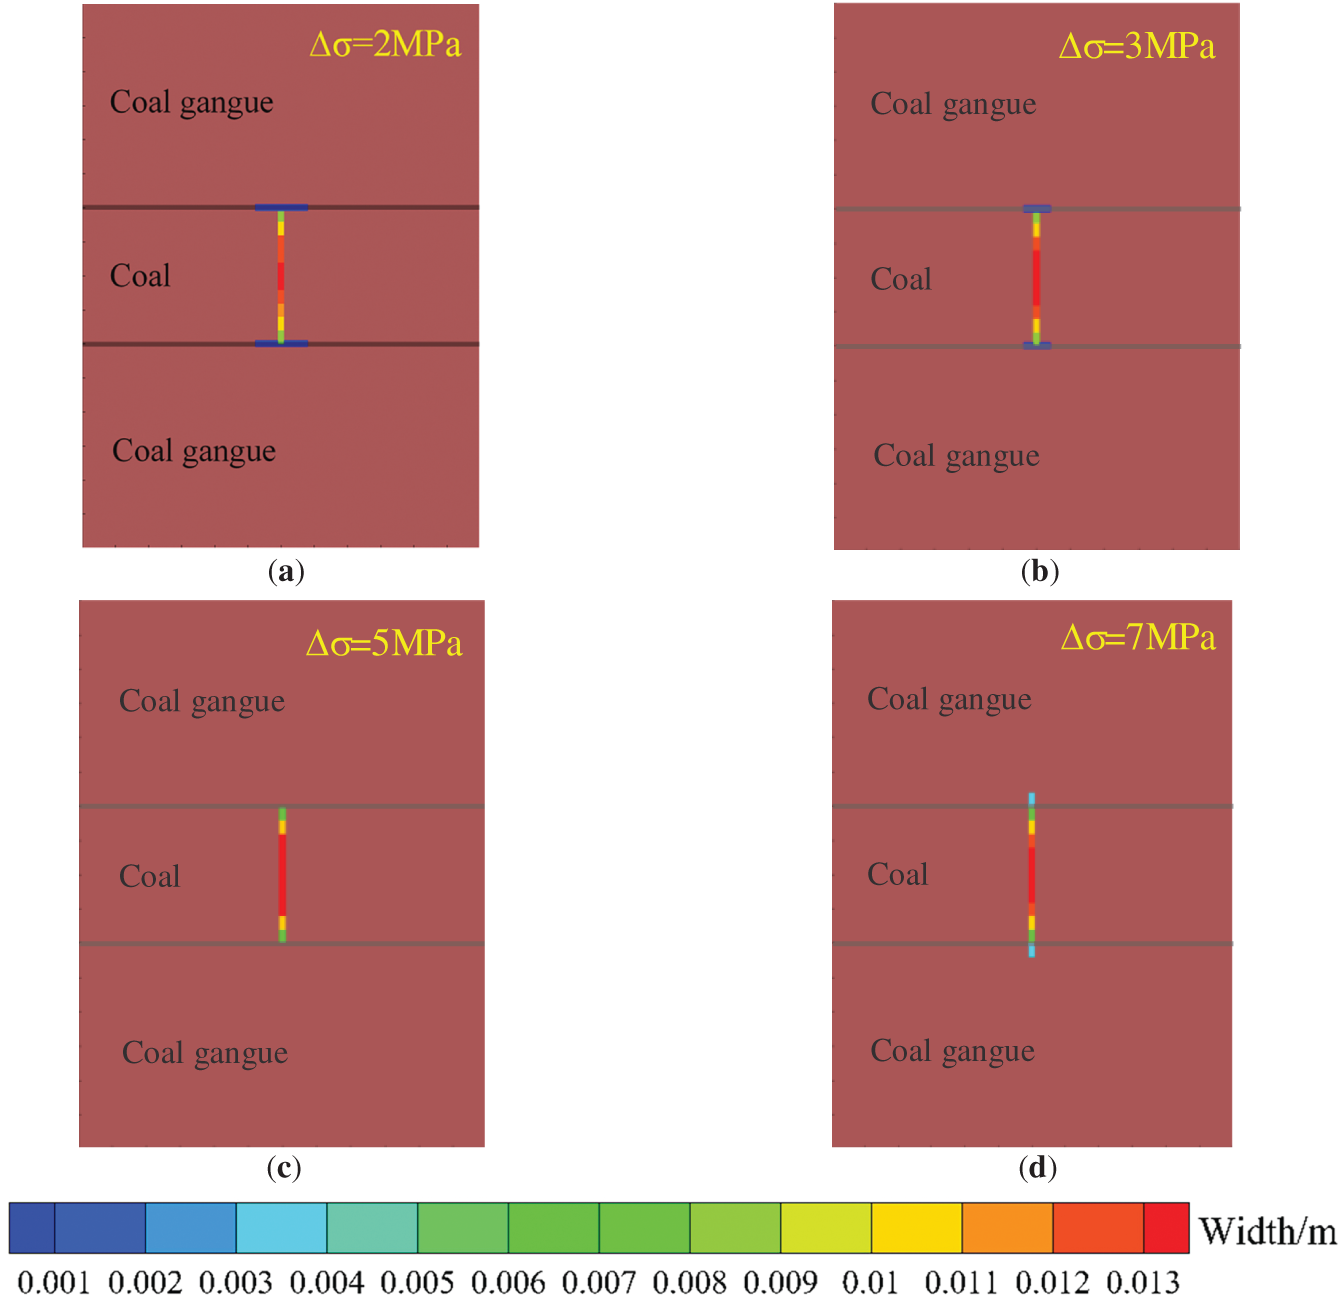
Figure 8: Hydraulic fracture propagation morphology diagrams under different vertical stress differences. (a) 2 MPa; (b) 3 MPa; (c) 5 MPa; (d) 7 MPa
As illustrated in Fig. 9a, the fracture width at the central injection point initially increases and subsequently decreases with increasing vertical stress difference. This non-monotonic trend primarily stems from the following mechanisms: when the vertical stress difference is 5 MPa, bedding planes remain unopened, leading to full energy allocation toward enhancing shear displacement. However, a more significant reduction in fracture width occurs after bedding planes are penetrated. When the vertical stress difference ranges from 2 to 5 MPa, hydraulic fractures are captured or terminated by interlayer interfaces without penetrating adjacent strata. Under these conditions, fracture aperture at the injection point exhibits an increasing trend with rising vertical stress difference, reaching a maximum value of 15.66 mm. When the vertical stress difference exceeds 5 MPa, hydraulic fractures penetrate interlayer interfaces and propagate vertically. Concurrently, fracture aperture at the injection point demonstrates a progressive reduction with increasing stress differential. As evidenced in Fig. 9b, an increase in vertical stress difference from 2 to 3 MPa reduces the bedding plane aperture at the central region by 0.57 mm and decreases the fractured zone extent by 43.8%. In cases where hydraulic fractures are terminated by or penetrate through interlayer interfaces, no shear or tensile failure occurs along bedding planes.
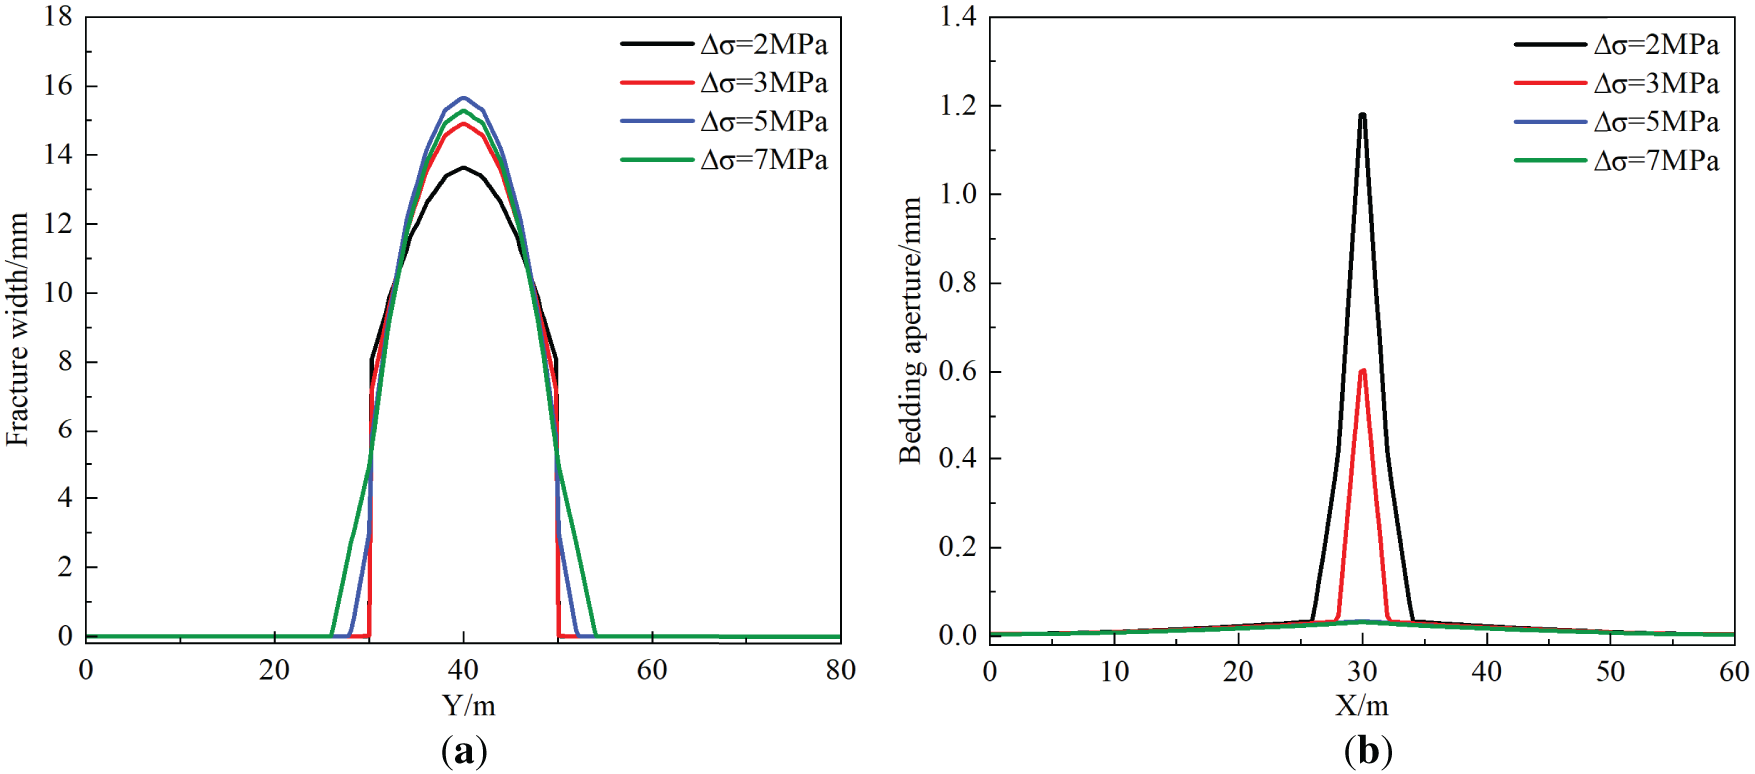
Figure 9: Numerical simulation result curves of hydraulic fracturing under different vertical stress. (a) Y-direction hydraulic fracture aperture variation curve; (b) bedding plane aperture variation curve in X-direction
3.2 Influence of Elastic Modulus
With other geological and operational parameters held constant and the elastic modulus of the parting layer fixed at 15 GPa, variations in the coal-rock layer’s elastic modulus (5, 10, 20, 25 GPa) investigate the influence of elastic modulus contrast on hydraulic fracture cross-layer propagation. Fig. 10 simulation results indicate: when the elastic modulus E1 of the coal-rock layer is 1/3, 2/3, 4/3, 5/3 of the parting layer modulus E2, hydraulic fractures initiating from the coal-rock layer fail to achieve cross-layer propagation, while fracture aperture at the injection point gradually decreases, and bedding activation range progressively expands, demonstrating that elastic modulus contrast inhibits fracture penetration while enhancing bedding activation effects.
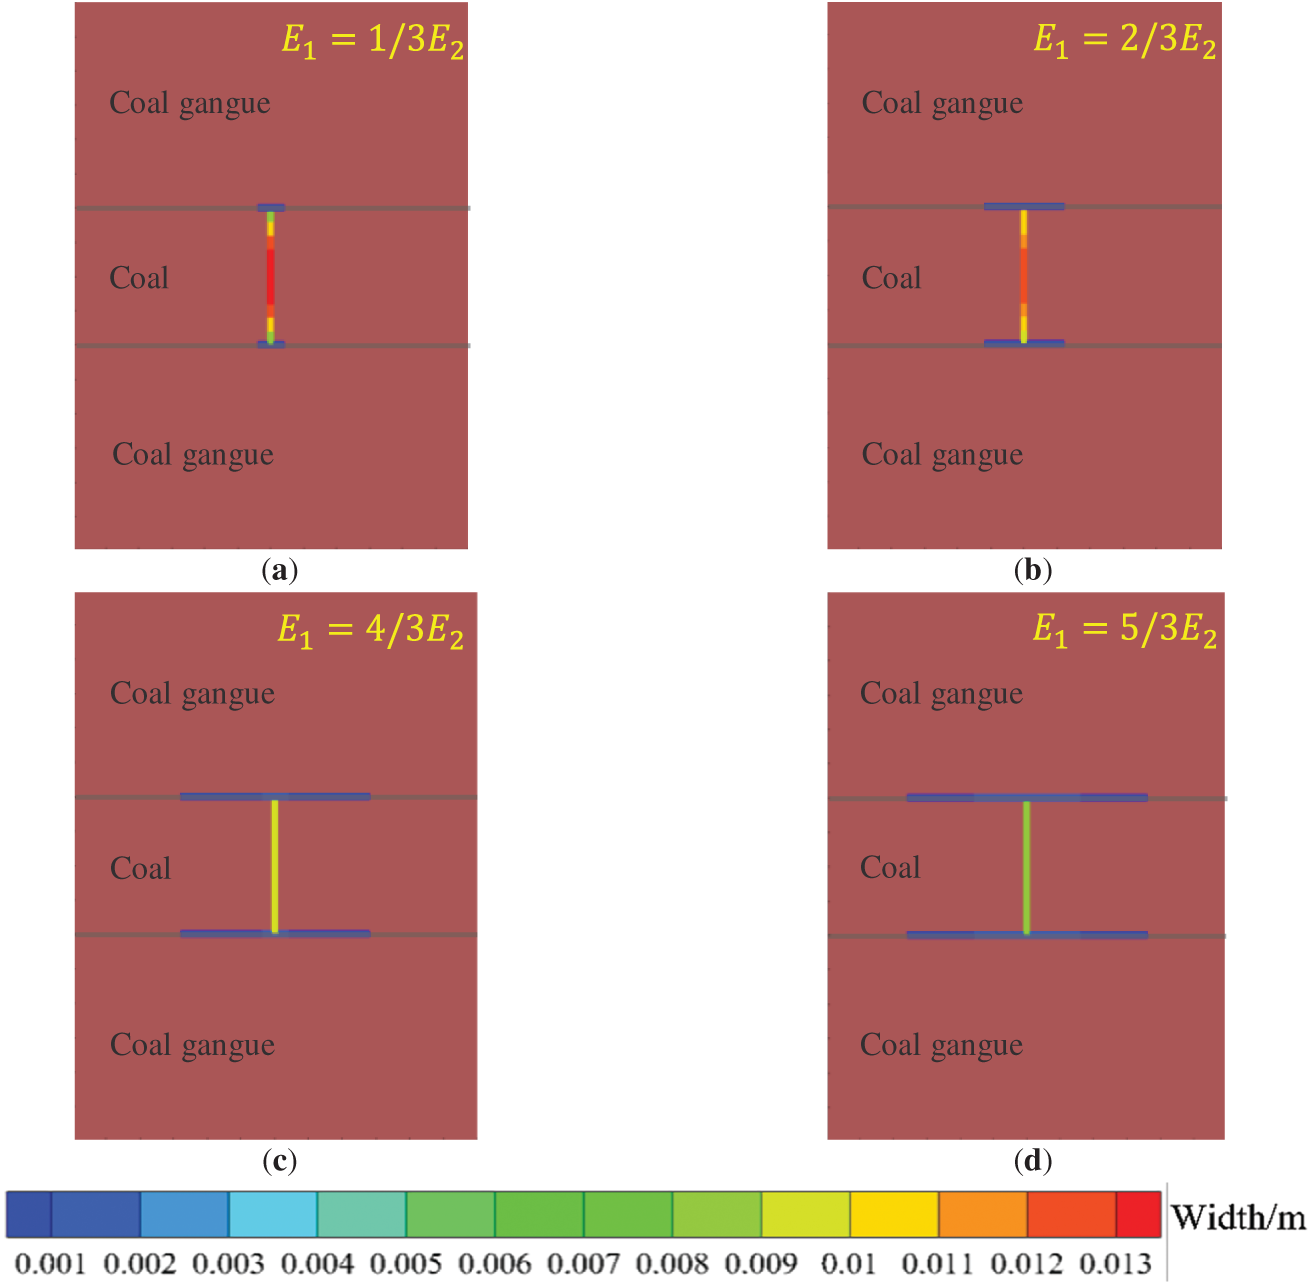
Figure 10: Hydraulic fracture propagation morphology diagram under different formation elastic moduli. (a) 5 MPa; (b) 10 MPa; (c) 20 MPa; (d) 25 MPa
Fig. 11 shows that as the coal-rock reservoir elastic modulus increases, hydraulic fractures propagate faster vertically, reaching bedding planes quicker, significantly increasing bedding aperture and activation range, whereas injection-point aperture declines. Increasing coal-rock elastic modulus from 5 to 25 GPa reduces fracture aperture by 42.6%, elevates bedding aperture by 0.86 mm, and expands bedding activation range by 31.9 m. Mechanistically, lower elastic modulus indicates higher rock plasticity, increasing fracture width within coal-rock, suppressing fracture-tip stress concentration effects, thereby decelerating propagation rates and reducing bedding activation degree.
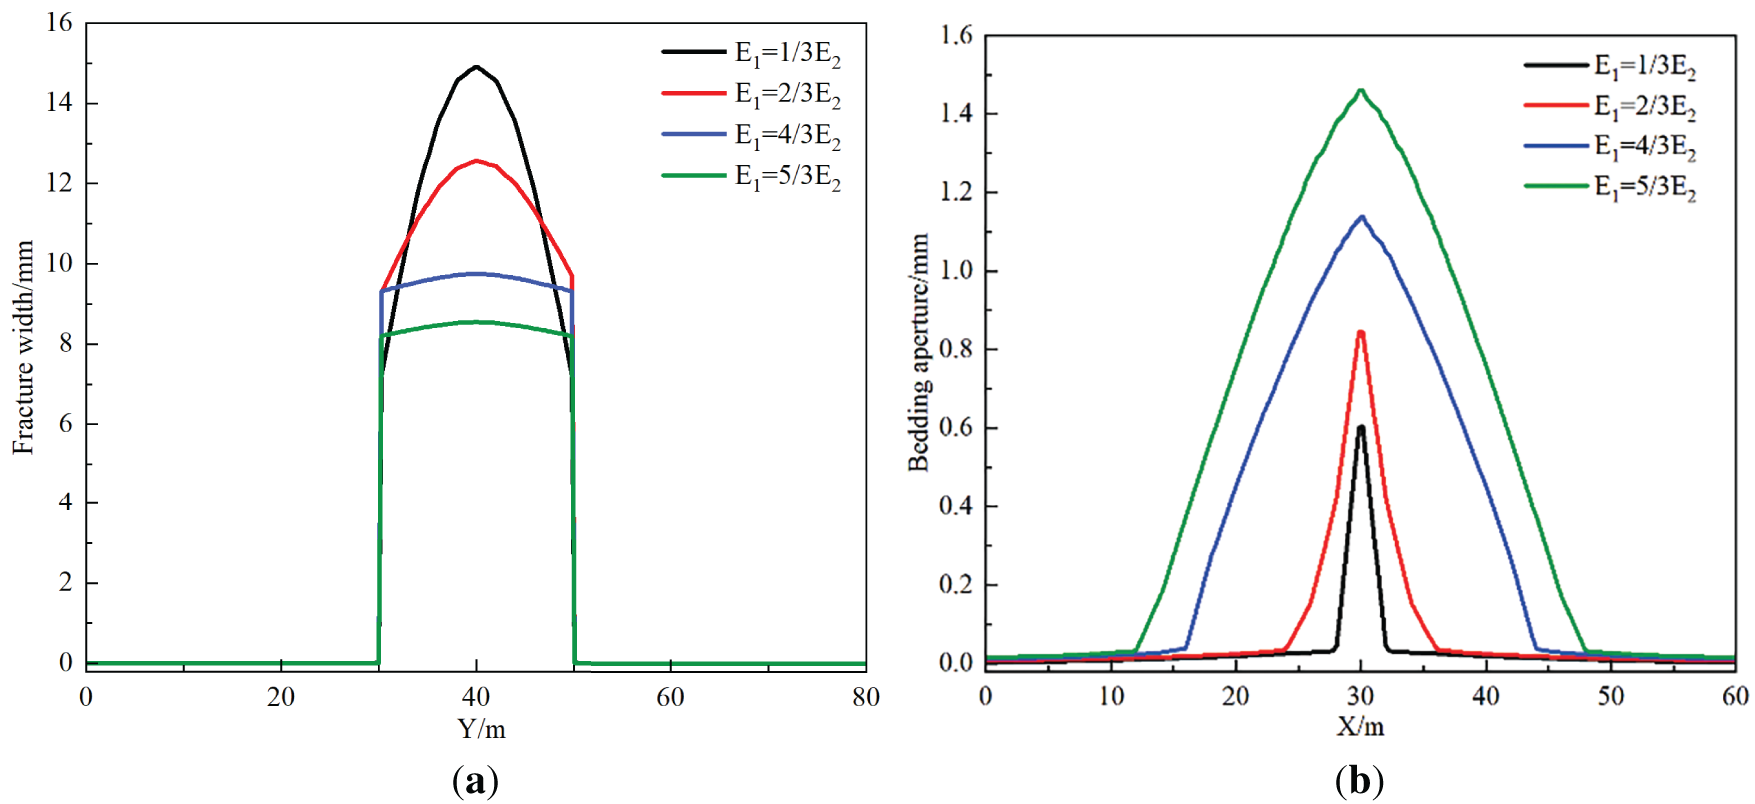
Figure 11: Hydraulic fracturing numerical simulation result curves under different elastic moduli. (a) Y-direction hydraulic fracture aperture variation curve; (b) bedding plane aperture variation curve in X-direction
3.3 Influence of Bedding Plane Cohesion
Bedding plane cohesion (c) is the key mechanical parameter controlling hydraulic fracture penetration through layers, therefore this section investigates the influence of bedding plane cohesion on fracture propagation in the height direction. Keeping other geological and operational parameters unchanged, bedding plane cohesion is varied to 2.5, 3.5, 4.5, and 5.5 MPa, with fracture morphology results shown in Fig. 12.
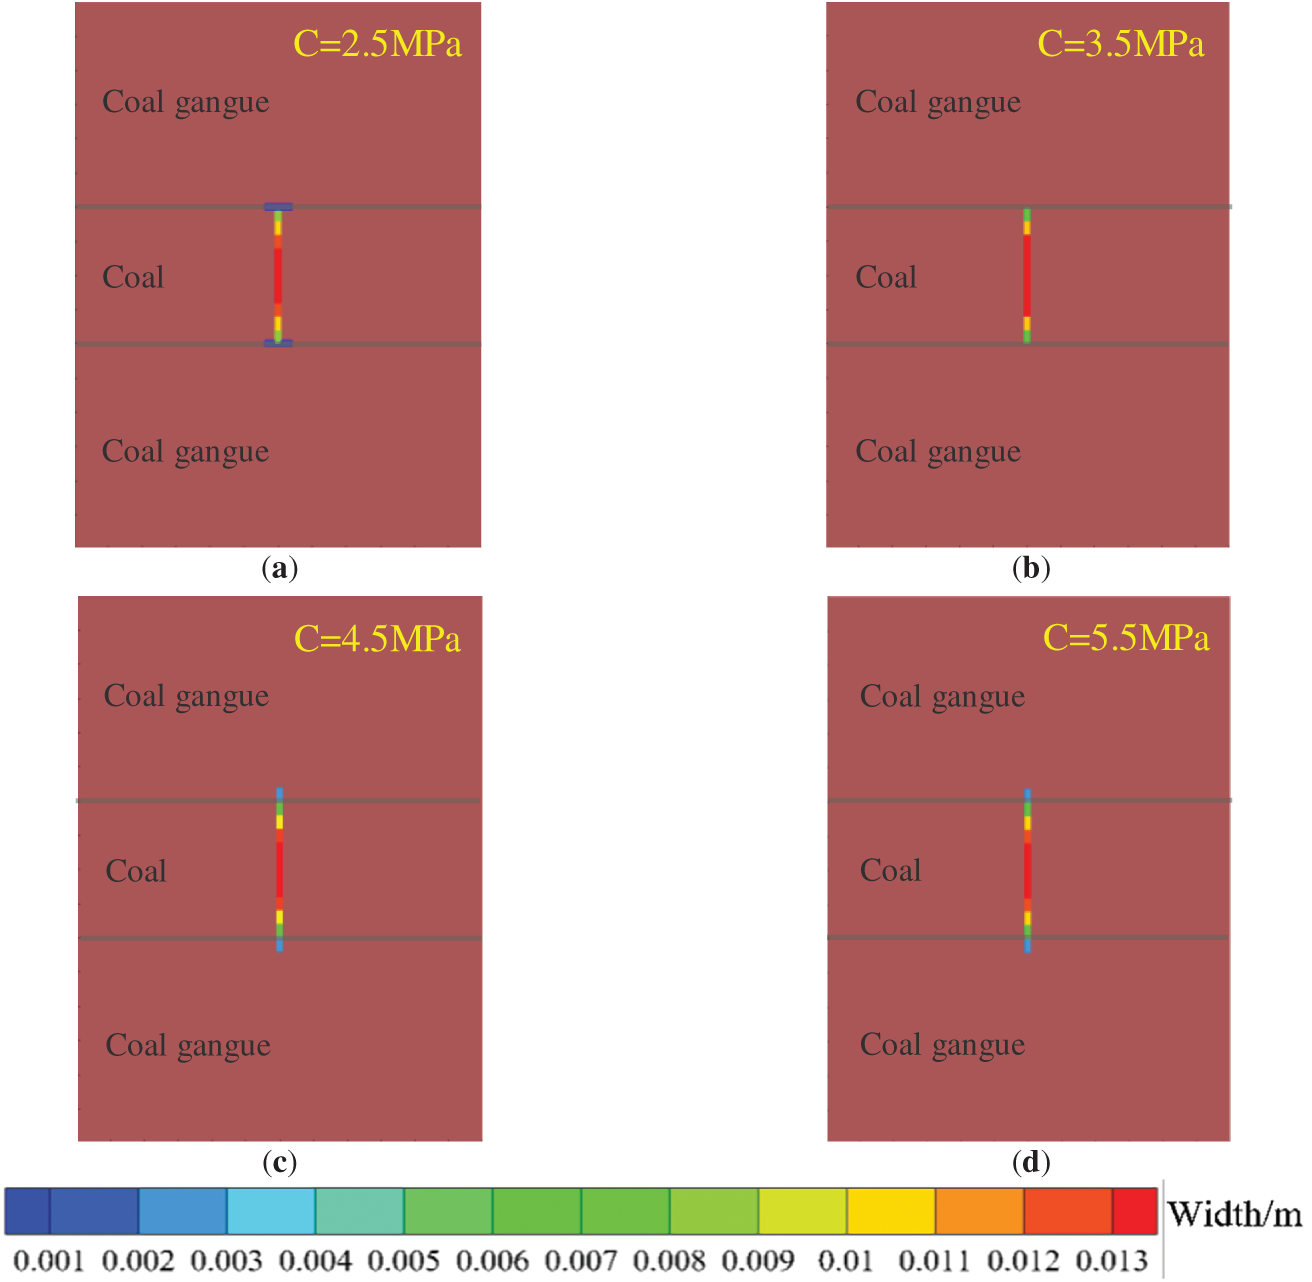
Figure 12: Hydraulic fracture propagation morphology diagram under different bedding plane cohesion. (a) 2.5 MPa; (b) 3.5 MPa; (c) 4.5 MPa; (d) 5.5 MPa
Fig. 12 displays hydraulic fracture propagation morphologies under different bedding plane cohesion values. When cohesion is below 3.5 MPa, hydraulic fractures are captured or terminated by bedding planes; when cohesion exceeds 4.5 MPa, fractures penetrate bedding planes and propagate into adjacent layers. As illustrated in Fig. 13, as bedding plane cohesion increases from 2.5 to 3.5 MPa, fracture width at the injection point increases by 0.95 mm; when cohesion further rises to 4.5 MPa, hydraulic fractures penetrate bedding planes, and fracture width at the injection point decreases by 0.52 mm. At 2.5 MPa cohesion, bedding aperture measures 0.61 mm with an activation range of 4.54 m. Research results indicate: when bedding plane cohesion is low, its interfacial strength is significantly lower than the energy required to overcome interlayer stress differences and rock tensile strength, causing fracture tips to preferentially propagate along paths of lower energy consumption, thereby inhibiting cross-layer propagation; when bedding plane cohesion is high, hydraulic fractures generate sufficient net pressure at their tips under high driving forces, enabling penetration through bedding planes. Bedding plane cohesion exerts significant control over hydraulic fracture penetration behavior but has minimal impact on dynamic width variations at the injection point.
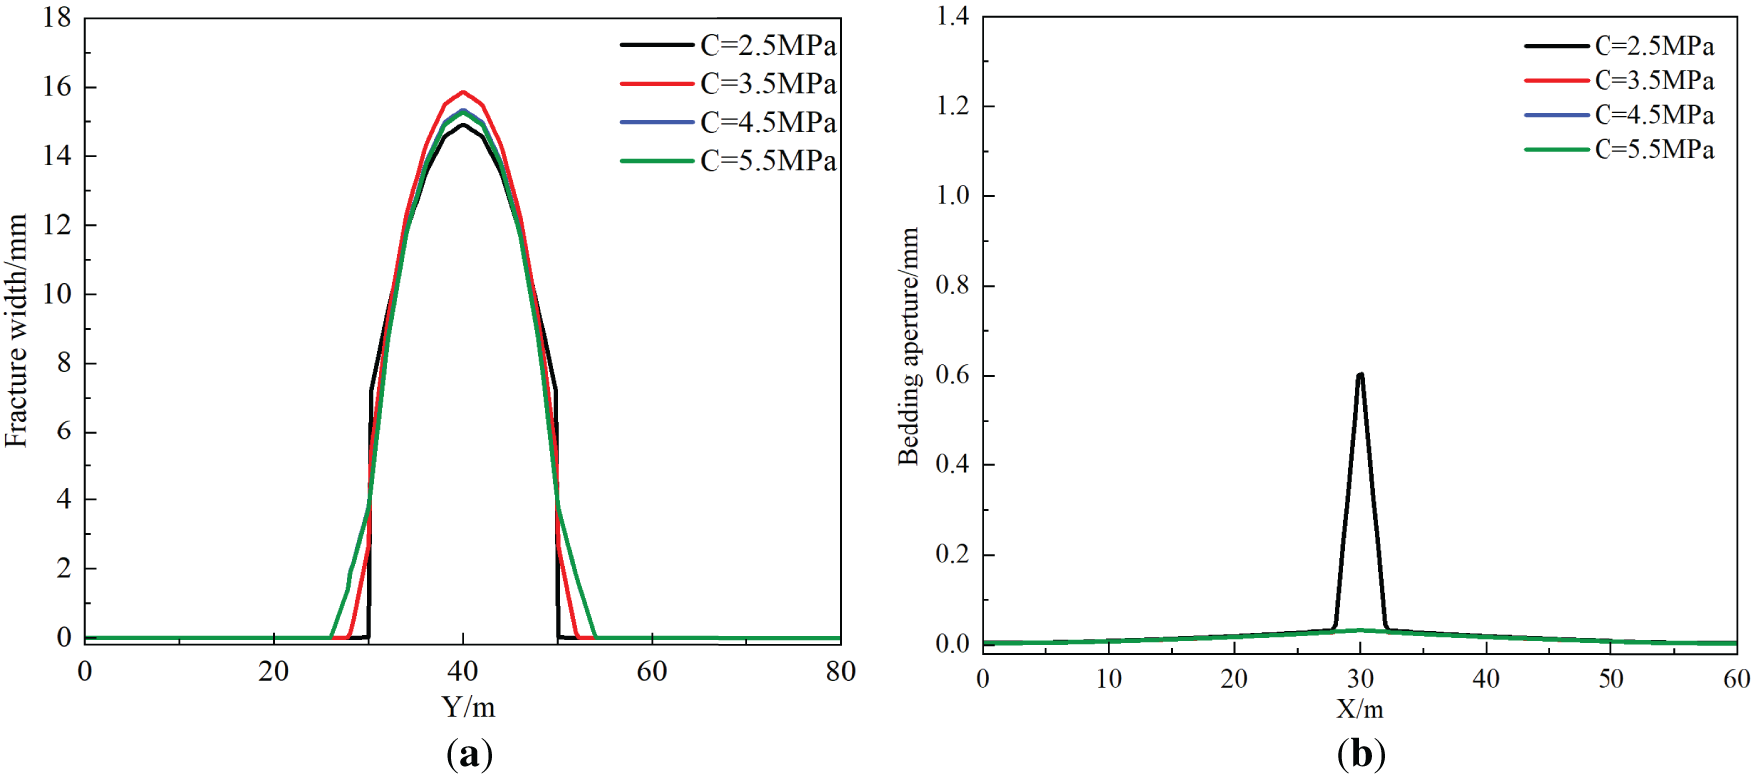
Figure 13: Hydraulic fracturing numerical simulation result curves under different bedding plane cohesion. (a) Y-direction hydraulic fracture aperture variation curve; (b) bedding plane aperture variation curve in X-direction
3.4 Influence of Interlayer Stress Difference
The interlayer stress difference (
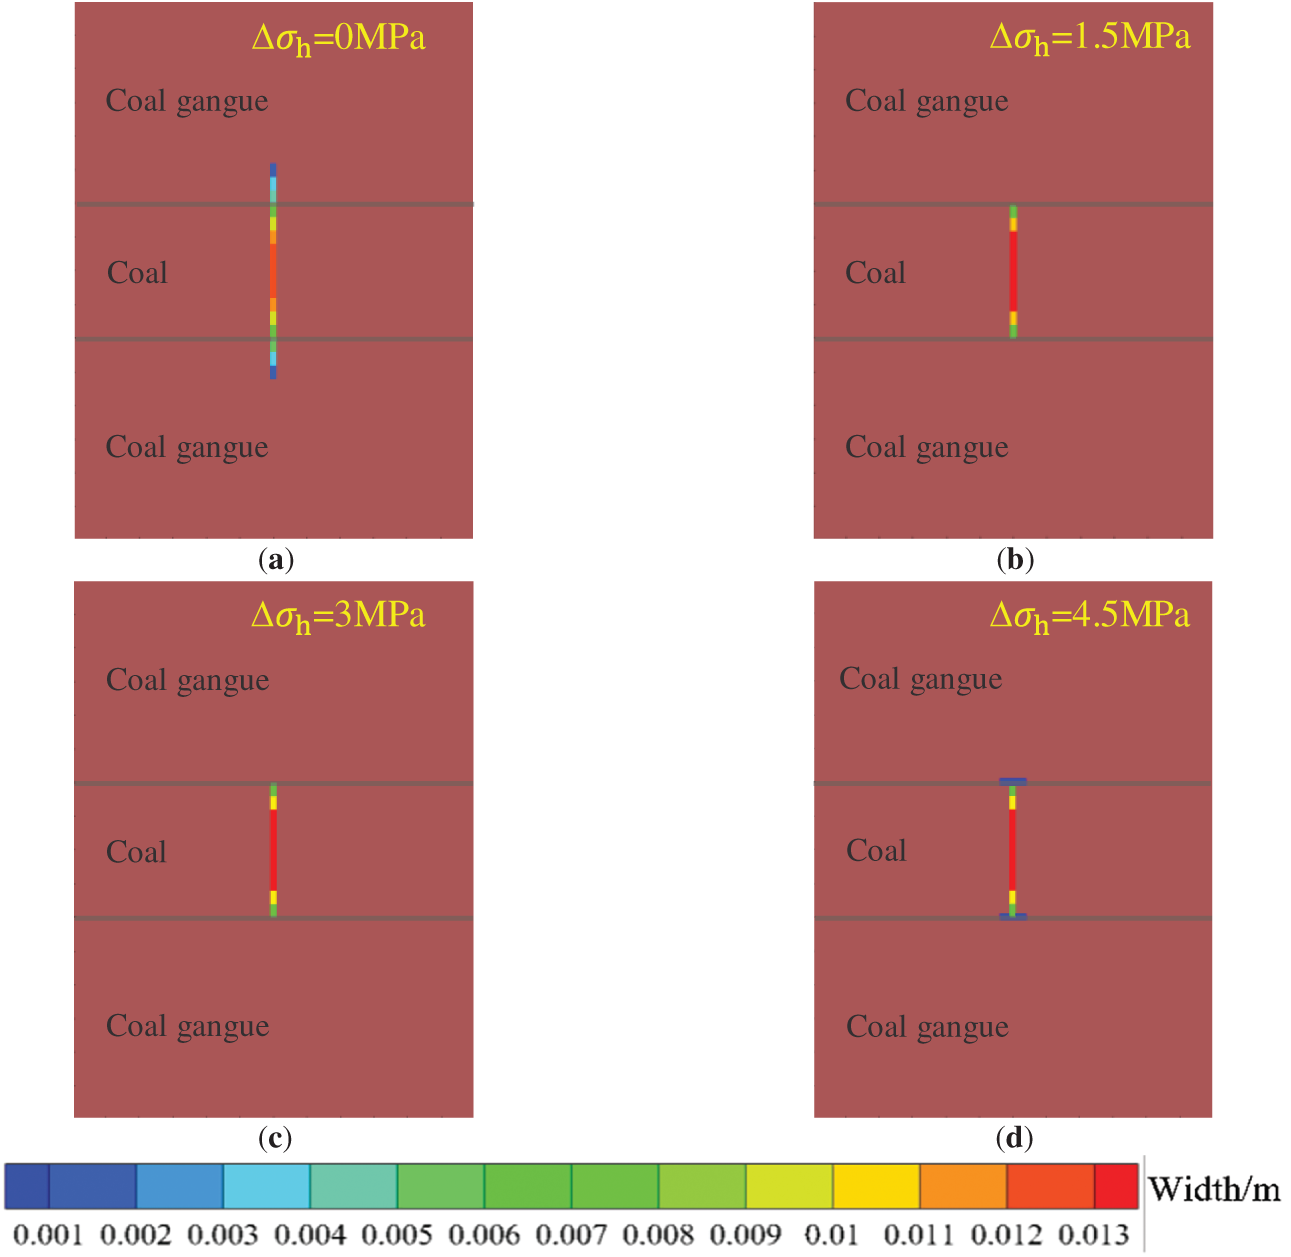
Figure 14: Fracture width distribution under different interlayer stress difference. (a) 0 MPa; (b) 1.5 MPa; (c) 3 MPa; (d) 4.5 MPa
Fig. 14 displays hydraulic fracture propagation morphologies under different interlayer stress differences. As the interlayer stress difference increases, hydraulic fracture behavior exhibits staged evolution: transitioning from initial penetration through layers to gradual suppression by bedding planes, and finally being fully captured by the bedding interface, deflecting to propagate along the bedding direction. As shown in Fig. 15, when the interfacial stress difference increases from 0 to 3 MPa, the fracture width at the injection point increases from 13.04 to 15.78 mm, representing an increase of approximately 21%. Additionally, at an interlayer stress difference of 4.5 MPa, the bedding plane opens, with a central aperture of 0.28 mm and an activation range of 5.21 m. When the interlayer stress difference exceeds 1.5 MPa, as the fracture tip approaches the high-stress barrier layer, the stress barrier formed by the high-stress zone increases the energy required for continued vertical propagation, causing the fracture tip to deflect and preferentially propagate along the bedding plane weak interfaces.
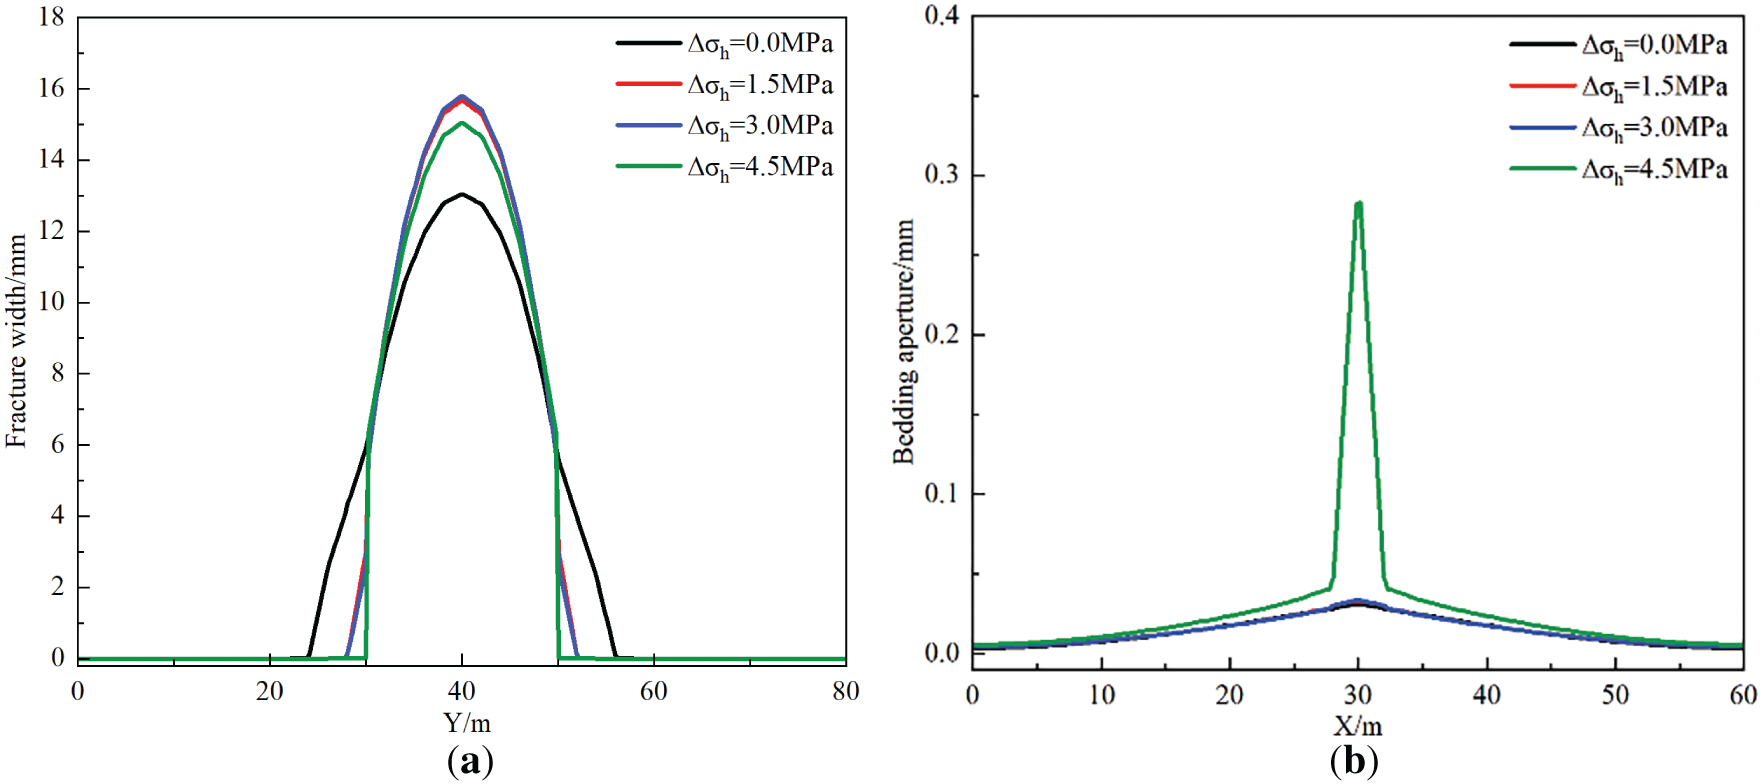
Figure 15: Hydraulic fracturing numerical simulation result curves under different interlayer stress difference. (a) Y-direction hydraulic fracture aperture variation curve; (b) bedding plane aperture variation curve in X-direction
3.5 Influence of Fracturing Fluid Flow Rate
During hydraulic fracturing operations, different fracturing fluid flow rates provide varying net pressures for fracture propagation, which critically determines whether hydraulic fractures can penetrate through bedding planes. Therefore, while keeping other geological parameters constant, numerical simulations were conducted for flow rates of 0.003, 0.006, 0.009, and 0.012 m2/s, with results illustrated in Fig. 16. The simulations demonstrate that as the flow rate increases, hydraulic fractures transition from being captured by bedding planes to penetrating through them, subsequently propagating perpendicular to the minimum horizontal principal stress direction.
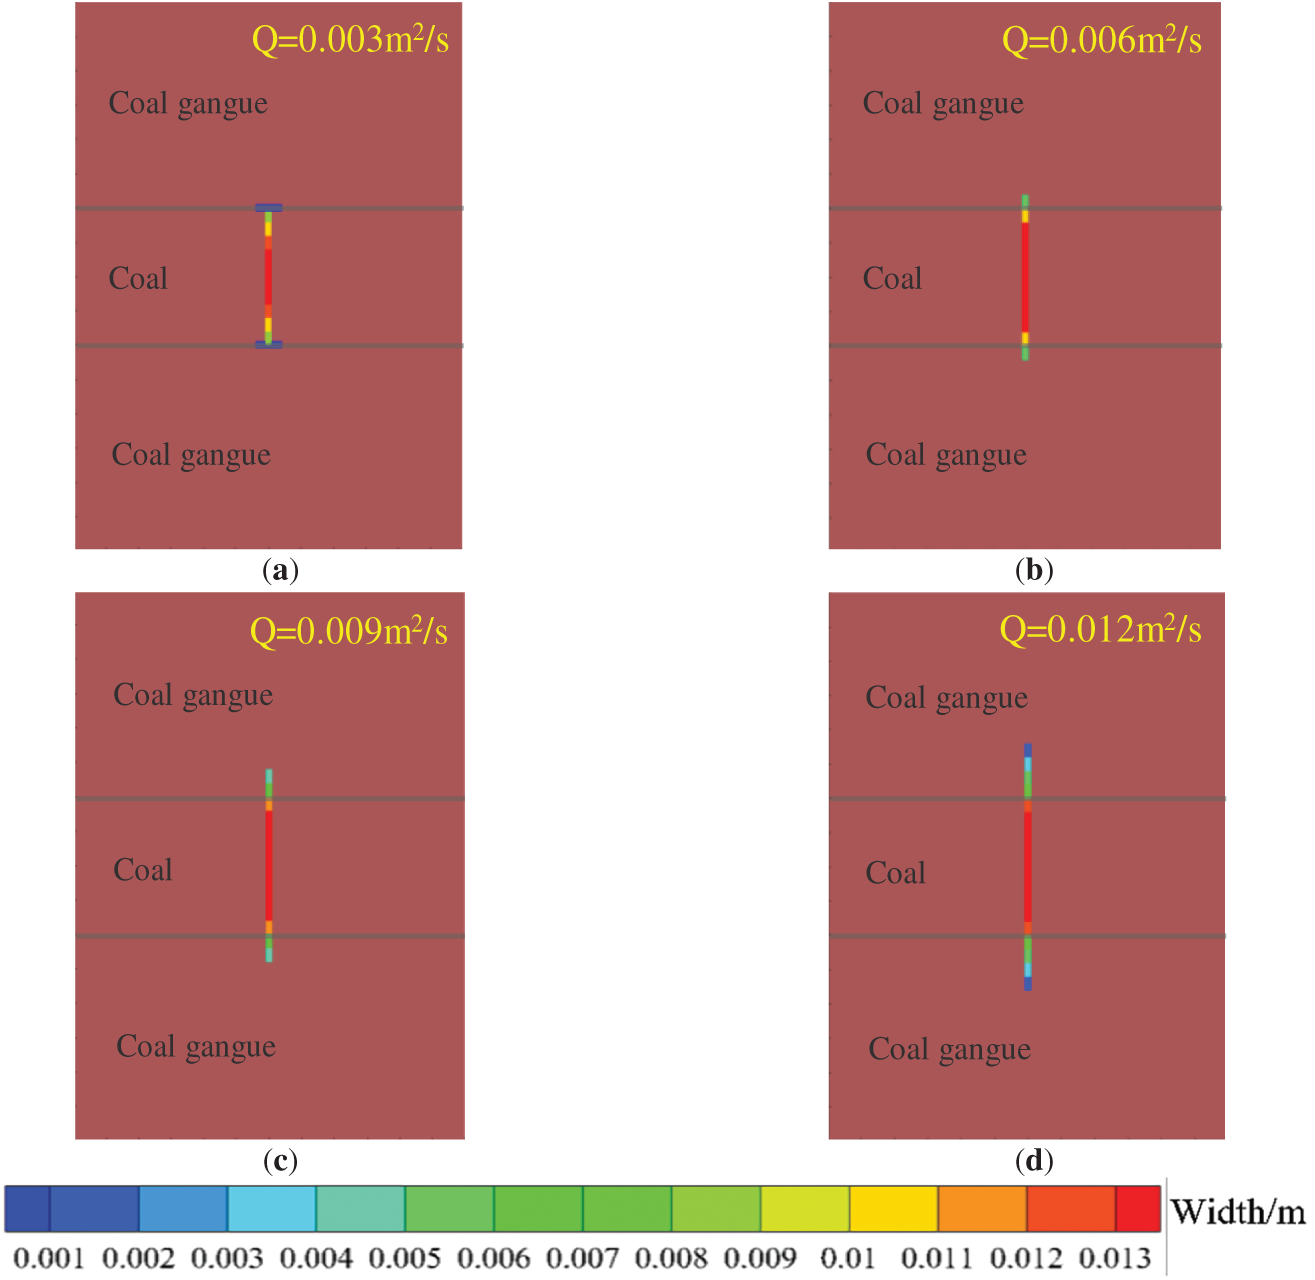
Figure 16: Hydraulic fracture morphology under varying fracturing fluid flow rate. (a) 0.003 m2/s; (b) 0.006 m2/s; (c) 0.009 m2/s; (d) 0.012 m2/s
As shown in Fig. 17, the fracture width at the injection point and bedding aperture were extracted to quantitatively analyze the effect of flow rate on fracture penetration. Higher injection rates significantly increase net pressure within the fracture, enabling the fracture tip to overcome bedding plane barriers and penetrate through layers. When the flow rate exceeds 0.006 m2/s, fractures consistently penetrate the coal-parting interface, with earlier penetration timing and sustained height growth at higher rates. Increasing the flow rate from 0.003 to 0.012 m2/s enlarges the fracture width at the injection point by 8.38 mm (a 56.2% increase), attributed to greater fluid energy widening the fracture. Additionally, bedding planes only opened at the lowest rate (0.003 m2/s), exhibiting a central aperture of 0.60 mm and an activation range of 4.66 m. Overall, higher flow rates reduce height containment, significantly elevating the risk of height breakthrough into non-target layers. Consequently, flow rate optimization is essential for effective stimulation of composite reservoirs.
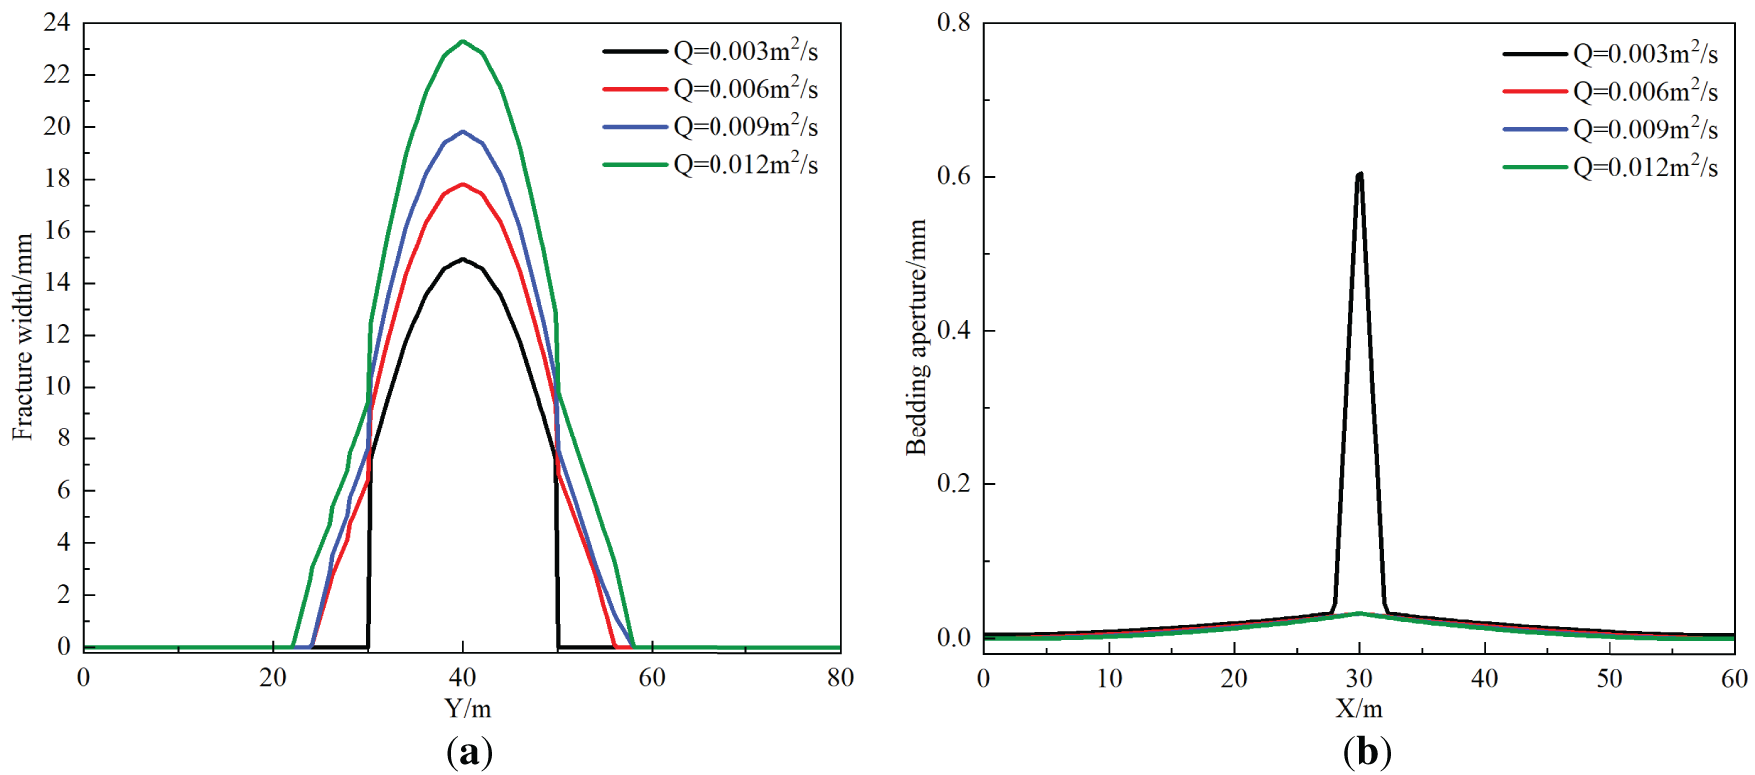
Figure 17: Hydraulic fracturing numerical simulation result curves under different fracturing fluid flow rate. (a) Y-direction hydraulic fracture aperture variation curve; (b) bedding plane aperture variation curve in X-direction
This study utilizes the Combined Continuous-Discontinuous Element Method (CDEM) to develop a numerical model simulating hydraulic fracture propagation in deep coal seams containing interbedded partings. Using this framework, a controlled-variable methodology was employed to systematically evaluate the effects of key parameters—such as vertical stress difference, elastic modulus, interfacial cohesion, interlayer stress contrast, and injection rate—on fracture penetration behavior across coal-parting interfaces. The main results are concluded as follows:
1. In the deep coal rock with weak plane structure, the propagation behavior of hydraulic fracture mainly presents three stages of change: the fracture is captured by the bedding plane and then turns to propagate along the bedding plane; the fracture propagation is limited by the bedding plane in the coal rock reservoir; the fracture breaks through the interlayer interface and propagates in the gangue layer.
2. Under deep coal reservoir conditions, elevated vertical stress differences and enhanced bedding cohesion facilitate hydraulic fracture penetration through bedding planes, promoting propagation within parting interlayers. During cross-layer fracturing events, bedding planes remain intact without shear or tensile failure, while a discernible reduction in fracture aperture is observed at the injection point.
3. An increased contrast in elastic modulus between coal and gangue inhibits the penetration of hydraulic fractures across the interfacial boundary. The greater modulus difference promotes more extensive activation of bedding planes, thereby enhancing the stimulation effectiveness of the coalbed methane reservoir.
4. Elevated interlayer stress contrast establishes a stress barrier that impedes hydraulic fracture penetration across bedding interfaces. Compared to scenarios lacking interlayer stress differentials, this configuration yields an approximately 21% increase in fracture aperture at the injection point.
5. Higher fracturing fluid injection rates promote hydraulic fracture penetration across coal-parting interfaces, significantly reducing the time required for cross-layer propagation. Elevated injection rates further drive progressive expansion of fracture aperture and height post-penetration. For effective stimulation of composite reservoirs, injection rate optimization must align with specific engineering objectives.
Acknowledgement: The authors gratefully acknowledge the invaluable support provided by the Research Institute of Petroleum Engineering Technology, SINOPEC Jiangsu Oilfield Company.
Funding Statement: The authors received no specific funding for this study.
Author Contributions: The authors confirm their contributions to the paper as follows: Study conception and design: Zhirong Jin, Xiaorui Hou; Data collection: Yanrong Ge; Analysis and interpretation of results: Tiankui Guo, Ming Chen; Draft manuscript preparation: Shuyi Li, Tianyu Niu. All authors reviewed the results and approved the final version of the manuscript.
Availability of Data and Materials: The dataset generated and analyzed during the current study is available from the corresponding author upon reasonable request.
Ethics Approval: Not applicable.
Conflicts of Interest: The authors declare no competing financial interests or personal relationships that could have appeared to influence the work reported in this paper.
References
1. Jiang SH, Shi SZ, Zhao K, Liu YC, Yao XJ, Shi JX, et al. Prospect and development direction of deep coal and coalbed methane exploration. Sci Technol Rev. 2023;41:106–13. (In Chinese). [Google Scholar]
2. Kang Y, Huangfu Y, Zhang B, He Z, Jiang S, Ma YZ. Gas oversaturation in deep coals and its implications for coal bed methane development: a case study in Linxing Block, Ordos Basin, China. Front Earth Sci. 2023;10:1031493. doi:10.3389/feart.2022.1031493. [Google Scholar] [CrossRef]
3. An Y, Sun Z, Wang J, Zhang X, Sun Y. Numerical simulation of deep coalbed methane development based on embedded discrete fracture model: a triple medium flow approach. Energy Sci Eng. 2025;13(6):3045–62. doi:10.1002/ese3.70085. [Google Scholar] [CrossRef]
4. Wan Y, Wang Z, Hu D, Wang Y, Huo M, Mu X, et al. Gas-bearing evaluation of deep coal rock in the Yan’an gas field of the Ordos Basin. Front Earth Sci. 2024;12:1438834. doi:10.3389/feart.2024.1438834. [Google Scholar] [CrossRef]
5. Feng R, Li C, Sun L, Wang J, Liu J, Li N. Study on the influence of deep coalbed methane horizontal well deployment orientation on production. Energies. 2024;17(22):5784. doi:10.3390/en17225784. [Google Scholar] [CrossRef]
6. Guo F, Lv R, Song D, Li Y, Zhang Z, Wang X, et al. Coalbed methane enhancement in low-permeability reservoirs by hydraulic fracturing with coated ceramsite. Energy Fuels. 2023;37(13):9023–31. doi:10.1021/acs.energyfuels.3c00496. [Google Scholar] [CrossRef]
7. Xiong D, He J, Ma X, Qu Z, Guo T, Ma S. Fracturing simulation with different perforation positions at deep coal seam and roof/floor rock—case study at the No. 8 deep coal seam of a gas field in the Ordos Basin. J China Coal Soc. 2024;49(12). (In Chinese). doi:10.13225/j.cnki.jccs.2024.0009. [Google Scholar] [CrossRef]
8. Cao S, Wang X, Ge Z, Zhang L, Yang Y, Hu H. Dynamic damage mechanism of coal with high true triaxial stress level subject to water jets. Powder Technol. 2024;437(8):119583. doi:10.1016/j.powtec.2024.119583. [Google Scholar] [CrossRef]
9. Chen B, Barboza BR, Sun Y, Bai J, Thomas HR, Dutko M, et al. A review of hydraulic fracturing simulation. Arch Comput Meth Eng. 2022;29(4):1–58. doi:10.1007/s11831-021-09653-z. [Google Scholar] [CrossRef]
10. Wang C, Li S, Liu L, Liu L. Research on hydraulic fracturing technology of long boreholes along strata of high vast thick coal seam. Adv Civ Eng. 2024;2024(1):6305640. doi:10.1155/2024/6305640. [Google Scholar] [CrossRef]
11. Sun Z, Tan Z, Lin J, An Q, Zou Y, Liu S, et al. Investigation into hydraulic fracture propagation behavior during temporary plugging and diverting fracturing in deep coal seam. Front Energy Res. 2024;12:1369428. doi:10.3389/fenrg.2024.1369428. [Google Scholar] [CrossRef]
12. Shi Y, He Y, Wan J, Sun J, Zeng J, Cui R. The primary controlling factors of the occurrence state of deep high-rank coalbed methane in eastern Ordos Basin. Front Earth Sci. 2024;12:1340523. doi:10.3389/feart.2024.1340523. [Google Scholar] [CrossRef]
13. Daneshy AA. Hydraulic fracture propagation in layered formations. Soc Petrol Eng J. 1978;18(1):33–41. doi:10.2118/6088-pa. [Google Scholar] [CrossRef]
14. Zhao H, Chen M. Extending behavior of hydraulic fracture when reaching formation interface. J Petrol Sci Eng. 2010;74(1–2):26–30. doi:10.1016/j.petrol.2010.08.003. [Google Scholar] [CrossRef]
15. Tan P, Jin Y, Han K, Zheng X, Hou B, Gao J, et al. Vertical propagation behavior of hydraulic fractures in coal measure strata based on true triaxial experiment. J Petrol Sci Eng. 2017;158(6):398–407. doi:10.1016/j.petrol.2017.08.076. [Google Scholar] [CrossRef]
16. Tian Z, Xiong Z, Wei Y, Ma S, Hu X. Numerical simulation of fracture propagation in deep coal seam reservoirs. Energy Sci Eng. 2023;11(10):3559–74. doi:10.1002/ese3.1540. [Google Scholar] [CrossRef]
17. Ren Q, Zhao Y, Zhu X, Zhou Y, Jiang Y, Wang P, et al. CDEM-based simulation of the 3D propagation of hydraulic fractures in heterogeneous Coalbed Methane reservoirs. Comput Geotech. 2022;152(4):104992. doi:10.1016/j.compgeo.2022.104992. [Google Scholar] [CrossRef]
18. Xu W, Zhao J, Rahman SS, Li Y, Yuan Y. A comprehensive model of a hydraulic fracture interacting with a natural fracture: analytical and numerical solution. Rock Mech Rock Eng. 2019;52(4):1095–113. doi:10.1007/s00603-018-1608-9. [Google Scholar] [CrossRef]
19. Huang L, Li B, Wang B, Zhang J. Effects of coal bedding dip angle on hydraulic fracturing crack propagation. Geomech Geophys Geo Energy Geo Resour. 2023;9(1):30. doi:10.1007/s40948-023-00562-y. [Google Scholar] [CrossRef]
20. Zhu X, Feng C, Cheng P, Wang X, Li S. A novel three-dimensional hydraulic fracturing model based on continuum-discontinuum element method. Comput Meth Appl Mech Eng. 2021;383(6):113887. doi:10.1016/j.cma.2021.113887. [Google Scholar] [CrossRef]
21. Zhang B, Guo T, Chen M, Wang J, Cao J, Wang H, et al. Effect of bedding planes and property contrast between layers on the propagation mechanism of hydraulic fracture height in shale reservoirs. Comput Geotech. 2024;175(12):106715. doi:10.1016/j.compgeo.2024.106715. [Google Scholar] [CrossRef]
22. Li J, Wang L, Feng C, Zhang R, Zhu X, Zhang Y. Study on the influence of perforation parameters on hydraulic fracture initiation and propagation based on CDEM. Comput Geotech. 2024;167(3):106061. doi:10.1016/j.compgeo.2023.106061. [Google Scholar] [CrossRef]
23. Zhang B, Guo T, Chen M, Wang J, Qu Z, Wang H, et al. Research on fracture propagation of hydraulic fracturing in a fractured shale reservoir using a novel CDEM-based coupled HM model. Comput Geotech. 2024;168(3):106170. doi:10.1016/j.compgeo.2024.106170. [Google Scholar] [CrossRef]
24. Xu Z, Zhao H, Liu X, Liang L, Luo P. Three-dimensional numerical simulation of fracture extension in conglomerate fracturing considering pore-fracture seepage and study of influencing factors. Geofluids. 2024;2024(1):7883958. doi:10.1155/2024/7883958. [Google Scholar] [CrossRef]
25. Lu Y, Cai Z, Huang D, Yao X, Ma Q, Chen D. Peridynamic modeling and analysis of interfacial crack propagation by hydraulic fracturing in layered shale. Comput Geotech. 2025;184(16):107280. doi:10.1016/j.compgeo.2025.107280. [Google Scholar] [CrossRef]
26. Hwang J, Manchanda R, Sharma MM. An extended finite volume model for implicit cohesive zone fracture propagation in a poroelastic medium. Comput Meth Appl Mech Eng. 2019;350:571–94. doi:10.1016/j.cma.2019.03.040. [Google Scholar] [CrossRef]
27. Wang J, Guo T, Chen M, Qu Z, Zhang B, Zhang W, et al. Numerical simulation of fracture propagation morphology in hydraulic fracturing development of geothermal reservoirs based on the CDEM-THM3D. Comput Geotech. 2024;172(05):106444. doi:10.1016/j.compgeo.2024.106444. [Google Scholar] [CrossRef]
28. Dontsov EV. An approximate solution for a penny-shaped hydraulic fracture that accounts for fracture toughness, fluid viscosity and leak-off. R Soc Open Sci. 2016;3(12):160737. doi:10.1098/rsos.160737. [Google Scholar] [PubMed] [CrossRef]
Cite This Article
 Copyright © 2026 The Author(s). Published by Tech Science Press.
This work is licensed under a Creative Commons Attribution 4.0 International License , which permits unrestricted use, distribution, and reproduction in any medium, provided the original work is properly cited.
 Downloads
 Citation Tools