
 Submit a Paper
 Propose a Special lssue
 Open Access
ARTICLE

Solar Photovoltaic System as a Sustainable Solution for Electric Load Shortage in Baghdad: A Design and Economic Study
1 Energy and Renewable Energies Technology Center, University of Technology, Baghdad, 10066, Iraq
2 Research of Environment and Renewable Energy, Karbala University, Baghdad, 10066, Iraq
3 Training and Workshop Center, University of Technology, Baghdad, 10066, Iraq
4 Faculty of Engineering, Sohar University, P.O. Box 44, Sohar, PCI 311, Oman
* Corresponding Author: Miqdam T. Chaichan. Email:
(This article belongs to the Special Issue: Advancements in Energy Resources and Their Processes, Systems, Materials and Policies for Affordable Energy Sustainability)
Energy Engineering 2026, 123(2), 14 https://doi.org/10.32604/ee.2025.073313
Received 15 September 2025; Accepted 18 November 2025; Issue published 27 January 2026
 View Full Text
 Download PDF
Abstract
In the present study, researchers examined a solar off-grid-connected photovoltaic system for a family house in the city of Baghdad. The design was created with the help of the “How to Design PV Program” and the “Renewable Energy Investment Calculator (REICAL)” software (Version 1.1). In Iraq, the national grid provides around 71% of the overall electricity demand, though this drops to nearly 50% during extremely hot and cold months, where the supply alternates between four hours on and four hours off. During the off periods, power is generated by local generators at high costs. To promote the adoption of photovoltaic solar systems among Iraqi citizens through loans, three options for meeting 100% of electricity needs have been proposed: an on-grid solution, a hybrid system that supplies 24 h, and an off-grid solution for a 24-h supply. The 12-h off-grid system (hybrid) is both economical and efficient for delivering electricity. Findings reveal that, over 20 years, the system’s output will amount to 141,176.71 kWh, with a payback period of 5.85 years and a performance ratio of 86.2%. Investment outcome data showed a net present value of $6445, and the profitability index was 6.16, indicating the project’s profitability. Additionally, the system could result in a net reduction of CO2 emissions totaling 132,810.24 kg.Keywords
Renewable energy sources are a key driver for achieving net-zero greenhouse gas emissions by 2050. Over the past 15 years, the share of renewable energy in the European Union has grown rapidly, reaching 38% of total electricity consumption in 2021 (compared to 16% in 2005), with similar ambitions in the rest of the world [1]. Numerous nations struggle to provide adequate electricity for their populations, and Iraq finds itself among them. One viable alternative is solar energy, which can address this issue without harming the environment, alleviating hardships during extreme weather conditions. The supply from the national grid reaches only about 50% capacity during peak hours, and 90% in the spring and autumn months [2]. Therefore, implementing a 12-h energy supply system would be a practical and more affordable choice for a larger number of users compared to a 24-h arrangement. Many researchers are concentrating on the advancement of modified semiconductors for applications involving solar cells and photodetectors. They have predominantly agreed that, despite facing some obstacles, photovoltaic solar energy systems stand out as the best solution for both energy needs and environmental concerns [3,4].
While solar panel electricity can be generated at no cost, various challenges affect its functionality, including high initial expenses, production variations, and energy storage issues [5]. Numerous studies have assessed photovoltaic systems using software like PV-SYST, PVGIS, and Homer for renewable energy simulations [6,7]. Some researchers have compared results by utilizing multiple simulation tools [8]. A variety of solar modules—such as CdTe, Poly, Mono, and CIS—have been experimentally analyzed for performance, with the focus on achieving the lowest cost per kWh [9].
Grid-connected systems often face temporary instabilities that hinder maximum power tracking, negatively influencing power quality and generating high costs [10]. In contrast, standalone (off-grid) systems utilize batteries and operate independently of the grid, prompting many researchers to explore these systems [11]. The performance of photovoltaic systems is susceptible to several factors, including wind, temperature, humidity, and dust [12]. Increased heat can lead to a drop of more than 15% in energy production when considering the effects of temperature and wind, as well as wire losses and the angles of sunlight incidence. Dust accumulation on the solar modules also reduces output, necessitating regular cleaning. Asghar et al. [13] offered a techno-economic analysis of a standalone hybrid energy system designed to power telecom towers in Saudi Arabia. The study indicates that it serves as a dependable model for effectively deploying such systems to deliver electricity to telecom towers in remote locations globally, especially in the Middle East [14]. Similarly, Hassan and others have concluded that the extensive use of photovoltaic energy could significantly enhance electricity self-sufficiency in Iraq [15]. Studies have explored the potential for several Gulf Cooperation Council countries—including Yemen, Iraq, and Jordan—to harness their plentiful solar radiation for electricity generation through photovoltaic technology. Most PV plants and associated infrastructure development occur primarily in Saudi Arabia, the United Arab Emirates, and Jordan [16]. A method is proposed that integrates photovoltaic, wind, and battery technologies to supply power to individual devices while tracking battery levels during daily power outages of 8, 12, and 16 h in Iraq [17]. Over three years, this setup of photovoltaic-wind-battery has shown that it can recover its initial investment. A solar power system was designed and evaluated to provide energy for a base transceiver station (BTS) in Baghdad, Iraq, where the power load is 4.177 kW [18].
The project simulation utilized the PVsyst software (Version 8.0). The financial analysis reveals that this system presents a low cost per kilowatt-hour of $0.108 [18]. In 2024, Salim and Rashed [19] presented several hybrid system designs incorporating solar panels (PV), wind turbines (WT), diesel generators (DG), batteries, and inverters. These were sorted into three categories based on their suitability for different conditions. The research indicated that, across all scenarios examined, solar PV systems, wind turbines, batteries, and distributed generators (DG) are the most cost-efficient options for the targeted area (Al-Teeb). Daabo et al. [20] developed a solar energy system to supply electricity to homes in Duhok during outages, focusing on technology and cost for distribution. This system can provide energy for 10 h (grid-connected solar system). They found the daily energy needs of a home to be 6239.1 W-hours, with a rate of $0.005 per watt-hour. The total investment needed amounted to $3475.
Qasim et al. [21] evaluated the performance—technical, economic, and environmental—of a hybrid power setup that combines photovoltaic (PV) arrays, wind turbines (WTs), battery energy storage systems (BESSs), and diesel generators (DGs) in remote areas, specifically looking at Baghdad. Results showed that the PV and distributed generation (DG) combination was the most effective solution, yielding an annual energy output of 90,113 MWh. PV arrays contributed 71.7% (64,652 MWh annually), while WTs offered 27.8% (25,033 MWh per year), and DGs a small 0.475% (0.428 MWh each year).
Mohammed et al. [22] analyzed and compared a solar-powered water collector with a conventional electric water heater for home heating. He tested a solar heating system featuring a flat-panel collector of 2 square meters, designed to heat a 60-L water tank for a room measuring 1.55 square meters wide, 1.8 m long, and 2.2 m tall, utilizing a fan coil unit. In his research, he employed two different heating techniques.
The current study aims to design and install a solar PV system on a rooftop in Iraq to address the electricity shortfall arising from insufficient supply from the national grid. Furthermore, find the best economy methods to supply electric power for 24 h by using a different solar PV system.
2.1 System Description and Design
The house is located in eastern Baghdad (33.302522, 44.475104) as shown in Fig. 1. The best tilt angle for the winter season is 45° at midday and 15° for summer. The best angle chosen for all sessions for climate Iraq is 30° [23]. The effect of the high tree shadow is insignificant, as the tree is located to the east of the proposed house for installing the system.
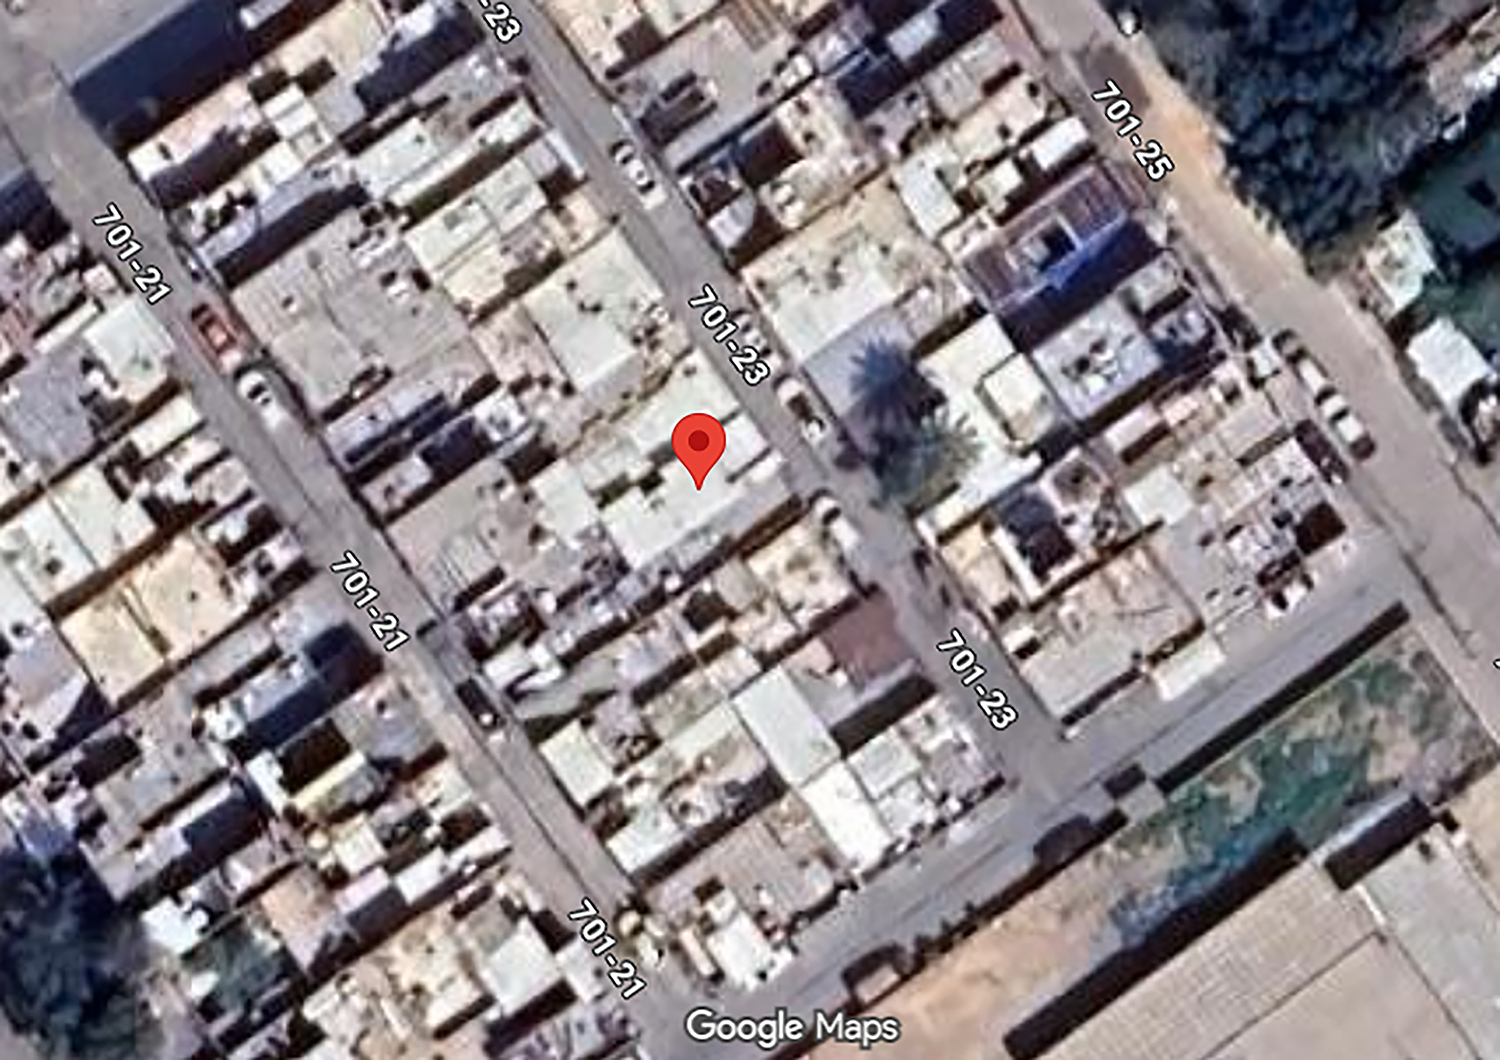
Figure 1: The proposed house for installing the system
There are many mathematical models and simulation programs to calculate the suitable module’s title, as the PV-syst program. Depending on the height of the sun in the four seasons, the best tilt angle for a cold session is 45, and the amount of output power will be high, as shown in Fig. 2.
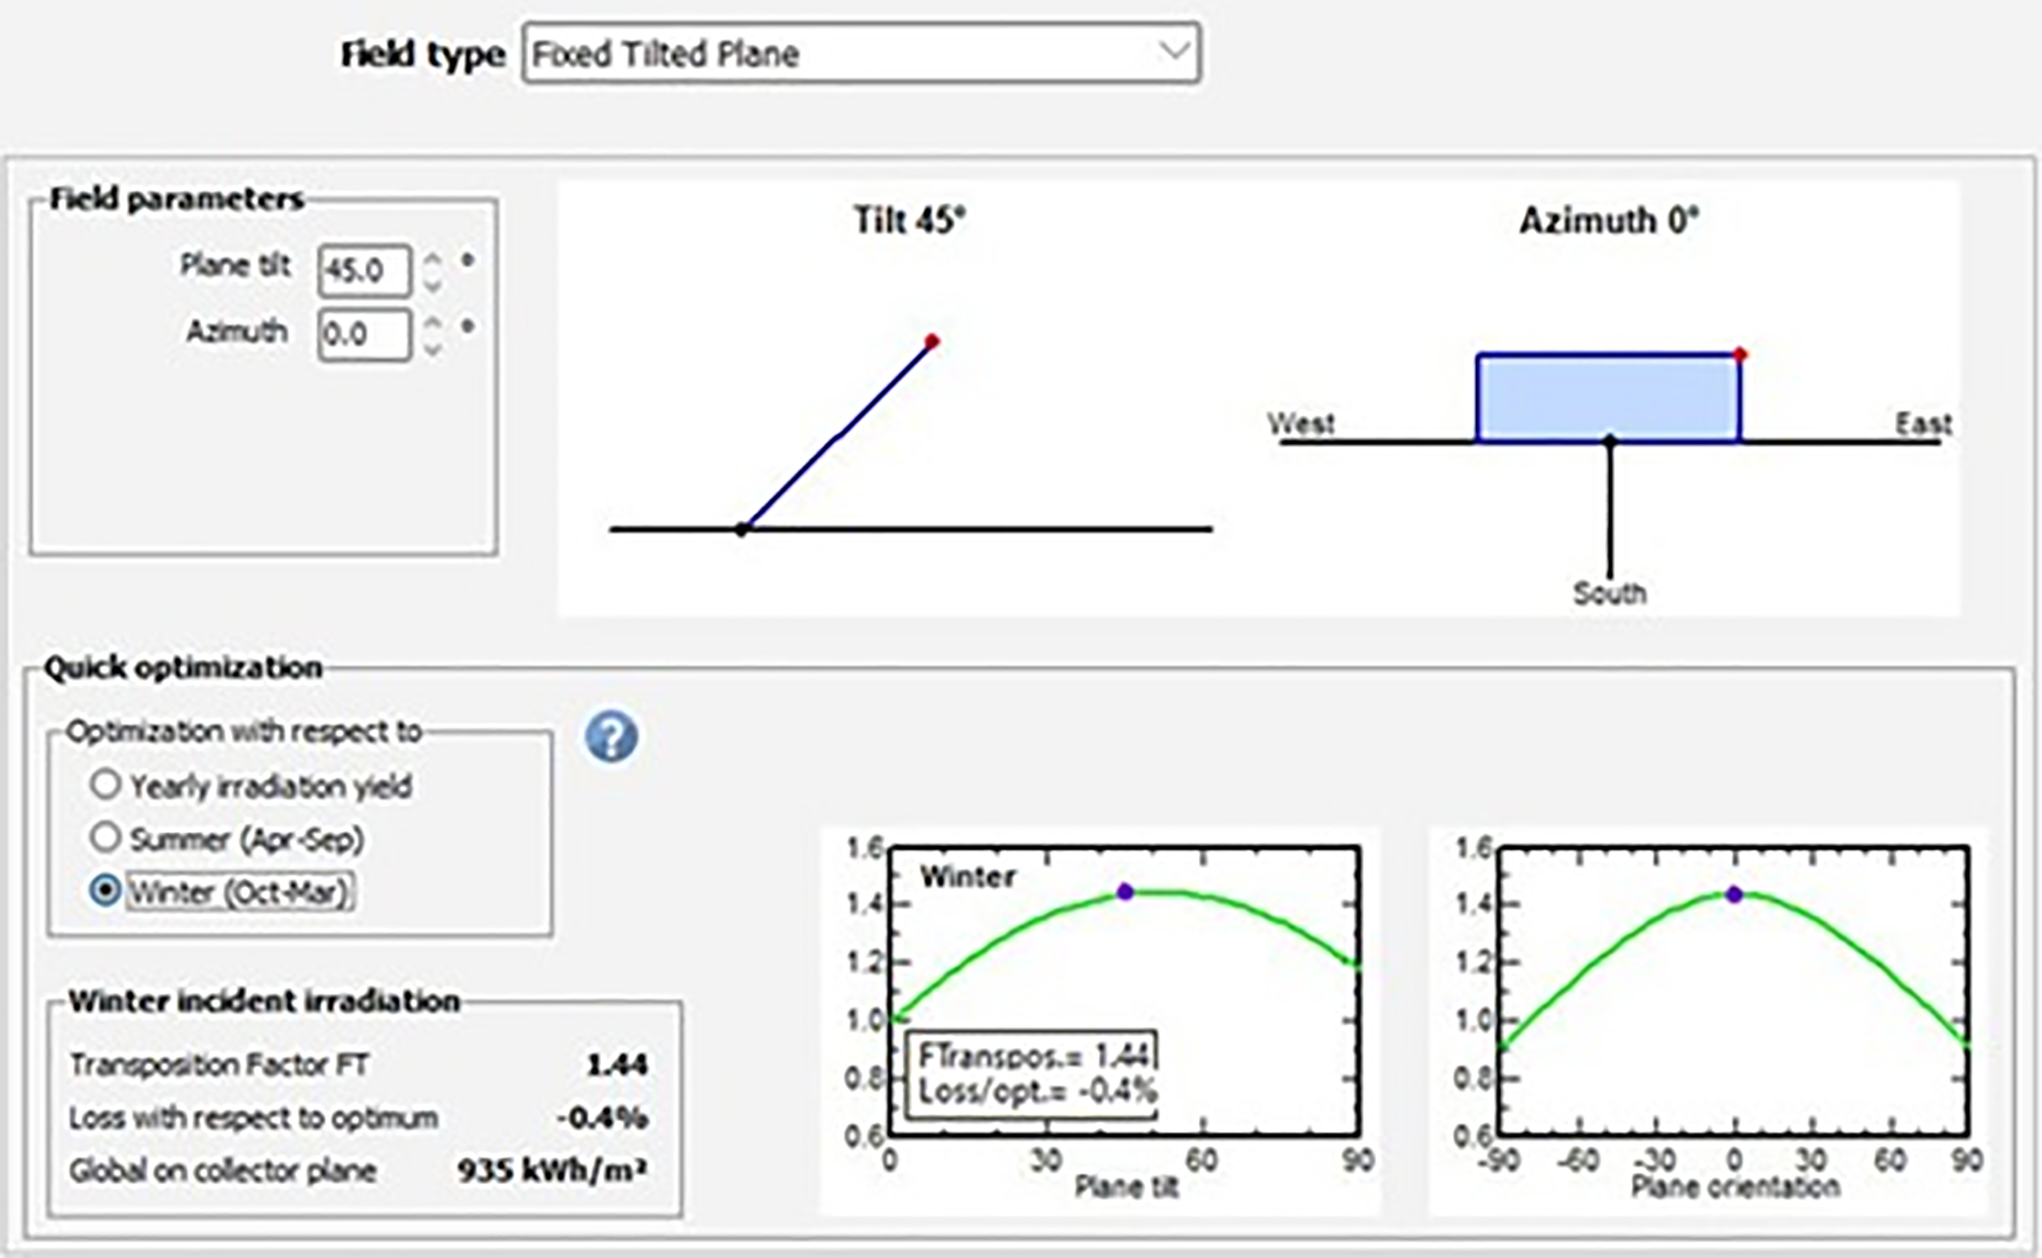
Figure 2: The best tilt angle for a cold session is 45°
The best tilt angle for a hot session is 15°, and the amount of output power will be high, as shown in Fig. 3.
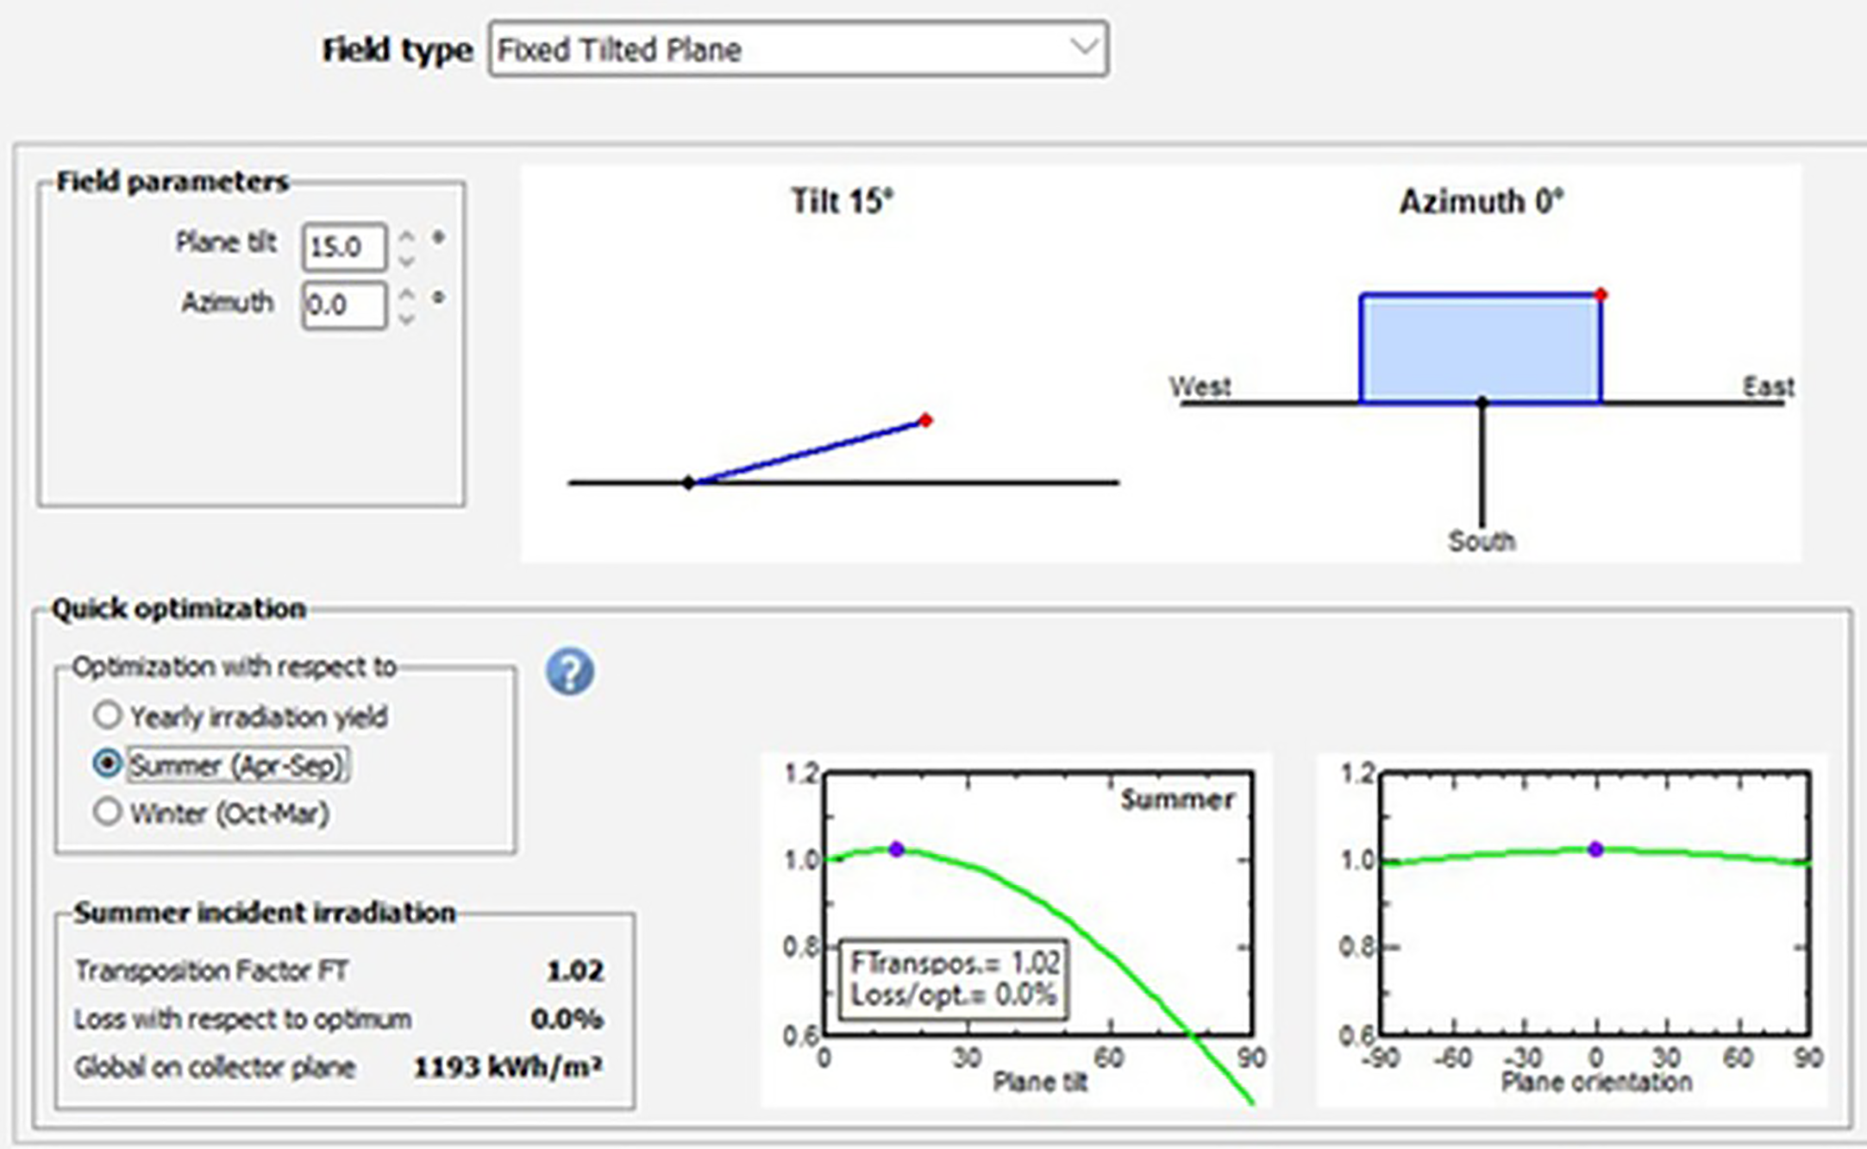
Figure 3: The best tilt angle for a cold session is 15°
The yearly tilt angle is 30° and the amount of output power will be high, as shown in Fig. 4.
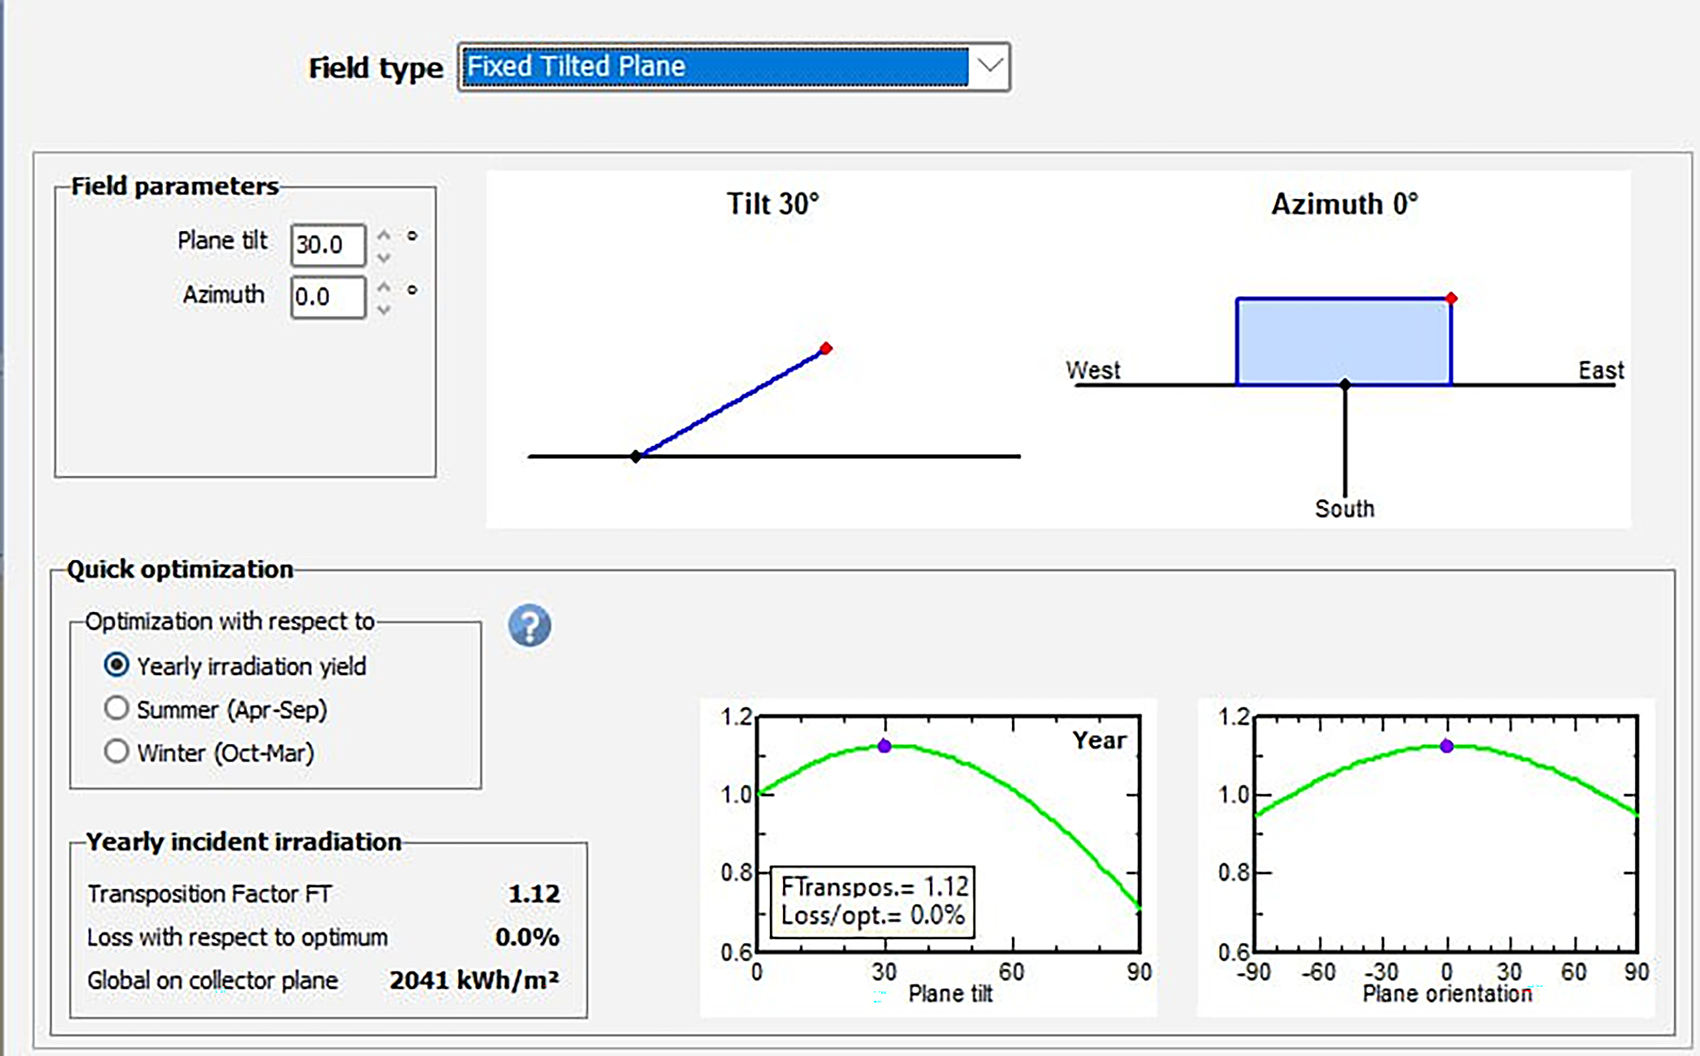
Figure 4: The best yearly tilt angle session is 30°
The angle at which panels are installed varies depending on the position of the sun during the four seasons. In spring and fall, the sun is at an average height when it is above the equator. In winter, the sun is behind the equator and its elevation relative to the panels is low, while in summer, the opposite is true. Fig. 5 illustrates the position of the sun relative to the panels.
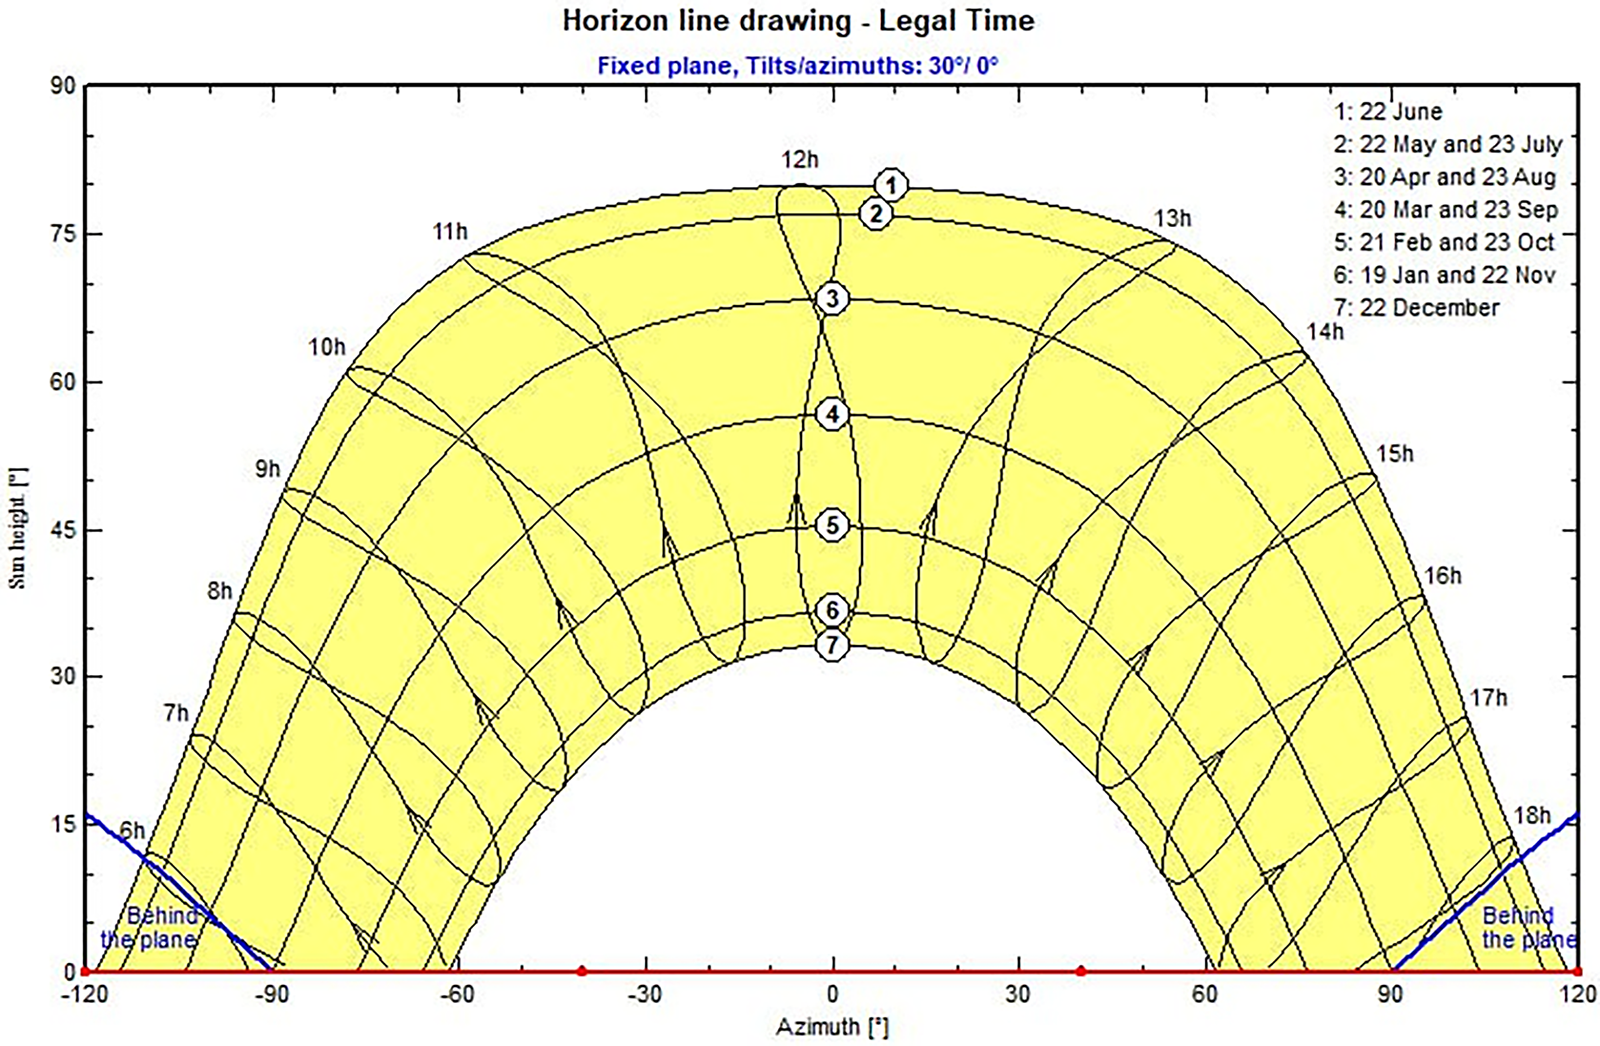
Figure 5: The position of the Sun relative to the Earth
In the current study, a fixed angle of 30 degrees was used for fixed modules, and suitable for all months of the year.
2.2 The Electric Supply in Iraq
Some countries suffer from persistent power outages as [24–26]:
• Nigeria tops the list of African countries with the worst power outages in 2024/2025. The electricity sector suffers from aging infrastructure, vandalism, poor maintenance, and a general lack of investment in generation capacity.
• South Africa: Despite being one of Africa’s most industrialized countries, it still suffers from its worst energy crisis in decades, with widespread blackouts expected to return in early 2025.
• Yemen: Experiences frequent power outages that can last up to 12 h a day.
• Lebanon: Power outages have become a part of daily life, with state-provided electricity only available for one or two hours a day.
• Iraq: Suffers from dilapidated networks and low generation capacity, leading to frequent outages.
• Pakistan: Vulnerable to global supply shocks as most power plants run on imported fuel and face frequent outages.
• Papua New Guinea: Records the highest rate of business-related power outages.
• Central African Republic: Regularly experiences power outages.
Iraq’s long history of war, culminating in the 2003 occupation, has resulted in widespread destruction of vital infrastructure, including electricity systems. As a result, the country has faced significant energy shortages for consumers, causing significant hardship, particularly during extremely hot or cold seasons [27]. Contributing to this energy crisis is a high population growth rate of 2.4% and a slowdown in economic growth. Iraq’s gas resources are insufficient, so it has proposed purchasing gas from other countries. Attempts have been made to secure gas from neighboring Iran, but international sanctions on Iran complicate these efforts. The electricity supply rate can be seen in Fig. 6 [26].
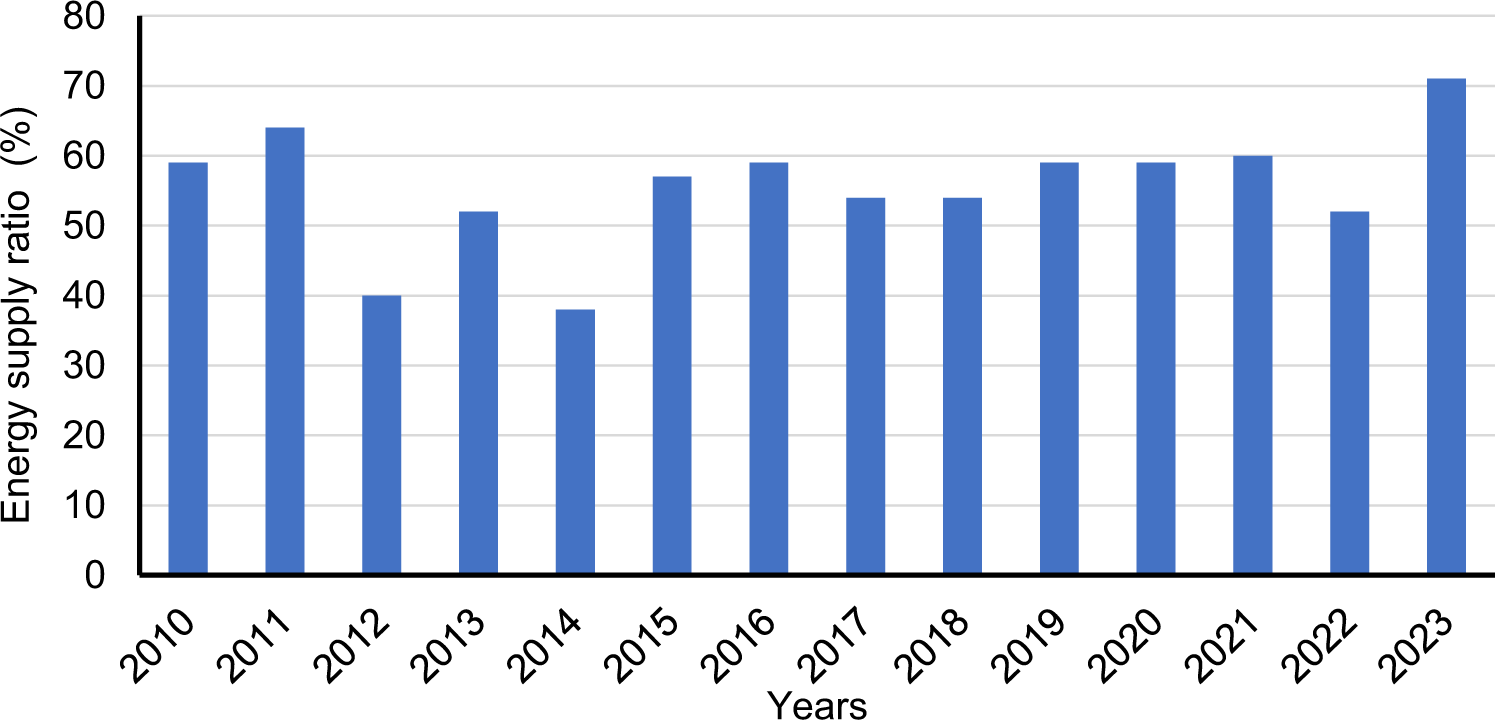
Figure 6: The yearly rate of electric supplement in Iraq (2010–2023) [26]
In both 2012 and 2014, the electricity supply faced a major reduction. This was primarily due to a sharp fall in oil prices on the global market, which is Iraq’s main source of income, as well as internal conflicts. To tackle the issue of electricity supply, government banks started offering loans to solar energy companies. These loans aim to help citizens acquire solar energy systems while generating moderate profits for the banks. However, there has been no clear technical guideline provided for these solar systems. In this study, three possible scenarios are presented to ensure a 100% electricity supply for consumers through photovoltaic (PV) solar systems:
1. Promote the installation of on-grid PV systems that are based on the roofs of houses, where the capacity is generally high. This system generates electricity during daylight hours without needing storage devices, like batteries, which reduces around 33%–50% to the overall cost.
2. Encourage the setup of off-grid 12-h (hybrid) PV systems capable of providing electricity for 12 h. This kind of system requires smaller modules, batteries, and metal frames.
3. Motivate consumers to invest in larger off-grid PV systems that can supply electricity for a full 24 h. These systems are designed to be twice the size of the ones in the second scenario. Table 1 offers a comparison between these three scenarios.
Fig. 7 illustrates the components of the proposed solar off-grid energy system.
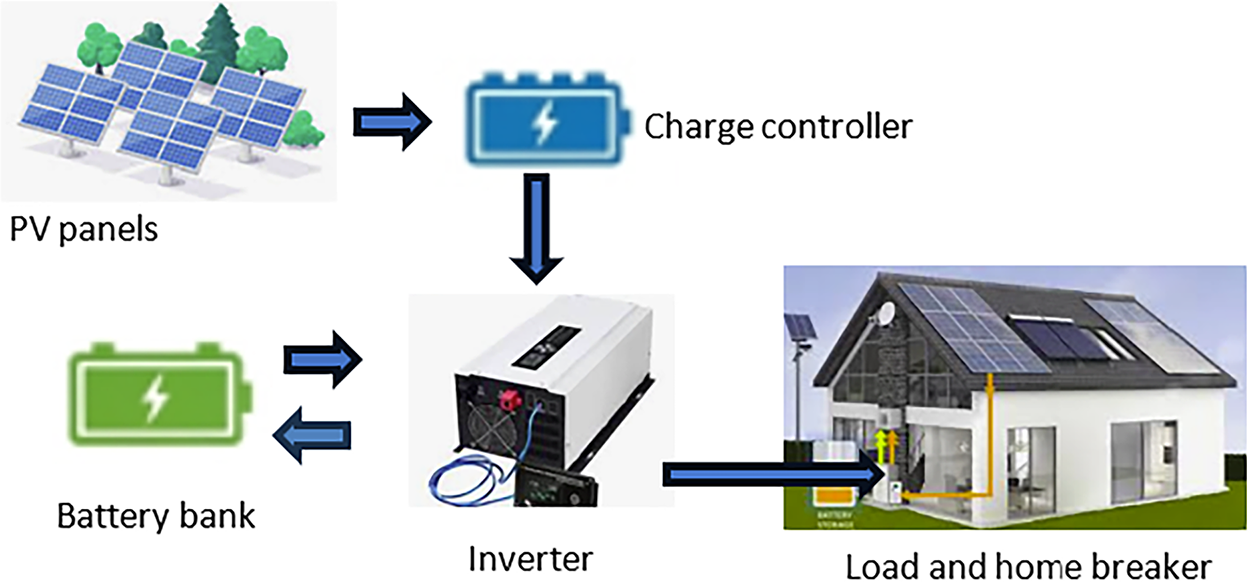
Figure 7: The components of the proposed off-grid 24-h energy system
When the solar energy system operates in conjunction with the national electricity grid to supply the home with electricity for 24 h, the home electricity system is called a hybrid system (solar system, batteries, and the national electricity grid), as shown in Fig. 8.
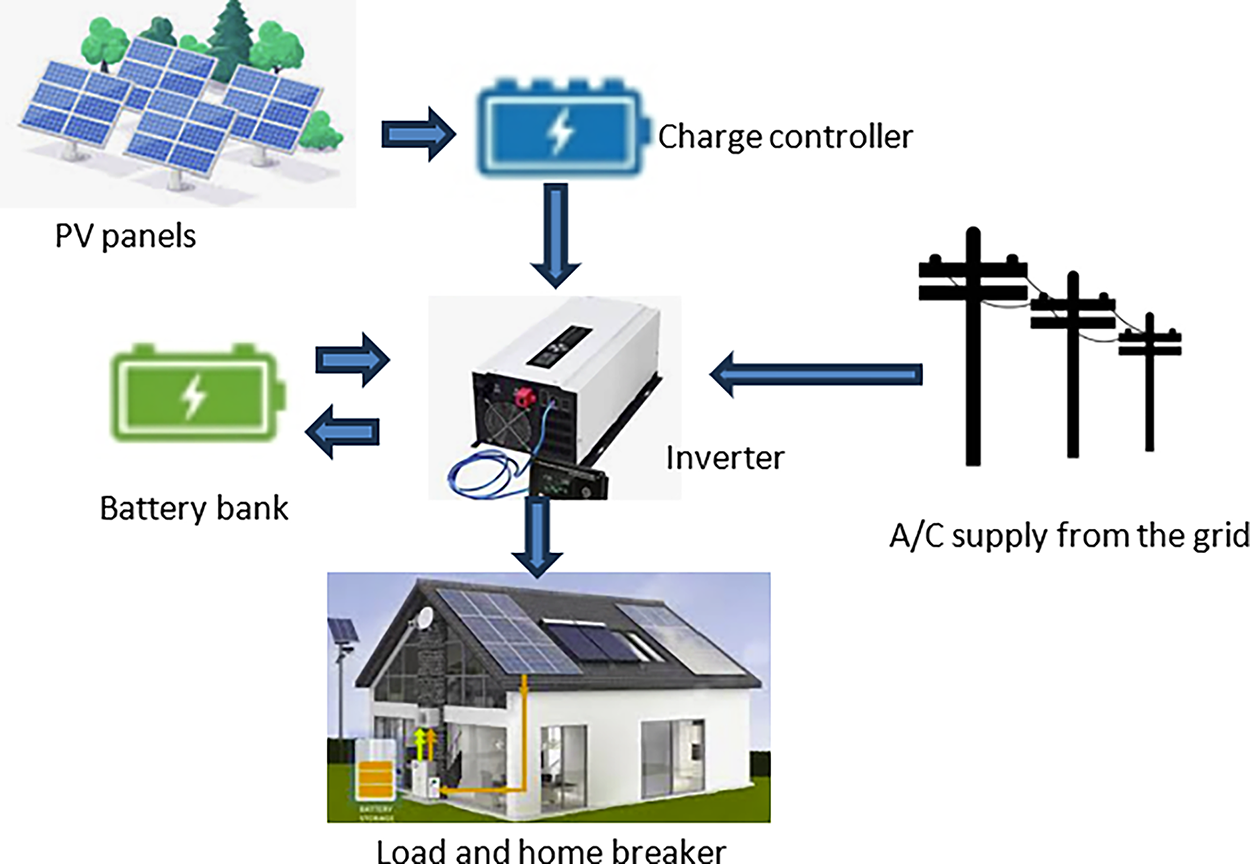
Figure 8: The components of the proposed off-grid energy system with the national electricity grid (hybrid system)
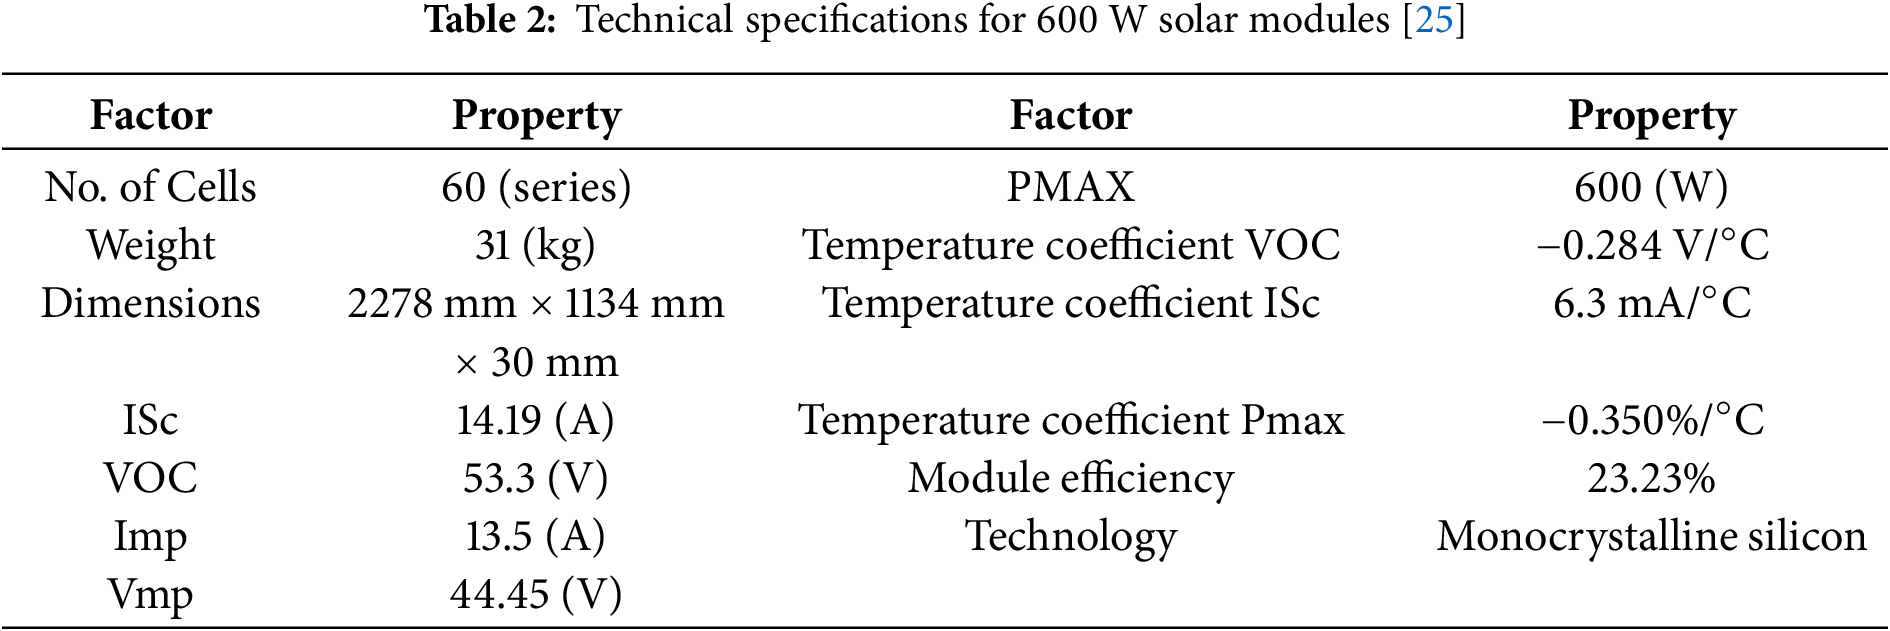
The details for the monocrystalline module 600 Wp, which was adopted in the recent study design, can be found in Table 2.
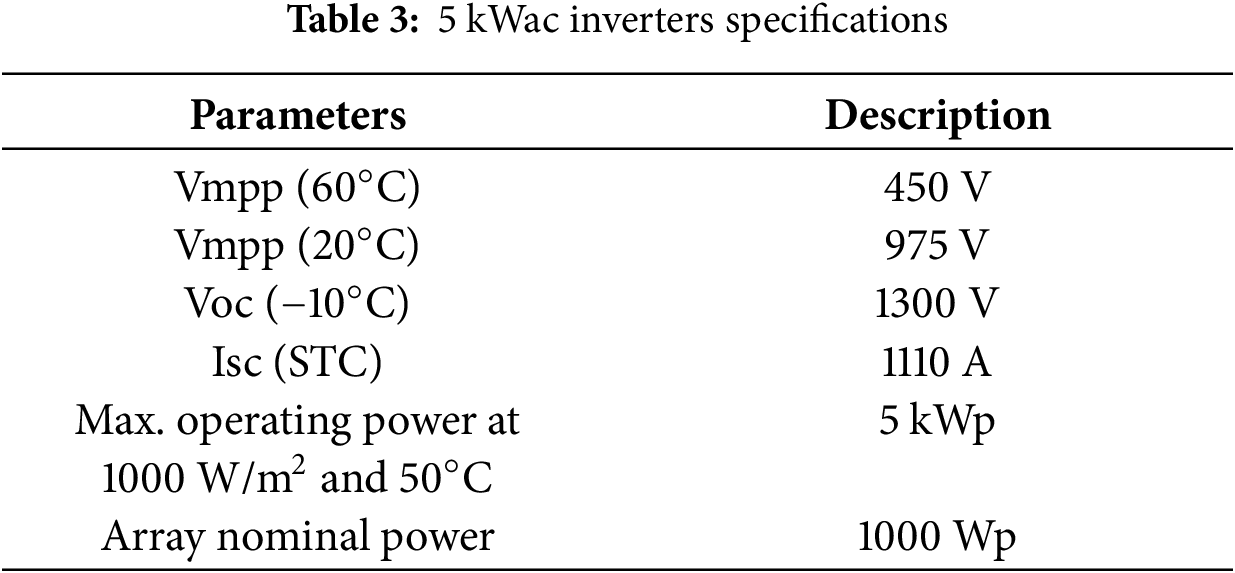
In the current work, a complete production of the system is obtained by using a 5 kWac Inverter (type hybrid). For Iraqi grid compatibility, the inverter output is set to 400 V, 50 Hz. The specifications of the adopted inverter are listed in Table 3.
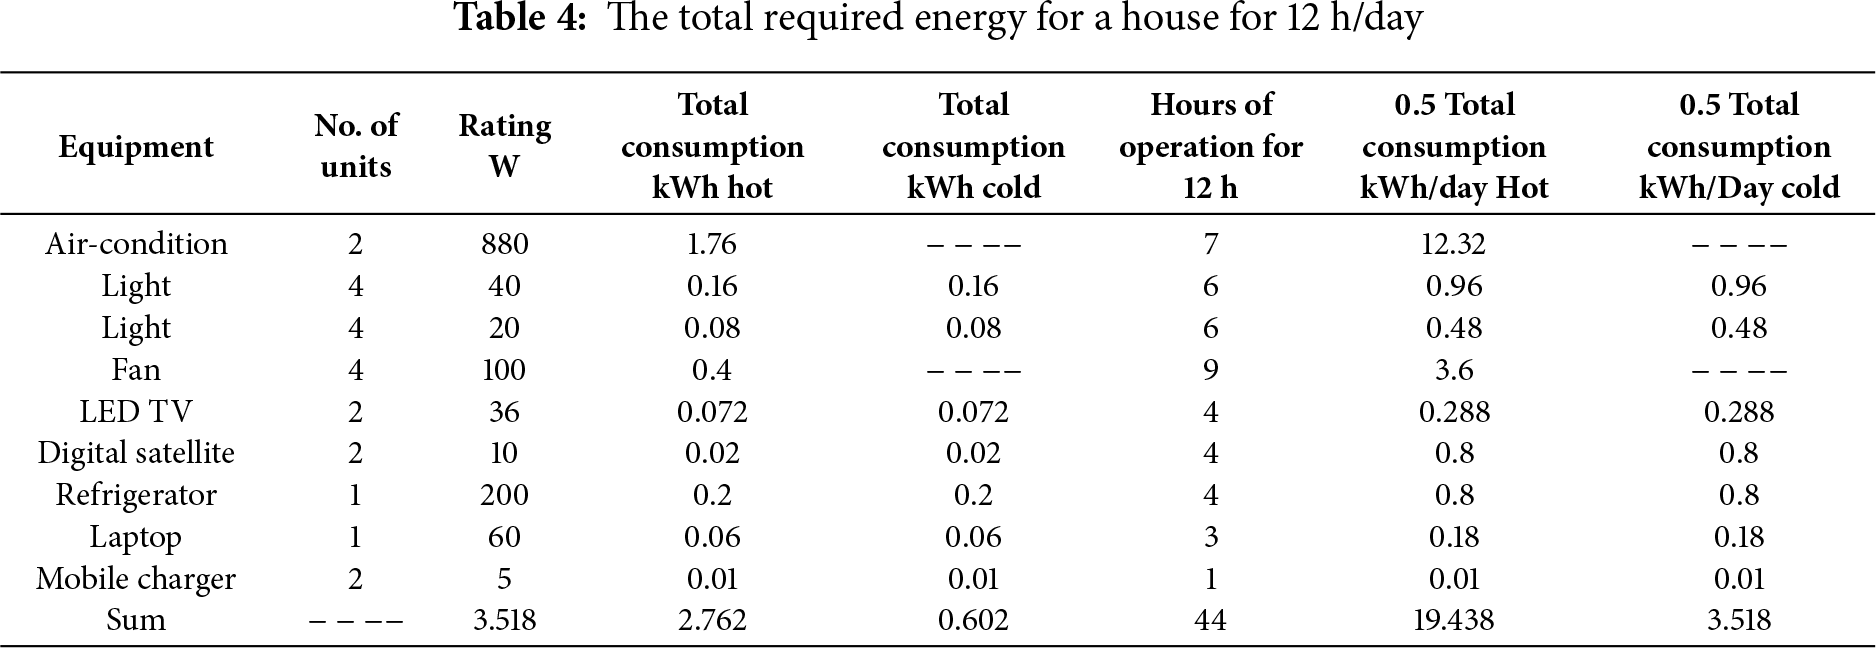
A house that consists of four rooms, a kitchen, and a bathroom has daily energy needs outlined in Table 4 for a duration of 12 h.
2.4 Energy Production Estimation
The maximum output power,
The efficiency of conversion is determined by comparing the maximum power generated to the power received by the solar cell’s area [26]:
In this equation, A represents the area of the modules, while GT stands for the total solar irradiance. Guidelines for measuring energy demand are available through the simulation program titled ‘How to Design a Solar PV System. It is a mathematical calculation program used to design solar energy systems by the company LEONICS [27,28]. The program’s job is to design a solar photovoltaic system. You must first calculate your daily energy consumption, then determine the required system size, inverter rating, battery bank size, and charge controller capacity. To meet a daily energy requirement related to the PV system (Er), it must align with the household’s energy demand, D, and anticipated system losses (Ls), which are projected to be around 30% of the overall demand.
The Watt peak rating (Wp) required for PV panels is:
The average solar irradiance per day in Baghdad is 5.27 kW/m2 for each square meter [29].
The number of modules in the current system is based on the module’s power output, Wp.
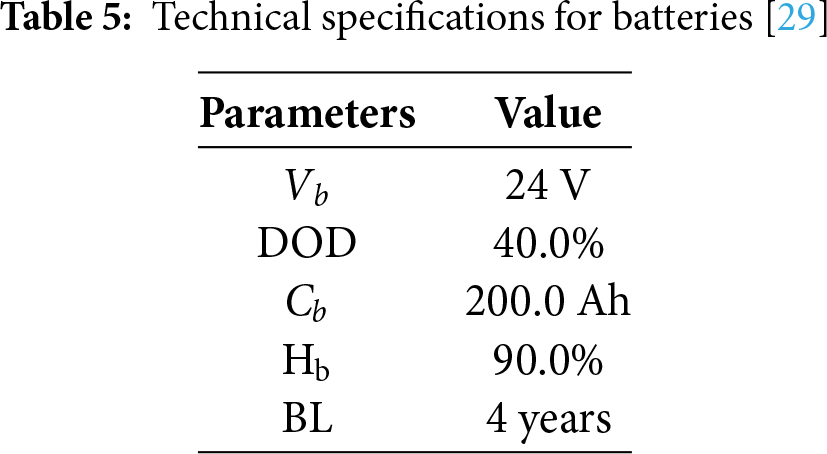
To ensure appliances function during nighttime and on cloudy days, batteries must have adequate storage to keep enough energy. Solar energy can satisfy the household’s needs throughout the day. Battery specifications are detailed in Table 5.
Calculating the required Battery Capacity (Cr) leads to:
The capacity of each unit determines the total count of batteries:
The factors affecting battery capacity and battery losses are discharge factor (DOD), battery efficiency factor, temperature effect factor, inverter efficiency factor, and charge controller efficiency factor. The inverter must be larger than the maximum power requirement. The required inverter size (
To find the number of inverters (
Smart inverters today can limit current spikes, meaning a higher capacity than Wp is unnecessary, but having larger inverters offers flexibility for future upgrades. The number of modules connected in parallel, or the array size (
Given that the
The total energy consumed per square meter is 1516.59 kWh/m2, which represents the energy consumed for materials, manufacturing, transportation, installation, and management [29]. The total area of the modules (Amodules) of the solar system is:
In this context,
The electricity generated (
here, 329.6 days per year indicates the annual count of sunny days.
For electrical generation, the CO2 emission rate stands at 0.707 kg of CO2 for every kWh produced. Reducing CO2 emissions refers to the amount of CO2 that is cut down as a result of the energy produced by the PV system. The yearly CO2 reduction can be calculated as Yearly CO2 Mitigation.
To find the total difference between CO2 emissions and CO2 reduction over the system’s lifespan of 30 years, we arrive at the net CO2 mitigation for the system [30].
Total consumption (19.438 kWh/day) in the hot summer season will be considered the basis for the following calculations.
Table 6 provides all the outcome results for the three proposed systems using the simulation program titled “How to Design a Solar PV System”.
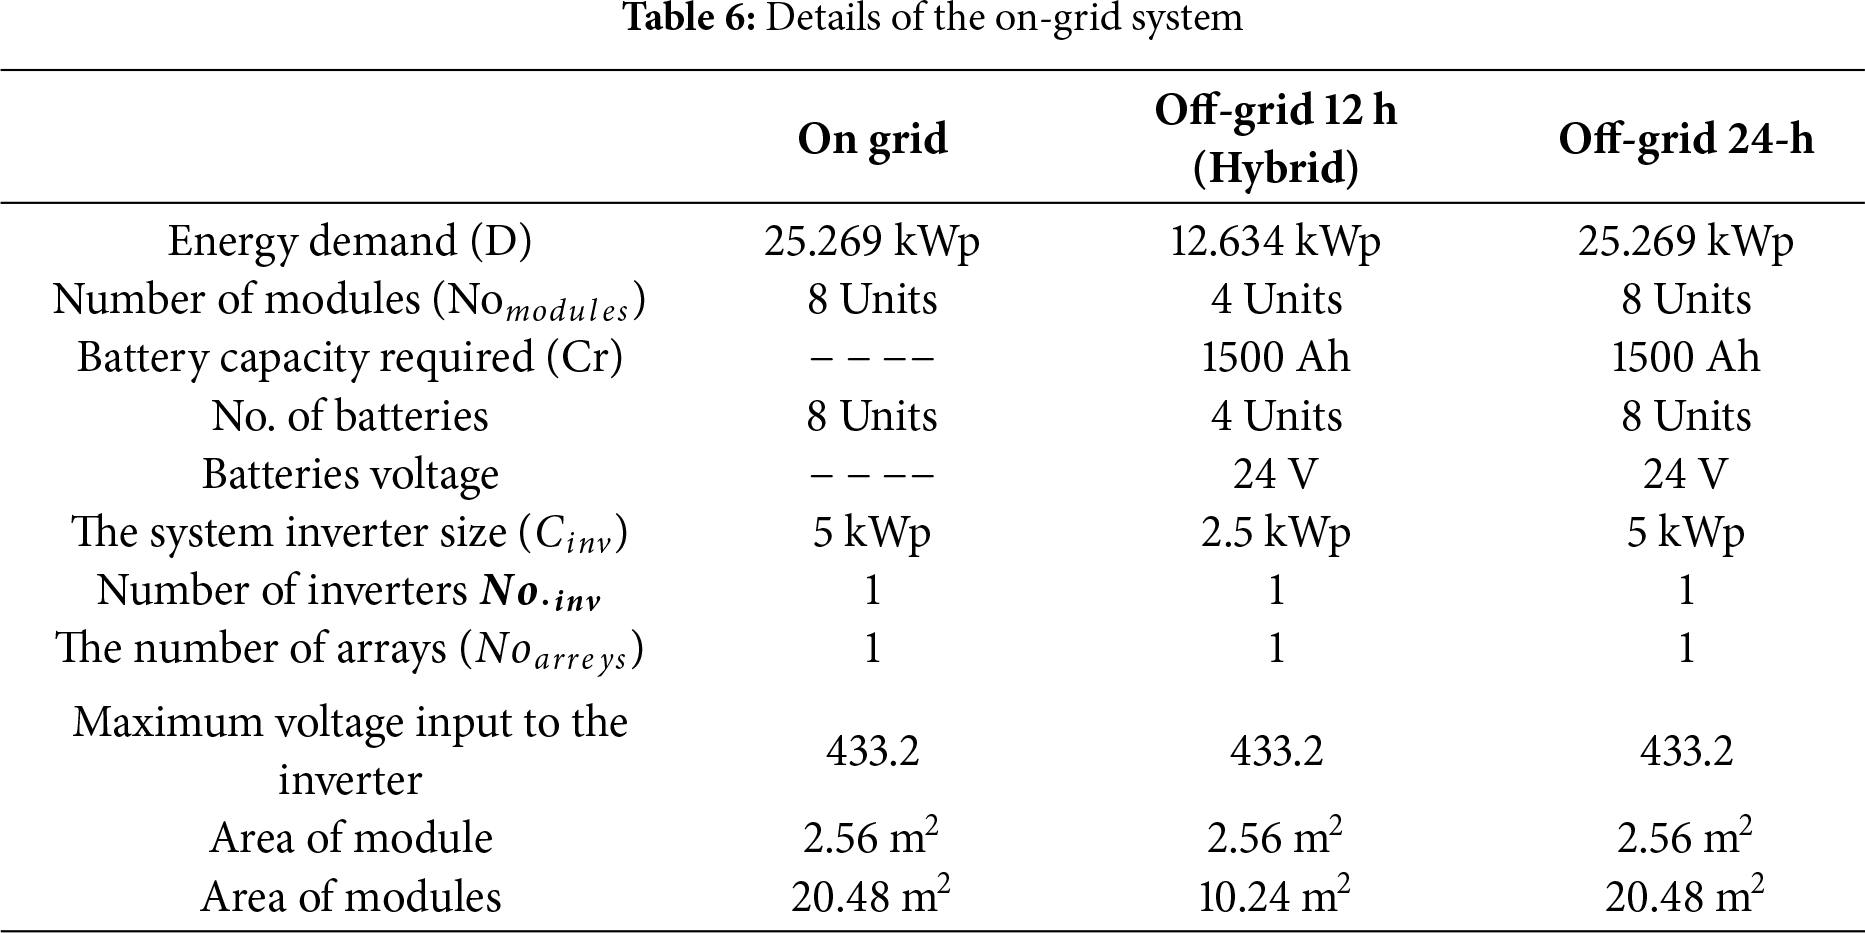
An on-grid electricity supply system is a good, economical option and makes the electric bills equal zero, but it is not popular because the clients paying for the system do not receive a 24-h electricity supply.
An off-grid electricity supply system provides electricity 24 h a day and is a good option for Iraqi conditions, but it is very expensive as the cost of batteries is high and requires a large area.
An off-grid 12-h (hybrid) system, which provides electricity 12 h a day with sharing the National grid to provide 24 h, is the optimal option for Iraqi conditions due to its lower cost.
Fig. 9 illustrates the differences between the three systems in terms of the number of modules, number of batteries, and the size of the system’s inverter. We note that the hybrid system is the least expensive and most practical, as electricity from the national grid is available at approximately 50%, and the price per kilowatt is cheaper than the price per kilowatt from the solar system.
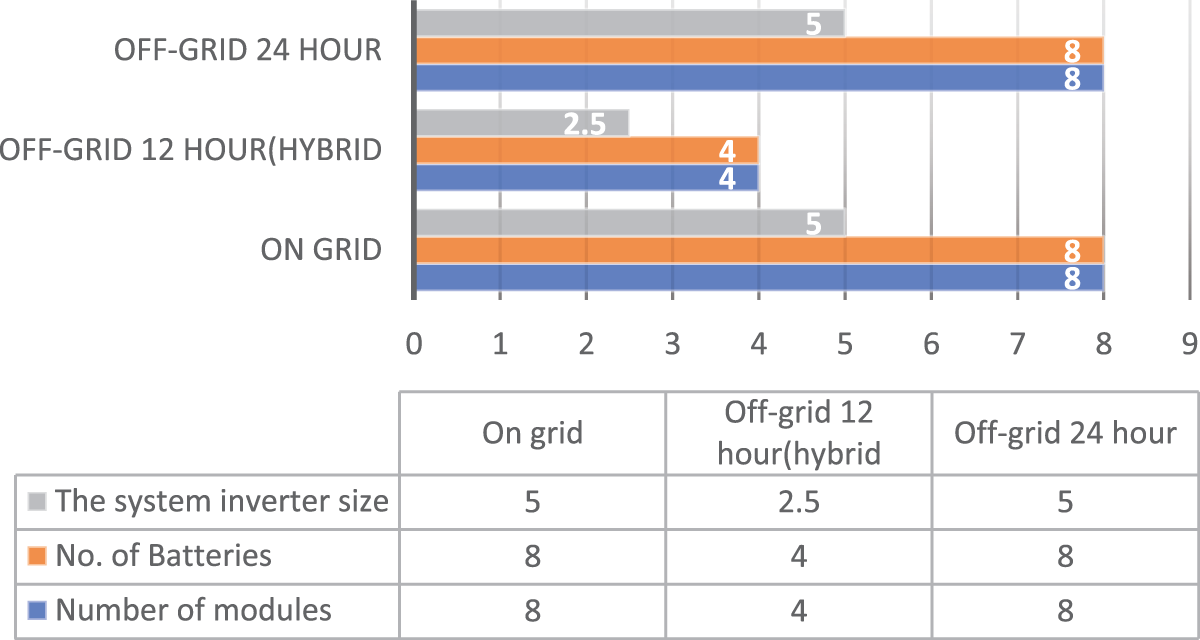
Figure 9: Comparison between the number of modules, the number of batteries, and the size of the system’s inverter for the three proposed systems
All three solar systems are equally efficient. The first on-grid system provides power to the national grid, reducing the electricity bill, but does not provide a full 24-h electricity supply. The capacity and size of the first system can vary depending on the customer’s preference. The second and third systems provide a full 24-h electricity supply, but the cost of the second system is half the capacity, size, and price of the third system. Table 7 shows the Array losses in the system using the program PV-syst.
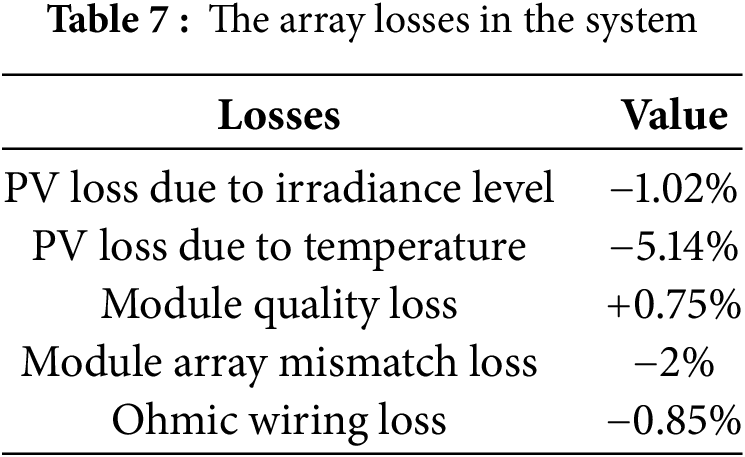
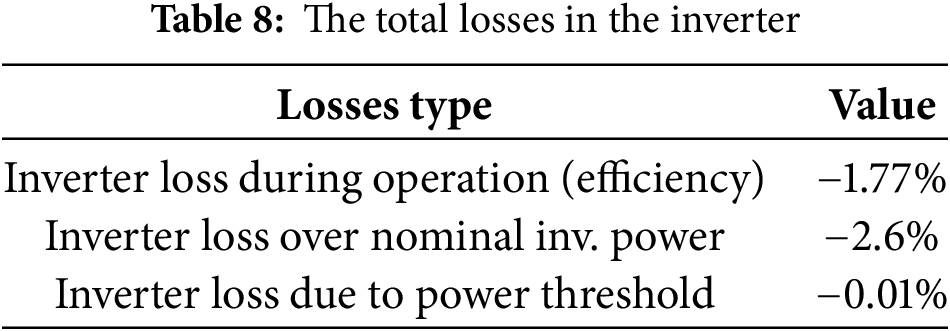
The table shows that heat losses, radiation level, and panel mismatches represent the largest percentage of losses. Heat losses can be addressed using various panel cooling methods, while radiation losses can be mitigated by tracking or additional reflectors. Table 8 shows the total losses in the system components using the program PV-syst.
The values of GlobHor and E-grid are listed in Fig. 10, which were found by the PV-syst program.
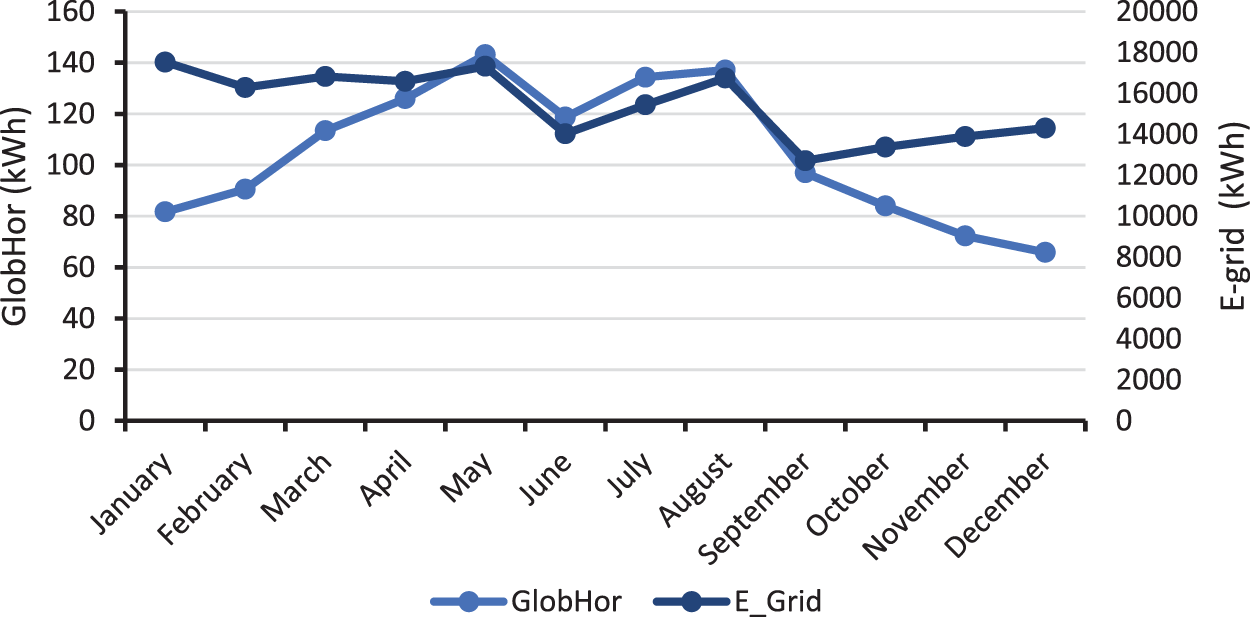
Figure 10: The value of GlobHor and E-grid
The efficiency of the system is better in winter than in summer due to the negative effect of heat on the solar cells, as shown in Fig. 11. System performance ratio declines due to high temperatures in the summer months, but the performance ratio improves in the winter.
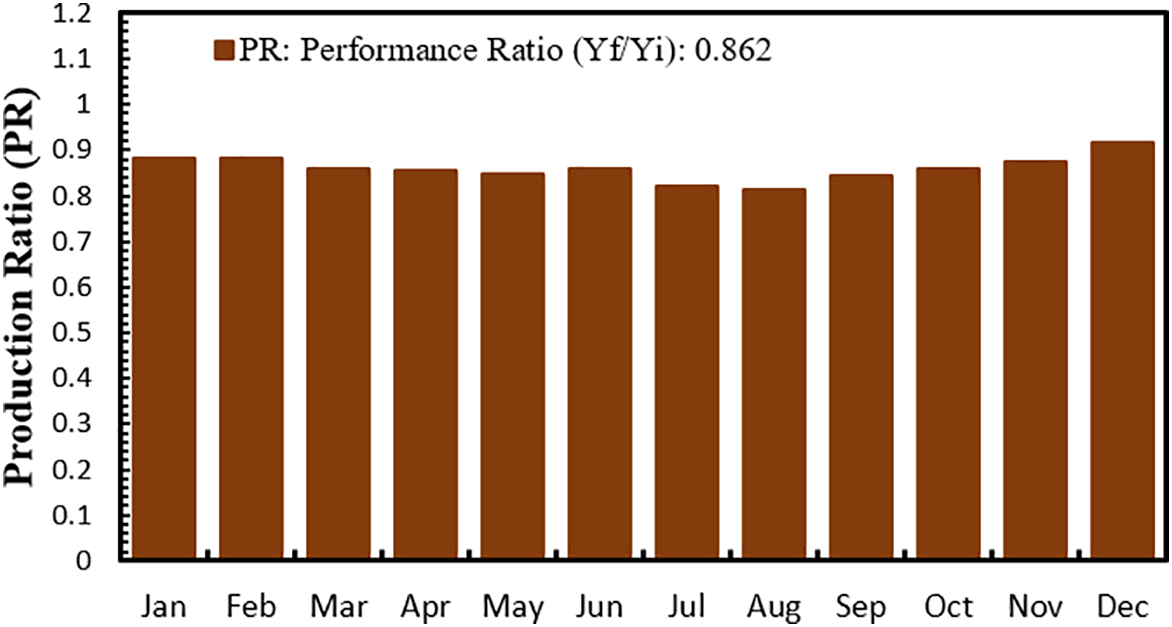
Figure 11: Yearly performance ratio for the system
The performance percentage (PR) indicates the viability and efficiency of the system and the suitability of the site for installing solar energy systems.
REICAL Application-Investment Indices is a renewable energy investment calculator developed by Integrated Solutions Experts Ltd. to analyze the feasibility of different types of renewable energy (RE) systems. The results of the economy evaluation are listed in Table 9. The system’s generation capacity, 4.74 kW, specifies its peak power output. The total system cost in the Iraqi market, which is the initial capital investment for the entire system, is 5000$. The Annual O&M estimates yearly operation and maintenance expenses at 250$. The Annual O&M increment percentage indicates a projected annual increase of 10% in these costs. The method for applying the annual increase in operation and maintenance costs is described by the Annual O&M increment model as “Fixed”. It is important to note that “Fixed” here likely signifies a constant percentage increase, not a constant dollar amount. The operation period (Yr) specifies the anticipated lifespan of the system, which is 20 years.
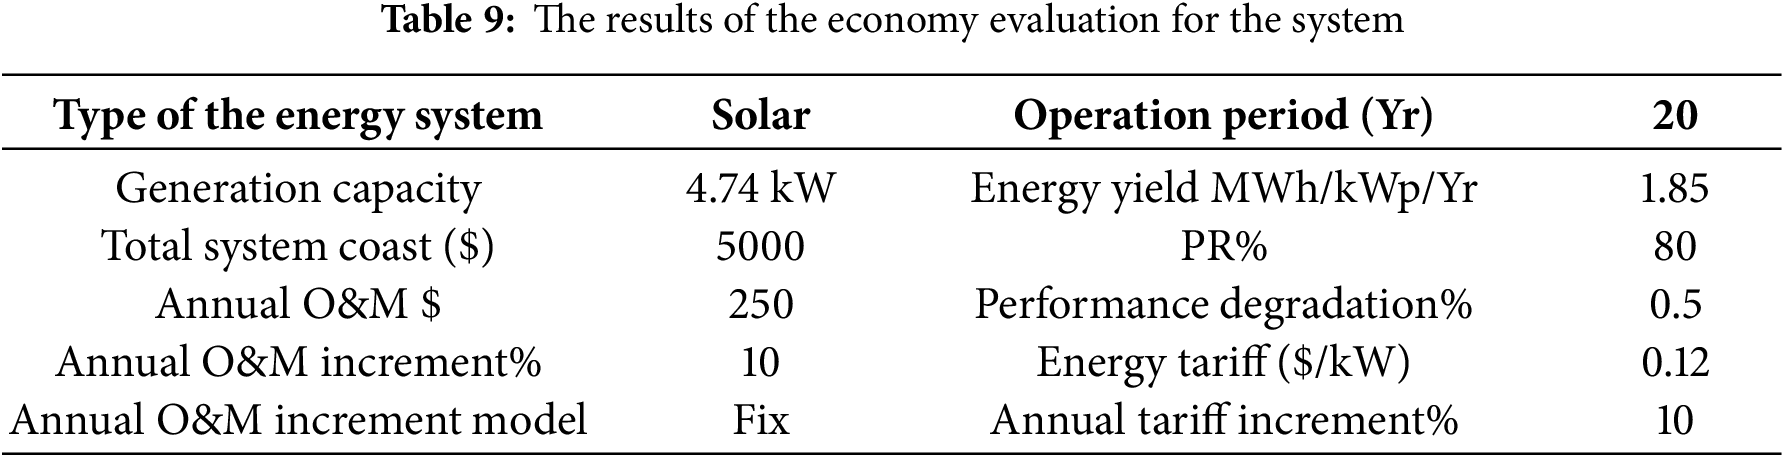
The Energy yield estimates the yearly energy output per unit of installed capacity at 1.85 (MWh/kWp/Yr). The system’s efficiency under real-world conditions, relative to ideal conditions, is represented by the Performance ratio of 86.2%. The Performance degradation estimates the yearly reduction in the system’s performance at 0.5%. The Energy tariff is the cost of electricity per kilowatt-hour, which is 0.12 $/kWh. The Annual tariff increment represents the anticipated annual percentage growth in this electricity price, at 10%. The Annual tariff increment model defines how this tariff increase is applied, noted as “Fixed”, likely signifying a fixed percentage increase.
The results of the economy evaluation of the system by (REICAL Renewable Energy Investment Calculator).
• Project Equity (%): The percentage of the total project cost that the investor or project owner will finance. Here, it is 25%.
• Project Debt (%): The percentage of the total project cost that a loan will finance. Here, it is 75% (100%−25%).
• Loan Duration (Yr): The period of time over which the loan will be repaid. Here, it is 5 years.
• Interest Rate (%): The percentage that will be calculated as interest on the loan amount annually. Here, it is 5%.
• Installation Model: Specifies how the loan repayment installments will be calculated. Here, it is defined as “Fixed Interest,” meaning that the interest amount paid in each installment may vary, while the loan principal paid remains fixed for a fixed installment.
• Compound Schedule: Specifies the period over which interest is accrued on the loan. Here, “monthly” means that interest is calculated and added to the outstanding balance each month.
• Installation Schedule: Specifies the period over which loan installments are paid. Here, “monthly” means monthly installments are paid to repay the loan principal and interest.
3.1.2 Administration Input Data
• Administration (%): The percentage of a given cost (usually total revenue or project cost) allocated to administration costs. Here, it is 0%.
• Insurance (%): The percentage to cover insurance costs related to the project. Here, it is 0%.
• Depreciation (%): The percentage of the asset’s value that is reduced annually to reflect wear and tear or obsolescence. Here, it is 0%.
• Inflation Rate (%): The rate at which general prices of goods and services are expected to rise annually. Here, it is 0%.
• First Year Production (kWh): An estimate of the amount of electricity the solar system will produce in the first year of operation. Here, it is 7400 kWh.
• Total Production (kWh): The total amount of electricity expected to be produced over the entire operating period (20 years), taking into account annual performance degradation. Here, it is approximately 141,176.71 kWh.
• Performance Ratio (%): This is repeated here and is 86.2%.
• First Year Revenue (%): The amount expected to be generated from selling the electricity produced in the first year. It is calculated by multiplying the first year’s production by the energy tariff. Here, it is $888 (7400 kWh × $0.12/kWh).
• Total revenue (Total project revenue): The total projected revenue over the entire operating period, taking into account annual tariff increases and performance degradation. Here, it is approximately $16,941.05.
• First-year net revenue (First year net revenue): The revenue generated in the first year, less the operating and maintenance costs for that year. Here, it is −$211 ($888 − $250 − $849 (first-year loan interest)).
• Total net revenue (Total net revenue): The total revenue over the operating period less the total operating and maintenance costs and other costs. Here, it is approximately $7695.4.
• Total O&M cost ($): The total projected operating and maintenance costs over the entire operating period, taking into account annual increases. Here, it is $5000.
• First-year administration cost ($): The expected management costs in the first year. Here, it is $0 due to the input management ratio of 0%.
• Total administration cost ($): The total expected management costs over the operating period. Here, it is $0.
• First-year insurance cost ($): The expected insurance costs in the first year. Here, it is $0 due to the input insurance ratio of 0%.
• Total insurance cost ($): The total expected insurance costs over the operating period. Here, it is $0.
• First-year tariff (/$kWh): This is repeated here and is 0.12 $/kWh.
• Debt ($): The total amount of the loan to be taken out to finance part of the project. Here, it is $3750 (75% of $5000).
• Loan ($): This appears to be a duplicate of the Debt amount, $4245, which is somewhat surprising since it should be the same as the initial loan amount. This could be a calculation or data display error.
• Total Interest ($): The total amount of interest expected to be paid on the loan over the repayment period. Here, it is $496.
• Installation ($): The expected monthly payment to repay the loan, including principal and interest. Here, it is $71.
• Principal ($): The original amount of the loan borrowed. Here, it is $0, which seems illogical because it should be equal to the initial debt amount at the start of the repayment period. This could be referring to the remaining principal balance at the end of a given period (perhaps after the first year if the data is annual).
• Project Equity ($): The cash amount the project owner will invest from their own funds. Here, it is $1250 (25% of $5000).
• Net Present Value (NPV) ($): The present value of all cash inflows (revenues) less the present value of all cash outflows (costs and investments) over the project’s life, discounted at a certain rate (usually the cost of capital). A positive NPV indicates that the project is profitable. Here, it is $6445, indicating the project’s profitability.
• Internal Rate of Return (IRR) (%): The discount rate that makes the project’s net present value zero. It is considered a measure of investment profitability; the higher it is, the more attractive the project. Here, it is 13.39%.
• Return on Investment (ROI) (%): A ratio that measures the profitability of an investment by comparing the net profit to the cost of the investment. Here, it is 5.16%.
• Profitability Index (PI): The ratio of the present value of cash inflows to the present value of cash outflows. A value greater than 1 indicates that the project is profitable. Here, it is 6.16.
• Payback Period (PP) (Yr): The length of time it takes for the project to recover the initial investment cost through the cash flows generated. Here, it is 5.85 years.
The total embodied energy (Eem), which reflects the energy used to create the system, amounts to 31059.76 kWh. Each year, the electricity produced, Eg, is 6406.8 kWh, and the average CO2 emissions due to the embodied energy of the PV system reach 21959.2 kg. The reduction in CO2 emissions achieved by the energy generated from the PV system is 4529.6 kg annually. Over the complete 30-year lifespan, the difference between CO2 emissions and CO2 mitigation results in a net CO2 reduction for the system of 132,810 kg.
The article is dedicated to the designing and testing of an off-grid solar photovoltaic (PV) system to supply electrical power to households in Baghdad, Iraq. With the help of the software How to Design Solar PV System, PV-syst simulation program, and economic analysis through the software REICAL (Version 1.1), three scenarios were considered to supply the entire electricity, where the 12-h off-grid (hybrid) system was chosen as the most cost-effective and appropriate to the local conditions.
The obtained outcomes demonstrate that the planned PV system with a capacity of 25.269 kWp and 8 modules, 8 batteries, and a 5 kW inverter generates about 141,176.71 kWh within 20 years, with the performance ratio amounting to 86.2%. The payback period is 5.85 years, and the system has good profitability indicators: net present value (NPV) of 6445, internal rate of return (IRR) of 13.39, ratio of returns on investment (ROI) of 5.16, and profitability index (PI) of 6.16. The system has a net CO2 reduction of 132,810 kg in the environment in its lifetime.
It has been suggested that similar off-grid PV systems should be encouraged in Iraq to eliminate overreliance on the unreliable grid, reduce the cost of electricity, and help cut CO2 emissions. The crucial design variables include energy demand (D) = 25.269 kWp, number of modules = 8, battery capacity required (Cr) = 1500 Ah, number of batteries = 8, inverter size (Cinv) = 5 kWp, and the ratio of system performance = 86.2%. This solution is a cost-effective, ecologically sustainable method of filling the electricity gap in Baghdad.
We recommend using solar PV to fill the gap in the equipment needed for full power, especially the 12-h off-grid (hybrid) solar system that complements the 24-h supply in conjunction with the national electricity grid.
Acknowledgement: The authors thank the Energy and Renewable Energies Technology Center at the University of Technology, Iraq, for providing the necessary resources and software to complete the study.
Funding Statement: The authors received no specific funding for this study.
Author Contributions: The authors confirm contribution to the paper as follows: Conceptualization, Fadhil M. Oleiwi and Jaber O. Dahloos; methodology, Hasanain A. Abdul Wahhab; software, Amer Resen Kalash; validation, Fadhil M. Oleiwi and Jaber O. Dahloos; formal analysis, Miqdam T. Chaichan; investigation, Miqdam T. Chaichan; resources, Hasanain A. Abdul Wahhab; data curation, Fadhil M. Oleiwi and Jaber O. Dahloos; writing—original draft preparation, Miqdam T. Chaichan; writing—review and editing, Fadhil M. Oleiwi; visualization, Amer Resen Kalash; supervision, Miqdam T. Chaichan. All authors reviewed the results and approved the final version of the manuscript.
Availability of Data and Materials: Data available on request from the authors. The data that support the findings of this study are available from the corresponding author, Miqdam T. Chaichan, upon request.
Ethics Approval: The study does not include human or animal subjects.
Conflicts of Interest: The authors declare no conflicts of interest to report regarding the present study.
Nomenclature
| BL | Life of a Battery (Year) |
| Cb | Battery Capacity (Ah) |
| Cr | Battery Capacity (Ah) |
| Cinv | Required inverter size (kW) |
| DOD | Depth of Discharge (%) |
| D | Energy demand (kW) |
| Eb | Electricity generated (kW) |
| Lmodule | Module area (m2) |
| Er | energy requirement (kW) |
| Ls | system losses (%) |
| Pmax | maximum output power (kW) |
| Vb | Nominal Voltage (V) |
| Wp | the module’s power output (kW) |
| Winv | Inverter rated power (kW) |
| ηb | Battery Efficiency (%) |
| ηele | Electrical efficiency (%) |
References
1. Busch S, Kasdorp R, Koolen D, Mercier A, Spooner M. The development of renewable energy in the electricity market. Vol. 187. Utrecht, The Netherlands: Utrecht University Repository; 2023. [Google Scholar]
2. Al-Kayiem HH, Mohammad ST. Potential of renewable energy resources with an emphasis on solar power in Iraq: an outlook. Resources. 2019;8(1):42. doi:10.3390/resources8010042. [Google Scholar] [CrossRef]
3. Oleiwi FM, Hameed JS, Dahloos JOD. Design and feasibility study of a stand-alone home PV solar system in Baghdad climate. Iraqi J Sci. 2024;65:160–74. doi:10.24996/ijs.2024.65.1.15. [Google Scholar] [CrossRef]
4. Navothna B, Thotakura S. Analysis on large-scale solar PV plant energy performance–loss–degradation in coastal climates of India. Front Energy Res. 2022;10:857948. doi:10.3389/fenrg.2022.857948. [Google Scholar] [CrossRef]
5. Wang F, Li R, Zhao G, Xia D, Wang W. Simulation test of 50 MW grid-connected “Photovoltaic + Energy storage” system based on pvsyst software. Results Eng. 2024;22(2):102331. doi:10.1016/j.rineng.2024.102331. [Google Scholar] [CrossRef]
6. Al-Waeli AHA, Kazem HA, Yousif JH, Chaichan MT, Sopian K. Mathematical and neural network models for predicting the electrical performance of a PV/T system. Int J Energy Res. 2019;43(14):8100–17. doi:10.1002/er.4807. [Google Scholar] [CrossRef]
7. Mishra PR, Rathore S, Jain V. PVSyst enabled real time evaluation of grid connected solar photovoltaic system. Int J Inf Technol. 2024;16(2):745–52. doi:10.1007/s41870-023-01677-x. [Google Scholar] [CrossRef]
8. Ahmad Dost Mohammadi S, Gezegin C. Design and simulation of grid-connected solar PV system using PVSYST, PVGIS and HOMER software. Int J Pioneer Technol Eng. 2022;1(1):36–41. doi:10.56158/jpte.2022.24.1.01. [Google Scholar] [CrossRef]
9. Kumar PM, Karthick A, Kaliappan S, Muhibbullah M. Investigation of concentrated semitransparent photovoltaic system for hot and humid climatic conditions. Int J Photoenergy. 2025;2025(1):1321921. doi:10.1155/ijph/1321921. [Google Scholar] [CrossRef]
10. Chahtou A, Lounis M, Boudjelthia EAK, Belhaouas N. Environmental influences on photovoltaic module performance along the Mediterranean coast: analyzing the impact of temperature, wind, and humidity. In: Technological and Innovative Progress in Renewable Energy Systems: Proceedings of the 2024 International Renewable Energy Days (IREN Days' 2024). Berlin/Heidelberg, Germany: Springer; 2025. p. 17–22. doi:10.1007/978-3-031-71926-4_3. [Google Scholar] [CrossRef]
11. Ebhota WS, Tabakov P. Influence of cabling on photovoltaic system performance: wire length, diameter, and material. Kurd J Appl Res. 2025;10(1):50–65. doi:10.24017/science.2025.1.4. [Google Scholar] [CrossRef]
12. Kazem HA, Chaichan MT, Al-Waeli AHA, Sopian K. A novel model and experimental validation of dust impact on grid-connected photovoltaic system performance in Northern Oman. Sol Energy. 2020;206(4):564–78. doi:10.1016/j.solener.2020.06.043. [Google Scholar] [CrossRef]
13. Asghar F, Hussain MI, Alshahrani FA, Akhtar MI, Amjad W, Shahzad M, et al. Technoeconomic analysis of standalone hybrid renewable energy systems for telecommunication sector under different climatic conditions in Saudi Arabia. Energy Rep. 2024;11(2):4067–84. doi:10.1016/j.egyr.2024.03.055. [Google Scholar] [CrossRef]
14. Aissi T, Nefraoui A, Kandoussi K, Elotmani R, Monkade M, Abouelmahjoub Y. The impact of dust on the efficiency of various photovoltaic panels: an experimental study. Sol Energy Adv. 2025;5(1):100106. doi:10.1016/j.seja.2025.100106. [Google Scholar] [CrossRef]
15. Hassan Q, Algburi S, Sameen AZ, Salman HM, Jaszczur M. Implications of strategic photovoltaic deployment on regional electricity self-sufficiency by 2050: a case study in Iraq. Renew Energy Focus. 2023;46(9):338–55. doi:10.1016/j.ref.2023.07.007. [Google Scholar] [CrossRef]
16. Al Essa MJM. Energy assessments of a photovoltaic-wind-battery system for residential appliances in Iraq. J Energy Storage. 2023;59(8):106514. doi:10.1016/j.est.2022.106514. [Google Scholar] [CrossRef]
17. Hu S, Liu W, Wen H, Liu Z, Huang W. Numerical simulation of dust deposition on photovoltaic module surface based on multifactor fusion deposition mechanism. Sci Total Environ. 2025;959(5):178327. doi:10.1016/j.scitotenv.2024.178327. [Google Scholar] [PubMed] [CrossRef]
18. Wan L, Zhao L, Xu W, Guo F, Jiang X. Dust deposition on the photovoltaic panel: a comprehensive survey on mechanisms, effects, mathematical modeling, cleaning methods, and monitoring systems. Sol Energy. 2024;268(1):112300. doi:10.1016/j.solener.2023.112300. [Google Scholar] [CrossRef]
19. Salim HA, Rashed JR. Feasibility study of off-grid rural electrification in Iraq: a case study of the AL-Teeb area. Iraqi J Electr Electron Eng. 2025;21(1):251–63. doi:10.37917/ijeee.21.1.24. [Google Scholar] [CrossRef]
20. Daabo AM, Zubeer S, Ismaeel H, Mustafa F, Hamzah H, Basem A, et al. A novel economic and technical dispatch model for household photovoltaic system considering energy storage system in Duhok City/Iraq as a case study. J Energy Storage. 2024;94:112440. doi:10.1016/j.est.2024.112440. [Google Scholar] [CrossRef]
21. Qasim MA, Yaqoob SJ, Bajaj M, Blazek V, Obed AA. Techno-economic optimization of hybrid power systems for sustainable energy in remote communities of Iraq. Res Eng. 2025;25(1):104283. doi:10.1016/j.rineng.2025.104283. [Google Scholar] [CrossRef]
22. Mohammed GA, Saleh AAM, Khalifa AHN. Reduction of electric power consumption by solar assisted space heating system in Mosul City-Iraq. Int J Thermofluids. 2025;26(3):101071. doi:10.1016/j.ijft.2025.101071. [Google Scholar] [CrossRef]
23. Al-Shohani WAM, Khaleel AJ, Dakkama HJ, Ahmed AQ. Optimum tilt angle of the photovoltaic modules in Baghdad. Iraq Appl Sol Energy. 2022;58(4):517–25. doi:10.3103/s0003701x22040028. [Google Scholar] [CrossRef]
24. González-Acevedo H, Muñoz-Maldonado Y, Ospino-Castro A, Serrano J, Atencio A, Saavedra CJ. Design and performance evaluation of a solar tracking panel of single axis in Colombia. Int J Electr Comput Eng IJECE. 2021;11(4):2889. doi:10.11591/ijece.v11i4.pp2889-2898. [Google Scholar] [CrossRef]
25. Farahat A, Labban AH, Mashat AS, Hasanean HM, Kambezidis HD. Status of solar-energy adoption in GCC, Yemen, Iraq, and Jordan: challenges and carbon-footprint analysis. Clean Technol. 2024;6(2):700–31. doi:10.3390/cleantechnol6020036. [Google Scholar] [CrossRef]
26. The yearly rate of electric supplement in Iraq. [cited 2025 Nov 19]. Available from: https://moelc.gov.iq/?page=2879%20Iraqi%20Ministry%20of%20Electricity. [Google Scholar]
27. Sohani A, Pierro M, Moser D, Cornaro C. Comparison of physical models for bifacial PV power estimation. Energy Convers Manag. 2025;327:119515. doi:10.1016/j.enconman.2025.119515. [Google Scholar] [CrossRef]
28. LEONICS. How to Design Solar PV System [Internet]. [cited 2025 Nov 19]. Available from: https://www.leonics.com/support/article2_12j/articles2_12j_en.php. [Google Scholar]
29. Awadh SM, Al-Mimar H. Iraqi oil: a summary overview from discovery to export. In: The geography of Iraq. Berlin/Heidelberg, Germany: Springer; 2024. p. 333–45. doi:10.1007/978-3-031-71356-9_15. [Google Scholar] [CrossRef]
30. Havrysh V, Kalinichenko A, Mentel G, Mentel U, Vasbieva DG. Husk energy supply systems for sunflower oil mills. Energies. 2020;13(2):361. doi:10.3390/en13020361. [Google Scholar] [CrossRef]
Cite This Article
 Copyright © 2026 The Author(s). Published by Tech Science Press.
This work is licensed under a Creative Commons Attribution 4.0 International License , which permits unrestricted use, distribution, and reproduction in any medium, provided the original work is properly cited.
 Downloads
 Citation Tools