
 Submit a Paper
 Propose a Special lssue
 Open Access
ARTICLE

Analysis of Geometrical Arrangement and Packing Material on Heat Generation in Lithium-Ion Battery Banks
1 Sustainable Energy Engineering Department, Tikrit University, Tikrit, 34001, Iraq
2 Electromechanical Engineering Department, University of Samarra, Samarra, 34010, Iraq
3 Mechanical Engineering Department, Tikrit University, Tikrit, 34001, Iraq
* Corresponding Author: Shaymaa Husham Abdulmalek. Email:
(This article belongs to the Special Issue: Advancements in Energy Resources and Their Processes, Systems, Materials and Policies for Affordable Energy Sustainability)
Energy Engineering 2026, 123(2), 25 https://doi.org/10.32604/ee.2025.073940
Received 29 September 2025; Accepted 18 December 2025; Issue published 27 January 2026
 View Full Text
 Download PDF
Abstract
Operating Lithium-ion batteries at their temperature limits is a challenging design task due to explosion risk at high temperatures and rapid degradation at low temperatures. Depending on the battery package design, those risks can be solved with passive solutions, which require no active cooling or heating. The current work aims to optimize the pack design and materials of the type-NCR18650B battery based on a wide range of operation temperature. The lower limit was denoted by cold case while the maximum limit was expressed by hot case. A combined analytical-numerical approach was developed to model the heat generation inside the battery. A thermal resistance analysis was used to determine the boundary conditions of the numerical model. The governing differential equations for the 1-D heat generation model were solved analytically. The numerical analysis was considered to determine the best battery pack design based on material parameters, number of batteries, and geometrical arrangement. The analytical results revealed that the cold case can be selected as the worst case and the best model was obtained using the hexagonal-shaped 10-battery pack that was covered with Delrin of 1.8 mm in thickness. The numerical results showed that the best model was the hexagonal-shaped 10-battery pack with Delrin of 2 mm in thickness that achieved the largest temperature of −20.6°C in the cold case.Keywords
Nomenclature
| Symbol | Difinition |
| Cp | Specific heat (J/kg∙K) |
| d, D | Daimeter (m) |
| h | Heat transfer coefficient (W/m2·K) |
| H | Battery height (m) |
| I | Current amper (mA) |
| k | Thermal conductivity (W/m∙K) |
| Ė | Energy rate (mWh) |
| Heat transfer rate (W) | |
| r | Radial; Radius (m) |
| R | Thermal resistance (°C/W) |
| t | Battery thickness (m) |
| T | Temperature (°C) |
| V | Voltage (V) |
| gen | Generated |
| tot. | Total |
| s | Surface |
| w | Wall |
| Greek Symbols | |
| Δ | Difference (-) |
| ρ | Density (kg/m3) |
| θ | Temperature gradient (K) |
| Subscripts | |
| amb | Ambient |
| B | Battery |
| cond | Conduction |
| cont | Contact |
| conv | Convection |
| equiv | Equivalent |
| Abbreviations | |
| ABTMS | Active battery thermal management system |
| a, b, c | Boundary conditions |
| Al | Aluninum |
| CFD | Computational fluid dynamics |
| CPCM | Composite phase change material |
| D. | Dimention |
| EV | Electric vehicles |
| FDD | Fault detection and diagnosis |
| FHP | Flat heat pipe |
| HEV | Hybrid Electric Vehicle |
| LIBs | Lithium-ion batteries |
| max | Maximum |
| Mc | Monte Carlo |
| Mil | Military |
| min | Minimum |
| SOC | System-On-Chip |
| SR | Silicon rubber |
| Std | Standard |
| TR | Thermal runaway |
The lithium-ion battery (LIB) is difficult to utilize in numerous applications due to the limited range of working conditions and discharge temperature. The thermal variations induce substantial changes in both the material’s structural form and intrinsic characteristics [1,2]. This makes the design of batteries forms a real challenge against safety problems such as the explosions. A MIL-STD-810 (G) is a military standard that tests the durability of smartphones in extreme atmospheric conditions. This type is tested using two methods, 501.5 and 502.5, to determine the suitable working temperature range, with tailoring to geographical conditions considered in the product life cycle [3,4]. In some types, the temperature was selected to be −20°C to 40°C as shown in Fig. 1, while the discharge operating temperature ranged from −20°C to 60°C as illustrated in Fig. 2 [5]. Satisfying the heat generation ranges of the LIB can be achieved by using it in cold conditions. In contrast, it is unsuitable in hot conditions due to poor insulation. Fig. 1 illustrates a clear positive correlation between ambient temperature and total energy outcome, with energy growing steadily from about 2550 mWh at 0°C to a peak of around 3350 mWh at 55°C. The polynomial fitting equation (with R2 = 1) confirms the strong dependency of energy output on temperature.
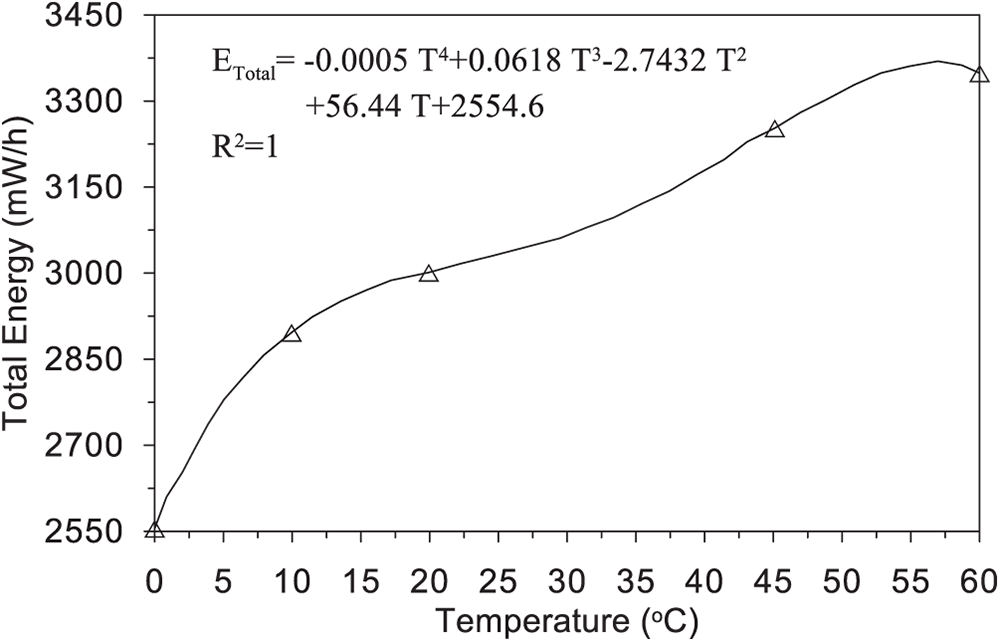
Figure 1: Energy rate vs. ambient temperature [3]
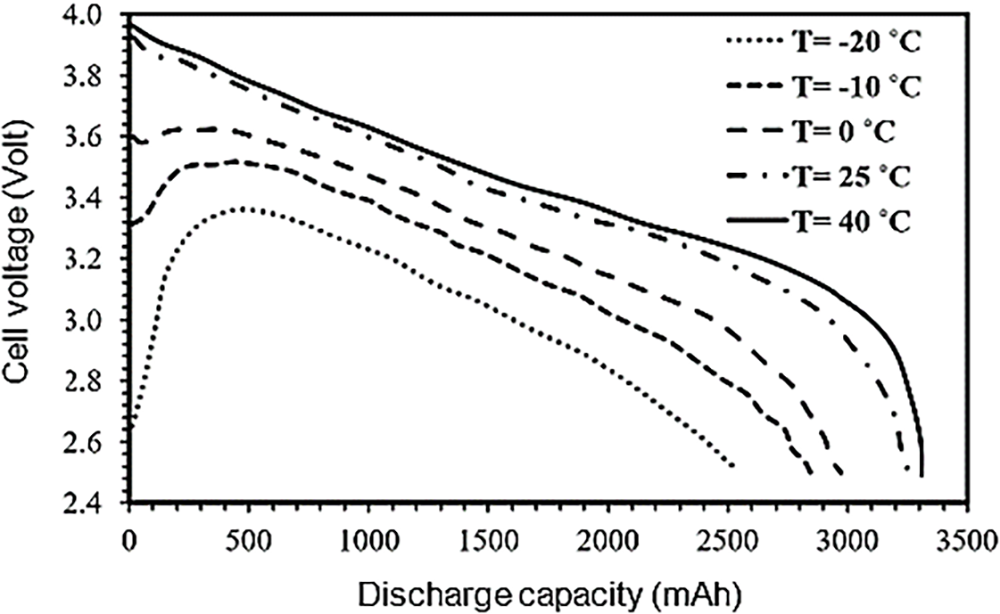
Figure 2: Discharge temperature characteristics for a typical high-power NCR18650B battery [3]
Fig. 2 shows the discharge voltage profiles at various ambient temperatures as observed. Higher temperatures (25°C and 40°C) resulted in higher discharge voltages and longer durations before voltage droped significantly, indicating enhanced electrochemical performance. In contrast, at sub-zero temperatures (e.g., −20 and −10°C), the battery displayed lower voltage levels and reduced discharge capacity, reflecting limitations in ion mobility and internal resistance under cold conditions.
The depletion of global oil resources, coupled with efforts to reduce carbon dioxide emissions, has made the development of sustainable energy storage systems such in EVs/HEVs and solar power techniques a priority [2,6], which will be considered a major issue for the future. Therefore, the battery has been used to provide optimal performance by supplying power to the EV/HEV during the driving operation. Consequently, the LIB technology globally used in electronic applications was designated as the best candidate due to its higher energy density and lower self-discharge [7]. Hence, the thermal management of lithium-ion batteries plays a crucial role in determining battery life and safety. Additionally, accurate heat generation calculation and low battery heat generation can alleviate the complexity of battery thermal management [8].
Lithium-ion batteries, one of the most widely used energy storage units, are now found everywhere due to their high energy density, high power output, low self-discharge rate, and minimal memory effect. Nevertheless, these advancements also have some counterparts, potentially causing a thermal runaway (TR) phenomenon due to their lower thermal stability [9,10]. Due to varying energy demands, battery cells are typically arranged in series or in parallel to function as a battery pack or a battery system. Angelo [7] adopted a theoretical and numerical approach to consider the battery thermal management systems (BTMS). A one-dimensional computational model was developed by combining the thermal circuit with the thermal model of the heat pipe. This model was validated by comparing its results with those obtained analytically, based on variable separation and numerical results from a three-dimensional CFD simulation. As a result, the one-dimensional computational model was considered sufficient to represent the temperature distribution in BTMS using heat pipes at 27.6°C.
The effect of changing the State of Charge (SOC) parameter of electrodes on the reversal heat and ohmic heat was investigated numerically and analytically by Chen et al. [8]. A numerical study was conducted using a thermo-electrochemical model to determine which components have the greatest impact on the three components of heat generation. Additionally, the effects of the highest active material concentration and the solid radius on the polarisation heat in lithium-ion batteries were discussed. It was demonstrated that reducing heat generation during the charging process increases the reversal endothermic time. Then, Li et al. [9] investigated the internal heat of the battery experimentally and numerically by using a three-dimensional CFD model of a house. The results revealed that an increase in battery current causes rising heat dissipation to the environment, leading to a 2.93% temperature increase. Additionally, combining BTMS with a composite phase change material (CPCM), a flat heat pipe (FHP), and a cooling liquid was considered analytically by Xin et al. [11]. Three BTMS configurations were evaluated: CPCM alone, CPCM with aluminium thermal sheets, and CPCM combined with flat heat pipes (FHP) and cooling liquid. Using the orthogonal method, the study found that the CPCM–FHP–liquid combination most effectively reduced maximum battery temperature by lowering liquid temperature and increasing cooling tube count. This setup enabled the battery to achieve a 2°C charge rate at an ambient temperature of 37°C. Hence, Chen et al. [12] utilised the Bernardi model alongside a cooling system to analyse the effect of reversible heat on EV battery pack performance, with results validated experimentally and numerically under real-world conditions. Similarly, Xun et al. [13] examined the thermal behaviour of cylindrical and flat plate LIB models during discharge using both analytical and numerical methods. Changing the size and number of cooling channels-while maintaining a constant volume ratio-had no impact on the battery’s average temperature; however, larger channels improved cooling efficiency, albeit with uneven temperature distribution. To enhance thermal management, Son and Du [14] introduced a fault detection and diagnosis (FDD) algorithm that effectively identified defects in LIBs through a two-step approach, outperforming Monte Carlo simulations. Yang and Cao [15] examined the role of interfacial thermal resistance in heat generation and dissipation using steady-state and transient methods. Their findings indicated that the flash diffusivity method in the transient case provided the highest thermal conductivity accuracy in both cross-plane and in-plane directions.
Additionally, the thermal behaviour of lithium iron phosphate (LiFePO4) batteries contributes to an improved understanding of their temperature response under various conditions. Ismail et al. [16] developed a MATLAB model to predict battery temperature under constant ambient conditions, showing good agreement with manufacturer data. The increasing demand for portable electronics has led to the development of various LIB types with differing thermal behaviours. Budget batteries typically produce more heat and operate less efficiently due to higher internal impedance [17]. Thermal abuse conditions further impact performance depending on the state of charge (SoC), with deep discharge posing the highest risk of failure [18]. Despite broad applications, efficient Battery Thermal Management Systems (BTMS) remain essential to maintain performance and safety. Enhancing cycle life-a key performance metric-can be achieved using thermoelectric coolers (TECs), which significantly improve thermal regulation [19–21]. Optimal BTMS design requires careful consideration of thermochemical properties and operational temperature ranges. Villano et al. [22] addressed this by analysing the specific heat capacities of lithium polymer batteries.
The preceding analysis of literatures emhasise the importance of temperature regulation, where maintaining optimal thermal conditions can significantly enhance battery efficiency, energy output, and discharge behaviour. Therefore, good thermal management is crucial in battery applications that operate across a wide range of temperatures. However, limited researches were focused on the integrated optimisation of battery pack design. Accordingly, the main contributions of this study are:
• adopted a combined analytical and numerical approach to optimise the NCR18650B battery pack, considering cell count, material parameters, and geometric configuration across a wide temperature range.
• This study combined one-dimensional analytical thermal resistance models with three-dimensional numerical simulations to achieve both computational efficiency and detailed thermal analysis. The one-dimensional model offers fast initial evaluation, while the three-dimensional simulations capture complex heat transfer and spatial temperature distribution. This hybrid approach ensures accurate and efficient thermal optimisation of the battery pack.
• The analysis was considered two conditions (hot and cold) boundary conditions that leads to a decision of the safer design; which suits those conditions.
In this work, a battery pack is presented with different models aimed at determining the best design based on material parameters, the number of batteries, and geometrical arrangement. The parameters associated with the material include using the battery pack’s cover materials, using filler material to increase conduction among batteries, using an aluminium base, and using a fire-proof insulator. Table 1 presents the type, location, and thickness of material parameters under study. The physical models of the battery pack structure and the number of batteries considered are illustrated in Fig. 3a–c for nine batteries, 10 batteries, and a single battery, respectively.
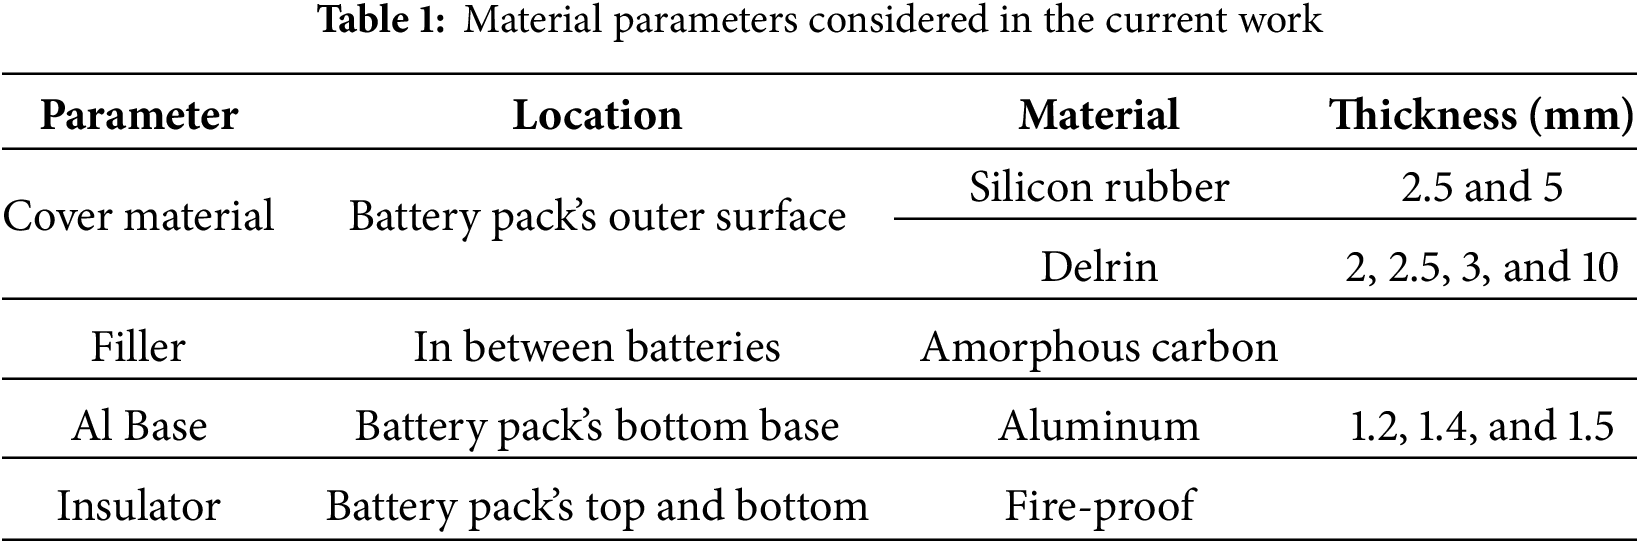
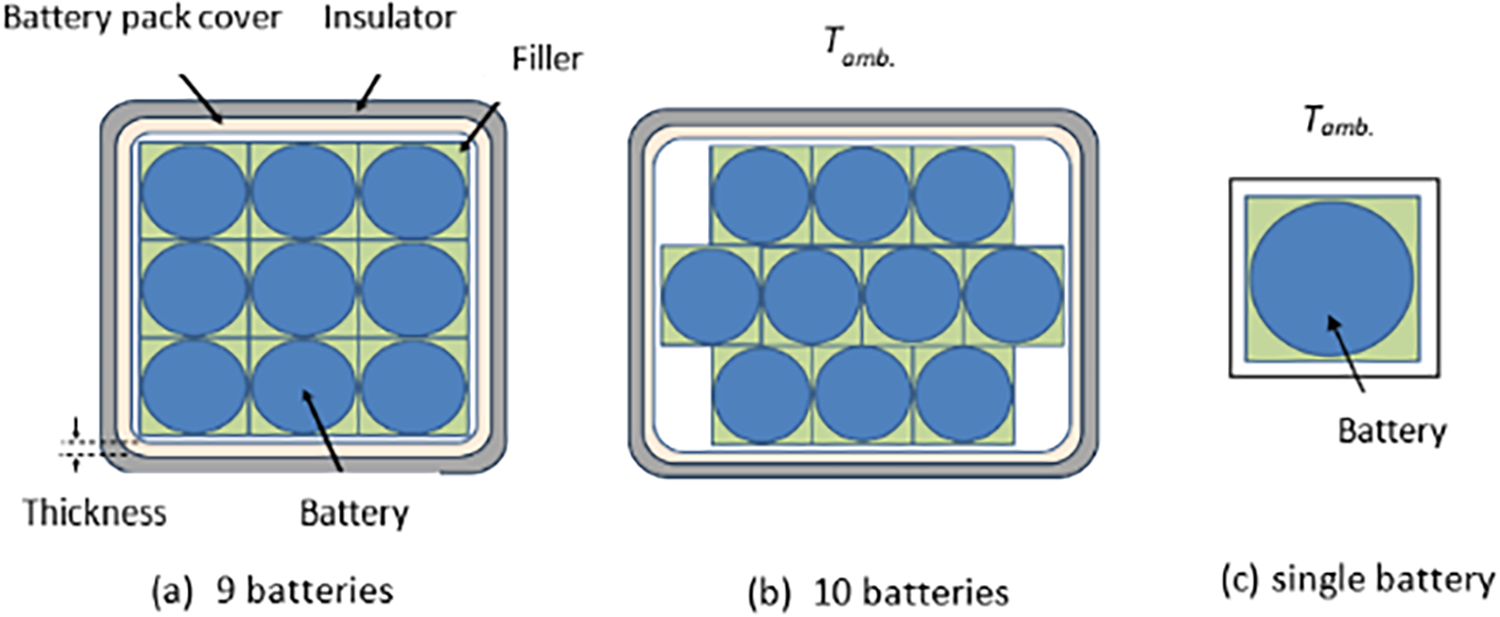
Figure 3: Physical model of NCR18650B battery pack with (a) 9 batteries and (b) 10 batteries, and (c) a single battery
Inside the pack, the batteries are surrounded by filler material, which is covered by a pack cover of a specific thickness and then by an external layer of insulator. The pack arrangement models of rectangular and hexagonal shapes for 9 and 10 batteries studied in the work are shown in Fig. 4. Four different configurations have been simulated and analysed, namely, Pack-A, Pack-B, Pack-C, and Pack-D.
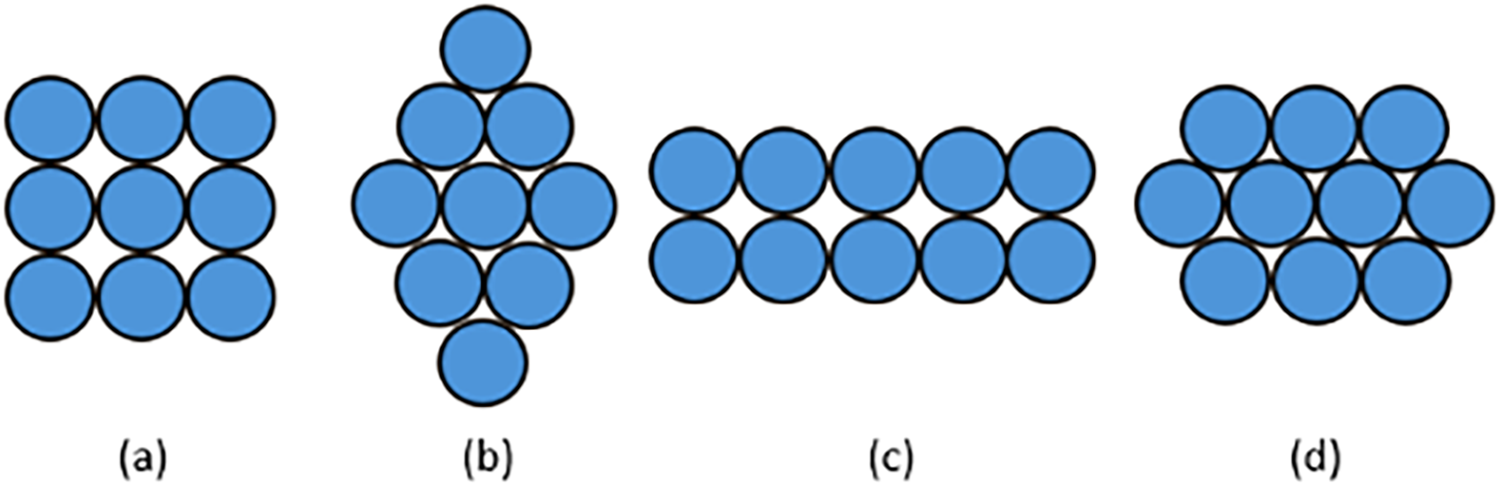
Figure 4: Considered cases of battery arrangement in the pack with (a) Pack-A: 9 batteries, rectangular shape, (b) Pack-B: 9 batteries, optimized shape, (c) Pack-C: 10 batteries, rectangular shape, and (d) Pack-D: 10 batteries, hexagonal shape
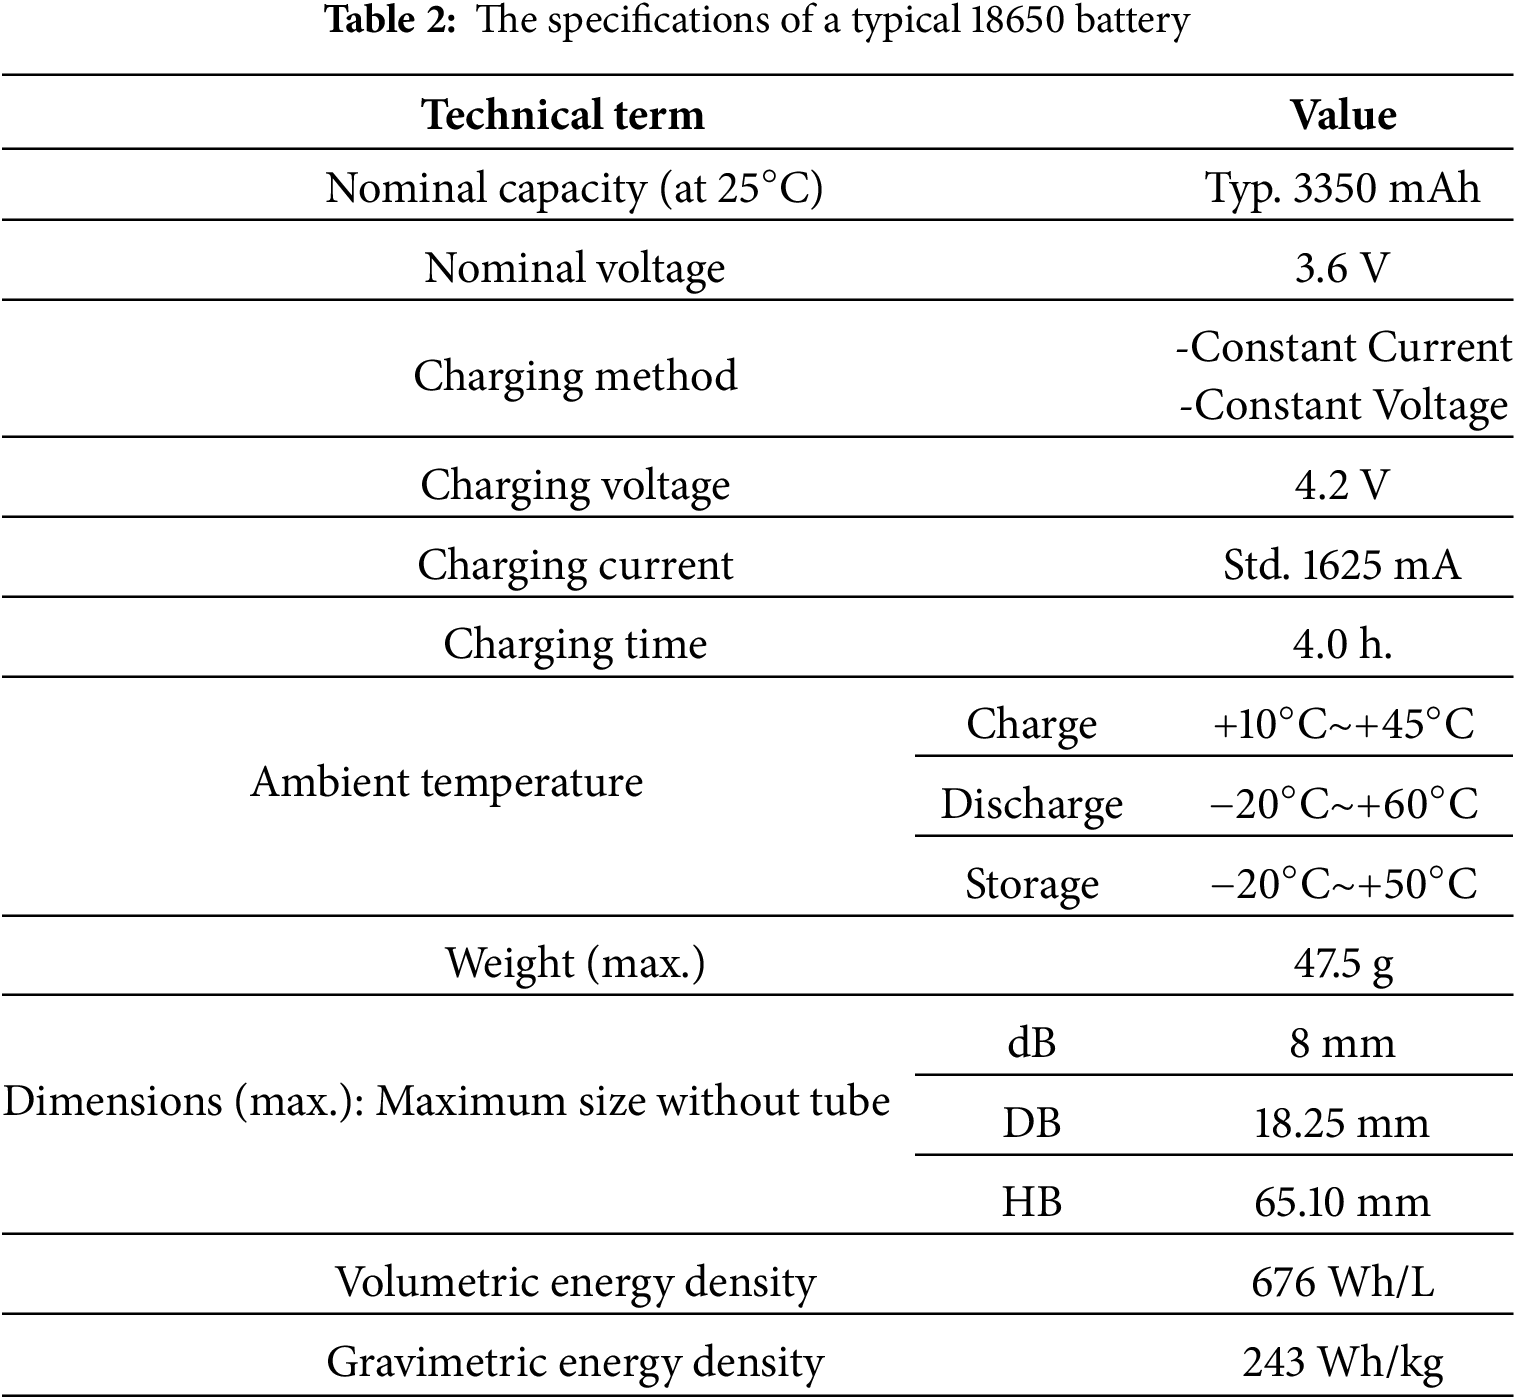
To obtain the relationship between the temperature and battery power, the datasheet of the NCR18650B battery was used to find the exact relation [23]. In other words, the power-temperature curve fitting was determined (refer to Fig. 1). There are certain assumptions necessary to model the battery that are necessary to achieve meaningful results. Firstly, the 18650 battery, as given in its name, is 18 mm in diameter and 65 mm long, while the zero indicates its cylindrical shape, as depicted in Fig. 5 [5]. Secondly, the axial conductivity of the battery is 30 W/m·K, and the heat capacity is 1700 J/kg·K (Jiang et al., 2023). Thirdly, assume the battery’s power supply is constant, which is sufficient for the system and the heat generated by the battery. Finally, assume an identical charge level for each battery in all models. Table 2 [5] lists the specifications of typical NCR18650B battery while Table 3 shows its material properties which are the density, specific heat capacity and thermal conductivity of Filler material, silicon rubber [24,25], fire-proof insulator [26], aluminium [27], copper [28], Delrin [29], 18650 cell material [30], the axial and radial properties of 18650 battery [31,32].
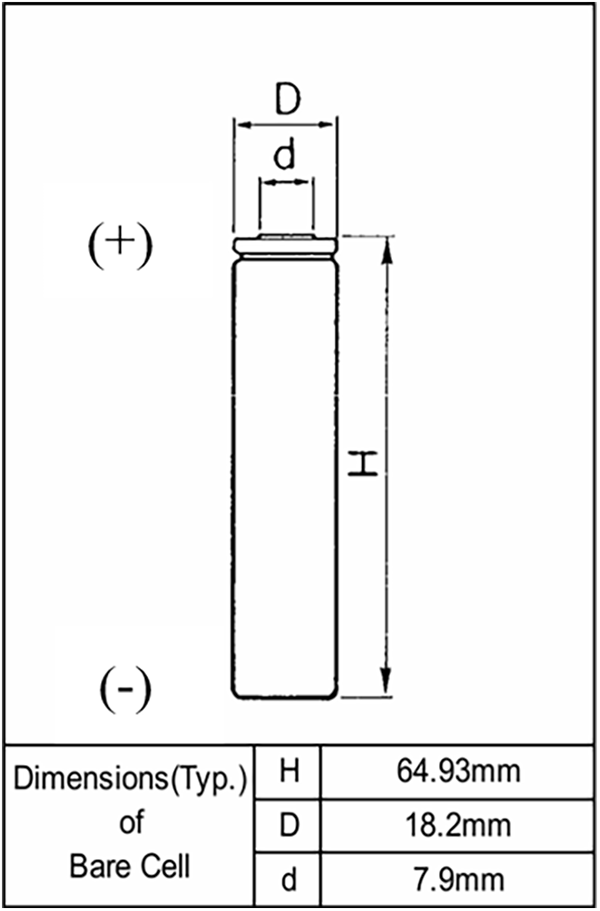
Figure 5: Battery NCR18650B dimensions

3 Thermal Resistance Network Analysis
As referred to in the introduction part, the working temperature range of the battery is −20°C to 60°C. However, the operational conditions were chosen as −30°C to 45°C, in the worst-case scenario, to select the optimum battery pack design for cold weather conditions. The case study of the battery was divided into two parts. Firstly, studying the effect of the cold side (negative pole) temperature that ranged between −20°C and −30°C as a boundary condition. Secondly, considering the impact of the hot side (positive pole), the temperature ranged from 45°C to 60°C as a boundary condition. A one-dimensional (1D) analytical approach to thermal resistance in the battery was adopted for both cold and hot cases. However, the system was assumed to be a single combined battery with a constant total output power of 1.5 W. Then, the thermal resistance analysis was used to determine the boundary conditions of the numerical model for the combined single battery (see Fig. 3c) for both cold and hot cases. Next, the output heat can be determined by using Fourier’s law as a function of thermal resistance and temperature difference [33] as given by the following equation;
The temperature operating range of the battery is crucial for saving the battery life cycle. In intense conditions such as excessive heat in summer or cold in winter, the possibility of battery damage during the operation is very likely. In other words, rising temperature leads to battery life reduction while diminishing the temperature out of the operating range leads to the battery forfeiting the working capacity. In a cold case at −20°C battery temperature and −30°C ambient condition, it is expected that the coldest point of the battery occurs on the surface due to internal heat generation. Therefore, the thermal resistance calculation is analyzed from the surface to the ambient. The thermal resistance network of cold case is demonstrated in Fig. 6a. The total thermal resistance (Rtot) can be determined by the sum of contact thermal resistance (Rcont), conduction thermal resistance (Rcond), and convection thermal resistance (Rconv) [34]. The total resistance in the cold case, which was about 6.67°C/W can be calculated by using Eqs. (2)–(5) [9,34]. Next, the hot case is operated between 45°C to 60°C due to heat generation since the hottest point occurs in the axis of the battery. Accordingly, the 1-D analytical approach adopted to calculate the thermal resistance of the battery in hot case can be started from the battery middle to the ambient as shown in Fig. 6b. However, in the hot case, there is one more resistance which is battery resistance (RB), which can be computed by Ohm’s Law as given by Eq. (6). Subsequently, the resistance analogy was applied for the hot case to calculate the equivalent thermal resistance (Requiv) that has been computed by Eq. (7) approximately 10°C/W [12]. The conduction thermal resistance is given by;
where t = 64 mm and k = 30 W/m·K. The contact thermal resistance is defined as;
where
where
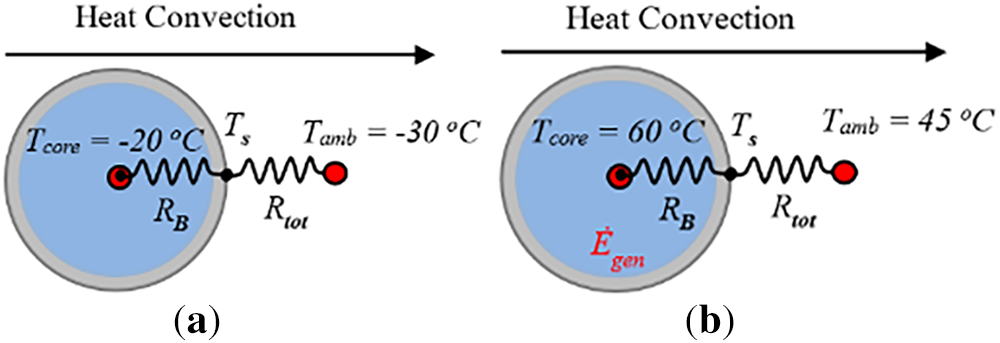
Figure 6: One-dimensional resistance network of (a) cold side (Negative pole) and (b) hot side (Positive pole)
The internal resistance of the battery is calculated by Ohm’s law as follows;
The equivalent resistance then can be determined as;
As a result of these thermal resistance calculations, the relation between total resistance and battery resistance has been deduced. According to this relation, the following conditions have been achieved [7,13];
Accordingly, the worst case of the battery will be determined between hot and cold conditions, depending on the battery’s thermal resistance. When the battery resistance is lower than 3.33°C/W, batteries will be protected from overheating. However, the cold side will be more severe. On the other hand, if the battery thermal resistance is higher than the limit, the hot side will be more dangerous, and it may experience an overheating risk.
4 Numerical and Analytical Modelling
A three-dimensional (3D) numerical approach was employed to investigate the thermal performance of the NCR18650B battery pack by varying material parameters, the number of batteries, and the geometrical arrangement. This analysis aims to determine the optimal model that yields the best temperature range for enhancing the battery life cycle. Boundary conditions are defined as a 3-D model that includes ambient temperatures of −30°C for the cold case and 45°C for the hot case, respectively. Steady-state thermal analysis was performed to determine the cold and hot battery regions. Temperature contours on the battery surface were analysed to determine the lowest temperature in the battery pack under cold ambient conditions.
On the other hand, the maximum temperature is also analysed numerically at the central axis of the battery, where heat is generated for hot ambient conditions. Next, a numerical and analytical solution approach, along with the key design, can be achieved in this study by following specific procedures. The procedure steps are investigated by developing a resistance network and obtaining an analytical solution. At room temperature, the required number of batteries to provide 60 Wh of energy is eight. However, due to low-temperature degradation, the design options are simulated with 9 and 10 batteries rather than 8. Then, determine the number of batteries required for 40-h operational conditions under the worst-case temperature scenario.
Additionally, design the insulator to allow for the discharge of the battery within a specified temperature range, thereby preventing overheating of the battery. The battery life under normal conditions can be known. Thus, the one-dimensional analysis constraint is not working due to the internal heat generation in the battery. However, the one-dimensional analysis can be used to solve the constraints analysis of the battery. The limitation of the temperature difference between hot and cold conditions is approximately 5°C, calculated between the surface and axis battery positions for cold and hot conditions, respectively. If the temperature difference in the battery is less than 5°C, the hot conditions are less severe on the battery working than the cold conditions in all design options. Therefore, the 1-D battery model was solved analytically by studying the 1-D heat generation model of the infinite cylinder with finite length. Hence, the basic heat conduction law can be written by following the equations [35];
where
By performing the derivative in the first term of Eq. (8), the temperature behaviour through the battery is given as;
Defining the temperature difference (θ) between any point in the cylinder and its wall as;
The boundary conditions using the temperature difference become;
By using the temperature difference, Eq. (9) can be written as;
The solution of this equation gives the following parabola equation;
Applying boundary conditions given by;
The solution obtained is given as;
By deriving Eq. (12) twice, the following equation is obtained. To solve the non-homogeneous part (in this case, “a” remaining a constant) by solving the differential Eqs. (13) and (14) to get;
So, the solution is given as;
Then, at r = 0, the temperature difference between the battery center and its wall is determined by;
As a result of θ < 5°C, the cold case was selected as the worst case for testing the optimum design.
5.1 Analytical Approach Results
The analytical results of battery temperature at different cover thicknesses for the cold case are illustrated in Fig. 7. The results are obtained for 9 and 10 batteries with different materials, aluminium and Delrin. Since this analysis is for a cold case, the higher the temperature, the more optimal the conditions (material, battery number, and thickness) are.
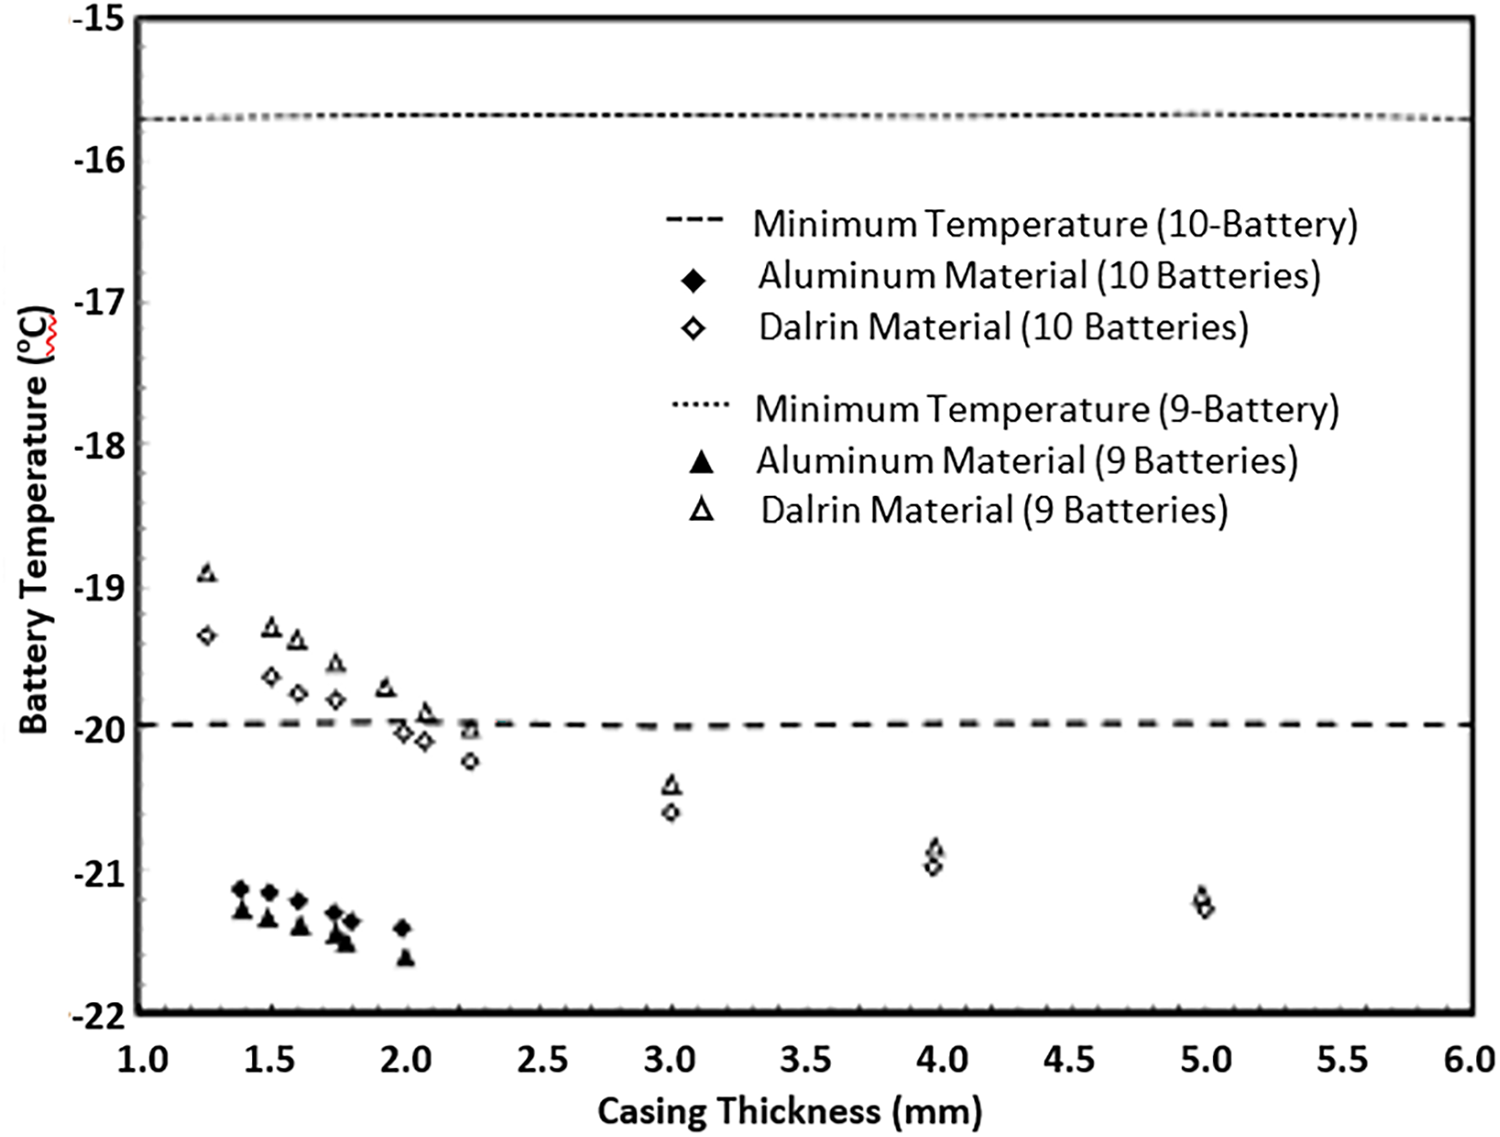
Figure 7: The effect of casing thickness on battery temperature
The maximum limit of cold-case battery temperature was achieved for a 9-battery pack covered with Delrin, and it was approximately −15.7°C. On the other hand, the 10-battery pack has achieved the minimum battery temperature limit of approximately −20°C when using Delrin. It can be deduced that the best model is obtained using a hexagonal-shaped battery pack covered with Delrin of 1.8 mm in thickness. Although the 1-D analytical method is insufficient for estimating the accurate battery temperature, it helps to understand the worst-case condition, which is crucial for determining the main design features of the battery pack. Since the 1-D solutions for different design models are the same, it is not possible to compare different design options in 1D. Therefore, numerical analysis has been adopted to obtain more detailed information about the optimum configuration of the battery pack.
5.2 Numerical Analysis Results of a 9-Battery Pack
For a 9-battery pack, Fig. 8a–d shows the numerical results of different models: base case, base case with filler material, base case with 2.5 mm rubber, and base case with shape optimisation for cold and hot cases. The results of the maximum temperature achieved for both hot and cold cases were 53.7°C and −21.34°C, respectively, for the base case compared to the other cases. This is because the reference model (base case) did not contain any improvement by adding other materials such as amorphous carbon filler, Silicon rubber, Fire-proof insulator, aluminium base, and Delrin. In conclusion, the thermal performance of the 9-battery pack has not exceeded the allowable maximum limit of 54°C. However, the results obtained for cold conditions show a deficiency in the operation temperature, which has fallen below the minimum accepted limit of −15.7°C.
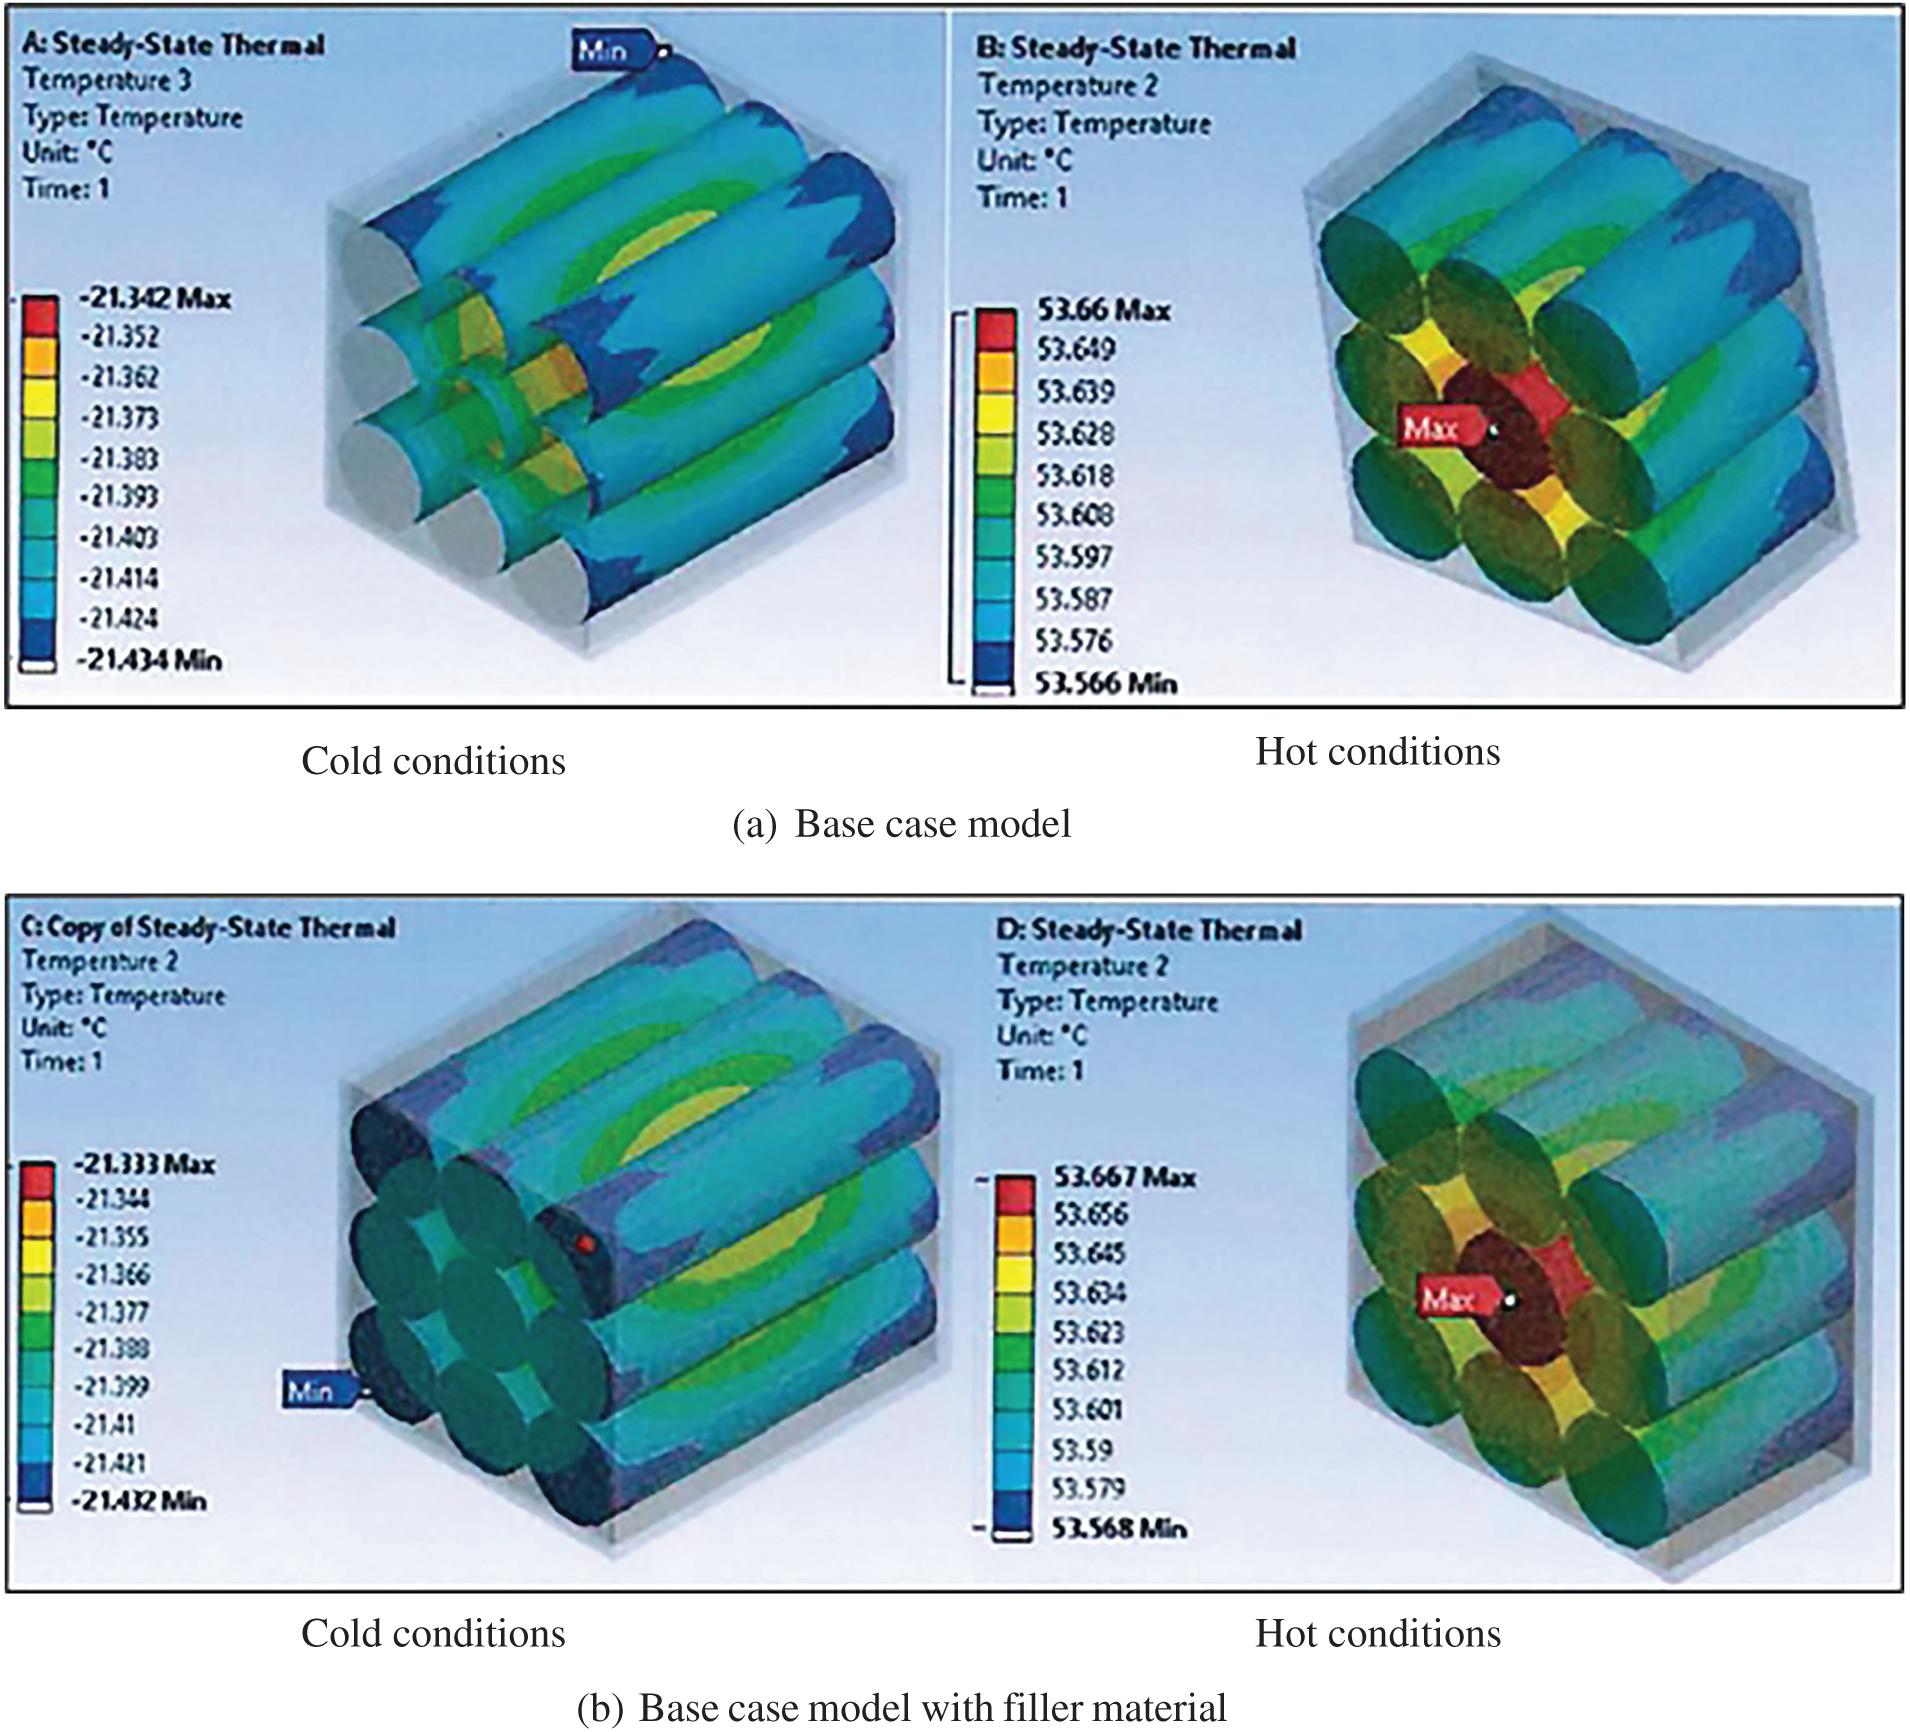
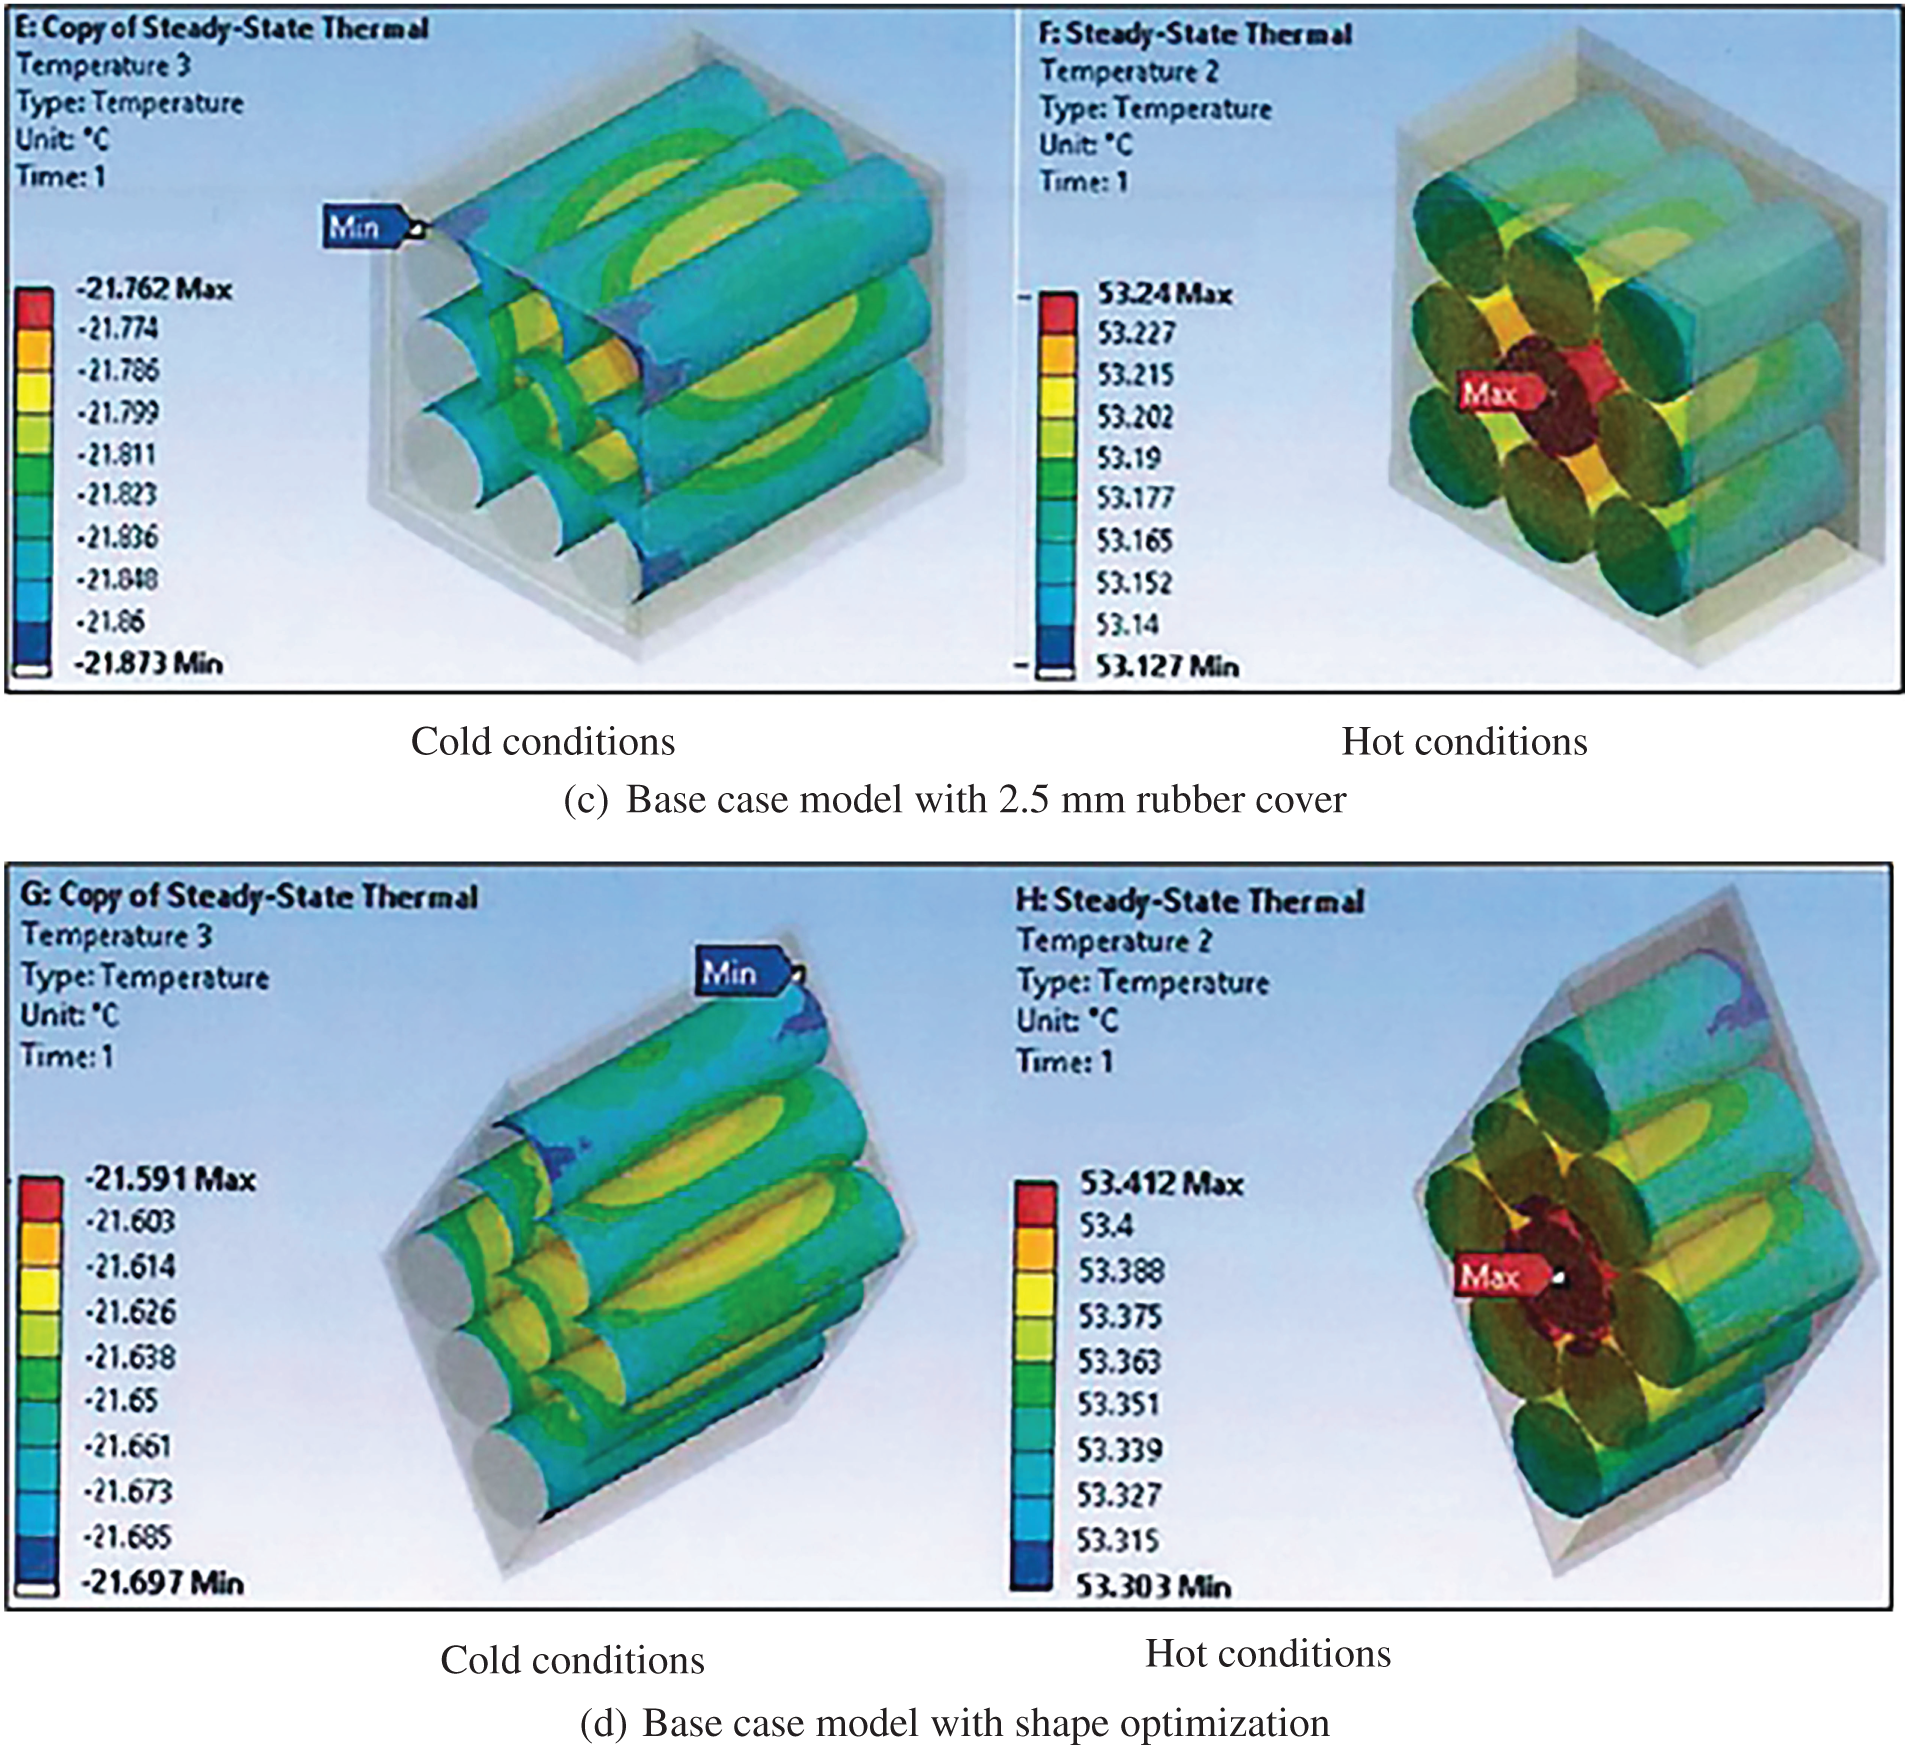
Figure 8: Temperature distribution of the 9-battery pack for (a) the base case model, (b) the base case model with filler material, (c) the base case model with a 2.5 mm rubber cover, and (d) the base case model with shape optimization
5.3 Numerical Analysis Results of a 10-Battery Pack Conventional Arrangement
For 10-batteries pack, Fig. 9a–f depicts the numerical results at cold and hot conditions of the base case with 1.2 mm Al base thickness, 1.4 mm Al base thickness, 1.5 mm Al base thickness with fire-proof insulator Al, 2.5 mm rubber and 1.5 mm Al base, 5 mm rubber with 1.5 mm Al base, and filler material with 1.4 mm Al base, respectively. The results showed that using an aluminium base with a thickness of 1.5 mm, along with top and bottom insulators (Fig. 9c), produces the highest temperatures of 52.81°C and −22.2°C in hot and cold conditions, respectively, compared to other models. This is attributed to the aluminium material having the largest specific heat and thermal conductivity (see Table 3). The insulator reduces heat dissipation from the battery to the environment, leading to increased battery temperature in both cold and hot cases. In the context of the operation temperature range, the same scenario with a 9-battery pack has been repeated with a 10-battery pack. The hot solutions were below 53°C, which meets the requirements, while this was not the case with cold cases, which have exceeded the temperature limit of −15.7°C. In the base case with filler material, the temperature comparison between the 9 and 10 batteries, shown in Figs. 8b and 9f show a hot and cold trend for each case. The results illustrated that the lowest temperature achieved for 10 batteries was −22.45°C, compared to −52.55°C for the nine batteries. This is because the cold case temperature for the 10 batteries was very close to the battery temperature range of the 9-battery model.
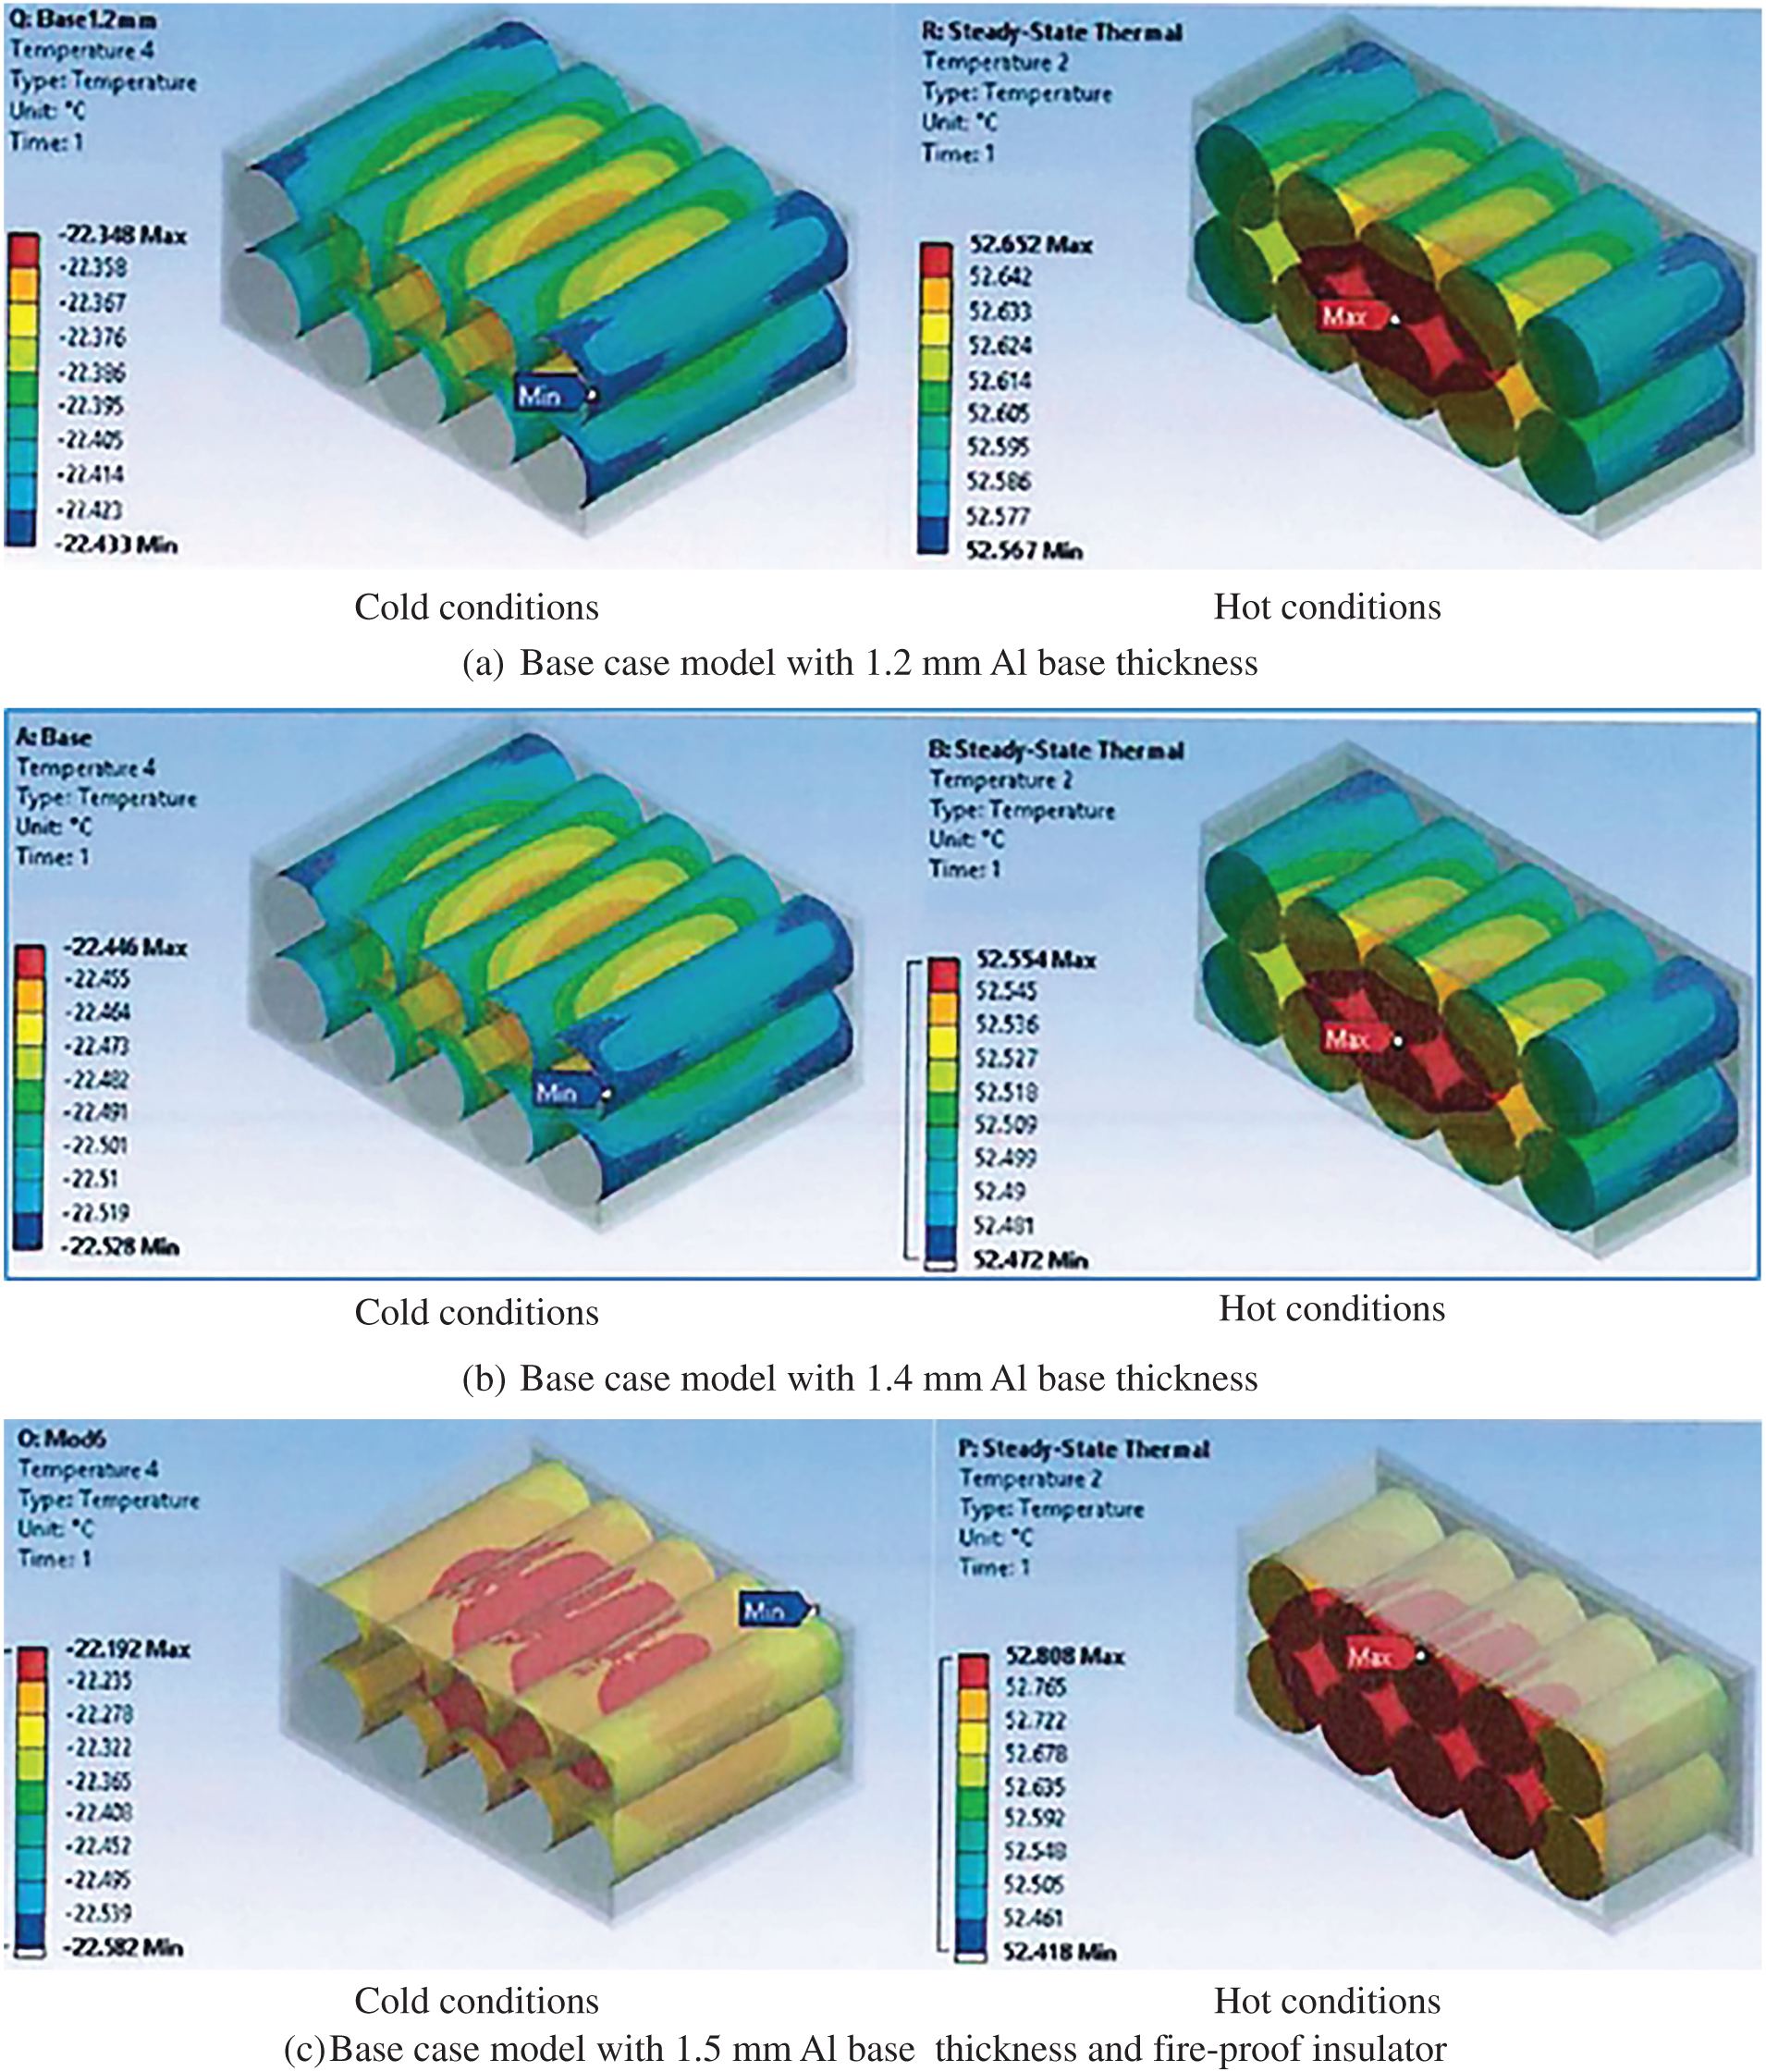
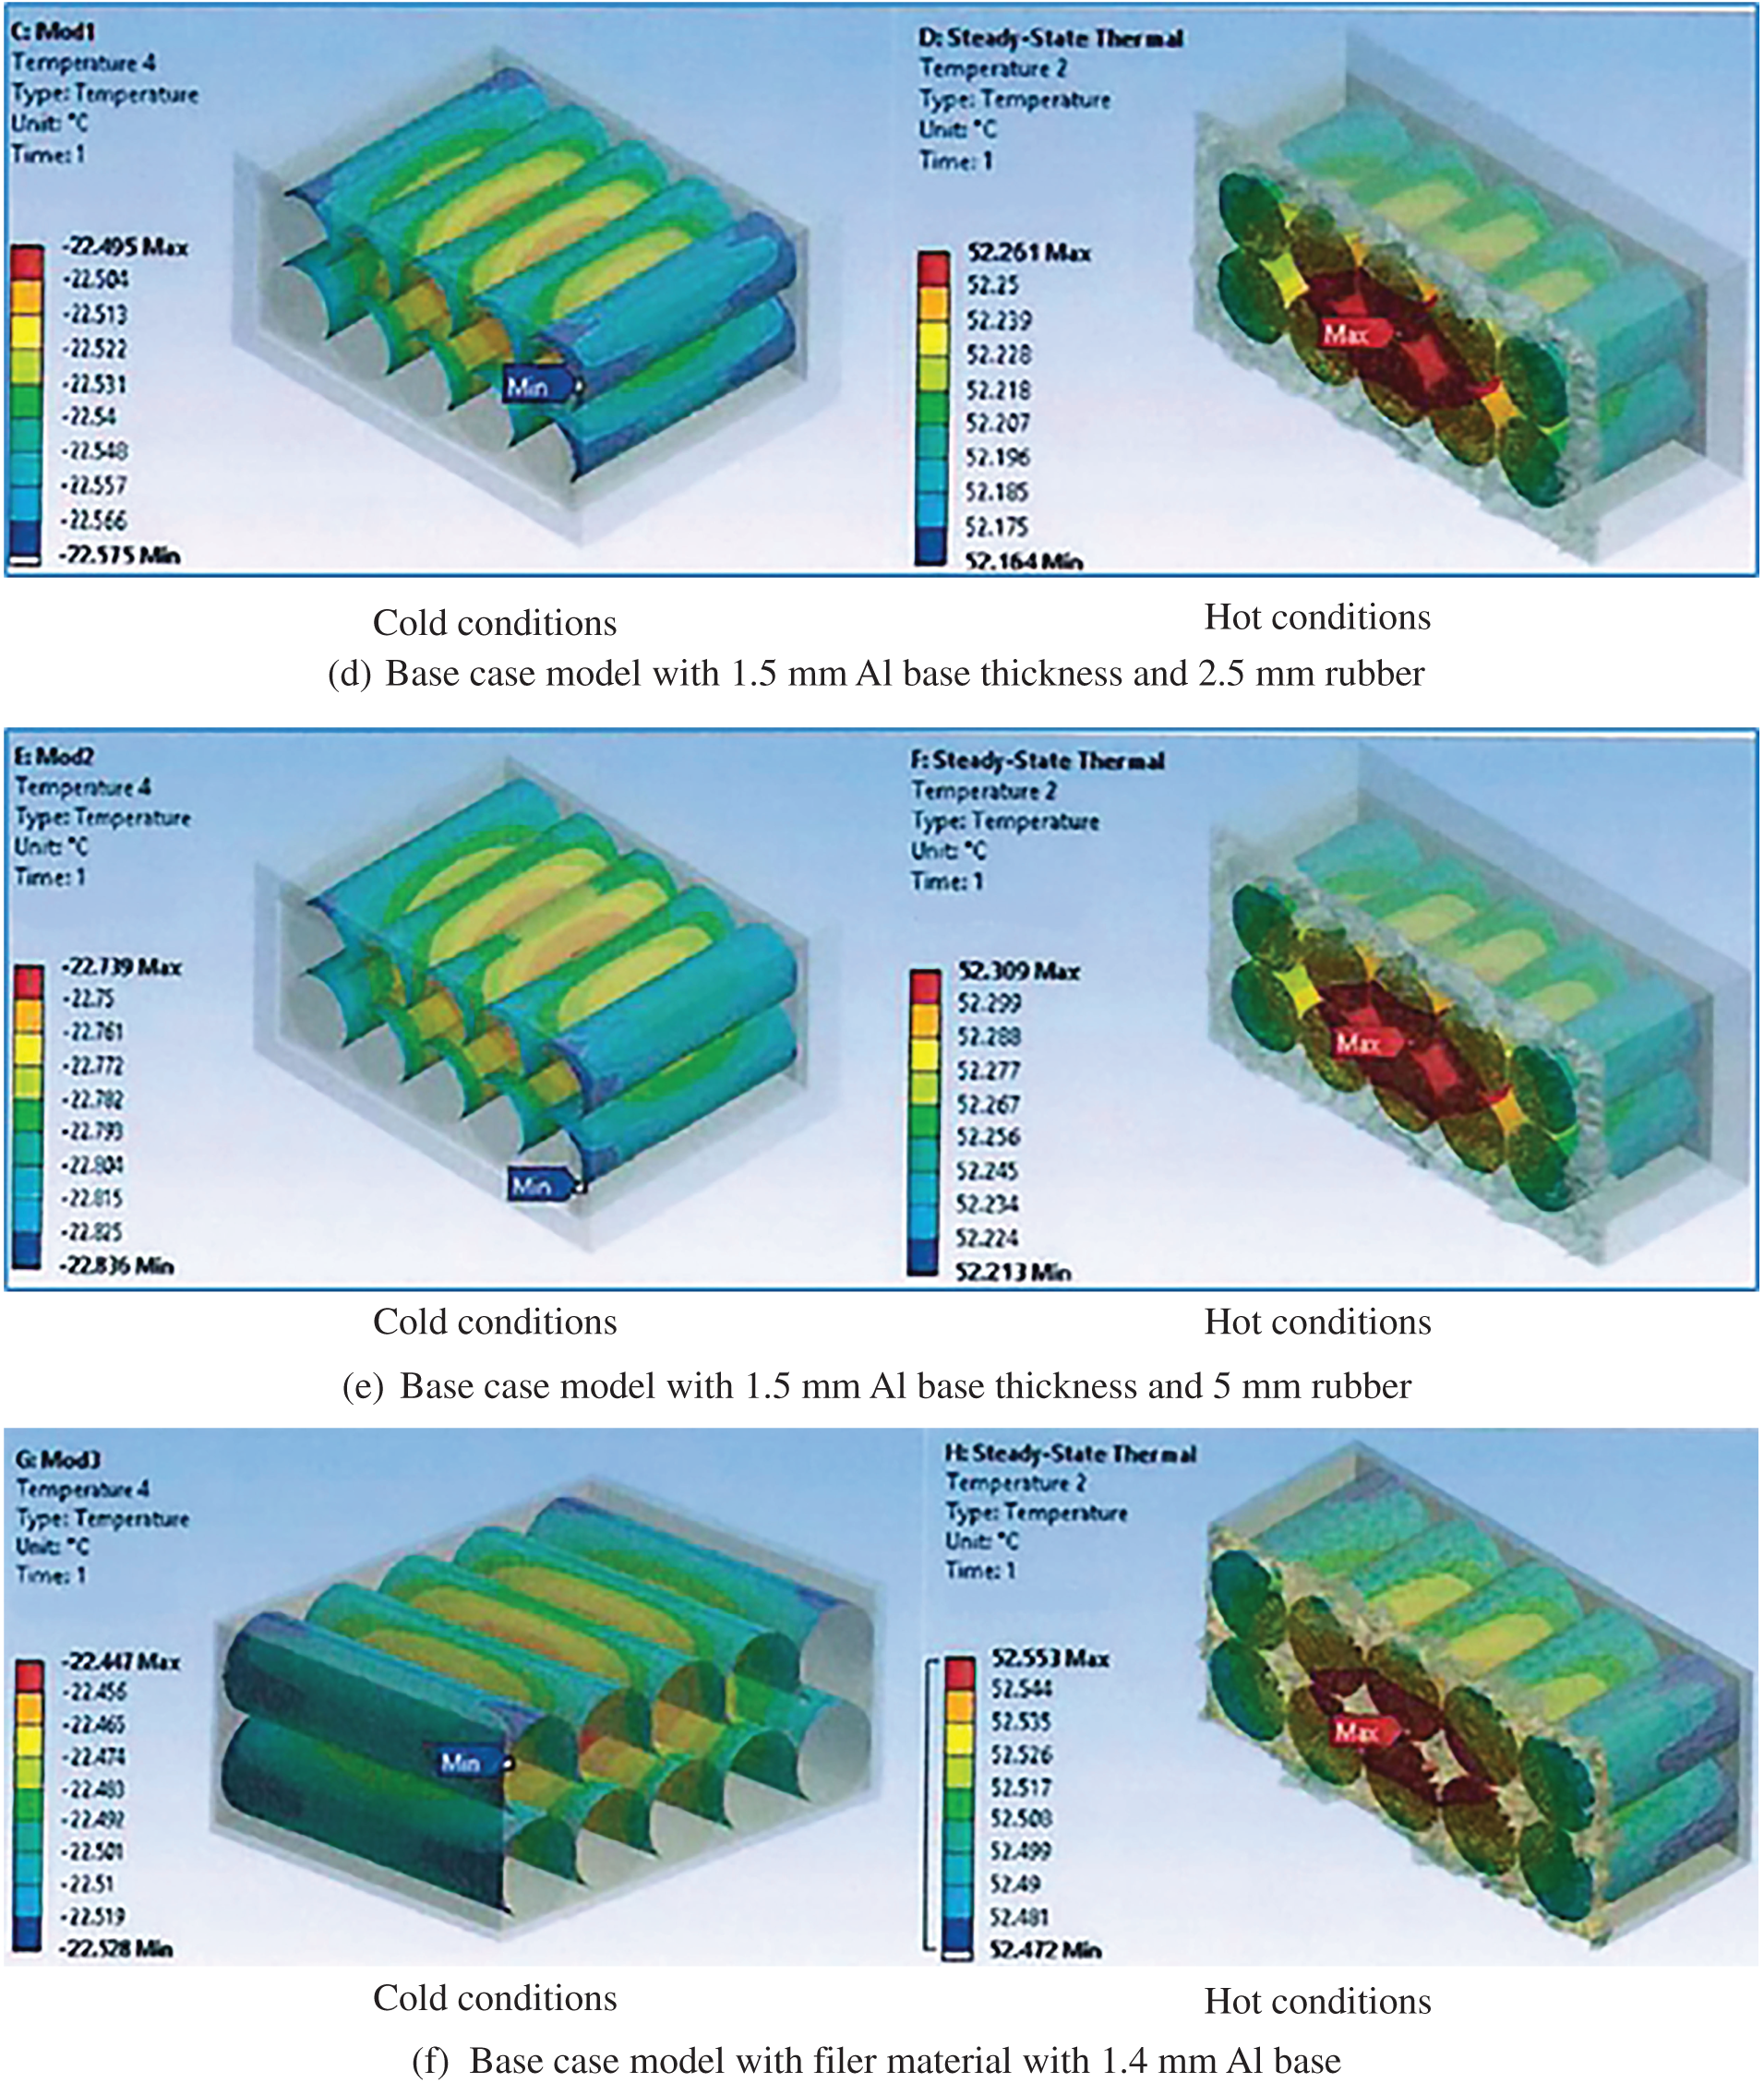
Figure 9: Temperature distribution of the 10-battery pack for (a) the base case model with 1.2 mm Al base thickness, (b) the base case model with 1.4 mm Al base thickness, (c) the base case model with 1.5 mm Al base thickness and fire-proof insulator, (d) the base case model with 1.5 mm Al base thickness and 2.5 mm rubber, (e) the base case model with 1.5 mm Al base thickness and 5 mm rubber, and (f) the base case model with filler material with 1.4 mm Al base
5.4 Numerical Analysis Results of a 10-Battery Pack in a Hexagonal Arrangement
The new model is designed in a hexagonal shape to enhance battery modelling, thereby improving the temperature range in both hot and cold conditions. Fig. 10a–g illustrates the numerical simulation results of 10 batteries for cold and hot cases of base case, base case model with insulator at top and bottom, base case model with Delrin thickness 2, 2.5, 3, 10 mm, and base case with shape optimisation model, respectively. The results revealed that the maximum battery temperatures of −20.6°C and 56.17°C have been generated in the base case hexagonal shape model with 2.5 mm Delrin for cold and hot cases, respectively. The reasons are that increasing the Delrin thickness reduces the heat conduction from the battery to the ambient, which is evident at a Delrin thickness of 10 mm (see Fig. 10e).
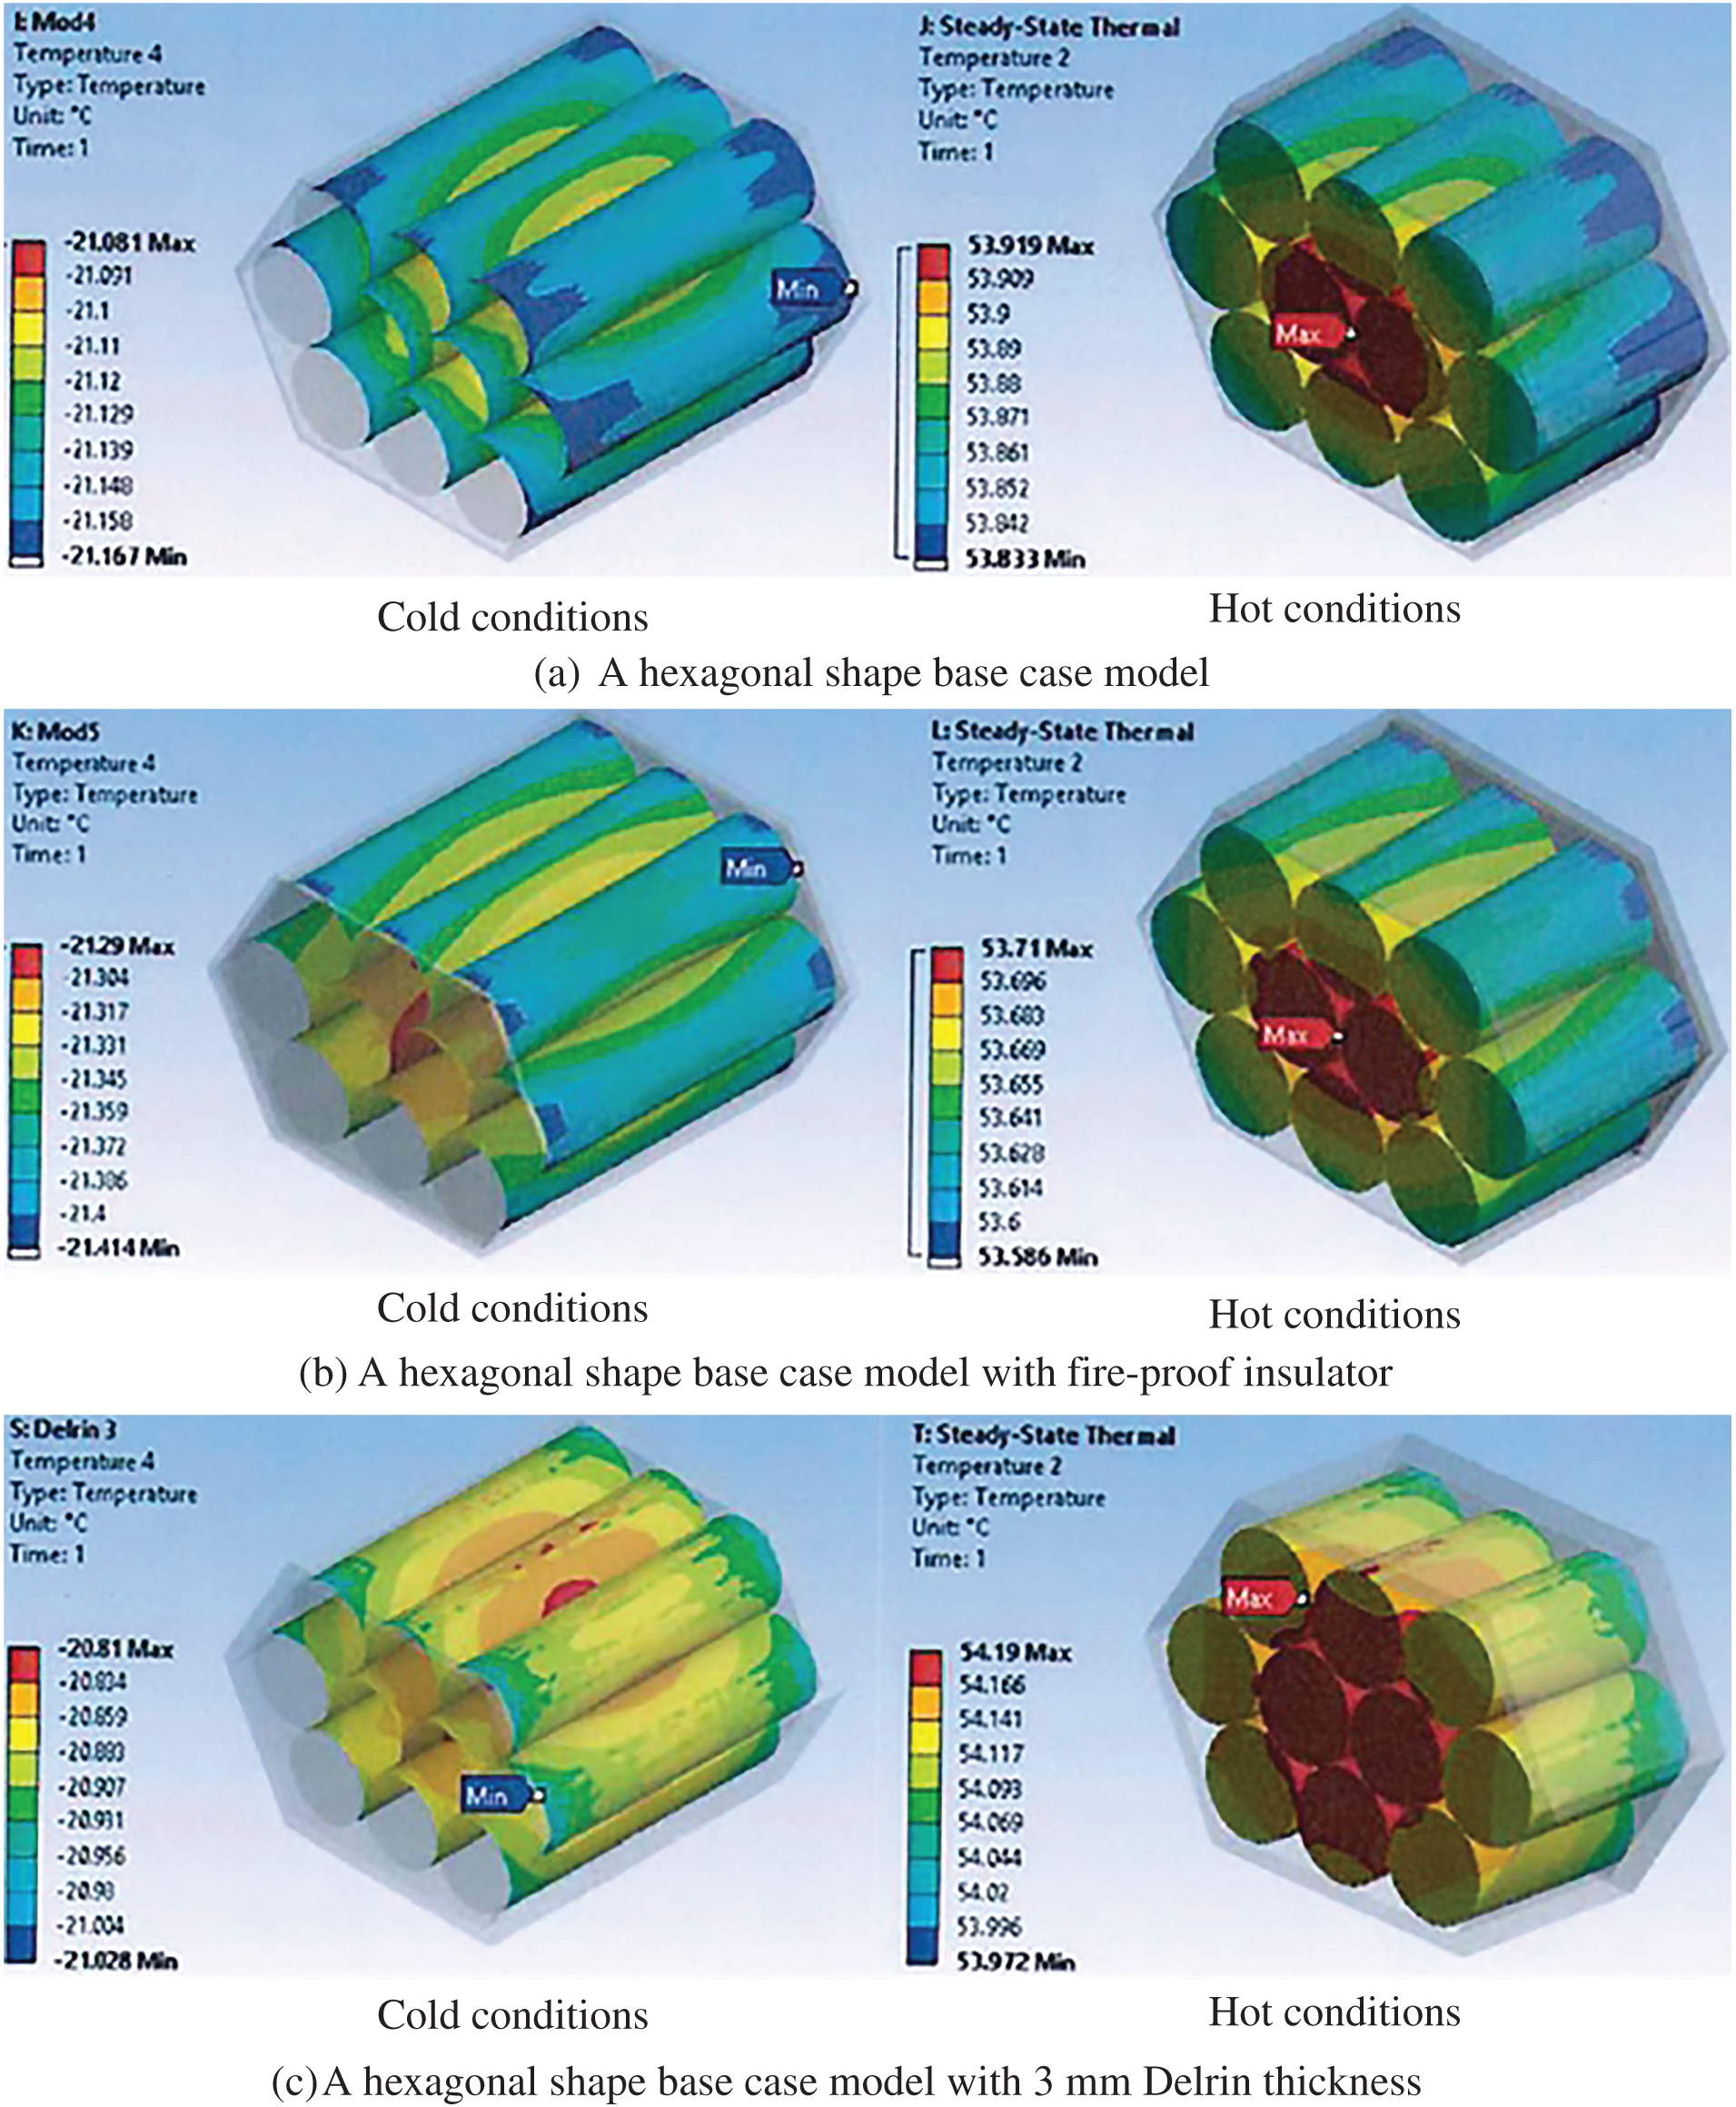
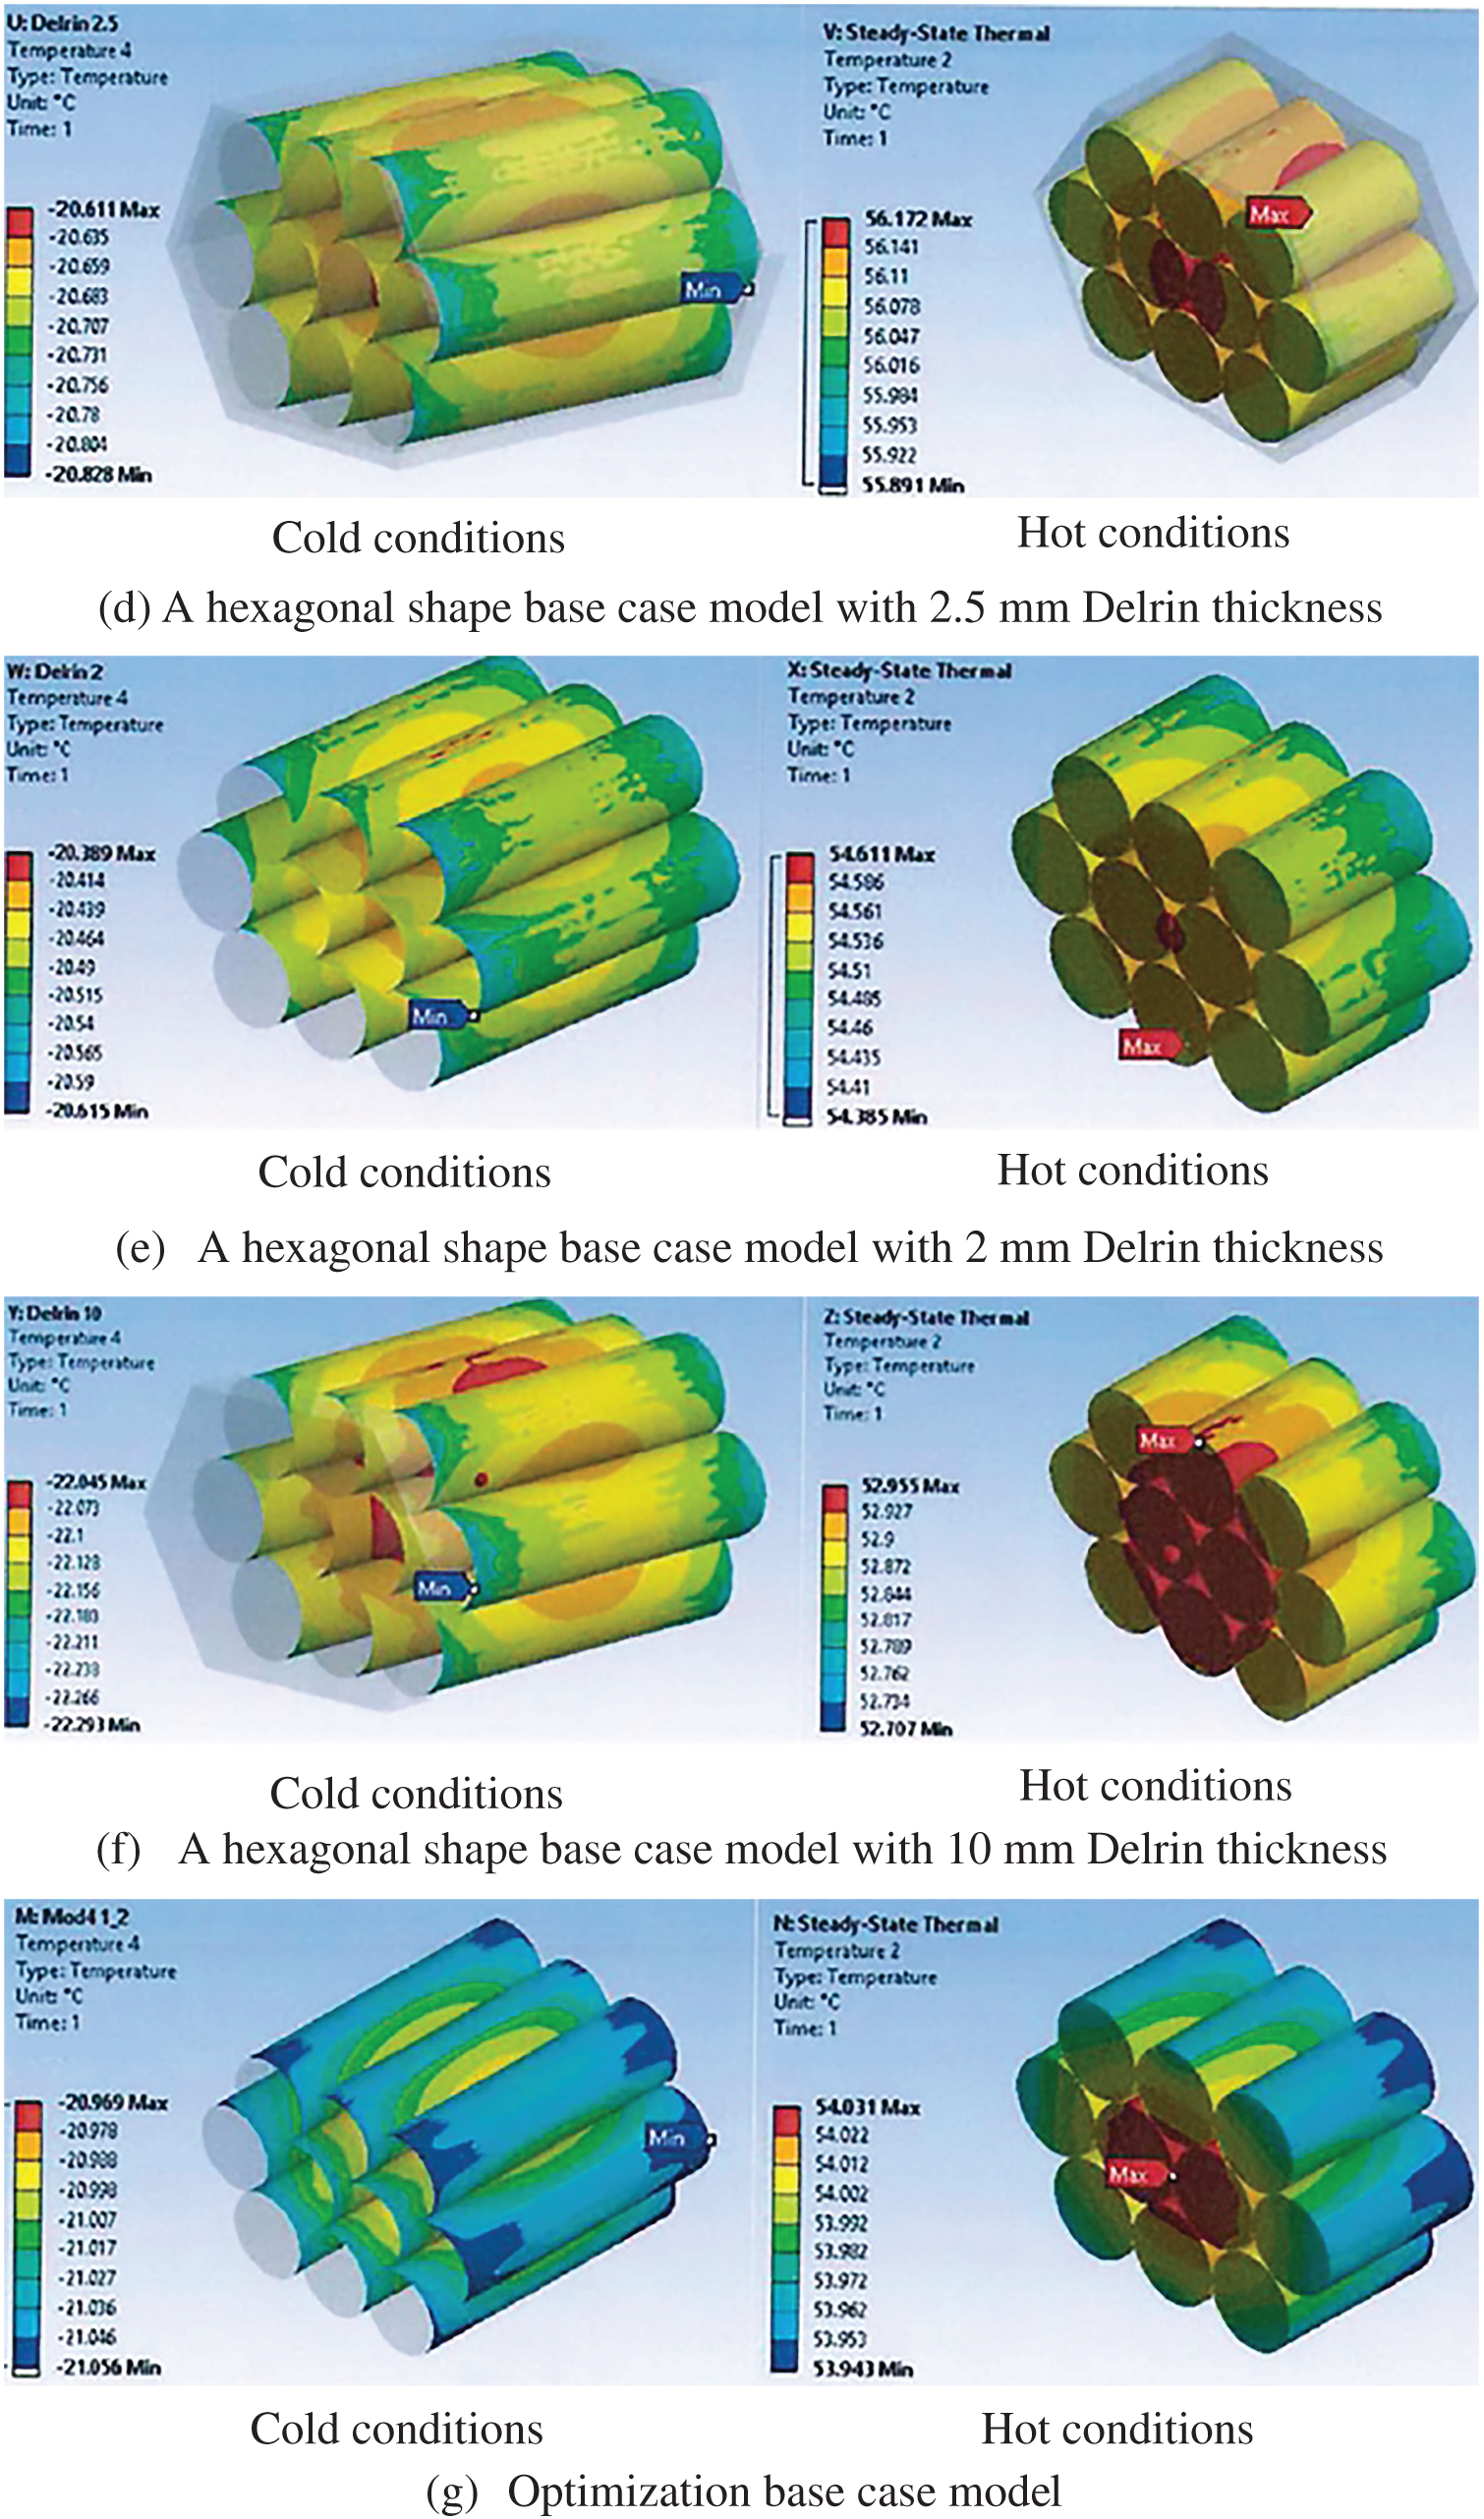
Figure 10: Temperature distribution of 10 battery packs for a hexagonal shape model, (a) a hexagonal shape base case model, (b) a hexagonal shape base case model with fire-proof insulator, (c) a hexagonal shape base case model with model with 3 mm Delrin thickness, (d) a hexagonal shape base case model with model with 2.5 mm Delrin thickness, (e) hexagonal shape base case model with model with 2 mm Delrin thickness, (f) hexagonal shape base case model with model with 10 mm Delrin thickness (g) optimization base case model
The result of the developed hexagonal configuration indicates an enhancement in the thermal behaviour of the battery pack, especially when using 10 batteries. Nevertheless, the results illustrated that the lowest and largest battery temperatures were achieved for the base case of hexagonal shape, −21.1°C and 53.92°C, and the base case −22.45°C and 52.65°C in cold and hot cases, respectively, at 10 batteries (see Figs. 9a and 10a). This is because the hexagonal shape has a good thermal enhancement by increasing the heat transfer area of the battery.
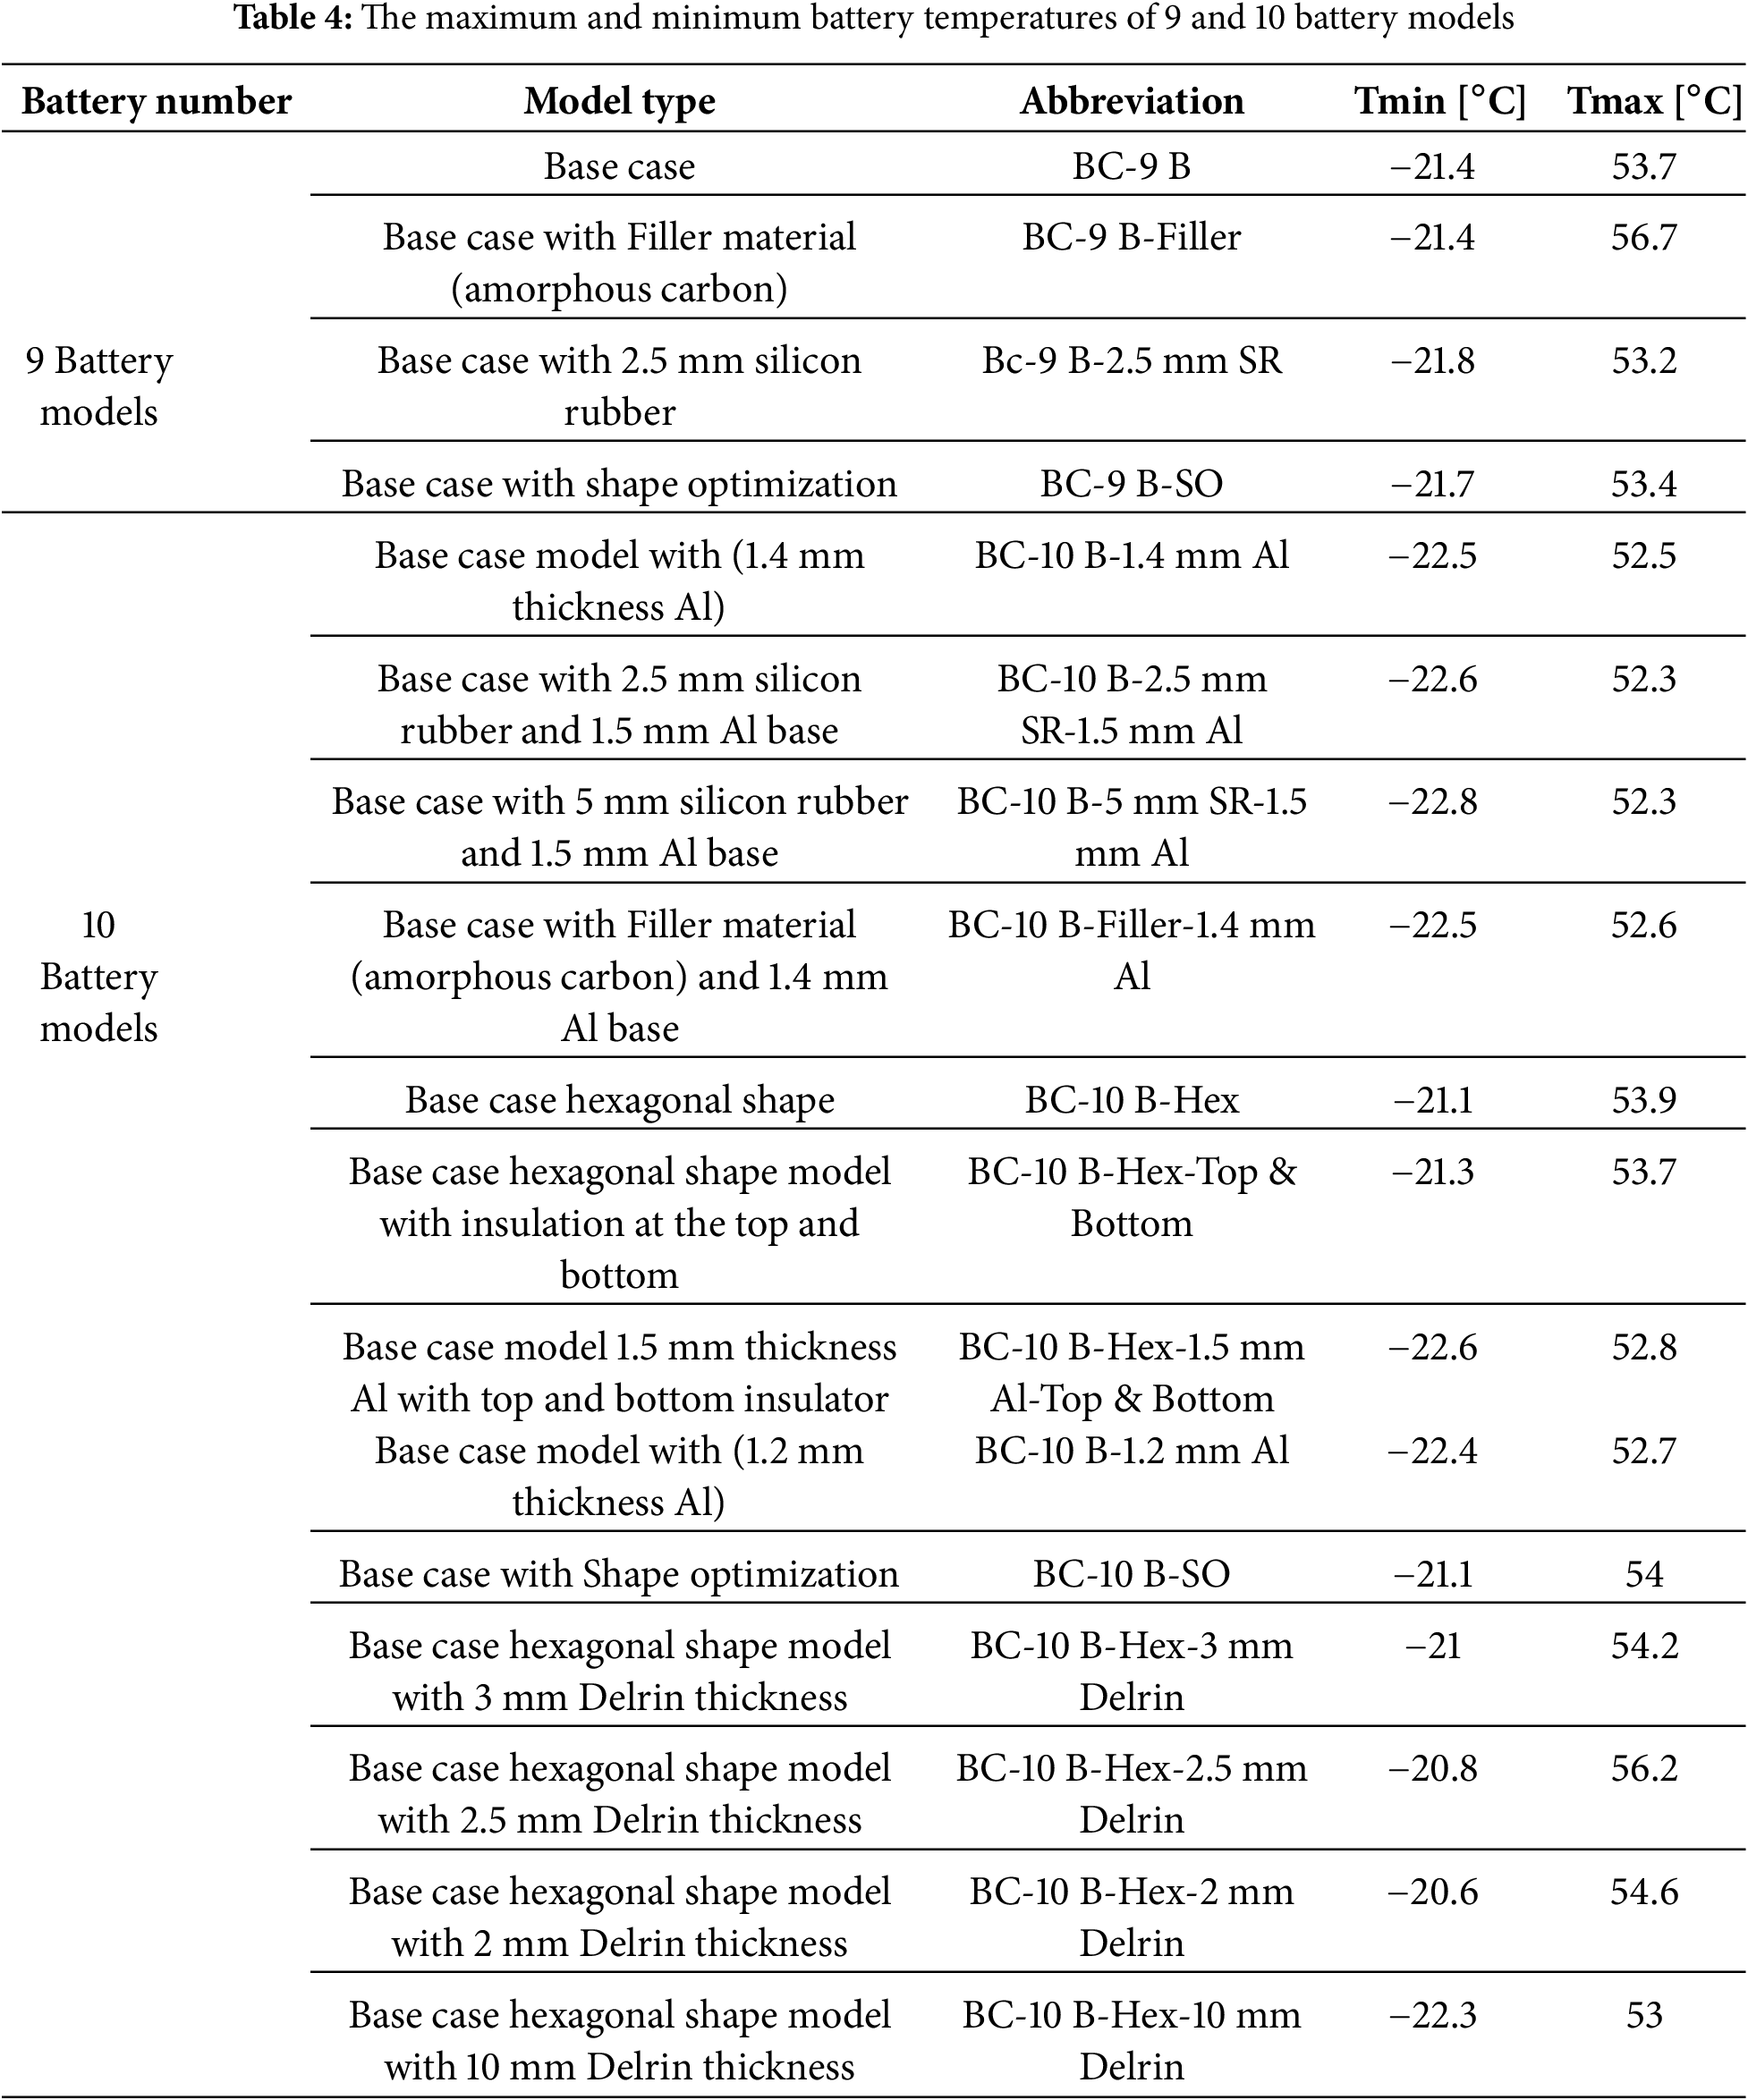
The numerical results of all models, using 9 and 10 batteries for both cold and hot cases, are listed in Table 4. In 9 batteries with different models, it is observed that there is no appropriate solution that meets the design requirements. This is due to the maximum and minimum battery temperature values for all models being outside the operating temperature range. Additionally, in 10 batteries, there are modifications to the base case model, such as a hexagonal shape with Delrin material. The results showed the best case was the base case hexagonal shape model with 2 mm Delrin thickness, which provided the largest temperature of −20.6°C in the cold case compared to other models because the Delrin material has lower thermal conductivity (0.210 W/m·K) compared to the aluminium material (205 W/m·K).
In the same context, the percentage difference between the standard operation temperature range and the current results is considered to show how the geometrical arrangement and materials affect the thermal performance of the battery package. For the minimum battery temperature, a significant deviation in the percentage difference between the considered cases can be observed, as shown in Fig. 11. This behaviour indicates the existence of a nearest minimum temperature, with a 3% difference from the common operation minimum temperature (−20°C), when using the hexagonal shape model with a 2 mm Delrin thickness. In contrast, the percentage difference for maximum temperature exhibits a higher level of uniformity, at approximately 34%, as represented by the trend line in red, as illustrated in Fig. 12.
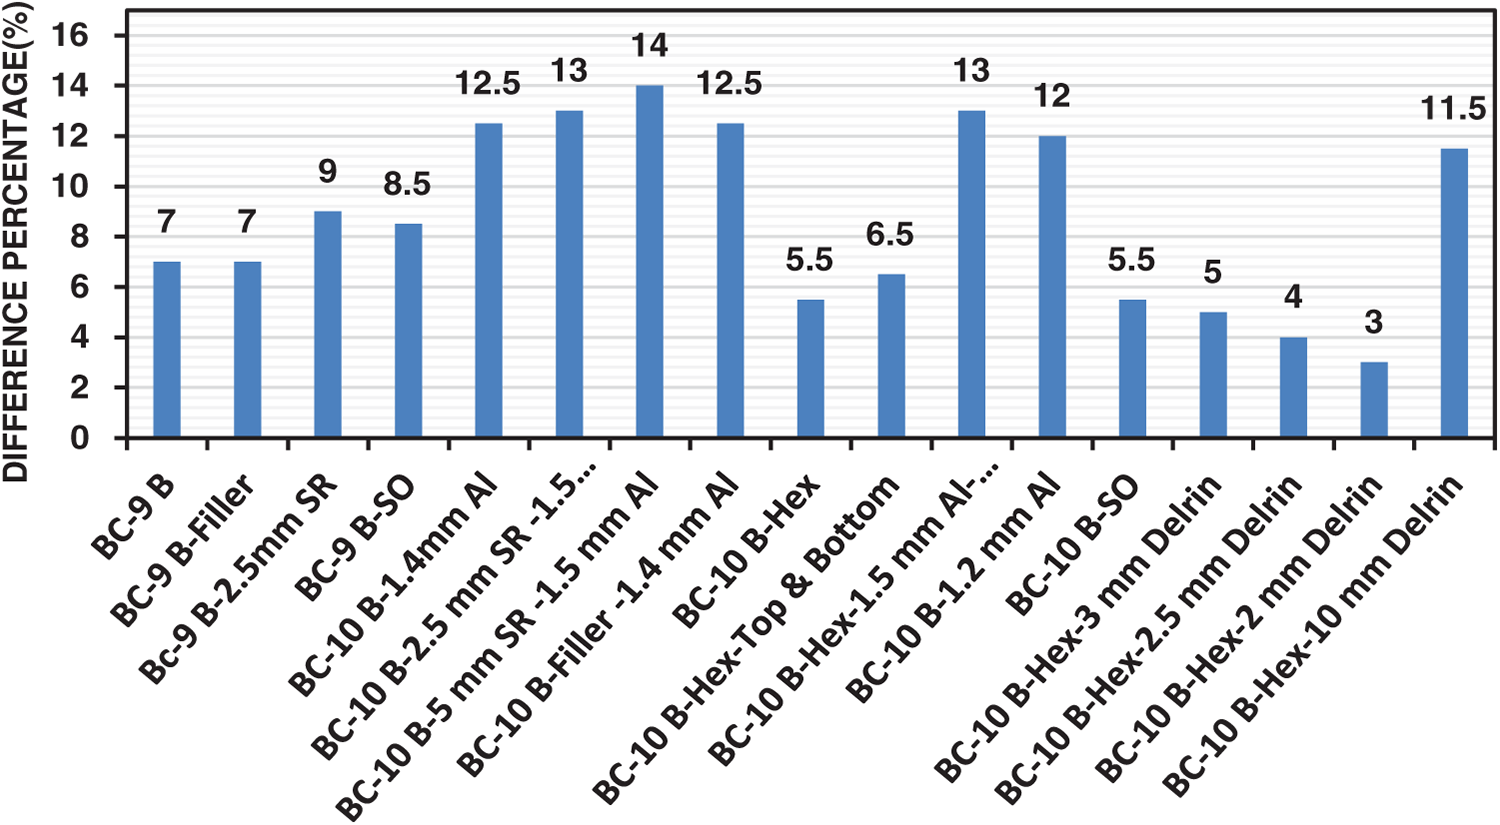
Figure 11: The deviation of the predicted minimum temperature from the common value
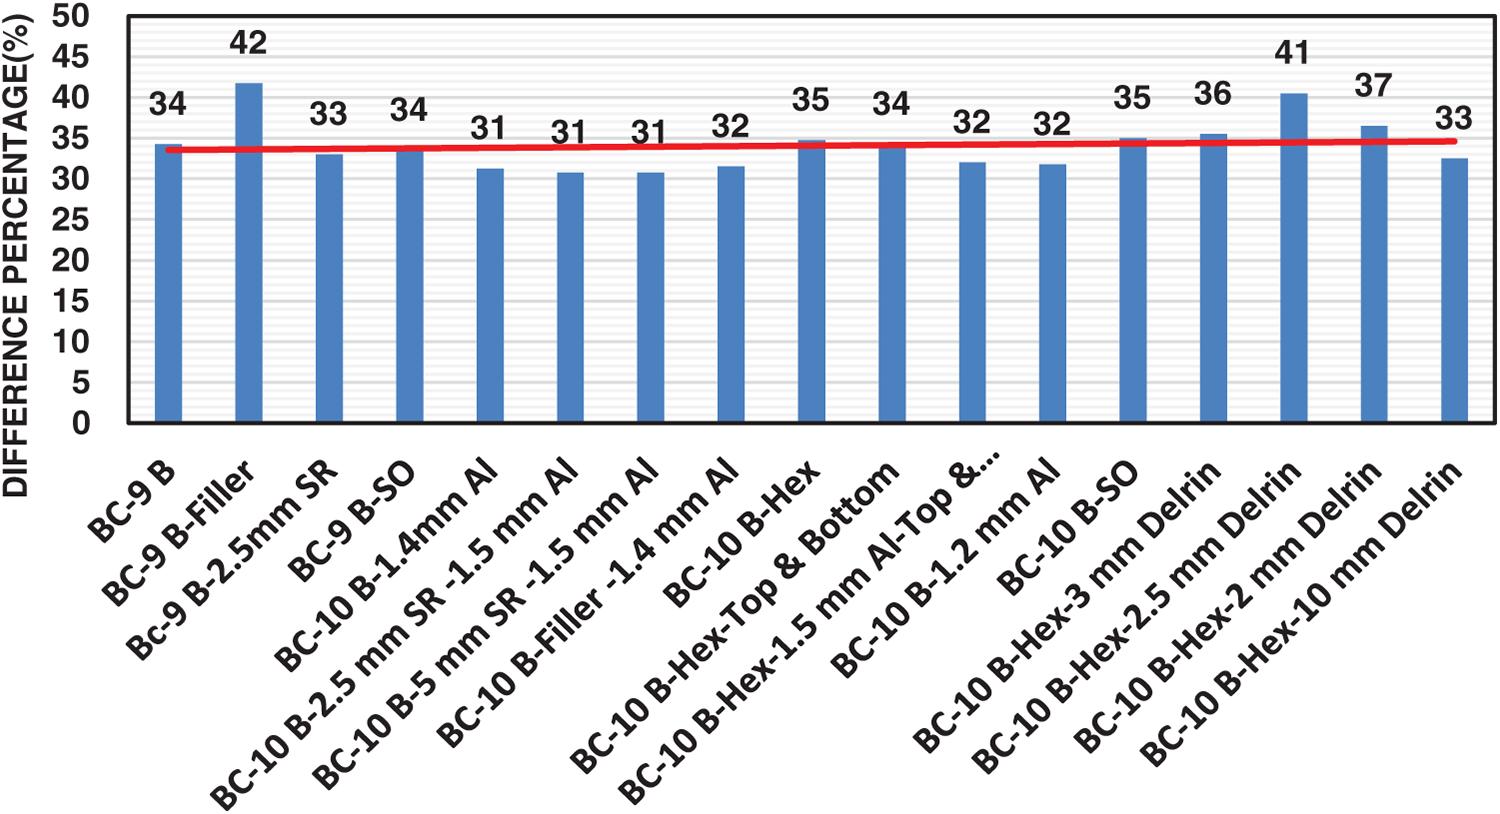
Figure 12: The deviation of the predicted maximum temperature from the common value
The total thermal resistance for all cases of lithium batteries is illustrated in Figs. 13 and 14 on the cold and hot sides. The total resistance was determined for each side by calculating the equivalent and internal resistances (see Eqs. (1), (6) and (7)). The results showed that the lowest and highest values of total resistance were 0.06 and 0.29°C/kW at temperature differences for the cold side were 0.6°C and 2.8°C, respectively. The maximum and minimum results of total resistance were 1.34 and 1.06°C/kW at hot side temperature differences of 12.4°C and 11.6°C, respectively.
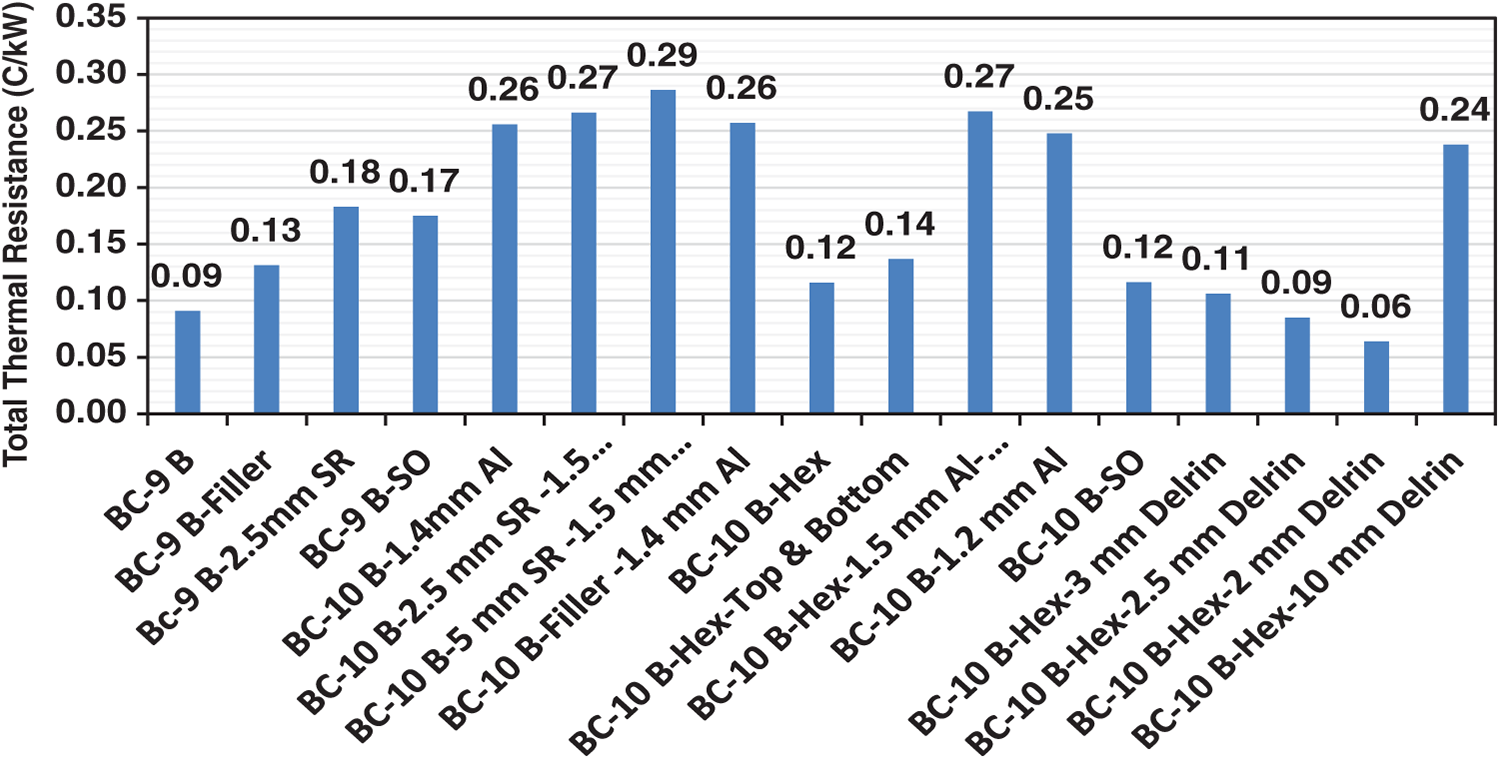
Figure 13: The total thermal resistance for all battery cases of the cold side
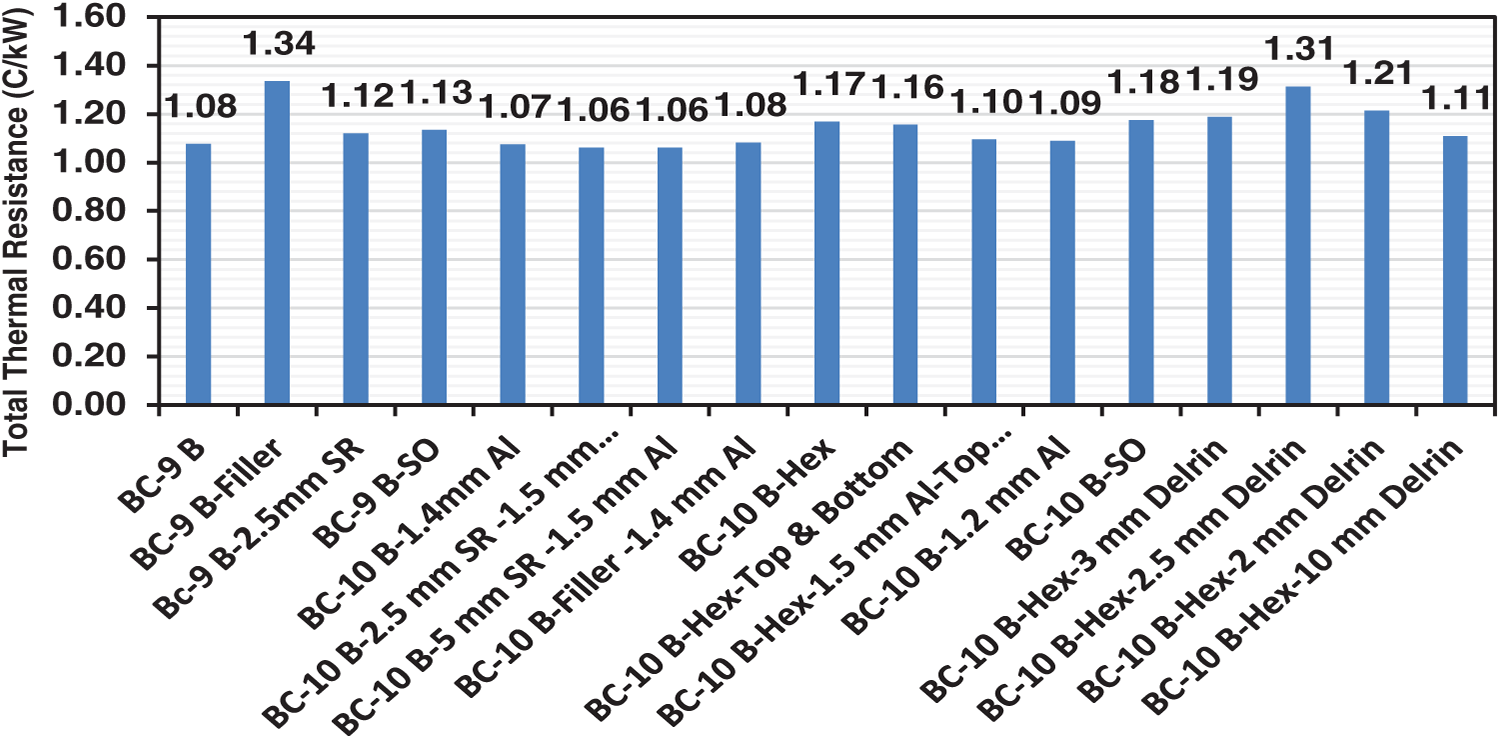
Figure 14: The total thermal resistance for all battery packing cases of the hot side
In this work, the thermal performance of the NCR18650B battery pack was considered using an analytical and numerical approach. The following remarks can be concluded:
• The 9-battery pack did not meet the required operation temperature, as all models were out of the temperature range.
• Increasing Delrin thickness from 2 to 3 mm led to a decrease in the minimum temperature by 2%.
• The battery in a hot case met the requirements, while in cold cases, it did not satisfy the requirements.
• Each battery should be as close to the others as possible to reduce the heat losses by convection.
• Delrin material should be preferred instead of Al due to its low thermal conductivity.
• When the thickness of Delrin was increased, the results became worse because of the rising thermal conduction resistance.
• The candidate solution was the model that had a hexagonal shape instead of a rectangular shape, a minimum cross-section area, and a minimum Delrin thickness to decrease the conduction thermal resistance.
Acknowledgement: This work was supported in part by Ozyegin University, Istanbul, Turkey.
Funding Statement: The authors received no specific funding for this study.
Author Contributions: The authors confirm contribution to the paper as follows: Conceptualization, Seenaa Khudhayer Salman and Shaymaa Husham Abdulmalek; literature review, Shaymaa Husham Abdulmalek, Raaid Rashad Jassem Al-Doury and Ali Ahmed Gitan; methodology, Ali Ahmed Gitan, Thamer Khalif Salem and Raaid Rashad Jassem Al-Doury; software and analysis, Thamer Khalif Salem; writing and editing, Ali Ahmed Gitan. All authors reviewed the results and approved the final version of the manuscript.
Availability of Data and Materials: All data generated or analyzed during this study are included in the published article.
Ethics Approval: Not applicable.
Conflicts of Interest: The authors declare no conflicts of interest to report regarding the present study.
References
1. Ismail MF, Ahmed HM, Abbas IA. Analytical investigation of temperature-dependent thermoelastic behavior under laser pulse influence within the coupled theory framework using improved modified extended tanh function method. Mech Solids. 2025;60(5):3686–705. doi:10.1134/s0025654425601491. [Google Scholar] [CrossRef]
2. Rauf H, Khalid M, Arshad N. A review of processes and mechanisms driving structural and mechanical evolution in lithium-ion batteries. Sustain Energy Technol Assess. 2025;82:104545. doi:10.1016/j.seta.2025.104545. [Google Scholar] [CrossRef]
3. MIL-STD-810G. Environmental engineering considerations and laboratory tests. Method 501.5: high temperature. Washington, DC, USA: USA Department of Defense; 2014. [Google Scholar]
4. MIL-STD-810G. Environmental engineering considerations and laboratory tests. Method 502.5: low temperature. Washington, DC, USA: USA Department of Defense; 2014. [Google Scholar]
5. Group PB. NCR18650B Datasheet [Internet]. [cited 2025 Dec 17]. Available from: https://www.tme.eu/Document/3e0170a1e089819f286f7066e69035b4/NCR18650B.pdf. [Google Scholar]
6. Yaseen AY. Performance evaluation of hybrid system (PV/wind/battery) integrated with smart grids. Tikrit J Eng Sci. 2025;32(2):1–12. doi:10.25130/tjes.32.2.5. [Google Scholar] [CrossRef]
7. Greco A. Numerical and analytical modelling of battery thermal management using passive cooling systems [dissertation]. Lancaster, UK: Lancaster University; 2016. [Google Scholar]
8. Chen Z, Qin Y, Dong Z, Zheng J, Liu Y. Numerical study on the heat generation and thermal control of lithium-ion battery. Appl Therm Eng. 2023;221:119852. doi:10.1016/j.applthermaleng.2022.119852. [Google Scholar] [CrossRef]
9. Li A, Yuen ACY, Wang W, Weng J, Lai CS, Kook S, et al. Thermal propagation modelling of abnormal heat generation in various battery cell locations. Batteries. 2022;8(11):216. doi:10.3390/batteries8110216. [Google Scholar] [CrossRef]
10. Du K, Chen G, Zhang Y, Li S, Shi B, Zhang T, et al. Comprehensive review of thermal management strategies for lithium-ion batteries: from heat generation mechanism to advanced cooling solutions. Energy Storage Mater. 2025;82:104597. doi:10.1016/j.ensm.2025.104597. [Google Scholar] [CrossRef]
11. Xin Q, Yang T, Zhang H, Zeng J, Xiao J. Simulation and optimization of lithium-ion battery thermal management system integrating composite phase change material, flat heat pipe and liquid cooling. Batteries. 2023;9(6):334. doi:10.3390/batteries9060334. [Google Scholar] [CrossRef]
12. Chen H, Zhu L, Liu J, Xiong F, Wei D. Thermal modeling and validation for EV battery packs in realistic operation conditions. J Phys Conf Ser. 2020;1600(1):012074. doi:10.1088/1742-6596/1600/1/012074. [Google Scholar] [CrossRef]
13. Xun J, Liu R, Jiao K. Numerical and analytical modeling of lithium ion battery thermal behaviors with different cooling designs. J Power Sources. 2013;233:47–61. doi:10.1016/j.jpowsour.2013.01.095. [Google Scholar] [CrossRef]
14. Son J, Du Y. Model-based stochastic fault detection and diagnosis of lithium-ion batteries. Processes. 2019;7(1):38. doi:10.3390/pr7010038. [Google Scholar] [CrossRef]
15. Yang C, Cao L. The role of interfacial thermal resistance in Li-ion battery thermal management. In: Proceedings of the ASME 2019 International Technical Conference and Exhibition on Packaging and Integration of Electronic and Photonic Microsystems; 2019 Oct 7–9; Anaheim, CA, USA. doi:10.1115/ipack2019-6594. [Google Scholar] [CrossRef]
16. Ismail NHF, Toha SF, Azubir NAM, Md Ishak NH, Hassan MK, Ibrahim KSM, et al. Simplified heat generation model for lithium ion battery used in electric vehicle. IOP Conf Ser Mater Sci Eng. 2013;53:012014. doi:10.1088/1757-899x/53/1/012014. [Google Scholar] [CrossRef]
17. Muenzel V, Hollenkamp AF, Bhatt AI, de Hoog J, Brazil M, Thomas DA, et al. A comparative testing study of commercial 18650-format lithium-ion battery cells. J Electrochem Soc. 2015;162(8):A1592–600. doi:10.1149/2.0721508jes. [Google Scholar] [CrossRef]
18. Mele ML, Bracciale MP, Ubaldi S, Santarelli ML, Mazzaro M, Di Bari C, et al. Thermal abuse tests on 18650 Li-ion cells using a cone calorimeter and cell residues analysis. Energies. 2022;15(7):2628. doi:10.3390/en15072628. [Google Scholar] [CrossRef]
19. Liu Y, Yang S, Guo B, Deng C. Numerical analysis and design of thermal management system for lithium ion battery pack using thermoelectric coolers. Adv Mech Eng. 2014;6:852712. doi:10.1155/2014/852712. [Google Scholar] [CrossRef]
20. Baird S. Review of technical criteria for high-impact battery applications with examples of industry performance. ChemRxiv. 2022. doi:10.26434/chemrxiv-2022-s9gq1. [Google Scholar] [CrossRef]
21. Mahek MK, Ramadan M, Bin Dol SS, Ghazal M, Alkhedher M. A comprehensive review of thermoelectric cooling technologies for enhanced thermal management in lithium-ion battery systems. Heliyon. 2024;10(24):e40649. doi:10.1016/j.heliyon.2024.e40649. [Google Scholar] [PubMed] [CrossRef]
22. Villano P, Carewska M, Passerini S. Specific heat capacity of lithium polymer battery components. Thermochim Acta. 2003;402(1–2):219–24. doi:10.1016/S0040-6031(02)00612-3. [Google Scholar] [CrossRef]
23. PANASONIC. Lithium-Ion battery NCR18650B datasheet. [cited 2025 Dec 17]. Available from: https://www.tme.eu/Document/3e0170a1e089819f286f7066e69035b4/NCR18650B.pdf. [Google Scholar]
24. Overview of materials for Silicone Rubber [Internet]. 2015 [cited 2025 Dec 17]. Available from: https://www.matweb.com/search/DataSheet.aspx?MatGUID=cbe7a469897a47eda563816c86a73520. [Google Scholar]
25. Shin-Etsu Silicone. Characteristic properties of silicone rubber compounds. Tokyo, Japan: Shin-Etsu Silicone; 2015. p. 1–15. [Google Scholar]
26. Bai Q, Li K, Zan J, Liu J, Ou J, Liu J. Influence of insulation material thickness on spread of thermal runaway in battery packs. Processes. 2023;11(5):1321. doi:10.3390/pr11051321. [Google Scholar] [CrossRef]
27. Spinner NS, Ananth R, Tuttle SG, Rose-Pehrsson SL, Mazurick R, Brandon A. Lithium battery safety/cell-to-cell failure project FY14 progress report. Washington, DC, USA: United States Naval Research Laboratory; 2015. [Google Scholar]
28. Murashko K. Thermal modelling of commercial lithium-ion batteries [dissertation]. Lappeenranta, Finland: Lappeenranta University of Technology; 2016. [Google Scholar]
29. HPC Europe. Properties of delrin 150 (polyoxymethylene). Lyon, France: HPC Europe; 2016. [Google Scholar]
30. Jánó R, Ilieş AI, Fodor A. Thermal simulations for 18650 Li-ion batteries. In: Proceedings of the 2022 IEEE 28th International Symposium for Design and Technology in Electronic Packaging (SIITME); 2022 Oct 26–29; Bucharest, Romania. doi:10.1109/SIITME56728.2022.9987899. [Google Scholar] [CrossRef]
31. Jiang Y, Huang J, Xu P, Wang P. Axial and radial thermal conductivity measurement of 18,650 Lithium-ion battery. J Energy Storage. 2023;72:108516. doi:10.1016/j.est.2023.108516. [Google Scholar] [CrossRef]
32. Drake SJ, Wetz DA, Ostanek JK, Miller SP, Heinzel JM, Jain A. Measurement of anisotropic thermophysical properties of cylindrical Li-ion cells. J Power Sources. 2014;252:298–304. doi:10.1016/j.jpowsour.2013.11.107. [Google Scholar] [CrossRef]
33. Lee H. Thermal design: heat sinks, thermoelectrics, heat pipes, compact heat exchangers, and solar cells. Hoboken, NJ, USA: John Wiley & Sons, Inc.; 2022. [Google Scholar]
34. Jiang ZY, Qu ZG, Zhang JF, Rao ZH. Rapid prediction method for thermal runaway propagation in battery pack based on lumped thermal resistance network and electric circuit analogy. Appl Energy. 2020;268:115007. doi:10.1016/j.apenergy.2020.115007. [Google Scholar] [CrossRef]
35. Drake SJ. Thermal conduction and heat generation phenomena in Li-ion cells [dissertation]. Arlington, TX, USA: The University of Texas at Arlington; 2014. [Google Scholar]
Cite This Article
 Copyright © 2026 The Author(s). Published by Tech Science Press.
This work is licensed under a Creative Commons Attribution 4.0 International License , which permits unrestricted use, distribution, and reproduction in any medium, provided the original work is properly cited.
 Downloads
 Citation Tools