
 Submit a Paper
 Propose a Special lssue
 Open Access
ARTICLE

Centralized PV Coordination Control Strategy for Unbalanced LV Distribution Networks Based on Sensitivity Coefficient Weights
1 Nantong Electric Power Design Institute Co., Ltd., Nantong, 226000, China
2 School of Electrical Engineering and Automation, Nantong University, Nantong, 226019, China
* Corresponding Author: Xiuyong Yu. Email:
Energy Engineering 2026, 123(3), 18 https://doi.org/10.32604/ee.2025.071728
Received 11 August 2025; Accepted 24 October 2025; Issue published 27 February 2026
 View Full Text
 Download PDF
Abstract
The dense integration of residential distributed photovoltaic (PV) systems into three-phase, four-wire low-voltage (LV) distribution networks results in reverse power flow and three-phase imbalance, leading to voltage violations that hinder the growth of rural distributed PV systems. Traditional voltage droop-based control methods regulate PV power output solely based on local voltage measurements at the point of PV connection. Due to a lack of global coordination and optimization, their efficiency is often subpar. This paper presents a centralized coordinated active/reactive power control strategy for PV inverters in rural LV distribution feeders with high PV penetration. The strategy optimizes residential PV inverter reactive and active power control to enhance voltage quality. It uses sensitivity coefficients derived from the inverse Jacobian matrix to assign adjustment weights to individual PV units and iteratively optimize their power outputs. The control sequence prioritizes reactive power increases; if the coefficients are below average or the inverters reach capacity, active power is curtailed until voltage issues are resolved. A simulation based on a real 37-node rural distribution network shows that the proposed method significantly reduces PV curtailment. Typical daily results indicate a curtailment rate of 1.47%, which is significantly lower than the 15.4% observed with the voltage droop-based control method. The total daily PV power output (measured every 15 min) increases from 5.55 to 6.41 MW, improving PV hosting capacity.Keywords
Low-voltage (LV) distribution feeders face challenges such as outdated management and limited situational awareness [1], which hinder real-time monitoring and proactive risk mitigation of overloads, imbalances, and faults [2]. In recent years, new renewable energy sources, such as distributed photovoltaics (PV), have seen rapid growth and have been widely integrated into LV distribution networks, reaching unprecedented high penetration rates [3]. This “bottom-up” energy supply model, while promoting the green transformation of the energy structure, has significantly altered the traditional operational characteristics of the distribution network and introduced many technical challenges that urgently need to be addressed, including [3,4]:
(1) Reverse power flow disrupts protection and control schemes.
(2) Risks of elevated voltage violation (especially midday PV peaks causing overvoltage at the feeder end, which threatens equipment safety and power quality);
(3) Limited local PV hosting capacity due to network constraints and insufficient regulation. These intertwined challenges jeopardize grid security, power quality, operational efficiency, and the sustainable deployment of PV [3]. Therefore, research on coordinated voltage regulation and enhanced PV hosting capacity for LV feeders under high PV penetration is imperative [5].
Existing voltage mitigation strategies mainly focus on balanced medium-voltage (MV) systems [6]. Traditional methods include coordinated active/reactive power regulation, using on-load tap changers (OLTC), Static VAR compensator (SVC)/capacitors, demand control [7], and inverter reactive support through centralized or distributed control [8]. However, applying MV strategies to unbalanced three-phase four-wire LV feeders faces limitations. Key differences include: (1) prevalence of single-phase loads and PV inverters at feeder ends; (2) severe three-phase current/power imbalance; (3) in LV networks, controlling reactive power has a limited impact on voltage due to large R/X ratios [9].
After the high penetration rate of PV connects to the LV distribution networks, the voltage support methods can be divided into three categories [3]:
(1) Local (decentralized) control methods: They rely not on communication networks but mainly use local measurement data for autonomous decision-making. As a result, they offer significant benefits, including low implementation costs and easy deployment. References [9–11] use droop-based control to support voltage, which indirectly influences the voltage level (U) at the PV-connected point by adjusting the active power P(U) and reactive power Q(U) output of distributed PV inverters, thereby achieving local voltage regulation. Reference [12] uses an apparatus to correct and offset the measured voltage. The potential of active power curtailment and supercapacitors is identified in reference [13]. Reference [14] adopts the community energy storage to manage voltage. Local control methods have limitations, as they lack global coordination and optimization, resulting in less efficient regulation. Their effects are easily disrupted by measurement errors, load changes, and conflicting adjustments from nearby nodes, resulting in voltage fluctuations or inadequate regulation responses.
(2) Distributed (limited communication) control methods: Through limited information exchange and collaboration, nodes achieve a broader operational state than local control alone, often outperforming non-communication methods and finding solutions closer to the global optimum [15,16]. Reference [17] employs distributed optimization and peer-to-peer communication to support the voltage in LV distribution networks. Reference [18] proposes a combined centralized-decentralized voltage support scheme to overcome PV imbalance-induced issues. Reference [19] utilizes intelligent agents and a consensus-based algorithm to enhance voltage quality. This performance gain increases system complexity, necessitating reliable communication links that account for delays, packet loss, and network changes.
(3) Centralized control methods: The development of advanced metering infrastructure (AMI) has enabled large-scale real-time data collection and uploading, providing a strong basis for centralized voltage management [20]. References [21,22] utilize multi-objective optimal power flow (OPF) to determine the setpoints of PV inverters. Reference [23] suggests coordinating algorithms by using real-time measurements of node voltage and active power to improve network voltage control. Hierarchical coordinated control strategy [24], model-less centralized control approach [25], and real-time distributed voltage control [26] are used to regulate and optimally coordinate voltages in LV distribution networks. Global optimization calculations utilize network topology and data to generate optimal regulation instructions, enabling comprehensive solutions with high control accuracy, reliability, efficiency, and system perception and control.
This paper proposes a centralized reactive and active power collaborative control strategy for rural LV distribution networks with high penetration of PVs. The main contributions are: (1) We propose a centralized coordinated active/reactive power control strategy for PV inverters in rural LV distribution feeders with high PV penetration. The proposed method enhances the distribution system’s capacity for photovoltaic consumption while requiring minimal communication infrastructure; (2) The proposed strategy allocates adjustment weights to individual PV units and iteratively optimizes their power outputs. Therefore, the most effective PV is used for voltage regulation; (3) Typical daily simulation results demonstrate the higher performance of the proposed scheme. The curtailment rate of the traditional method is approximately η = 15.87%, which is significantly higher than the 1.47% of the proposed scheme.
The structure of this paper is organized as follows: Section 2 presents the theoretical basis of voltage regulation with PV integration in LV feeders. Section 3 describes the proposed sensitivity-based coordinated active/reactive power control strategy. Section 4 demonstrates the effectiveness of the voltage control methods and PV hosting performance compared to the traditional approach using a 37-node LV feeder model with real PV/load data. Section 5 summarizes the study and suggests directions for future research.
2 Voltage Regulation Principles in LV Feeders with PV Integration
2.1 High-Penetration LV Distribution Feeders
The study employs a typical Chinese rural three-phase four-wire LV distribution network with N = 37 nodes, as shown in Fig. 1, where OLTC regulates node 1’s voltage. Frequent OLTC adjustments are undesirable due to lifespan limitations, cost, and dependence on manual operation. Therefore, this paper concentrates on PV inverter-based autonomous voltage control without frequent OLTC tapping.
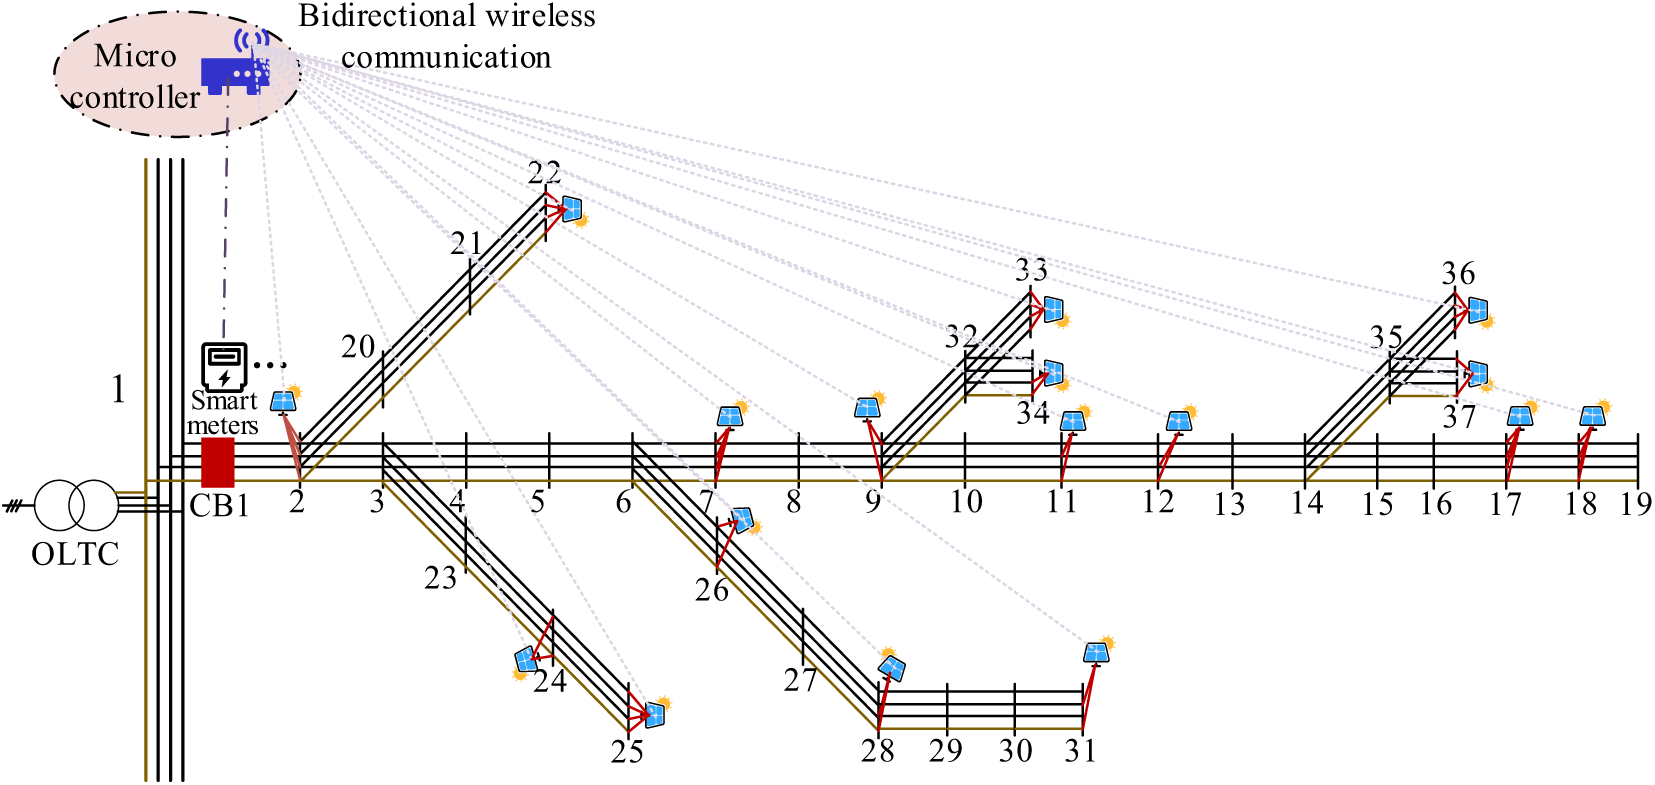
Figure 1: Simple network structure of PV integration to an LV distribution network
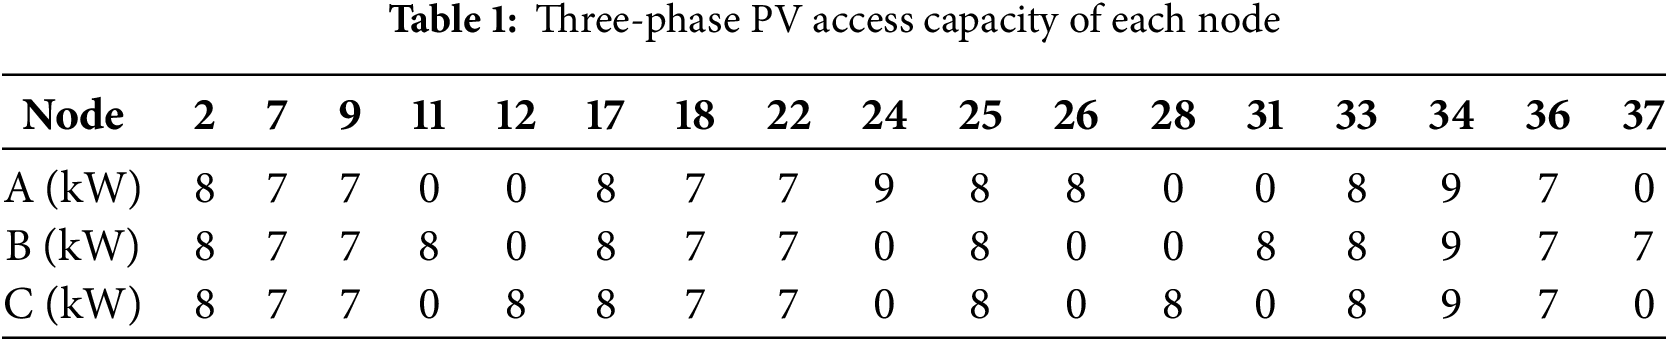
In Fig. 1, PV inverters (single or three-phase) are integrated at nodes KPV,index = {2, 7, 9, 11, 12, 17, 18, 22, 24, 25, 26, 28, 31, 33, 34, 36, 37} (17 nodes). Nodes connect heterogeneous active (PL) and reactive (QL) loads.
To quantitatively analyze the impact of distributed PV integration on voltage distribution in LV distribution networks. The PV power generation coefficient is defined as follows:
where PG represents the actual active power of PV, and PG,N denotes the rated installed capacity of PV.
When active (PL) and reactive (QL) loads are fixed, the PG of PV inverters is gradually increased. That is, λ increases from 0% to 100%, and the simulation records the voltage changes at each node in the LV distribution network. The voltage distribution characteristics are shown in Fig. 2. The horizontal axis represents node numbers, while the vertical axis represents voltage per unit (p.u.). The observation results are as follows: When λ is greater than or equal to 70%, significant voltage violations occur at the end nodes of the LV distribution network (nodes 17, 18, 19, 36, and 37), with the highest voltage exceeding 1.08 p.u. It is essential to note that the threshold for voltage violations varies slightly according to national standards. China’s current industry standards (such as GB/T 12325-2008) specify that the voltage deviation limit for single-phase distribution systems is +7% of the nominal voltage (i.e., 1.07 p.u.), for durations exceeding 15 min. This paper adheres to this standard, with a maximum voltage limit of 1.08.
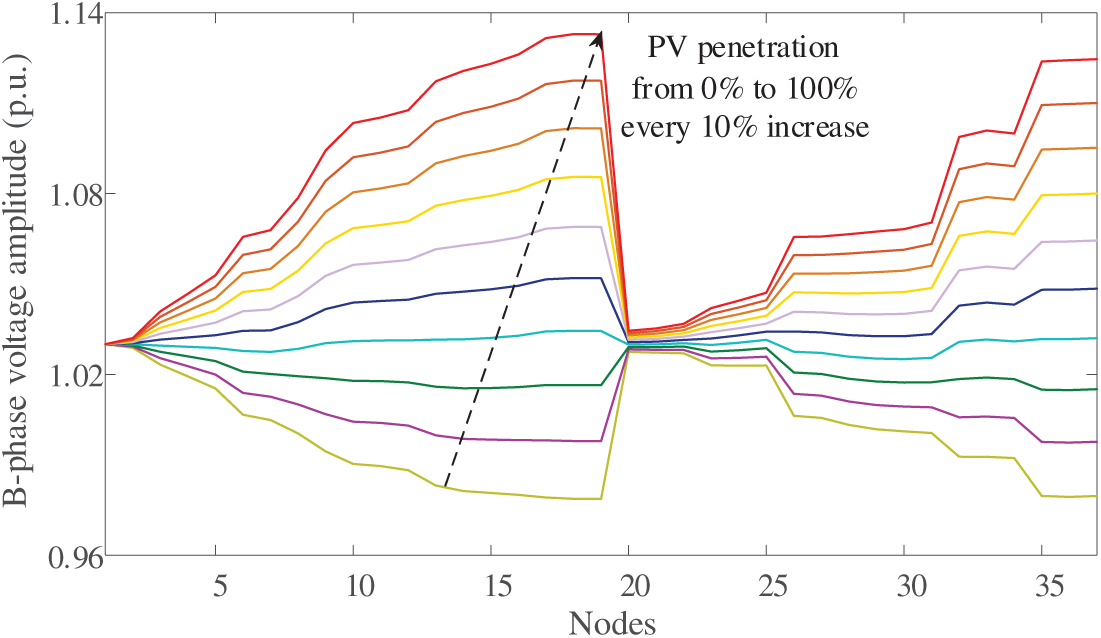
Figure 2: Relationship between PV penetration level and system overvoltage
2.2 Voltage Regulation Principle
Overvoltage occurs due to reverse power flow and inverted voltage drop characteristics at high PV penetration. In LV distribution networks, a significant three-phase imbalance requires per-phase analysis. The voltage drop between Nodes 1 and 2 is:
where V1 and V2 represent the voltages of node 1 and node 2, respectively,
Eq. (3) can be further expressed as:
In LV distribution networks, because the line parameters are generally fixed, and since the line resistance R in LV networks is usually much higher than the reactance X (usually R/X > 10), the voltage drop is mainly related to active power P2.
In traditional passive distribution networks, load power (PL > 0, QL > 0) absorbs energy from the grid, resulting in a monotonic decrease in voltage along the feeder direction (i.e., V1 > V2). When PV systems are deeply integrated, their active power output PG < 0 (considered as a negative load) reverses the net power flow:
This reverses line current and the sign of the voltage drop term (Eq. (3)), causing feeder-end voltage rise (as shown in Fig. 3). For λ > 70%, voltages exceed the 1.07 (p.u.) safety threshold.
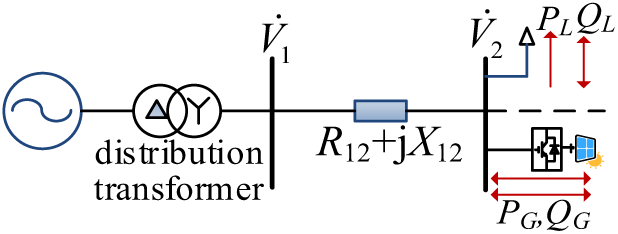
Figure 3: Diagram of voltage drop in a typical distribution network
2.3 Voltage Regulation Method Classification
Different control methods for PV inverters in LV distribution networks are shown in Fig. 4. In Fig. 4a, the distributed control strategy architecture of PVs is illustrated. At the same time, Fig. 4b presents the centralized control strategy architecture. In Fig. 4a, each PV inverter receives the grid operation parameters (mainly voltage amplitude, Vi) of the connected node in real-time via a local measurement unit and adjusts its active and reactive power output accordingly.
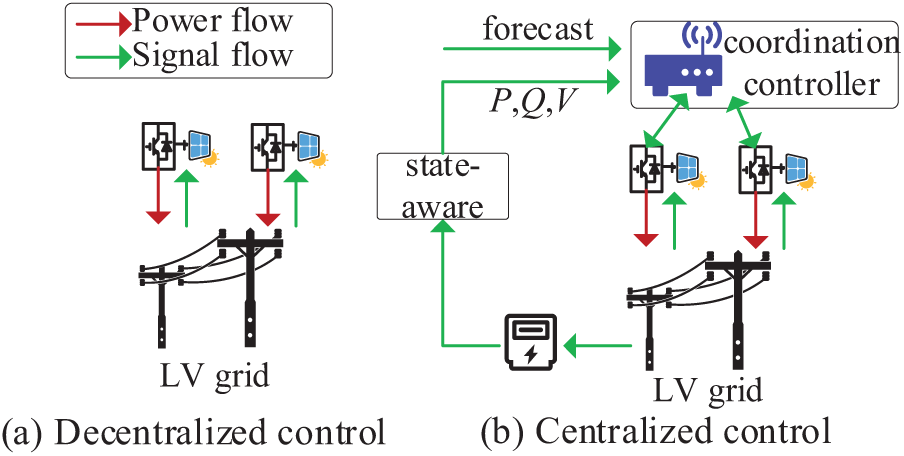
Figure 4: Schematic of the different control methods of PV inverters in LV distribution networks
Fig. 5 illustrates the PV inverter power regulation mechanism with the grid point voltage amplitude as the input. Based on this, the reactive power Q(i) output by the i-th PV inverter can be expressed as the following control equations:
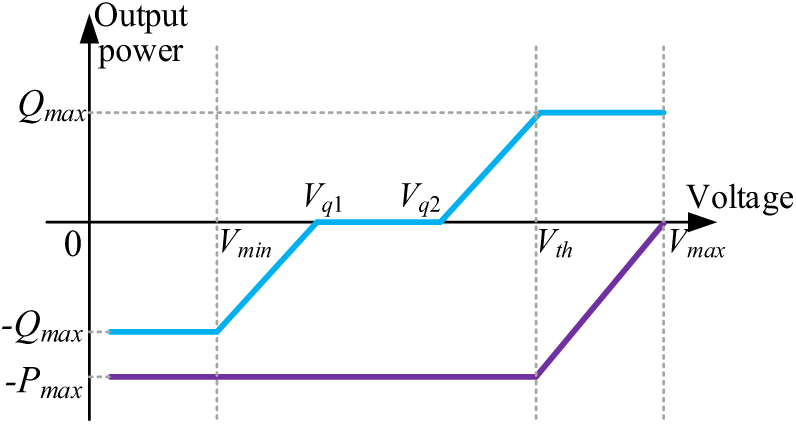
Figure 5: The method of discretization of droop-based control methods
where Vmin is the lower voltage limit, Vth is the upper voltage limit for reactive power, Vq1 and Vq2 are the reactive power zero stages, and Qi,max is the maximum reactive power of the i-th PV inverter.
Similarly, the grid-output active power P(i) of the i-th PV inverter can be expressed as:
where Vmax represents the upper voltage limit, and Pi,max denotes the PV output of the i-th PV inverter at a particular moment under Maximum Power Point Tracking (MPPT).
However, traditional droop-based control methods also have inherent limitations. Because they lack global information coordination and optimization abilities, their regulation efficiency is usually not globally optimal (making it hard to reach a Pareto optimal state). Additionally, their control effectiveness can be influenced by local measurement errors, changes in dynamic loads, and conflicting regulation behaviors of neighboring nodes, which may lead to voltage fluctuations or inadequate regulation responses.
In Fig. 1, using the widely adopted household AMI, the system can regularly gather and summarize load data from nodes throughout the entire network, transmitting it to the central coordination controller via the communication network, thus providing real-time data support for overall regulation and control.
As shown in Fig. 4b, various nodes are connected to active power Pi and reactive load Qi of different capacities in the LV distribution networks. The household AMIs regularly collect and summarize load information from each node and transmit it to the coordination controller.
The nodes KPV,index connected to single-phase or three-phase PV inverters establish bidirectional communication with the coordination controller through 4G/5G, power line carrier, Zigbee wireless network, etc., which not only enables the acquisition of state information such as active power and reactive power of each PV inverter, but also supports issuing control target instructions for the inverter through the coordination controller.
The centralized control strategy can achieve the optimal global solution. Therefore, this paper introduces an iterative control method weighted by sensitivity coefficients to minimize variations in reactive and active power, reduce curtailed solar energy, and improve the capacity for distributed PV usage.
3 Proposed Control Strategy Principle
3.1 Power Flow Equation in LV Distribution Networks
By building the node impedance matrix of the LV distribution network as shown in Fig. 1, we can determine:
where Z represents line impedance, subscripts a, b, c, and n represent phases A, B, C-phases, and neutral point, respectively. The node admittance matrix Y is obtained from the node impedance matrix, where:
Assuming there are N + 1 nodes in the LV distribution network, where node 1 is the balanced node and the remaining N nodes are PQ nodes, the Newton-Raphson (N-R) method can be used to solve the three-phase four-wire asymmetric power flow. In polar coordinates, for the N nodes excluding the balanced node, the set of power flow correction equations after three-phase decoupling is given as follows [27]:
where Δθ and ΔV represent the correction amounts for voltage phase angle and voltage amplitude, respectively, with dimensions of 3N × 1. ΔP, ΔQ, and ΔIn denote the error magnitudes of the active equation, reactive equation, and neutral line equation, respectively. J stands for the inverse Jacobi matrix, and k indicates the k-th iteration. Since the neutral line current is generally small, its ΔIn impact is neglected, resulting in the following correction equation:
where
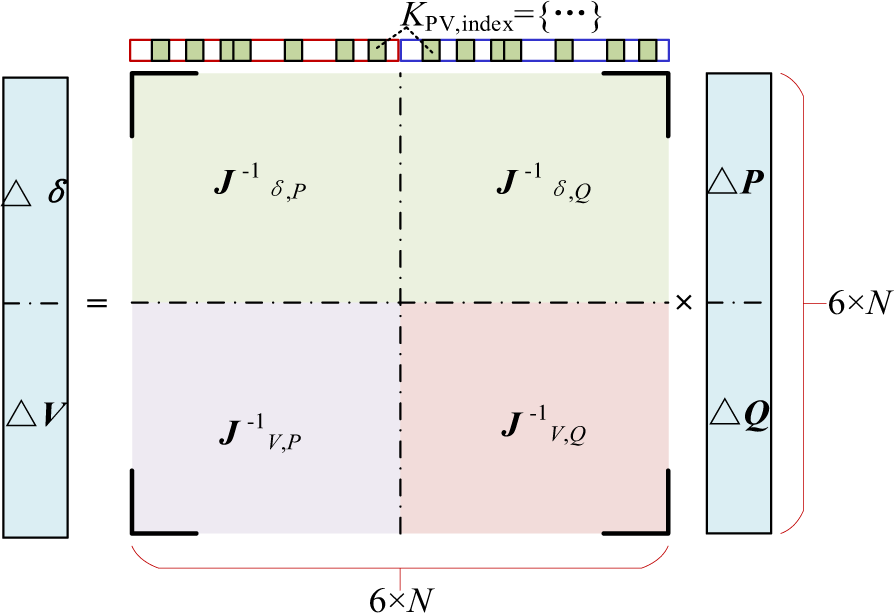
Figure 6: P/Q power flow calculation Jacobi matrix diagram
3.2 Principle of the Proposed Collaborative Control Strategy for PVs
Building upon the sensitivity analysis derived from the inverse Jacobian matrix in the previous subsection, this section presents the practical implementation of the coordinated control strategy. Under normal operating conditions, all PV inverters operate in MPPT mode. The proposed upper-level coordination strategy is activated only when voltage violations occur at certain nodes in the distribution network. At each 15-min sampling interval, smart devices collect load and PV output data. Based on this information, the power flow is recalculated, and the inverse Jacobian matrix is updated to obtain the sensitivity coefficients of each PV inverter with respect to the constrained node—reflecting how much active or reactive power adjustment at a given inverter influences the voltage at the sensitive node.
Observing Eq. (11), it can be seen that the coefficients in the inverse Jacobi matrix can be regarded as variables that cause changes in voltage phase angle and amplitude under conditions of ΔP and ΔQ variations. That is to say,
In LV distribution feeders, the adjustable nodes are the set of nodes KPV,index connected to the PV inverter. The weight of the reactive power and active power adjustment coefficients for the three-phase voltage of each node is calculated, that is:
where KPV,index is the retrieval index of the node connected to the PV inverter. Operating conditions vary in the low-voltage distribution network. We collect load and PV outputs every 15 min. After receiving the data, we recalculate the power flow to update the Jacobian inverse matrix and revise the sensitivity coefficients for each photovoltaic.
Therefore, this paper iteratively optimizes the reactive power adjustment of each PV inverter using the key coefficients in the Jacobi inverse matrix. The goal is to minimize the reactive power increase and maximize the reduction of overvoltage levels in the distribution area. When the reactive power of all PV inverters in the LV distribution networks reaches its maximum capacity limit, and the overvoltage level in the distribution area still cannot be kept within the specified range, the active power of each PV inverter is further optimized and reduced using the key coefficients in the Jacobi inverse matrix. This involves performing minimum-capacity curtailment of PV power to prevent the voltage in the distribution area from exceeding the limit.
3.3 The Steps and Flowchart of the Proposed Voltage Coordinated Control Strategy
In this paper, sensitivity coefficients are used to prioritize and coordinate PV inverters: we first leverage reactive power support from the most sensitive inverters. If reactive power resources are exhausted and the voltage violation persists, active power curtailment is applied, again guided by the sensitivity coefficients, to achieve the minimum necessary reduction in PV output. This iterative process ensures efficient voltage regulation while minimizing both reactive power usage and active power curtailment. The flowcharts for reactive power-voltage coordinated regulation and active power-voltage coordinated regulation proposed in this paper are shown in Fig. 7, with the specific steps as follows:
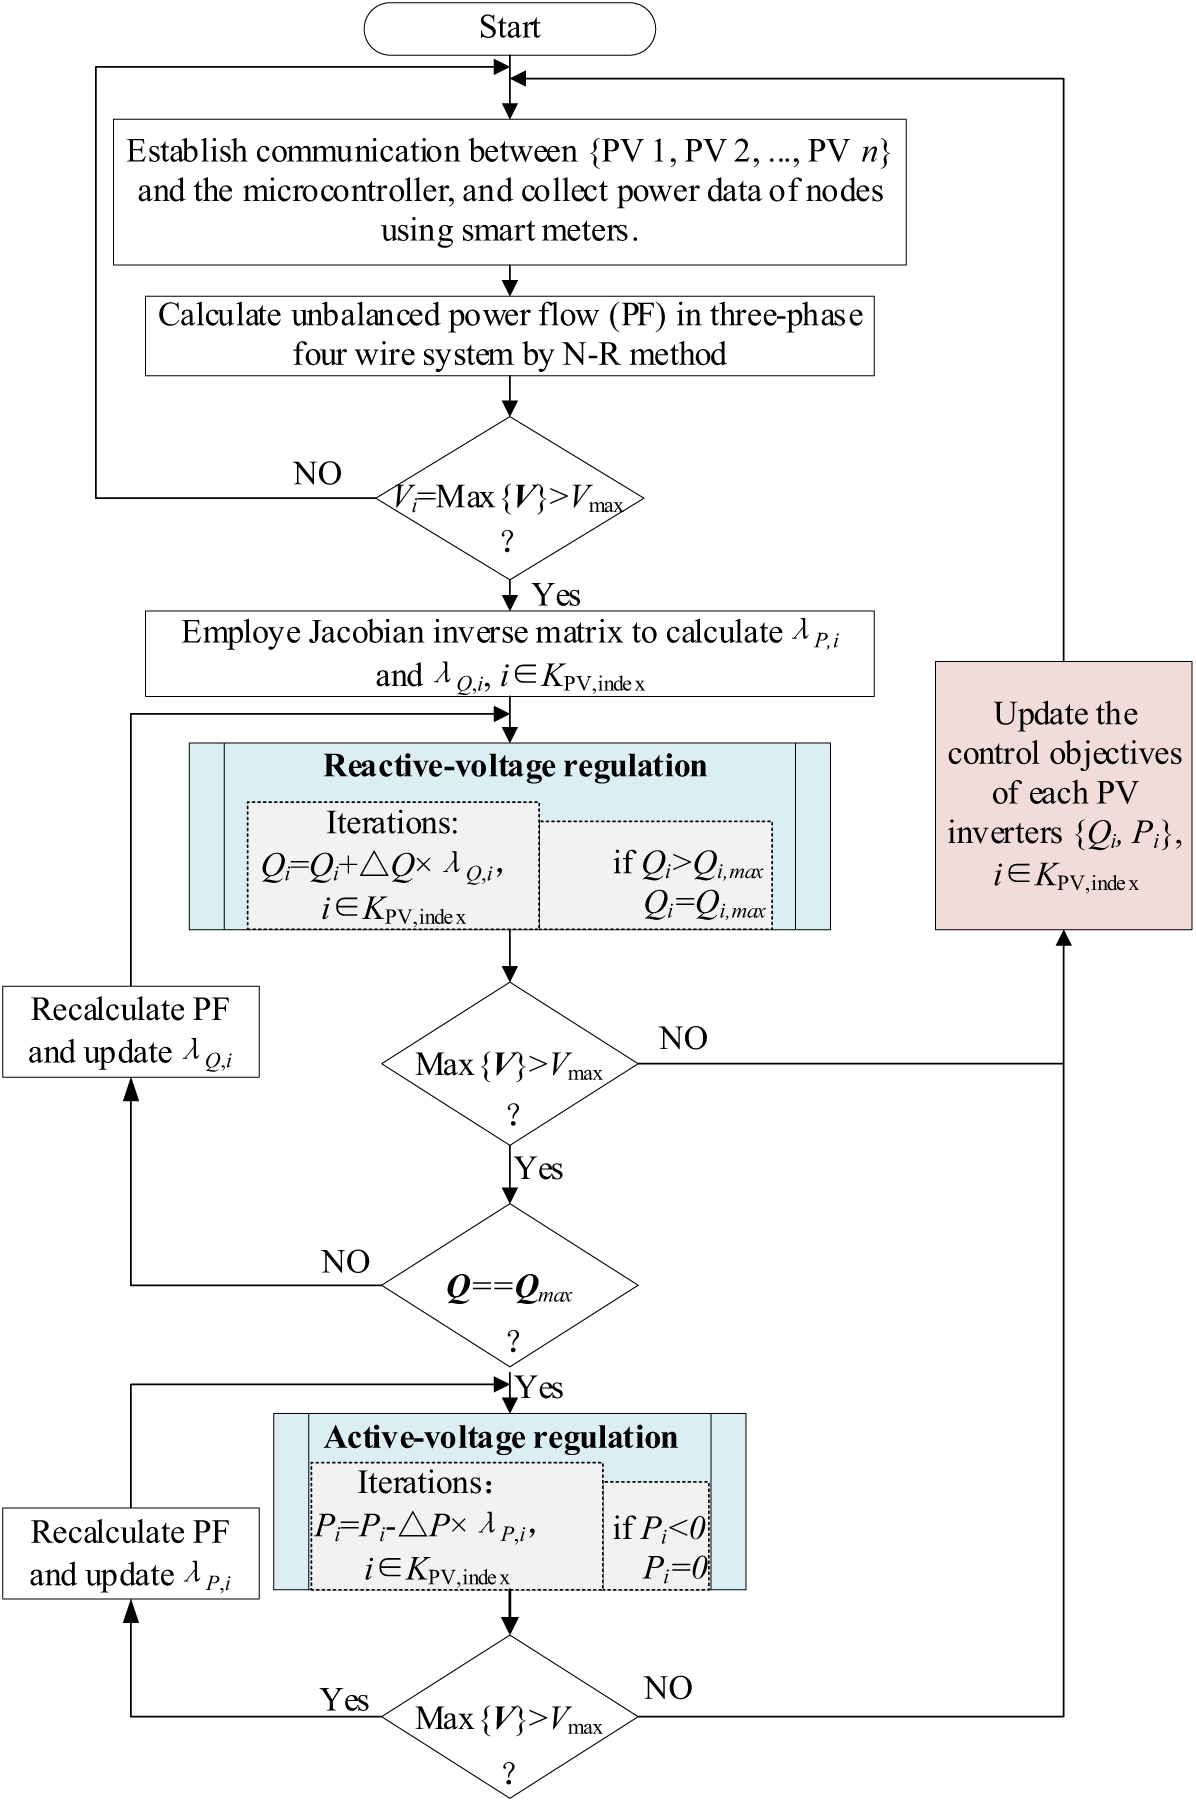
Figure 7: The flowchart of the proposed voltage coordinated control strategy
Step 1: Use the power information and network topology data of the LV distribution network nodes to solve the three-phase four-wire unbalanced power flow using the N-R method. Assume the distribution network has a total of N+1 nodes, where the secondary side of the distribution transformer is a balanced node, and the remaining N nodes are PQ nodes. The set of node numbers connected to the PV inverter is denoted as KPV,index;
Step 2: After the power flow iteration converges, evaluate whether the highest voltage among the three-phase voltages at each node in the LV distribution system—that is, among the 3 × N voltages—exceeds the limit. If it does not, no coordinated control is needed, and the process returns to Step 1; if it does, identify the node number and phase number corresponding to the maximum voltage;
Step 3: Calculate the inverse matrix J−1 of the Jacobi matrix, utilize Eq. (12), and compute the weight values of the reactive power and active power adjustment coefficients corresponding to the three-phase voltage of each node.
Step 4: Perform reactive power-voltage coordinated regulation by iteratively updating the reactive power level of each PV inverter, as follows:
where ΔQ represents the step size for reactive power iteration, which can be set based on the adjustment capability of the PV inverter, while also considering the iteration speed, the optimal value is 0.5 kVar. After updating all PV inverter reactive power settings, it is necessary to check whether the reactive power setting exceeds the inverter’s maximum capacity, which is given as follows:
where Si,max is the rated capacity of the PV inverter, which is generally 1.1 times the rated power Pi,max. If the maximum capacity is exceeded, the reactive power setting value of the PV inverter is set to Qi = Qi,max;
Step 5: Determine whether the maximum voltage among the 3 × N voltages exceeds the limit. If it does not, the controller issues a command to update the reactive power control targets for each PV inverter and then returns to Step 1. If the voltage exceeds the limit, further determine whether the reactive power settings of all PV inverters at all nodes have reached their maximum capacity values. If not, recalculate the power flow, update λQ,i, and return to Step 4. If they have reached the maximum values, it indicates that active power adjustment is needed, meaning a small amount of light should be cut back to prevent voltage from exceeding the limit.
Step 6: Perform active power-voltage coordinated regulation by iteratively updating each PV inverter’s active power levels, which is as follows:
where ΔP represents the step size for active power iteration, which can be set based on the adjustment capability of the PV inverter, while also considering the iteration speed; the preferred value is 0.2 kW.
Step 7: Determine whether the maximum voltage among the 3 × N voltages exceeds the limit. If it does not, the controller issues a command to update the active power control targets of each PV inverter and then returns to Step 1. If the voltage exceeds the limit, the power flow is recalculated, λP,i is updated, and the process returns to Step 6 until the voltage limit requirement is met.
4.1 Simulation System Parameters
This study adopts the three-phase four-wire LV distribution network model shown in Fig. 1, with line parameters set according to the IEEE European Low Voltage Test Feeder standard [28]. The main line uses 2c_16 cable, which exhibits significant resistance-dominant characteristics (R = 1.15 Ω/km, X = 0.088 Ω/km, thus R/X > 10), resulting in voltage drop mainly influenced by the distribution of active power (contribution rate > 90%). This electrical characteristic has a significant influence on the design of future voltage regulation strategies.
In the LV distribution network, a total of 17 nodes are connected to the distributed PV inverters (refer to Table 1 for details on capacity and location), encompassing both single-phase and three-phase grid-connected inverters. The capacity of single-phase inverters ranges from 7 to 9 kW, while that of three-phase inverters spans from 21 to 27 kW. By default, all inverters operate in a constant power factor mode (cos φ = 0.95), a configuration that aligns with the typical PV access characteristics in rural China.
Based on measured data from a rural suburb in China, Fig. 8 illustrates the daily load curve of a typical residential user: a peak in electricity consumption occurs between 18:00 and 21:00 (peak load of 3.5 kW). In contrast, the midday load is only 30% of the peak. This “low during the day and high at night” load characteristic poses a structural contradiction with PV output.
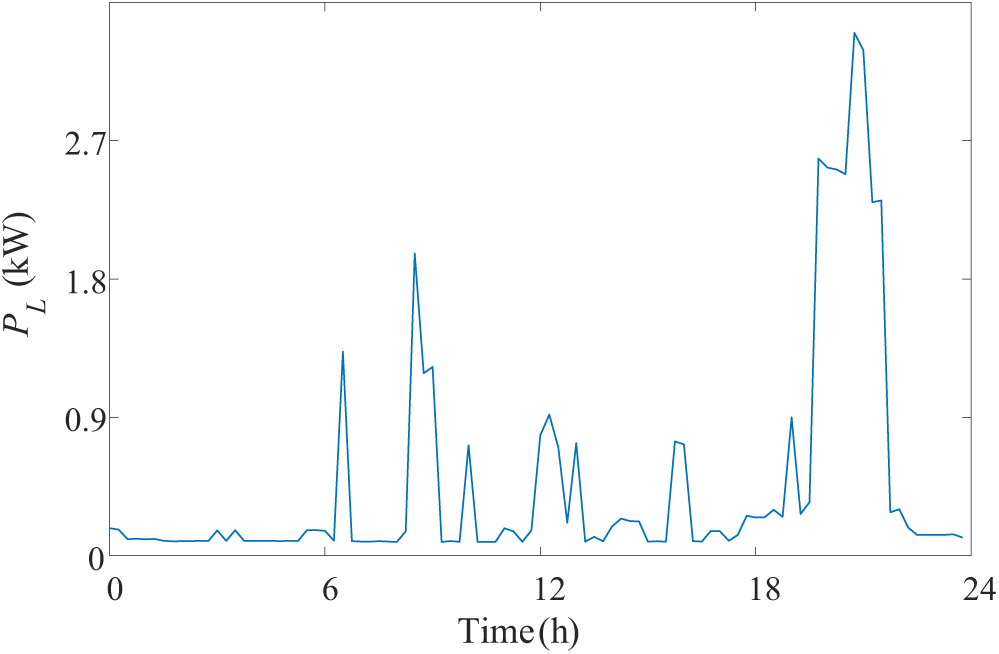
Figure 8: Typical daily residential load curve
The PV output curve under cloudy weather, shown in Fig. 9, indicates that the PV output reaches its maximum (installed capacity of 85%) between 11:00 and 2:00 p.m., during which the load demand is at its lowest, resulting in a net power flow Pnet = PG + PLoad < 0 (reverse power flow). This phenomenon triggers a reversal in the line voltage drop characteristics, causing the voltage at the end nodes (such as 17–19 in Fig. 1) to rise above 1.08 p.u., which seriously violates the voltage deviation limits specified in GB/T 12325-2008.
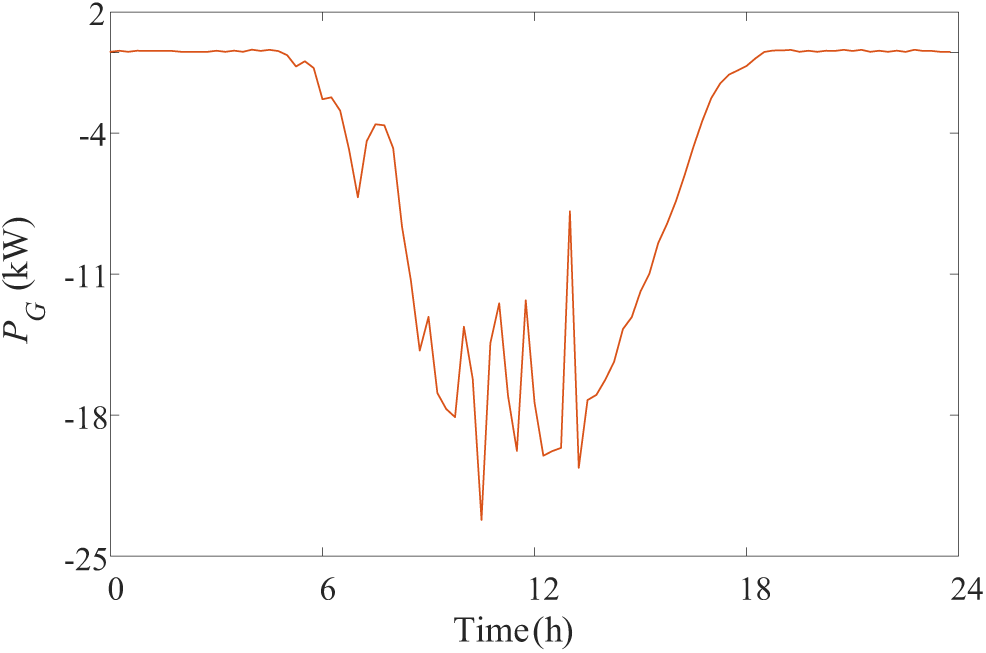
Figure 9: Typical solar PV output curve
Based on the typical day simulation of the LV distribution networks in Fig. 1, Fig. 10 compares the effects of voltage control strategies through a three-dimensional spatiotemporal distribution diagram (horizontal axis: 0–24 h/96 sampling points; vertical axis: 1–37 nodes; y-axis: voltage amplitude). Specifically, Fig. 10a–c shows that under uncontrolled conditions (PV MPPT operation + fixed power factor cos φ = 0.95), the PV high-generation period (08:00–16:00) triggers a global voltage rise due to power flow reversal, especially at the line end nodes (17–19, 35–37)—where all three-phase voltages exceed the safety limit of 1.07 p.u. (e.g., node 19-B phase reaches 1.142 p.u.), fully verifying the necessity of voltage control.
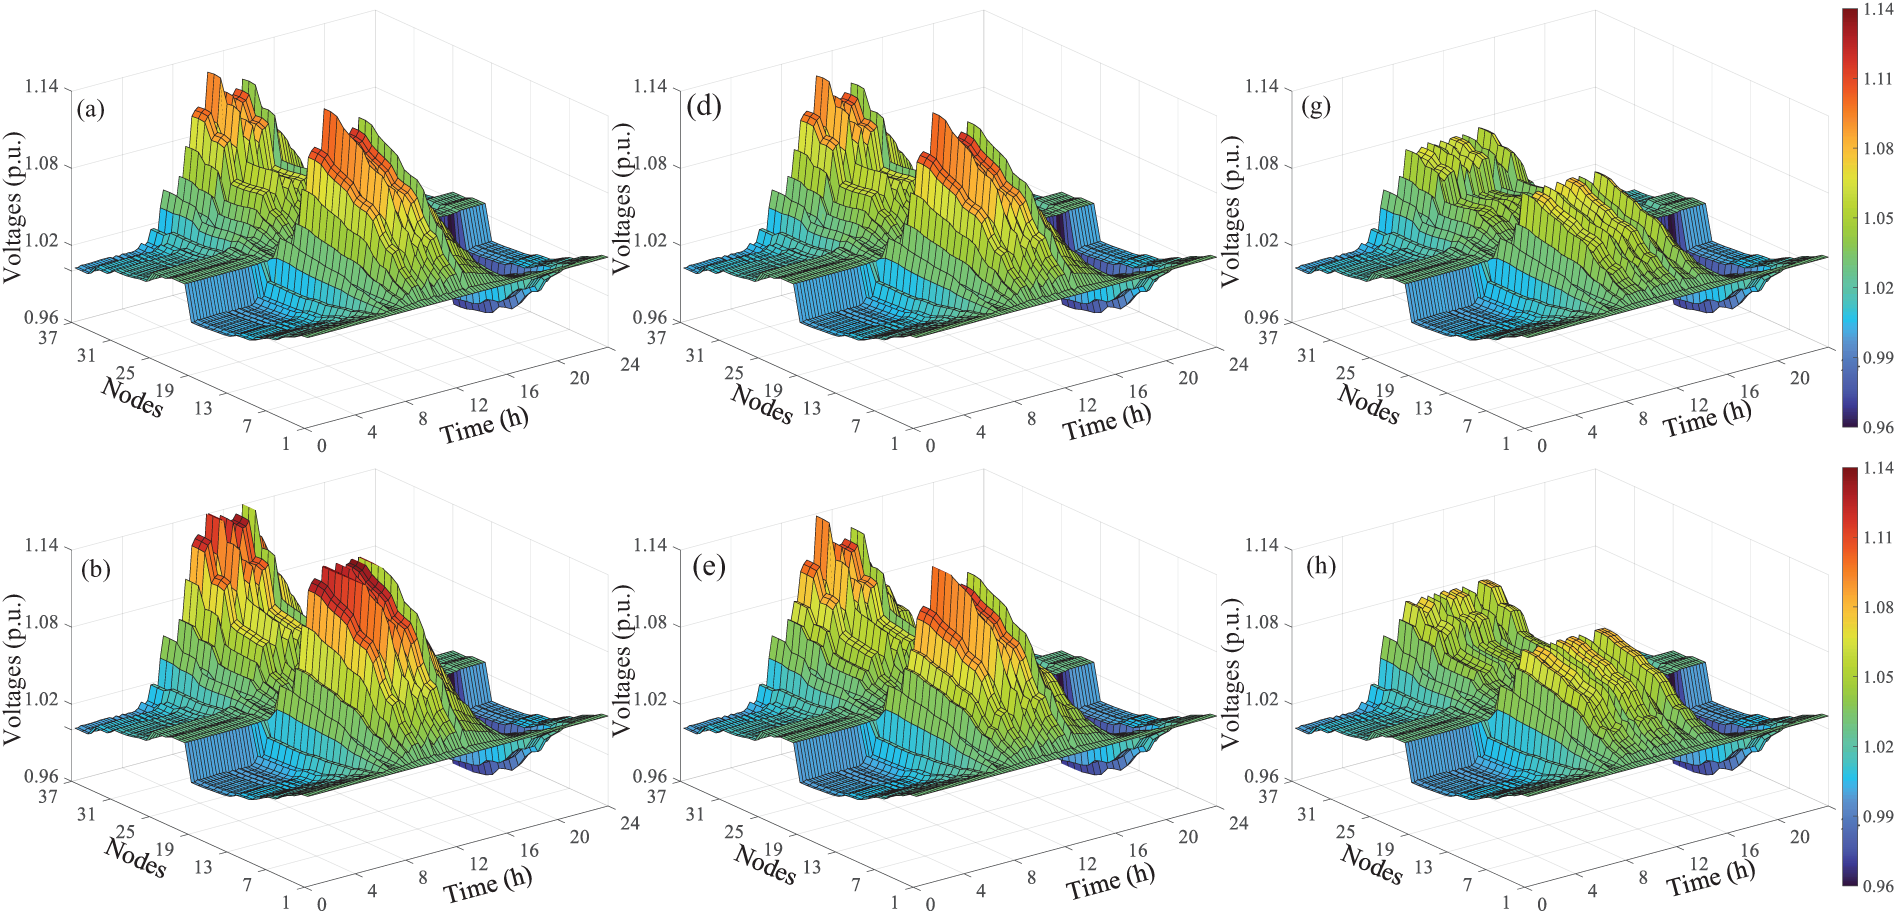
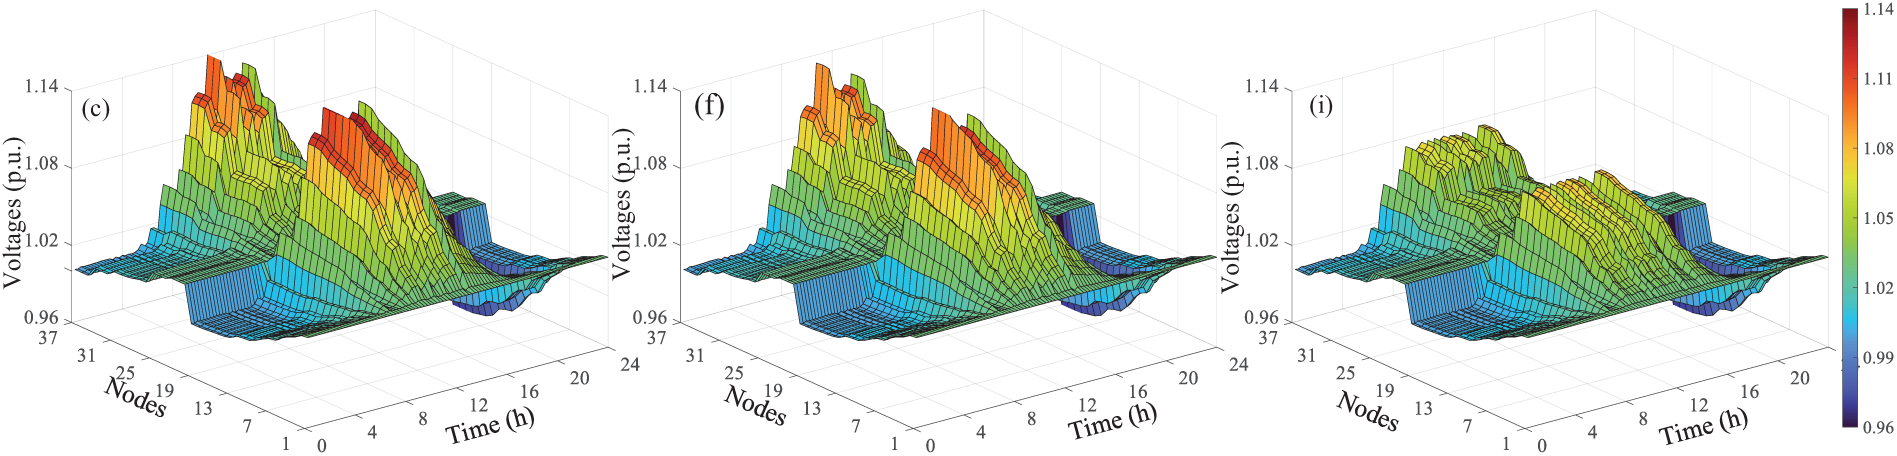
Figure 10: Voltage regulation results of LV distribution feeders. Voltage distribution at each node during a day with (a–c) at a fixed power factor; (d–f) are adopting the reactive power voltage regulation method; (g–i) are adopting the active power voltage regulation method
After adopting the voltage control strategy proposed in this paper, Fig. 10e,f shows the regulation effect of implementing only reactive-voltage control (without curtailment). The results indicate that although there is a slight decrease in the A, B, and C phase voltages, they still exceed the voltage upper limit of 1.07 at certain moments. Since R/X > 10, it is necessary to introduce active-voltage coordinated control (strategic curtailment) to ensure fundamental voltage safety by reducing the PV active power output.
After further introducing the active-voltage coordinated control strategy proposed in this paper, the voltage distributions shown in Fig. 10g–i indicate that the system successfully achieves global voltage security management and control. The amplitude of the three-phase voltage is strictly constrained within the limit of 1.08 p.u. (e.g., the peak value of phase B at the end node 19 decreases to 1.069 p.u.).
To analyze the adjustment amounts of active and reactive power at each moment, the active power of all PVs in the system at that specific moment is superimposed. The result is shown in Fig. 11. The upper curve in Fig. 11 represents the output of all PVs operating at MPPT before voltage control, while the lower curve represents the algebraic sum of all PV output power after active-voltage control. The shaded area between the two curves represents the amount of light curtailment after active-voltage control. The smaller the area of abandoned PV power, the better.
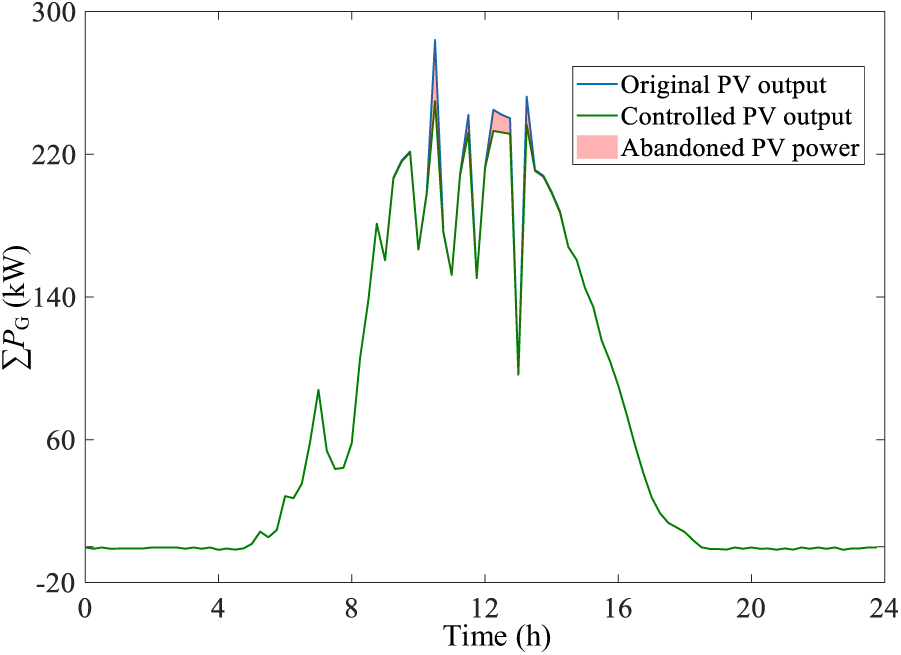
Figure 11: Situation of active power increase
The light curtailment rate is defined as:
where
Fig. 12 demonstrates that reactive-voltage control substantially increases total PV reactive power output (upper curve vs. lower baseline at cos φ = 0.95, shaded area). However, in this resistive-dominant LV network (R/X > 10), reactive power adjustments exhibit limited effectiveness in voltage regulation. Consequently, minimal active power curtailment remains essential to resolve persistent overvoltage violations.
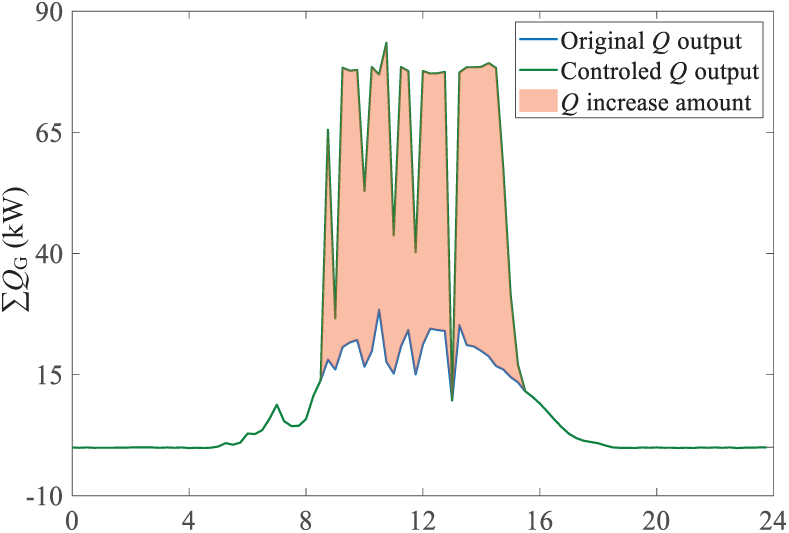
Figure 12: Increase in the reactive power
4.2.2 Case 1: Reactive Control Sufficient
At 9:00 a.m., the voltage deviation was relatively small. It was possible to maintain the voltage within limits solely through reactive power-voltage regulation, as shown in Fig. 13. Prior to voltage control, the A-phase voltage of the three-phase system (A, B, and C) was 1.1. The B-phase voltage was 1.09, both exceeding the upper voltage limit. After reactive power-voltage regulation, the A, B, and C-phase voltages all dropped below 1.08, meeting the requirements.
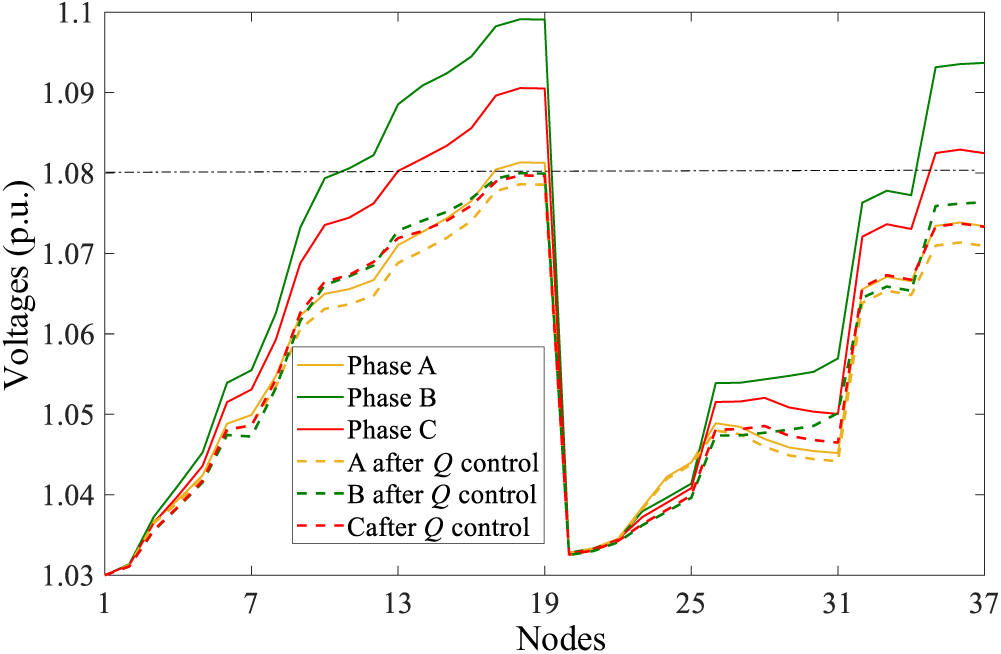
Figure 13: Nodes Voltages after controlling reactive power Q
4.2.3 Case 2: Coordinated P/Q Control Required
At 10:45 a.m., the active power reached a relatively high amplitude. The control results are shown in Fig. 14. Before voltage regulation, all three-phase voltages exceeded 1.12, with phase A exceeding 1.16, indicating a severe voltage violation. After reactive-voltage regulation, all three-phase voltages slightly decreased to 1.12–1.14, but still exceeded the upper voltage limit, requiring further adjustment through active-voltage regulation. After active-voltage regulation, the voltages of phases A, B, and C all fell below 1.08, meeting the safety standard.
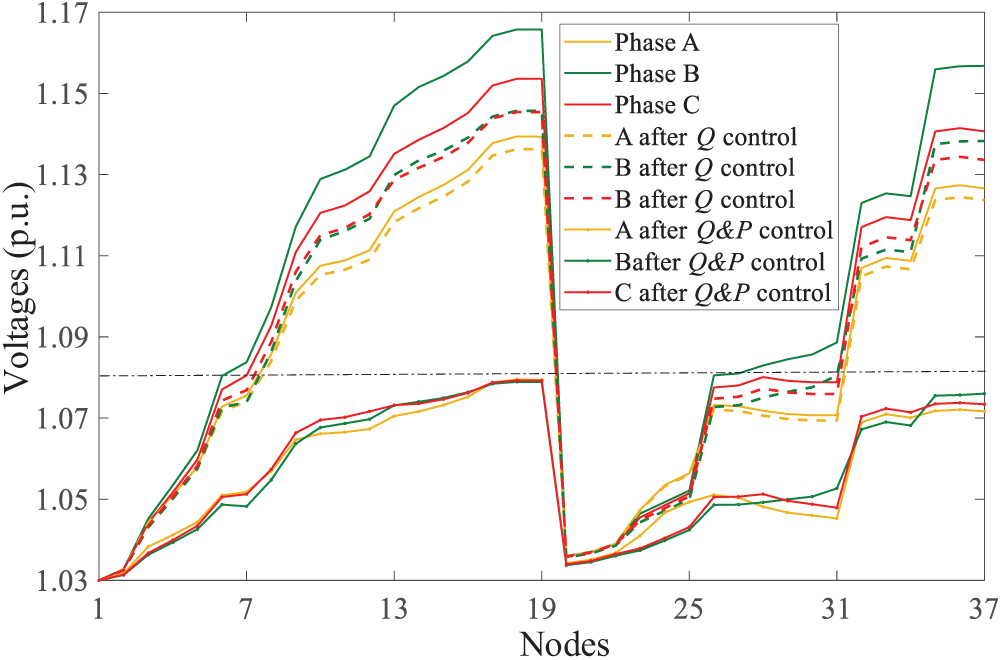
Figure 14: Nodes Voltages after controlling PV power of P and Q
For Case 1, it suffices to adjust the reactive power to ensure the voltage remains within limits. The iterative adjustment process is illustrated in Fig. 15. After 63 iterations, the voltage remains within limits, and the reactive power increases nearly linearly from an initial value of around 20 to 67 kVar. For Case 2, reactive-voltage control must be performed first, followed by active-voltage control. During the reactive-voltage control process, the reactive capacity is limited after 80 iterations, and the reactive power increases from 32 to 75 kVar. Further active-voltage control is required, and after 90 iterations, the voltage meets the requirements. At this point, the total reactive power of the PV system decreases linearly from 280 to 249 kW, resulting in 31 kW of curtailed solar power, which ensures the voltage remains within limits.
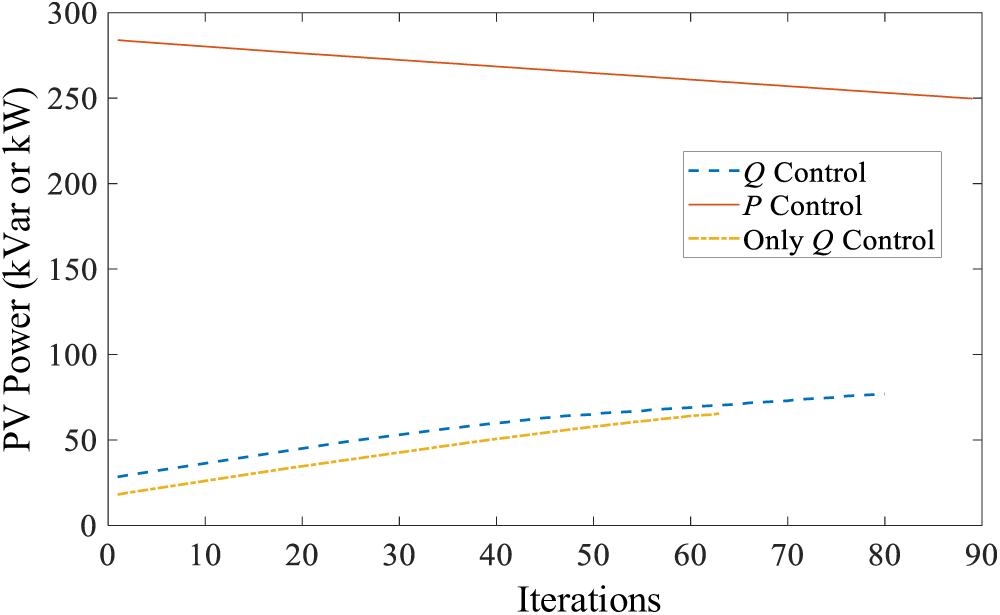
Figure 15: Changes in PV power with iteration times
This paper introduces an iterative control strategy based on centralized control, weighted by sensitivity coefficients, to reduce reactive and active power fluctuations, decrease curtailed solar power, and enhance the consumption capacity of distributed PV systems.
Although it requires centralized control based on communication, it can significantly reduce the amount of curtailed solar power. In the simulation system, this paper compares its method with the distributed voltage droop control methods in Eqs. (6) and (7) and Fig. 5.
The voltage regulation results obtained using the method in Fig. 5 are presented in Fig. 16. Similarly, after only performing reactive-voltage adjustment, the voltage amplitude decreases but still exceeds the upper limit during a day with high PV power generation, necessitating active-voltage regulation control, as shown in Fig. 16a. After performing voltage-active power control, the voltage regulation results are shown in Fig. 16b, and the voltage no longer exceeds the upper limit.
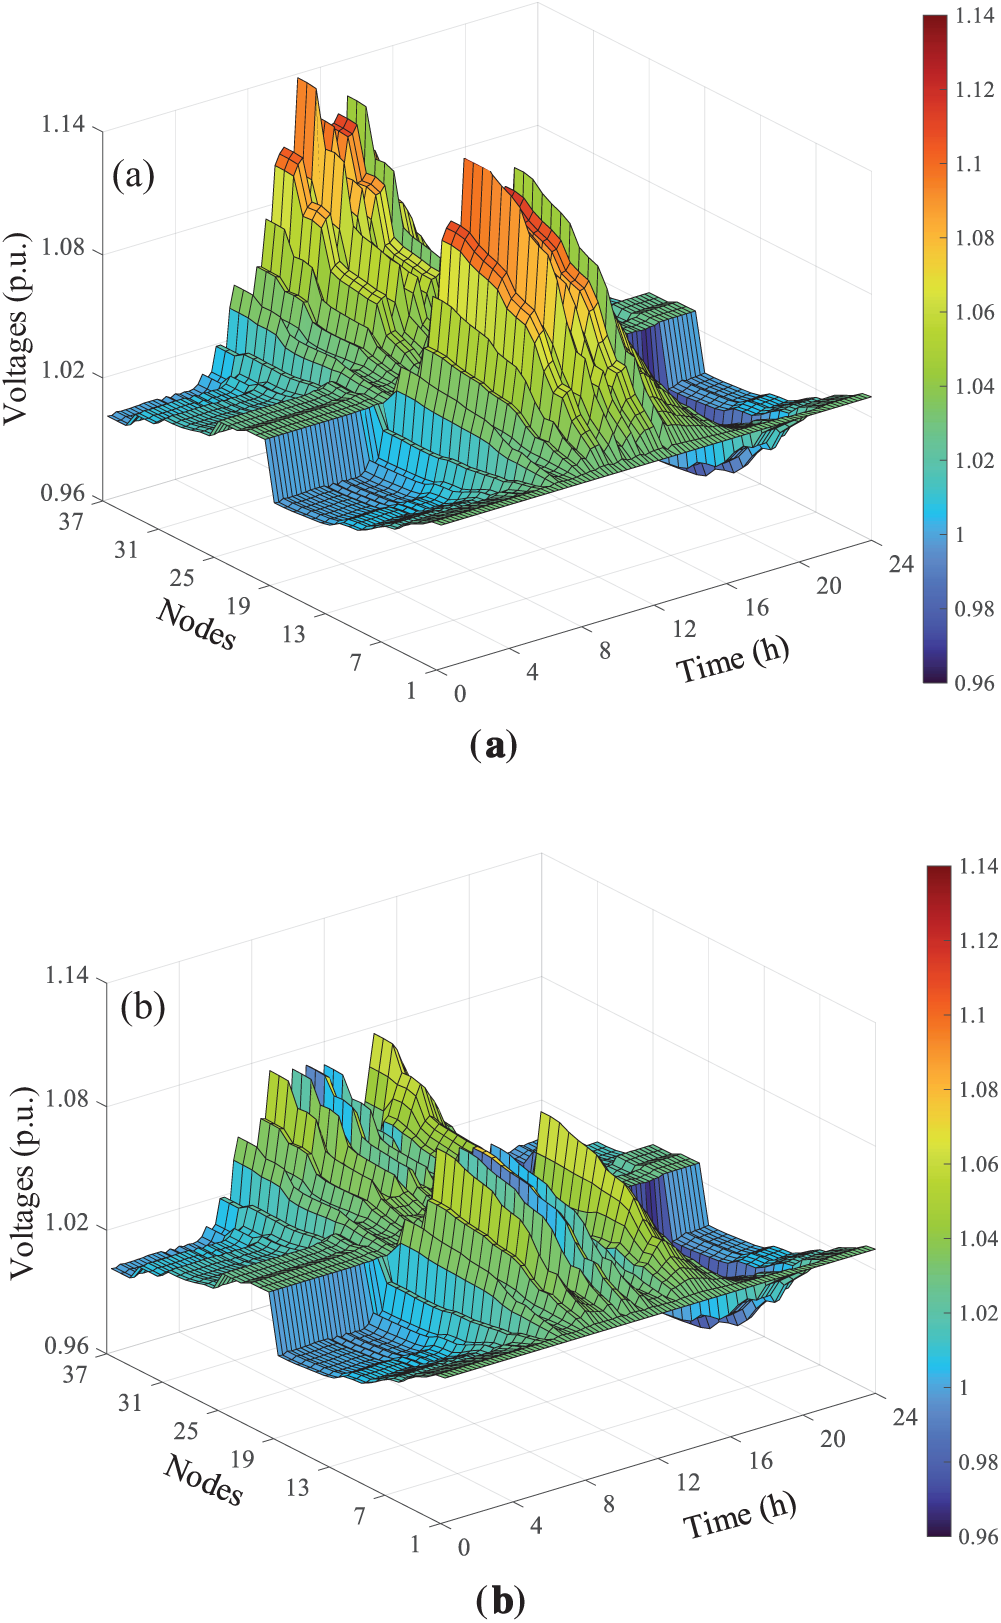
Figure 16: Results after traditional droop-based voltage control. (a) Only performing reactive-voltage adjustment; (b) After performing voltage-active power control
To compare the amount of curtailed solar power generated by different methods, Fig. 17 shows the total PV power generation before and after active power regulation. The shaded area in Fig. 17 represents the amount of curtailed solar power during a typical day. The figure clearly shows that the drop in active power after traditional droop-based voltage regulation is significantly greater than with the proposed method in Fig. 11. This indicates that the proposed method possesses the property of global optimality, can substantially reduce the amount of curtailed solar power, and enhance the PV power consumption capacity.
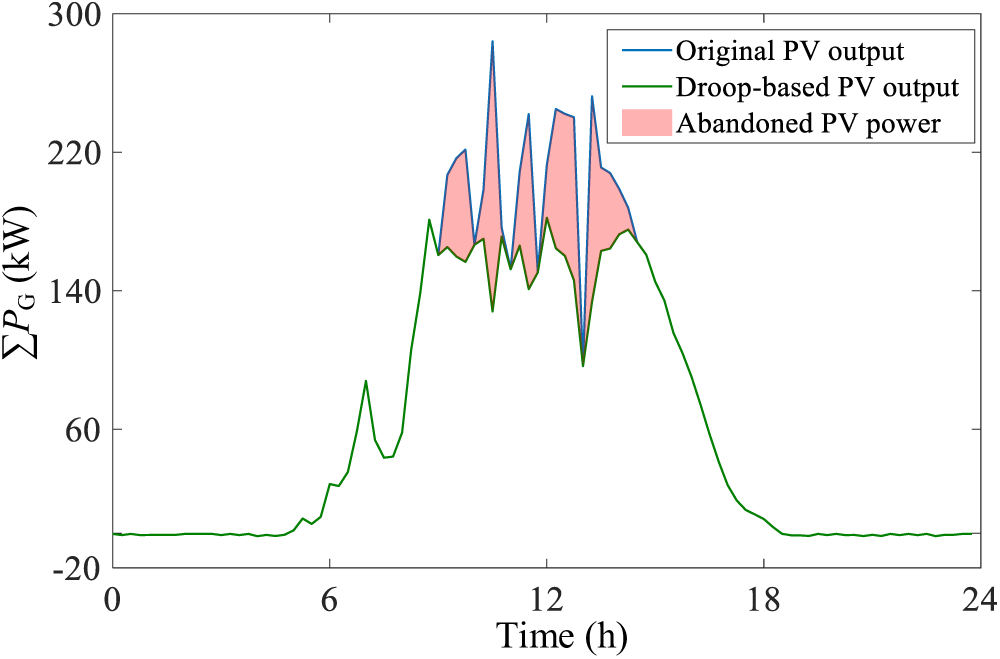
Figure 17: The situation of PV abandonment using traditional methods
Fig. 18 shows the corresponding system’s total PV reactive power before and after traditional droop-based reactive voltage regulation. When the PV power generation is high, although the increase in reactive power is significant, due to R/X > 10, the voltage regulation capability is weak. When the PV power generation is low and the system user load is high, the PV generates reactive power to support the system voltage. However, overall, due to R/X > 10, the reactive regulation effect is minor. Compared to Fig. 12, the traditional method does not select the most sensitive nodes for voltage regulation, resulting in a larger reactive increment but with increased regulation ability, which necessitates active voltage regulation.
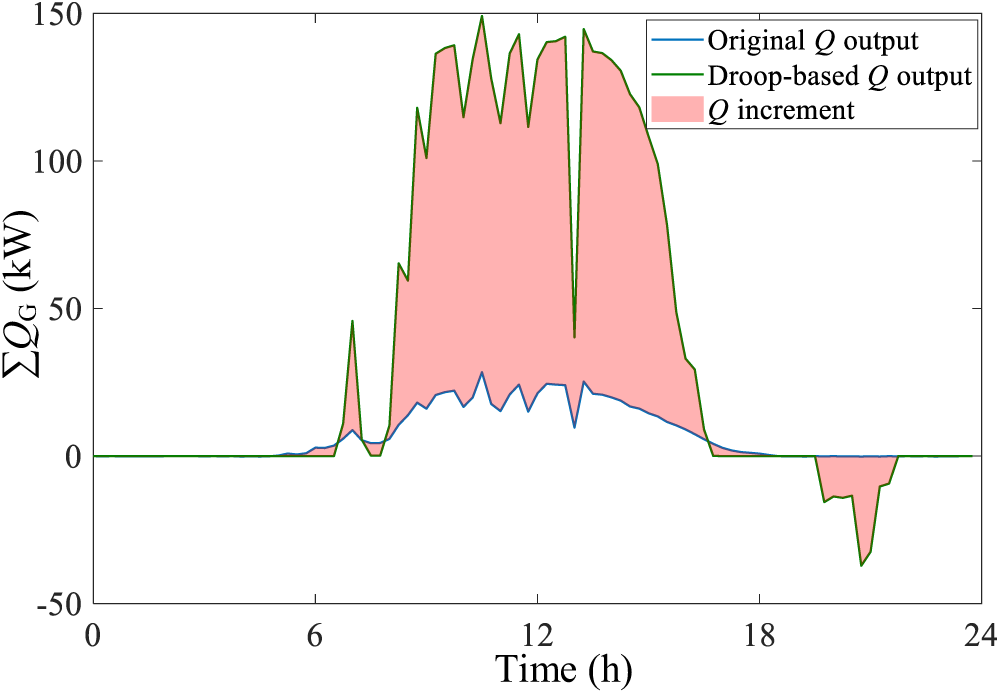
Figure 18: The situation of Q increasing using traditional methods
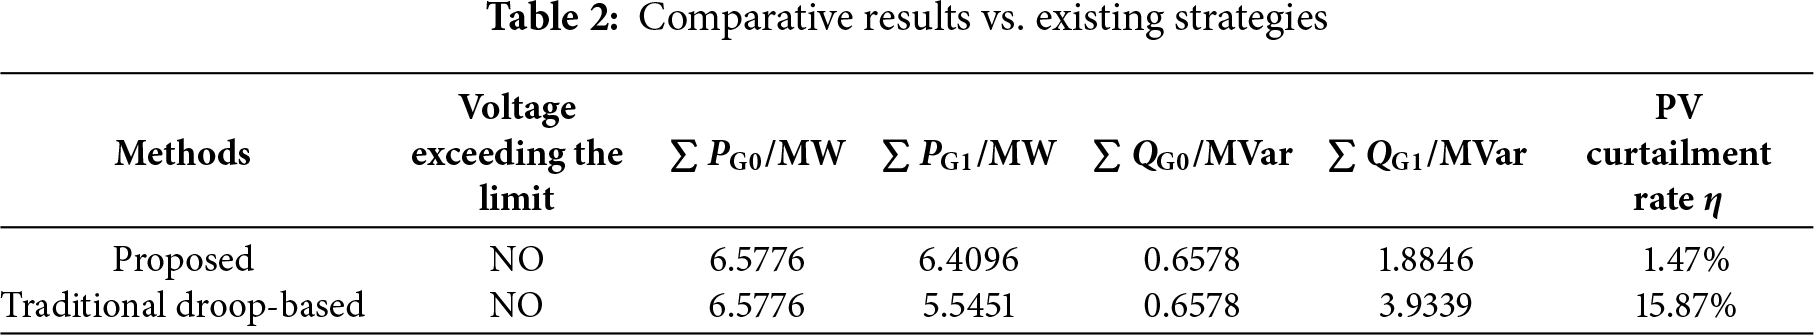
Comparative results vs. the traditional droop-based method are shown in Table 2. Taking a typical day as an example, both strategies can control the voltage within the operating range. The proposed method reduces the daily power output of photovoltaics (15 min, 96 points) from ∑PG0 = 6.5776 MW to ∑PG1 = 6.4096 MW, whereas the traditional droop-based method requires a reduction to 5.5451 MW. The proposed method reduces 0.8645 MW. The active power regulation amount is also reduced from 3.9339 to 1.8846 MVar, thereby reducing the total network loss. The curtailment rate of the traditional method is approximately η = 15.87%, which is significantly higher than the 1.47% of the proposed scheme.
The proposed method calculates and adjusts the sensitivity coefficient weight, utilizing an iterative approach to update the PV adjustment amount. Compared to traditional methods, it can control the voltage to not exceed the limit by minimizing the amount of wasted light. The shortcomings of the proposed method include the requirement for collecting structural and load information of the distribution network, limited communication, potential cost increases, and the need for compatibility with the protocols of different PV inverter brands when issuing instructions. Therefore, in some areas where PV penetration is not very high, it can be combined with distributed control methods that do not rely on communication.
While the proposed method has been validated on a 37-node test system, it is also applicable to larger and more complex distribution networks. The core approach remains unchanged—only the dimension of the Jacobian matrix increases with node count. Given the sparse nature of distribution networks, this does not significantly impact computational burden, ensuring the strategy’s scalability without compromising efficiency. Additionally, the proposed method can be applied to medium-voltage distribution networks through simple transformations. In medium voltage distribution networks, the impact of reactive power regulation is more effective due to the smaller R/X ratio.
This paper proposes a centralized reactive and active power collaborative control strategy for rural LV distribution networks with high penetration of PV systems. The aim is to optimize the control of reactive and active power of household PV inverters, improve the voltage quality in LV distribution networks, avoid voltage violations, and minimize the amount of curtailed PV power. Key conclusions:
(1) Voltage magnitude is highly sensitive to active power in R-dominated LV networks (R/X > 10). Selecting a centralized control strategy to optimize both reactive and active power from photovoltaic inverters enhances the distribution system’s capacity for photovoltaic consumption.
(2) By optimally allocating P/Q adjustments using Jacobi-based weights, the strategy eliminates voltage violations with minimal curtailment (η = 1.47%). The proposed method significantly surpasses traditional droop control (η = 15.87%). The proposed method reduces the total daily power output of photovoltaics (15 min, 96 points) from ∑PG0 = 6.5776 MW to ∑PG1 = 6.4096 MW, whereas the traditional droop-based method requires a reduction to 5.5451 MW. This thereby increases PV hosting capacity while requiring minimal communication infrastructure.
The next research focus is on how to perform joint voltage regulation with OLTC and reactive power compensation devices.
Acknowledgement: The authors would like to thank State Grid Jiangsu Electric Power Co. for their support.
Funding Statement: This research was supported by the Provincial Industrial Science and Technology Project of State Grid Jiangsu Electric Power Co., Ltd. of China, grant number JC2024118.
Author Contributions: The authors confirm contribution to the paper as follows: Conceptualization, Xuming Hu, Nan Hu and Xinsong Zhang; methodology, Xiaocen Xue and Xiuyong Yu; software, Xiuyong Yu; validation, Xuming Hu and Na Li; formal analysis, Xiaocen Xue and Xiuyong Yu; investigation, Xuming Hu; resources, Nan Hu and Xinsong Zhang; data curation, Xinsong Zhang and Xiuyong Yu; writing—original draft preparation, Xinsong Zhang and Xiuyong Yu; writing—review and editing, Xuming Hu, Na Li and Nan Hu; visualization, Xiuyong Yu; supervision, Nan Hu and Xinsong Zhang; project administration, Xinsong Zhang; funding acquisition, Xinsong Zhang. All authors reviewed the results and approved the final version of the manuscript.
Availability of Data and Materials: The data that support the findings of this study are available from the corresponding author, [Xiuyong Yu], upon reasonable request.
Ethics Approval: Not applicable. For studies not involving humans or animals.
Conflicts of Interest: The authors declare no conflicts of interest to report regarding the present study.
References
1. Torquato R, Freitas W, Trindade FCL. Practical method for first-screening assessment of new PV connection requests on unbalanced low voltage distribution systems. Trans Power Deliv. 2023;38(1):363–75. doi:10.1109/tpwrd.2022.3187273. [Google Scholar] [CrossRef]
2. Soleimani P, Roghanian M, Heidari M, Heidari A, Pinnarelli P, Vizza M, et al. Refining hybrid energy systems: elevating PV sustainability, cutting emissions, and maximizing battery cost efficiency in remote areas. Energy Nexus. 2025;18(1):100452. doi:10.1016/j.nexus.2025.100452. [Google Scholar] [CrossRef]
3. Gui Y, Nainar K, Bendtsen JD, Diewald N, Iov F, Yang Y, et al. Voltage support with PV inverters in low-voltage distribution networks: an overview. J Emerg Sel Top Power Electron. 2024;12(2):1503–22. doi:10.1109/jestpe.2023.3280926. [Google Scholar] [CrossRef]
4. Zhou F, Yin H, Luo C, Tong H, Yu K, Li Z, et al. Research on low voltage series arc fault prediction method based on multidimensional time-frequency domain characteristics. Energy Eng. 2023;120(9):1979–90. doi:10.32604/ee.2023.029480. [Google Scholar] [CrossRef]
5. Wang J, Shen Y, Wang X, Xu J. An energy storage planning method based on the vine copula model with high percentage of new energy consumption. Energy Eng. 2025;122(7):2751–66. doi:10.32604/ee.2025.064317. [Google Scholar] [CrossRef]
6. Heidari M, Heidari M, Soleimani A, Khorrami BM, Pinnarelli A, Vizza P, et al. Techno-economic optimization and strategic assessment of sustainable energy solutions for powering remote communities. Results Eng. 2024;23:102521. doi:10.1016/j.rineng.2024.102521. [Google Scholar] [CrossRef]
7. He Y, Wang M, Xu Z, Jia Y. A novel γ control for enhancing voltage regulation of electric springs in low-voltage distribution networks. Trans Power Electron. 2023;38(3):3739–51. doi:10.1109/tpel.2022.3216845. [Google Scholar] [CrossRef]
8. Gao X, Zhang J, Sun H, Liang Y, Wei L, Yan C, et al. A review of voltage control studies on low voltage distribution networks containing high penetration distributed photovoltaics. Energies. 2024;17:3038. doi:10.3390/en17133058. [Google Scholar] [CrossRef]
9. Molina-Garcia A, Mastromauro RA, Garcia-Sanchez T, Pugliese S, Liserre M, Stasi S. Reactive power flow control for PV inverters voltage support in LV distribution networks. Trans Smart Grid. 2017;8(1):447–56. doi:10.1109/tsg.2016.2625314. [Google Scholar] [CrossRef]
10. Demirok E, González PC, Frederiksen KH, Sera D, Rodriguez P, Teodorescu R. Local reactive power control methods for overvoltage prevention of distributed solar inverters in low-voltage grids. J Photovolt. 2011;1(2):174–82. doi:10.1109/jphotov.2011.2174821. [Google Scholar] [CrossRef]
11. Collins L, Ward JK. Real and reactive power control of distributed PV inverters for overvoltage prevention and increased renewable generation hosting capacity. Renew Energy. 2015;81:464–71. doi:10.1016/j.renene.2015.03.012. [Google Scholar] [CrossRef]
12. Kashani MG, Bhattacharya S, Matamoros J, Kaiser D, Cespedes M. Autonomous inverter voltage regulation in a low voltage distribution network. Trans Smart Grid. 2018;9(6):6909–17. doi:10.1109/tsg.2017.2728661. [Google Scholar] [CrossRef]
13. Visser LR, Schuurmans EMB, AlSkaif TA, Fidder HA, Van Voorden AM, Van Sark WGJHM. Regulation strategies for mitigating voltage fluctuations induced by photovoltaic solar systems in an urban low voltage grid. Int J Electr Power Energy Syst. 2022;137(5):107695. doi:10.1016/j.ijepes.2021.107695. [Google Scholar] [CrossRef]
14. Reddy GK, Padhy NP. Decentralised control strategy for effective utilisation of distributed in PV-rich LV distribution network. Electr Power Syst Res. 2024;234:110536. doi:10.1016/j.epsr.2024.110536. [Google Scholar] [CrossRef]
15. Calderaro V, Conio G, Galdi V, Massa G, Piccolo A. Optimal decentralized voltage control for distribution systems with inverter-based distributed generators. Trans Power Syst. 2014;29(1):230–41. doi:10.1109/tpwrs.2013.2280276. [Google Scholar] [CrossRef]
16. Antoniadou-Plytaria KE, Kouveliotis-Lysikatos IN, Georgilakis PS, Hatziargyriou ND. Distributed and decentralized voltage control of smart distribution networks: models, methods, and future research. Trans Smart Grid. 2017;8(6):2999–3008. doi:10.1109/tsg.2017.2679238. [Google Scholar] [CrossRef]
17. Almasalma H, Claeys S, Deconinck G. Peer-to-peer-based integrated grid voltage support function for smart photovoltaic inverters. Appl Energy. 2019;239:1037–48. doi:10.1016/j.apenergy.2019.01.249. [Google Scholar] [CrossRef]
18. Wang L, Yan R, Saha TK. Voltage regulation challenges with unbalanced PV integration in low voltage distribution systems and the corresponding solution. Appl Energy. 2019;26:113927. doi:10.1016/j.apenergy.2019.113927. [Google Scholar] [CrossRef]
19. Zeraati M, Golshan MEH, Guerrero JM. Voltage quality improvement in low voltage distribution networks using reactive power capability of single-phase PV inverters. Trans Smart Grid. 2019;10(5):5057–65. doi:10.1109/tsg.2018.2874381. [Google Scholar] [CrossRef]
20. Ban J, Park JY, Kim JY, Catalao JPS. AMI data-driven strategy for hierarchical estimation of distribution line impedances. Trans Power Deliv. 2023;38(1):513–27. doi:10.1109/tpwrd.2022.3195075. [Google Scholar] [CrossRef]
21. Su X, Masoum MA, Wolfs PJ. Optimal PV inverter reactive power control and real power curtailment to improve performance of unbalanced four-wire LV distribution networks. Trans Sustain Energy. 2014;5(3):967–77. doi:10.1109/tste.2014.2313862. [Google Scholar] [CrossRef]
22. Hamilton D, Navarro L, Aliprantis D. Sensitivity-based voltage constraints for optimal power flow in low-voltage distribution feeders. Sustain Energy Grids Netw. 2025;43:5069015. doi:10.1016/j.segan.2025.101855. [Google Scholar] [CrossRef]
23. Pukhrem S, Basu M, Conlon MF, Sunderland K. Enhanced network voltage management techniques under the proliferation of rooftop solar PV installation in low-voltage distribution network. J Emerg Sel Top Power Electron. 2017;5(2):681–94. doi:10.1109/jestpe.2016.2614986. [Google Scholar] [CrossRef]
24. Gui Y, Nainar K, Ciontea CI, Bendtsen JD, Iov F, Shahid K, et al. Automatic voltage regulation application for PV inverters in low-voltage distribution grids—a digital twin approach. Int J Electr Power Energy Syst. 2023;149:109022. doi:10.1016/j.ijepes.2023.109022. [Google Scholar] [CrossRef]
25. Del Nozal AR, Barragan-Villarejo M, Garcia-Lopez F, Dobric G, Mauricio JM, Maza-Ortega JM. A model-less approach for the optimal coordination of renewable energy sources and DC links in low-voltage distribution networks. Electr Power Syst Res. 2024;234:110770. doi:10.1016/j.epsr.2024.110770. [Google Scholar] [CrossRef]
26. Jiao W, Wu Q, Chen J, Tan J, Song G, Huang S, et al. Analytical target cascading based real-time distributed voltage control for MV and LV active distribution networks. Int J Electr Power Energy Syst. 2024;159:110024. doi:10.1016/j.ijepes.2024.110024. [Google Scholar] [CrossRef]
27. Alam MJE, Muttaqi KM, Sutanto D. A three-phase power flow approach for integrated 3-wire MV and 4-wire multigrounded LV networks with rooftop solar PV. Trans Power Syst. 2013;28(2):1728–37. doi:10.1109/tpwrs.2012.2222940. [Google Scholar] [CrossRef]
28. Khan MA, Hayes BP. A reduced electrically-equivalent model of the IEEE European low voltage test feeder. In: Proceedings of the 2022 IEEE Power & Energy Society General Meeting (PESGM); 2022 Jul 17–21; Denver, CO, USA. p. 1–5. [Google Scholar]
Cite This Article
 Copyright © 2026 The Author(s). Published by Tech Science Press.
This work is licensed under a Creative Commons Attribution 4.0 International License , which permits unrestricted use, distribution, and reproduction in any medium, provided the original work is properly cited.
 Downloads
 Citation Tools