
 Submit a Paper
 Propose a Special lssue
 Open Access
ARTICLE

Fault Identification in Renewable Energy Transmission Lines Using Wavelet Packet Decomposition and Voltage Waveform Analysis
1 Information and Communication Research Institute, State Grid Information & Telecommunication Group, Co., Ltd., Chengdu, 610041, China
2 School of Electrical Engineering, Xi’an Jiaotong University, Xi’an, 710049, China
* Corresponding Author: Hanlin Xiao. Email:
Energy Engineering 2026, 123(3), 20 https://doi.org/10.32604/ee.2026.071768
Received 12 August 2025; Accepted 28 September 2025; Issue published 27 February 2026
A correction of this article was approved in:
Correction: Fault Identification in Renewable Energy Transmission Lines Using Wavelet Packet Decomposition and Voltage Waveform Analysis
Read correction
 View Full Text
 Download PDF
Abstract
The integration of a high proportion of renewable energy introduces significant challenges for the adaptability of traditional fault nature identification methods. To address these challenges, this paper presents a novel fault nature identification method for renewable energy grid-connected interconnection lines, leveraging wavelet packet decomposition and voltage waveform time-frequency morphology comparison algorithms. First, the paper investigates the harmonic injection mechanism during non-full-phase operation following fault isolation in photovoltaic renewable energy systems, and examines the voltage characteristics of faulted phases in renewable energy scenarios. The analysis reveals that substantial differences exist in both the time and frequency domains of phase voltages before and after the extinction of transient faults, whereas permanent faults do not exhibit such variations. Building on this observation, the paper proposes a voltage time-frequency feature extraction method based on wavelet packet decomposition, wherein low-frequency waveform components are selected to characterize fault features. Subsequently, a fault nature identification method is introduced, based on a voltage waveform time-frequency morphology comparison. By employing a windowing technique to quantify waveform differences before and after arc extinction, this method effectively distinguishes between permanent and transient faults and accurately determines the arc extinction time. Finally, a 220 kV renewable energy grid connection line model is developed using PSCAD for verification. The results demonstrate that the proposed method is highly adaptable across various fault locations, transition resistances, and renewable energy control strategies, and can reliably identify fault nature in renewable energy grid connection scenarios.Keywords
As the global energy landscape transitions towards low-carbonization, the transmission of large-scale renewable energy through long-distance high-voltage transmission lines to the main grid has emerged as a critical feature in the development of new power systems [1,2]. Interconnection lines, which serve as the primary means of linking renewable energy aggregation systems to the main grid, play a vital role in ensuring system protection and improving grid restoration efficiency. The rapid identification of faults within these lines directly influences the reliability of protection mechanisms and the effectiveness of grid restoration. Among these challenges, distinguishing between permanent and transient faults remains a key research issue. The indiscriminate use of automatic reclosing methods, for instance, can adversely affect renewable energy equipment [3,4]. Thus, the development of a highly reliable permanent fault identification mechanism is essential for optimizing reclosing decision logic and ensuring the safe and efficient operation of renewable energy grid-connected systems. While DC distribution systems are free from reactive power, phase, and frequency issues, the complex interactions among numerous power electronic devices can give rise to significant small-perturbation stability concerns. Poorly designed control strategies or improperly tuned controllers may lead to small-signal stability problems during the plugging in and out of devices. In this context, achieving plug-and-play (PnP) operations necessitates the establishment of an accurate small-signal model and the development of a parameter-optimization strategy capable of rapidly enhancing system stability, especially for digital DC distribution systems.
Existing research has predominantly focused on identifying the nature of transmission line faults by analyzing the transient characteristics at different stages of the fault arc, including the primary arc, secondary arc, and recovery voltage stages [5–7]. However, the complex transient components during the primary arc stage can obscure the intrinsic characteristics of the arc, significantly limiting the effectiveness of fault nature identification methods based on electrical quantity characteristics at this stage. Research on the secondary arc stage, in contrast, primarily examines the arc’s characteristics, utilizing various signal processing techniques to analyze the changes in high-frequency harmonic energy associated with the arc. Ref. [8] utilizes the trend in the variation of odd-order harmonic energy in the fault phase voltage during the secondary arc stage for fault nature identification. However, this approach encounters threshold crossover issues, particularly in small-resistance and metallic grounding faults. Ref. [9] proposes a new algorithm based on harmonic characteristics to detect the extinction time of secondary arcs, using TT transformation to highlight the harmonics of the healthy phase voltage. Ref. [10] proposes using the degree of distortion in the voltage curve at the beginning of the line to identify short-circuit arcs. An increase in voltage curve distortion during the secondary arc indicates the presence of an arc fault. All of these methods rely on the characteristics of the secondary arc to construct fault nature discrimination techniques, facilitating rapid fault nature identification. Nevertheless, the arc extinction time remains difficult to confirm, which introduces the potential risk of reclosing before the fault has been fully extinguished. The recovery voltage characteristics differ significantly between scenarios with and without parallel reactors on the line, and the two methods are generally not interchangeable. Ref. [11] constructs identification criteria based on the different phase characteristics of terminal voltages between transient and permanent faults, but this method is easily influenced by factors such as fault location and power factor; Ref. [12] constructs a fault nature identification method based on the DC offset phenomenon caused by interphase capacitance discharge in scenarios where parallel reactors are not installed on the line; Literature [13] identifies fault nature by analyzing the intersection point of the product of the power frequency and low-frequency components of the voltage recovery curve after phase disconnection, but the extraction of low-frequency components is easily affected by noise. Ref. [14] utilizes the characteristic of periodic differences in fault phase recovery voltage to apply the Prony curve fitting algorithm to obtain the amplitude of the free decay component of the recovery voltage during transient faults, thereby distinguishing between fault types. Ref. [15] proposes a permanent fault identification scheme based on LCC signal injection, thereby preventing secondary damage when reclosing to a permanent fault.
With the development of artificial intelligence technology, many literature sources utilize intelligent algorithms to identify fault nature. For example, Ref. [16] extracts multiple harmonic energy features from the fault phase voltage, fuses them using machine learning algorithms, and obtains a fault nature identification model for hybrid transmission lines; References [17,18] construct fault nature identification criteria using neural networks and wavelet transforms. Ref. [19] proposed the RF-LSTM Tuned KNN ensemble method to address the challenges posed by renewable energy integration to conventional fault detection approaches. However, artificial intelligence methods rely on large amounts of data for training and have poor generalization capabilities in diverse scenarios, limiting their engineering application value.
Contemporary research on fault characteristics in renewable energy grid integration has predominantly concentrated on fault duration phases, while inadequately addressing the critical non-full-phase operation (NFPO) phase that occurs subsequent to fault isolation. The large-scale integration of renewable energy clusters into power grids introduces significant operational complexities, particularly the elevated harmonic content inherent in inverter-based systems compared to conventional synchronous generators. These characteristics fundamentally challenge the reliability of traditional fault nature identification criteria, necessitating the development of advanced methodologies specifically tailored for renewable energy-integrated power systems [20]. Several research efforts have attempted to address these challenges with varying degrees of success. Ref. [21] investigates the impact of inverter-type resources on traditional fault detection schemes based on negative sequence components, analyzing the negative sequence current generation characteristics of Type III wind turbines and full-scale converters during asymmetric faults and the challenges they pose to protection. However, it lacks a comprehensive fault nature identification solution for large-scale renewable energy clusters after grid connection. Ref. [22] after a photovoltaic system is connected to the grid via an inverter, its fault characteristics differ significantly from those of traditional generator sets, and existing protection schemes are unable to adapt to the dynamic characteristics and low fault current characteristics of photovoltaic systems. The current state of research indicates an urgent need for comprehensive solutions that simultaneously account for the dynamic behavior of renewable energy systems, maintain power quality standards, and provide reliable fault discrimination under diverse operational conditions. This research gap represents a critical barrier to achieving optimal protection selectivity in modern power systems with high renewable energy penetration.
Wavelet Packet Decomposition (WPD), as a significant technique in signal analysis, demonstrates unique advantages in identifying the nature of faults on transmission lines. Compared to the traditional Discrete Wavelet Transform (DWT), WPD can simultaneously decompose both the approximation coefficients and detail coefficients of a signal, forming a complete binary tree structure. This provides finer frequency domain resolution and more flexible time-frequency analysis capabilities. In recent years, with the rapid advancement of smart grid and renewable energy technologies, significant progress has been made in the application of WPD for fault diagnosis in transmission lines. Ref. [23] proposed a dual-loop fault diagnosis framework based on WPD and deep learning models. By decomposing voltage and current signals using db10 mother wavelet packets, it achieved significant improvements in fault detection accuracy and localization precision. Ref. [24] conducted a comprehensive analysis of the IEEE-16 bus system, systematically evaluating the impact of different decomposition levels and bus wavelet functions on fault detection performance in distribution networks. This study demonstrated the significant influence of wavelet function selection on fault identification accuracy. However, the harmonic injection characteristics of renewable energy systems during non-full-phase operation (NFPO) exhibit significant differences from conventional systems, particularly the amplification of third- and fifth-order harmonics. This necessitates greater adaptability in fault identification algorithms. Furthermore, most WPD methods still require manual optimization of decomposition order and threshold settings based on specific application scenarios, which to some extent limits the algorithms’ universality and real-time performance. Therefore, establishing a more precise and adaptive fault identification system within the complex grid-connected environment of new energy sources remains a critical issue requiring in-depth research.
According to power system operation statistics, single-phase ground faults account for 80%–90% of all transmission line faults, making them the most common and challenging fault type in renewable energy grid-connected systems. This paper focuses on single-phase ground faults, laying the theoretical foundation for subsequent expansion to other fault types. To address these critical research gaps, this paper presents a comprehensive investigation of the harmonic injection mechanisms exhibited by photovoltaic (PV) renewable energy systems during non-full-phase operation (NFPO), while simultaneously characterizing the distinct fault signatures of permanent and transient faults in grid-connected transmission lines. The study is conducted using a representative photovoltaic grid-connected system configuration that captures the essential dynamics of large-scale renewable energy integration. The proposed methodology exploits the fundamental differences in time-frequency characteristics of voltage waveforms observed at both sending and receiving terminals during the critical transition periods preceding and following arc extinction in transient fault scenarios. A novel feature extraction algorithm based on wavelet packet decomposition is developed to systematically analyze these time-frequency distribution patterns, enabling precise characterization of fault-induced waveform variations. The fault nature identification framework incorporates Euclidean distance metrics as a quantitative measure for voltage waveform similarity assessment. By establishing baseline waveform signatures and computing the Euclidean distances between pre-fault and post-fault voltage patterns, the methodology constructs robust permanent fault identification criteria. These criteria leverage the distinct temporal evolution patterns that differentiate permanent faults from transient disturbances. The validity and effectiveness of the proposed identification algorithm are rigorously evaluated through comprehensive electromagnetic transient simulations implemented in PSCAD/EMTDC. The simulation framework encompasses diverse fault scenarios, system configurations, and operating conditions to demonstrate the algorithm’s reliability and robustness under realistic grid operation circumstances.
2 Fault Characteristic Analysis and Solution Approach for New Energy Access
2.1 Mechanism of Harmonic Generation in Photovoltaic New Energy during NFPO
During NFPO, the grid connection point voltage recovers to approximately 1.0 p.u. with minor overvoltage transients that remain below protection thresholds, preventing renewable energy disconnection. This voltage recovery triggers the transition from low-voltage ride-through control to steady-state dual-loop power control, where phase-locked loop synchronization and coordinate transformation are critical for renewable energy integration [25]. Notably, residual voltage imbalances persist at the connection point despite overall voltage recovery, providing distinct signatures for fault nature identification. Under these conditions, the presence of negative sequence components results in both Uα and Uβ containing negative sequence content following abc/αβ coordinate transformation. Here, U1 and U2 represent the RMS values of positive and negative sequence voltages at the grid connection point, respectively.
The phase-locked angle expression is given by Eq. (2).
In the equation, V represents the voltage imbalance factor, defined as the ratio of negative sequence to positive sequence RMS components. During NFPO, the voltage imbalance factor at the grid connection point is typically V << 1. Therefore, Eq. (2) can be simplified through Taylor series expansion, yielding Eq. (4).
Due to negative sequence components, the phase-locked loop exhibits double-frequency oscillations. Consequently, the dual closed-loop control generates d-axis and q-axis voltage references containing double-frequency components, as expressed in Eq. (6).
In the equation, Ud1 and Ud2 represent the fundamental and second harmonic components of the d-axis voltage, respectively, while Uq1 and Uq2 represent the corresponding components of the q-axis voltage. The parameters φd0 and φq0 denote the initial phase angles of the second harmonic components.
The A-phase voltage output is obtained from the dq-axis voltage references through inverse Park transformation. During NFPO, parameter B remains sufficiently small to justify the small-angle approximations: sin(Bsin2ωt) ≈ Bsin2ωt and cos(Bsin2ωt) ≈ 1.
Eqs. (8) and (10) demonstrate that renewable energy voltage output during NFPO contains fundamental, third- and fifth-harmonic components, as illustrated in Fig. 1. These harmonic components reduce the THD differential between pre- and post-arc extinction periods during transient faults, thereby compromising the reliability of conventional fault identification methods designed for synchronous generator (SG) systems. This necessitates alternative fault discrimination approaches.
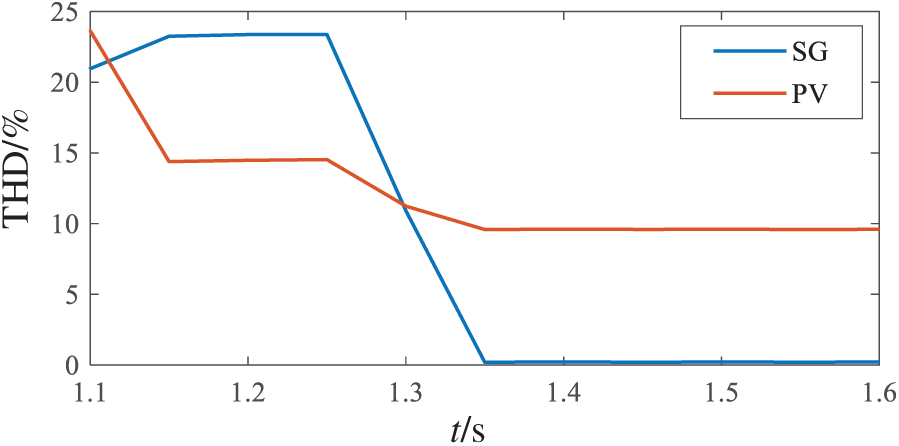
Figure 1: Terminal voltage THD comparison
2.2 Fault Phase Voltage Analysis
In engineering practice, transmission lines connecting renewable energy clusters typically operate without shunt reactors, though reactors may be installed to suppress power frequency overvoltages. Since voltage waveform characteristics differ significantly between these configurations, this paper analyzes fault-phase terminal voltage at point q under both scenarios. Given that single-phase ground faults account for up to 90% of incidents in single-phase adaptive reclosing of transmission lines, this paper analyzes the characteristics of single-phase ground faults under shunt reactors. Fig. 2 illustrates the renewable energy grid-connected system, where dashed lines represent optional shunt reactors. A single-line-to-ground (SLG) fault is simulated on phase A for analysis.
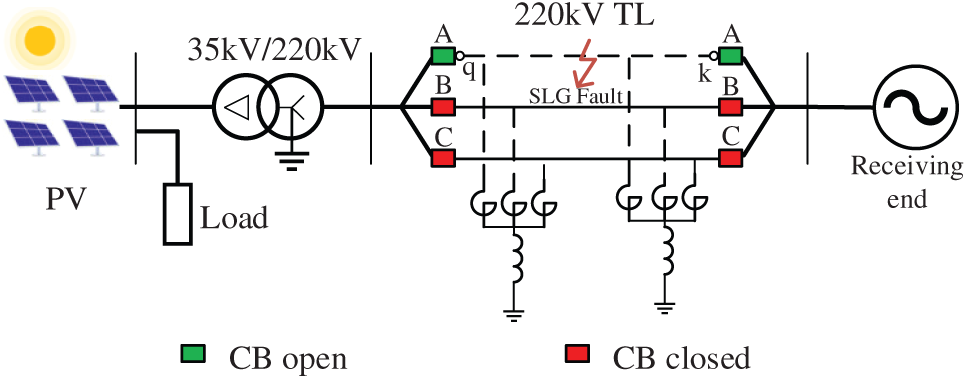
Figure 2: New energy grid connection line model
2.2.1 Phase Voltage of Line Fault without Parallel Reactor
During transient ground faults, the faulted phase terminal voltage comprises capacitive and electromagnetic coupling components, with capacitive coupling being dominant. Fig. 3 presents the equivalent capacitive coupling circuit for the secondary arc stage, where UB and UC represent healthy phase voltages, Cm denotes interphase coupling capacitance, and C0 represents the line-to-ground capacitance. The capacitive coupling voltage is expressed in Eq. (12).
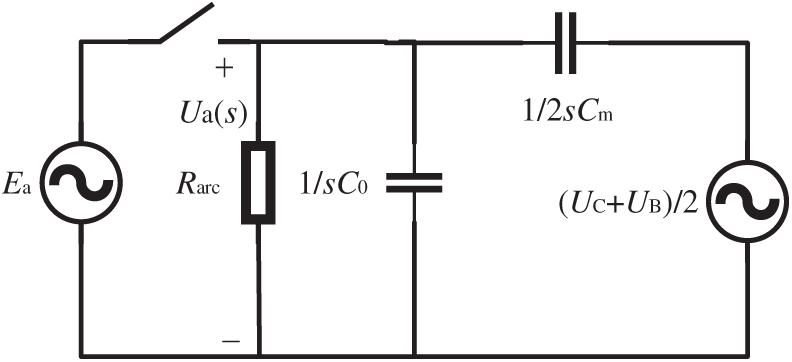
Figure 3: Equivalent circuit diagram of the secondary arc stage
The resulting time-domain expression for the faulted phase voltage is given by Eq. (13).
In the equation, U1 represents the fundamental voltage amplitude and Um denotes the interphase equivalent capacitance charging voltage. Eq. (13) shows that the faulted phase voltage contains a DC decay component. However, with typical line parameters where Rarc ≤ 1000 Ω and capacitance values Cm, C0 ∈ [10−8, 10−7] F, the resulting time constant is negligibly small, enabling rapid decay that can be disregarded in the analysis [26]. The highly nonlinear characteristics of arc resistance Rarc introduce substantial harmonic distortion into the faulted phase voltage. Consequently, the harmonic content during the secondary arc stage stems from two primary mechanisms: the nonlinear temporal variation of arc resistance and the harmonic injection inherent in renewable energy inverter systems.
Following arc extinction, the arc resistance approaches infinity, and the charged interphase capacitance initiates energy discharge. Fig. 4 illustrates the equivalent capacitive coupling circuit during the recovery voltage stage, where Um represents the interphase capacitance charging voltage. The corresponding capacitive coupling voltage is expressed in Eq. (14).
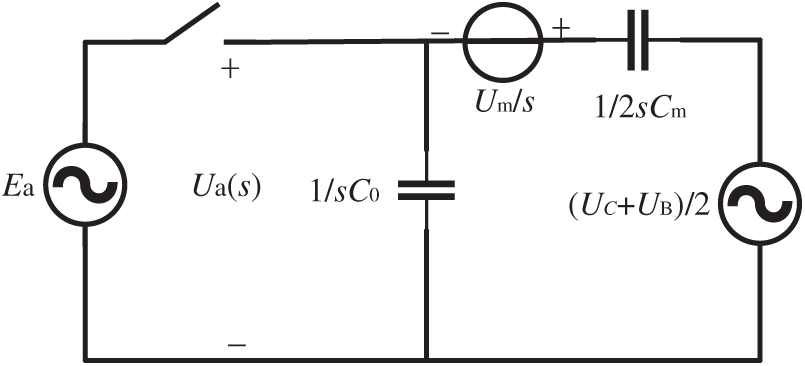
Figure 4: Equivalent circuit diagram of the voltage recovery phase
This leads to the time-domain expression for the fault phase, as expressed in Eq. (15).
The interphase capacitance discharge introduces a DC component into the faulted phase voltage, resulting in characteristic DC offset in the voltage waveform. During this recovery phase, the harmonic content of the faulted phase voltage originates predominantly from renewable energy inverter harmonic injection.
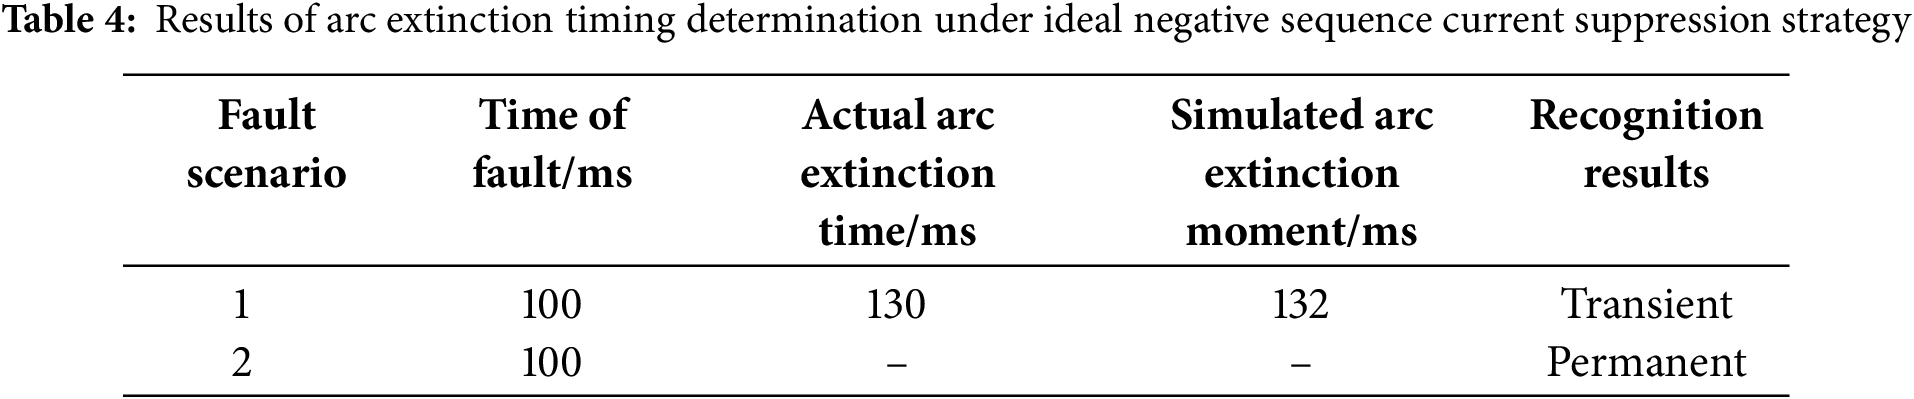
During a transient ground fault on the grid connection line, the typical voltage behavior at connection point q is illustrated in Fig. 5a. The simulation parameters include fault initiation at t = 1.0 s, natural fault clearing at t = 1.3 s, and circuit breaker operation at t = 1.1 s. As illustrated in Fig. 5a,b, transient faults exhibit three distinct phases at the line terminal: primary arc, secondary arc, and recovery voltage stages. Following arc extinction, interphase capacitance discharge creates characteristic DC offset in the voltage waveform, markedly different from pre-extinction behavior. Conversely, permanent faults maintain consistent voltage characteristics due to sustained arc energy dissipation through the reliable ground path, eliminating waveform variations. As demonstrated in Fig. 6a,b, transient faults exhibit distinct harmonic characteristics across two phases. During the pre-extinction phase, the arc undergoes extinction-reignition cycles, causing highly nonlinear resistance variations that generate broad-spectrum harmonics and interharmonics beyond the characteristic 3rd and 5th harmonics from renewable energy sources. Following arc extinction, the voltage spectrum comprises fundamental frequency, DC offset, and renewable energy-derived harmonic components.
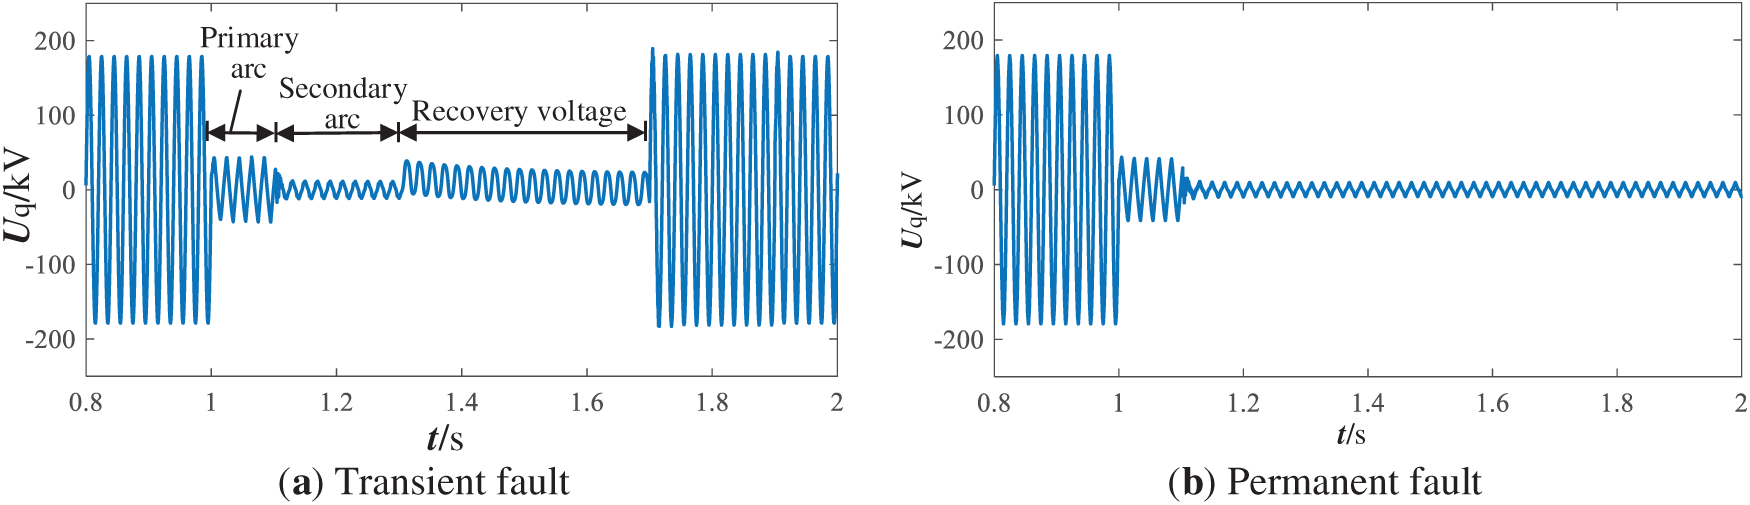
Figure 5: Line terminal voltage
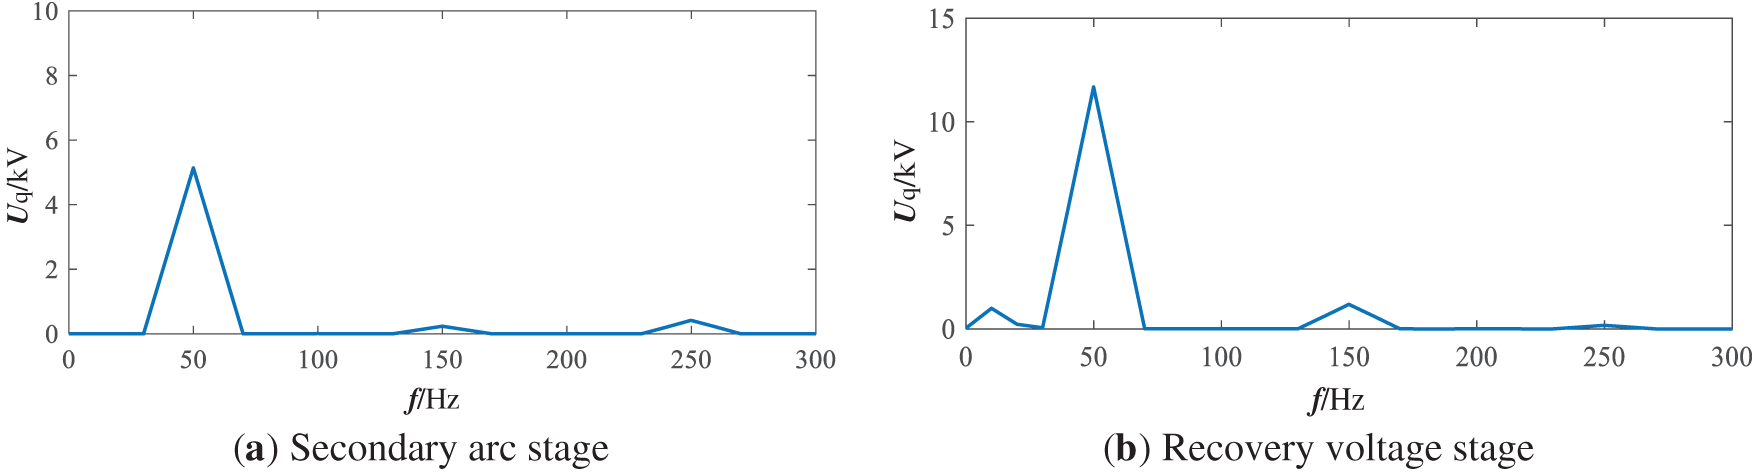
Figure 6: Transient fault terminal voltage spectrum
2.2.2 Phase Voltage of a Line Fault with a Parallel Reactor
The capacitive coupling equivalent circuit for the secondary arc stage is presented in Fig. 7, where Lm and L0 represent the equivalent interphase coupling inductance and ground inductance, respectively, obtained through star-delta transformation of the shunt reactor and neutral grounding reactor. The resulting faulted phase capacitive coupling voltage is expressed in Eq. (16).
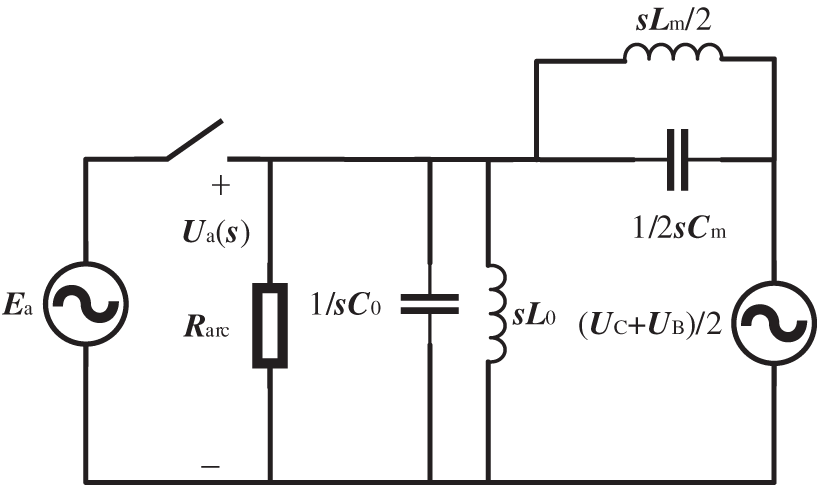
Figure 7: Equivalent circuit diagram of the secondary arc stage
Due to the highly nonlinear characteristics of Rarc, the voltage-frequency spectrum during this stage remains equivalent to that of systems without shunt reactors. The harmonic content originates from two primary sources: nonlinear arc resistance variations and harmonic injection from renewable energy systems.
Following arc extinction, the equivalent circuit for the voltage recovery phase is illustrated in Fig. 8. The corresponding faulted phase capacitive coupling voltage is expressed in Eq. (17).
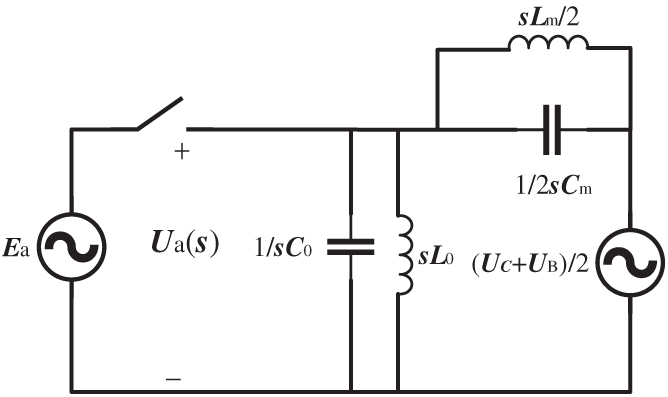
Figure 8: Equivalent circuit diagram of the voltage recovery phase
The circuit energy storage elements form a free oscillation circuit whose characteristic equation yields the oscillation frequency ω2, as expressed in Eq. (19). Based on typical circuit parameters, this oscillation frequency approaches the fundamental frequency, resulting in beat frequency phenomena through interaction with the power frequency voltage component.
As illustrated in Fig. 9a,b, transient faults exhibit distinctive post-extinction behavior where free oscillations generated by reactive circuit elements interact with the fundamental frequency voltage, producing characteristic beat frequency patterns that contrast markedly with pre-extinction waveforms. Conversely, permanent faults maintain consistent voltage characteristics without such waveform variations. As demonstrated in Fig. 10a,b, transient faults exhibit two distinct harmonic characteristics. During the arc period, highly nonlinear resistance variations generate broad-spectrum harmonics and interharmonics beyond the characteristic 3rd and 5th harmonics from renewable energy sources. Following arc extinction, the voltage spectrum comprises fundamental frequency, free oscillation components from reactive circuit elements, and renewable energy-derived harmonics.
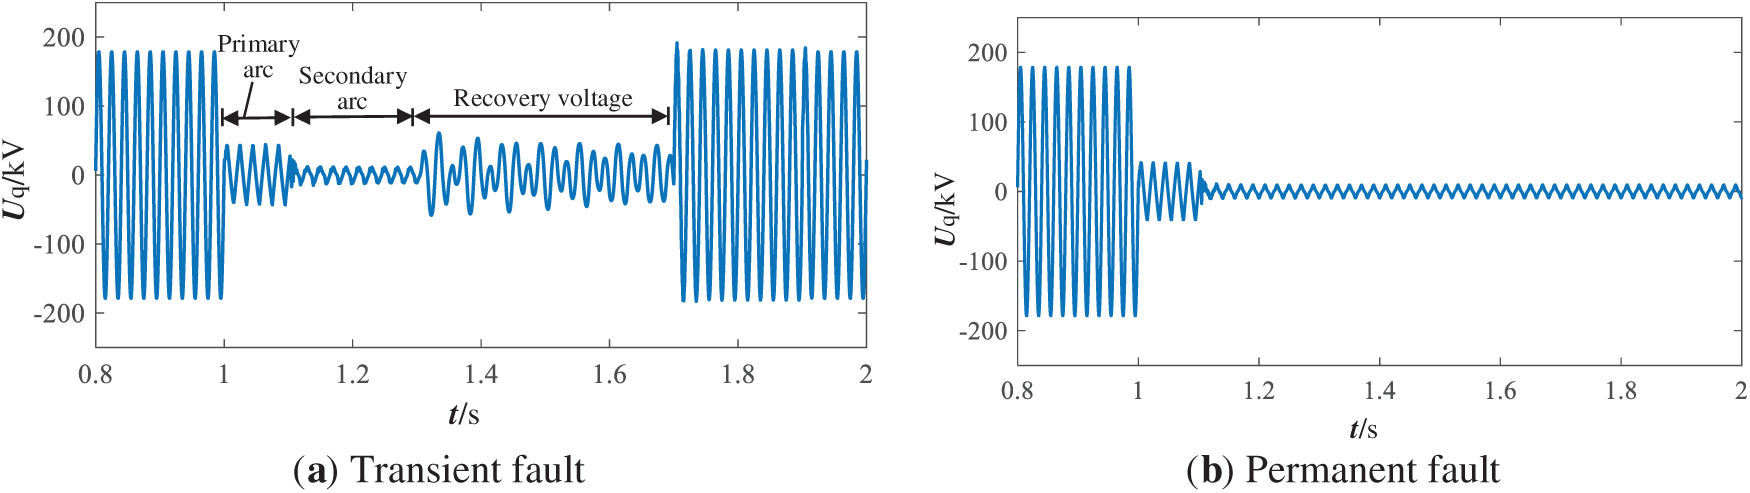
Figure 9: Line terminal voltage
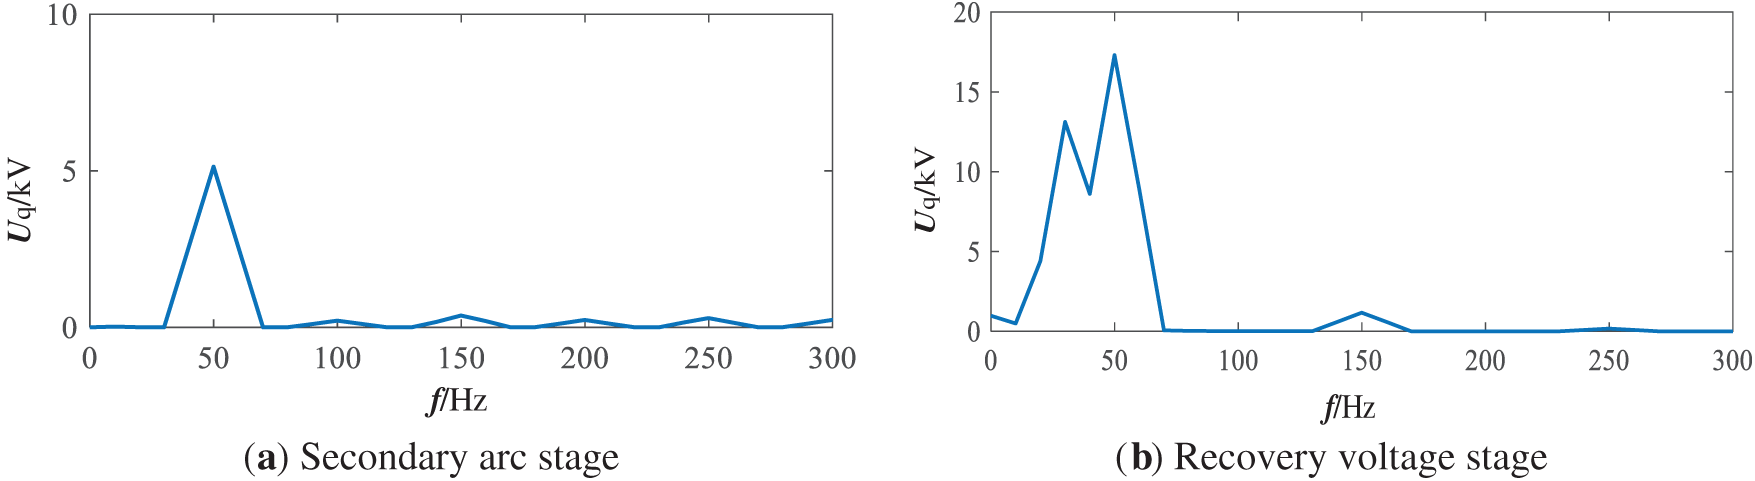
Figure 10: Transient fault terminal voltage spectrum
This paper derives the harmonic injection mechanisms in renewable energy systems and analyzes transmission line fault characteristics under both shunt reactor and non-reactor configurations. The following conclusions are established:
Renewable energy grid integration introduces characteristic harmonic voltages, predominantly third and fifth harmonics, at system output terminals compared to conventional synchronous generation. These harmonics can either amplify or attenuate arc-induced harmonic content, thereby compromising the effectiveness of traditional fault identification algorithms. Independent of shunt reactor configuration, transient transmission line faults exhibit distinct voltage characteristics before and after arc extinction, providing discriminative features for fault nature identification. Specifically, two distinct scenarios emerge: (1) Without shunt reactors, the faulted phase terminal exhibits low-amplitude oscillations during the arc period, followed by DC offset characteristics post-extinction due to interphase capacitance discharge. (2) With shunt reactors, similar pre-extinction oscillations occur, but post-extinction behavior differs significantly—the distributed capacitance and shunt reactors form an underdamped oscillatory circuit, generating characteristic beat frequency patterns in the recovery voltage. From a frequency domain perspective, the harmonic source mechanisms differ fundamentally before and after arc extinction. Independent of shunt reactor configuration, pre-extinction voltage harmonics originate from dual sources: nonlinear arc resistance variations and renewable energy harmonic injection. Post-extinction harmonics derive exclusively from renewable energy systems, as the eliminated arc resistance removes the primary nonlinear source.
Based on the distinct time-frequency voltage distributions observed before and after arc extinction in transient faults, this paper proposes a novel fault identification methodology utilizing windowed feature comparison. The approach employs wavelet packet decomposition for time-frequency feature extraction, followed by Euclidean distance metrics to quantify voltage waveform variations. Permanent fault identification criteria are subsequently established based on the computed Euclidean distance variations between pre- and post-fault periods.
3 Key Technologies for Comparing the Time-Frequency Characteristics of Voltage Waveforms
3.1 Selection of Reference Voltage
The reference voltage selection critically influences subsequent differential calculations, necessitating optimal determination of analysis window parameters, including start time and window duration, to ensure accurate fault identification performance.
As demonstrated in Figs. 6 and 10, the fundamental component dominates the fault voltage spectrum during the secondary arc phase, with voltage oscillations maintaining approximately 20 ms periodicity. Accordingly, the analysis window length is set to 20 ms. To account for renewable energy control switching delays and circuit breaker operating times [27], the reference voltage selection commences 100 ms after protection command initiation. The resulting reference voltage selection methodology is illustrated in Fig. 11. Single-window processing time is 20 ms, and complete fault nature determination time is <200 ms, meeting the real-time requirements for rapid reclosing in power systems.
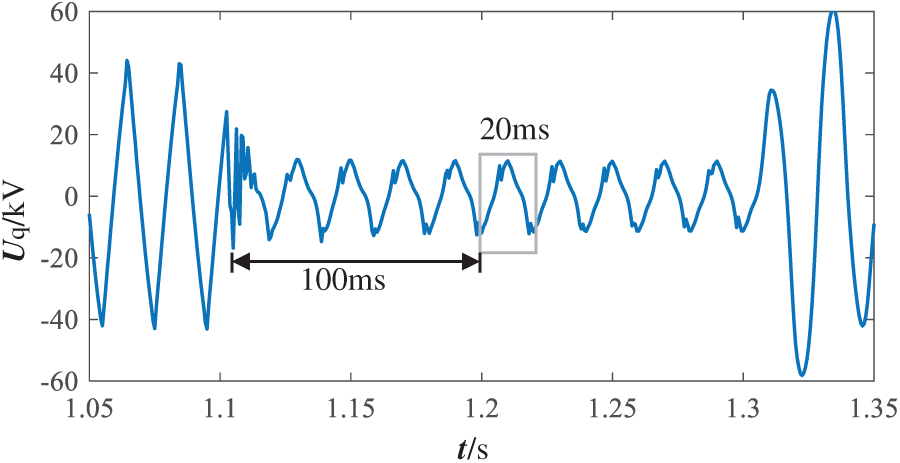
Figure 11: Voltage reference selection diagram
3.2 Fundamentals of Wavelet Decomposition Methods and Extraction of Fault Characteristics
Wavelet packet decomposition (WPD) enables flexible signal analysis through adaptive time-frequency space segmentation, facilitating precise frequency domain partitioning for arbitrary frequency bands and characteristic components. In renewable energy integrated systems, WPD enhances fault characterization by providing detailed frequency band resolution that effectively captures both harmonic injection signatures from renewable sources and arc resistance frequency distributions, thereby improving fault feature extraction accuracy and identification reliability.
Let the original signal s(t) be denoted as S00. Applying wavelet packet decomposition to signal x(t) yields wavelet packet coefficients at the j-th decomposition level and k-th node. The corresponding decomposition formula is expressed in Eq. (20).
In the equation, i represents the node index, j denotes the decomposition level, g(n) and h(n) are the low-pass and high-pass filter coefficients, respectively, that decompose the signal into corresponding frequency components. These filters constitute a pair of orthogonal mirror filters ensuring perfect reconstruction properties.
Compared to other wavelet basis functions, the ‘db6’ wavelet exhibits higher regularity, enabling smoother signal reconstruction—a critical advantage for capturing transient characteristics in power systems. Furthermore, the db6’s compact support property ensures excellent localization performance in the time domain, allowing precise identification of fault occurrence timepoints. More importantly, the db6’s six vanishing moments enable superior sparse representation capabilities when processing polynomial-type signals, which are commonly found in power system fault signals containing combinations of multiple frequency components. Additionally, the db6 exhibits enhanced frequency selectivity in the frequency domain, effectively separating fault characteristics across different frequency bands. This capability is crucial for distinguishing the spectral differences between permanent faults and transient faults [28]. Therefore, this paper selects the ‘db6’ wavelet basis pair to perform a five-level wavelet packet decomposition on the fault voltage signal, dividing it into 32 frequency bands. At a sampling frequency of 1600 Hz, each frequency band has a width of 25 Hz.
Using the voltage waveforms from Figs. 5 and 9 as representative examples, a fundamental frequency cycle during the fault isolation stage is extracted for wavelet packet decomposition. The energy distribution across frequency bands is computed according to Eq. (21), yielding the nodal wavelet energy distribution presented in Fig. 12.
Figure 12: Distribution of wavelet energy across nodes
The figure reveals that fault voltage fundamental and harmonic energy predominantly concentrates within the first eight frequency bands, spanning 0–200 Hz. To minimize noise interference and enhance feature reliability, this analysis extracts the time-frequency distribution of these eight bands as the primary fault characteristic parameters for subsequent identification algorithms.
4 Criteria for Identifying the Nature of Transmission Line Faults Adapted to New Energy Access
Based on system timing requirements, this paper establishes fault identification initiation criteria triggered by circuit breaker operation following faulted phase isolation. Upon detection of circuit breaker protection activation, the fault nature identification algorithm is initiated to distinguish between transient and permanent fault conditions.
Transient faults exhibit distinctive time-frequency voltage characteristics across pre- and post-arc extinction phases. In systems without shunt reactors, the faulted phase terminal voltage demonstrates low-amplitude oscillatory behavior during the arc period, transitioning to characteristic DC offset patterns following arc extinction due to interphase capacitance discharge. In shunt reactor configurations, the faulted phase terminal exhibits similar pre-extinction low-amplitude oscillations but develops characteristic beat frequency patterns post-extinction. The harmonic content also varies significantly across these phases. Pre-extinction harmonics derive from dual sources: nonlinear arc resistance variations generating broad-spectrum harmonics and interharmonics, plus characteristic third and fifth harmonics from renewable energy systems. Post-extinction, harmonics originate exclusively from renewable energy injection, as arc elimination removes the primary nonlinear source. These distinct time-frequency distribution variations can be effectively quantified through Euclidean distance metrics for fault identification.
Euclidean distance quantifies waveform dissimilarity by computing the shortest path between corresponding points in multidimensional feature space. Following reference voltage selection, the analysis window advances in 20 ms intervals. Each windowed voltage segment undergoes WPD, with the resulting 0–200 Hz frequency band components compared against the reference voltage. The normalized Euclidean distance between corresponding frequency bands is computed according to Eq. (22).
In the equation, Ai represents the normalized amplitude at each sampling point within a specific frequency band, n denotes the total sampling points, Aik and Bik are the normalized amplitudes for the k-th frequency band of the windowed and reference voltages, respectively, dk represents the Euclidean distance between reference and windowed voltages in the k-th frequency band, and D is the cumulative Euclidean distance across the first m frequency bands.
Transient faults exhibit substantial variations in voltage time-frequency distributions before and after arc extinction, while permanent faults maintain consistent waveform characteristics throughout the fault period. This fundamental difference provides a discriminative feature that can be effectively quantified through Euclidean distance analysis of the respective time-frequency distribution patterns. As demonstrated in Fig. 13, using the transient fault voltage waveform from Fig. 5 (without shunt reactor) as a representative case, the Euclidean distance between pre- and post-arc extinction time-frequency distributions exhibits significantly elevated values for transient faults, while permanent faults yield minimal distances approaching zero. Based on this discriminative characteristic, this paper establishes Euclidean distance as an effective metric for distinguishing between transient and permanent fault conditions.
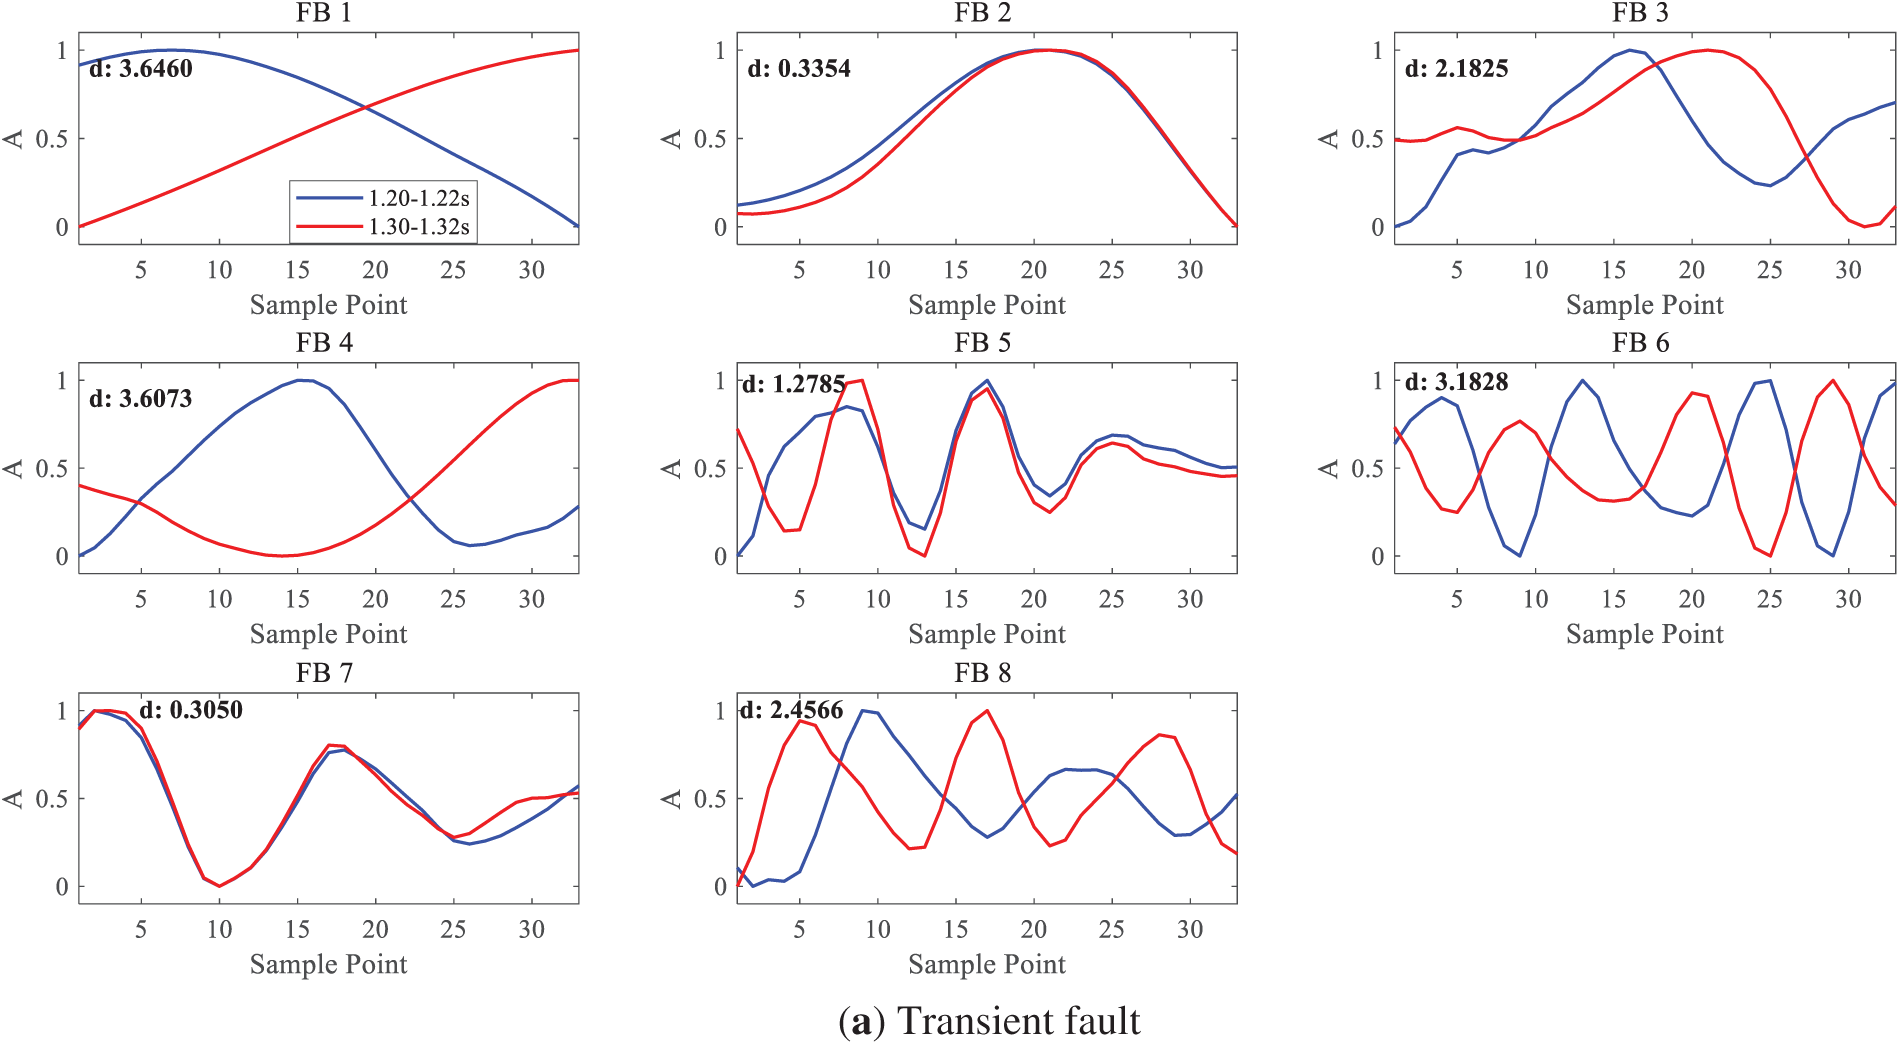
Figure 13: Calculation results of Euclidean distance between window voltage and reference voltage
To achieve accurate and rapid fault nature identification, this methodology captures the reference voltage 100 ms following fault occurrence and protection activation. Subsequently, a sliding window analysis is performed with 20 ms window length and 20 ms step size, sequentially advancing through the post-fault period while computing the Euclidean distance between each windowed voltage segment and the reference voltage after WPD processing. In practical engineering applications, considering the latency introduced by the WPD algorithm, the WPD decomposition is performed in parallel with subsequent Euclidean distance calculations. A sliding window technique is employed to update results every 20 ms. Furthermore, acknowledging that transmission line voltage waveforms may deviate from theoretical values due to external environmental factors, a threshold of 5 is set for the kurtosis value D. When D exceeds this threshold, the fault is classified as transient with concurrent arc extinction time determination. Conversely, when D remains below the threshold, the fault is identified as permanent.
The complete fault nature identification algorithm is summarized in the flowchart presented in Fig. 14.
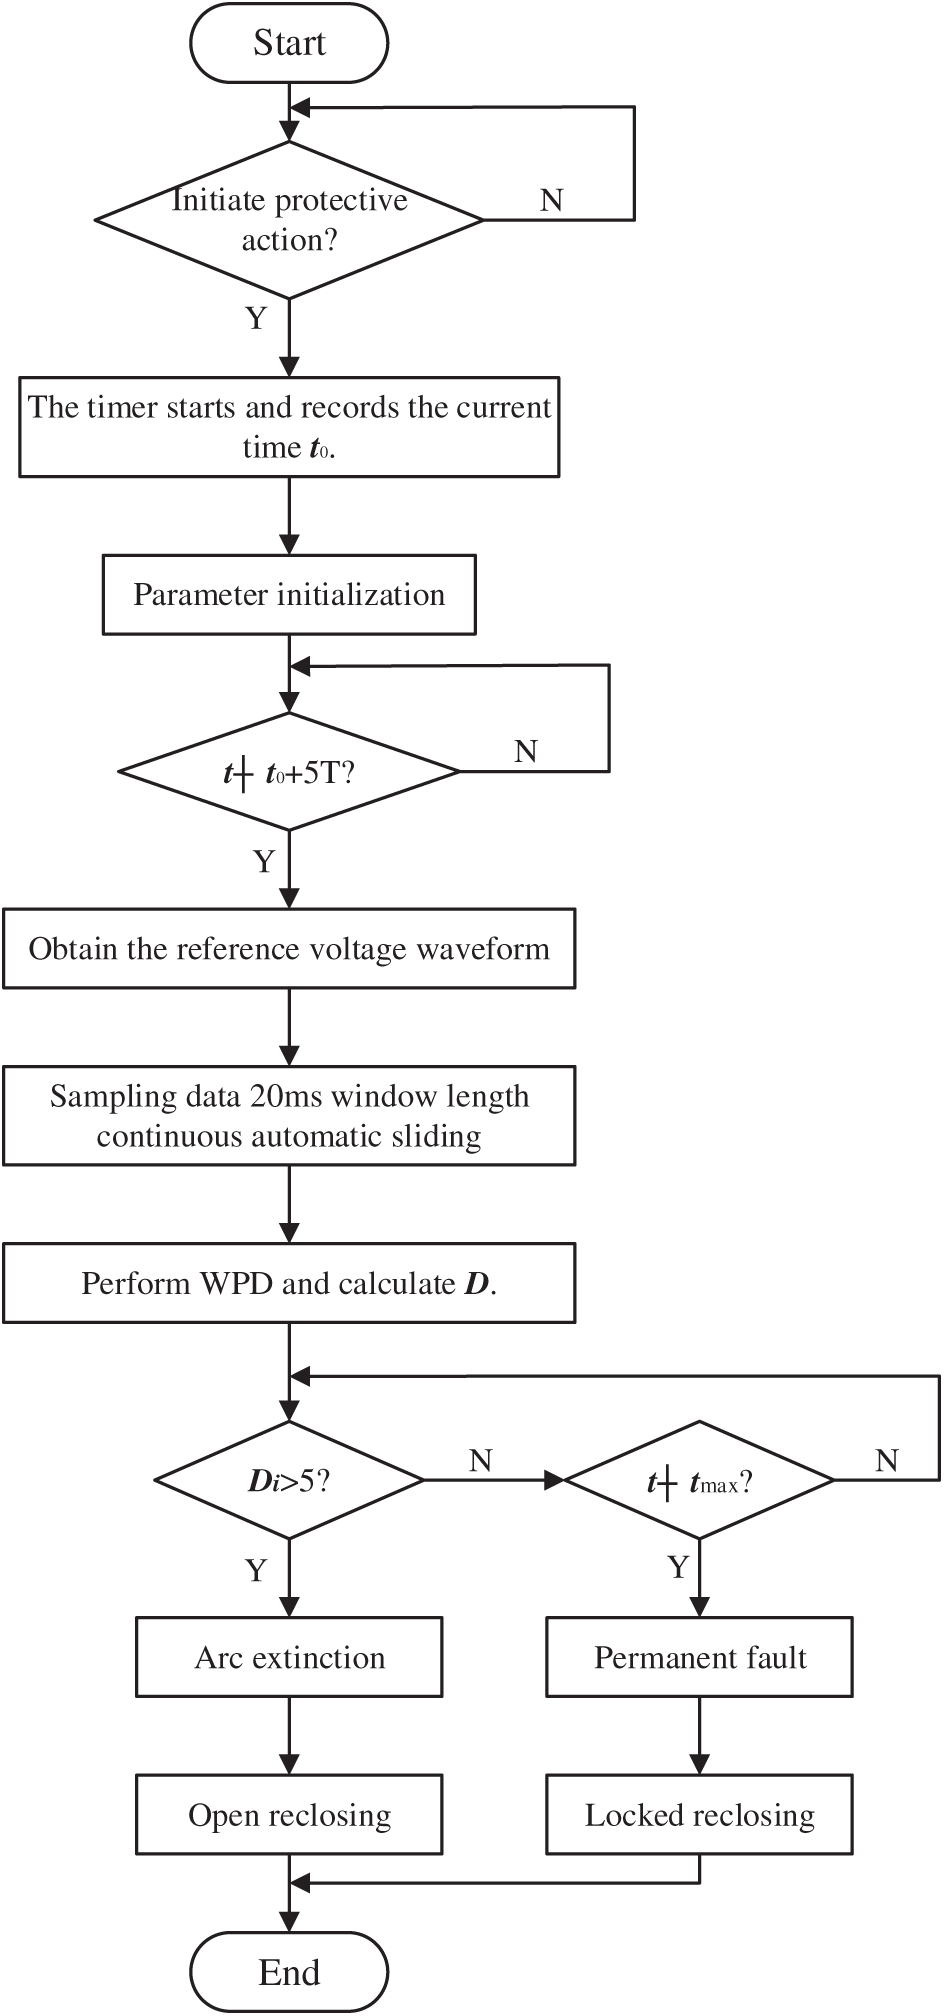
Figure 14: Single-phase permanent fault identification algorithm flowchart
To validate the proposed fault identification methodology, photovoltaic systems are selected as the representative renewable energy source. Given the similar fault characteristics exhibited by photovoltaic grid-connected transmission lines at 220 kV and above voltage levels, a comprehensive simulation model is developed using the PSCAD platform, featuring a 220 kV photovoltaic grid-connected transmission system as illustrated in Fig. 2. The total capacity of the photovoltaic power source is 120 MW, the transformer ratio of the box-type transformer is 0.48 kV/35 kV, the total capacity is 120 MVA, and the leakage reactance is 0.0676 p.u. The total length of the collection lines is 200 m, with a positive sequence impedance Z1 = 0.33 + j0.41 Ω/km, and a unit-to-ground positive sequence capacitive reactance XC1 = −j4.5473 × 105 Ω·km. The zero-sequence impedance Z0 = 1.04 + j1.25 Ω/km, and the unit-to-ground zero-sequence capacitive reactance XC0 = −j7.9577 × 105 Ω·km. The active power consumption of the local load is 10 MW, and the reactive power is 1 Mvar. The step-up transformer has a voltage ratio of 35 kV/220 kV, a total capacity of 150 MVA, and a positive sequence reactance of 0.1 p.u. The positive sequence impedance of the interconnection line is Z1 = 0.01 + j0.41 Ω/km, and the positive sequence capacitance per unit to ground is X′C1 = −j3.5886 × 108 Ω·km. The zero-sequence impedance per unit length Z0 = 0.33 + j1.32 Ω/km, and the zero-sequence capacitance per unit length X′C0 = −j5.1175 × 108 Ω·km. The equivalent impedance of the line with shunt reactors at both ends ZL = 11 + j1.57 × 104 Ω. The equivalent impedance on the grid side is Zg = 0.020 + j14.137 Ω, and the grid power supply is equivalent to an ideal voltage source of 220 kV.
The simulation model employs the widely-accepted Kizilcay arc model, with fault detection and identification performed at monitoring point q. The fault scenario initiates with an A-phase-to-ground fault at the transmission line midpoint at t = 1.0 s, followed by bilateral protection tripping to isolate the faulted phase at t = 1.1 s. For transient faults, arc extinction occurs at t = 1.3 s, while permanent faults exhibit rapid arc extinction with sustained grounding through transition resistance. All simulation analyses employ a sampling frequency of 1600 Hz. This frequency setting, based on the Nyquist sampling theorem, accurately reconstructs signal components within 800 Hz, fully covering the frequency range required for fault analysis.
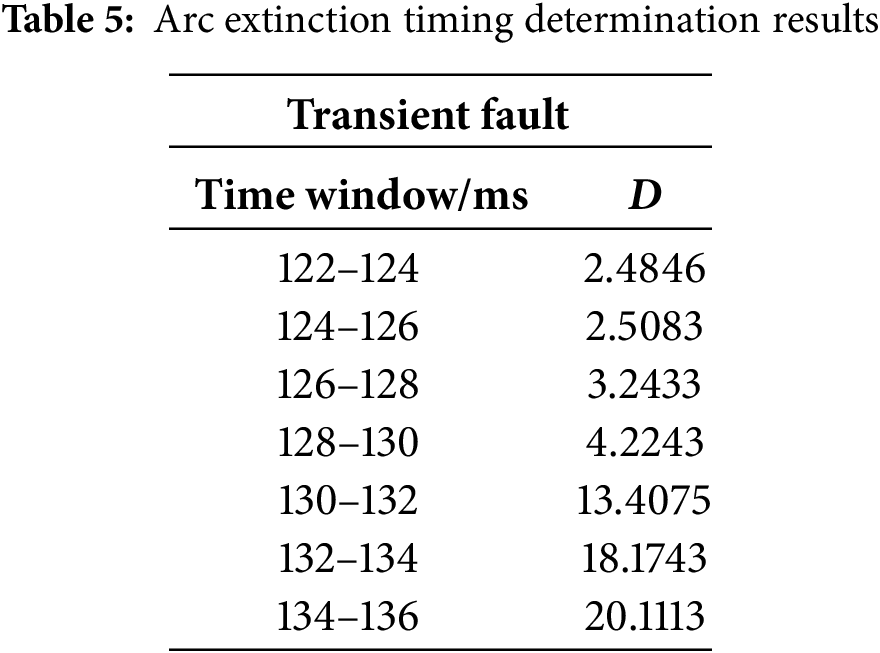
Comparative analysis of single-phase-to-ground metallic faults at varying distances from measurement point q reveals that increasing fault-to-measurement distance—corresponding to higher intervening impedance—results in reduced voltage waveform distortion at the terminal. This distance-dependent attenuation demonstrates the impedance-mediated effect on fault signature propagation. As demonstrated in Fig. 15, using a shunt reactor configuration as a representative case, the terminal voltage waveform during transient faults exhibits distinct time-frequency distribution characteristics before and after arc extinction. Applying the proposed fault identification methodology, the calculated Euclidean distances for each analysis window are presented in Table 1, indicating arc extinction occurs within the 130–132 ms time interval.
Figure 15: Voltage time domain and frequency domain waveforms when a transient fault occurs at the end of a line
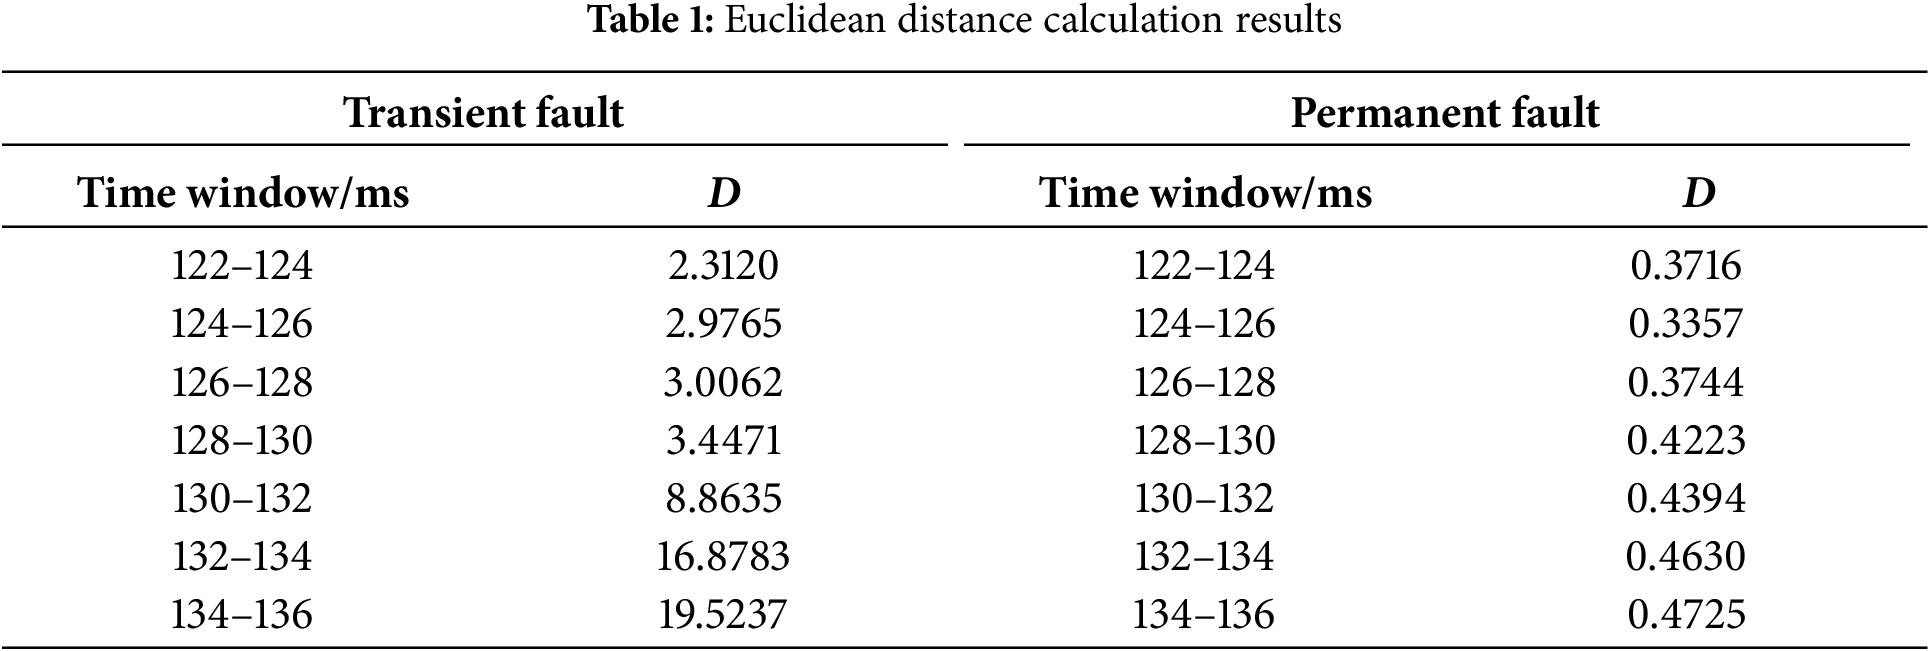
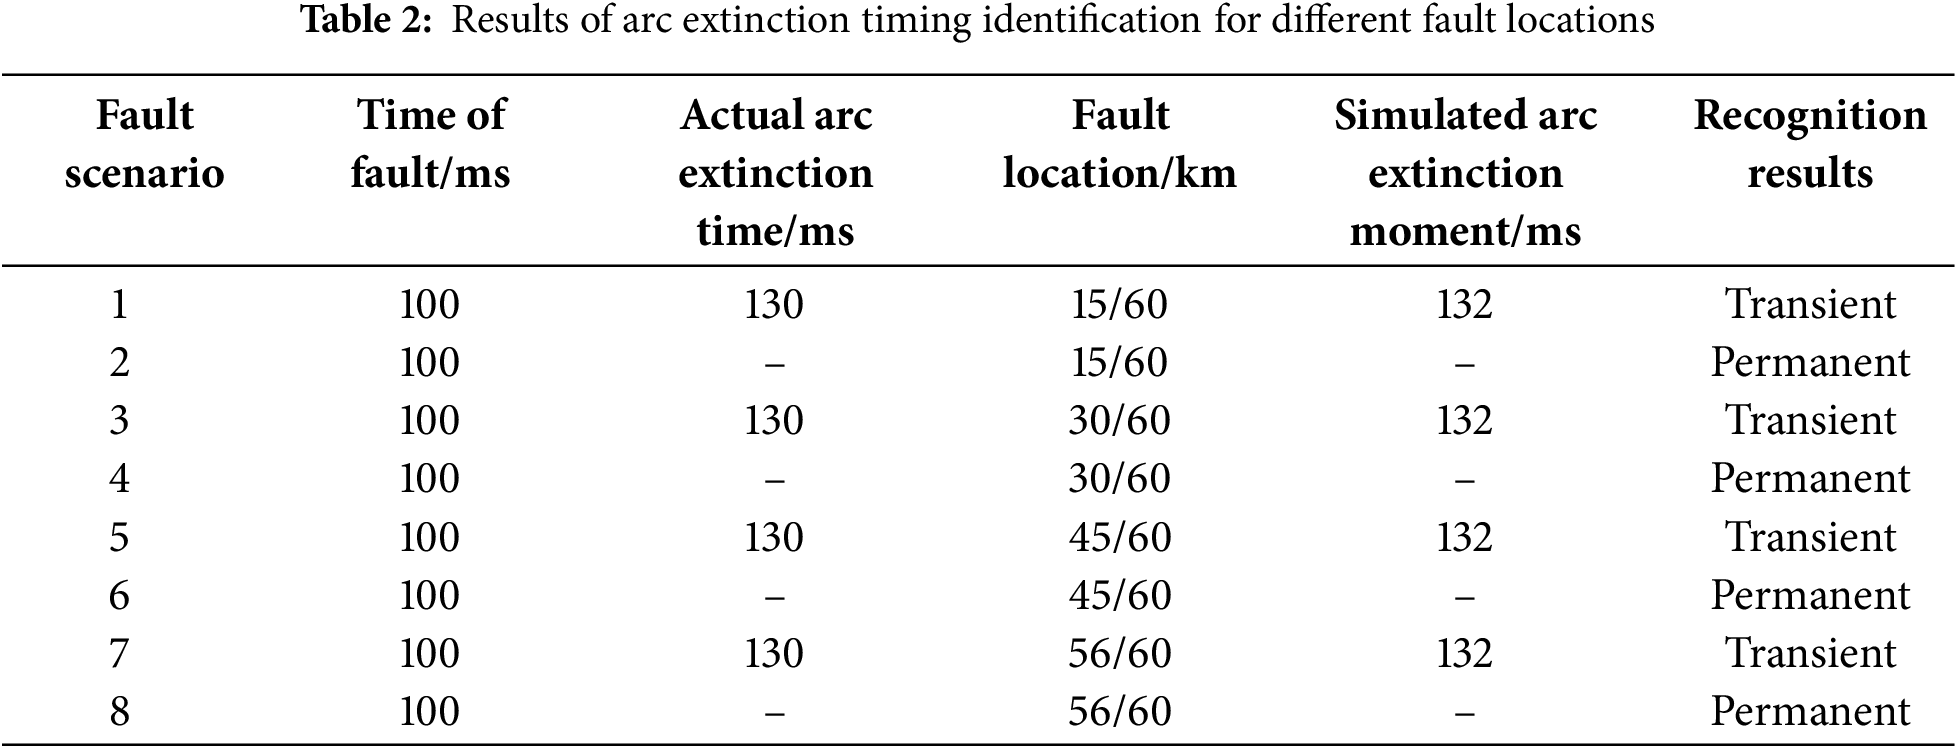
Table 2 presents the algorithm performance results for fault locations at 15, 30, 45, and 56 km from measurement point q along the 60 km transmission line, demonstrating the effectiveness and reliability of the proposed identification methodology across varying fault distances.
5.2 Different Transition Resistances
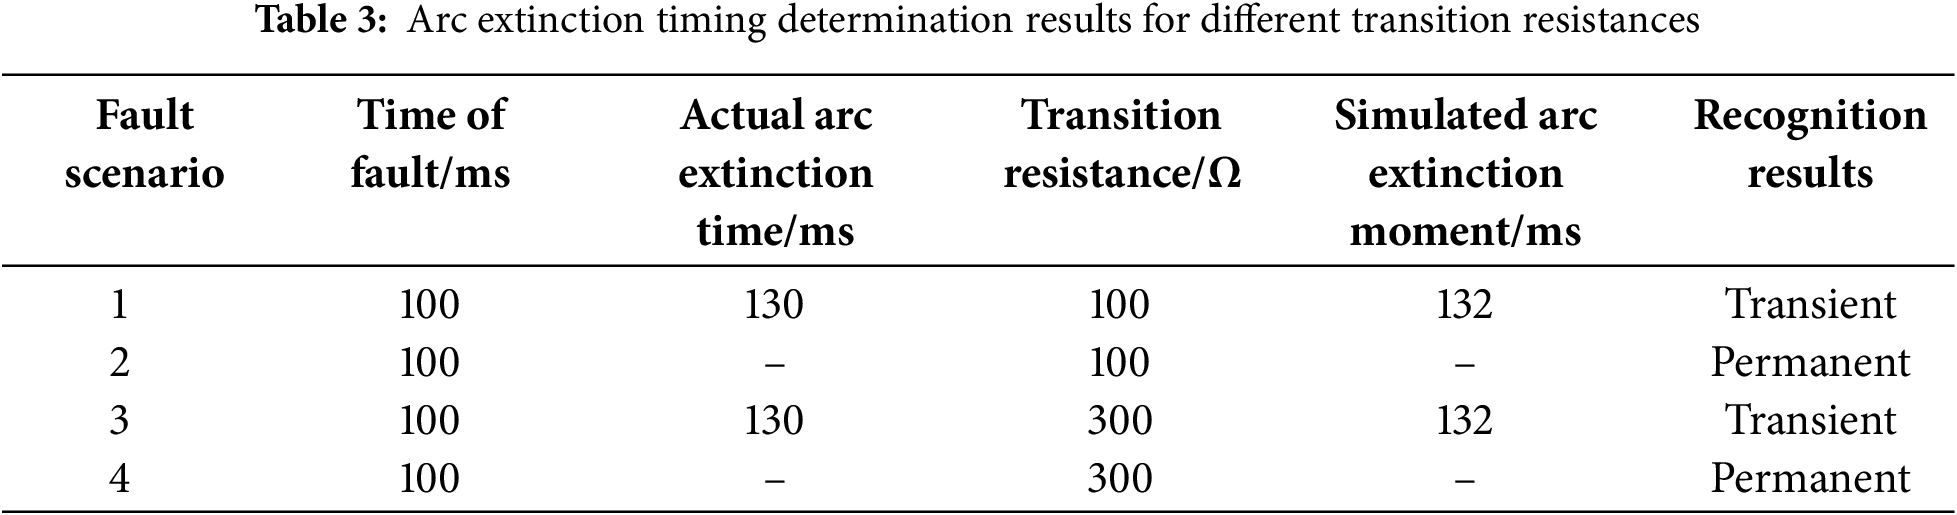
The secondary arc and recovery voltages during transient faults are governed primarily by capacitive coupling mechanisms. Since transition resistance does not participate in the capacitive coupling circuit, variations in transition resistance magnitude do not affect the distinctive time-frequency distribution characteristics observed before and after arc extinction at the terminal. Fig. 16 illustrates the terminal voltage waveform during transient faults in a non-reactor configuration with 100 Ω transition resistance. Despite variations in transition resistance magnitude, distinct time-frequency distribution differences persist before and after arc extinction, validating the robustness of the proposed fault identification methodology. Table 3 presents the identification results for transition resistance values of 100 Ω and 300 Ω, confirming algorithm effectiveness across different resistance scenarios.
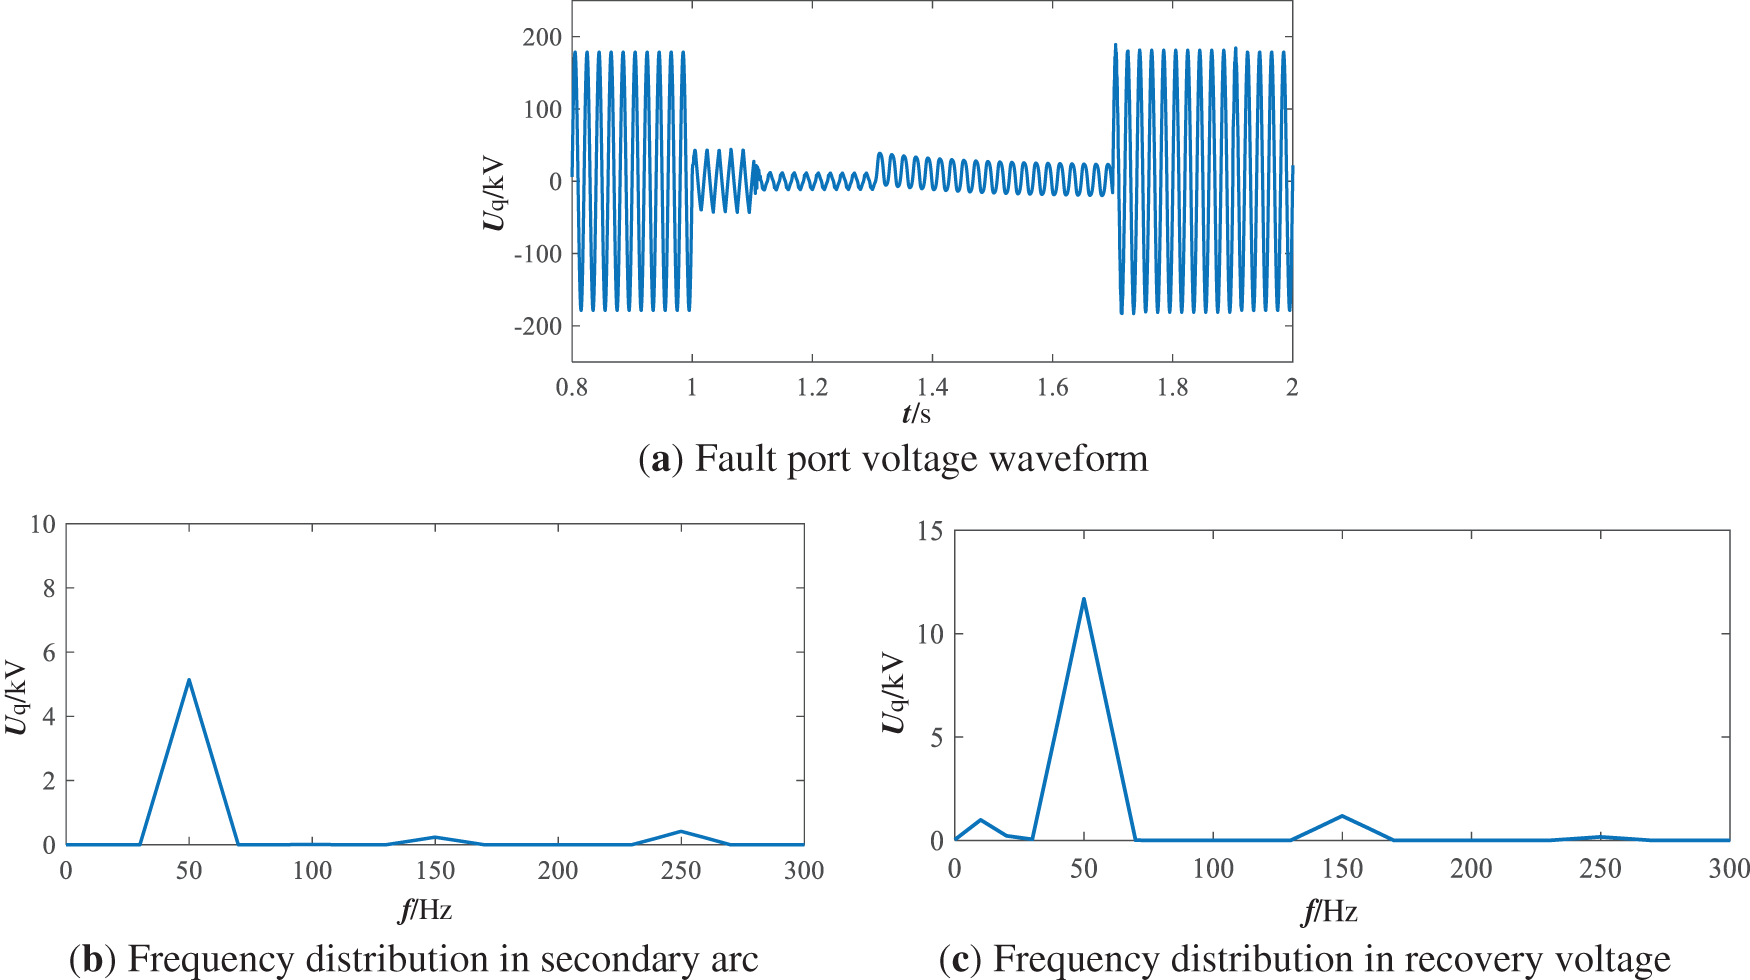
Figure 16: Transition resistance of 100 Ω port voltage time domain frequency domain waveform when different faults occur
5.3 Adopting an Ideal Negative Sequence Current Suppression Strategy
Under ideal negative sequence current suppression control, renewable energy systems exhibit equivalent behavior to conventional synchronous sources with minimal harmonic injection [25]. As demonstrated in Fig. 17, during single-phase-to-ground metallic faults at the line midpoint in non-reactor configurations, the faulted phase terminal voltage displays characteristic low-amplitude oscillations prior to arc extinction. Following arc extinction, interphase capacitance discharge induces characteristic DC offset, creating distinct voltage signatures that differentiate pre- and post-extinction phases. The harmonic content also varies significantly: pre-extinction harmonics derive from nonlinear arc resistance variations, while post-extinction periods exhibit minimal harmonic distortion due to the absence of nonlinear sources. These distinctive characteristics validate the effectiveness of the proposed fault identification methodology, with quantitative results presented in Table 4.
Figure 17: Port voltage time domain and frequency domain waveforms during a fault using an ideal negative sequence suppression strategy
Taking the transient fault occurring at the midpoint of the parallel reactor circuit in Section 5.1 as an example, adding 30 dB of white noise interference to the port voltage sampling data yields the waveform shown in Fig. 18. As shown in the figure, under 30 dB noise interference, the port voltage waveform exhibits some glitches. However, this paper primarily focuses on the time-frequency characteristics of the voltage waveform. By comparing the differences in time-frequency features between adjacent windows to construct a fault nature identification algorithm, the calculated Euclidean distance remains relatively stable even in the presence of noise interference, thereby enhancing the accuracy of the identification. As shown in Table 5, the calculation results for D during transient faults indicate that the arc extinction time determination for such faults is 132 ms. This demonstrates that the fault nature identification method developed in this paper exhibits excellent resistance to noise interference.
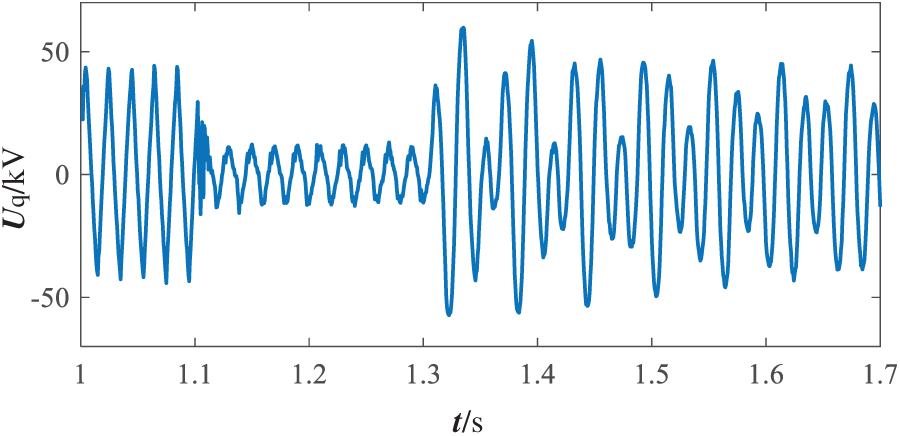
Figure 18: Voltage waveform with 30 dB noise interference
To demonstrate the superiority of the proposed method in identifying transmission line fault characteristics, the most commonly used identification methods in existing research—namely, the method based on terminal voltage harmonic content [29] and the method based on terminal voltage integral ratio [30]—were selected as comparative benchmarks.
The identification method based on terminal voltage harmonic content achieves fault classification by comparing the harmonic content of terminal voltage with a set threshold (5%). Fig. 19 illustrates the variation in harmonic proportion of terminal voltage during permanent faults in renewable energy grid-connected scenarios. It is evident that a fixed harmonic content threshold fails to adapt to renewable energy integration. During voltage recovery periods when renewable energy is grid-connected, the Total Harmonic Distortion (THD) rate consistently exceeds the threshold value. Under these conditions, the criterion may erroneously conclude that the arc has not extinguished, posing a risk of misjudgment.
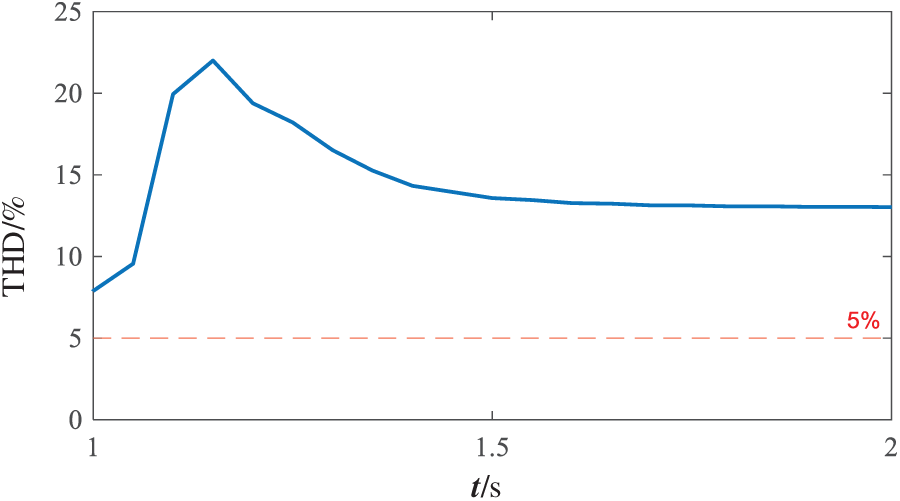
Figure 19: Permanent fault port voltage harmonic ratio
The identification method based on terminal voltage integral ratio utilizes the amplitude difference before and after fault arc extinction to determine the nature of ground faults. Fig. 20 shows the terminal voltage waveform when the fault occurs at the line end. In this fault scenario, due to the high impedance between the measurement point and the fault location, the amplitude difference between pre- and post-extinction waveforms is small, resulting in an indistinct extinction characteristic. The calculated voltage integral ratio is shown in Fig. 21. At this point, the calculated voltage integral ratio does not exceed the set threshold, causing the method to misclassify a transient fault as a permanent fault. In contrast, the fault nature identification method proposed in this paper can still correctly identify the fault nature in the above scenario, demonstrating excellent identification performance.
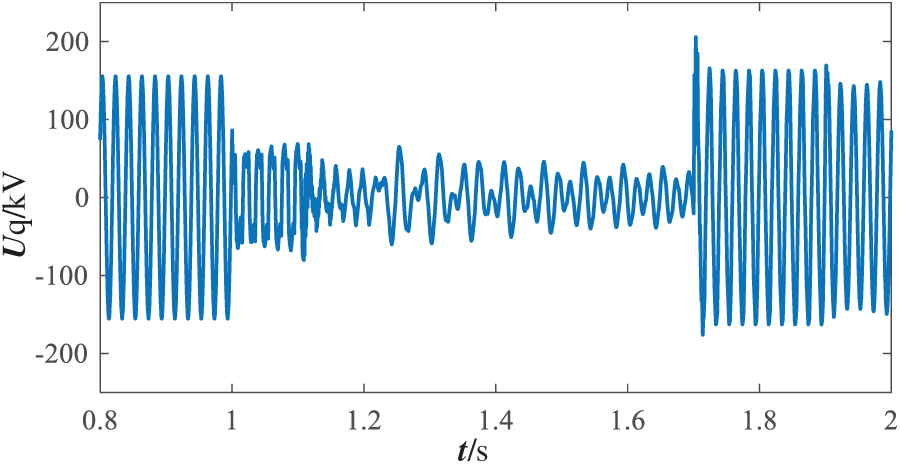
Figure 20: Port voltage waveform
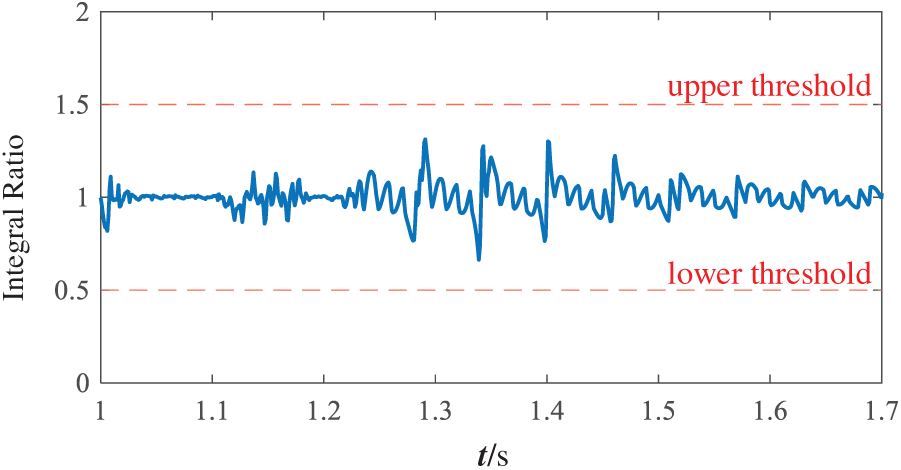
Figure 21: Port voltage integral ratio
Considering the algorithm’s computational complexity, this paper avoids computationally intensive matrix operations compared to the Prony algorithm used in [14], significantly improving computational efficiency. Compared to the artificial intelligence approaches employed in [17,19], it does not require large amounts of training data, thereby avoiding training complexity. Compared to the FFT used in references [8,9], although the computational complexity is slower, the WPD employed in this paper offers superior time-frequency resolution and achieves higher recognition accuracy. In summary, the fault nature identification algorithm proposed in this paper demonstrates excellent performance in both computational complexity and identification accuracy.
Addressing the challenges posed by renewable energy cluster integration to conventional fault identification methods, this paper analyzes the fault characteristics of single-phase-to-ground transient and permanent faults in transmission systems. A fault feature extraction methodology based on wavelet packet decomposition is proposed, utilizing the time-frequency distribution of the first eight frequency bands as discriminative fault signatures. Euclidean distance metrics between reference and windowed voltage feature patterns establish the permanent fault identification criteria. The methodology’s effectiveness is validated through comprehensive PSCAD simulation modeling, yielding the following conclusions:
(1) Compared to conventional synchronous generators, renewable energy cluster grid-connected systems exhibit characteristic harmonic emissions during non-full-phase operation following transmission line faults, predominantly comprising third and fifth harmonic components. Independent of shunt reactor configuration, transient transmission line faults demonstrate significant voltage characteristic differences before and after arc extinction, providing distinctive signatures for fault nature identification. Specifically, two distinct scenarios emerge: Without shunt reactors, the faulted phase terminal demonstrates low-amplitude oscillations during the arc period, followed by characteristic DC offset due to interphase capacitance discharge post-extinction; With shunt reactors, similar pre-extinction oscillations occur, but post-extinction behavior differs fundamentally—the distributed capacitance and shunt reactors form an underdamped oscillatory circuit, generating distinctive beat frequency patterns in the recovery voltage. From a frequency domain perspective, harmonic source mechanisms exhibit fundamental differences before and after arc extinction. Independent of shunt reactor configuration, pre-extinction voltage harmonics derive from dual sources: nonlinear arc resistance variations and renewable energy harmonic injection. Post-extinction harmonics originate exclusively from renewable energy systems, as arc elimination removes the primary nonlinear harmonic generator.
(2) Wavelet packet decomposition effectively extracts time-frequency distribution characteristics from fault terminal voltages. Experimental analysis reveals that fault voltage energy concentrates predominantly within the first eight frequency bands following decomposition, establishing these bands as optimal fault feature parameters. For transient faults, the time-frequency domain characteristics across these eight bands exhibit substantial pre- and post-arc extinction variations, which are effectively quantified through Euclidean distance metrics. Conversely, permanent faults demonstrate minimal variation, enabling reliable fault discrimination.
(3) The proposed fault identification methodology, integrating wavelet packet decomposition with time-frequency voltage waveform analysis, demonstrates reliable discrimination between permanent and transient transmission line faults. The algorithm exhibits robust performance across diverse operating conditions, including varying fault locations, transition resistance values, and renewable energy control strategies.
We will conduct research on the characteristics of different fault types in the future and establish corresponding criteria for identifying fault properties.
Acknowledgement: Not applicable.
Funding Statement: This work was supported by State Grid Sichuan Electric Power Company science and technology project “Research on Key Technologies for Reclosing of High-Ratio New Energy Grid Connection Lines.” (Program No: 52199723002Q).
Author Contributions: The authors confirm their contribution to the paper as follows: Study conception and design: Huajie Zhang, Xiaopeng Li, Hanlin Xiao, Lifeng Xing and Wenyue Zhou. Data collection: Huajie Zhang, Xiaopeng Li and Hanlin Xiao. Analysis and interpretation of results: Lifeng Xing and Wenyue Zhou. Draft manuscript preparation: Huajie Zhang, Xiaopeng Li and Hanlin Xiao. All authors reviewed and approved the final version of the manuscript.
Availability of Data and Materials: Data supporting this study are included within the article.
Ethics Approval: Not applicable.
Conflicts of Interest: The authors declare no conflicts of interest to report regarding the present study.
References
1. Shi Z, Wang C, Chen N, Ye X, Wu S. Policy requirements and economic affordability of energy storage for new energy. In: Proceedings of the 6th International Conference on Power and Energy Engineering (ICPEE); 2022 Nov 25–27; Shanghai, China. p. 330–3. doi:10.1109/ICPEE56418.2022.10050279. [Google Scholar] [CrossRef]
2. Li Z, Ye H, Li S, Dai D, Zhou H, Yang Y. Study on optimized operation and configuration of energy storage promoting the consumption of renewable energy. In: Proceedings of the 2024 IEEE 7th International Electrical and Energy Conference (CIEEC); 2024 May 10–12; Harbin, China. p. 10–2. doi:10.1109/CIEEC60922.2024.10583316. [Google Scholar] [CrossRef]
3. Wang T, Song G, Hussain KS. Adaptive single-pole auto-reclosing scheme for hybrid MMC-HVDC systems. IEEE Trans Power Deliv. 2019;34(6):2194–203. doi:10.1109/TPWRD.2019.2921674. [Google Scholar] [CrossRef]
4. Qiu Y, Qian Z, Pan W, Wang S, Xu F, Zhang Z, et al. New automatic reclosing scheme on substation lines for renewable energy source access. In: Proceedings of the 2023 7th International Conference on Power and Energy Engineering (ICPEE); 2023 Dec 22–24; Chengdu, China. p. 99–106. doi:10.1109/ICPEE60001.2023.10453734. [Google Scholar] [CrossRef]
5. Ge Y, Sui F, Xiao Y. Prediction methods for preventing single-phase re-closing on permanent fault. IEEE Trans Power Deliv. 1989;4(1):114–21. doi:10.1109/61.19197. [Google Scholar] [CrossRef]
6. Li B, Cui H, Li B, Wen W, Dai D. A permanent fault identification method for single-pole grounding fault of overhead transmission lines in VSC-HVDC grid based on fault line voltage. Int J Electr Power Energy Syst. 2020;117(1):105603. doi:10.1016/j.ijepes.2019.105603. [Google Scholar] [CrossRef]
7. Chen K, Huang C, He J. Fault detection, classification and location for transmission lines and distribution systems: a review on the methods. High Volt. 2016;1(1):25–33. doi:10.1049/hve.2016.0005. [Google Scholar] [CrossRef]
8. El Refaie HB, Negm E, Abd El Razik M, Negm TS. Developed model and simulation of primary and secondary arc fault on transmission lines using MATLAB. In: Proceedings of the 2017 Nineteenth International Middle East Power Systems Conference (MEPCON); 2017 Dec 19–21; Cairo, Egypt. p. 965–70. doi:10.1109/MEPCON.2017.8301297. [Google Scholar] [CrossRef]
9. Nikoofekr I, Sadeh J. Determining secondary arc extinction time for single-pole auto-reclosing based on harmonic signatures. Electr Power Syst Res. 2018;163:211–25. doi:10.1016/j.epsr.2018.06.013. [Google Scholar] [CrossRef]
10. Prikler L, Kizilcay M, Bán G, Handl P. Improved secondary arc models based on identification of arc parameters from staged fault test records. In: Proceedings of the 14th Power Systems Computation Conference; 2002 Jun 24–28; Seville, Spain. p. 70. [Google Scholar]
11. Ahn SP, Kim CH, Aggarwal RK, Johns AT. An alternative approach to adaptive single pole auto-reclosing in high voltage transmission systems based on variable dead time control. IEEE Trans Power Deliv. 2001;16(4):676–86. doi:10.1109/61.956756. [Google Scholar] [CrossRef]
12. Jamali S, Parham A. New approach to adaptive single-pole auto-reclosing of power transmission lines. IET Gener Transm Distrib. 2009;4(1):115–22. doi:10.1049/iet-gtd.2009.0058. [Google Scholar] [CrossRef]
13. Luo X, Huang C, Jiang Y, Tang T. Adaptive single-phase reclosure scheme for transmission lines with shunt reactors based on current Inner product. IET Gener Transm Distrib. 2017;11(7):1170–6. doi:10.1049/iet-gtd. [Google Scholar] [CrossRef]
14. Qi Q, Lv F. New criteria for identifying the nature of single-phase faults in extra-high voltage transmission lines with parallel reactors. Sichuan Electr Power Technol. 2011;34(1):16–20. (In Chinese). [Google Scholar]
15. Zhao Q, Chen J, Zhou J, Zhang S, Tan J, Zhang L. Permanent fault identification scheme for transmission lines based on amplitude difference for LCC injection signal. Electronics. 2025;14(17):3526. doi:10.3390/electronics14173526. [Google Scholar] [CrossRef]
16. Wu S, He B, Meng F, Liu Y, Lin X, Dai W, et al. Machine learning-based single-phase ground fault identification strategy for AC-DC transmission lines. Electr Power Syst Res. 2023;223:109538. doi:10.1016/j.epsr.2023.109538. [Google Scholar] [CrossRef]
17. Khorashadi-Zadeh H, Li Z. Design of a novel phasor measurement unit-based transmission line auto reclosing scheme. IET Gener Transm Distrib. 2011;5(8):806–13. doi:10.1049/iet-gtd.2010.0744. [Google Scholar] [CrossRef]
18. Karacasu O, Hocaoglu MH. An adaline based arcing fault detection algorithm for single-pole autoreclosers. Electr Power Syst Res. 2011;81(2):367–76. doi:10.1016/j.epsr.2010.09.014. [Google Scholar] [CrossRef]
19. Anwar T, Mu C, Yousaf MZ, Khan W, Khalid S, Hourani AO, et al. Robust fault detection and classification in power transmission lines via ensemble machine learning models. Sci Rep. 2025;15(1):2549. doi:10.1038/s41598-025-86554-2. [Google Scholar] [PubMed] [CrossRef]
20. Jalilian A, Muttaqi KM, Sutanto D, Robinson D. A novel earth fault detection scheme to empower distance protection during asymmetrical power swings with inverter based resources. In: Proceedings of the 2021 IEEE Industry Applications Society Annual Meeting (IAS); 2021 Oct 10–14; Vancouver, BC, Canada. p. 1–8. doi:10.1109/IAS48185.2021.9677183. [Google Scholar] [CrossRef]
21. Haddadi A, Zhao M, Kocar I, Karaagac U, Chan KW, Farantatos E. Impact of inverter-based resources on negative sequence quantities-based protection elements. IEEE Trans Power Deliv. 2021;36(1):289–98. doi:10.1109/TPWRD.2020.2978075. [Google Scholar] [CrossRef]
22. Pillai DS, Rajasekar N. A comprehensive review on protection challenges and fault diagnosis in PV systems. Renew Sustain Energy Rev. 2018;91(5):18–40. doi:10.1016/j.rser.2018.03.082. [Google Scholar] [CrossRef]
23. Ali ZM, Esmail EM. Deep learning and wavelet packet transform for fault diagnosis in double circuit transmission lines. Sci Rep. 2025;15(1):30145. doi:10.1038/s41598-025-15583-8. [Google Scholar] [PubMed] [CrossRef]
24. Shalby EM, Abdelaziz AY, Ahmed ES, Abd-Elhamed Rashad B. A comprehensive guide to selecting suitable wavelet decomposition level and functions in discrete wavelet transform for fault detection in distribution networks. Sci Rep. 2025;15(1):1160. doi:10.1038/s41598-024-82025-2. [Google Scholar] [PubMed] [CrossRef]
25. Li Z, Zhu Y, Hu C, An Z, Li Z. Adaptive single-phase auto-reclosing method for bundled renewable energy transmission lines based on temporal structural mutation of coupled voltage. Electr Power Syst Res. 2025;246:111693. doi:10.1016/j.epsr.2025.111693. [Google Scholar] [CrossRef]
26. Indulkar CS, Ramalingam K. Estimation of transmission line parameters from measurements. Int J Electr Power Energy Syst. 2007;30(5):337–42. doi:10.1016/j.ijepes.2007.08.003. [Google Scholar] [CrossRef]
27. Xiao M, Chang L, Le C. Flexible tripping strategy dealing with uncertain excessive short-circuit current. Proc CSEE. 2019;39(19):5782–92. (In Chinese). [Google Scholar]
28. Huang D, Zhang WA, Guo F, Liu W, Shi X. Wavelet packet decomposition-based multiscale CNN for fault diagnosis of wind turbine gearbox. IEEE Trans Cybern. 2023;53(1):443–53. doi:10.1109/tcyb.2021.3123667. [Google Scholar] [PubMed] [CrossRef]
29. Hoseinzadeh B, Amini MH, Bak CL, Blaabierg F. High impedance DC fault detection and localization in HVDC transmission lines using harmonic analysis. In: Proceedings of the 2018 IEEE International Conference on Environment and Electrical Engineering and 2018 IEEE Industrial and Commercial Power Systems Europe (EEEIC/I & CPS Europe); 2018 Jun 12–15; Palermo, Italy. p. 1–4. doi:10.1109/EEEIC.2018.8494613. [Google Scholar] [CrossRef]
30. He B, Ning J, Huang G, Kong J, Wang L, Xie Y, et al. Identification strategy for arc-extinguishing moment in single-phase ground faults based on integral ratio distribution. Electr Power Autom Equip. 2020;40(4):178–84. (In Chinese). [Google Scholar]
Cite This Article
 Copyright © 2026 The Author(s). Published by Tech Science Press.
This work is licensed under a Creative Commons Attribution 4.0 International License , which permits unrestricted use, distribution, and reproduction in any medium, provided the original work is properly cited.
 Downloads
 Citation Tools