
 Submit a Paper
 Propose a Special lssue
 Open Access
ARTICLE

Experimental Assessment of a Modified PTC with Aluminum Tubes on the Reflector Surface
Department of Mechanical Engineering, University of Wasi, Kut, 52001, Iraq
* Corresponding Author: Ebtehal Chasseb Jbary. Email:
(This article belongs to the Special Issue: Advancements in Energy Resources and Their Processes, Systems, Materials and Policies for Affordable Energy Sustainability)
Energy Engineering 2026, 123(3), 9 https://doi.org/10.32604/ee.2025.074415
Received 10 October 2025; Accepted 11 December 2025; Issue published 27 February 2026
 View Full Text
 Download PDF
Abstract
Despite significant advancements in solar collector technology, persistent challenges remain in improving the overall efficiency of solar systems. This paper investigates the use of mini-channel aluminum tubes mounted on the reflective surface as preliminary heating stages to enhance the overall system thermal performance. Experimental assessments were conducted with flow rates ranging from 0.1 to 0.8 LPM and tilt angles of 180° South and 225° Southwest in Al-Kut, Iraq, from 9:00 AM to 2:00 PM. Fluid flows sequentially through five flat aluminum tubes totaling 50 channels, named stage-1, then flows through four aluminum tubes totaling 40 channels, named stage-2, and lastly through the copper tube receiver, named stage-3. Results indicate that the copper tube contributes 65%–80% of total heating, while the aluminum tubes contribute 20%–35%. The maximum thermal efficiency reached 84% at a flow rate of 0.5 LPM and a tilt angle of 180° South at 1:00 PM. The pressure drop behavior was analyzed through three stages with different flow distributions. In stages 1 and 2, the pressure drop increased linearly with flow rate. In stage-3, the pressure drop rose more sharply with flow rate showing a nonlinear trend. The results contribute to the optimization of solar thermal systems by clarifying the roles of flow rate, collector orientation, and the use of mini-channel aluminum tubes in enhancing thermal efficiency. This study contributes to solar thermal technology by showing that the use of aluminum preheating tubes in a modified PTC can enhance thermal performance and provide sustainable energy solutions.Keywords
Solar energy, being the most abundant and freely available renewable source, represents a significant component of the global energy transition towards sustainable energy systems. While there is ample opportunity for solar energy, the contribution to total energy consumption worldwide is modest, in part due to significant technical, economic, and infrastructure challenges [1]. Solar energy applications are generally divided into two forms: thermal energy (heat) and photovoltaic energy (electricity). For thermal applications, solar collectors are the fundamental technology that converts solar radiation into useful heat for residential, commercial, and industrial processes [2].
Among different solar collector types, parabolic trough collectors (PTCs) and flat-plate collectors (FPCs) are well-established. PTCs are especially well-suited to medium- and high-temperature applications, and PTCs are commonly used in solar thermal power generation applications [3]. However, these systems are frequently limited by thermal losses, which are more severe at higher operating temperatures, and increased pumping power due to long flow paths and higher pressure drops [4]. To overcome these limitations, new research has focused on miniaturized thermal management techniques, such as mini-channel, which show promising prospects for improved thermal performance, compactness, and energy efficiency [5]. These systems include multiple small-diameter flow channels within the absorber section, promoting greater heat transfer coefficients, less thermal loss to the ambient, and flexibility in modular configuration [6].
Historically, parallel flow tubes were used for air-based flat-plate collectors. When implementing liquid-based solar collectors, careful consideration and optimization, especially of geometry, flow distribution, and materials, are required. One main concern is that an increasing number of collector tubes to optimize the thermal exchange will also increase the manufacturing cost and collector surface area, which could lead to increased thermal loss [1]. Also, flow maldistribution, fabrication tolerances, and channel orientation have much greater effects on the performance of the mini-channel systems [5]. Incorporating mini-channels into energy systems. These advancements have improved not only heat transfer, but also compactness, cost, and efficiency [7]. Further improvements in heat transfer have been achieved because internal fins, perforated inserts, and structured surfaces can be incorporated into mini-channels, thereby disrupting the thermal boundary layer and creating secondary flows that enhance heat transfer.
A number of experimental and numerical studies have demonstrated the potential of mini-channel arrangements to be effective in solar collectors. Cheng et al. [8] also conducted 3D numerical simulations using the Monte Carlo Ray Tracing (MCRT) method and developed nuanced representations of a sun tracker, showing enhanced heat transfer through a PTC receiver tube, while discussing the influence of radiation losses and flow property parameters on efficiency [9]. Mwesigye et al. [10] also examined the use of an internal perforated plate in solar receiver tube applications and showed the potential improvement in Nusselt number due to the perforated plate, leading to an improvement of up to 138.2% at increased pressure drops. Wen [11], as well as [12], highlighted many recent advancements in thermal isolators that impede bubble formation and simplified coupling thermodynamics, and even discussed the use of polymer absorbers, nanofluids, and cavity receivers in increasing the thermal performance of solar collectors.
Recent work by Singh et al. [13] explored volumetric solar absorption using nanofluids, underscoring the most important factors impacting thermal efficiency and fluid stability. He et al. [14] performed the experimental validation of the heat performance of a stainless steel-based microchannel configuration as flat-plate air heat exchangers. Even with these two recent studies, more research is needed to comprehend the implications of geometrical parameters (fin shapes, tube diameters, count of inlets/outlets), working fluid characteristics, and operating conditions on the mini-channel solar collector’s efficiency. Therefore, a more descriptive multi-parameter analysis is required to enhance design and thermal performance while maintaining cost effectiveness and mechanical robustness is to be conducted.
Research aimed at developing methods to enhance heat transfer in Parabolic Trough Collectors (PTCs) has remained a primary focus of solar thermal research because of its enormous influence on efficiency and sustainability of the system. Among effective methods for improving PTC performance is the geometric modification of the absorber tubes (including fins, twisted, perforated, and multi-channel configurations, etc.), creating a greater surface area for heat transfer, disrupting the laminar sublayer, and promoting internal convective heat transfer coefficients. A plethora of studies have shown that geometric modifications improve thermal efficiency, outlet temperature, and the effectiveness of the collector as a whole, and enhancing absorber geometry stands as one of the leading avenues for performance improvement.
Ghomrassi et al. [15] investigated cost-effective changes to the receiver tube that would enhance the thermal performance of PTC systems. It should be noted that the receiver comprises nearly 20% of total system cost. The proposed design consisted of an enlarged diameter tube and thicker metallic walls, which resulted in a higher solar heat flux at the lower edge and increased temperature of the outlet fluid. The thermal performance was improved with the modified design compared to the conventional receiver, and this was validated with Jeter’s analytical correlations.
More et al. [16] continued the study of mini-channel receiver arrangements with a MATLAB-based model. These models determined that the optimized mini-channel receiver design produced a thermal gain of 23% with outlet fluid temperatures between 82°C and 155°C at flow rates of 1.5–4 L/h. These results indicated reduced thermal losses and increased efficiency of the collector at changing solar flux.
Muthusamy [17] suggested a receiver design that involves a bundle configuration by substituting a single large diameter tube with a number of small diameter tubes with the aim of improving convective heat transfer. This configuration achieved an optical performance of 66.4%, and a thermal performance of 74.8% which reinforces an increase in heat transfer. The configuration did present the additional challenge of greater fluid resistance and required a higher pumping power further reinforcing challenges in creating a balance between hydraulic loss and thermal gain. Bhattacharya et al. [18] investigated twisted absorber tube geometries, utilizing the MCRT method and validating the designs through heat transfer fluid testing to evaluate the thermal performance of twisted tubes. The modified twisted tubes achieved a 9.2% increase in heat transfer performance over the smooth tubes, and the overall efficiency of the collector was 75.5% which modified twisted tubes outperformed conventional smooth tubes. The additional performance was attributed to enhanced mixing of the fluid. Byiringiro et al. [19] examined an innovative receiver design that incorporated internal fins, and a central rod insert, and was assessed using CFD simulations in ANSYS Fluent with Therminol VP-1 utilized as the working fluid. The receiver design resulted in a 49.7% higher Nusselt number and a 41.2% reduction in circumferential temperature gradients along the circumference of the tube. The overall implications resulted in improvements to the uniformity of heat transfer, the durability of the structure, and the system efficiency.
While many authors have analyzed the ways that the performance of parabolic trough collectors (PTC) can be enhanced by altering either geometry or materials, significant trade-offs exist, particularly with respect to thermal performance improvements vis-a-vis hydraulic or economic trade-offs. Ghomrassi et al. [15] increased heat transfer by enlarging the receiver size, yet this resulted in higher material expense and load on the structure. Bhattacharya et al. [18] increased turbulence and heat transfer by approximately 9% by implementing twisted tube geometries, though commensurately higher pressure drops also occurred. Similarly, Byiringiro et al. [19] reported a 49% increase in Nusselt number with finned receivers, though this retrospective study suggested that fins were too complex and expensive to manufacture. More et al. [16] explored mini-channel configurations, offering a high degree of compactness and enhanced convective coefficients, but the bulk of these studies were numerical in nature and were limited to single-channel arrangements, under idealized conditions.
In their research, Alshehery et al. [20] investigated how flat absorber tubes modified with triangular prism turbulators influenced the performance of parabolic trough collectors. They concluded that the experimental results indicated the flat tube would increase thermal performance by 28% greater than conventional geometry. It also explored to consider turbulator geometry and turbulator spacing; an optimal cross-sectional area of 33 mm2 would produce the greatest heat transfer. It was clear that internal thermally-insulating turbulator designs and geometries of tubes can significantly improve convective heat transfer and total efficiency of each collector, supporting a continuum of studies which provide geometrically based designs as improvements of PTC performance.
This review finds that most past work features either alterations to the internal receivers or theoretical simulations, and few studies look at empirical experimental integration of hybrid stages of mini-channel pre-heating along with PTC systems. Such experiments are warranted, and this research demonstrates, and then experimentally tests, a hybrid parabolic trough collector that includes aluminum mini-channel pre-heating stages on the reflector surface and contains a copper receiver tube as the main absorber. The original contribution of this research is in demonstrating the multi-staged absorption concept that promotes distribution of solar energy absorption through successive mini-channel and classic absorber areas improving thermal uniformity, the temperature gradient, and overall efficiencies, while not being overly costly or complex. Experimental corroboration in outdoor conditions in Al-Kut, Iraq, builds on the knowledge gained from the interaction between flow rate, collector orientation, and a stage-wise heat transfer approach.
The hypothesis of the current investigation is to utilize preheating elements to raise the working fluid temperature utilizing absorbed solar radiation. The preheated WF is then directed to the receiver tube in the parabolic trough focal line. This section articulates the developed solar collector’s design through a designed, fabricated, and experimented solar water heating setup based on a parabolic trough receiver integrated with preheating Aluminum flow channels. The solar water heating system absorbs and heats the water in three stages, as outlined in Fig. 1.
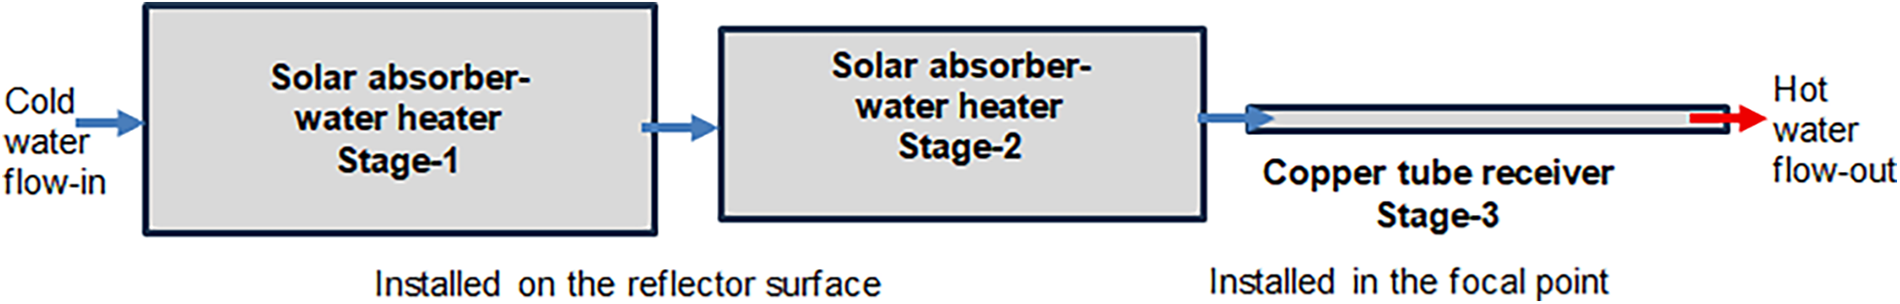
Figure 1: Strategy of the proposed integrated solar water heater comprising two preheating stages and a main receiver heater tube in a parabolic trough assembly
The correlation between the aperture width and the focal length could be expressed as a function of the rim angle, as shown in Eq. (1).
where wa is an aperture width (m),
The arc length of the parabolic reflector surface is expressed by Eq. (2) [21]:
where Hp = 4F is the latus rectum of the parabola (m).
The length from the edge of the reflector to the focal point is called the radius of the parabola, that could be estimated by Eq. (3) [21].
where r is the parabolic radius (m).
The concentration ratio Ca defines the performance of the concentrating solar collector. It is the ratio between the area of the collector’s aperture and the area of the receiver [22], which is predicted as 13.042.
Fig. 2 illustrates the design of the parabolic trough solar collector.
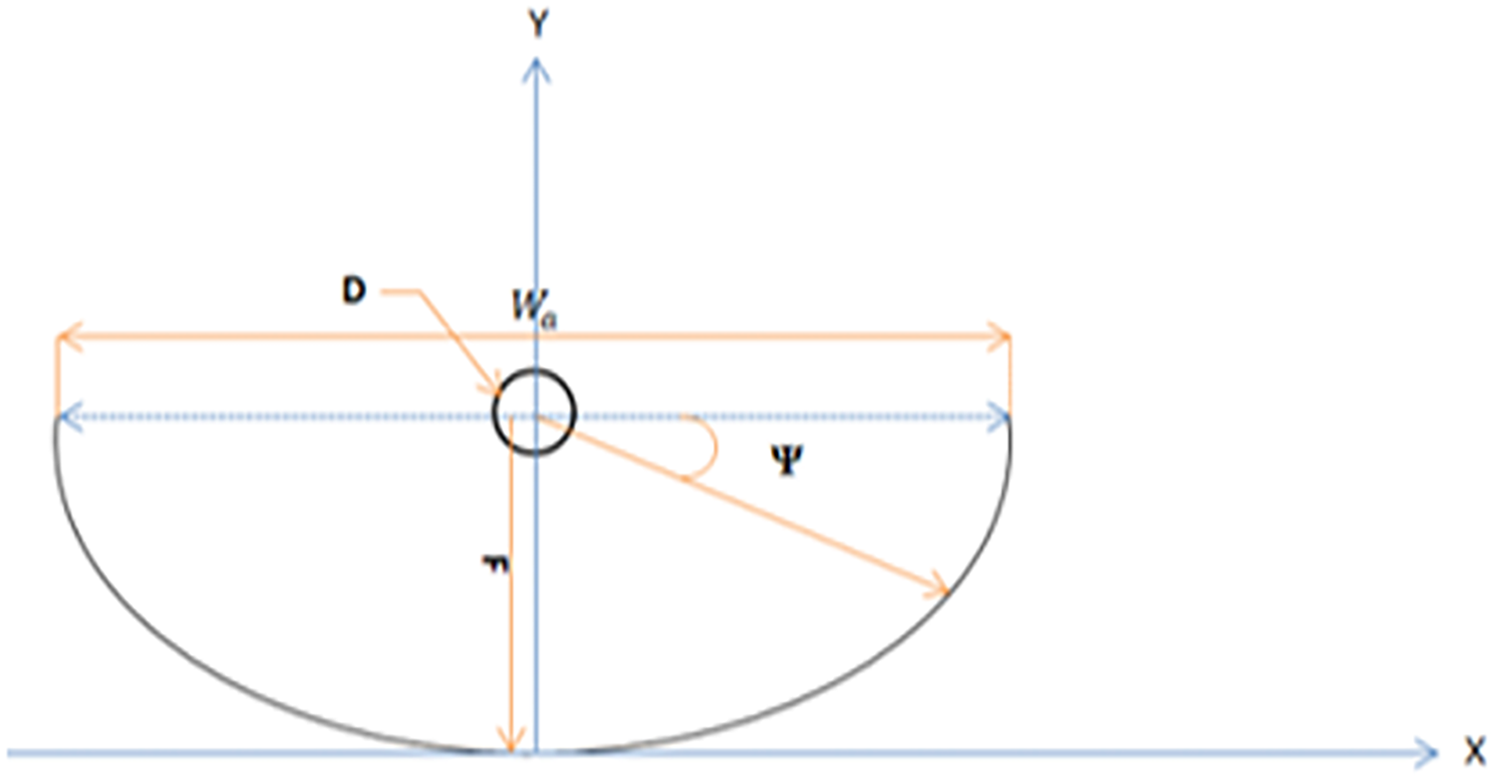
Figure 2: Design of the parabolic trough solar collector
The useful energy,
where Tout is the water outlet temperature (°C), Tin is the water inlet temperature (°C), and Cp is the specific heat of water (J/kg·K).
The solar energy input,
where I is the solar radiation (W/m2), and
The thermal efficiency of a PTC is defined as the ratio of the useful energy gained to the solar input, as in Eq. (7) [24]:
The percentage of the heat gained in each stage represents the fraction of the heat gain by the stage of total heat gained. A suitable analytical depiction of a parabola is given in Eq. (8).
where Y is the height of the parabola (m), X is the horizontal distance from the vertex (m).
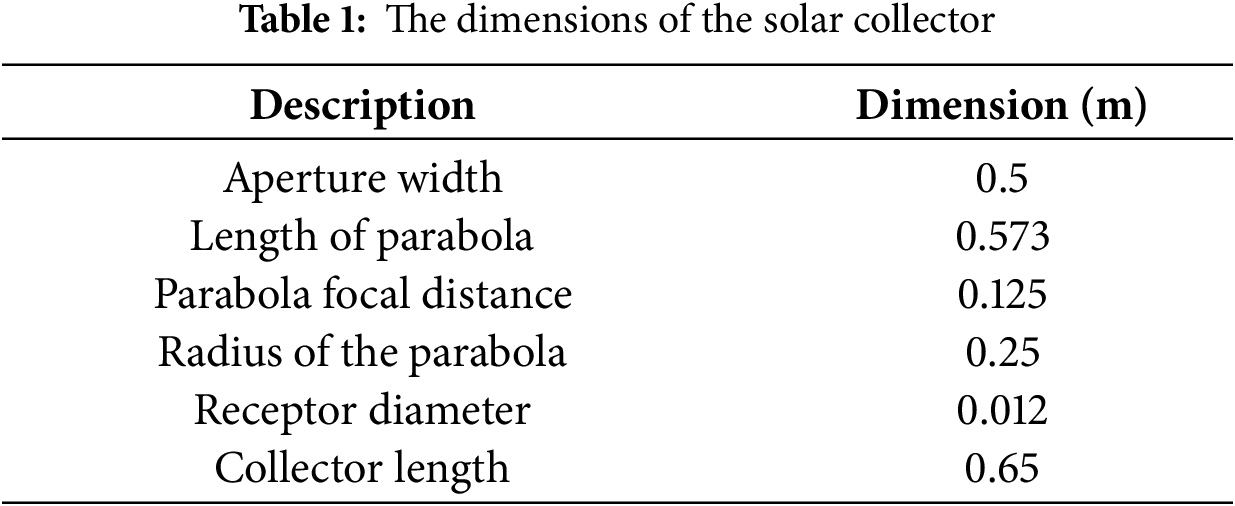
The dimensions of the developed solar heating system are shown in Table 1.
The parabolic arc shape, shown in Fig. 3, has been utilized to fabricate the reflector of the solar water heating system. The mini-channel cross-section and the geometries are shown in Fig. 4 and the dimensions are listed in Table 2, while the design specifications of the absorbing-heating stages are listed in Table 3.
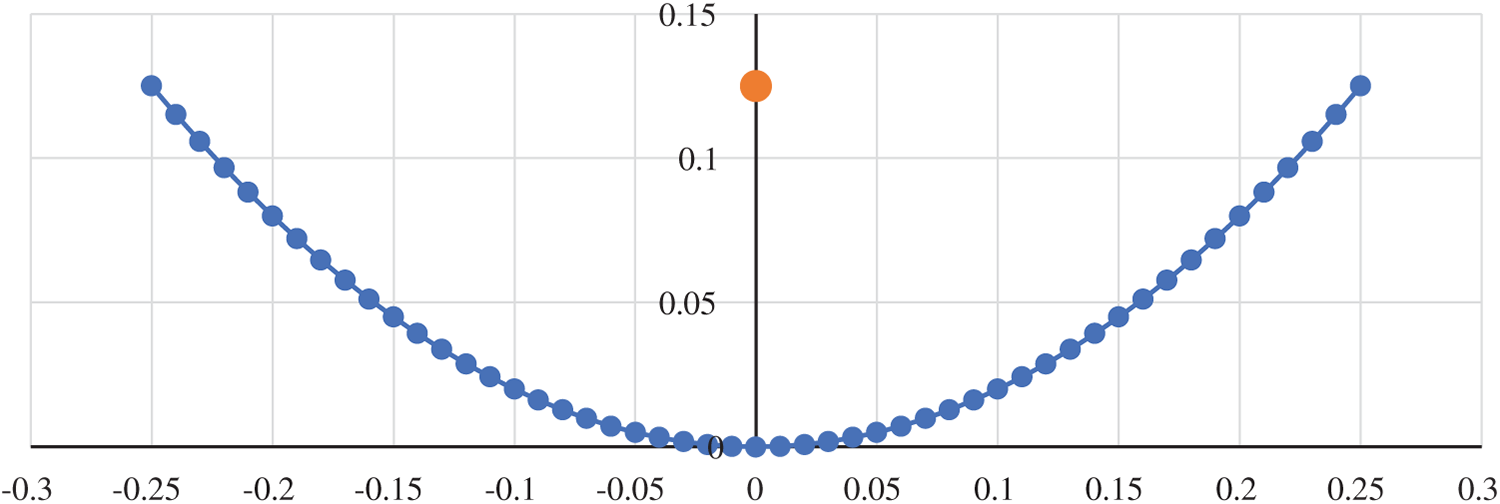
Figure 3: The design geometries of the reflector parabolic surface
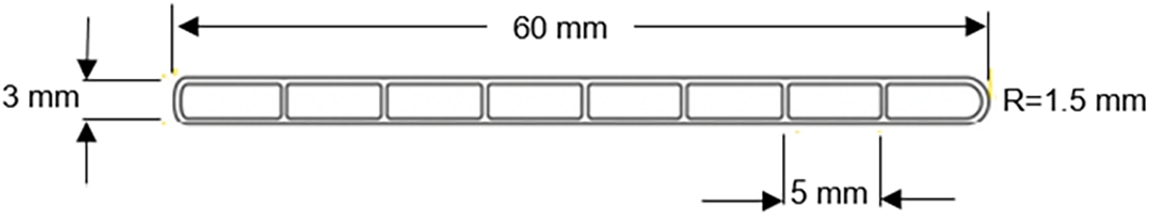
Figure 4: The cross-section and the geometries of the Aluminium mini-channel
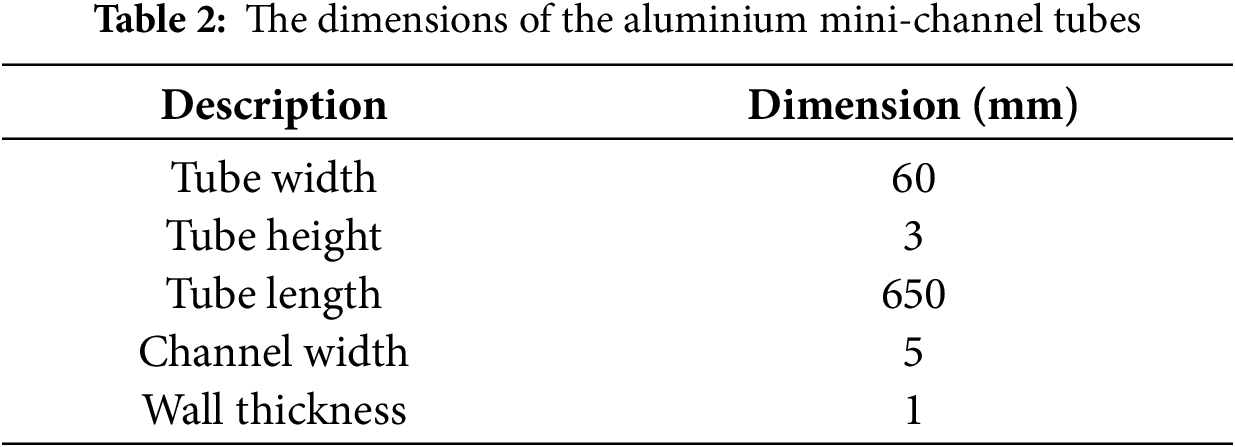
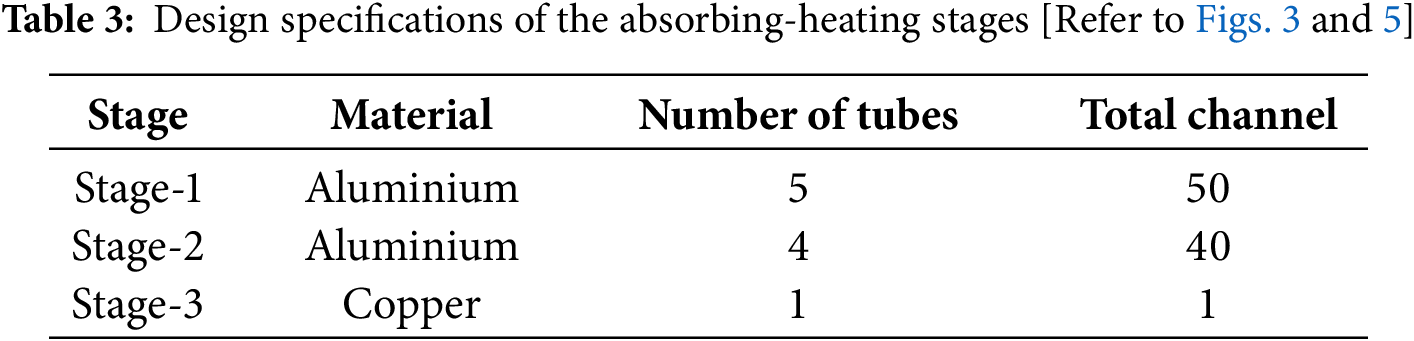
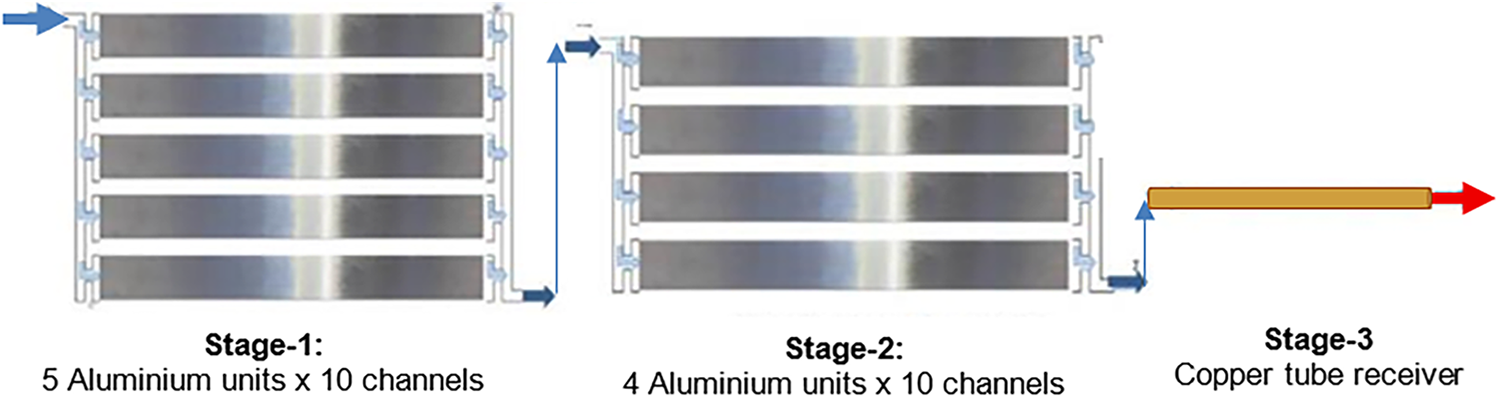
Figure 5: Basic illustration of the heating stages and sequence of the fluid flow
The system comprises three interconnected heating stages. The first heating stage consists of five aluminum flat tubes containing 50 channels, connected in parallel to ensure uniform water distribution. The second heating stage includes four aluminum tubes with 40 channels, also connected in parallel. Heating stage-1 and heating stage-2 are linked in series to enable gradual heat transfer. Subsequently, the water flows directly into the third stage, which consists of a single copper tube housed within a parabolic trough collector. The system is designed as a continuous closed loop, allowing uninterrupted water flow through all stages, thereby enhancing overall thermal efficiency, as outlined in Fig. 5.
To determine the pressure losses, the subsequent equations were applied: The hydraulic diameter is expressed as the quotient of the flow’s cross-sectional area and the wetted perimeter, as indicated in the relationship below [25]:
where Dh is the hydraulic diameter (m).
For the minichannel tube:
For the copper tube:
The Reynolds number represents the ratio of inertial forces to viscous forces and is used to identify the flow type. It is calculated using the mean hydraulic diameter as shown in Eq. (10):
where μ is water dynamic viscosity (Pa·s).
The Darcy friction factor, f formulas are equations used to determine the friction factor, a dimensionless value that represents friction losses in both pipe and channel flow.
For laminar flow, the Darcy friction factor for laminar flow is expressed by Eq. (11) [26]:
For transitional flow:
where:
All tubes used are smooth, so
For turbulent flow,
The velocity of the working fluid is calculated using Eq. (14).
where v is the fluid velocity (m/s), and Aflow is the croos sectional area of the conduit.
The widely recognized equation for calculating pressure loss from experimental data was formulated by the Darcy-Weisbach formula and can be expressed by Eq. (15) [26]
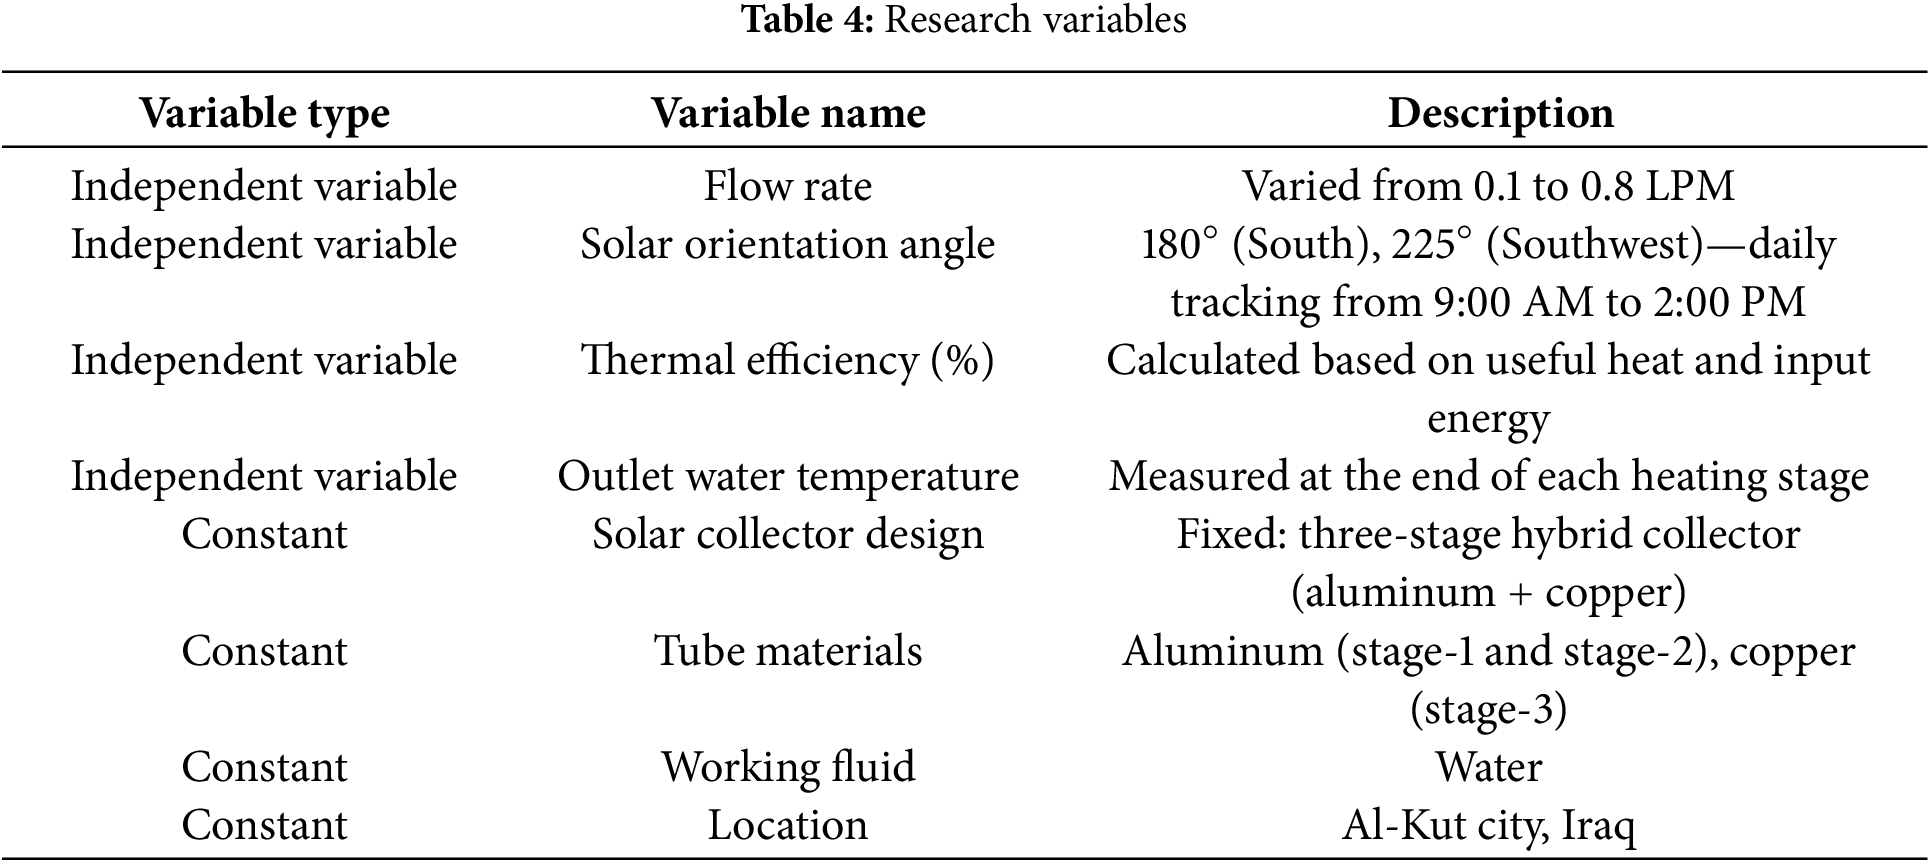
The experiments were conducted at six flow rates of 0.1, 0.2, 0.3, 0.4, 0.5, and 0.8 LPM, and in three stages of heating. In heating stage-1, water flows through 50 channels; in heating stage-2, water flows through 40 channels; and in stage-3, water flows through the copper tube receiver. The test has been performed at 180° South and 225° Southwest tilt angles in Al-Kut city. See Table 4, which contains the research variables.
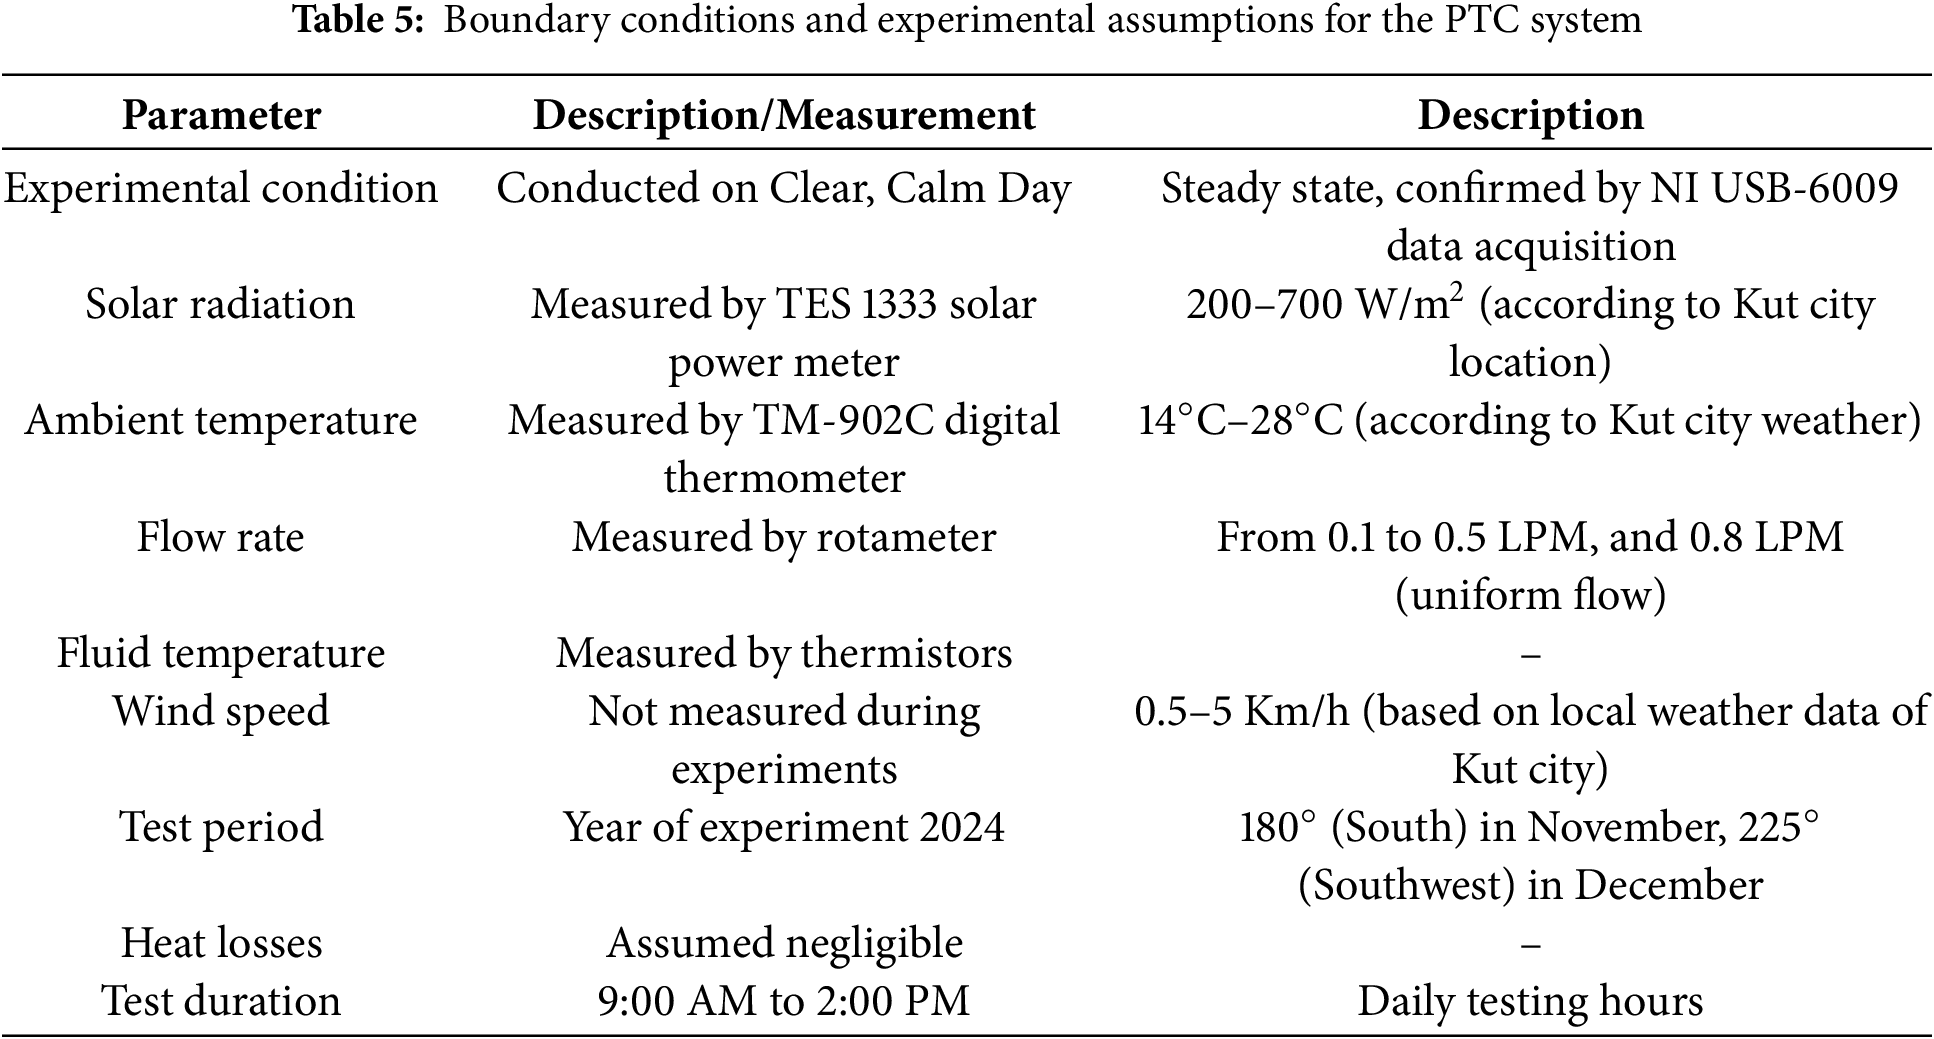
To ensure clarity and reproducibility of the experiments, the main boundary conditions and experimental assumptions for the modified PTC system are summarized in Table 5. These conditions include ambient and fluid temperatures, solar radiation, flow rate, wind speed, and steady-state operation during the tests.
Clarification on heat losses and temperature measurements, in the present setup, temperature sensors were installed directly at the outlet of each stage, allowing the measurement of the net thermal energy that actually reached the working fluid. Although radiative and convective heat losses from the collector structure were not quantified separately, their effect is inherently reflected in the outlet temperature measurements, since the sensors record only the remaining heat that is successfully transferred to the water.
2.2 Experimental Implementation
The mini-channel aluminum tubes used in the system were manufactured through an extrusion process, in which heated aluminum is forced through a shaped die to create the required multi-channel rectangular profile with rounded edges, as shown in Fig. 6. Copper end caps were then carefully fitted onto both ends of each tube to serve as inlets and outlets for the working fluid (water), as illustrated in Fig. 6.
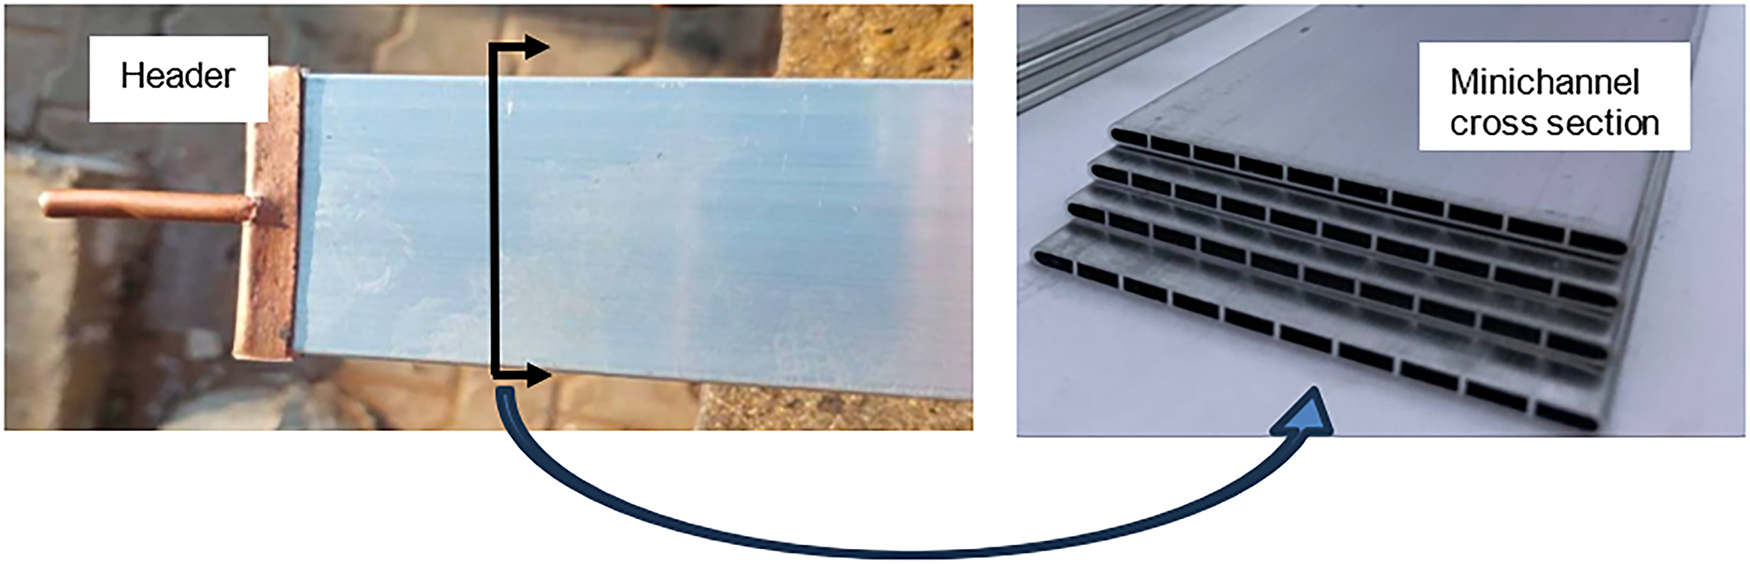
Figure 6: Aluminium mini-channel
The assembled Aluminum mini-channels were then installed on the reflective surface of the solar collector, as shown in Fig. 7a. The mini-channel aluminum tubes were carefully and precisely installed on the reflector, maintaining its parabolic curvature. Their small dimensions allowed mounting without significantly affecting the smoothness or shape of the reflective surface. Fiberglass insulation was also added to the backside of the collector to reduce heat loss, as shown in Fig. 7b. To increase solar reflectivity toward the copper tube, a thin layer of self-adhesive Aluminum foil tape was applied onto the surface of the Aluminum tubes, as shown in Fig. 7c. The entire solar collector was mounted on a supporting iron structure equipped with movable parts that enable the reflective surface to track the sun’s position and maximize solar radiation capture. Water flows initially through stage-1, consisting of five aluminum tubes with a total of 50 mini-channels. It then passes through stage-2, made of four aluminum tubes containing 40 channels. Significant heat transfer occurs in these two stages due to the effective design and geometry of the tubes. Finally, the water enters the third stage, where it flows through a single copper tube positioned at the focal line of the parabolic trough collector, gaining substantial thermal energy due to the concentrated solar radiation and the high thermal conductivity of copper.
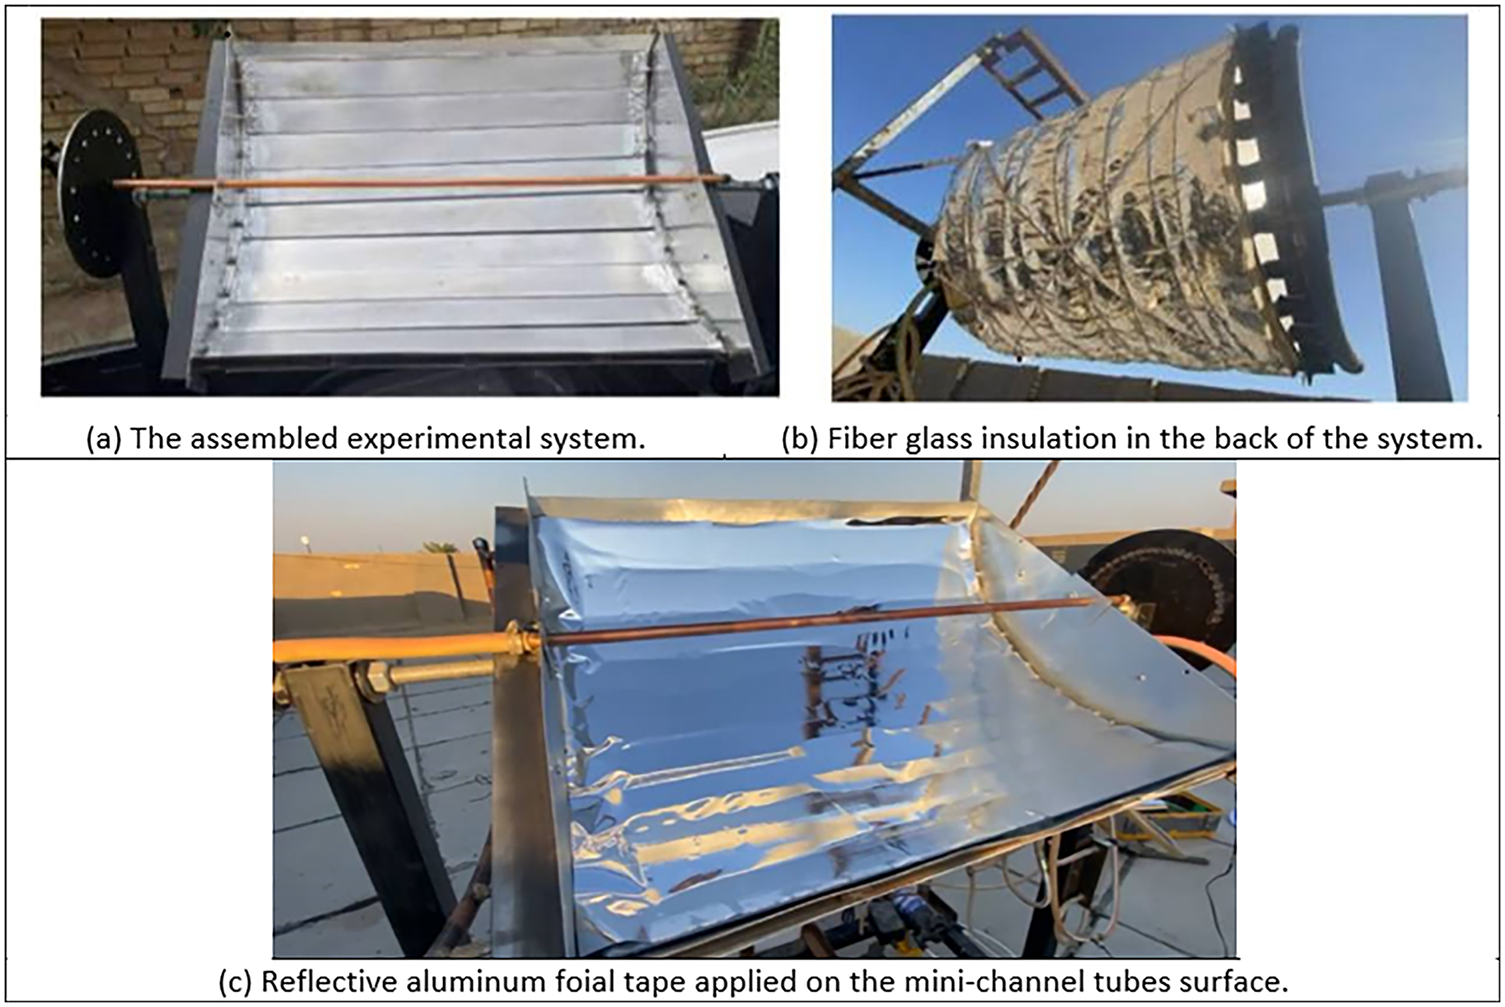
Figure 7: The assembled experimental solar heating system
3 Measurements and Instrumentation
Fig. 8 shows the schematic diagram of the experimental setup and measurement instrumentation. The experimental setup consists of a tank connected to a pump that circulates water through the system. The flow rate was controlled using a rotameter installed after the pump. The water flows through three consecutive stages of the solar collector. A thermistor (
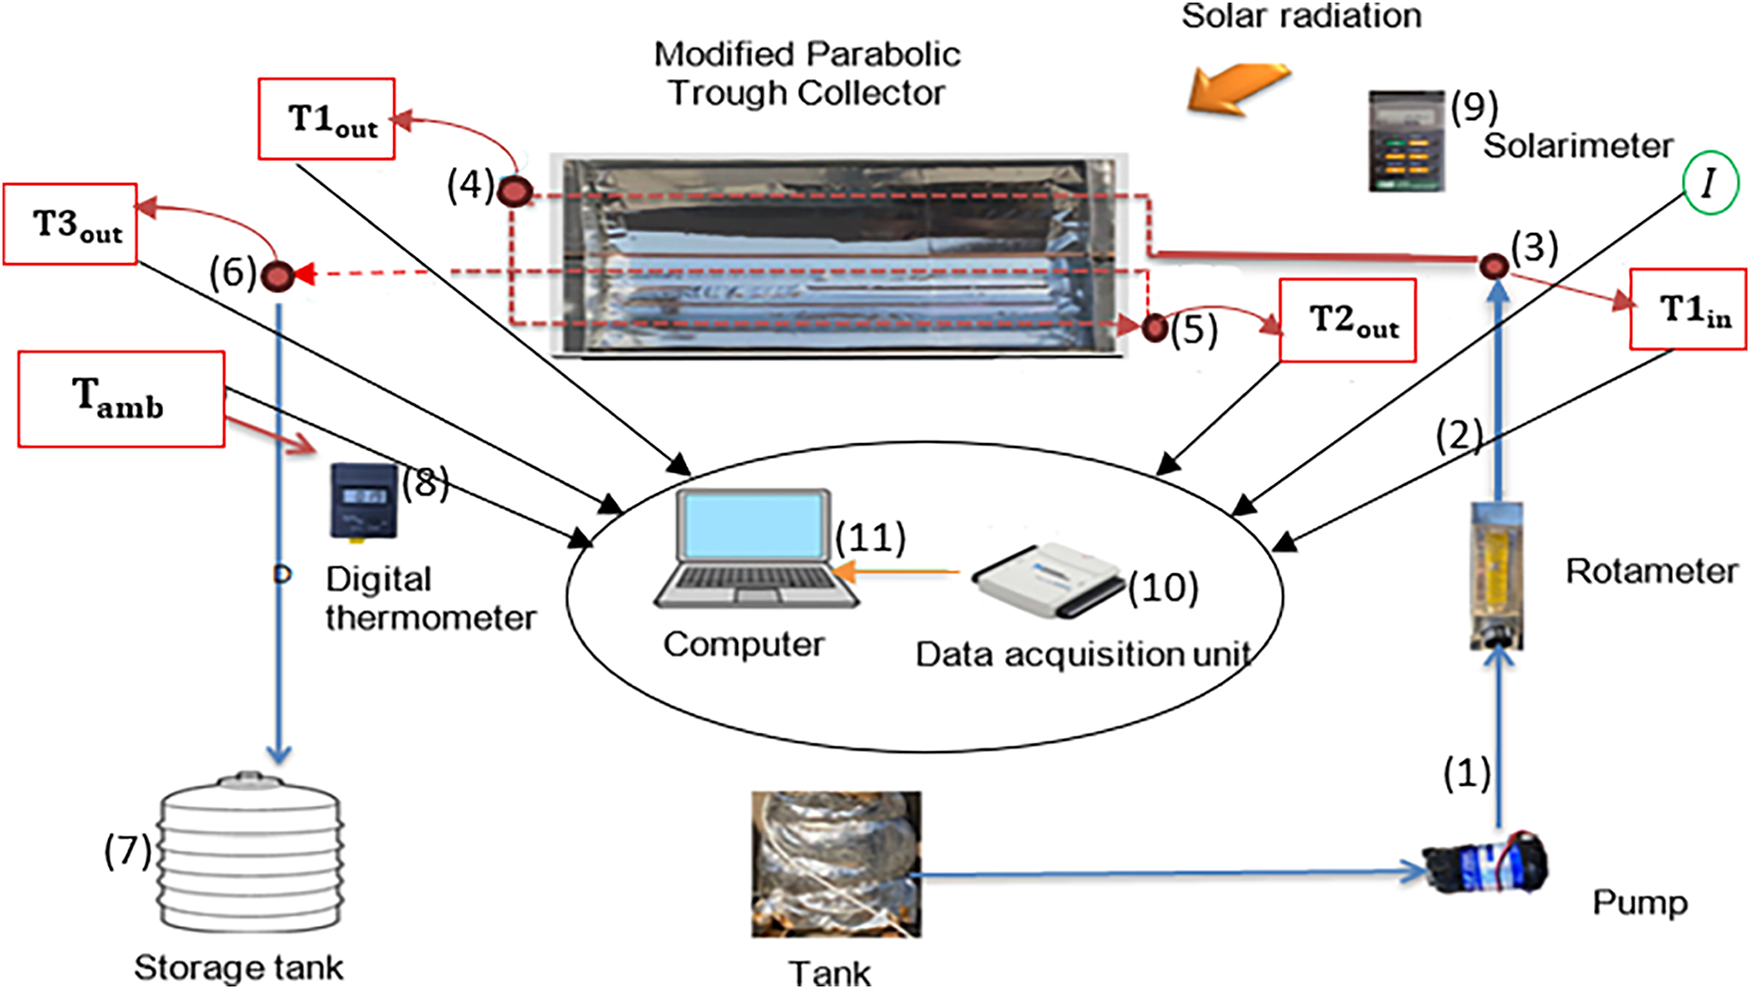
Figure 8: A schematic diagram illustrates a solar water heating system
In addition, two separate measuring devices were used: a Solar Power Meter (Solarimeter) to measure the solar radiation intensity (
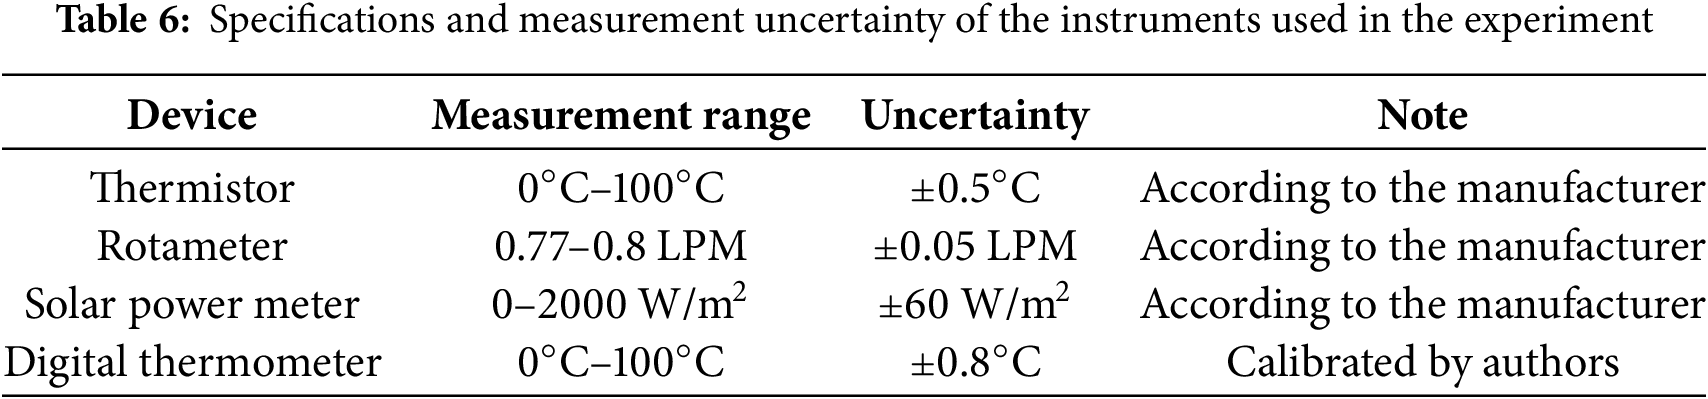
To maintain the credibility of the experimental results, the accuracy of the measurement instruments used in this study was taken into account. The TM-902C digital thermometer used for temperature measurements has an accuracy of ±0.8°C. The solar irradiance was recorded using the TES 1333 solar power meter, with a specified accuracy of ±60 W/m2. The flow rate was monitored using a rotameter, with a typical accuracy of ±0.05 LPM. These specifications were deemed sufficient for the current experimental setup, as listed in Table 6 and the K-type thermocouple uncertainty in Table 7.
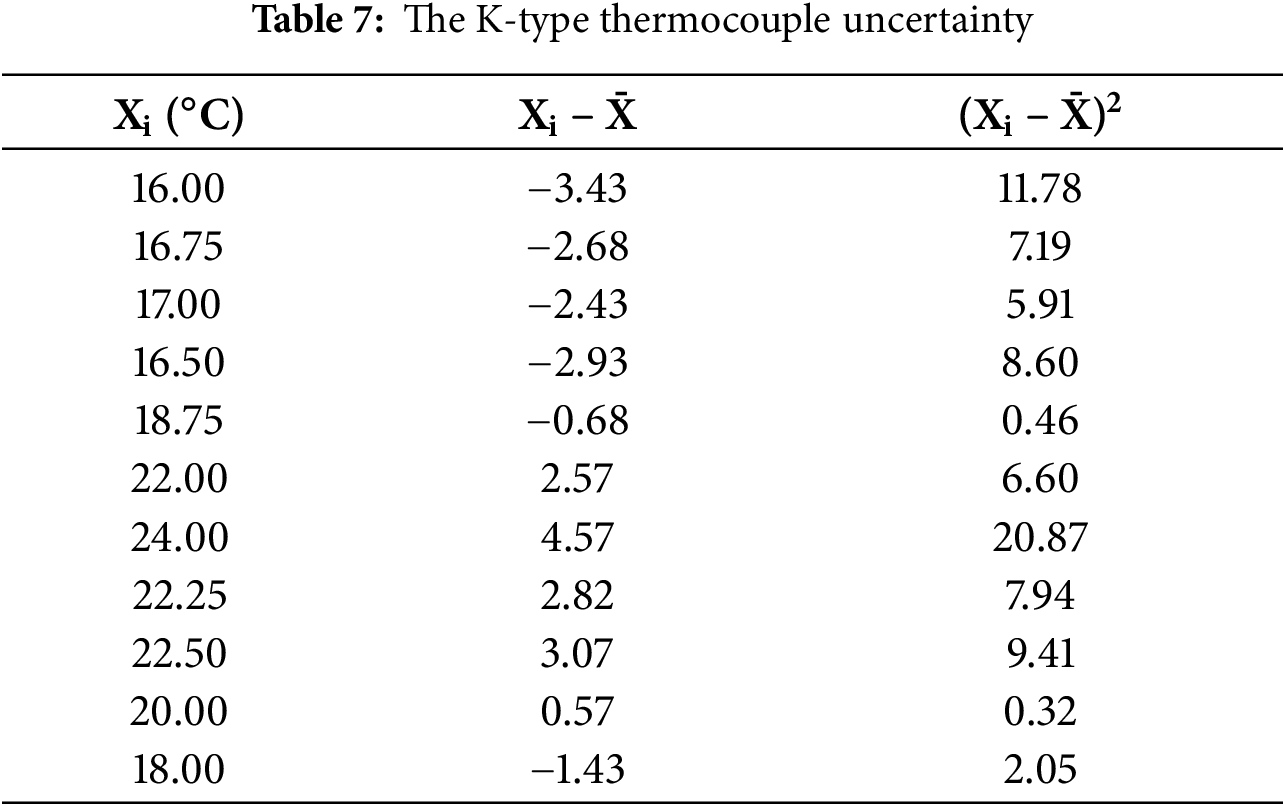
The inaccuracy of the digital thermometer was calculated using the following equation:
3.1 NI USB-6009 Data Acquisition
The NI USB-6009 is a multi-function Data Acquisition (DAQ) device that offers precise measurements and control. It connects to Modbus RTU Slaves using RS-485 via USB, which makes it a useful device for Research, Education, and Industry. Key characteristics include: 8 Analog Input Channels with a 14-bit resolution, a 48KS/s sample rate, 12 Digital I/O, 1 x 32-bit counter, and two signal generators. It works with LabVIEW and DAQ Express, and it is suitable for circuit automation, on-site measurements, and signal simulation—providing precise and repeatable solutions.
3.2 TES 1333 Solar Power Meter
The TES 1333 Solar Power Meter is a portable instrument for measuring solar irradiation in W/m2. It is mainly used in ecology, solar power installations, and energy savings studies to assess sunlight exposure. The meter has a data hold feature, a storage feature to save measurements, and various modes for operating convenience.
3.3 TM-902C Digital Thermometer
The TM-902C Digital Thermometer is a portable temperature recording instrument utilizing a Type K thermocouple probe. It has a temperature range of −50°C to 1300°C, a clear digital display, and has tremendous applications in industry and home improvement projects. There are many professionals and weekend warriors who use this thermometer due to the accurate readings it delivers.
3.4 TYP 2500 Diaphragm Booster Pump
The TYP 2500 Diaphragm Booster Pump is a requirement for reverse osmosis (RO) water filter systems to increase water pressure and the amount of filtered water. The pump runs on 24 V DC with a rated production of 50 gallons per day and an operating pressure of 80 PSI, and a bypass cut-off at ≤125 PSI. This pump is designed for residential, commercial, and industrial RO systems to be capable, reliable, and energy-efficient in water purification.
The rotameter is a flow-measuring device used to measure the flow rate of liquid or gas in closed systems. It consists of a vertical, tapered tube with a float inside that rises or falls based on the flow rate. The float’s position is visible through a transparent tube and indicates flow rate on a marked scale. The rotameter usually has a variable valve that permits the user to control fluid flow. The rotameter is simple, accurate, repeatable, compact, and reliable, and is commonly used in laboratories, industrial processes, medical devices, and water treatment.
Thermometers were made from semiconductor materials that can change their electrical resistance with temperature. Thermistors operate on the principle that a semiconductor material’s mobility and charge-carrier concentration will change with temperature. For accurate temperature measurement, the temperature-resistance relation is typically represented using the Steinhart-Hart equation, which can adequately represent the nonlinear thermistor response.
The following section presents the key findings from the experimental investigation. The results are organized to highlight the thermal performance of the system under varying conditions. Detailed discussions on heat gain, efficiency, solar tracking, flow dynamics, and their interrelations are provided to understand the overall behavior and effectiveness of the collector.
4.1 Useful Energy for the Heating Stages
Fig. 9 shows the percentage of useful energy,
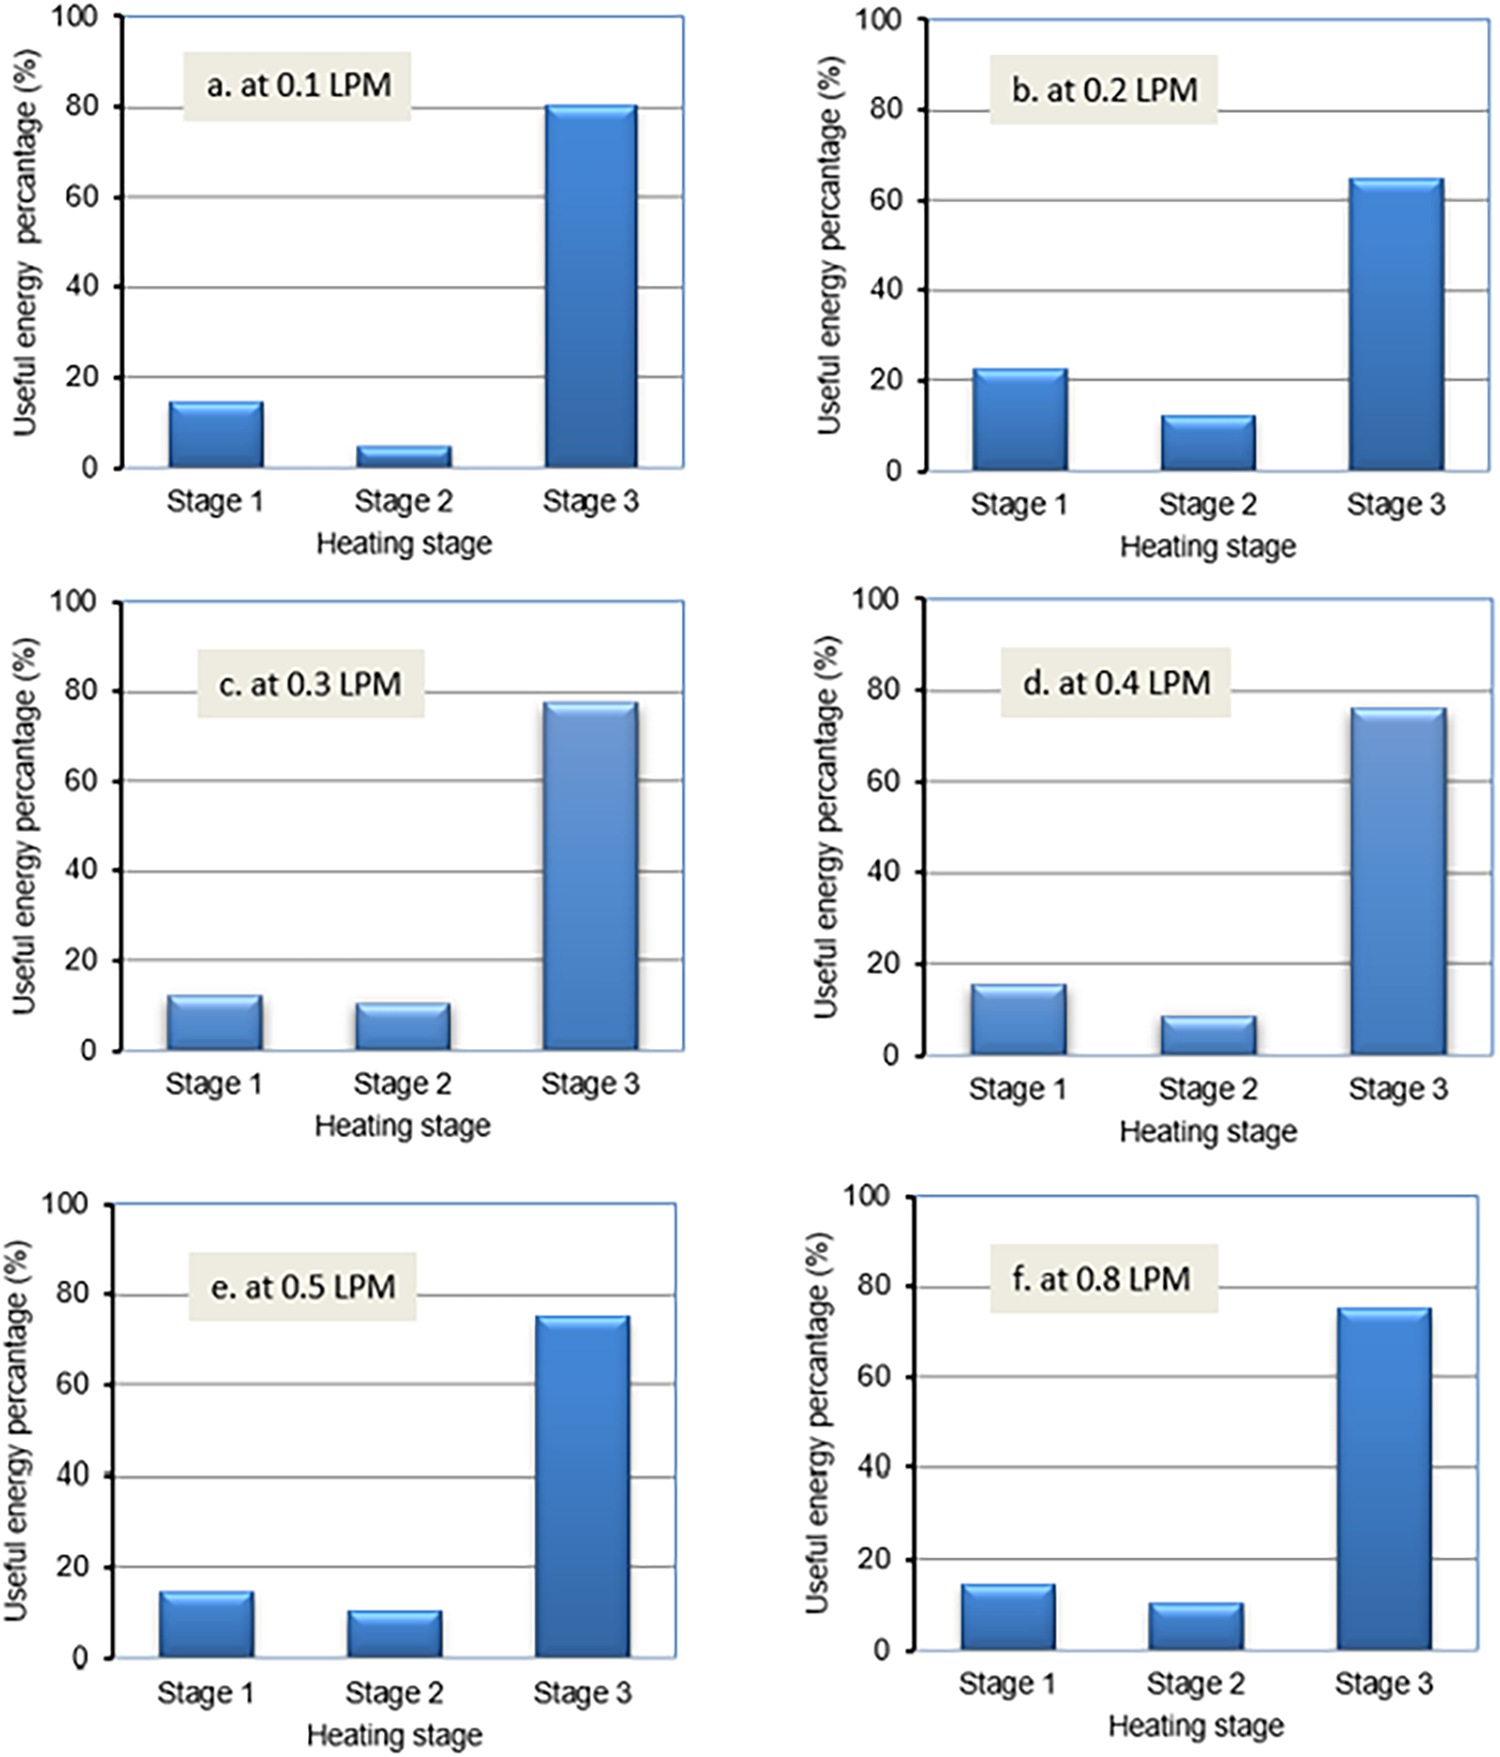
Figure 9: Percentage of useful energy (heat gain) in each eating stage at an angle of 180° South Kut city, operating at various flow rates
The percentage useful energy percentage,
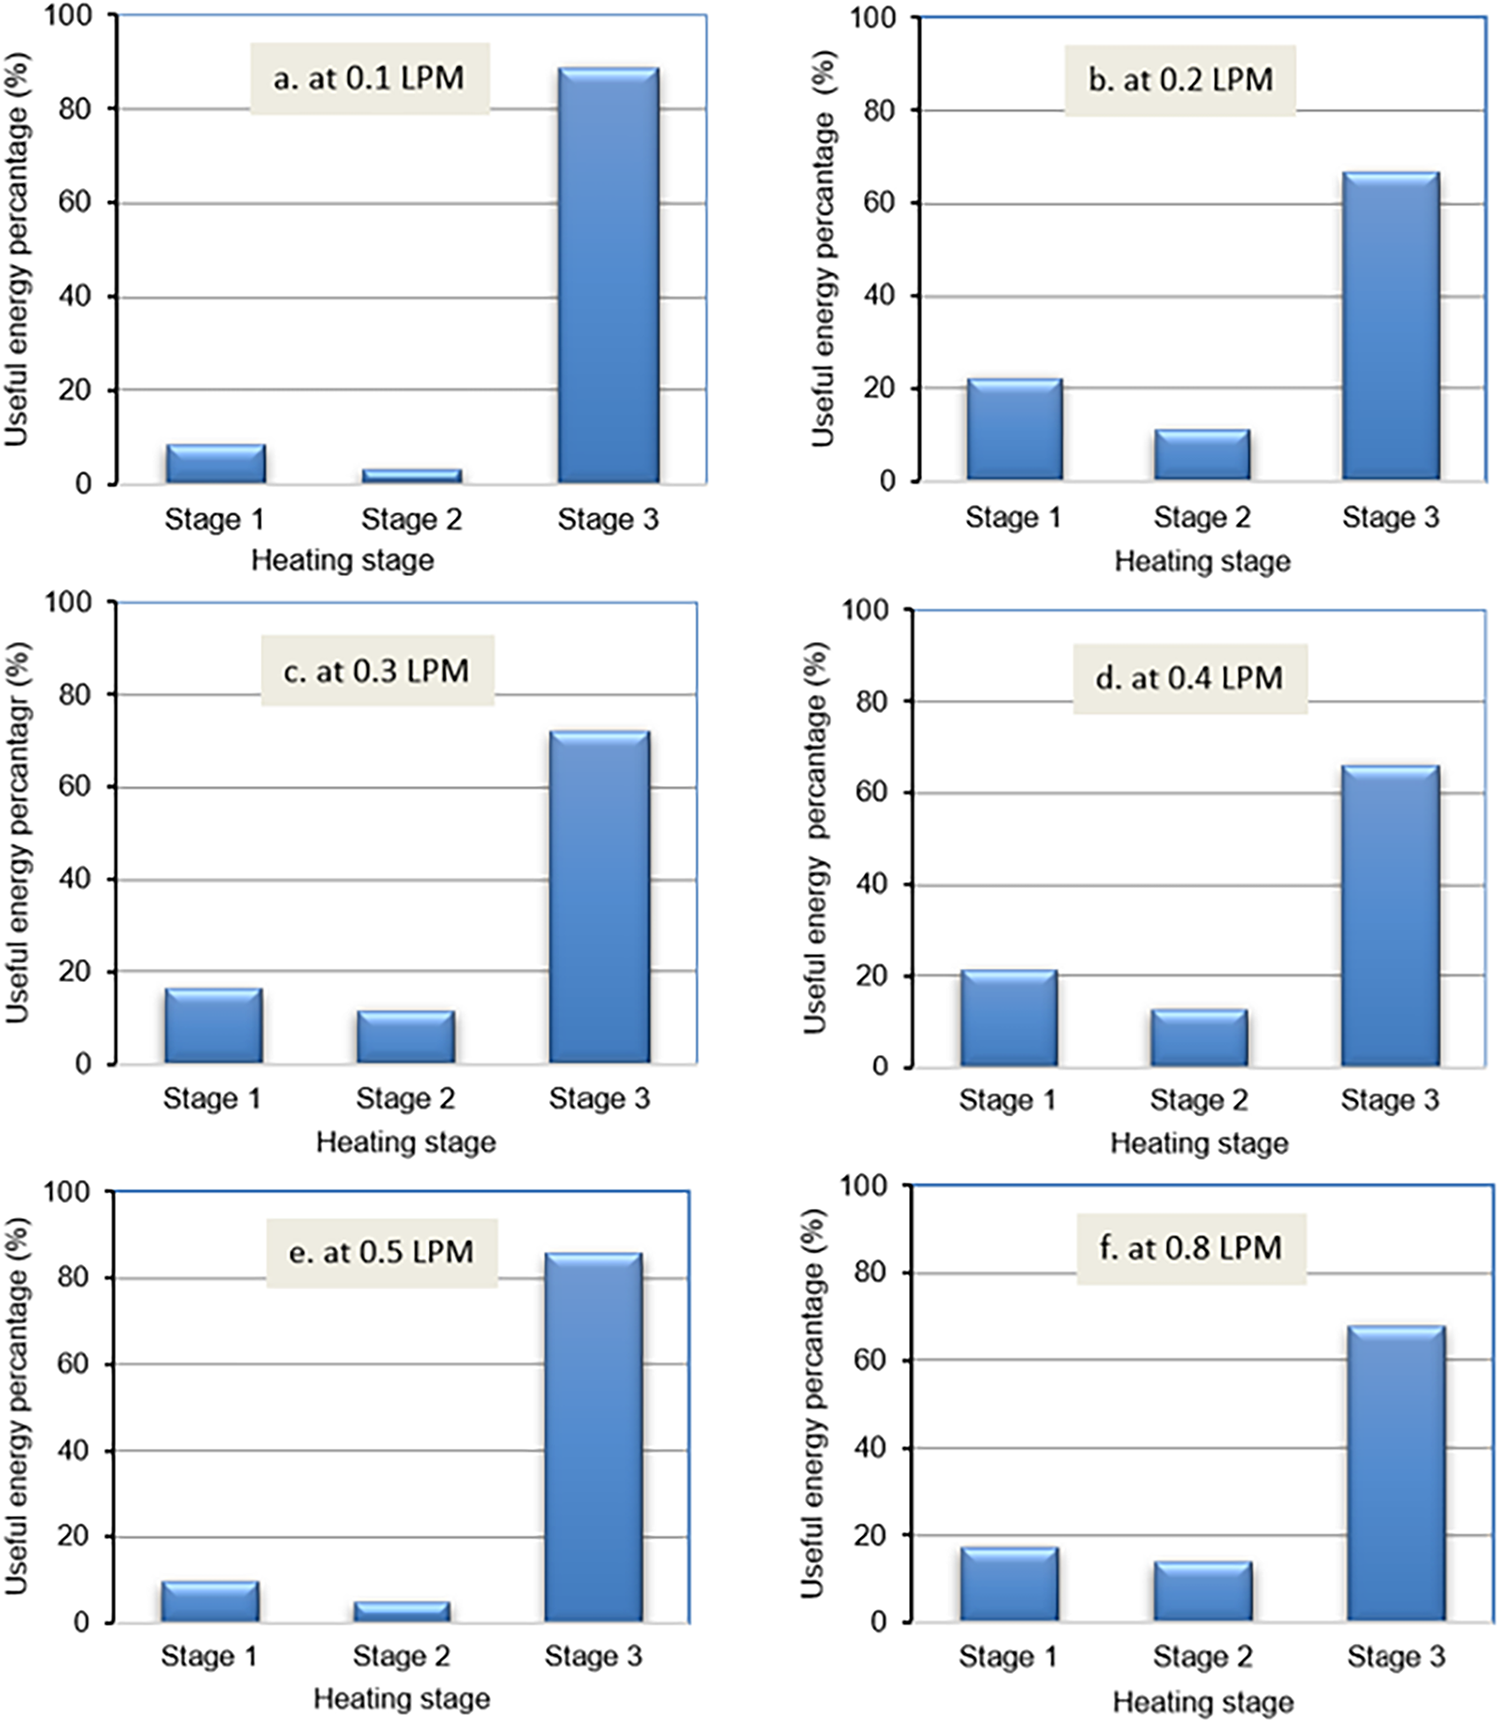
Figure 10: Useful energy percentage gained in each heating stage at an angle of 225° in the Southwest of Kut city, operated at various flow rates
System installation at 180° South of Kut city shows a considerable efficiency change with time and flow rate, as shown in Fig. 11. The efficiency at all flow rates, 0.1 to 0.8 LPM, shows a gradual increase from 9:00 AM until 1:00 PM. This parallels the solar intensity effect, which stays elevated up to midday and has a gradual decrease thereafter. The efficiency values during the morning hours are low, where it reached 0.58% at 9:00 AM at a flow rate of 0.1 LPM, which is the lowest reading recorded during the experiments that were conducted. This low efficiency is attributed to the low solar irradiance in early morning, combined with the extended residence time of the working fluid inside the collector, which increases relative heat losses to the surroundings. Efficiency starts to increase after the morning hours until it reaches its highest value at 1:00 PM, where it reaches 84% at a flow rate of 0.5 LPM. The high efficiency at this flow rate is due to the multi-stage heating configuration, where the reflective surface functions as an active heating stage, allowing optimal heat transfer to the fluid, and the balance between sufficient residence time for heat absorption and minimal thermal losses. Efficiency begins to decrease gradually after 1:00 PM, reaching 0.7% at 2:00 PM at flow rates of 0.1 and 0.2 LPM, mainly due to the decline in solar irradiance and increased relative heat losses during longer residence times at low flow rates.
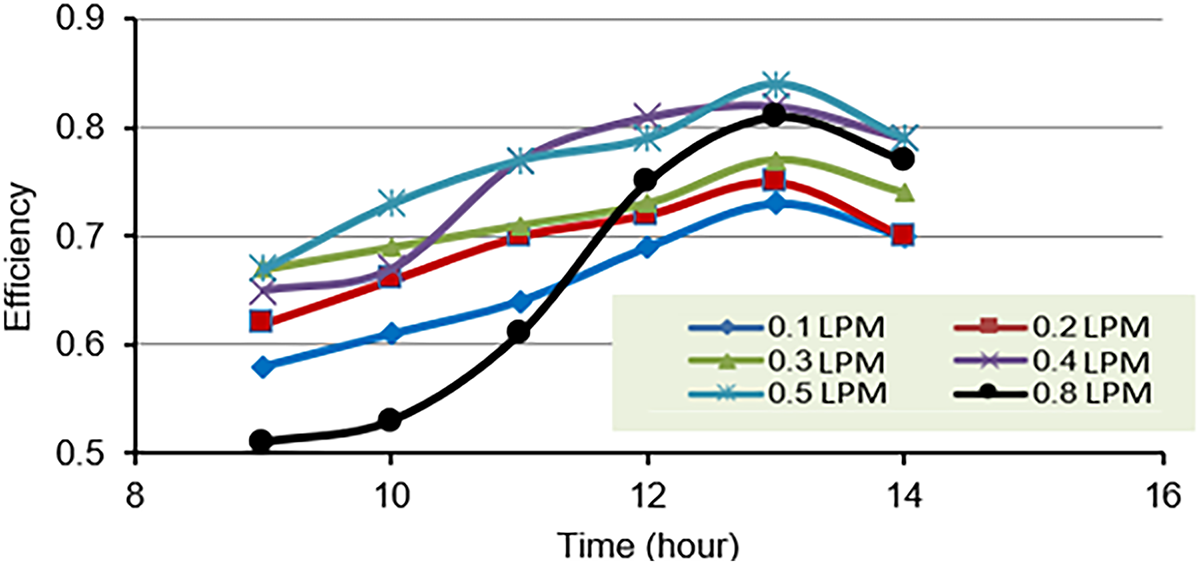
Figure 11: Efficiency with time at a tilt angle of 180° South of Kut city
The efficiencies, as a function of flow rate from 0.1 to 0.8 LPM, as shown in Fig. 12 at an angle of 225° Southwest of Kut city, rise consistently between 9:00 AM to 12:00 PM. Changes in efficiency correspond with expected sun intensity throughout the diurnal cycle, increasing until noon and subsequently decreasing. The angle 225° Southwest recorded the highest efficiency at 12:00 PM, reaching 79% at a flow rate of 0.5 LPM. The increase in efficiency at this angle is similarly linked to higher solar irradiance, effective heat transfer via the multi-stage heating configuration, and minimized thermal losses at the intermediate flow rate. After that, the experiments recorded a decrease in efficiency values at 1:00 PM, reaching 0.69% at flow rates of 0.1 and 0.2 LPM, due to decreasing solar intensity and prolonged residence times resulting in increased heat dissipation. From the collected data, it is clear that the angle of 180° South is better than the angle of 225° Southwest according to the geographical location of Kut city, as the angle of 180° achieved the highest efficiency based on the experiments conducted on the solar collector. Generally, efficiency values depend on the solar radiation beam incident on the collector aperture, the residence time of the fluid, and the heat losses to the environment.
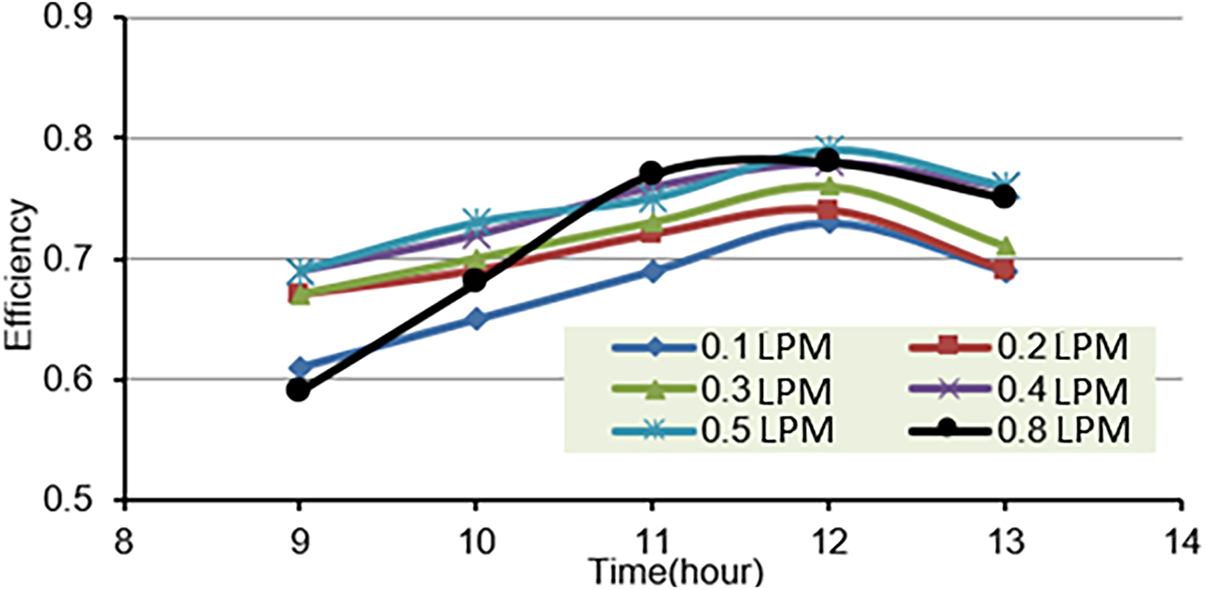
Figure 12: Efficiency with time at a tilt angle of 225° Southwest of Kut city
The flow rate of 0.5 LPM was found to be the optimal operating condition, achieving the highest thermal efficiency. This flow rate provides an optimal balance between sufficient heat absorption and minimizing thermal losses, and it perfectly matches the dimensions of the current solar collector. At lower flow rates (0.1–0.2 LPM), the longer residence time of the working fluid inside the absorber caused higher heat losses to the surroundings. In contrast, at higher flow rates (0.8 LPM), the efficiency decreased due to shorter heat absorption time and the approach toward the design limits of the collector.
4.3 Solar Tracking Angle with Time
Fig. 13 shows the solar tracking angle, which ranges from 9:00 AM to 2:00 PM throughout the day. For the 180° South tilt angle, the tracking angle starts at −45° at 9:00 AM and increases steadily until it reaches 0° at solar noon (12:00 PM), then continues to rise to +30° by 2:00 PM. This consistent increase reflects the sun’s apparent motion from east to west around solar noon relative to the Southern direction.
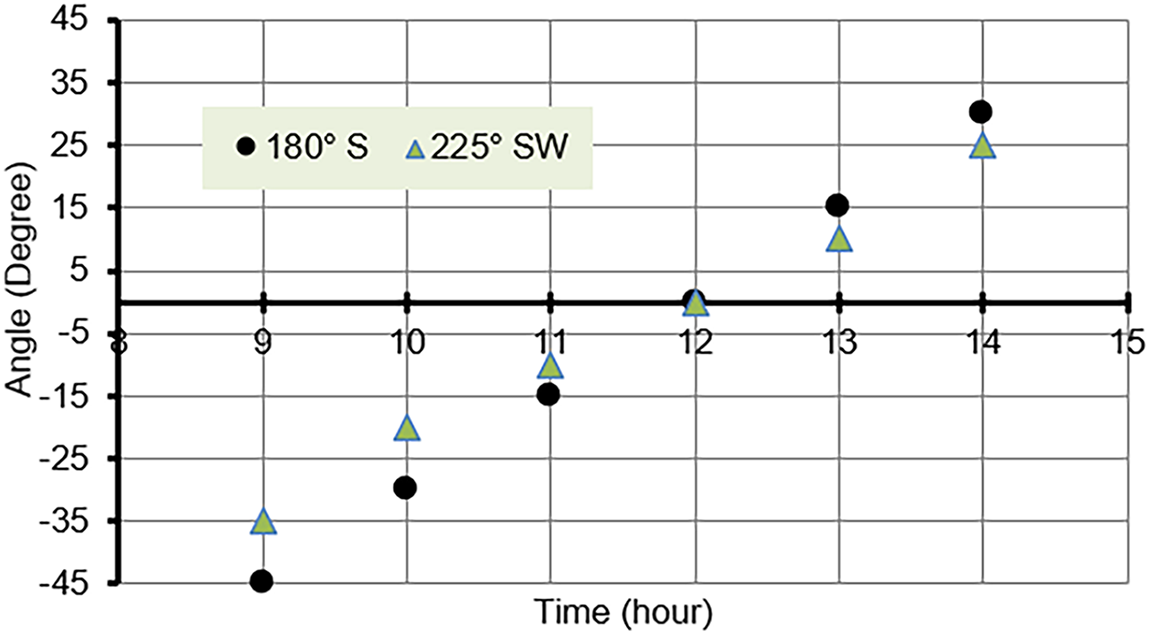
Figure 13: The solar tracking angle at 180° and 225° Southwest of Kut city
In contrast, the 225° Southwest tilt angle begins with a tracking angle of −35° at 9:00 AM, which gradually increases to −10° by 11:00 AM, reaches 0° at noon, and continues to rise to +25° by 2:00 PM. While both orientations show a similar rising trend in tracking angle over time, the 180° direction exhibits a wider angle range in the early hours, whereas the 225° tilt angle results in less pronounced angular changes. This reflects the relative position of the sun with respect to each fixed azimuth during the day.
4.4 Gained Thermal Energy Analysis
The scatter plot of useful energy at 180° South in Fig. 14 shows the useful energy output at various solar irradiance for flow rates between 0.1 and 0.8 LPM. At all flow rates, as solar irradiance increases from 300 W/m2 to approximately 650 W/m2, useful energy output increases. At the lower irradiance levels, around 300–400 W/m2, the useful energy does not vary too much across all flow rates, with values generally between 65–100 W. Once irradiance becomes greater than 500 W/m2, useful energy shows a more distinct increase, especially for the higher flow rates. The flow rate of 0.5 LPM showed the highest Qu values, reporting peak values around 169 W at approximately 619 W/m2 of irradiance. This implies that, under high solar intensity conditions, increased flow rates enable the system to absorb and transfer more energy. The orientation at 180° South of Al-Kut city is likely promoting the optimal energy collection at midday when irradiance is peaking.
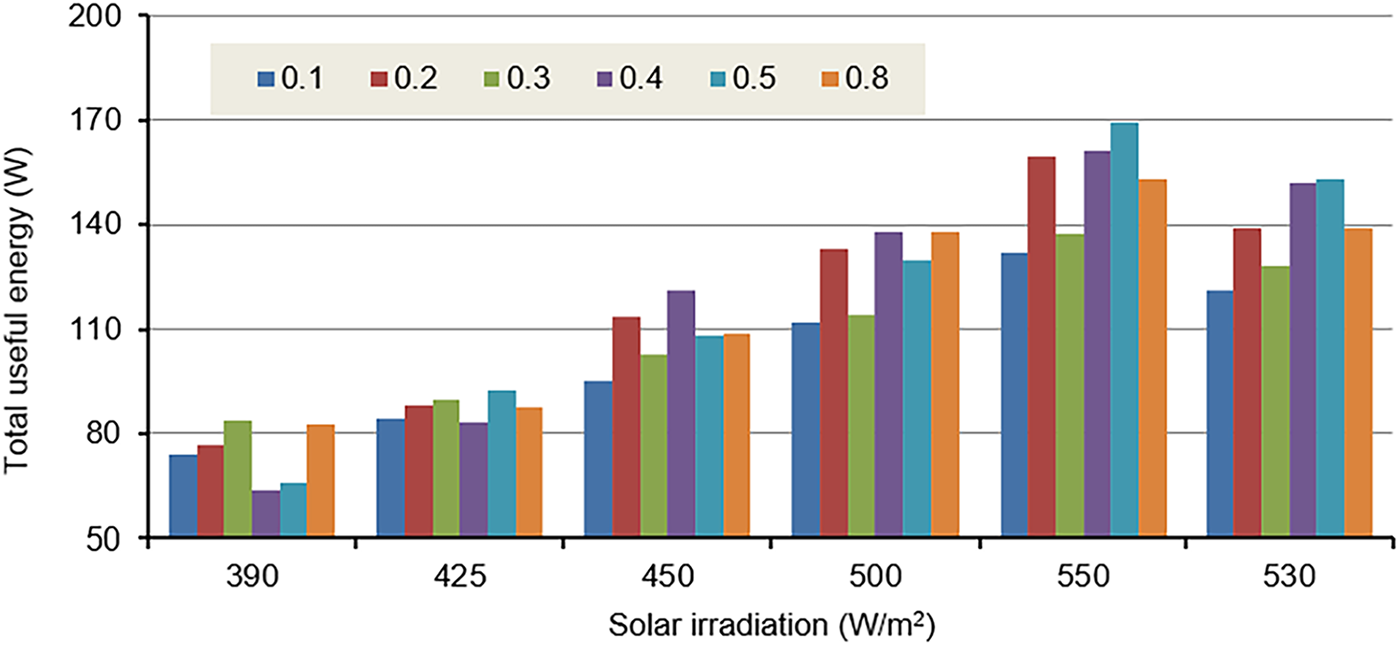
Figure 14: The total useful energy gained at various solar radiation with installation at 180° South
The evaluation of useful energy output at azimuth angles 180° South and 225° Southwest indicates a strong agreement between solar irradiance and useful thermal energy generated by the system at various flow rates, as shown in Fig. 15. In general, at both orientations, increasing irradiance leads to greater amounts of useful energy, where the highest flow rates achieve the highest amount of energy output. With different solar collector orientations and different flow rates, there is a direct relationship between solar radiation and useful energy. These results indicate that the useful thermal energy gained by the system is directly influenced by both solar irradiance and flow rate. Higher solar irradiance increases the energy absorbed by the working fluid, while optimal flow rates, such as 0.5 LPM, enable efficient heat transfer and minimize thermal losses.
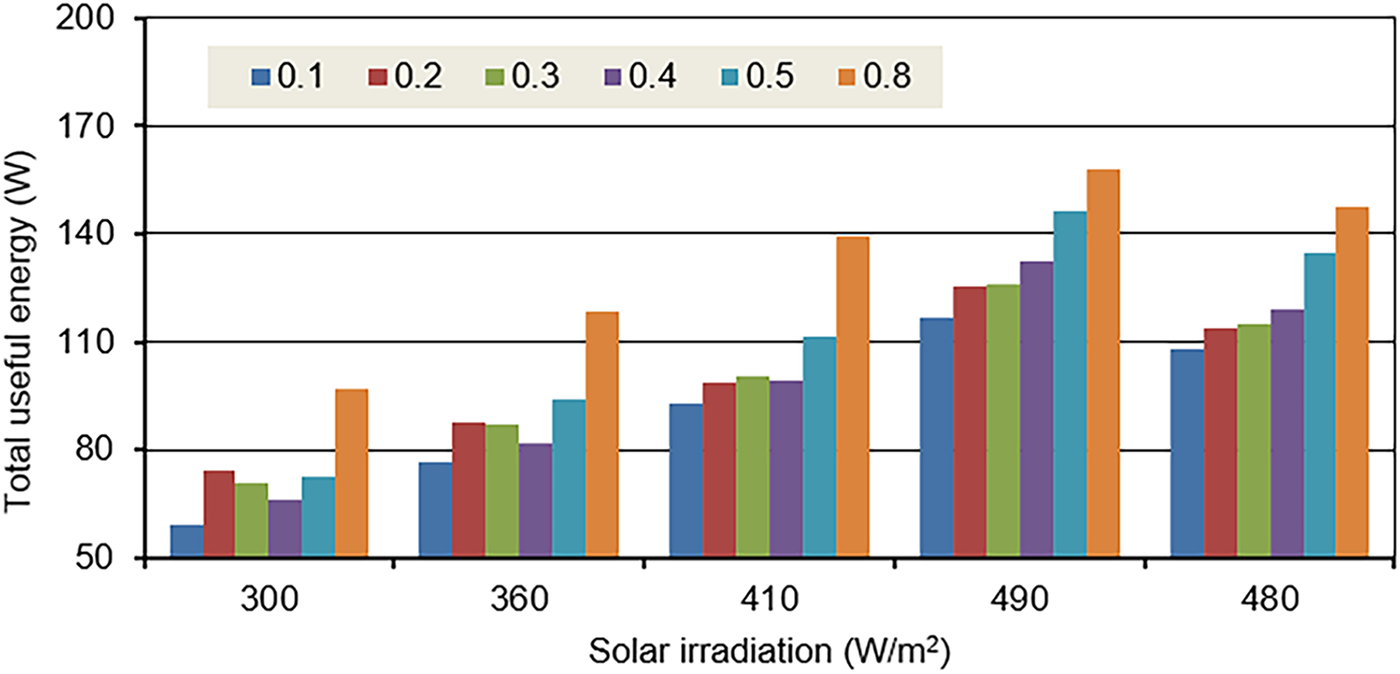
Figure 15: The total useful energy gained at various solar radiation with installation at 225° Southwest
Fig. 16 conveys the changes in the pressure drop across the first stage vs. the Reynolds number in the receiver tube, which covers a range of flow rates from 0.1 to 0.8 LPM. In the first stage, which included five mini-channel tubes distributing the flow into fifty microchannels, the relationship between pressure drop and Reynolds number was investigated at different flow rates. The results showed that the pressure drop increases proportionally with the flow rate and Reynolds number within the studied range. For example, at a flow rate of 0.1 LPM, the Reynolds number was 22.28 with a pressure drop of 2.221 Pa, while at a flow rate of 0.8 LPM, the Reynolds number reached 178.2 with a pressure drop of 17.77 Pa. This behavior reflects the linear nature of the flow in mini-channels and confirms that the flow remains in the laminar regime, where pressure losses increase gradually with flow velocity without any indication of transition to turbulence.
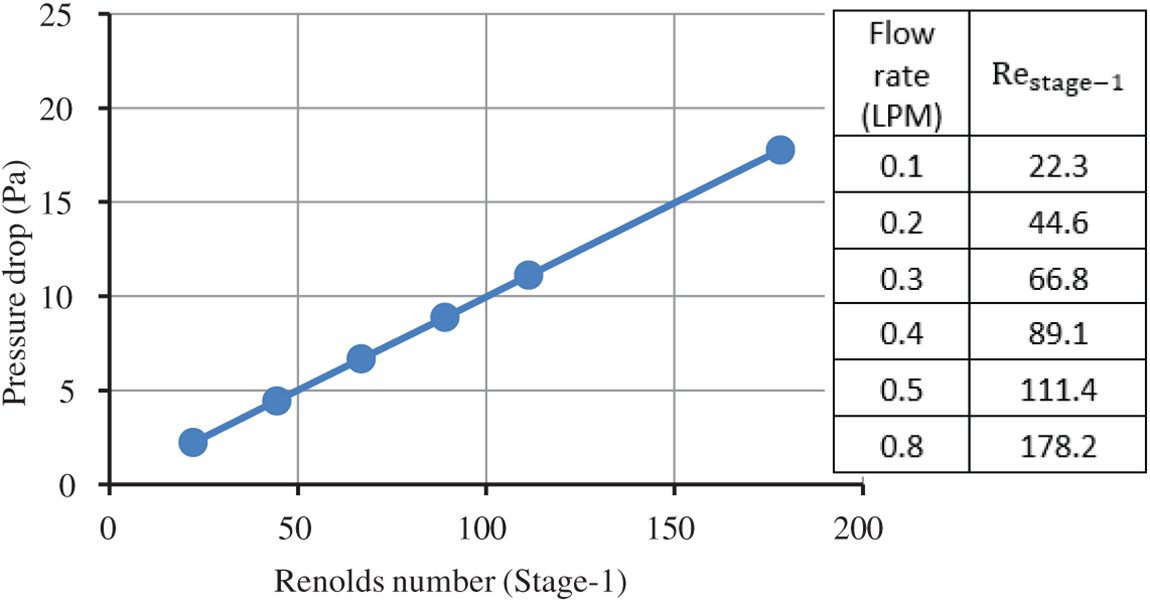
Figure 16: Variation of total pressure drop across stage-1 at various flow rates from 0.1 to 0.8 LPM
When the water moves from stage-1 (5 mini-channel tubes distributing the flow into 50 channels) to stage-2 (4 mini-channel tubes distributing the flow into 40 channels), a clear effect of reducing the number of channels on the pressure drop behavior was observed, as illustrated in Fig. 17. Reducing the number of channels increased the flow velocity inside each channel, which in turn led to higher Reynolds numbers and pressure drops at the same flow rates. For example, at a flow rate of 0.8 LPM, the pressure drop reached 22.21 Pa in the second stage compared to 17.77 Pa in the first stage. This variation confirms that decreasing the number of channels increases the hydraulic resistance of the system due to the higher velocity within the channels, while the flow remains within the laminar regime.
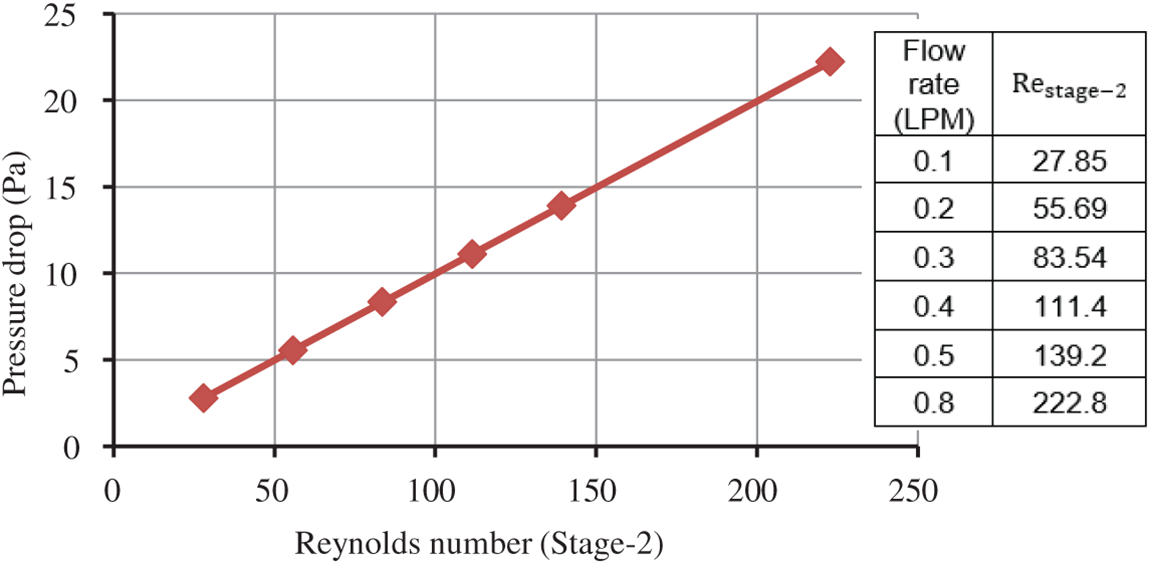
Figure 17: Variation of pressure drop across the stage-2 at various flow rates from 0.1 to 0.8 LPM
Fig. 18 illustrates the flow behavior in the third stage, which consisted of a single circular copper tube where the entire flow passed without distribution into multiple channels. The results show that the pressure drop increases gradually with the rise in flow rate and Reynolds number, reaching 1.786 Pa at a Reynolds number of 525 and 7.14 Pa at 2100. With a higher flow rate of 0.5 LPM, the Reynolds number increased to 2625 with a pressure drop of 13.98 Pa, while the maximum values were recorded at 0.8 LPM with a Reynolds number of 4200 and a pressure drop of 36.85 Pa. The figure also shows that the relationship between pressure drop and Reynolds number becomes nonlinear beyond certain values, reflecting the transition from laminar to transitional flow and the onset of turbulent characteristics at higher flow rates. The pressure drop in each stage is strongly affected by the flow rate, the number of mini-channels, and the hydraulic diameter of the channels. Smaller hydraulic diameters and reduced channel numbers increase the flow velocity, resulting in higher Reynolds numbers and greater pressure drops. The first and second stages maintain predominantly laminar flow, whereas the single-tube third stage exhibits a nonlinear increase in pressure drop at higher flow rates, indicating the onset of transitional and turbulent behavior. These findings emphasize the critical role of channel configuration, hydraulic diameter, and flow rate in managing pressure losses and optimizing the thermal performance of the solar collector.
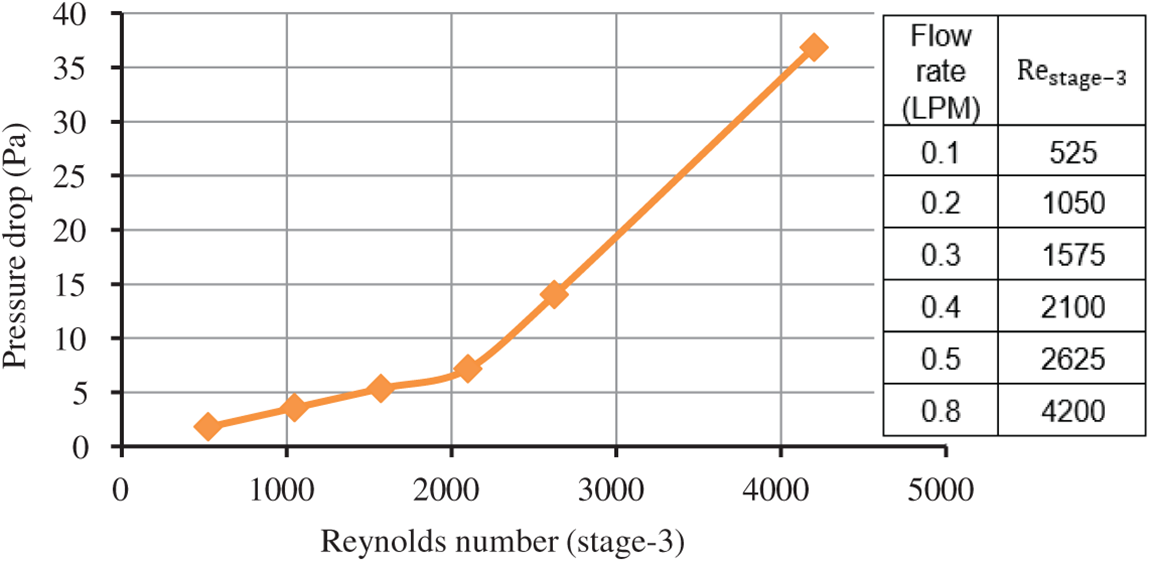
Figure 18: Variation of pressure drop across the stage-3 at various flow rates from 0.1 to 0.8 LPM
4.6 Transient Analysis of Thermal Performances
Fig. 19 depicts useful energy output, Qu as a function of time at a tilt angle of 180°, for a variety of flow rates. The results show that useful energy is increasing steadily from 9:00 AM before reaching a maximum at approximately 1:00 PM. This has a logical relationship to solar irradiance since sunlight intensity is vastly increasing in the morning, peaking at noon, noted in the variation in Qu, and again decreasing after noon. Higher flow rates (e.g., 0.5 LPM) produced higher useful energy outputs at all times. For instance, at 1:00 PM, the maximum Qu is almost 170 W for 0.5 LPM, but only about 130 W for 0.1 LPM. This shows that the heat extraction improves as the flow rate increases, which optimizes the thermal performance for the collector. However, it appears the rate of increase is flattening out at higher flow rates, indicating diminishing returns, which is expected. While collecting the variable on time in conjunction with solar availability provides an overview of the system’s overall performance aspects, these results illustrate enhanced performance at 1:00 PM and at higher flow conditions.
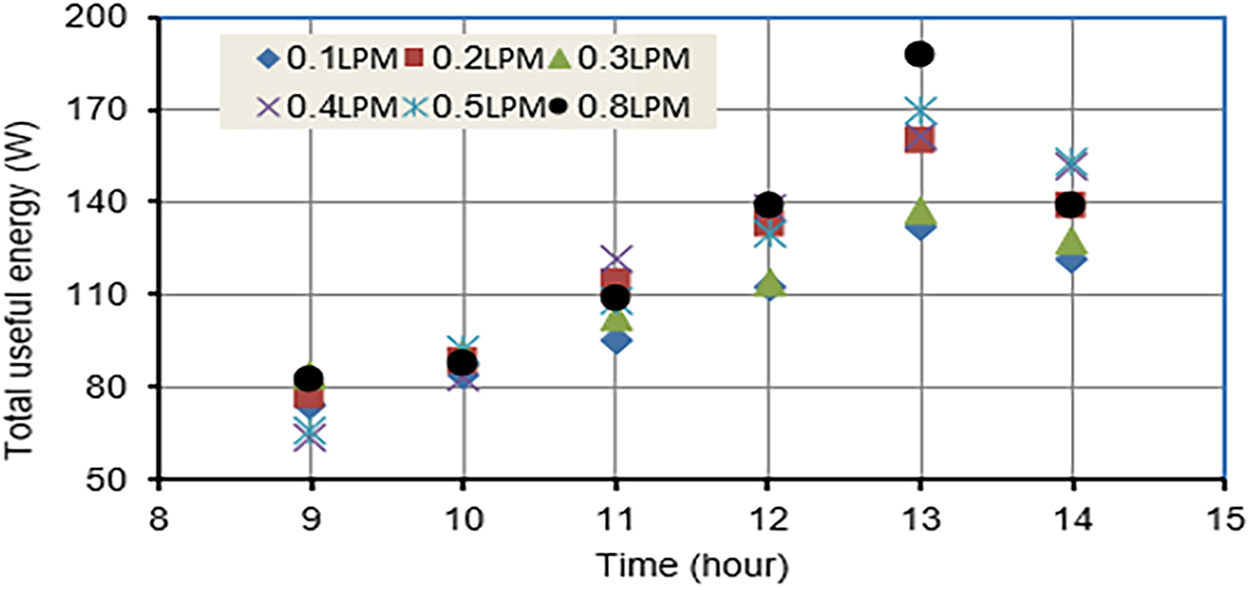
Figure 19: The transient behavior of the total useful energy gain at 180° South installation
Fig. 20 demonstrates the progressive changes in useful energy output (Qu) for flow rates over time, at a tilt angle of 225°. Overall, there was a noticeable trend that Qu increased from 9:00 AM, peaked around noon, and slightly decreased by 1:00 PM. This mirrors the trend for solar radiation, whereby solar intensity increased until around midday, and then decreased thereafter. Nevertheless, the results demonstrate the effect of the solar collector orientation angle on the amount of heat that can be extracted and its overall impact on the efficiency of the solar collector.
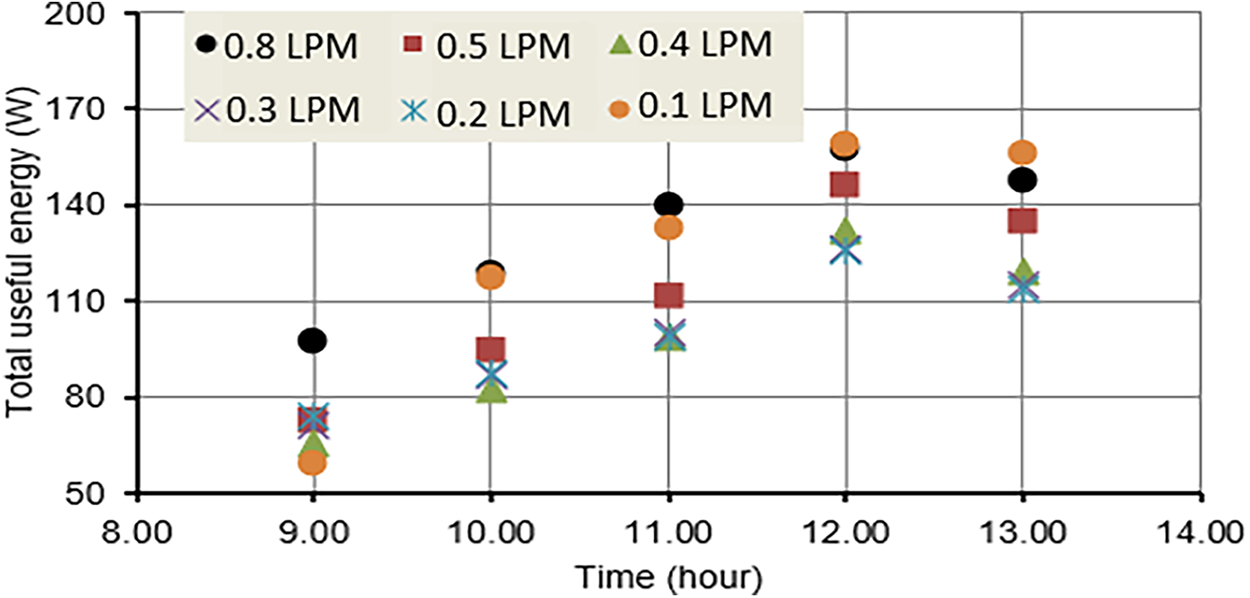
Figure 20: The transient behavior of the total useful energy gain at 225° Southwest installation
4.7 Temperature Variation with Time
Fig. 21 presents the variation of inlet, outlet, and ambient temperatures recorded between 9:00 AM and 2:00 PM. The results show a steady increase in all temperature profiles with time, following the rise in solar radiation intensity throughout the day. The outlet temperature consistently remained higher than the inlet temperature, indicating effective heat absorption within the collector. The temperature difference between the inlet and outlet increased from approximately 2.3°C at 9:00 AM to about 5.4°C at 2:00 PM, confirming a gradual enhancement in the collector’s thermal performance as solar intensity increased. Meanwhile, the ambient temperature showed a mild rise, contributing slightly to the observed thermal trends.
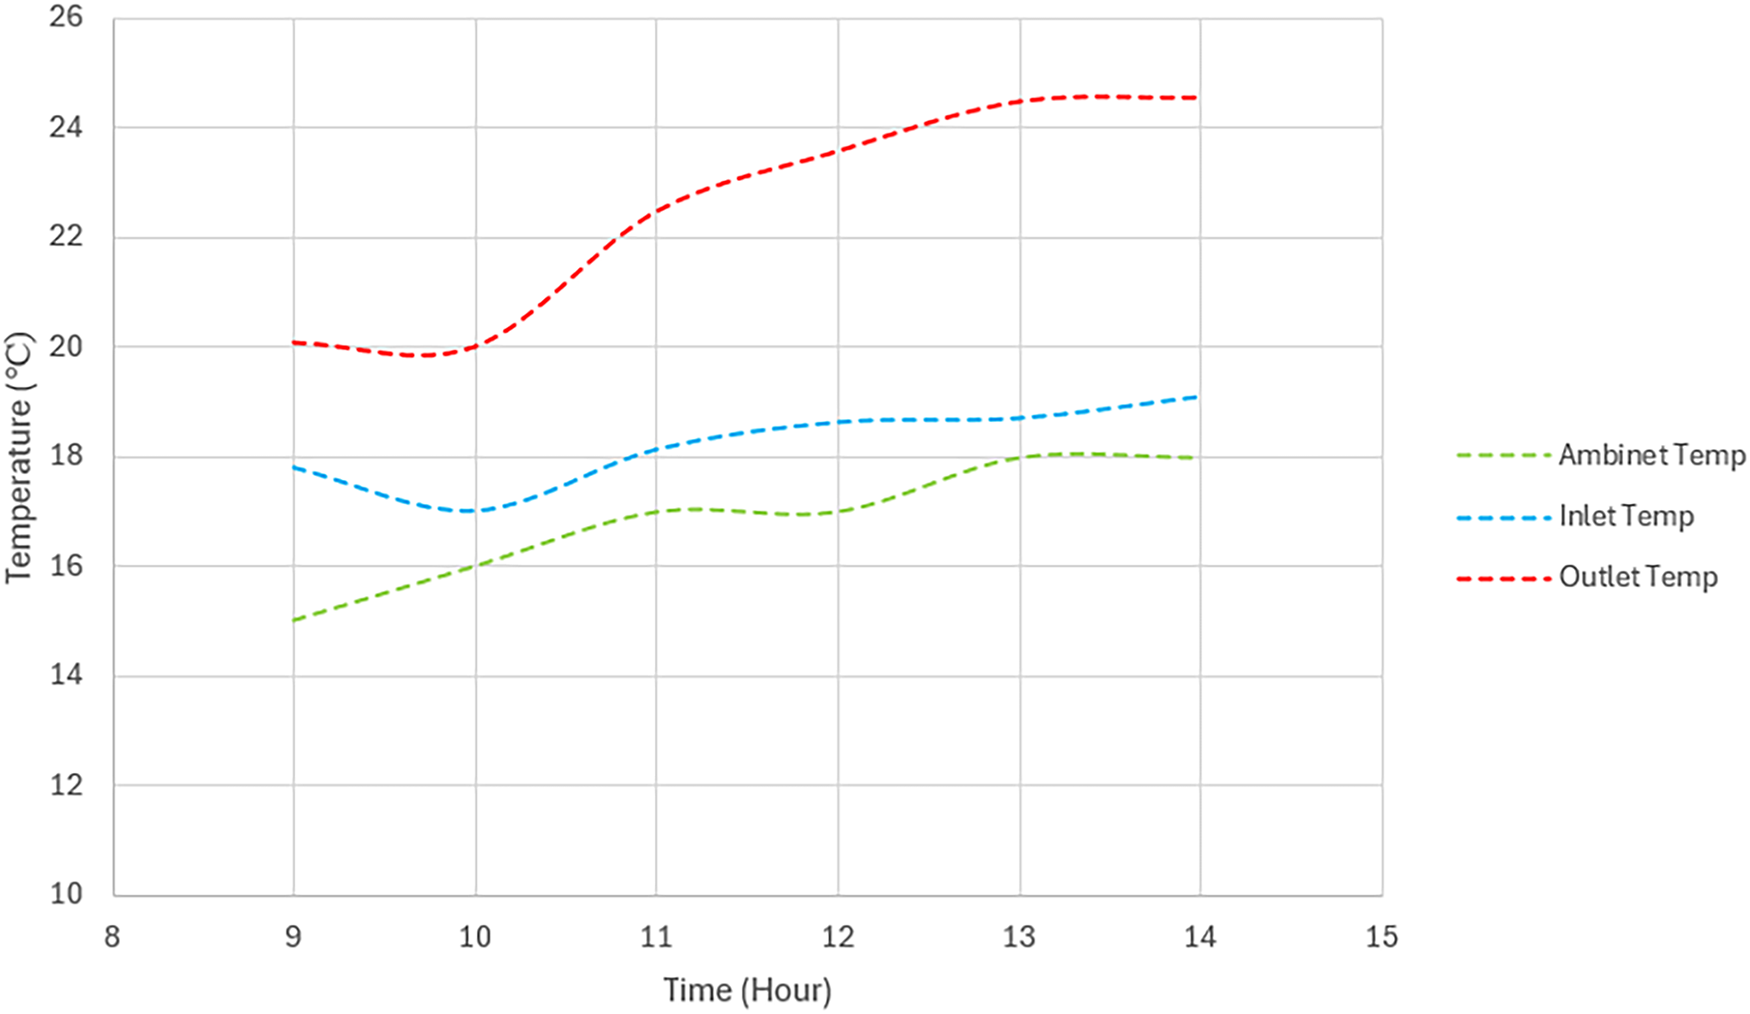
Figure 21: The variation of temperatures with time
These readings were obtained at a flow rate of 0.4 LPM, where the rate of heat gain was consistent with the compact geometry of the solar collector, demonstrating efficient heat transfer under the given operating conditions.
Fig. 22 illustrates the variation in temperatures across the three stages of the solar collector. Stage one contributes a higher amount of heat compared to stage two, due to its five tubes distributing water through fifty channels, whereas stage two contains only four tubes, with water distributed through forty channels, resulting in lower heat absorption. Stage three exhibits the highest temperature increase, owing to the exposure of the copper tube to the maximum reflected solar radiation, in addition to the high thermal conductivity of copper, which enhances heat transfer to the water more effectively. This variation highlights the influence of the number of tubes and the collector design on thermal performance. Furthermore, temperatures gradually increase as the day progresses due to the rising solar radiation intensity, reflecting the effect of each stage on the overall thermal performance of the collector.
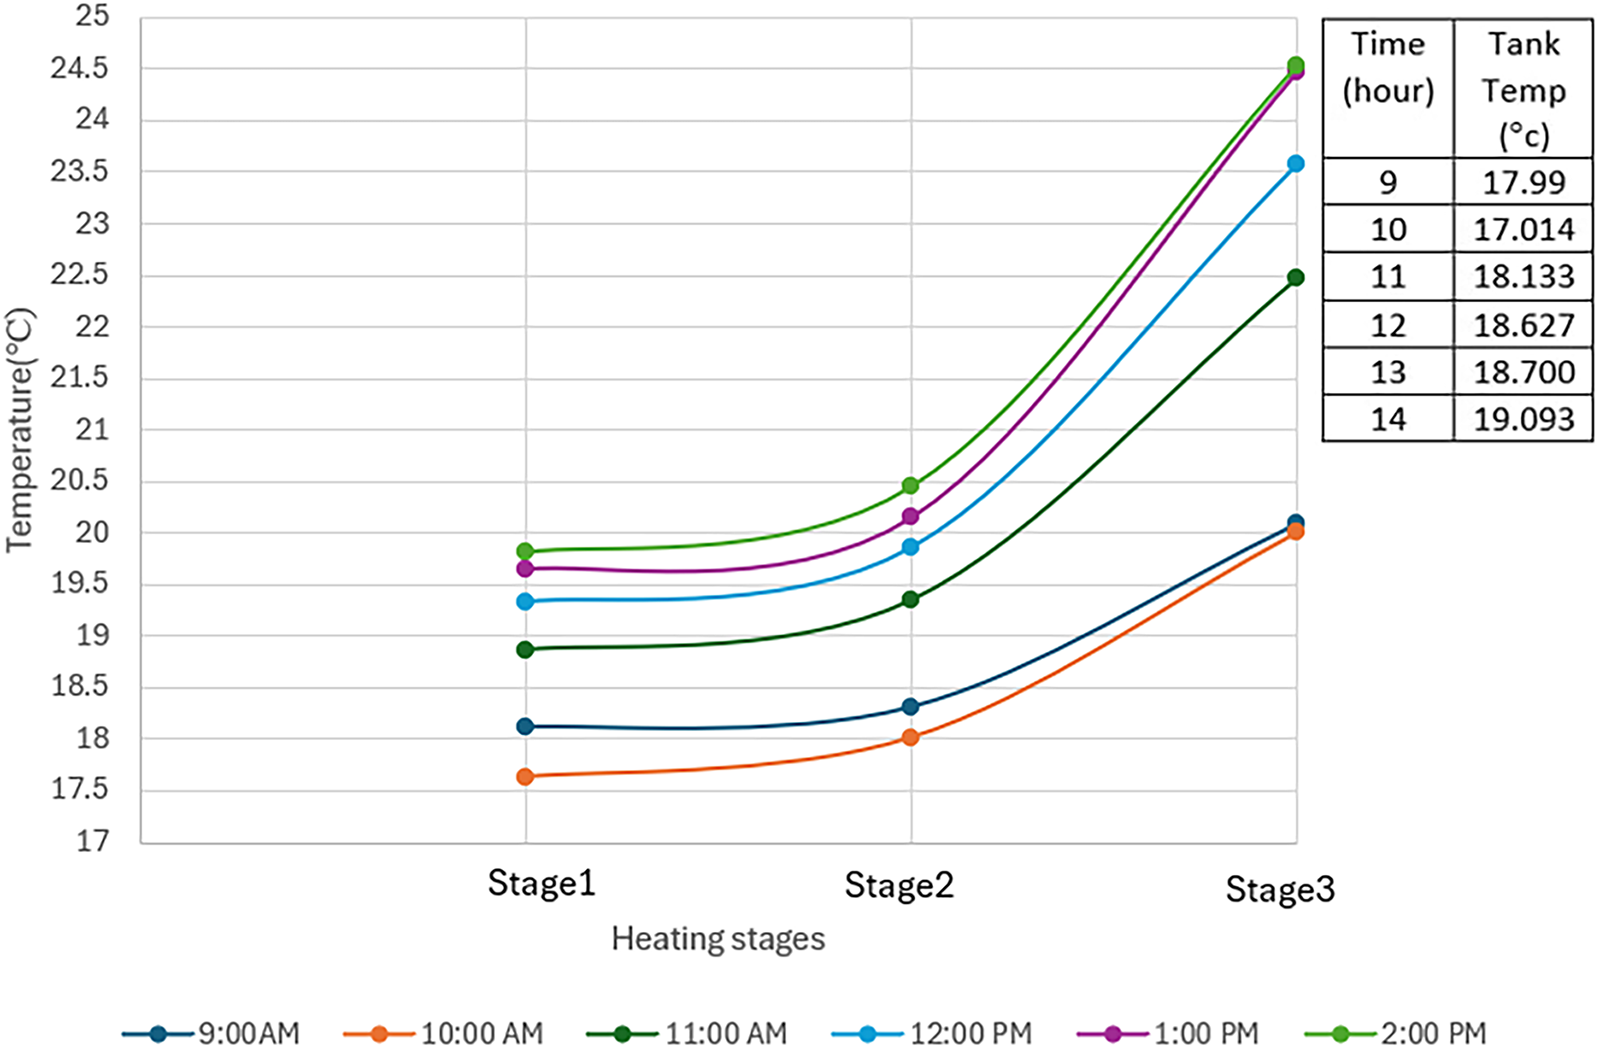
Figure 22: The variation of temperatures across the three stages
The aluminum tubes preheat the working fluid, promoting efficient heat transfer through both conduction and convection. This increases the fluid outlet temperature, reduces thermal losses, and enhances the overall thermal efficiency of the system. The observed temperature trends indicate that the multi-stage design of the solar collector effectively enhances heat transfer to the working fluid. The combination of preheating in the aluminum tubes, the number of mini-channels, and the high thermal conductivity of copper in the third stage contributes to a progressive increase in outlet temperature throughout the day. These findings demonstrate that both collector geometry and material properties play a critical role in achieving efficient thermal performance and minimizing heat losses under varying solar irradiance conditions.
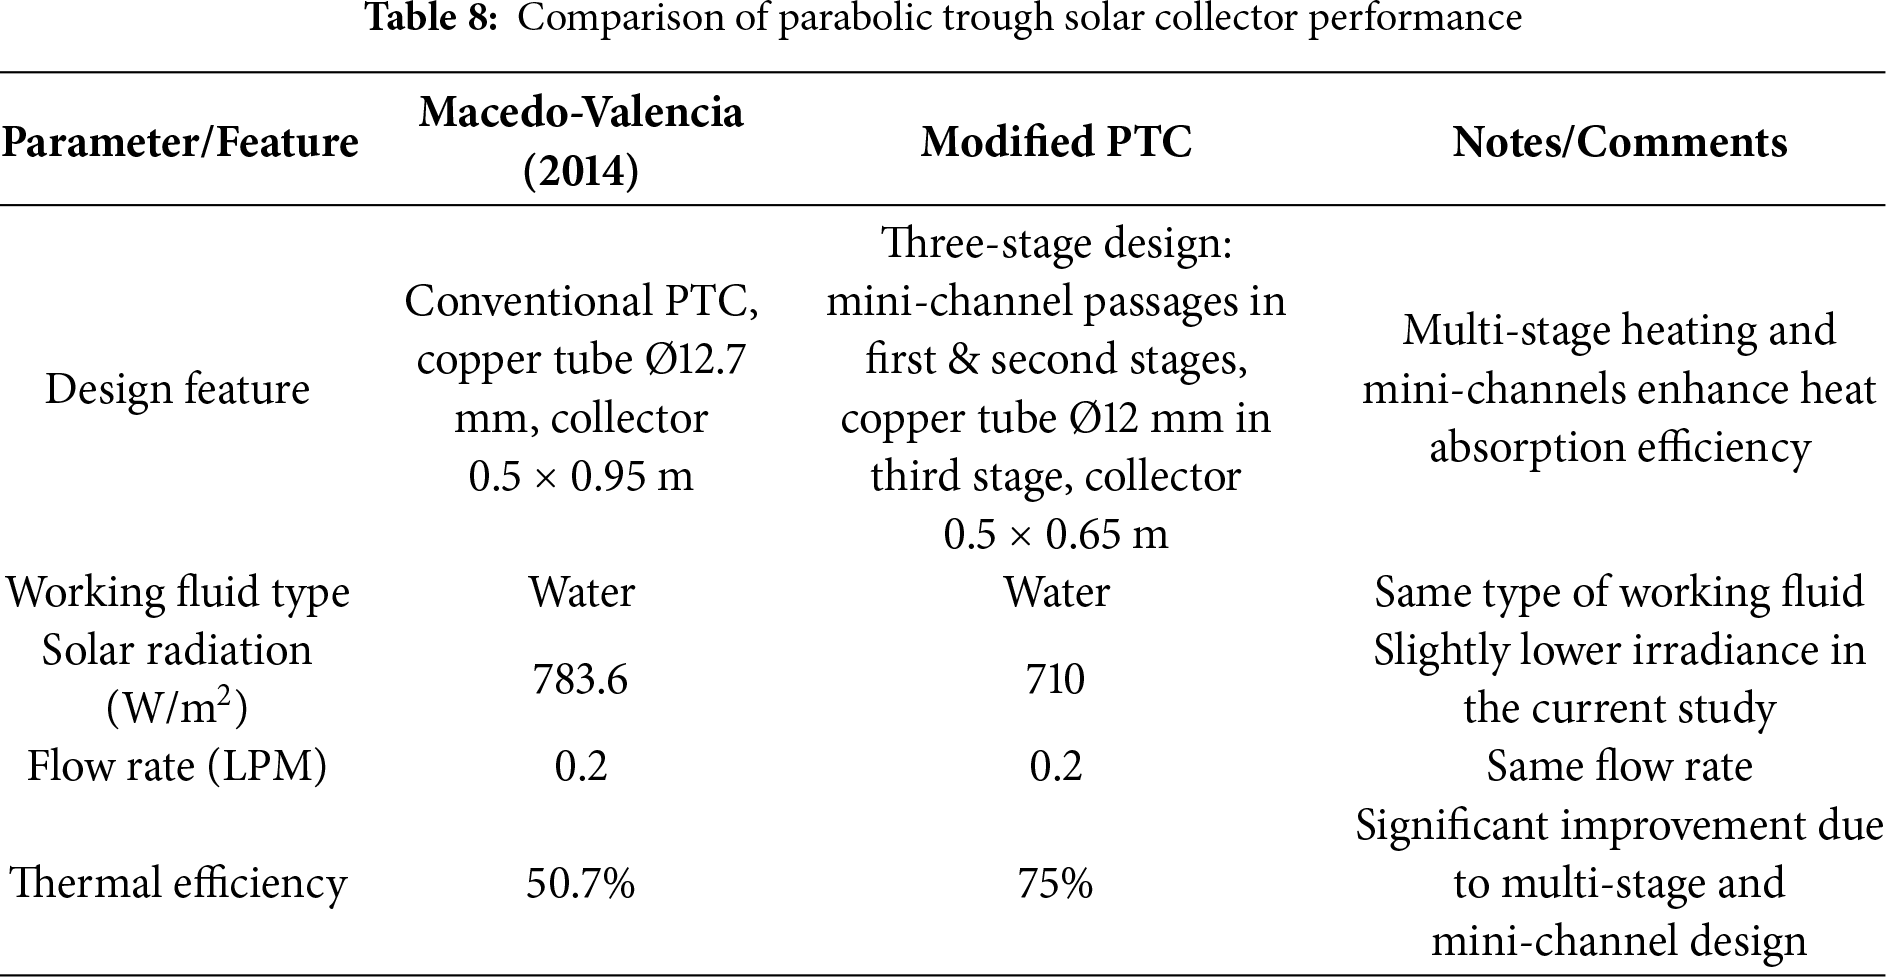
The proposed system’s performance was preliminarily validated using the study by Macedo-Valencia (2014) [27], as the collector dimensions and operating conditions (solar irradiance and flow rate) are comparable to the current system. The modified system achieved 75% thermal efficiency, compared to 50.57% for the conventional collector, showing an improvement of 48.4%. A comparison of the parabolic trough solar collector performance is summarized in Table 8.
The main conclusions and recommendations of this study are summarized below.
• The integration of aluminum mini-channel tubes on the parabolic trough reflector enhanced system performance.
• The modified solar collector using aluminum mini-channel tubes achieved a 48.4% improvement in thermal efficiency compared to conventional solar collectors.
• The mini-channel aluminum tubes contributed a significant amount of heat to the working fluid due to their precise design, which increases the heat transfer area.
• The copper tube (stage-3) provided the highest heat addition to the fluid, owing to the large reflected solar radiation and the high thermal conductivity of copper.
• Experimental tests showed a 20%–35% increase in useful heat gain.
• The tilt angle of 180° (due South) achieved better thermal performance than 225° (Southwest), which can be attributed to the geographic location of Kut city, Iraq, and the local solar radiation conditions.
• The highest efficiency (84%) was obtained at a flow rate of 0.5 LPM and 180° orientation.
• The flow rate of 0.5 LPM was found to be optimal, providing a balance between heat gain and thermal losses, consistent with the dimensions of the solar collector.
• The pressure drop exhibited a linear relationship with the Reynolds number during Stages 1 and 2, while it showed a nonlinear behavior in Stage 3.
The authors recommending below attempts for further development in the proposed idea of absorber installation.
• Investigate alternative connection methods for mini-channel tubes to optimize flow distribution and heat transfer efficiency.
• Explore different reflective materials to enhance solar radiation concentration and increase energy gain.
• Study the integration of thermal storage tanks to improve the system’s ability to store and manage collected heat effectively.
• Using different working fluids (e.g., nanofluids or thermal oils) to enhance heat transfer.
• Investigating long-term performance and durability of the modified system under varying weather conditions.
• Implement automated solar tracking combined with simulation-based optimization to enhance overall system performance.
Acknowledgement: The authors express their sincere gratitude to all those who provided support and assistance during the completion of this work.
Funding Statement: The authors received no specific funding for this study.
Author Contributions: Conceptualization: Alaa R. Al-Badri; Methodology, Investigation, Data Collection, Writing—Original Draft Preparation and Visualization: Ebtehal Chasseb Jbary under the supervision of Alaa R. Al-Badri. All authors reviewed the results and approved the final version of the manuscript.
Availability of Data and Materials: Not applicable.
Ethics Approval: Not applicable.
Conflicts of Interest: The authors declare no conflicts of interest to report regarding the present study.
Nomenclature
| Symbol | DescriptionUnit |
| Aa | Collector aperture area m2 |
| Aflow | Flow cross-sectional area m2 |
| Ca | Concentration ratio- |
| Cp | Specific heat capacity of the working fluid J/(kg·K) |
| Dh | Hydraulic diameterm |
| din | Receiver tube diameterm |
| dchannel | Minichannel diameterm |
| F | Focal length of a parabolam |
| f | Darcy friction factor- |
| Hp | Latus rectum of a parabolam |
| I | Direct normal irradiance (DNI) W/m2 |
| L | Length of parabola (collector length)m |
| Ltube | Length of the tube/channelm |
| m | Mass flow rate of working fluid kg/s |
| Qu | Useful heat outputW |
| Qin | Incident solar energy inputW |
| Pw | Wetted perimeterm |
| Re | Reynolds number- |
| r | Radius of parabola (edge to focal point)m |
| S | Arc length of a parabolam |
| Tin | Inlet temperature of the working fluid°C |
| Tout | Outlet temperature of the working fluid°C |
| v | Velocity of working fluid m/s |
| Wa | Aperture width of the PTCm |
| X | Horizontal distance from the parabola’s vertexm |
| Y | Vertical height of the parabola m |
| Ψ | Rim angle of a parabola Degree |
| ΔT | Temperature difference of the fluid°C |
| ΔP | Pressure lossPa |
| η | Thermal efficiency of the collector– |
| ε | Relative roughnessm |
| ϵ | Density of working fluid kg/m3 |
| μ | Dynamic viscosity of the working fluid Pa·s |
References
1. Muñoz J, Abánades A. Analysis of internal helically finned tubes for parabolic trough design by CFD tools. Appl Energy. 2011;88(11):4139–49. doi:10.1016/j.apenergy.2011.04.026. [Google Scholar] [CrossRef]
2. Ismail EM, Flayh SJ, Saeedmohammed M, Mohammed KS. Heat exchanger design and optimization for industrial applications. Nanotechnol Percept. 2024;20(S3):211–29. doi:10.62441/nano-ntp.v20is3.18. [Google Scholar] [CrossRef]
3. Singh R, Gupta A, Paul AR, Paul B, Saha SC. Improving heat transfer in parabolic trough solar collectors by magnetic nanofluids. Energy Eng. 2024;121(4):835–48. doi:10.32604/ee.2024.046849. [Google Scholar] [CrossRef]
4. Sookdeo S. Experimental investigation of the thermofluid behaviour within a flat-plate solar collector [dissertation]. Montreal, QC, Canada: Concordia University; 2009. [Google Scholar]
5. Naji ZH, Ameer MAA. Heat transfer analysis of modified solar collector plate with mini-channel. J Univ Babylon Eng Sci. 2018;26(7):314–30. doi:10.1615/heattransres.2016012266. [Google Scholar] [CrossRef]
6. Bande YM, Mariah NA. Flat plate solar collectors and applications: a review. Pertanika J Sci Technol. 2014;22(2):365–85. [Google Scholar]
7. Dąbrowski P, Klugmann M, Mikielewicz D. Channel blockage and flow maldistribution during unsteady flow in a model microchannel plate heat exchanger. J Appl Fluid Mech. 2019;12(4):1023–35. doi:10.29252/jafm.12.04.29316. [Google Scholar] [CrossRef]
8. Cheng ZD, He YL, Xiao J, Tao YB, Xu RJ. Three-dimensional numerical study of heat transfer characteristics in the receiver tube of parabolic trough solar collector. Int Commun Heat Mass Transf. 2010;37(7):782–7. doi:10.1016/j.icheatmasstransfer.2010.05.002. [Google Scholar] [CrossRef]
9. Mohammed MS, Dakel SF, Alshara AK, Alsayah AM. Numerical and experimental study of heat transfer in shell-and U-tube heat exchanger with baffles. Chin J Geotech Eng. 2022;44(5):11–26. doi:10.11779/CJGE202205.2. [Google Scholar] [CrossRef]
10. Mwesigye A, Bello-Ochende T, Meyer JP. Thermodynamic performance of a parabolic trough receiver with centrally placed perforated plate inserts. In: Proceedings of the International Conference on Applied Energy ICAE 2013; 2013 Jul 1–4; Pretoria, South Africa. p. 1–10. [Google Scholar]
11. Wen Z. Research and development in novel alternative renewable energy technology. Poole, UK: Bournemouth University; 2016. [Google Scholar]
12. Jafarimoghaddam A, Aberoumand S. A comparison between heat transfer performance of rectangular and semicircular tubes considering boundary effects on Brownian motions in the presence of Ag/water nanofluids: applicable in the design of cooling system of photovoltaic cells. PLoS One. 2017;12(7):e0180883. doi:10.1371/journal.pone.0180883. [Google Scholar] [PubMed] [CrossRef]
13. Singh A, Kumar M, Khullar V. Performance bounds of nanoparticles laden volumetric absorption solar thermal platforms in laminar flow regime. arXiv:1911.04802. 2019. [Google Scholar]
14. He Y, Yu H, Duan G, Wang Y, Yang Q, Feng L, et al. Thermal performance and experimental analysis of stainless steel flat plate solar collector with full-flow channels. Heliyon. 2024;10(7):e28255. doi:10.1016/j.heliyon.2024.e28255. [Google Scholar] [PubMed] [CrossRef]
15. Ghomrassi A, Mhiri H, Bournot P. Numerical study and optimization of parabolic trough solar collector receiver tube. J Sol Energy Eng. 2015;137(5):051003. doi:10.1115/1.4030849. [Google Scholar] [CrossRef]
16. More SS, Sagade AA, Ravindranath G, More S, More S. Innovative mini-channel design for a compound parabolic solar thermal collector serving intermediate temperature applications. Energy. 2023;283:129044. doi:10.1016/j.energy.2023.129044. [Google Scholar] [CrossRef]
17. Muthusamy E. A comparative study on optical and thermal performance of parabolic trough concentrator using a bundle of absorber tubes. Mater Today Proc. 2024;199:206. doi:10.1016/j.matpr.2024.03.041. [Google Scholar] [CrossRef]
18. Bhattacharya K, Paradeshi S, Karthik M, Sakthiraja VR, Bibin BS, Edison G. Analyzing the performance of a parabolic trough solar collector with advanced techniques adopted in the absorber—a review. Eng Res Express. 2024;6(1):012001. doi:10.1088/2631-8695/ad1c0b. [Google Scholar] [CrossRef]
19. Byiringiro J, Chaanaoui M, Hammouti B. Thermal performance enhancement of a novel receiver for parabolic trough solar collector. Interactions. 2024;246(1):13. doi:10.1007/s10751-024-02230-3. [Google Scholar] [CrossRef]
20. Alshehery S, Al Mdallal Q, Altohamy AA, Ben Said L, Bouzidi M, Alkathiri T, et al. Boosting the thermal efficiency of a flat-tube parabolic trough solar collector with the introduction of innovative slashed triangular prism turbulators. Case Stud Therm Eng. 2025;67(2):105849. doi:10.1016/j.csite.2025.105849. [Google Scholar] [CrossRef]
21. Alghamdi A, Jose Ponnore J, Hassan AM, Alqahtani S, Alshehery S, Anqi AE. Exergy-economic analysis of a hybrid combined supercritical Brayton cycle-organic Rankine cycle using biogas and solar PTC system as energy sources. Case Stud Therm Eng. 2023;50:103484. doi:10.1016/j.csite.2023.103484. [Google Scholar] [CrossRef]
22. Fernández-García A, Zarza E, Valenzuela L, Pérez M. Parabolic-trough solar collectors and their applications. Renew Sustain Energy Rev. 2010;14(7):1695–721. doi:10.1016/j.rser.2010.03.012. [Google Scholar] [CrossRef]
23. Mohammad ST, Al-Kayiem HH, Khlief AK, Aurybi MA. Modeling and performance assessment of a hypothetical stand-alone parabolic trough solar power plant supported by climatic measurements in Ipoh, Malaysia. J Sol Energy Eng. 2023;145(4):041005. doi:10.1115/1.4056346. [Google Scholar] [CrossRef]
24. Kasem MAM. Detailed performance analysis of parabolic trough collectors including geometric effect. J Mech Eng Sci. 2023;17(3):9552–63. doi:10.15282/jmes.17.3.2023.2.0756. [Google Scholar] [CrossRef]
25. Akhter J, Gilani SI, Al-Kayiem HH, Mehmood M, Ali M, Ullah B, et al. Experimental investigation of a medium temperature single-phase thermosyphon in an evacuated tube receiver coupled with compound parabolic concentrator. Front Energy Res. 2021;9:754546. doi:10.3389/fenrg.2021.754546. [Google Scholar] [CrossRef]
26. Hashim WM, Ahmed IS, Khlief AK, Jessam RA, Abed Jaddoa A. Performance evaluation of evacuated tube receiver at various flow rates under Baghdad climate with nanofluid as working fluids. Energy Eng. 2025;122(6):2485–501. doi:10.32604/ee.2025.061630. [Google Scholar] [CrossRef]
27. Macedo-Valencia J, Ramírez-Ávila J, Acosta R, Jaramillo OA, Aguilar JO. Design, construction and evaluation of parabolic trough collector as demonstrative prototype. Energy Proc. 2014;57:989–98. doi:10.1016/j.egypro.2014.10.082. [Google Scholar] [CrossRef]
Cite This Article
 Copyright © 2026 The Author(s). Published by Tech Science Press.
This work is licensed under a Creative Commons Attribution 4.0 International License , which permits unrestricted use, distribution, and reproduction in any medium, provided the original work is properly cited.
 Downloads
 Citation Tools