
 Submit a Paper
 Propose a Special lssue
 Open Access
ARTICLE

An Artificial Intelligence Algorithm for the Real-Time Early Detection of Sticking Phenomena in Horizontal Shale Gas Wells
CNPC Engineering Technology R&D Company Limited, Planning and Support Institute, Beijing, 102206, China
* Corresponding Author: Qing Wang. Email:
Fluid Dynamics & Materials Processing 2023, 19(10), 2569-2578. https://doi.org/10.32604/fdmp.2023.025349
Received 07 July 2022; Accepted 27 September 2022; Issue published 25 June 2023
 View Full Text
 Download PDF
Abstract
Sticking is the most serious cause of failure in complex drilling operations. In the present work a novel “early warning” method based on an artificial intelligence algorithm is proposed to overcome some of the known problems associated with existing sticking-identification technologies. The method is tested against a practical case study (Southern Sichuan shale gas drilling operations). It is shown that the twelve sets of sticking fault diagnostic results obtained from a simulation are all consistent with the actual downhole state; furthermore, the results from four groups of verification samples are also consistent with the actual downhole state. This shows that the proposed training-based model can effectively be applied to practical situations.Keywords
As the demand for clean energy continues to expand, the price of natural gas continues to rise, and people’s understanding of shale gas has rapidly improved [1,2]. In particular, the technology level of horizontal wells is constantly improving, and the exploration and development of shale gas is forming a boom. The high formation pressure coefficient and complex geological conditions in shale formations have led to complex drilling operations with frequent failures, among which sticking is the most prominent. The sticking faults seriously restricted the safe and efficient development of shale gas. Therefore, it is important to ensure the safety of drilling and completion in horizontal sections of shale gas horizontal wells. The traditional methods for identification of sticking relied only on experts’ experience to make qualitative judgments on downhole risks. They simply transplanted the commonly used risk assessment methods (such as analytic hierarchy process, event tree, fault tree, bow-tie model, among others) into drilling engineering. Most of these methods are qualitative and semi-quantitative, and their prediction accuracy and efficiency are insufficient to ensure drilling safety [3–5]. In addition, only a small amount of measurement and calculation work is automatically performed by computers, with most of the judgments still relying on manual work. Due to the differences of individual knowledge, experience, and sense of responsibility, it often leads to the failure to detect and handle drilling abnormalities in time, which increases the risk [6–8]. The existing sticking risk assessment methods are based on fuzzy analytic hierarchy process, bow model, fault tree, and so on [9]. In fact, it is not realistic to require operators to observe the changes in monitoring data and judge the potential risk of an accident quickly. Therefore, the problems associated with the existing technology for identification of sticking, such as the poor comprehensive utilization of monitoring information, the untimely risk warning, and the strong subjectivity are of huge importance to operational safety and efficiency [10,11]. To solve these problems, this paper proposed a real-time warning method based on an artificial intelligence algorithm, which can predict and control the sticking. The application of this technology is of great significance for companies to reduce the loss of complexity and failure.
2 Expert Knowledge Judgment of Sticking
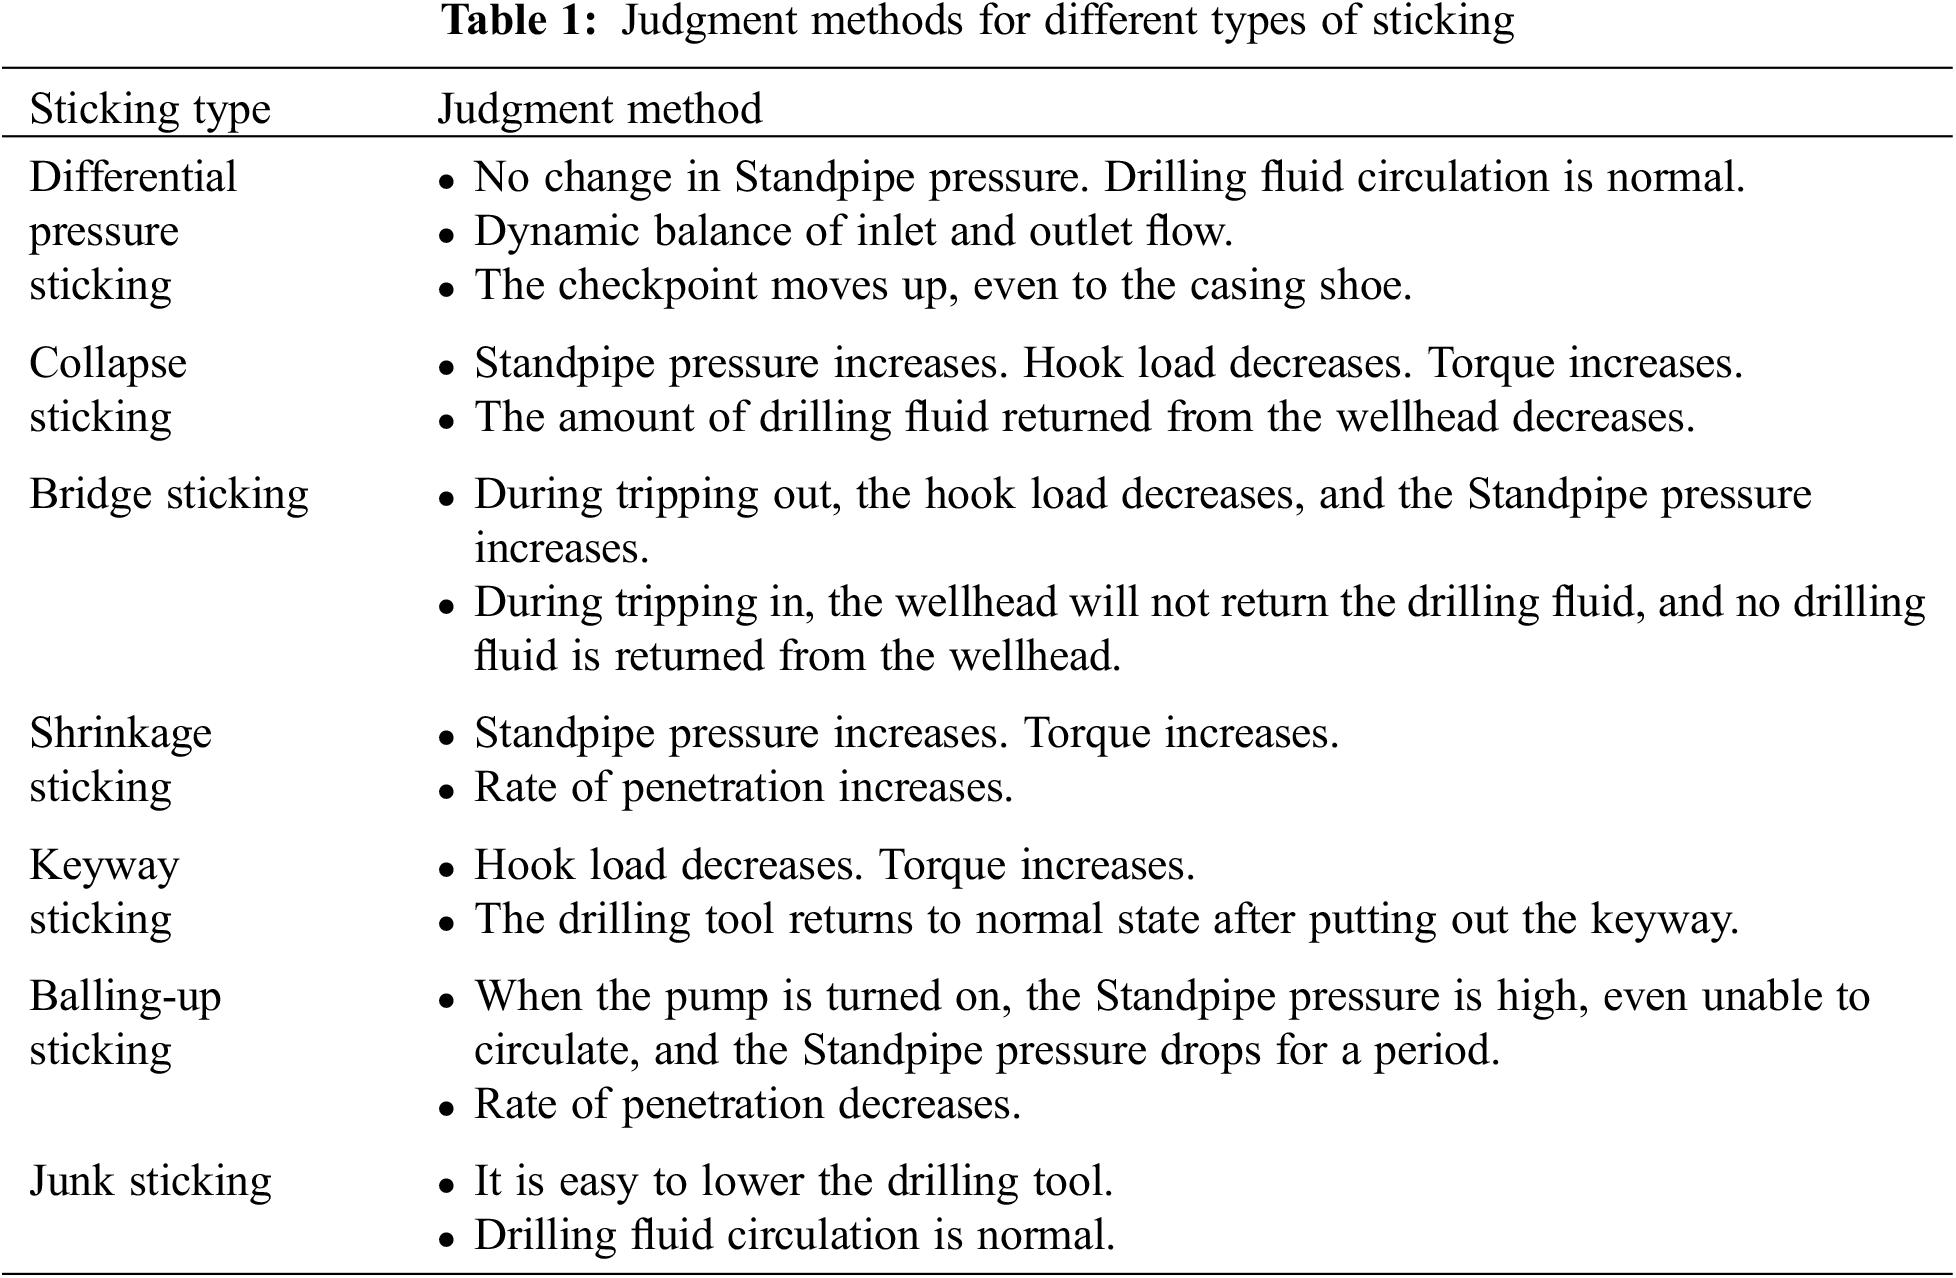
2.1 Judgment Methods for Different Types of Sticking
Firstly, it is necessary to combine the traditional method of expert knowledge judgment to summarize the qualitative methods for identification of sticking, which is one of the important basic work of artificial intelligence risk prediction. According to the different causes, the sticking can be divided into differential pressure, collapse, sand bridge, shrinkage, keyway, balling-up, and junk sticking [12]. The different types of sticking are correspond to different judgment methods. According to the field drilling practice and expert knowledge judgment [13,14], the judgment methods of sticking are summarized, as shown in Table 1.
2.2 Logging Characteristic Parameters Related to Sticking
According to the expert knowledge judgment of sticking failure, the comprehensive logging parameters that can characterize the sticking are hook load (WHO), standpipe pressure (SPP), torque (TOR), rate of penetration (ROP), rotary speed (RPM), and weight on bit (WOB). Although the types of sticking are different, the change rules of logging data before and after sticking are consistent. After the drill sticking fault occurs, the rotary table torque and the standpipe pressure increases, the rotary speed decreases. When sticking occurs during tripping out, the hook load and torque increases. When sticking occurs during tripping in, the hook load decreases, the torque increases, and the rotary speed increases.
3 Intelligent Algorithm of BP Neural Network Based on PSO
The back propagation (BP) neural network is a typical multi-layer and feed-forward network. The main advantage of the BP neural network is its strong nonlinear mapping ability. It is a three-layer forward artificial neural network composed of input layer, hidden layer, and output layer. According to the calculation formula of neuron output signal, the output of each neuron in the hidden layer can be obtained as follows:
In the formula, vij—connection weight of input layer neuron i and hidden layer neuron j. θj—threshold value of hidden layer neuron j. f(Ij)—activation function of neurons.
Similarly, the output signal of the output layer of BP neural network is obtained as follows:
In the formula, μjk—connection weight of output layer neuron k and hidden layer neuron j.
βk—threshold value of output layer neuron k. f(Ik)—activation function of neurons.
This paper systematically analyzed the learning steps of BP neural network.
a) Initialize parameters of neural network
The connection weights vij and μjk of each layer of neurons are given a random number between [−1, 1]. The learning rate η is set to a decimal within 0~1. The error E is set to 0. The error threshold Emin is set to a positive decimal. The number of hidden layer nodes m is obtained by an empirical formula. The sample mode calculator p and training times q are reset to 1. The default number of workouts is M.
b) Input training samples and calculate output of each layer
A pair of training samples (XP, QP) are selected to assign values of the input parameters, and the output O, Y are calculated.
c) Calculating the output error of neural network
Suppose the total number of training samples is P. The error of each training is
d) Calculate error signal of each layer
The error calculation formula of output layer and hidden layer is as follows:
The error calculation formula of hidden layer and input layer is as follows:
e) Adjust connection weight and threshold of each layer
The calculation formula of connection weight and threshold of output layer and hidden layer are as follows:
The calculation formula of connection weight and threshold value of hidden layer and input layer are as follows:
f) Determine whether to complete one training for all samples
If p < P, p, q increased by 1, return to Step b. Otherwise, go to Step g.
g) Check whether the total error of neural network meets the error threshold
ERME < Emin or q > M, end. Otherwise, E is reset to 0, p is reset to 1, return to Step b.
3.2 Particle Swarm Optimization Algorithm (PSO)
The BP neural network has its own defects. It is difficult to get the optimal value of the connection weight and threshold value, which eventually results in a large error between the prediction result and the actual value of BP neural network. Therefore, it is necessary to combine another optimal solution algorithm with the BP neural network to improve the accuracy of prediction. In this paper, the ability of PSO to search the optimal solution globally is used together with BP network to improve the prediction accuracy. The principle and model of PSO [15] are as follows: The M particles are initialized to form a “bird swarm”
In the formula,
3.3 Optimization of BP Neural Network Based on PSO
In this paper, the main steps of BP neural network based on PSO are as follows:
a) Initialization parameters.
Determine the topological structure of the BP neural network, initially set connect the weights and thresholds, and determine the particle swarm dimension D according to the number of weights and thresholds. Set the population size M and the number of iterations N. real code The weights and thresholds of the BP neural network are coded to obtain the initial population. In addition, the particle speed si,d and position zi,d are set within the allowable range [smin, smax], [zmin, zmax], and set the learning factors c1, c2.
b) The mean square error of each iteration in neural network is taken as the fitness function of particles.
c) According to the steps of particle swarm optimization algorithm, the global optimal position of particles is solved.
d) Check whether the iteration termination condition is met, if satisfied, stop, output the optimal particle, and decode it to get the optimal weight and threshold.
e) Training and prediction according to BP neural network.
4 Early Warning Model of Sticking
The algorithm based on particle swarm optimization (PSO) to optimize BP neural network is applied to early warning of sticking. In this paper, an intelligent and real-time quantitative evaluation method for downhole drilling risks is proposed, which is advanced compared to the existing qualitative and semi-quantitative assessment methods. This method includes the design of BP neural network, the design of particle swarm optimization algorithm and the prepossessing of model input parameters.
a) Input layer design
According to the expert knowledge, the six input neurons are set by selecting the characterization parameters with strong correlation with the sticking: hook load, standpipe pressure, torque, rate of penetration, rotary speed, and weight on bit.
b) Output layer design
This paper mainly deals with the identification of sticking. It only needs to judge whether it occurs and how likely it will happen. Therefore, there are two output neurons: expected output vector of sticking q1 = (1, 0), expected output vector of no sticking q2 = (0, 1).
c) Hidden layer design
In this paper, the number of hidden layers is set to 10 through research, and the result is most consistent with the actual situation.
Finally, the BP neural network structure is established, as shown in Fig. 1.
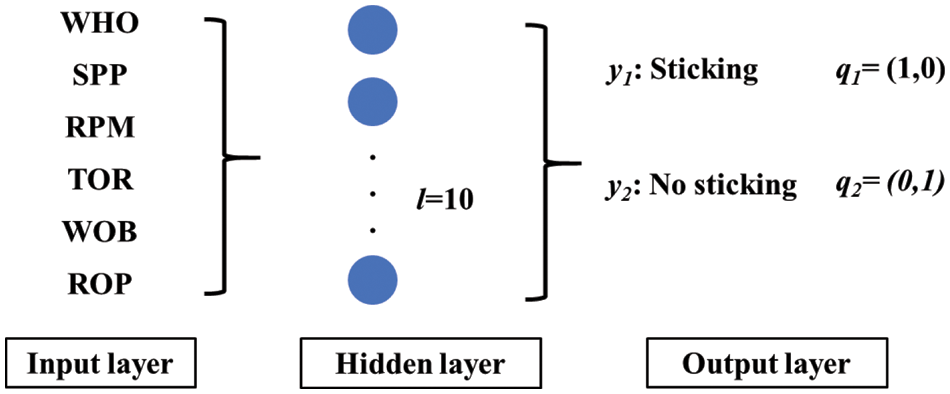
Figure 1: Schematic diagram of BP neural network structure for early warning of sticking
a) Particle coding
The structure of neural network is 6-10-2, as shown in Fig. 2. Therefore, there are 6 × 10 + 10 × 2 = 80 weight vectors and 10 + 2 = 12 threshold vectors. The number of particle swarm optimization parameters is 92, and the particle length is 92.
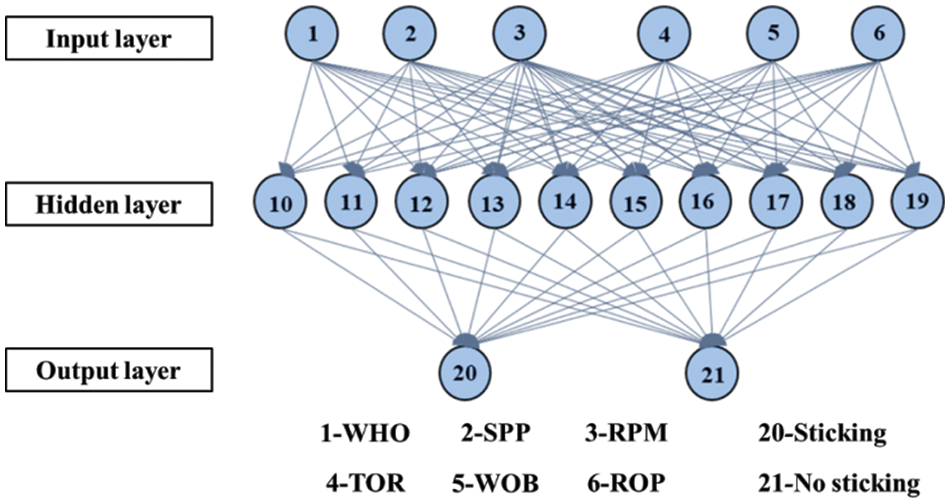
Figure 2: Schematic diagram of PSO-BP for early warning of sticking
In this paper, the vector coding is used, and particle i is encoded as follows:
b) Fitness function
The root mean square error of BP network training is taken as fitness function:
c) Data processing
To avoid the increasing error of network prediction result caused by the large difference of input and output data, the data normalization is carried out. In this paper, the minimum-maximum method is used for normalization [16,17]:
In formula, xmin, xmax—minimum and maximum values of logging data.
5 Training and Optimization of Early Sticking Warning Model
Combined with the field practice of shale gas drilling in South Sichuan, the comprehensive logging data of sticking are selected as the training samples to train and optimize the early warning model of sticking.
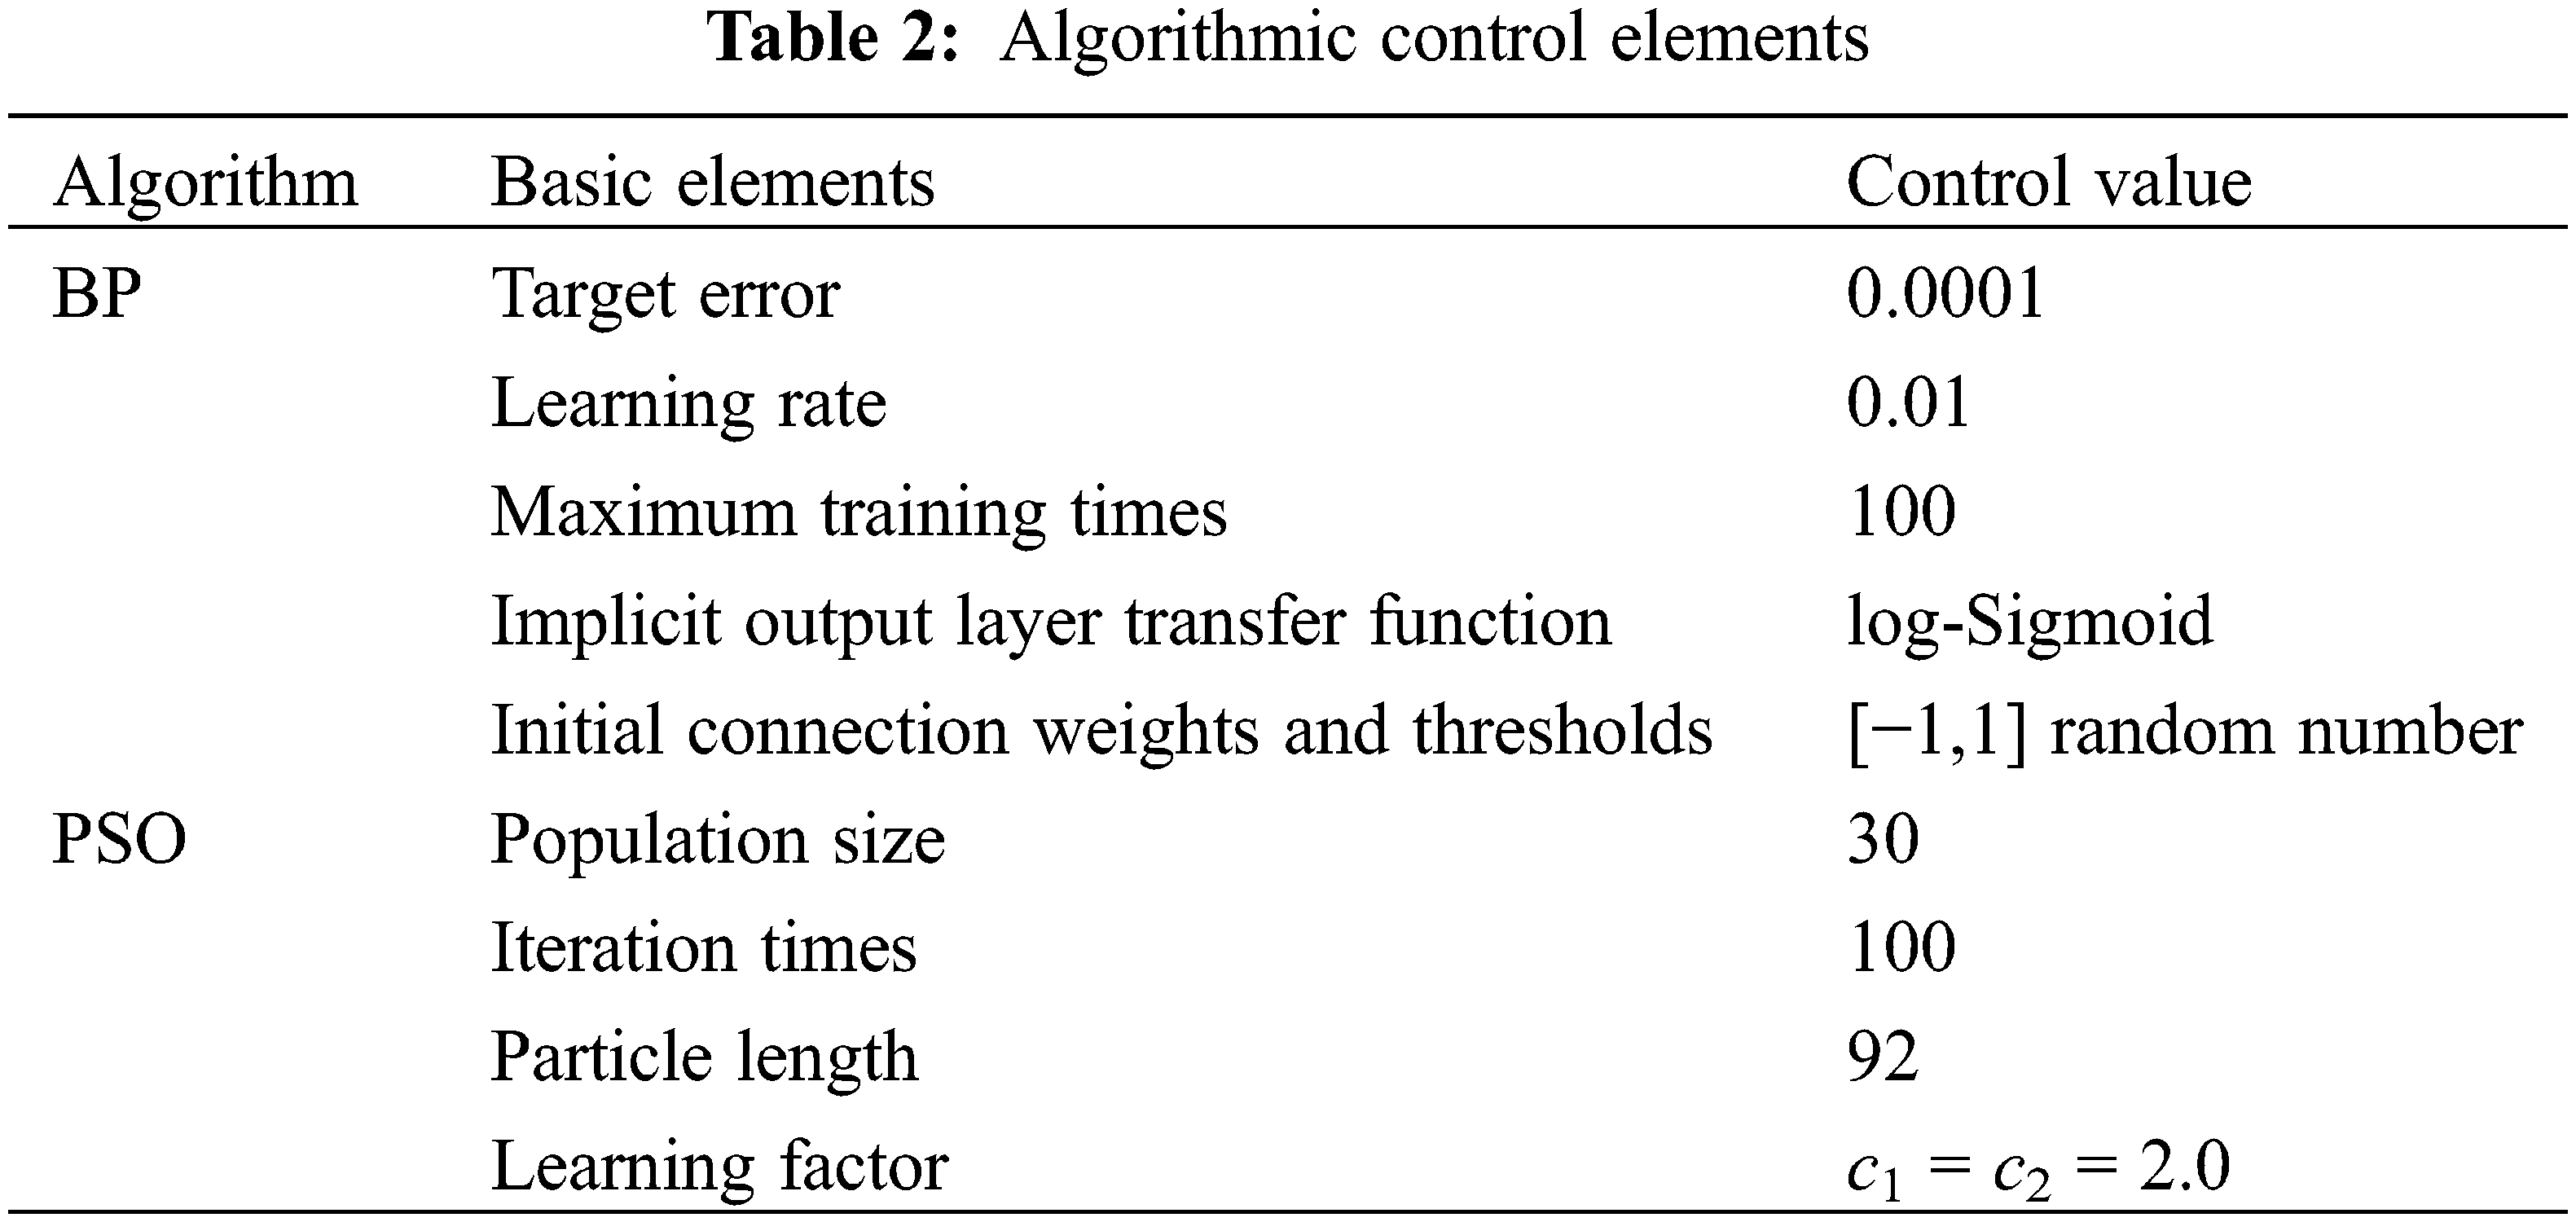
5.1 Algorithmic Control Elements
The elements of BP neural network and particle swarm optimization algorithm in the early warning model of sticking are set, as shown in Table 2.
5.2 Model Training and Simulating
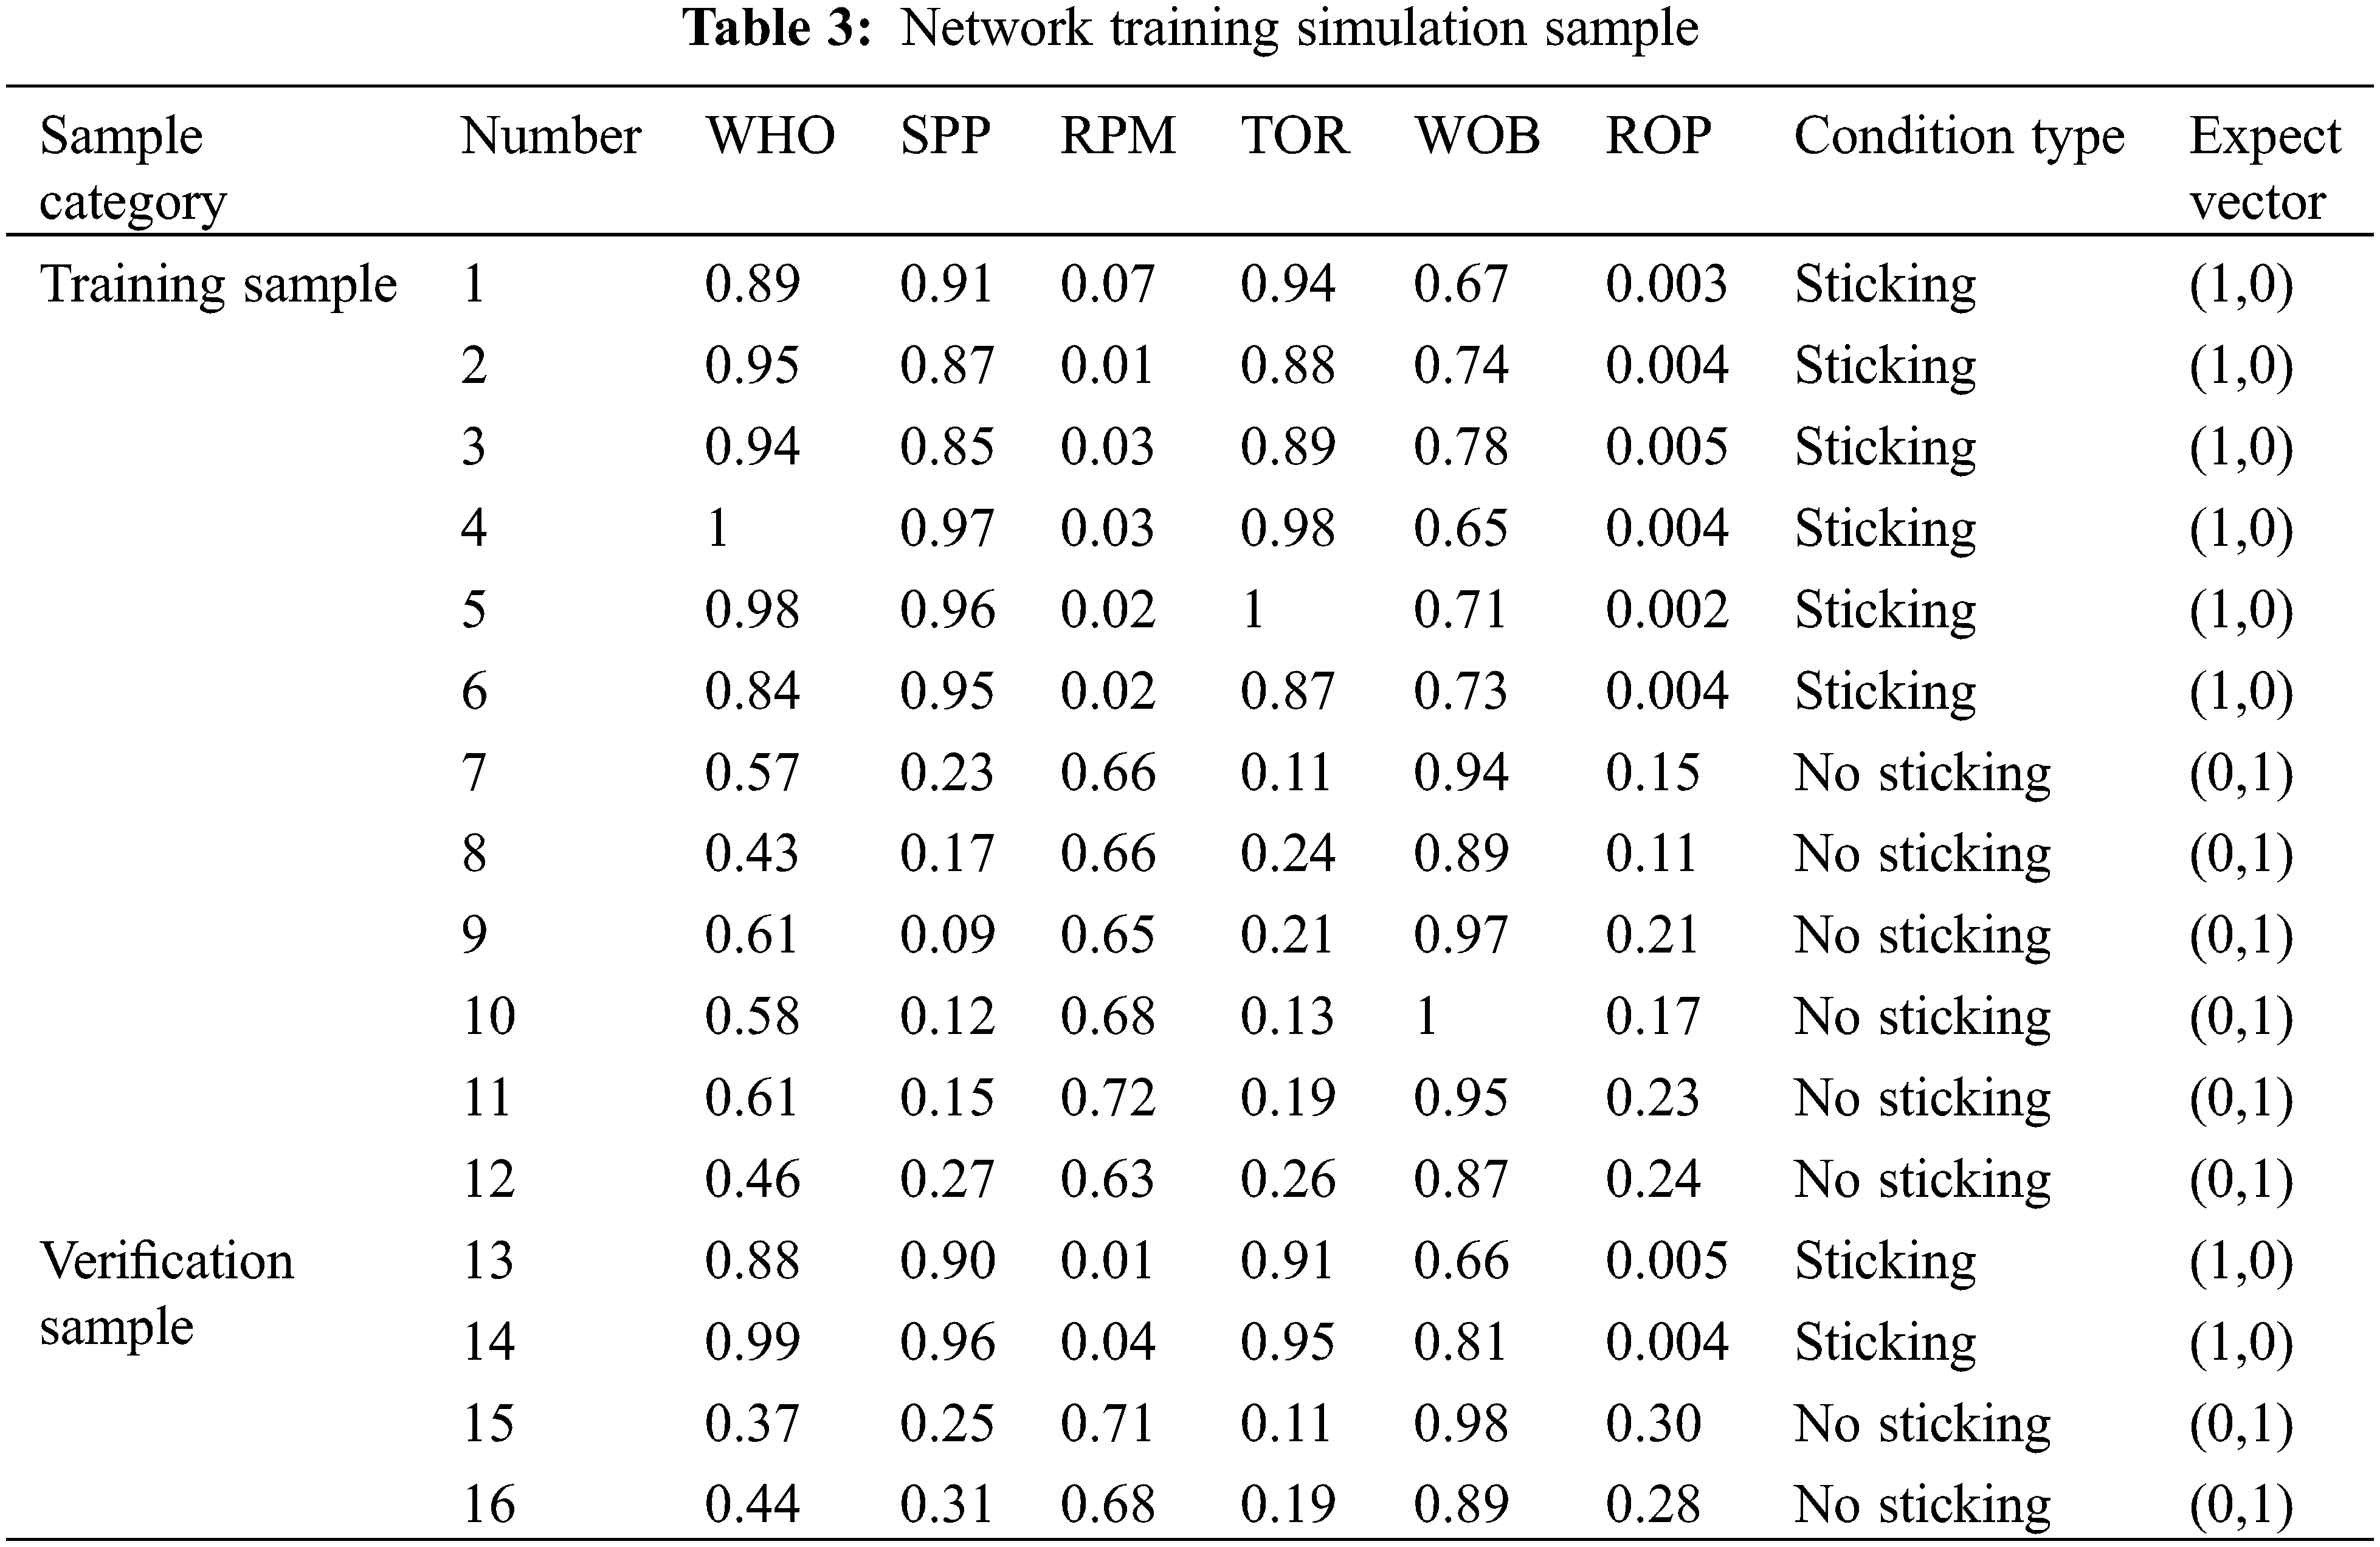
Based on the logging and well history data of seven sticking wells in South Sichuan shale gas work area (XX-1, XX-2, XX-3, XX-4, XX-5, XX-6, and XX-8), the sixteen sets of working condition data are selected as samples, eight sets of data correspond to sticking and eight sets of data correspond to no sticking. The comprehensive logging parameters monitored in given time period before and after the occurrence of sticking are selected and normalized according to the minimum-maximum method. The results are shown in Table 3. The first twelve groups of samples are selected as training samples to train the model, and the other four groups of samples as verification samples to verify the accuracy of the model.
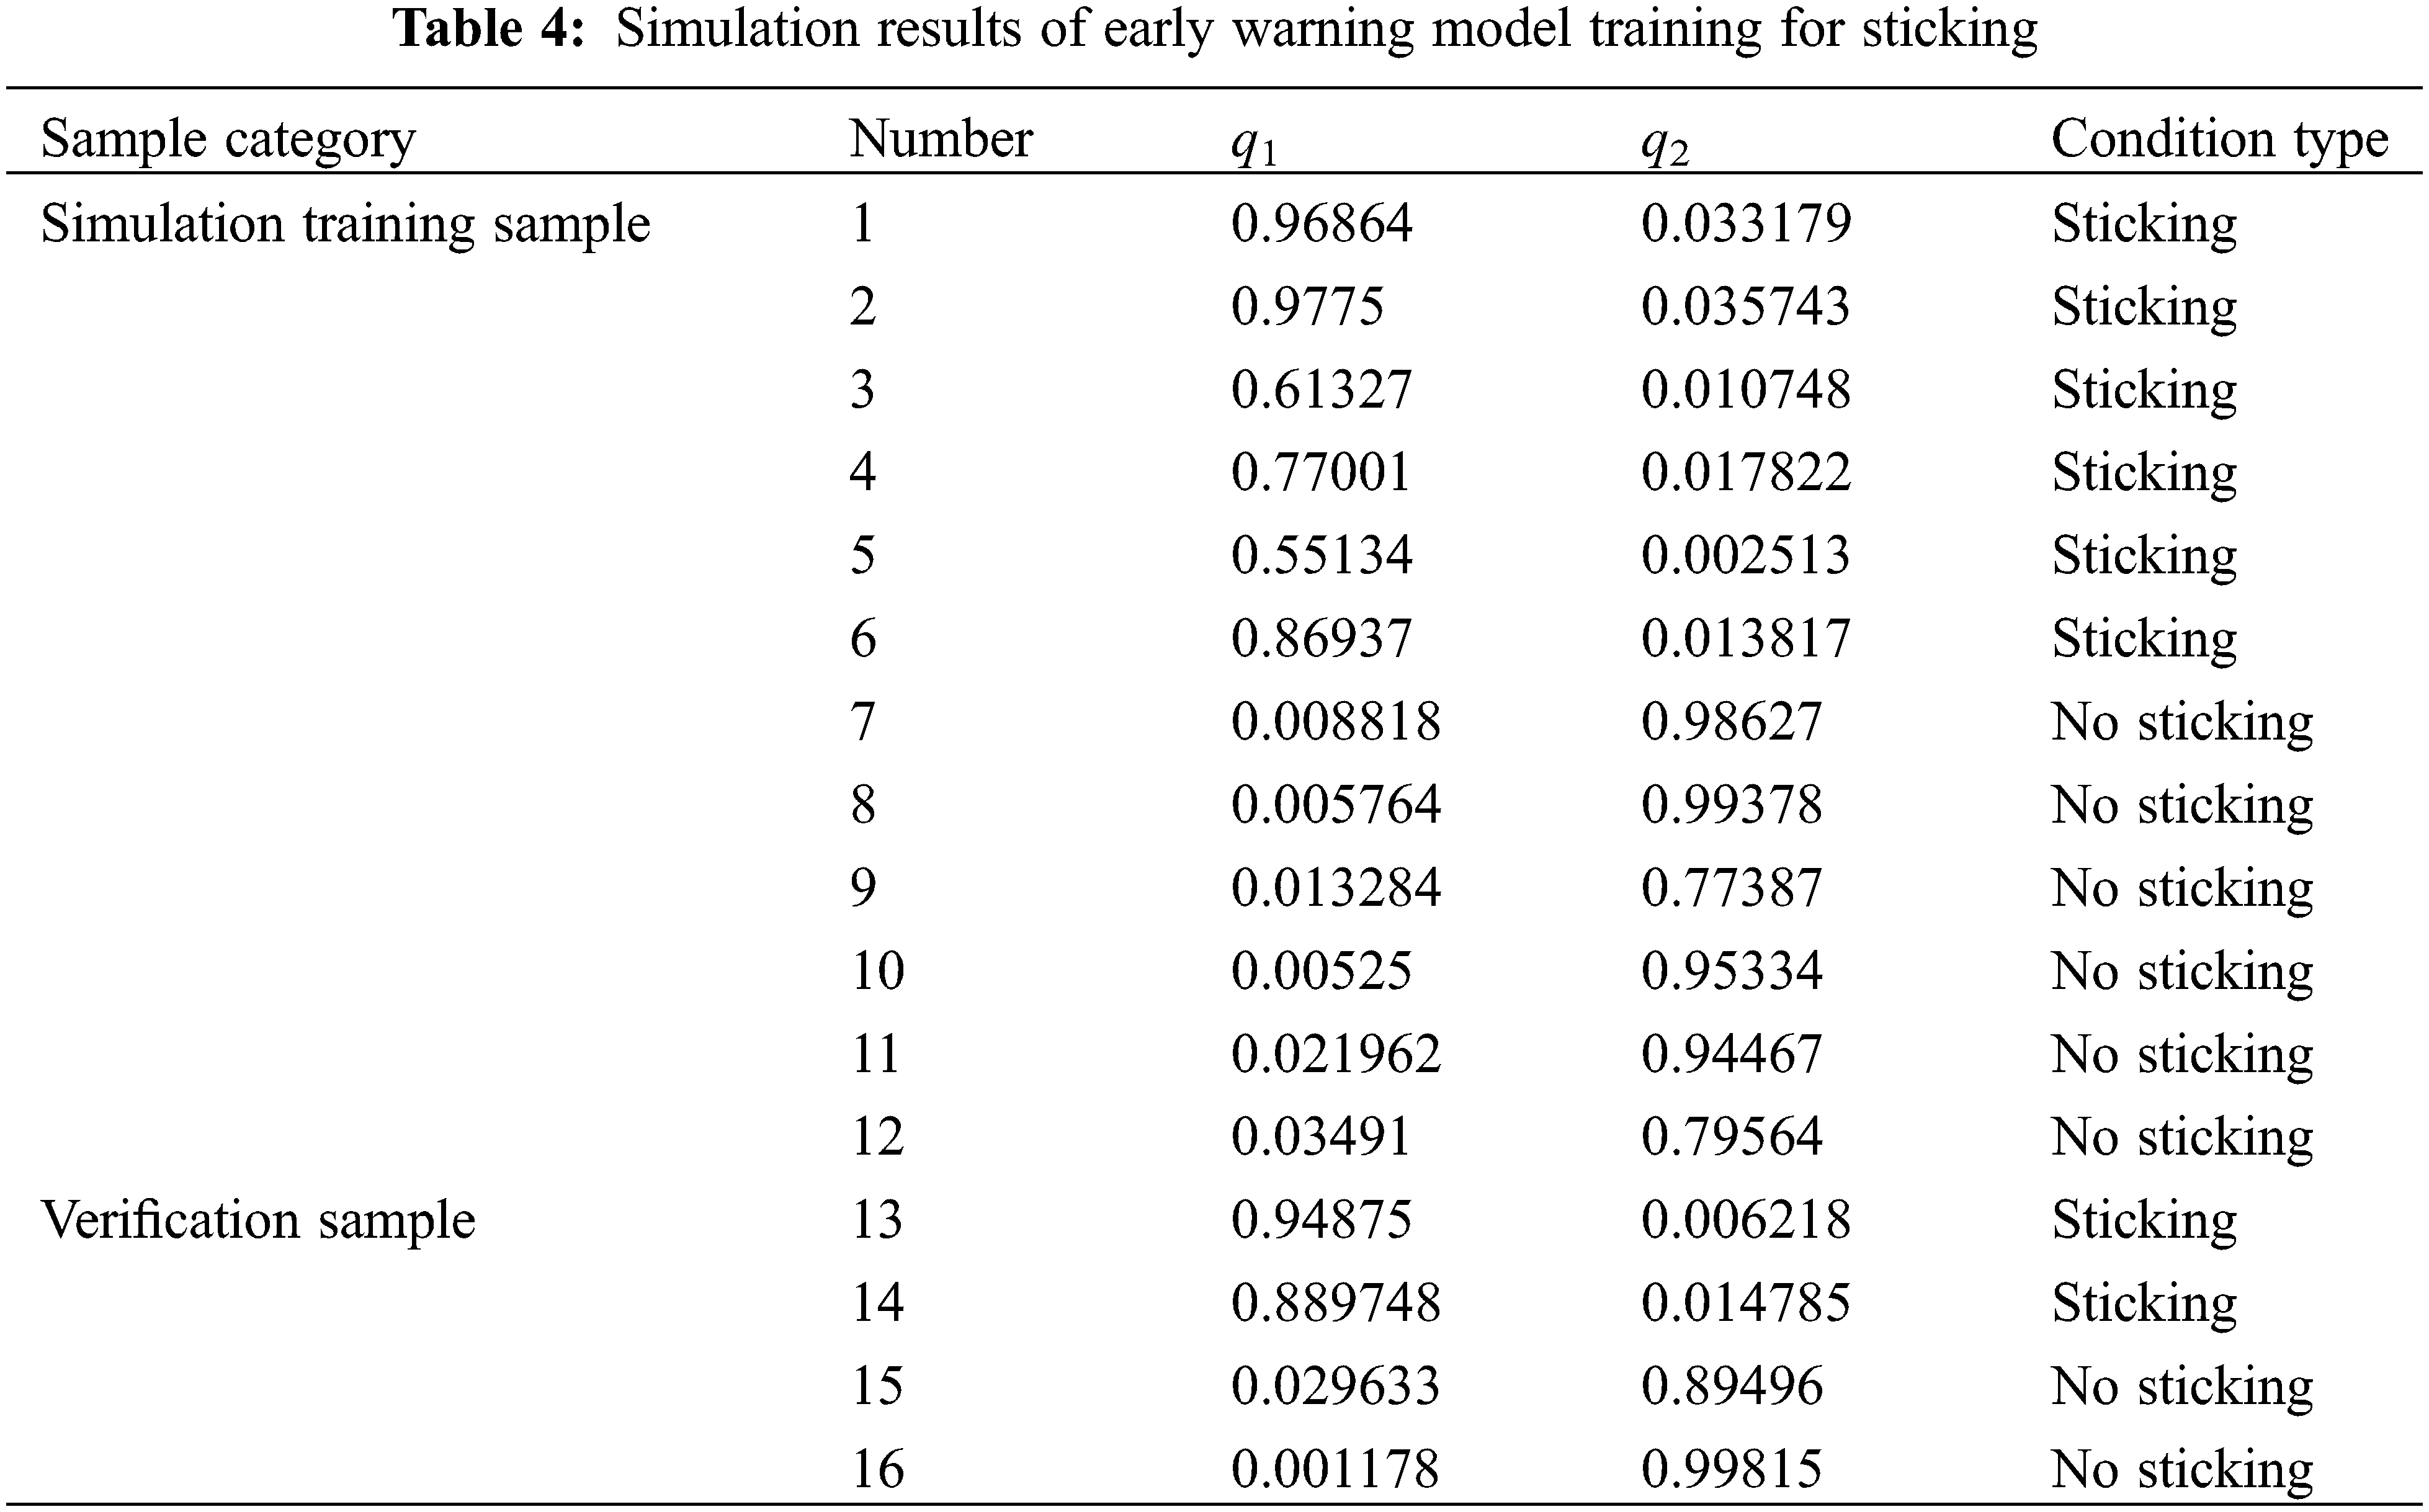
The training results of the sticking model are shown in Table 4. The conclusions are listed below: the simulation results are consistent with the actual downhole state, which shows that the training model can be applied to the early warning of sticking in the block.
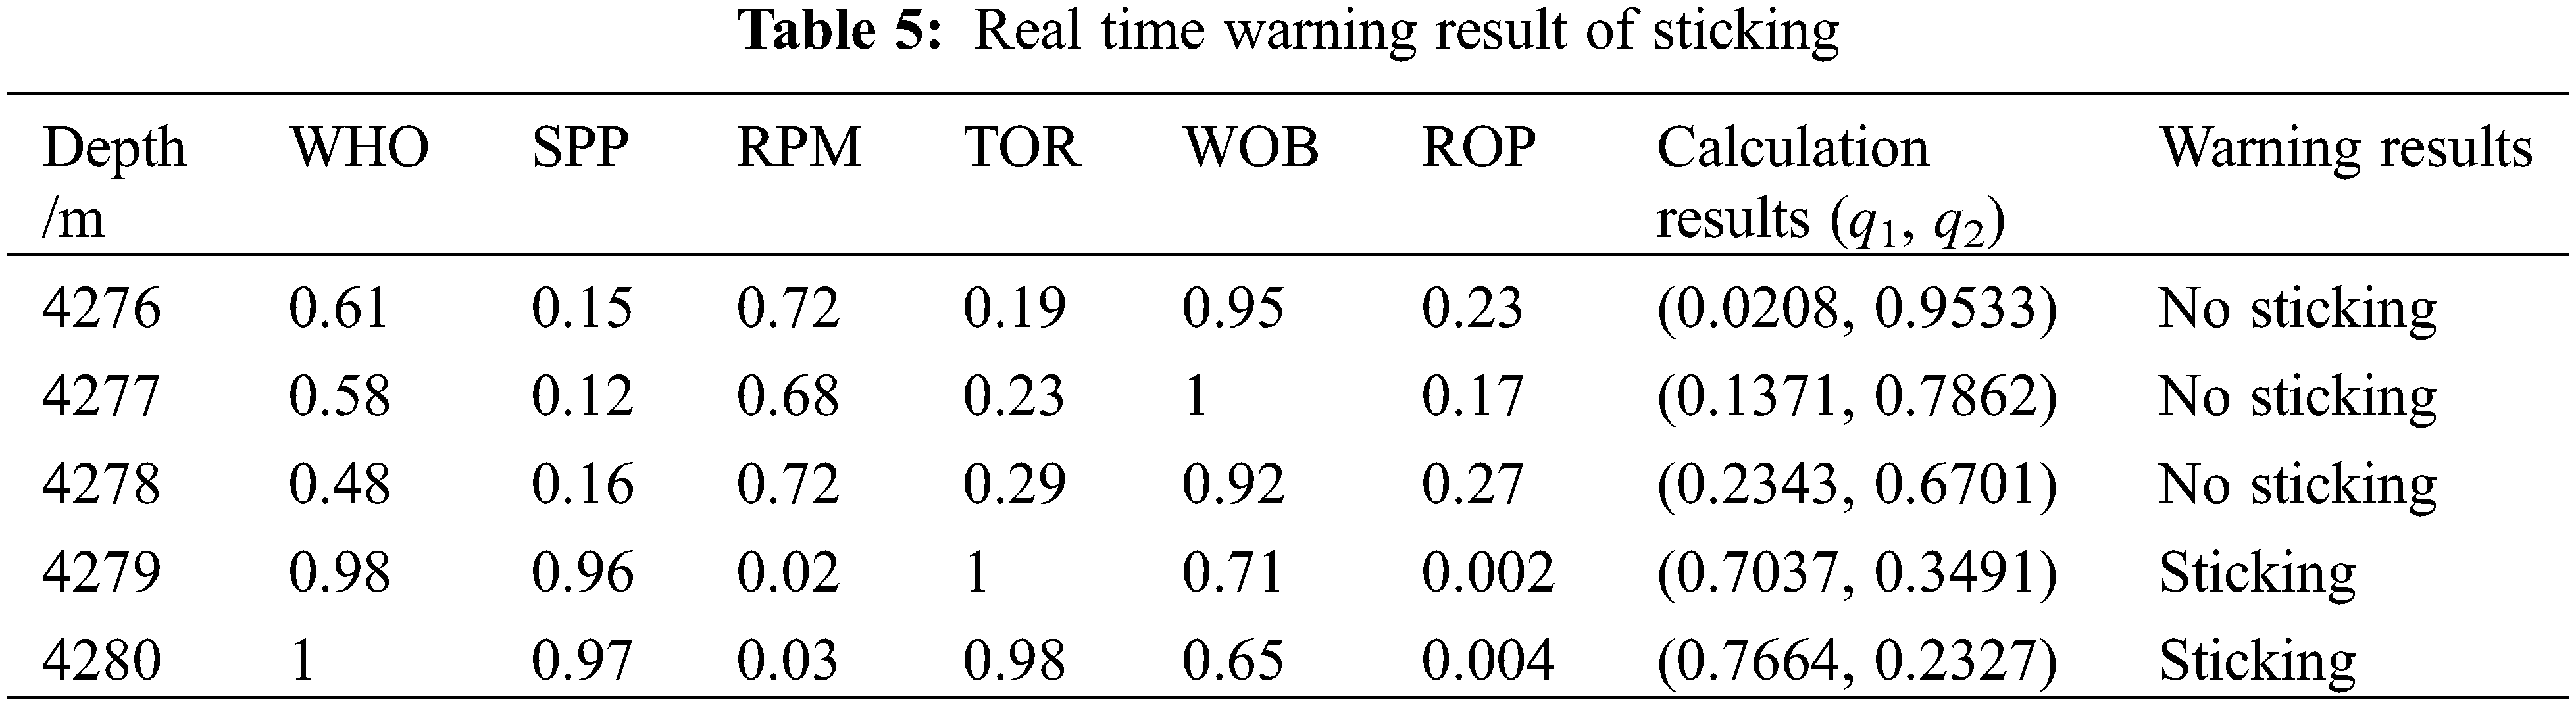
5.3 Application of Sticking Warning Model
To verify the accuracy of the developed early warning model, the being drilled WY-XX well in South Sichuan work area is selected for trial analysis. In the process of drilling in the fourth spud horizontal section, the sticking early warning model developed in this paper was used to conduct the real-time diagnosis of sticking. The probability of the sticking fault diagnosed at 4279 m was high (as shown in Table 5), and the drill sticking early warning information was timely sent to the driller operator. After drilling the column to 4280 m, the technicians took corresponding measures to avoid sticking. Thus, the possible sticking was effectively avoided. The field test application showed that the model developed in this paper can diagnose the sticking in real time, and the accuracy and efficiency of risk identification can meet the needs of field drilling operations and effectively ensure the safety of drilling operations.
(1) The traditional sticking fault prediction relies heavily on the subjective judgment of experts, and the results are mostly qualitative or semi-quantitative. In this paper, the method for early-warning of sticking is proposed, which utilizes the intelligent and real-time quantitative judgment of sticking, and solves the problems of poor comprehensive utilization of monitoring information, insufficient early warning of risk, and strong subjectivity.
(2) The error training function of BP neural network is not a strict convex function, thus it is easy to fall into local minimum when searching for the optimal connection weight and threshold value. The defects of BP network affect the accuracy of dynamic risk assessment results. The ability of a global searching optimal solution based on PSO can make up for the defect of local optimization of BP neural network.
(3) A case study and application of the developed early warning model for sticking was carried out. The twelve sets of sticking diagnostic results obtained by simulation were all consistent with the actual downhole state. Further, the results of four groups of verification samples were also consistent with the actual downhole state, which demostrated that the model developed by training can be applied to the early warning and recognition of sticking.
Funding Statement: The project is supported by CNPC Key Core Technology Research Projects (2022ZG06) received by Qing Wang and project funded by China Postdoctoral Science Foundation (2021M693508) received by Qing Wang. Basic Research and Strategic Reserve Technology Research Fund Project of Institutes directly under CNPC received by Qing Wang.
Availability of Data and Materials: The data that support the findings of this study are available from the corresponding author upon reasonable request.
Conflicts of Interest: The authors declare that they have no conflicts of interest to report regarding the present study.
References
1. Rotman, D. (2013). Drilling for shale gas. China: Technology Review Press. [Google Scholar]
2. Jarvie, D. M. (2012). Shale resource systems for oil and gas: Part 1—Shale-gas resource systems. AAPG Memoir, 10(6), 89–119. [Google Scholar]
3. Gholami, R., Rabiei, M., Rasouli, V. (2015). Application of quantitative risk assessment in wellbore stability analysis. Journal of Petroleum Science and Engineering, 135(3), 185–200. https://doi.org/10.1016/j.petrol.2015.09.013 [Google Scholar] [CrossRef]
4. Mostafavi, S., Adnoy, B., Hareland, G. (2011). Model based uncertainty assessment of wellbore stability analyses and downhole pressure estimations. Journal of American Rock Mechanics, 12(5), 60–65. [Google Scholar]
5. Udegbunam, J. E., Aadnoy, B. S., Fjelde, K. K. (2014). Uncertainty evaluation of wellbore stability model predictions. Journal of Petroleum Science & Engineering, 124(6), 254–263. https://doi.org/10.1016/j.petrol.2014.09.033 [Google Scholar] [CrossRef]
6. Guan, Z. C., Sheng, Y., Xu, Y., Wang, Q., Zhang, B. et al. (2017). Dynamic risk assessment method of drilling based on PSO optimized BP neural network. Journal of Safety Science and Technology, 13(8), 5–11. [Google Scholar]
7. Jiang, X. (2006). Drilling accidents and complex problems. China: Petroleum Industry Press. [Google Scholar]
8. Khakzad, N., Khan, F., Amyotte, P. (2013). Quantitative risk analysis of offshore drilling operations: A bayesian approach. Safety Science, 57(3), 108–117. https://doi.org/10.1016/j.ssci.2013.01.022 [Google Scholar] [CrossRef]
9. Ostebo, R., Tronstad, L., Fikse, T. (1991). Risk analysis of drilling and well operations. SPE/IADC Drilling Conference, SPE 21952. Houston, USA. https://doi.org/10.2118/21952-MS [Google Scholar] [CrossRef]
10. Lawal, A. I., Kwon, S. (2020). Application of artificial intelligence to rock mechanics: An overview. Journal of Rock Mechanics and Geotechnical Engineering, 14(6), 65–77. [Google Scholar]
11. Ali, J. A., Kalhury, A. M., Sabir, A. N. (2020). A state-of-the-art review of the application of nanotechnology in the oil and gas industry with a focus on drilling engineering. Journal of Petroleum Science & Engineering, 16(5), 30–45. https://doi.org/10.1016/j.petrol.2020.107118 [Google Scholar] [CrossRef]
12. Chen, T., Guan, Z. (2000). Theory and technology of drilling engineering. China: Petroleum University Press. [Google Scholar]
13. Liao, T., Lei, J. (2016). Current situation and development direction of mud logging technology at home and abroad. Logging Engineering, 27(1), 6–13. [Google Scholar]
14. Gao, D. (2004). Deep and ultra-deep well drilling technology under complex geological condition. China: Petroleum Industry Press. [Google Scholar]
15. Liao, M. (2010). Research on real-time monitoring technology of drilling process. China: China University of Petroleum Press. [Google Scholar]
16. Liu, X. (2010). Input layer normalization of BP neural network. Mechanical Engineering and Automation, 11(3), 122–126. [Google Scholar]
17. Zeng, Y., Liu, J. (2005). Technical status and developmental trend of drilling techniques in deep and ultra-deep wells. Petroleum Drilling Techniques, 33(5), 1–5. [Google Scholar]
Cite This Article
 Copyright © 2023 The Author(s). Published by Tech Science Press.
This work is licensed under a Creative Commons Attribution 4.0 International License , which permits unrestricted use, distribution, and reproduction in any medium, provided the original work is properly cited.
 Downloads
 Citation Tools