
 Submit a Paper
 Propose a Special lssue
 Open Access
ARTICLE

Investigation of Electrical Parameters of Fresh Water and Produced Mixed Injection in High-Salinity Reservoirs
1 PetroChina Research Institute of Petroleum Exploration & Development, Beijing, 100083, China
2 Changqing Oilfield No.5 Oil Production Plant, PetroChina, Xi’an, 710000, China
3 Exploration and Development Research Institute of Daqing Oilfield Co., Ltd., Daqing, 163712, China
4 Key Laboratory of Shallow Geothermal Energy, Ministry of Natural Resources of the People’s Republic of China, Beijing, 100195, China
5 Jiangsu Key Laboratory of Oil-Gas Storage and Transportation Technology, School of Petroleum and Natural Gas Engineering, Changzhou University, Changzhou, 213164, China
6 Sinopec International Petroleum Exploration and Production Corporation, Beijing, 100029, China
* Corresponding Author: Hui Xu. Email:
Fluid Dynamics & Materials Processing 2023, 19(10), 2695-2706. https://doi.org/10.32604/fdmp.2023.028115
Received 30 November 2022; Accepted 20 February 2023; Issue published 25 June 2023
 View Full Text
 Download PDF
Abstract
Assuming a reservoir with a typical salt-lake background in the Qaidam Basin as a testbed, in this study the variation law of the rock electrical parameters has been determined through water displacement experiments with different salinities. As made evident by the results, the saturation index increases with the degree of water injection. When the salinity of the injected water is lower than 80000 ppm, the resistivity of the rock sample first decreases, then it remains almost constant in an intermediate stage, and finally it grows, thereby giving rise to a ‘U’ profile behavior. As the salinity decreases, the water saturation corresponding to the inflection point of the resistivity becomes lower, thereby leading to a wider ‘U’ type range and a higher terminal resistivity. For different samples, higher initial resistivity of the sample in the oil-bearing state, and higher resistivity after low-salinity water washing are obtained when a thicker lithology is considered.Graphic Abstract
Keywords
Abbreviations
| CNL | Compensated neutron logging, % |
| DT | Acoustic logging, μs/m |
| DEN | Density logging, g/cm3 |
| I | Resistivity index |
| R3 | 3 m bottom gradient resistivity, Ω•m |
| R6 | 6 m bottom gradient resistivity, Ω•m |
| RNML | Micropotential resistivity, Ω•m |
| RLML | Microgradient resistivity, Ω•m |
| Sw | Water saturation |
Rock is a porous mixed medium. The physical properties of rocks are the link between geophysics and geological interpretation. The accuracy of physical data is the basis of reliable geological interpretation. Among them, the accuracy of rock electrical parameters and their influencing factors played an important role in evaluating the hydrocarbon saturation of reservoirs.
In 1942, the simple empirical relationship between formation factors and porosity was studied [1], and the simple empirical relationship between resistance increased coefficient and water saturation. The research on the relationship between formation conditions and rock electrical parameters has not been interrupted. A lot of work on the electrical parameters of tight reservoirs has been done [2,3]. They believed that the rock electrical parameters were most important in evaluating hydrocarbon saturation of reservoirs, and wettability [4–6], clay mineral distribution, pore structure, and heterogeneity, which made it difficult to accurately obtain oil and gas saturation [7,8]. In addition, due to the high salinity of formation water and strong conductivity, oil sand bodies generally showed low resistivity [9,10]. In the development of most reservoirs, the method of cleaning and mixed injection was adopted, which leads to the continuous decrease in the salinity of the mixed liquid [11], the drastic change of the rock electrical parameters [12,13], and increased the inaccuracy of the waterlogging layer identification and saturation calculation [14–16]. It was found that there were few studies on the influence of salinity on rock electrical parameters after the development of high-salt reservoirs by using the method of cleanup and mixed injection [17–19].
In this paper, the Gasikule reservoir with the typical salt lake background in the Qaidam Basin was taken as the research object. The original formation salinity was mostly in the range of 100000–200000 mg/L. It had been developed by mixed injection of clean water and sewage over more than 20 years. The characteristics of salinity were becoming increasingly complex. In this paper, the variation law of rock electrical parameters was studied by water injection experiments with different salinity. The results showed that the saturation index increases with the increase of water flooding degree. When the salinity of the injected water was lower than 80000 ppm, the resistivity of the rock sample decreased in the early stage, flattened in the middle stage, and increased in the later stage, of which the image alternation trend was similar to a ‘U’ shape. As the salinity decreased, the water saturation corresponding to the inflection point of the resistivity from falling to rising became lower, which resulted in a wider ‘U’ type range and a higher terminal resistivity. For different samples, as the lithology became thicker, the initial resistivity of the sample in the oil-bearing state was higher, and the resistivity after low salinity water washing is higher. The conclusion of this paper has an important application value for evaluating the oil and gas saturation of high-salt reservoirs after mixed injection development.
In the process of water displacement, low-salinity water flooding is conducive to change the rock wettability, and low-salinity water + carbon dioxide can effectively reduce interfacial tension. In the process of alkali flooding, low-salinity water is also conducive to raising pH value [20,21]. Therefore, low-salinity water flooding is used in the development of most oilfields. Due to the high salinity and strong conductivity of the formation water, an oil sand body generally shows low resistivity. In the process of low-salinity water flooding, the salinity of water in the oil sand body continuously decreases, and the resistivity changes dramatically. In the case of high waterlogging, the resistivity of the oil sand body is even higher than that in the case of no waterlogging, and the accuracy of waterlogging layers and the saturation calculation continues to deteriorate. Therefore, it is necessary to study the resistivity variation law of reservoirs by using low-salinity water injection.
2 Reservoir Salinity Variation and Its Effect on Resistivity
The variation trend in the average salinity of water produced in the Gasikule reservoir in the last 15 years is shown in Fig. 1 and Table 1. Since 2008, the average salinity of water produced in the Gasikule reservoir decreased from the highest value of 170052 mg/L (chloride ion peak value of about 134572 mg/L) to the current 73142 mg/L (chloride ion concentration of about 46613 mg/L).
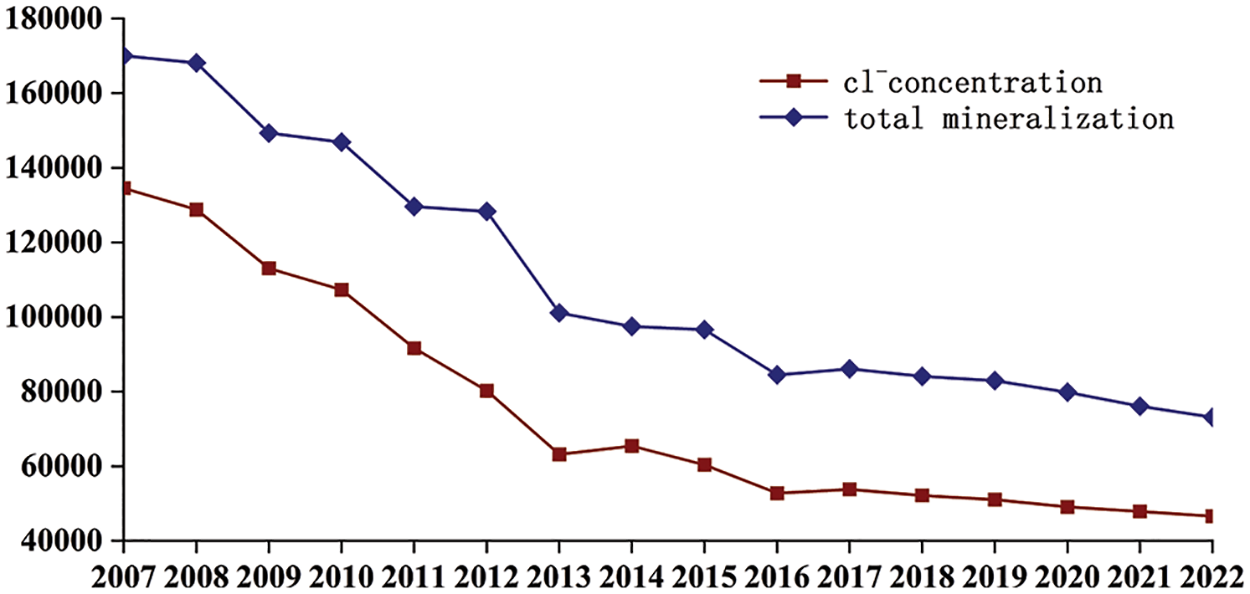
Figure 1: Trend of average salinity of water produced in the Gasikule reservoir in the last 15 years

In December 2008, Yue 443 (Y443) well began to undergo v-7 and v-9 layer clean by mixed injection, where v-7 was interpreted as an oil layer with DT of 310 μs/m, R6 resistivity of 3.6 Ω·m; v-9 was interpreted as a poor oil layer with DT of 295 μs/m, R6 resistivity of 2.7 Ω·m (Fig. 2a). The well was scrapped, and the cumulative water injection was 3.63 × 10⁴ m3. At the same time, the well Yuegeng 443 (YG443) was drilled, and the chloride ion concentration of the test water sample was 4.6 × 10⁴ mg/L, which was much lower than the original chloride ion concentration, indicating that the injection water of Y443 well was spread to the location of the renewal well (Table 2). Well YG443 is a replacement well for well Y443 and these wells shared a wellhead, which was only 51.3 m away from the target zone v-9. According to the logging curve, both wells were located in channel deposits. The channel width of the area was 300–600 m, indicating that the two wells were connected, and the reservoir conditions were consistent. The logging interpretation results of well YG443 showed that v-9 was a moderately flooded layer, which was affected by water injection erosion and the obvious increase of DT value. The average value was 315 μs/m, which was 1.07 times the original. The resistivity of R6 was 4.6 Ω·m, which is 1.7 times the original. The resistivity of the water-flooded layer did not decrease but rather increased (Fig. 2b). The two water absorption profiles in June and September 2015 proved that the layer was the main water absorption layer (Fig. 3 and Table 3), and verified the rationality of the interpretation of the v-9 layer of YG443 well as the moderate water displacement layer.
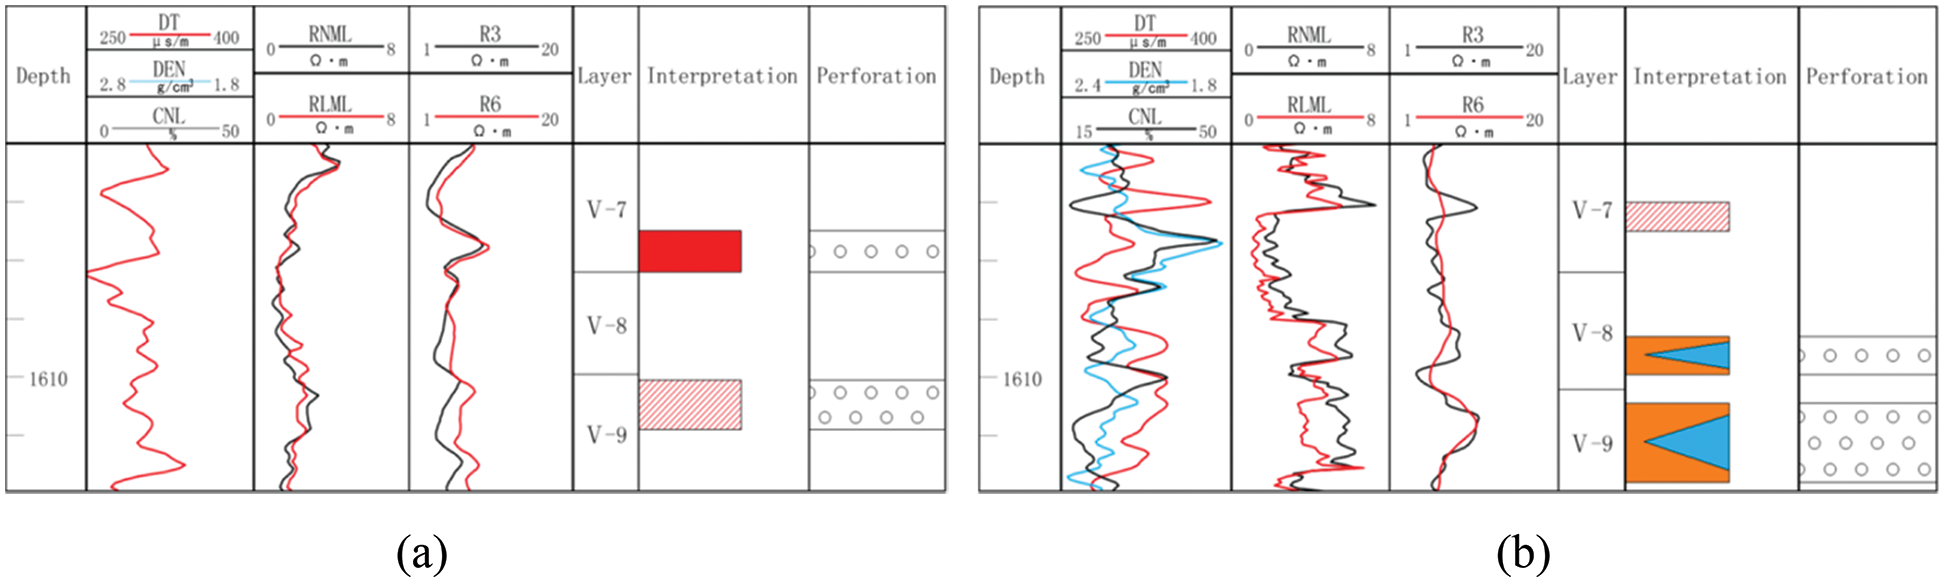
Figure 2: Different well logging interpretation, (a) Y443 well logging interpretation; (b) Well YG443 electrical logging interpretation

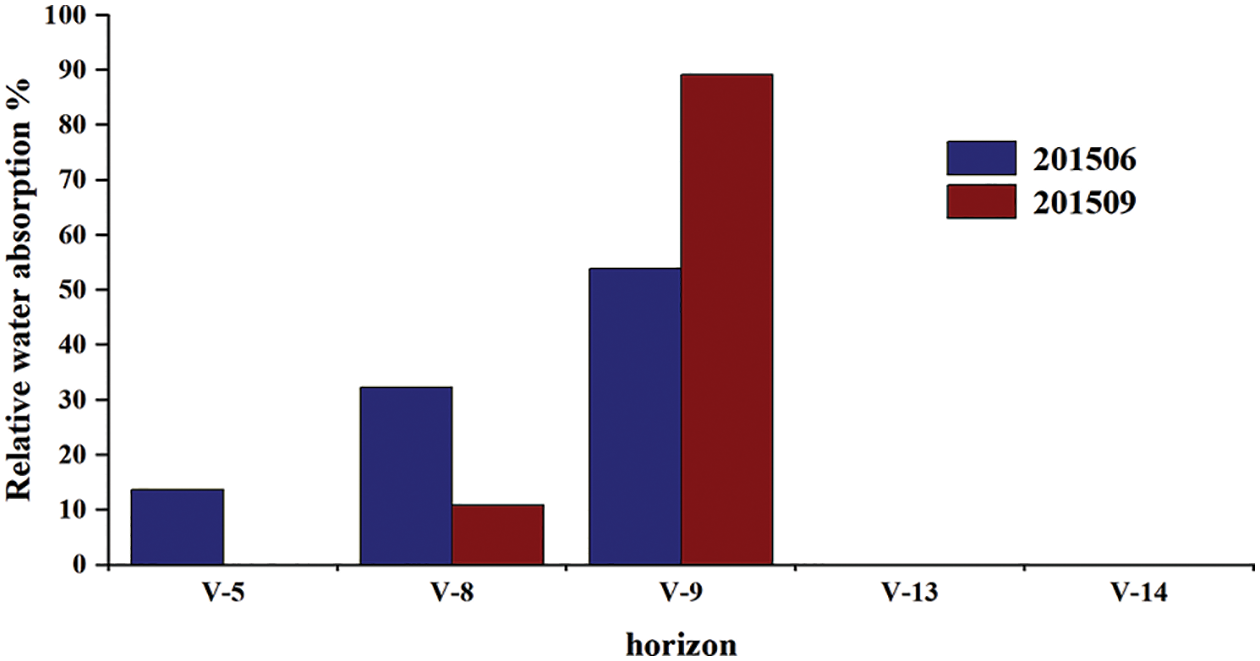
Figure 3: Comparison of relative water absorption in YG443 well

3.1 Rock Electricity Experiment Method
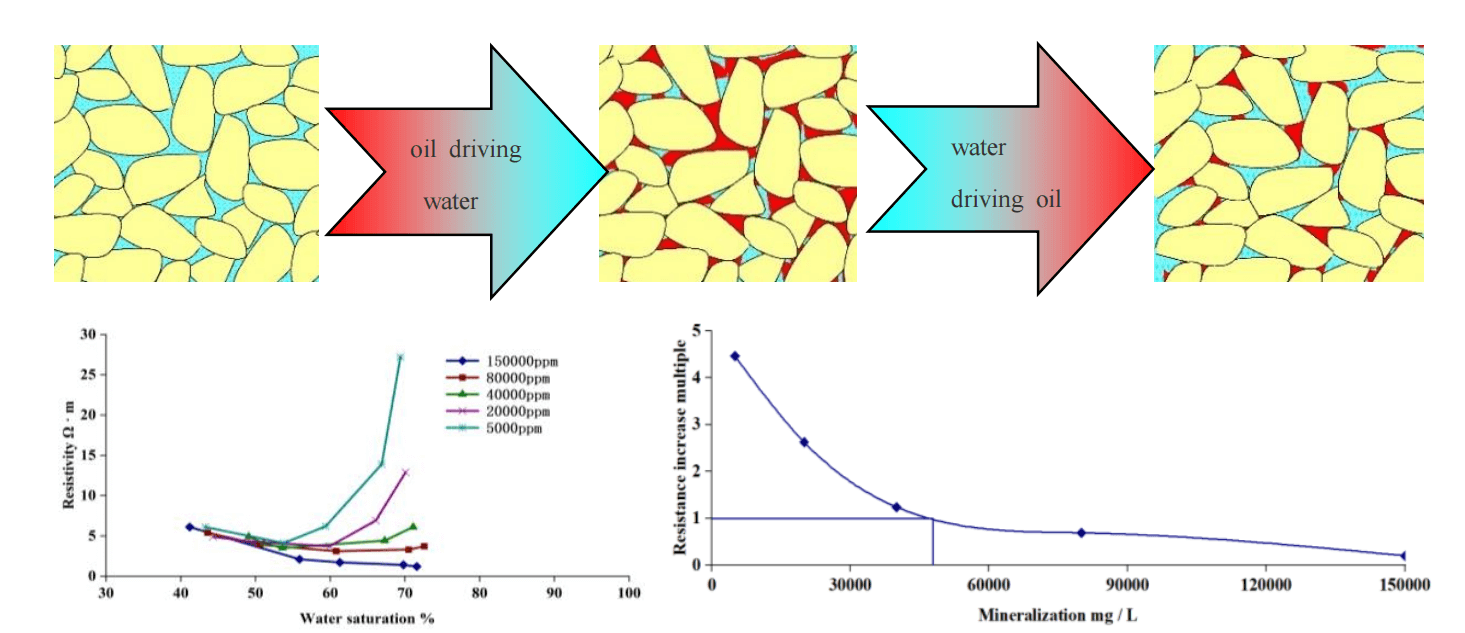
In the process of water injection in the oilfield, the distribution of oil/water in rock pore spaces, salinity of the formation mixed liquids, and the conductivity gradually changed. This process (oil driving water) and the accumulation process (water flooding) was reversed, which resulted in the different rock electrical parameters. Therefore, experiments were carried out on the original reservoir and the developed reservoir. The original reservoir was tested by oil injection, and the developed reservoir was tested by water displacement (Table 4).

In this experiment, the relative resistivity-porosity relationship of all samples (123 blocks) was analyzed. It was found that the characteristics of samples with a porosity of less than 8% were significantly different from those of samples with a porosity of more than 8%. Considering the effective range of the reservoir in this area, samples with porosity below 8% were removed when the specific parameters were determined.
3.2 Experimental Study of Electrical Characteristics Due to Different Salinity Displacement
In the process of water flooding, the distribution of oil and water in the rock inevitably changed, resulting in the destruction of the original conductive network of rock pores and the change of the conductive mechanism. In this paper, the variation of rock electrical parameters during water flooding was studied by simulating the reservoir development process.
3.2.1 Different Salinity Water Flooding Core Saturation Index Experiment
Firstly, the rock saturated by water with a salinity of 160000 ppm (simulating the original salinity of the formation) was used to measure the rock resistivity, to determine the rock formation factors, and the pore structure index. And then the water in the rock was displaced by crude oil to simulate the reservoir formation process and to measure the original reservoir rock saturation index.
3.2.2 Different Salinity Water Flooding Core Resistivity Experiment
According to the GB/T 29172-2012 ‘core analysis method’ and the SY/T 5385-2007 ‘laboratory measurement and calculation method of rock resistivity parameters’, the basic parameters (porosity and permeability), oil-water and water-oil displacement tests were carried out at 13°C and confining pressure of 5 MPa.
In each experiment of the displacement process, the core was saturated with water with a salinity of 160000 ppm, and then the reservoir conditions were saturated by the crude oil, and the displacement was carried out with different salinity water.
The degree of mineralization of successive displacement with different salinities of 160000, 80000, 40000, 20000, and 5000 ppm were carried out. The experimental results can not only aid in understanding the electrical parameters of rock but also study the variation of resistivity in the process of different salinity displacement.
4.1 The Variation of Saturation Index during the Displacement Process
The experiment showed that the saturation index of rock changed in different stages. In the early stage of water flooding, it was close to the saturation index of the original reservoir. With the increase of the degree of water injection, the saturation index increased and the rate of increase slowed down in the middle and late stages. There were some differences in the saturation index at each stage of development. In general, the average saturation index of rocks in the development period was slightly higher than that of the original reservoir as shown in Fig. 4 and Table 5.

Figure 4: Changes in saturation index of different oil groups during water flooding

From the difference in saturation index between the development period and the accumulation period, the corresponding rock electrical parameters were used in the interpretation of the water-flooded layer in the development period to improve the accuracy of saturation interpretation. The rock electrical parameters can be selected by using the interpolation calculation method or the water flooding grade zoning.
4.2 Resistivity Variation during the Displacement Process
The resistivity variations were shown in Fig. 5 and Table 6. The highest proportion of siltstone rock samples in the study area was selected. The resistivity of rock with saturated oil continuously decreased during the displacement process with 160000 ppm brine. In this process, the salinity of the displaced water was consistent with the original salinity of rock and the resistivity decreased continuously. The terminal resistivity was 0.2 times the original resistivity.
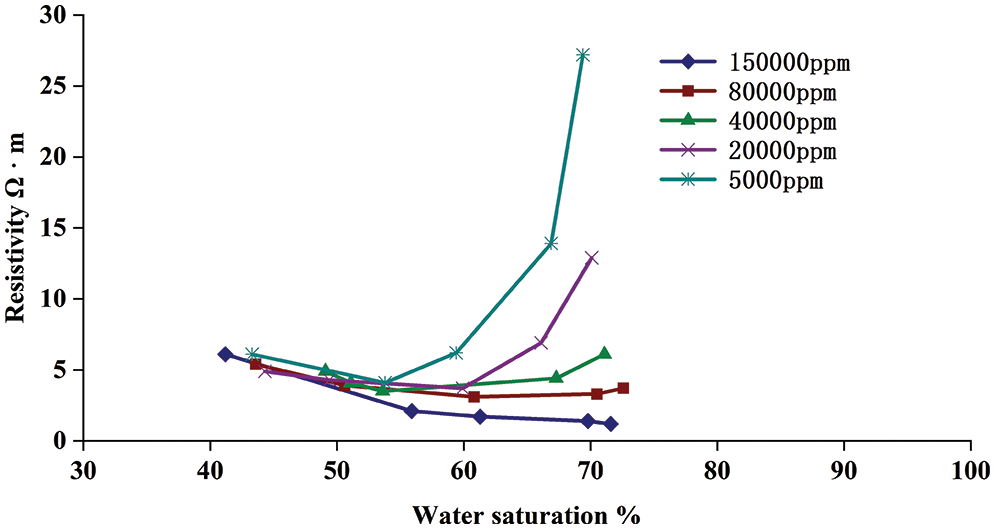
Figure 5: Characteristics of resistivity variation (average Ф19.7%, Perm22.6 mD) of siltstone samples during displacement with different salinities
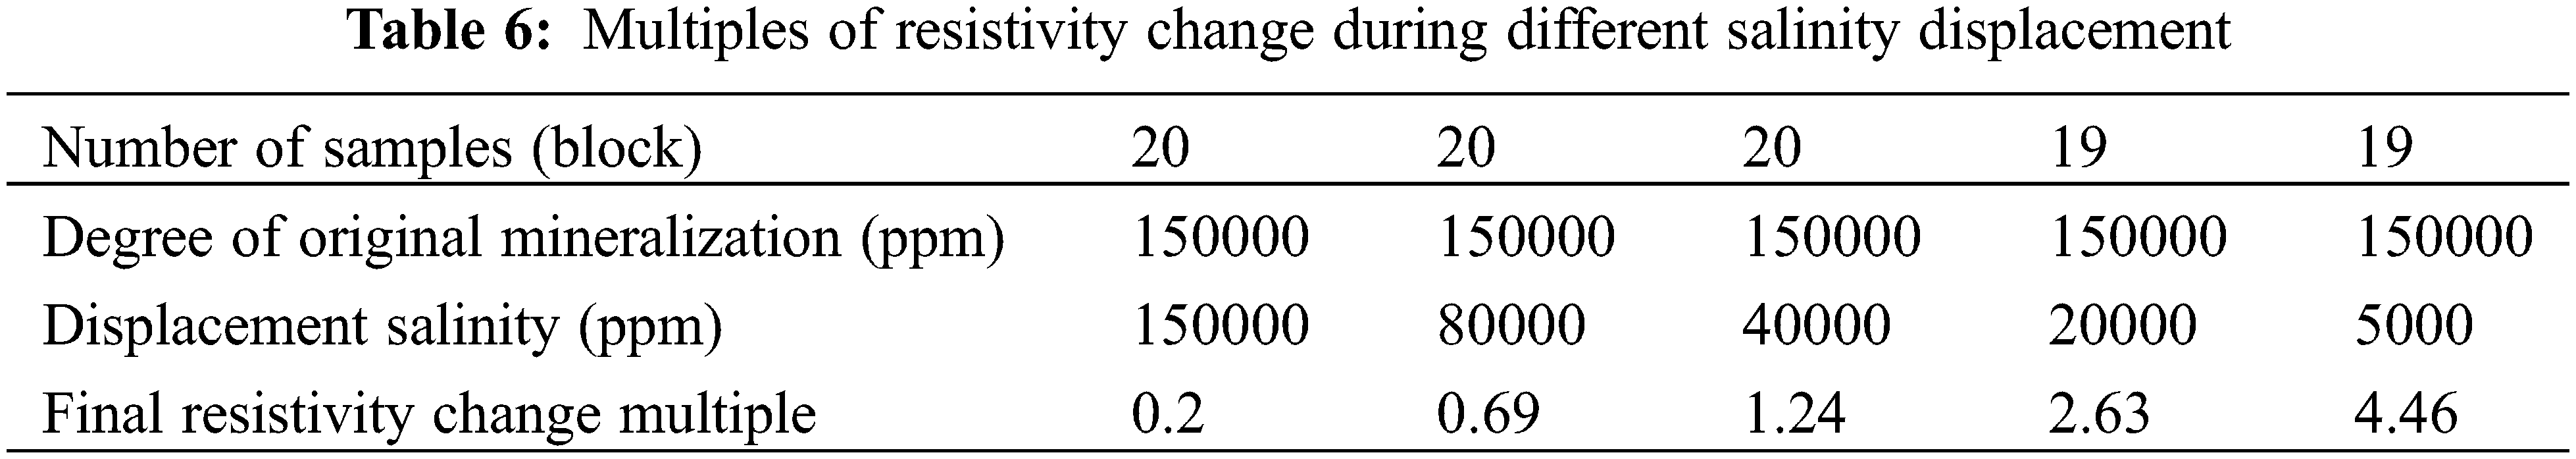
When the saturated oil was displaced by 80000 ppm brine, the resistivity of the rock decreased continuously during the displacement process, and then reached the inflection point at a water saturation of about 70% and gradually increased. The final resistivity was 3.7, which was 0.69 times the original resistivity. The resistivity curve showed an asymmetric U shape. This process basically represented the resistivity variation characteristics of the freshwater displacement process.
When the saturated oil was displaced by 40000 ppm brine, the resistivity of the rock began to decrease first and then rose at the inflection point with a water saturation of about 65%. The final resistivity was 6.1 Ω·m, which was 1.24 times the original resistivity. The range of the ‘U’ shape was slightly larger than that of 80000 ppm.
When the saturated oil was displaced by 20000 ppm brine, the resistivity of the rock began to decrease first and then reached the inflection point at a water saturation of about 59% and began to rise. The final resistivity was 12.9 Ω·m, which was 2.63 times the original resistivity. The ‘U’ shape range was further expanded.
Until the water saturation reached 54% by using 5000 ppm brine, the resistivity decreased to about 4.1 Ω·m. Then, with the increase of water saturation, the measured resistivity gradually increased and finally reached 27.2 Ω·m, which was 4.46 times the original resistivity. The ‘U’ shape range reached the maximum.
In general, as the salinity decreased, the water saturation corresponding to the inflection point of the resistivity from falling to rising became lower, which resulted in the wider ‘U’ type range and the higher terminal resistivity.
As shown in Fig. 6, the critical salinity of the end resistivity consistent with the initial resistivity is 46000 ppm.
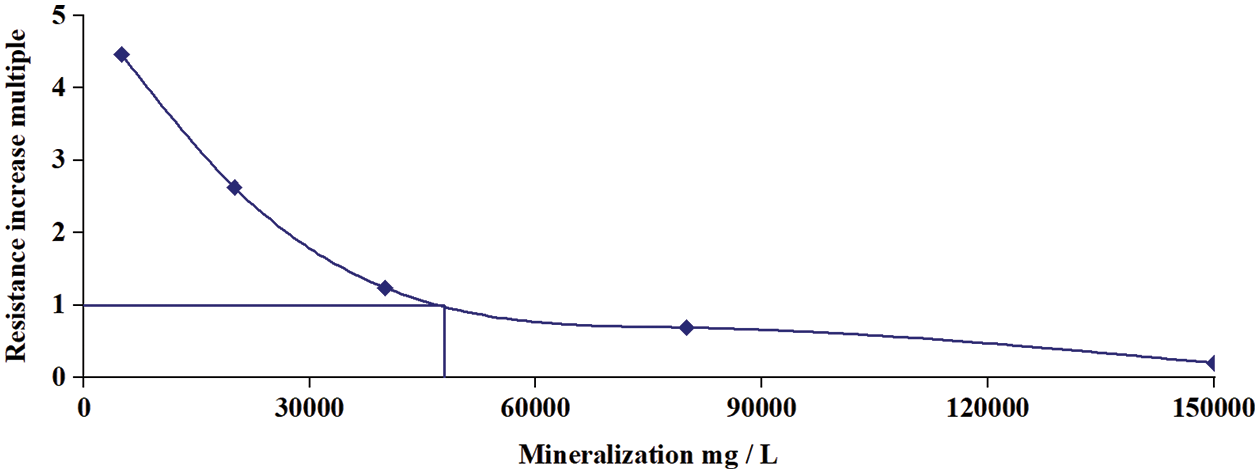
Figure 6: The relationship between the salinity of injected water and the final decrease multiple of rock resistivity
4.3 Analysis of Variations in Resistivity of Different Lithology Samples
Experiments showed that the resistivity of the rock samples had large alternation range and obvious differences. For example, the average resistivity of siltstone rock samples was about 5.5 Ω·m in the case of saturated oil, and the resistivity decreased to 2–3 Ω·m in the later stage following injection of water with a salinity of 160000 ppm. When water with 5000 ppm salinity was used, the resistivity of the rock later increased to 19.2 Ω·m. For fine sandstone samples, the average initial resistivity was 8.7 Ω·m in the case of saturated oil, and the later resistivity dropped to 7–8 Ω·m following the injection of water with a salinity of 150000 ppm. When water with a salinity of 5000 ppm was used, the later resistivity increased to about 35 Ω·m. For medium sandstone samples, the initial average resistivity was 17.5 Ω·m in the case of saturated oil, and the resistivity decreased to 7.4 Ω·m in the later stage when injected with water with a salinity of 150000 ppm. When water with a salinity of 5000 ppm was used, the later resistivity increased to about 66 Ω·m. The average resistivity of gravel-bearing coarse sandstone under saturated oil was 28.3 Ω·m, and the resistivity decreased to 14.1 Ω·m when water with a salinity of 150000 ppm was injected. When water with a salinity of 5000 ppm was used to displace, the later resistivity increased to about 130.3 Ω·m as shown in Table 7 and Fig. 7.

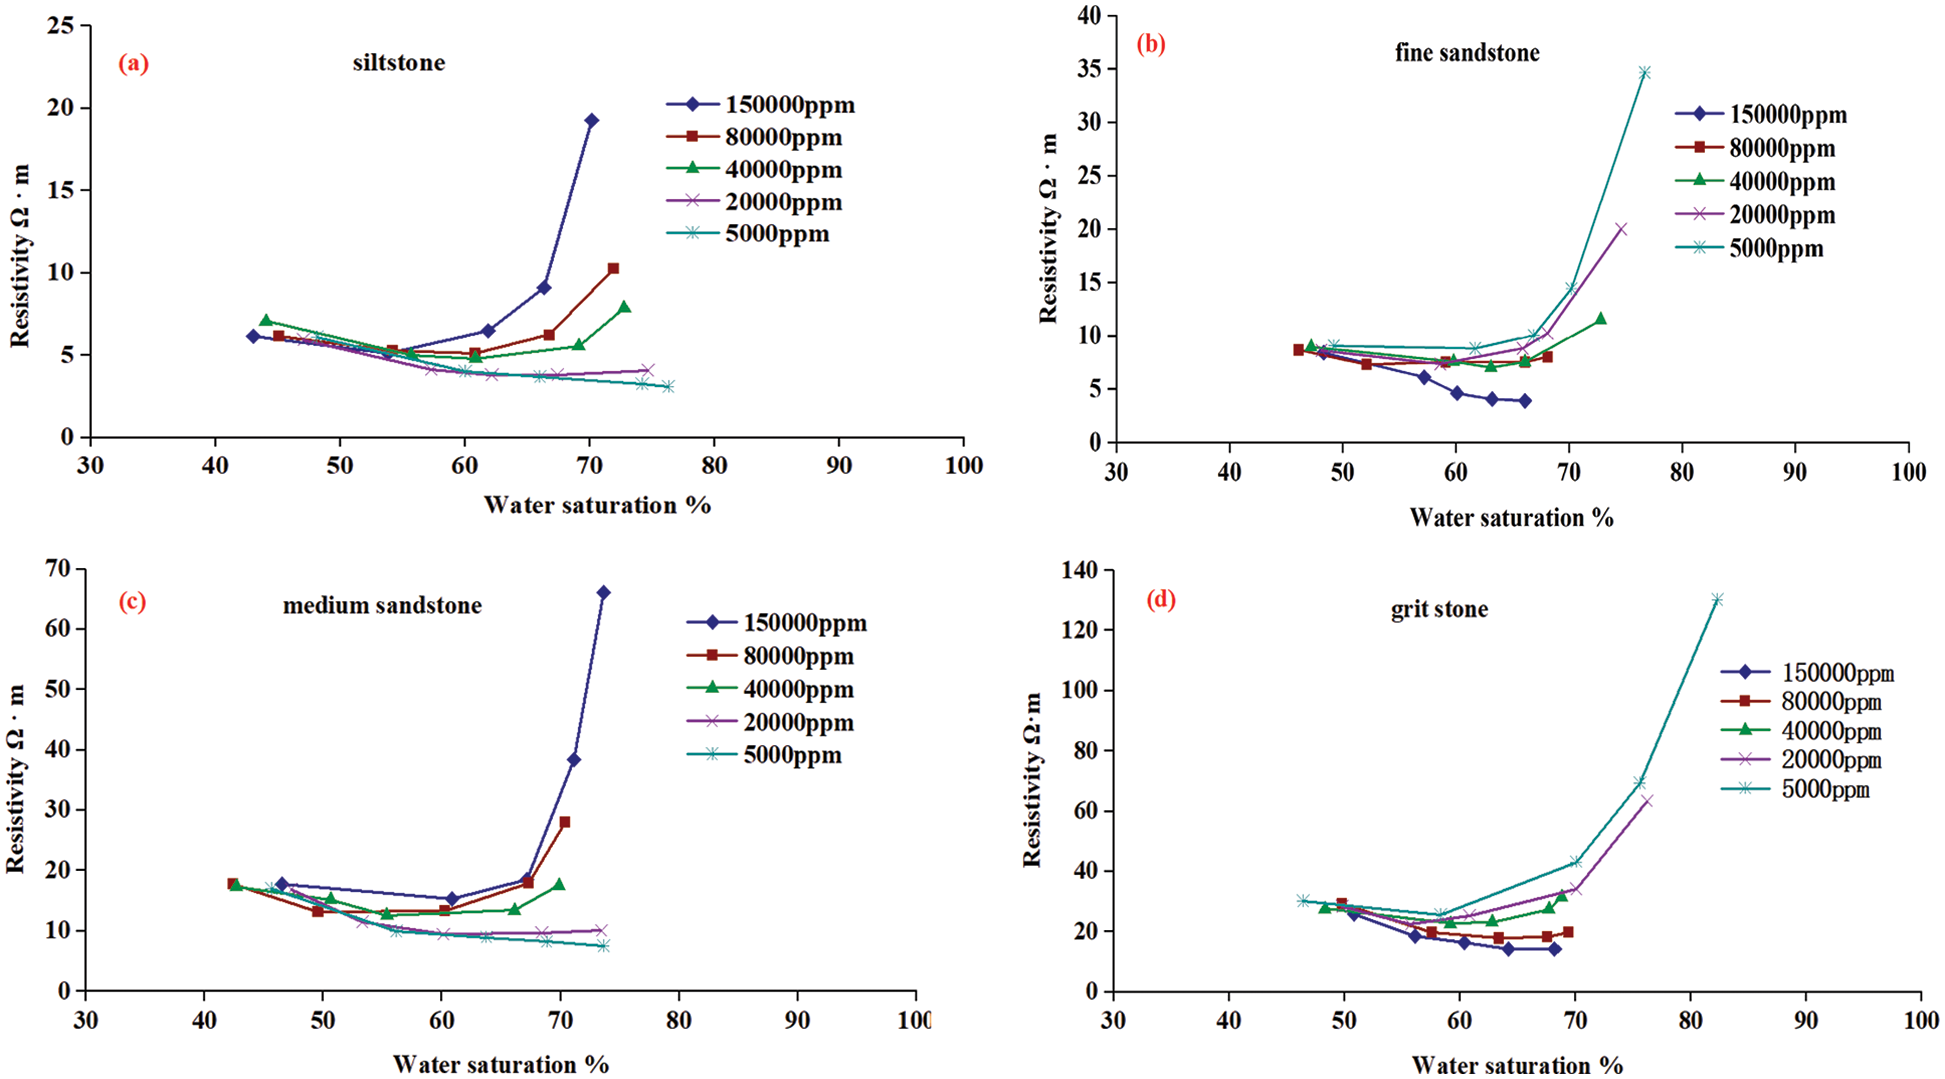
Figure 7: Resistivity variation characteristics of different lithology samples in the different salinity displacement processes
Regardless of the sample lithology, the water saturation corresponding to the inflection point of the resistivity from the drop to the rise became lower with the lower salinity of the injected water and the higher resistivity.
(1) Experimental results showed that in the process of water flooding, the saturation index of rock changed in different stages. In the early stage of water flooding, it was close to the original reservoir saturation index. With the increase of the degree of water flooding, the saturation index increased. In the middle and late stages, the rate of increase slowed down, and there were some differences in the saturation index at each stage of development. In general, the average saturation index of rocks in the development period was slightly higher than that of the original reservoir.
(2) Under the condition of high salinity water injection, the resistivity of rock samples continued to decline. Under the condition of low salinity, the resistivity of the rock sample may eventually change in a ‘U’ shape, forming a shape of initial decline, medium-term gentleness, and later increased. Finally, the resistivity of the sample after water flooding was close to or even higher than the original resistivity. But the lower the salinity the higher the resulting terminal resistivity.
(3) The samples of different lithology showed the phenomenon that the resistivity decreased under the condition of high salinity and the resistivity rose under the condition of low salinity. As the salinity decreased, the water saturation corresponding to the inflection point of the resistivity from falling to rising became lower and the terminal resistivity became higher. The thicker the lithology of the sample, the higher the initial resistivity in the oil-bearing state, and the higher the final resistivity under the same salinity condition.
Prior to the transfer of water injection in September 2004, Yue 395 well was brought on stream in the target interval and maintained a good production rate. Before the injection, the daily oil was still above 10 t and the water content was about 10%. The well has been injected with a salinity water of about 2000 ppm for many years. In 2013, a Yue 395 inclined well was completed nearby the Yue 395 well. The comparison showed that the resistivity of the II-9 layer in Yue 395 inclined well increased significantly more than 2.6 times that of the initial layer, but the water content was 98% after production with a strong waterlogging layer, which was consistent with the experimental results.
Therefore, the high resistance did not mean pure oil layers for the low-salinity water injection reservoir and it was likely to be the strong waterlogging layer. On the one hand, the experimental results reversed the misunderstanding that the resistivity of long-term water injection formation continued to decline. On the other hand, it could guide the identification of waterlogging layers. It is of great significance to define the remaining oil distribution and formulate the next development adjustment plan.
Funding Statement: The authors would like to acknowledge the financial support from the Jiangsu Key Laboratory of Oil-Gas Storage and Transportation Technology (Grant No. CDYQCY202201), and also it was funded by the Key Laboratory of Shallow Geothermal Energy, Ministry of Natural Resources of the People’s Republic of China. The authors thank the anonymous reviewers for their constructive and valuable opinions gratefully.
Author Contributions: As the corresponding author, Hui Xu has conceived the conception/design of the work and supervised the whole experiments. Nannan Liu gave the support of language revision in the manuscript text. As the first author, Jun Li wrote the main manuscript text and has approved the final version to be published; and Li agreed to be accountable for all aspects of the work in ensuring that questions related to the accuracy or integrity of any part of the work are appropriately investigated. Following the design, Jun Li and Hongwei Xiao guided the writing of the article. Xiang Li, Lizhi Wang, Yu Wang and Guofeng Cheng provided all of the experimental materials and sites in the laboratory. Shangping Chen provided assistance with experiments. Nannan Liu and Xing Shi gave the support of language revision in the manuscript text. All authors discussed the results and critically reviewed the manuscript.
Conflicts of Interest: The authors declare that they have no conflicts of interest to report regarding the present study.
References
1. Liu, N., Ju, B., Yang, Y., Brantson, E. T., Wang, J. et al. (2019). Experimental study of different factors on dynamic characteristics of dispersed bubbles rising motion behavior in liquid-saturated porous media. Journal of Petroleum Science and Engineering, 180(1), 396–405. [Google Scholar]
2. Liu, H., Zhao, Y., Luo, Y., Chen, Z., He, S. (2015). Diagenetic facies controls on pore structure and rock electrical parameters in tight gas sandstone. Journal of Geophysics and Engineering, 12(4), 587–600. [Google Scholar]
3. Liu, N., Chen, X., Ju, B., He, Y., Yang, Y. et al. (2021). Microbubbles generation by an orifice spraying method in a water-gas dispersion flooding system for enhanced oil recovery. Journal of Petroleum Science and Engineering, 198(24), 108196. [Google Scholar]
4. Amiri, S., Gandomkar, A. (2019). Influence of electrical surface charges on thermodynamics of wettability during low salinity water flooding on limestone reservoirs. Journal of Molecular Liquids, 277(1), 132–141. [Google Scholar]
5. Gandomkar, A., Rahimpour, M. R. (2017). The impact of monovalent and divalent ions on wettability alteration in oil/low salinity brine/limestone systems. Journal of Molecular Liquids, 248(1), 1003–1013. [Google Scholar]
6. Edo, P., Mohd, S., Syahrir, R. (2017). An integrated workflow to characterize and evaluate low resistivity pay and its phenomenon in a sandstone reservoir. Journal of Geophysics and Engineering, 14(3), 513–519. [Google Scholar]
7. Keshri, S. P., Pati, S. K. (2022). d-Orbital-driven low lattice thermal conductivity in TiRhBi: A root for potential thermoelectric and microelectronic performance. ACS Applied Energy Materials, 5(11), 13590–13599. [Google Scholar]
8. Feng, S., Xie, R., Zhou, W., Yin, S., Chen, J. et al. (2021). The new interpretation of the geological origin about differentiation phenomenon of resistivity in the tight sandstone reservoir. Arabian Journal of Geosciences, 14(20), 1125. [Google Scholar]
9. Bai, Z., Tan, M., Li, G., Shi, Y. (2019). Analysis of low-resistivity oil pay and fluid typing method of Chang 81 Member, Yanchang Formation in Huanxian area, Ordos Basin, China. Journal of Petroleum Science and Engineering, 175(3), 1099–1111. [Google Scholar]
10. Liu, N., Yang, Y., Wang, J., Ju, B., Mahlalela, B. M. (2020). Experimental investigations of single bubble rising in static newtonian fluids as a function of temperature using a modified drag coefficient. Natural Resources Forum, 29, 2209–2226. [Google Scholar]
11. Zhang, J., Revil, A. (2015). Cross-well 4-D resistivity tomography localizes the oil-water encroachment front during water flooding. Geophysical Journal International, 201(1), 343–354. [Google Scholar]
12. Xiao, L., Shi, Y., Li, G., Guo, H., Li, J. (2021). A method to predict the resistivity index for tight sandstone reservoirs from nuclear magnetic resonance data. AAPG Bulletin, 105(5), 1009–1032. [Google Scholar]
13. Xu, B., Wang, Z., Li, G. (2016). Based on rock electrical parameters anisotropy log evaluation method in horizontal well. Journal of Computational and Theoretical Nanoscience, 13(12), 10218–102. [Google Scholar]
14. Hendra, G., W, W., Prihadi, S. (2014). Layer stripping in magnetotellurics (MT) for enhancement of resistivity change effect in reservoir: Equivalence analysis. Journal of Engineering Technology, 52(2), 258–270. [Google Scholar]
15. Liu, R., Duan, Y., Tan, F., Wang, G., Qin, J. et al. (2015). Evaluation on an original resistivity inversion method of water flooding a conglomerate reservoir based on petrophysical analysis. Journal of Geophysics and Engineering, 12(5), 780–792. [Google Scholar]
16. Liu, N., Ju, B., Yang, Y., Brantson, E. T., Meng, S. (2019). A novel method of bidirectional displacement with artificial nitrogen gas cap and edge water for enhanced oil recovery: Experimental and simulation approaches. 37(4), 1185–1204. [Google Scholar]
17. Mohsen, S., Siavash, R. (2016). An investigation into the electrical behavior of oil/water/reservoir rock interfaces: The implication for improvement in wettability prediction. Colloids and Surfaces B-Biointerfaces, 490, 268–282. [Google Scholar]
18. Shemang, E., Nthaba, B., Gareutlwane, O., Molwalefhe, L. (2019). Application of electrical resistivity imaging (ERI) to investigate an oil contaminated experimental site. Environmental Engineering and Management Journal, 18(12), 2623–2634. [Google Scholar]
19. Cheng, F., Yang, Z., Feng, Z., Zhong, Y., Ling, K. (2020). A novel method to estimate resistivity index of tight sandstone reservoirs using nuclear magnetic resonance logs. Journal of Natural Gas Science and Engineering, 79, 103358. [Google Scholar]
20. Gandomkar, A., Rahimpour, M. R. (2015). Investigation of low-salinity waterflooding in secondary and tertiary enhanced oil recovery in limestone reservoirs. Energy Fuels, 29(12), 7781–7792. [Google Scholar]
21. Gandomkar, A., Sheykhneshin, M. G., Nasriani, H. R., Yazdkhasti, P., Safavi, M. S. (2022). Enhanced oil recovery through synergy of the interfacial mechanisms by low salinity water alternating carbon dioxide injection. Chemical Engineering Research and Design, 188(2), 462–472. [Google Scholar]
Cite This Article
 Copyright © 2023 The Author(s). Published by Tech Science Press.
This work is licensed under a Creative Commons Attribution 4.0 International License , which permits unrestricted use, distribution, and reproduction in any medium, provided the original work is properly cited.
 Downloads
 Citation Tools