
 Submit a Paper
 Propose a Special lssue
 Open Access
ARTICLE

Optimal Concentration of the Bubble Drainage Agent in Foam Drainage Gas Recovery Applications
1
Second Gas Production Plant of Qinghai Oilfield Branch, Jiuquan, 736202, China
2
School of Petroleum Engineering, Yangtze University, Wuhan, 430100, China
3
Petrochina Multiphase Flow Laboratory of Gas Lift Innovation Cente, Wuhan, 430100, China
* Corresponding Author: Guowei Wang. Email:
Fluid Dynamics & Materials Processing 2023, 19(12), 3045-3058. https://doi.org/10.32604/fdmp.2023.029810
Received 09 March 2023; Accepted 26 May 2023; Issue published 27 October 2023
 View Full Text
 Download PDF
Abstract
Foam drainage is the flow of liquid through the interstitial spaces between bubbles driven by capillarity and gravity and resisted by viscous damping. The so-called foam drainage gas recovery technology is a technique traditionally used to mitigate the serious bottom-hole liquid loading in the middle and late stages of gas well production. In this context, determining the optimal concentration of the bubble drainage agent is generally crucial for the proper application of this method. In this study, a combination of indoor experiments and theoretical analysis have been used to determine the pressure drop related to the foam-carrying capacity in a representative gas field. Dynamic and static experiments were designed with a bubble drainage agent concentration varying in the range 0.3%–0.6%. Using the field formation water data, the optimal soaking agent concentration was obtained and pressure drop test experiments on the foam carrying capacity were conducted accordingly. These tests have revealed that the optimal foam displacement agent concentration is 0.5%, and the foam quality at the optimum concentration is between 0.78–0.98. A theoretical method for calculating the pressure drop at the optimum soakaway concentration based on experimental data has also been introduced. The error of the proposed method is within 15% compared to the experimental measured value, demonstrating that it is highly accurate and simple.Keywords
A soakaway is an easy-to-operate and low-investment cost drainage gas recovery measure commonly used in the initial stage of gas well fluid accumulation [1,2]. A soaking agent is added from the wellhead, and the bubbling solution is mixed with the wellbore fluid by airflow agitation. The fluid at the bottom of the well becomes a lighter foam and is carried out of the wellhead. To improve the foam carrying efficiency, the first step is to optimize the foam concentration; only at the optimum concentration will the foam-carrying effect be optimal. The selection and static evaluation of the bubbling agent for gas wells have been studied by several scholars. Yan et al. [3,4] conducted a static and dynamic evaluation of the widely used UT-11C soaking agent and found that there is an optimal soaking agent concentration, optimal temperature, and mineralization range. Key [5] tested two types of soaking agents, UT-6 and XM-3D, used in the Nanbu 5 gas well for oil resistance, pressure resistance, high-temperature resistance, and fluid-carrying capacity. They found that the appropriate bubble drainage agent should be selected for bubble drainage gas extraction according to the characteristics of gas production and liquid production, mineralization, temperature, and oil output of different gas fields. Zhang et al. [6,7], through experiments, found that pressure affects the foam volume. As the pressure increases, the foam volume becomes smaller, the number of foam structures per unit volume increases, and the likelihood of the foam reaching the same height in the wellbore decreases. Condensate and pressure both have a certain impedance effect on the foaming performance of the foaming agent. Therefore, when selecting the soaking agent, it is important to first determine whether the target gas field contains condensate. In our investigation, we found that Block X does not contain condensate. The earlier mentioned scholars only analyzed the suitability range and suitability of soaking agents. However, the scholars did not select the optimal concentration of the soaking agent for different blocks of gas wells to maximize the discharge of the wellbore fluid.
Once the optimal soaker concentration for the block is determined, gas wellbore pressure prediction is performed at the optimal soaker concentration as an important basis for production parameter design such as the determination of soaker buildup and soaker refill amount. This phenomenon is different from the gas-liquid two-phase flow. It appears as a non-Newtonian fluid state, and its flow pattern is no longer the conventional gas-liquid two-phase flow pattern. Thus, using the conventional gas-liquid two-phase flow pressure drop calculation method will lead to large errors [8,9]. Mitchell [10] and Princen [11] investigated the changes in foam structure, viscosity, and dynamic shear stress with foam mass variation. They derived a close relationship between the flow pattern of the foam fluid and foam mass. Aziz et al. [12] and Metzner et al. [13] concluded that the friction coefficient of a power-law fluid exhibiting laminar flow in a circular tube can be calculated as laminar flow and gave the relevant equation. Deshpande et al. [14] obtained a modification of the Colebrook equation to fit the exact power-law behavior of the foam friction coefficient. Cheng et al. [15,16], through indoor simulation experiments, analyzed the pressure drop in the wellbore of bubble drainage wells with the presence of bent pipes to obtain the pressure drop calculation method suitable for bent pipes. The pressure drop calculation method of the mentioned scholars was established based on a foam mass of 0.78–0.98, and the scholars believed that there is no slip in the foam flow at this time. In the present study, the gas-liquid slip was observed by a high-speed camera in this interval, which is consistent with the observations of Buslov et al. [17] and Soni et al. [18], among others. To address this phenomenon, the present study conducted indoor bubble discharge simulation experiments based on the preferred bubble discharge agent concentration. The corresponding flow pattern conversion limit and pressure drop calculation method considering slip were established through the simulation experiment. This will provide theoretical guidance for optimizing work regimes such as soakaway refill volume and refill period to extend gas well production and maximize the benefits of gas well production.
2 Dynamic and Static Evaluation Methods and Analysis of Soaking and Draining Agents
To improve foam carrying efficiency, dynamic and static evaluation methods are often used to assess the foam displacement agent and obtain the optimal concentration. Static evaluation of foam involves testing foam initiation and stabilization performance to determine the concentration of foam displacement agent that exhibits good foaming and stabilization performance. In this paper, we conducted static evaluation experiments using the stirring method. On the other hand, dynamic evaluation of foam involves testing the foam carrying capacity, commonly evaluated by pressure drop and liquid carrying capacity. These tests were conducted using indoor simulation experiments. By using these two methods, we finally obtained the optimal foam displacement agent concentration to maintain the foam carrying efficiency.
2.1 Static Evaluation Analysis of Soaking Agents
The soaking and draining agent QH-MX, was selected for dynamic and static evaluation. The temperature range was set from 30°C–80°C. In this experiment, we prepared the corresponding formation water based on the formation water data of Block X in the Qinghai area, the details of which are presented in Table 1. We evaluated the foaming height and stability of the foam using the stirring method and measured the foam height at 0, 5, and 10 min. To maintain a constant temperature, a constant temperature oven was used to heat the foam discharge during the process. The results of the static evaluation test are shown in Fig. 1.
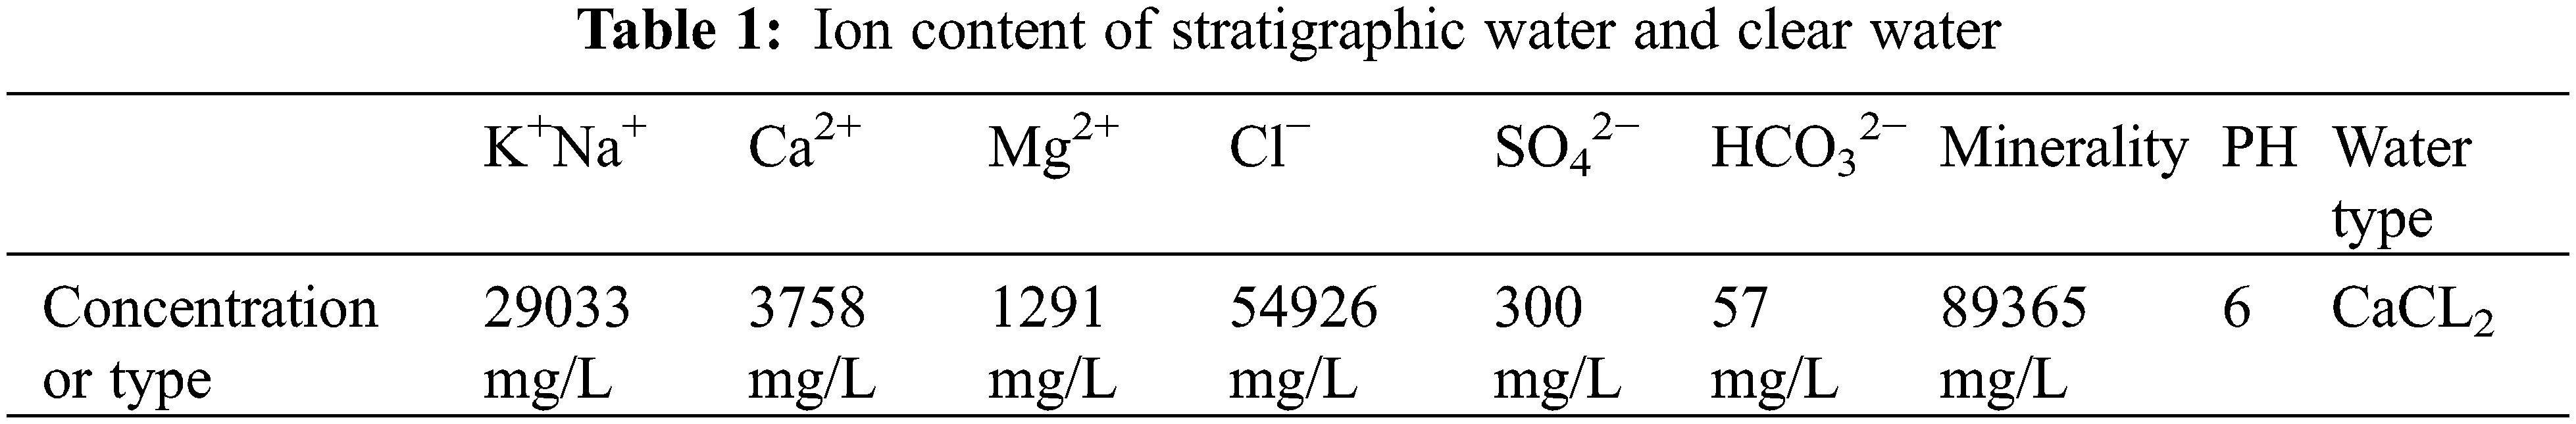
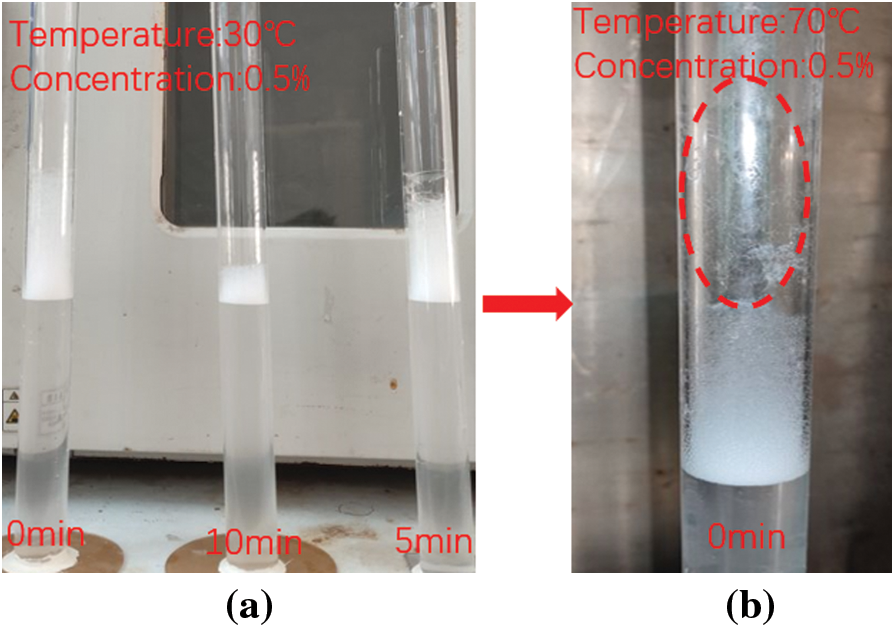
Figure 1: Experimental foam initiation and stabilization performance
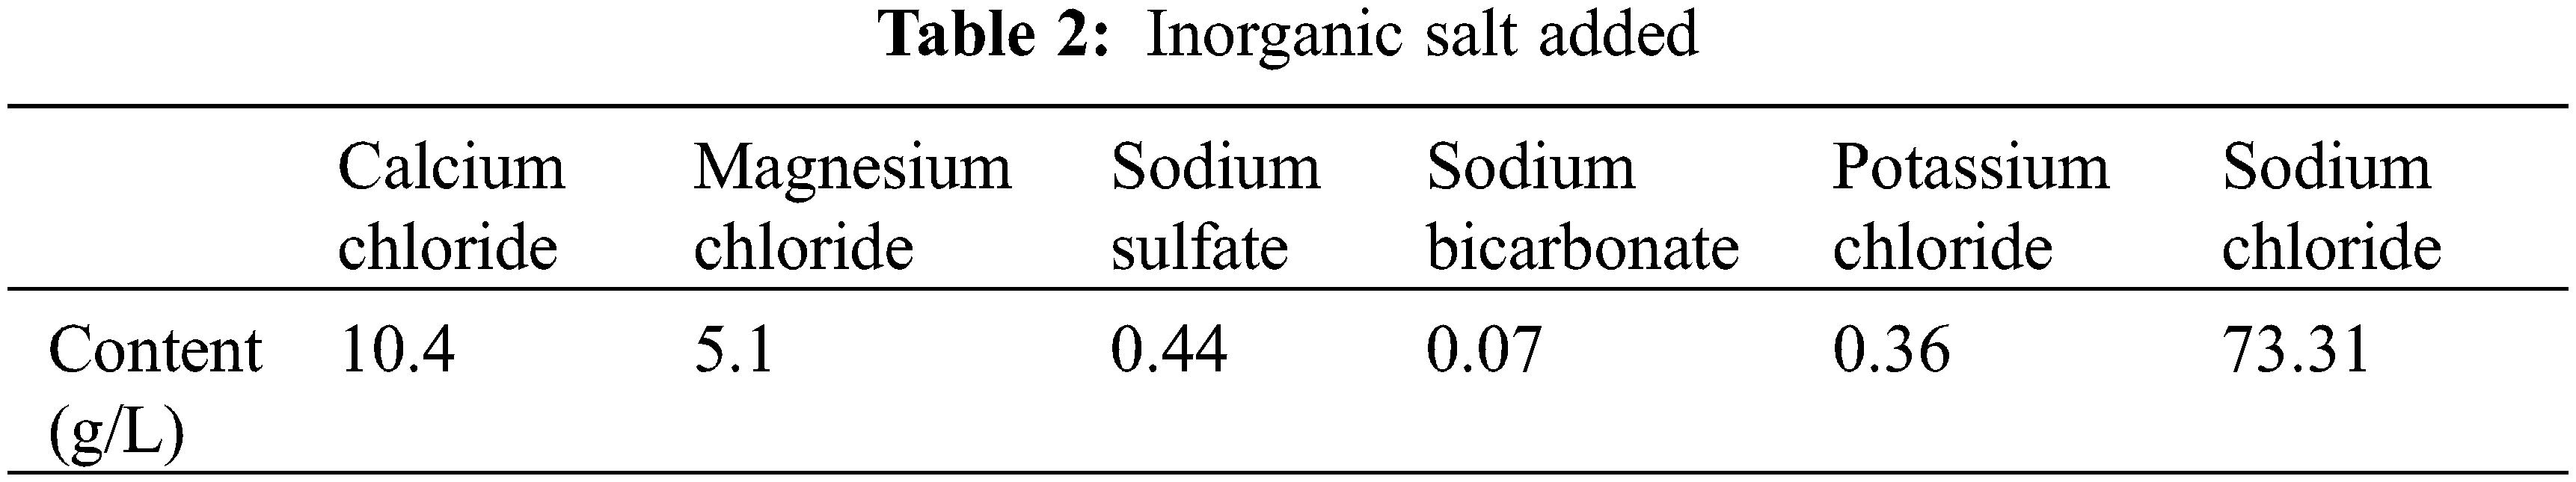
From the information of the ionic content of formation water presented in Table 1, it was calculated that five specific inorganic salts were to be added, which were calcium chloride, magnesium chloride, sodium sulfate, sodium bicarbonate, potassium chloride, and sodium chloride. The specific contents of these inorganic salts are presented in Table 2.
As shown in Fig. 1a, the QH-MX foam dispersant mixed with water can form stable foam of a certain height. The upper part of the foam column has fewer foam bubbles, and the foam liquid film is thin, showing a filamentous structure. Fig. 1b shows that when the temperature reaches 70°C, the foam height gradually decreases, and the filamentous part becomes longer, indicating that the foam has started to become unstable. This happens because at 70°C, the foam film becomes thin due to instability, resulting in decreased foam strength, and some parts of the foam structure are not strong enough to withstand gravity acting on the foam. Therefore, the foam shows a filamentous shape.
As shown in Fig. 2, the highest foaming height is consistently achieved at a foaming agent mass fraction of 0.5% under varying conditions of formation water and temperature. However, as the temperatures increase higher than 70°C, the foaming effect decreases at higher concentrations. This is due to the instability of the foam at such high temperatures, which causes a decrease in the foaming height as the temperature continues to increase. Therefore, the optimal concentration of the foam dispersant is 0.5%. Additionally, as also shown in Fig. 2, the QH-MX foaming agent at a 0.5% mass fraction remains relatively stable at 5 and 10 min as the temperature increases, with the foam height remaining around 27–30 cm, indicating that the foam stabilization is the best at this foam dispersant concentration. In summary, based on the analysis of foaming ability, foam stabilization, and temperature sensitivity, we conclude that a mass fraction of 0.5% of QH-MX foaming agent is the optimal concentration for this application.
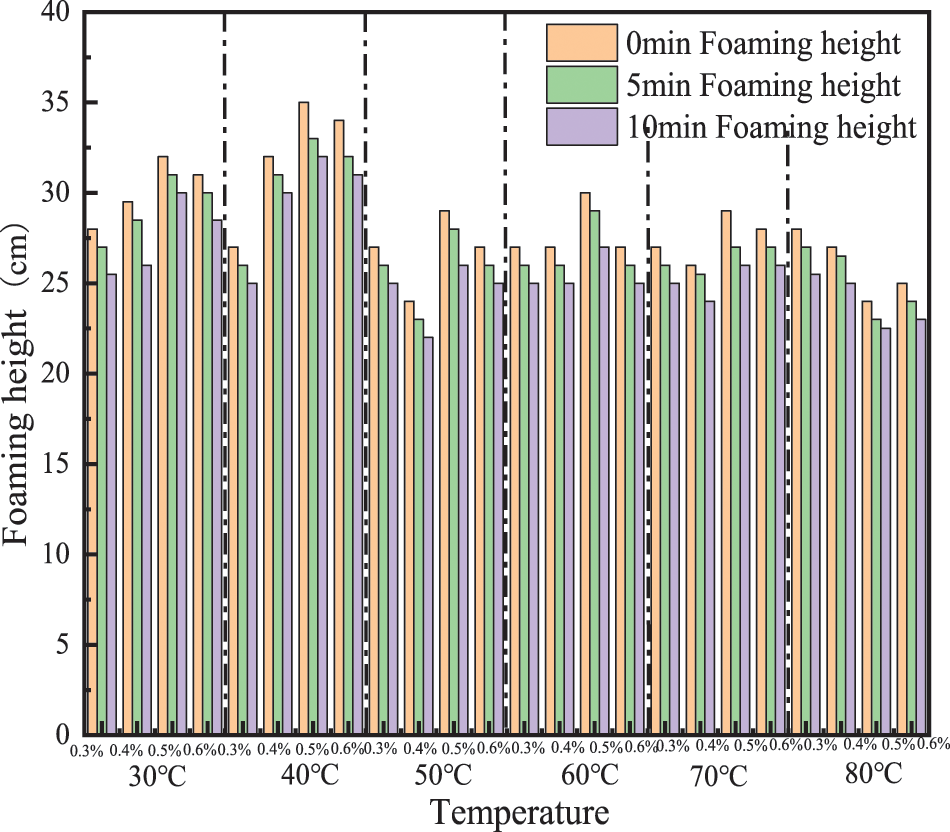
Figure 2: Bubble stability test chart
2.2 Dynamic Evaluation Analysis of Foam Dispersants
For the dynamic evaluation of foam displacement efficiency, two parameters were selected; pressure drop and liquid-carrying capacity. The pressure drop reflects the energy loss of the foam displacement agent, while the liquid-carrying capacity reflects the size of the effervescent agent’s liquid-carrying capacity. The experimental data for both parameters are shown in Fig. 3.
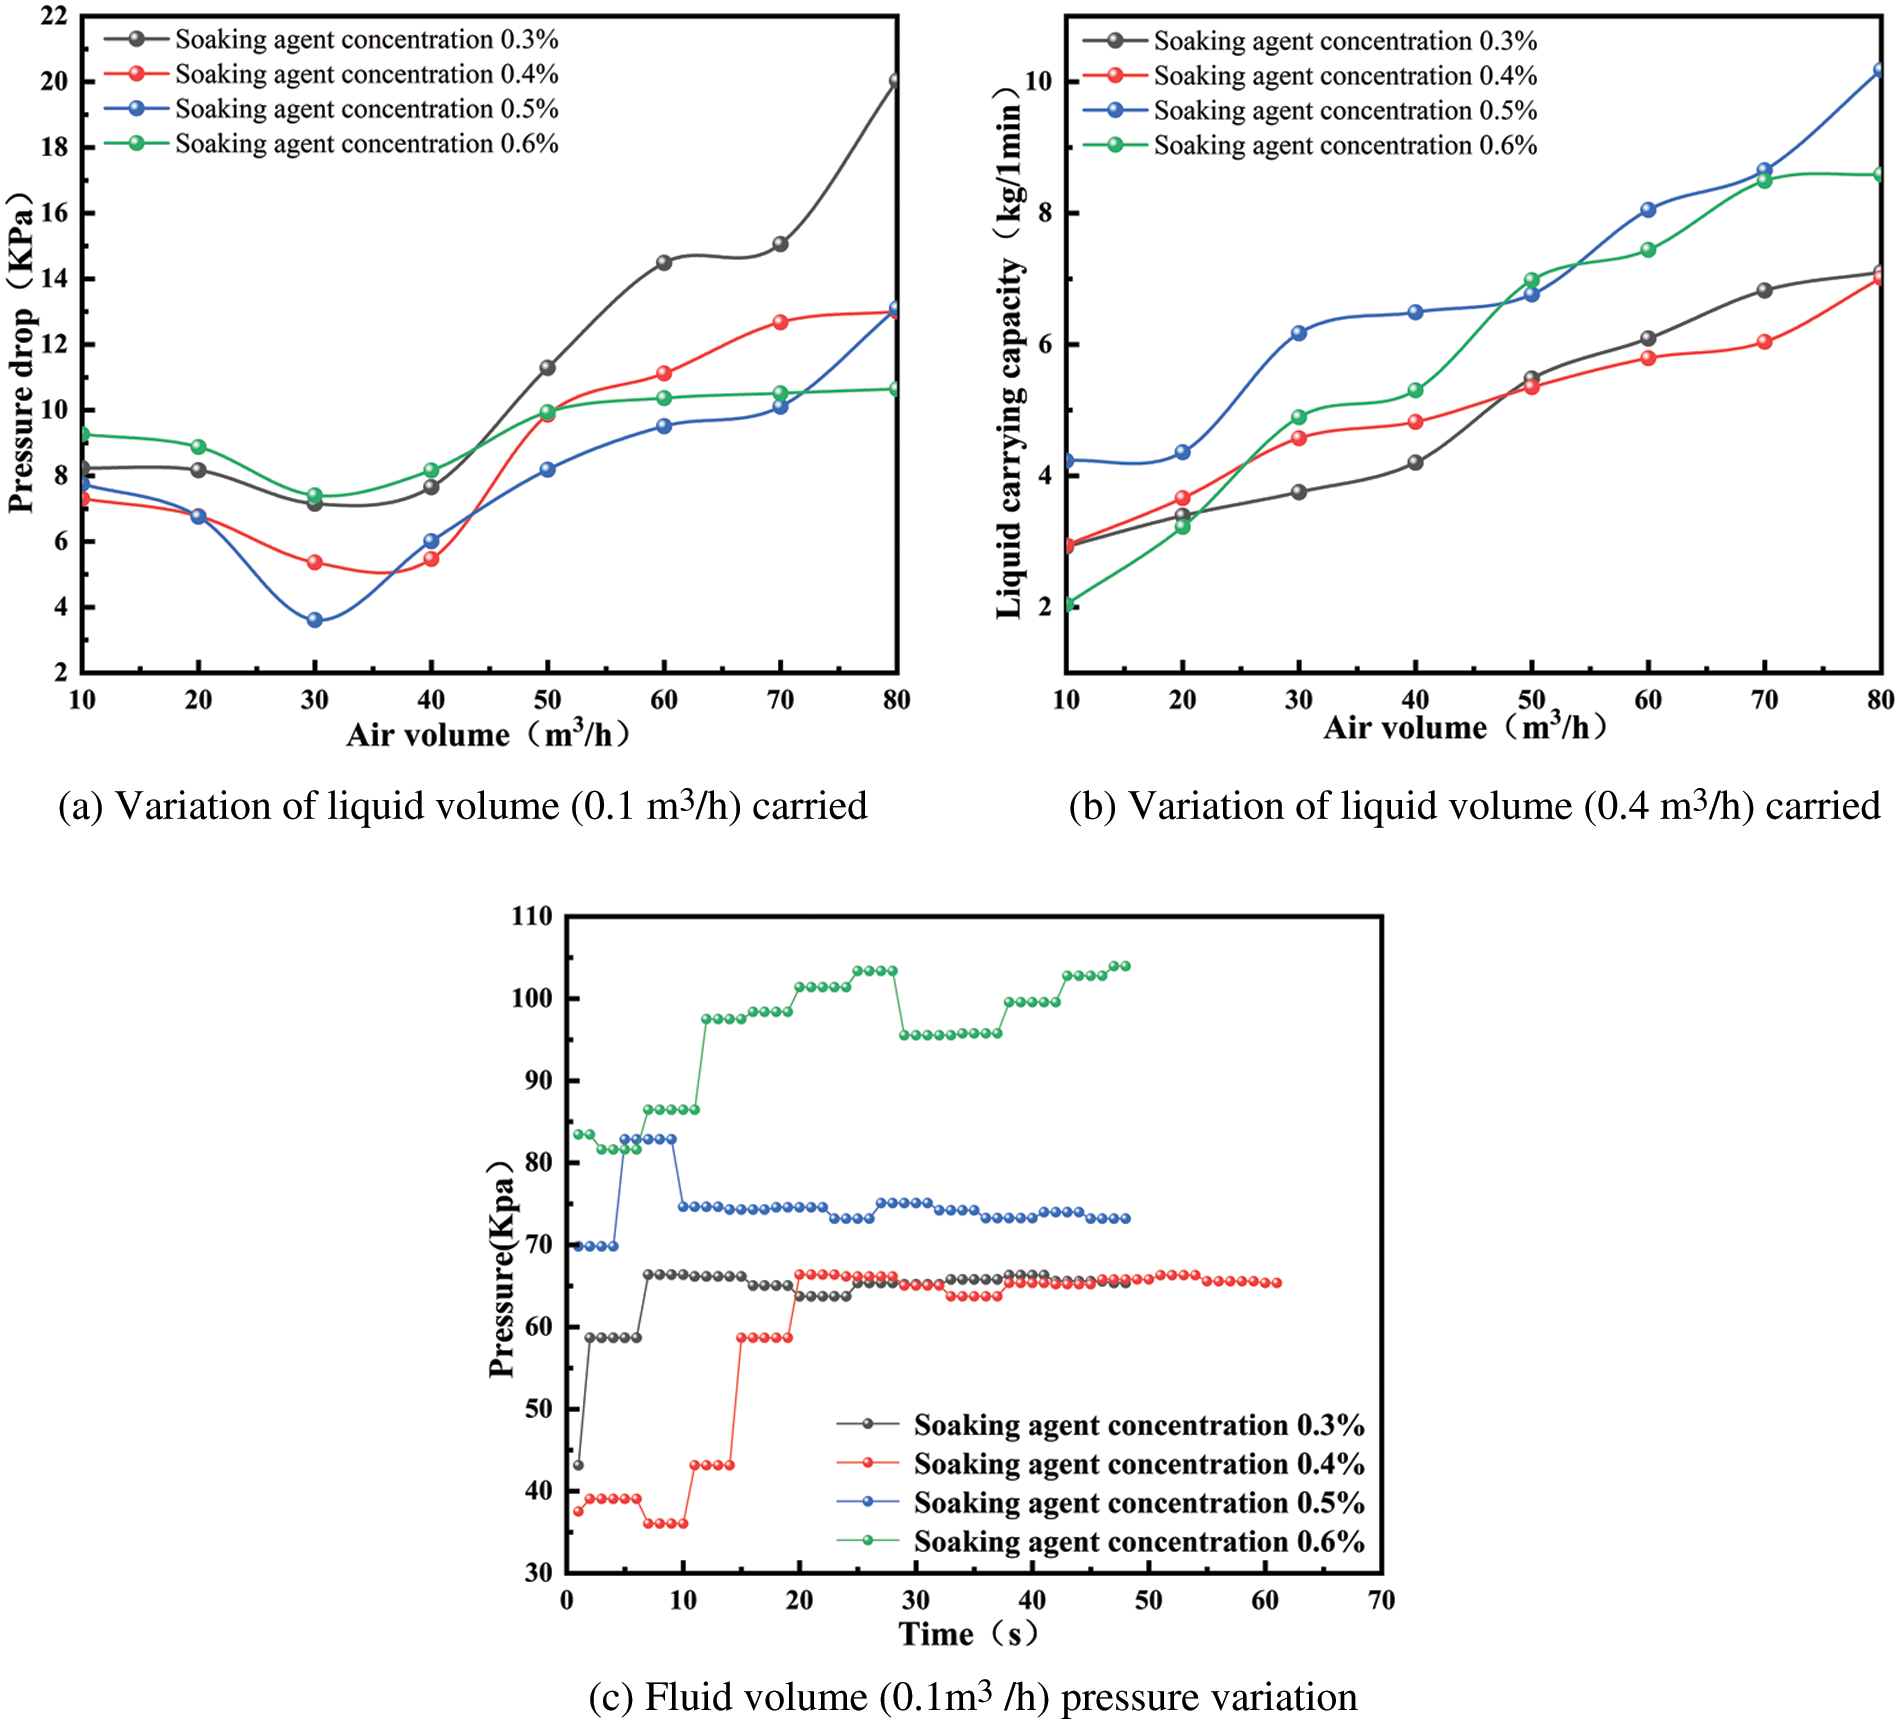
Figure 3: Dynamic evaluation of the soaking agent for variations in liquid volume carried and pressure
At a liquid volume of 0.1 and 0.4 m3/h with a mass fraction of 0.5% soaking agent, the wellbore pressure drop loss is the smallest and the liquid carrying capacity is the strongest. Therefore, this concentration is optimal for the soaking agent. However, when the concentration of the bubbling agent is higher than the optimal concentration, the liquid accumulates at the bottom of the well and comes in contact with the bubbling agent. As a result, the soaking agent is stirred by the airflow, and the bubbling agent bubbles below the bubble injection port, generating a large amount of water-containing foam from the bubble drainage fluid. The foam is driven by the gas to the vertical section in the middle and upper section, forming secondary foams that accumulate in the wellbore due to the limited lifting capacity of the gas. The collected foam forms a plug in the wellbore, which prevents the liquid from being carried out and results in a high density of water-bearing foam. This phenomenon is more evident in Fig. 3c, where at a foam concentration of 0.6%, the foam forms a plug in the middle and upper part of the wellbore. The pressure fluctuation in the middle and upper part of the wellbore becomes larger, and the pressure value is significantly higher than the other foam discharge agent concentrations, leading to a reduced total pressure drop in the wellbore. Conversely, when the concentration of the bubbling agent is lower than the optimal concentration, the bubbling agent foams incompletely under airflow stirring, and the foaming agent forms less foam. The pressure change in the middle and upper part of the wellbore is gentle, leading to a larger total pressure drop in the wellbore and weaker liquid carrying capacity. Therefore, a QH-MX foaming agent mass fraction of 0.5% is the optimal concentration for the foaming agent.
3 Flow Pattern Analysis of Air-Water Bubble Three-Phase Flow
Accurately determining the wellbore flow pattern is a prerequisite for modeling the pressure drop in the bubble row wellbore. This is because the different flow patterns exhibit different foam qualities and there is a slip of the foam phase with the gas phase. Therefore, it is necessary to accurately determine the flow pattern before proceeding with pressure drop modeling. This will help determine the foam mass and whether the foam phase appears to slip with the gas phase at the current operating conditions.
The formula for calculating the foam mass at room temperature and pressure is given by Eq. (1).
where
Foam mass
In the experiment, we used a 500 ml beaker was used to collect the foam. Once the beaker was filled with foam, a small amount of defoamer of known volume was added to the foam. The foam mass was then calculated as the ratio of 1 minus the volume of liquid collected in the beaker to 500 ml. We measured the foam mass of each group using this method. The results of the foam mass calculations are shown in Fig. 4.
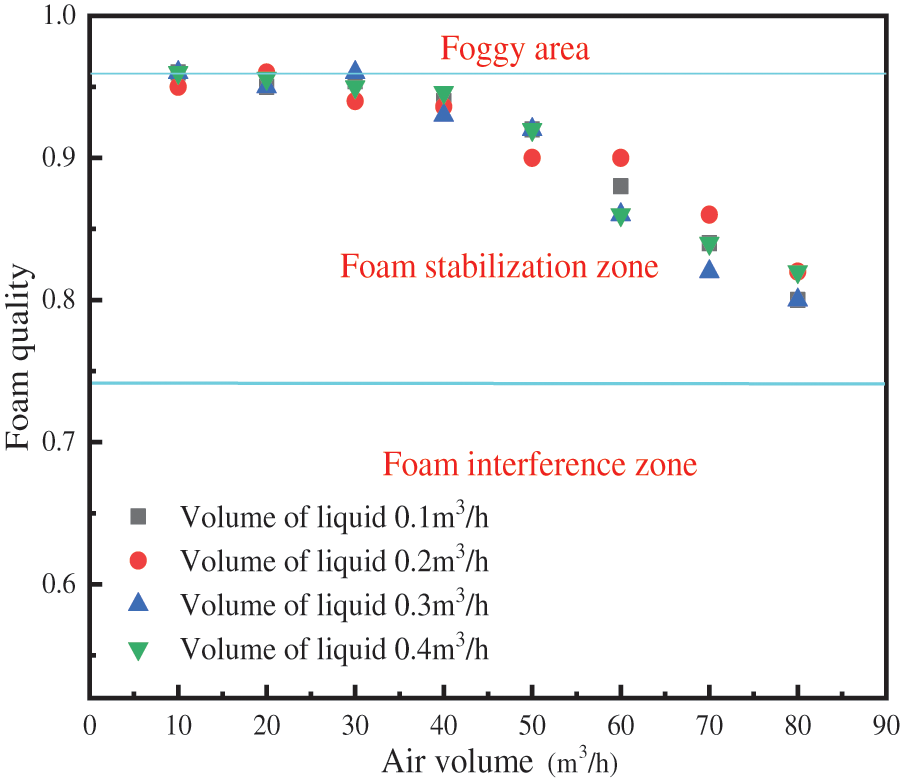
Figure 4: Foam quality test chart
All the foam quality test results fell within the range of 0.74–0.96, which represents the stable foam zone. As the gas volume increases, the foam mass tends to decrease. This is because, at low gas volumes, the gas phase has insufficient energy to carry the liquid phase away from the wellbore, resulting in the liquid phase falling back and creating repeated stirring between the gas and liquid phases with a large contact area. This promotes complete foaming of the foaming agent, leading to higher foam quality, especially when the gas volume is less than 30 m3/h. As the gas volume increases, the gas can lift the liquid to the wellhead, reducing the contact area between the foaming agent and the liquid phase, which results in incomplete foaming of the foaming agent and a decrease in foam quality.
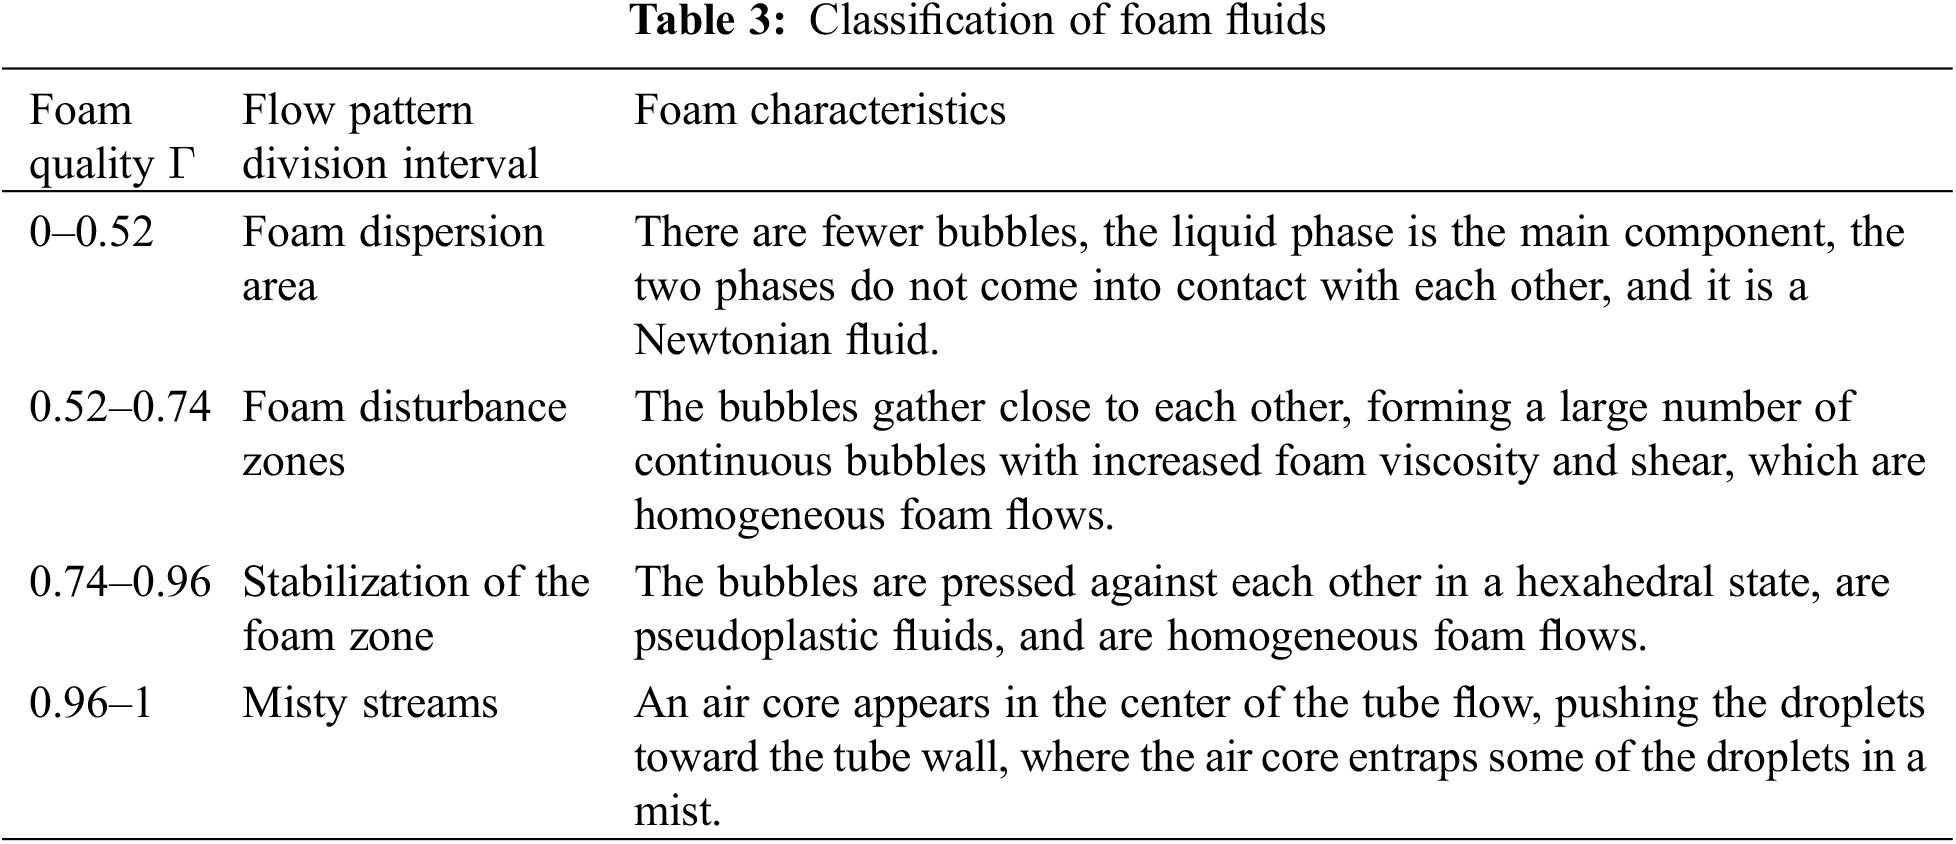
Through experiments, we found that there are various flow patterns, such as foam annular flow, foam stirring flow, foam segment plug flow, and continuous foam flow, when the foam falls within the traditionally considered foam stabilization zone. Table 4 summarizes the relevant characteristics of the foam flow pattern and foam mass range.
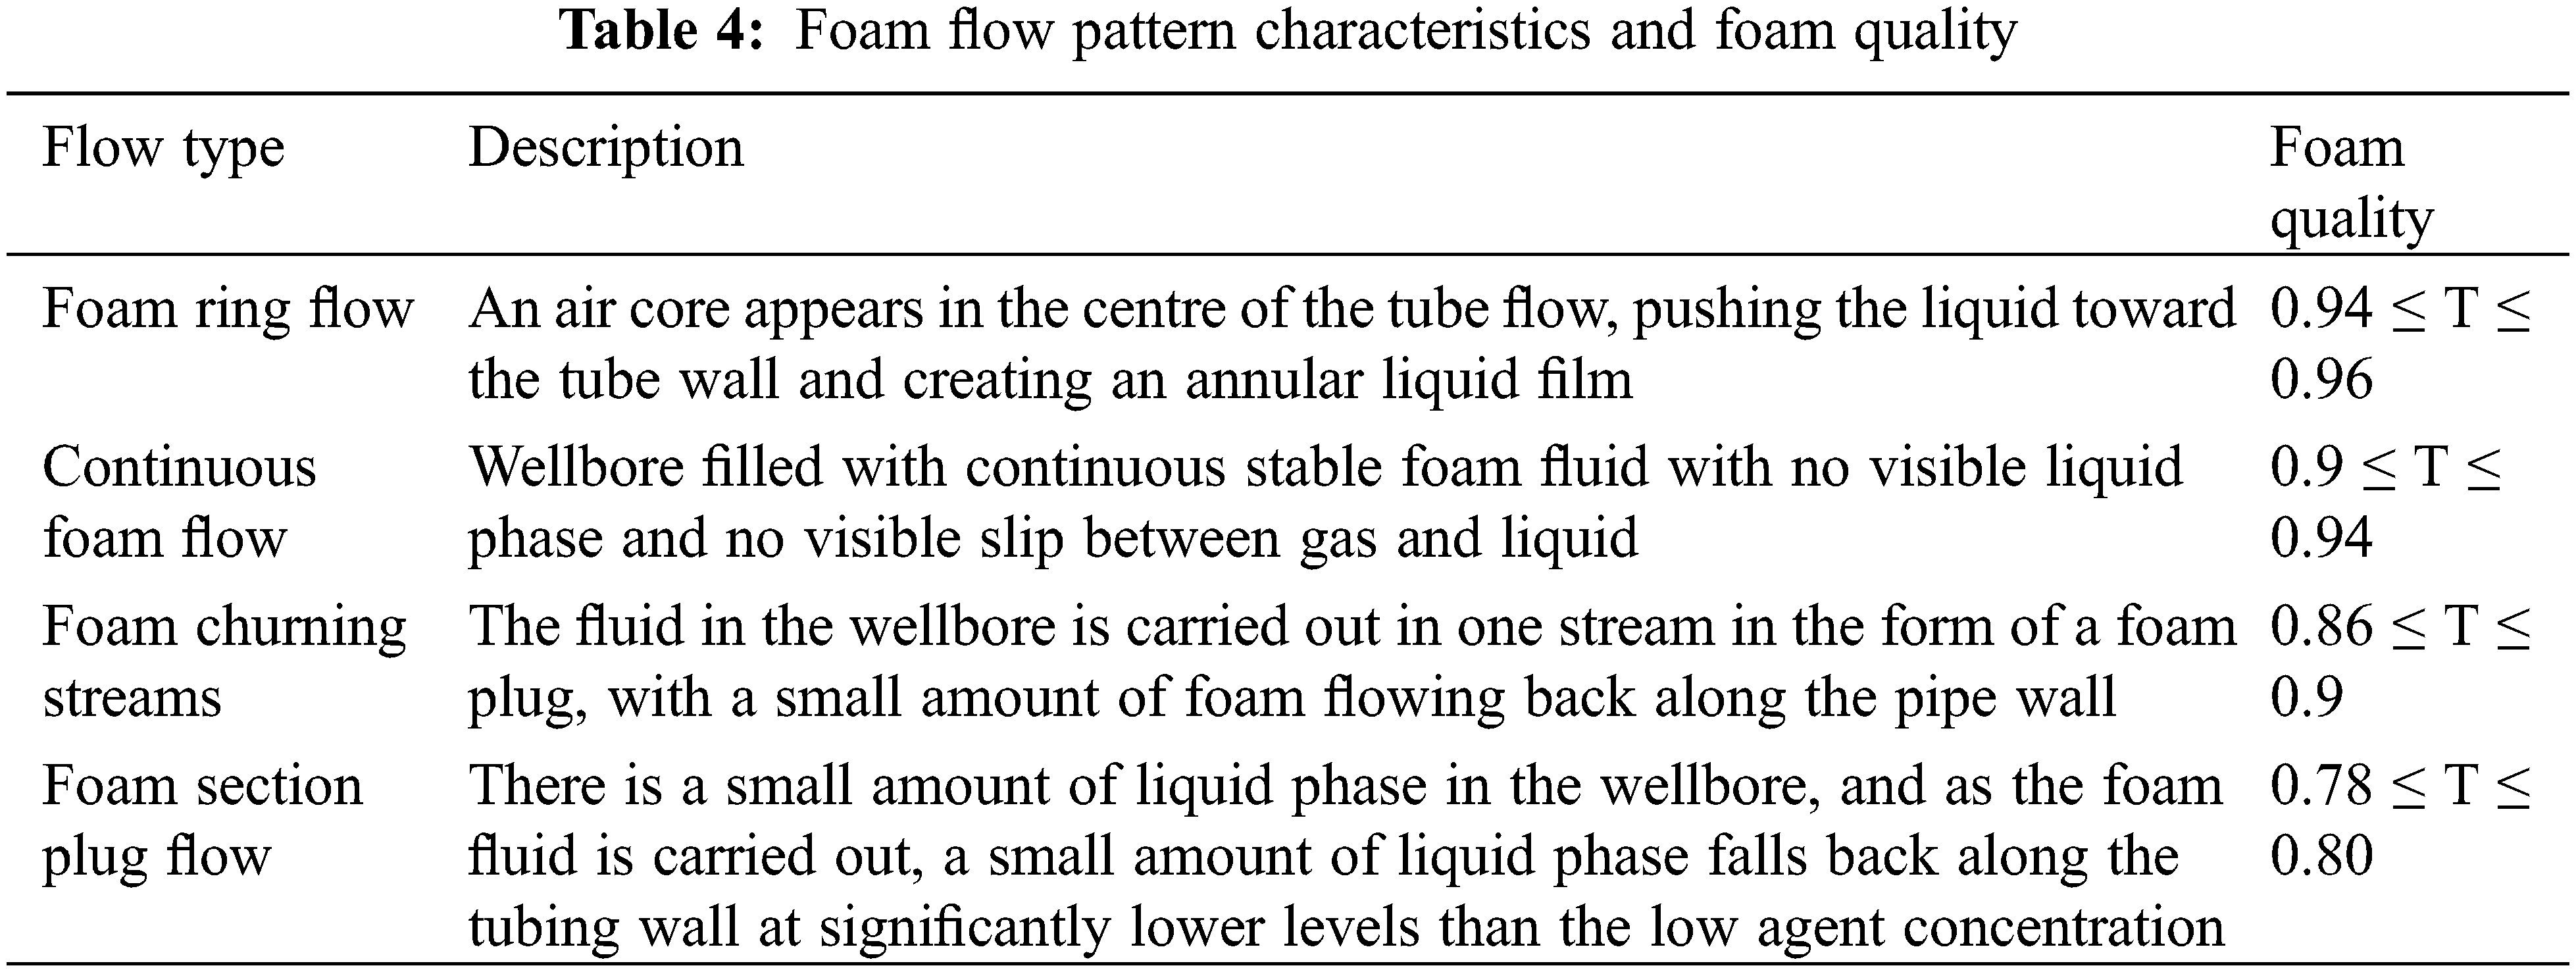
We observed the corresponding foam mass flow pattern using a high-speed camera, as shown in Fig. 5. With the increase in gas volume, the foam gradually changed from foam segment plug flow → foam stirring flow → continuous foam flow → annular flow in sequence. The foam masses in this process are all between 0.78–0.96.
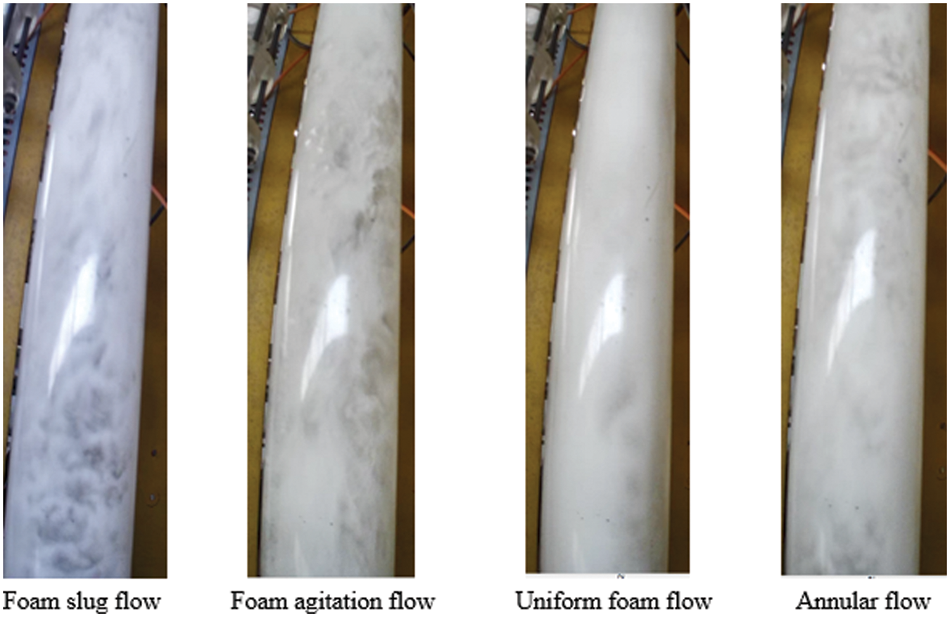
Figure 5: Foam flow pattern diagram
4 Modeling of Pressure Drop in Air-Water Bubble Three-Phase Flow
Prior to studying the pressure drop model, we conducted research on commonly used pressure drop models and utilized experimental data to validate them. In case the validation result shows significant errors, we plan to develop a new pressure drop calculation method.
A review of extant literature indicated that three pressure drop calculation methods, namely the Cheng Jinjin method [8], Govier and Metzner method [12,13], and the Deshpande method [14], are commonly used in this field. Since the foam fluid belongs to non-Newtonian fluids, it differs from a Newtonian fluid. Previous researchers have proposed the concept of apparent viscosity to address this issue. All three calculation methods are based on the concept of apparent viscosity and have obtained the friction coefficient calculation method. The pressure drop calculation methods proposed by these researchers were also obtained under their respective corresponding working conditions, and the prediction accuracy is high under the respective working conditions. Therefore, we validated the three methods under the current operating conditions of the gas well, and the results of our validation are shown in Fig. 6.
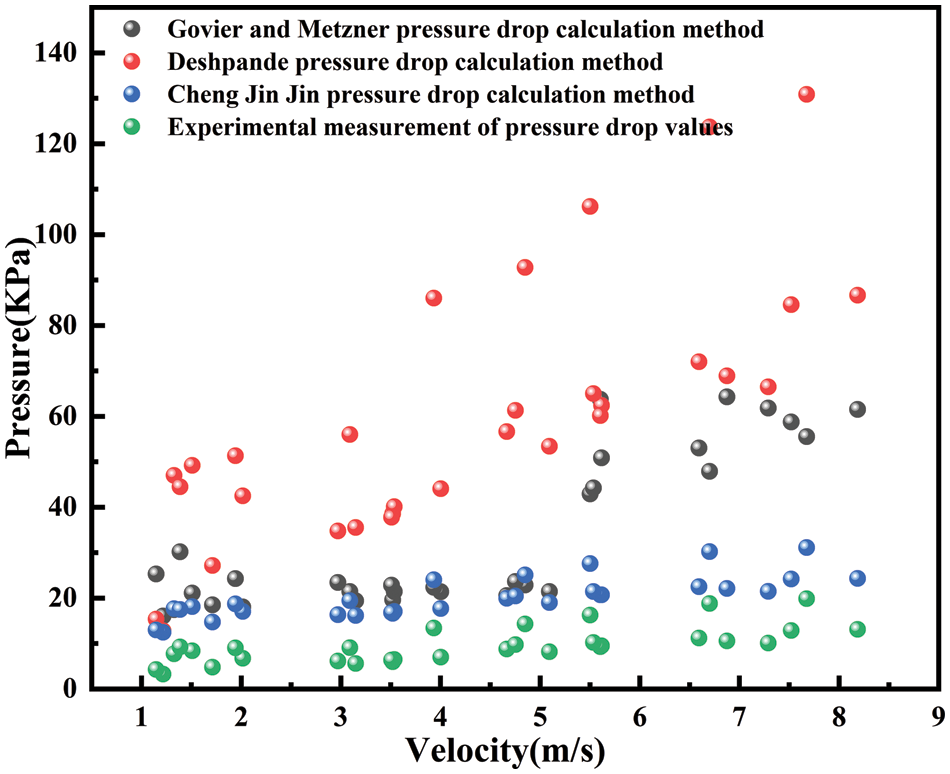
Figure 6: Validation of pressure drop calculation method
The calculated values from the three methods obtained from the literature have a large error compared to the experimentally measured pressure drop. This is because different bubbling agents were used in the three methods, which have different physical properties such as viscosity and surface tension. Additionally, the amount of gas and liquid produced, as well as the ion content in the formation water, also vary across different gas wells, leading to significant discrepancies. Therefore, the three methods could not be used to predict the pressure drop in the Block X soakaway well. A new pressure drop prediction method needs to be established for different working conditions with different bubbling agents.
4.2 Pressure Drop Calculation Method Set Up
We found that the optimal concentration of the QH-MX soaking agent is 0.5% by mass, through dynamic and static evaluation experiments. However, the existing pressure drop calculation method cannot accurately predict the pressure drop value in the soakaway well at this concentration. Therefore, we needed to establish a new pressure drop calculation method specifically for this concentration of QH-MX soaking agent.
The vertical section pressure drop is mainly composed of gravitational pressure drop, frictional pressure drop, and acceleration pressure drop. However, the acceleration pressure drop is much smaller than the gravitational and frictional pressure drops. Therefore, we can ignore the acceleration pressure drop in the establishment process.
Taking a micro-element section of the wellbore, as shown in Fig. 7, and basing the analysis on the principles of momentum and mass conservation, We establish the pressure gradient equation for the bubble discharge wellbore is established as Eq. (2).
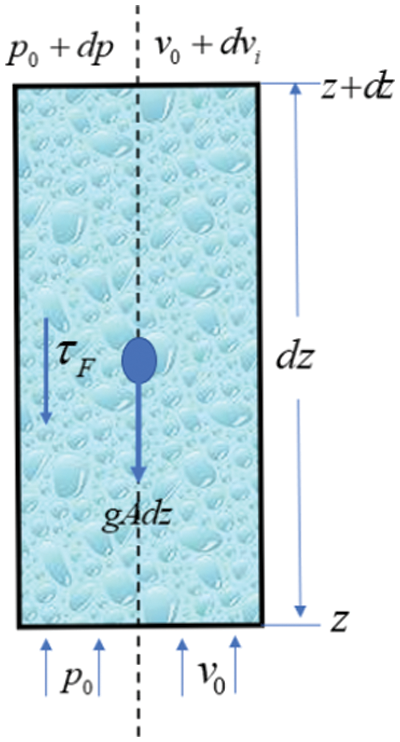
Figure 7: Wellbore flow diagram during stable 1D bubble discharge
where
The formula for calculating the density of a foam fluid is given by Eq. (3).
We can find from Tables 3 and 4 that the flow pattern of the foam fluid is stable under the gas and liquid production conditions of gas wells. We can use the gas holdup rate calculation equation as Eq. (4).
Under the stable foam zone, the flow of foam fluid is different from that of a conventional gas-liquid two-phase flow. The foam fluid forms water-containing foam in the pipeline. When the gas-liquid ratio reaches a certain value, it exhibits non-Newtonian fluid characteristics. Due to this characteristic, the calculation of frictional resistance is given by Eq. (5).
The effective viscosity of a power-law fluid is given by Eq. (6).
where
The power-law fluid flow rate vs. pressure drop in a circular tube is given by Eq. (7).
A power-law fluid flows in a circular tube with a coefficient of drag not different from that of a Newtonian fluid, so the shear stress is given by Eq. (8).
The power-law fluid instanton equation is given by Eq. (9).
The effective viscosity of the foam can be obtained by Eq. (10).
where the formula for K is given by Eq. (11).
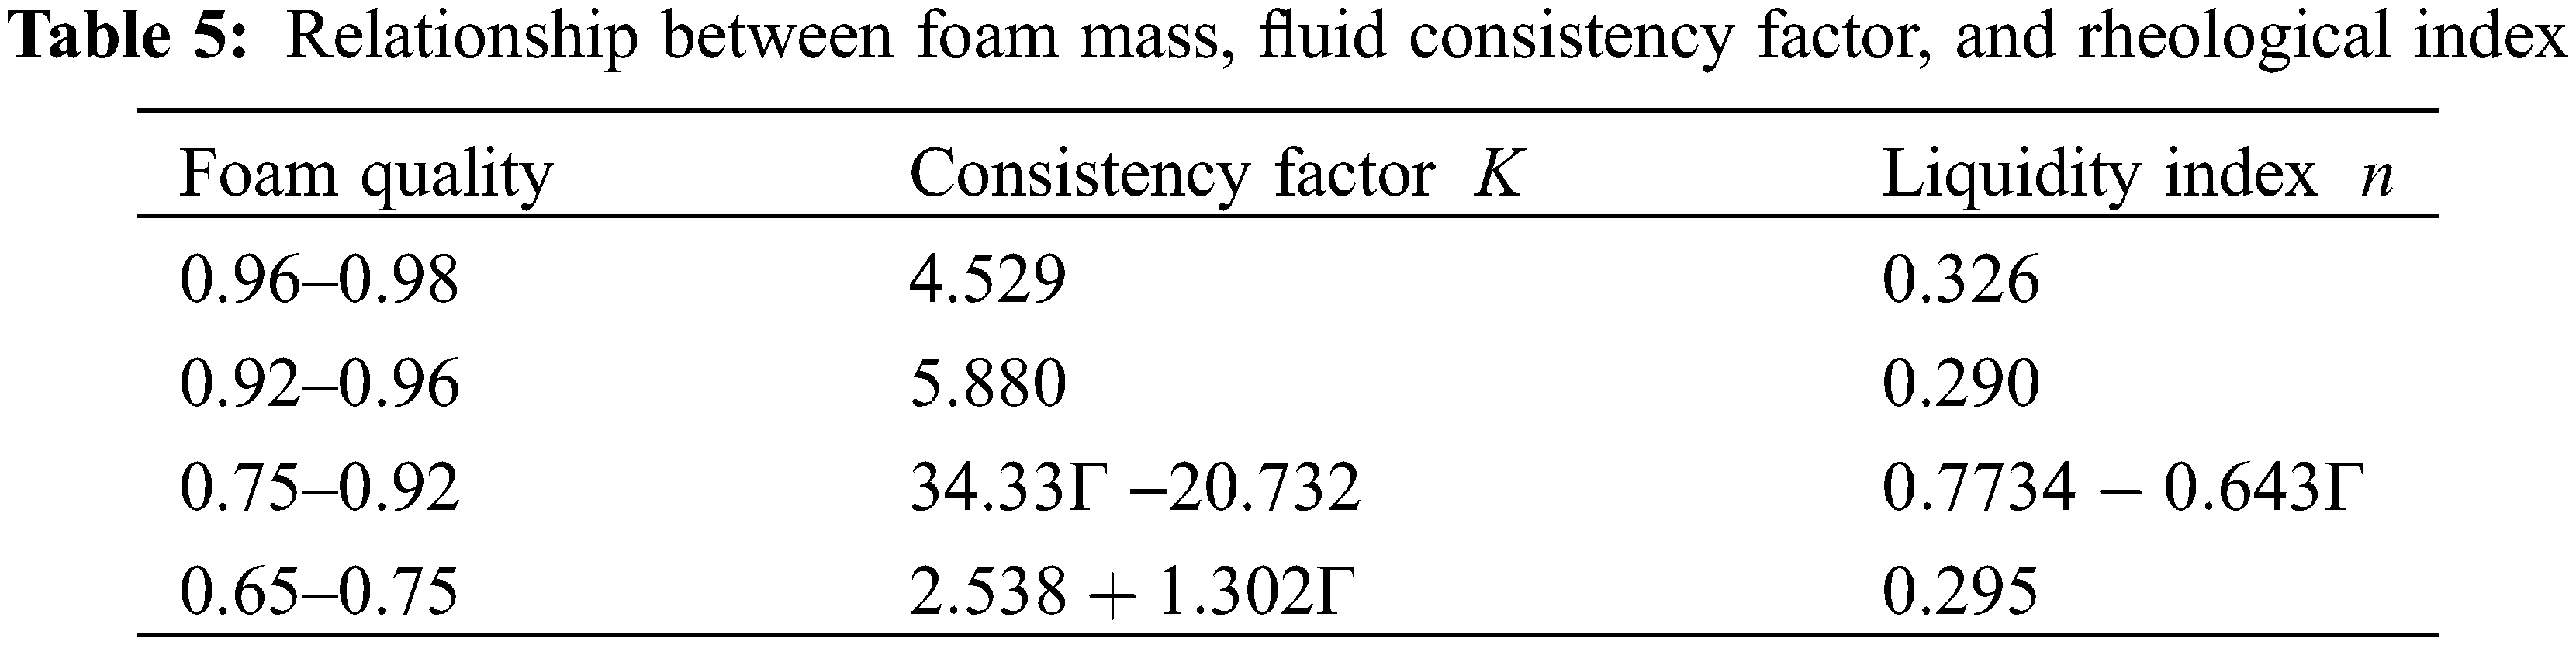
Ajani et al. [20,21] found that the effective viscosity, rather than the apparent viscosity, should be used for foam fluids, based on indoor foam flow experiments. The yield power law model for the relationship between foam mass, consistency factor, and rheological index is presented in Table 5.
In this state, the foam fluid exhibits power-law fluid characteristics, and its frictional pressure drop is greater than that of a Newtonian fluid. As a result, the Reynolds number cannot be calculated for the foam fluid as it is not Newtonian. To calculate the Reynolds number for the foam fluid, Eq. (12) can be used.
where
In the gas-water bubble three-phase flow test experiment, the data of gas production, foam mass and pressure drop during different experiments were recorded, the relationship between foam mass, fluid consistency coefficient, and rheological index of the foam fluid was calculated from Table 5, and the relationship between the foam flow friction coefficient and Reynolds number Ref was fitted according to the measured data as shown in Fig. 8.
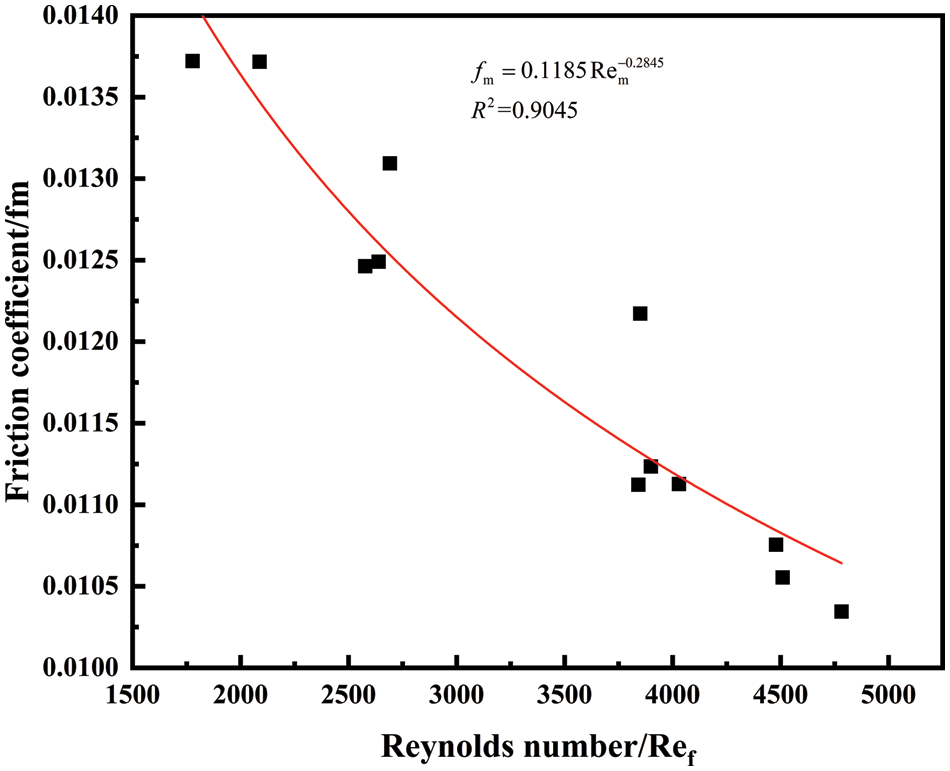
Figure 8: Friction coefficient vs. Reynolds number
The relationship between the coefficient of friction and Reynolds number for a mass fraction of 0.5% in situ foaming agent is obtained from the fit as Eq. (13).
The new pressure drop relationship is then obtained as Eq. (14).
The experimental data was then verified as shown in Fig. 9.
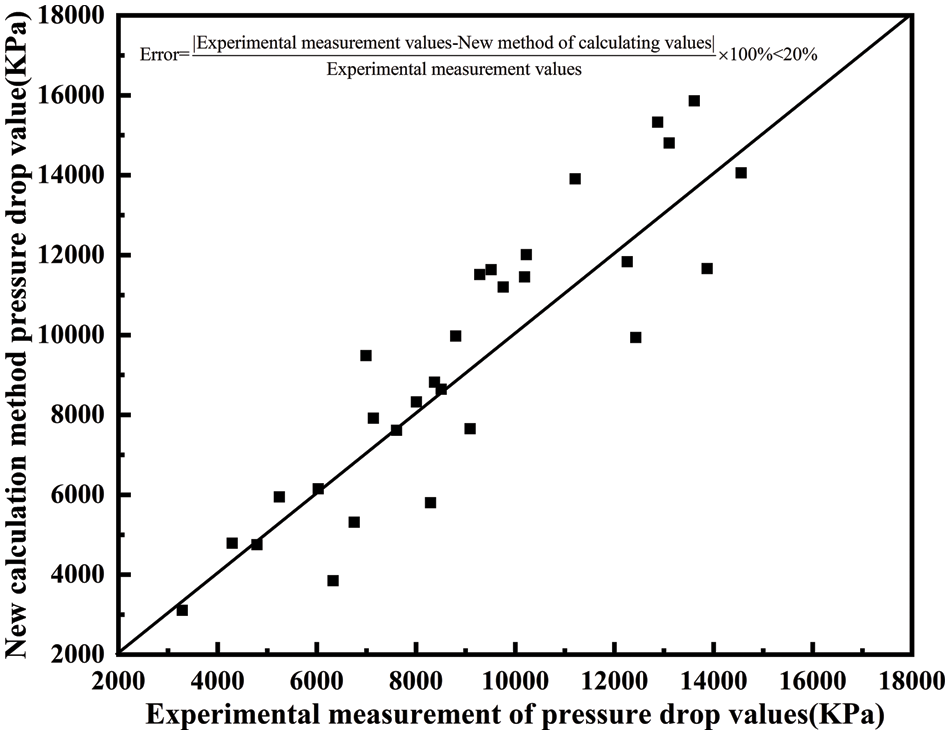
Figure 9: New model error plot
The errors between the experimental measurements and the values calculated by the new calculation method are all within 15%, so the new calculation method can accurately predict the pressure drop values under wellbore conditions.
Where,
The analysis of the foam drainage gas extraction method used in the Block X gas field led to the following conclusions:
(1) The optimal concentration of the bubbling agent must be selected for different blocks of bubbling wells to maximize fluid extraction. Through indoor simulation experiments, we determined that a concentration of 0.5% is optimal for the Block X gas field. At this concentration, the bubbling agent exhibits excellent foaming ability, bubble stabilization, high-temperature resistance, and fluid carrying capacity, and effectively reduces pressure drop in the wellbore.
(2) The foam quality in the Block X gas field ranges from 0.78 to 0.98 at the gas-liquid volume ratio. The flow types observed include foam segment plug flow, foam stirred flow, and continuous foam flow, all of which belong to the foam stabilization zone. Due to slips between the gas and water bubbles, the gas-liquid two-phase slip must be considered when establishing the pressure drop calculation method.
(3) We verified the existing pressure drop calculation method and found that it is necessary to re-establish the calculation method for different soaking agents and working conditions, considering the slip. In this paper, we establish a pressure drop calculation method for the optimal bubbling agent concentration based on the characteristics of the X Block gas field. In our modeling process, we considered the foam fluid to be a power-law fluid, with its viscosity changing. We also considered the slip between the foam phase and the gas phase. Using the experimental data, we fit a new method to calculate the friction coefficient.
(4) The calculated values from our new foam pressure drop model have an error of less than 15% when compared to the experimental measurements, meeting the requirements of the communal calculation.
Funding Statement: The authors would like to acknowledge the support provided by the National Natural Science Foundation of China (No. 62173049) and the Open Fund of the Key Laboratory of Exploration Technologies for Oil and Gas Resources (Yangtze University), Ministry of Education (Grant K2021-17).
Conflicts of Interest: The authors declare that they have no conflicts of interest to report regarding the present study.
References
1. Zhai, C. B., Qi, S. W., Wang, M. H., Yu, T. J., Wang, R. F. et al. (2021). Shut-in time after intermittent injecting foam agent into tight gas wells. Natural Gas Exploration and Development, 44(4), 123–130. [Google Scholar]
2. Xian, Y. (2019). Development of low-cost soaking and drainage agent in XX gas field and analysis of influencing factors (Master’s Thesis). Southwest Petroleum University, China. [Google Scholar]
3. Yan, X., Jing, Q., Yan, Z., Tang, Y., Chen, W. et al. (2016). Indoor evaluation of foaming agents for soaking and draining wells and study of influencing factors. Contemporary Chemical Industry, 45(3), 526–529. [Google Scholar]
4. Yan, X. (2016). Experimental study on flow characteristics and defoaming of bubble drainage well gathering pipeline (Master’s Thesis). Southwest Petroleum University, China. [Google Scholar]
5. Guan, J. (2019). Screening and evaluation study of foam drainage aids for high temperature and high pressure gas wells (Master’s Thesis). University of Petroleum (East ChinaChina. [Google Scholar]
6. Zhang, S. (2018). Performance evaluation method of foaming agent and its application in Sulige gas field (Master’s Thesis). Xi’an University of Petroleum, China. [Google Scholar]
7. Dukhan, N., Patel, K. (2011). Effect of sample’s length on flow properties of open-cell metal foam and pressure-drop correlations. Journal of Porous Materials, 18(6), 655–665. [Google Scholar]
8. Liu, P. S., Cui, G., Guo, Y. J., Chen, J. H., Yang, Z. X. (2017). A novel sort of porous ceramic foam ball with modified surface for arsenic removal from aqueous solution. Journal of Iron and Steel Research International, 24(6), 661–668. [Google Scholar]
9. Wang, H., Wang, F., Chen, X., Dong, J., Li, Y. et al. (2014). Comparison and improvement of foam drilling pressure drop models under different rheological modes. Journal of Petroleum and Natural Gas, 36(8), 95–99+6. [Google Scholar]
10. Mitchell, B. J. (1970). Viscosity of foam (Master’s Thesis). The University of Oklahoma, Norman. [Google Scholar]
11. Princen, H. M. (1983). Rheology of foams and highly concentrated emulsions: I. Elastic properties and yield stress of a cylindrical model system. Journal of Colloid and Interface Science, 91(1), 160–175. [Google Scholar]
12. Aziz, K., Govier, G. W. (1972). Pressure drop in wells producing oil and gas. Journal of Canadian Petroleum Technology, 11(3), 38–48. [Google Scholar]
13. Metzner, A. B., Reed, J. C. (1955). Flow of non-newtonian fluids—correlation of the laminar, transition, and turbulent-flow regions. AIChE Journal, 1(4), 434–440. [Google Scholar]
14. Deshpande, N. S., Barigou, M. (2000). The flow of gas-liquid foams in vertical pipes. Chemical Engineering Science, 55(19), 4297–4309. [Google Scholar]
15. Cheng, J. (2014). Experimental study on the simulation of bubble discharge tubular flow in horizontal gas wells (Master’s Thesis). Southwest Petroleum University, China. [Google Scholar]
16. Liu, Y. (2018). Experimental study of horizontal gas well velocity pipe and foam composite drainage gas recovery simulation (Master’s Thesis). Southwest Petroleum University, China. [Google Scholar]
17. Buslov, R., Towler, B. F., Amian, A. V. (1996). Calculation of pressures for foams in well completion processes. SPE Annual Technical Conference and Exhibition, Richardson, Texas, OnePetro. [Google Scholar]
18. Soni, S. N., Kelkar, M. G., Perez, C. (2009). Pressure-drop predictions in tubing in the presence of surfactants. SPE Production and Operations Symposium, Richardson, Texas, OnePetro. [Google Scholar]
19. Raza, S. H., Marsden, S. S. (1967). The streaming potential and the rheology of foam. Society of Petroleum Engineers Journal, 7(4), 359–368. [Google Scholar]
20. Ajani, A., Kelkar, M., Sarica, C., Pereyra, E. (2016). Effect of surfactants on liquid loading in vertical wells. International Journal of Multiphase Flow, 83, 183–201. [Google Scholar]
21. Ajani, A. A. (2014). Experimental study and modeling of surfactant effects on liquid loading in vertical pipes (Master’s Thesis). University of Tulsa, USA. [Google Scholar]
Cite This Article
 Copyright © 2023 The Author(s). Published by Tech Science Press.
This work is licensed under a Creative Commons Attribution 4.0 International License , which permits unrestricted use, distribution, and reproduction in any medium, provided the original work is properly cited.
 Downloads
 Citation Tools