
 Submit a Paper
 Propose a Special lssue
 Open Access
ARTICLE
Numerical Analysis of the Erosion Mechanism inside the Tube Sockets of Main Steam Thermometers in a Coal-Fired Power Plant
1 School of Energy Power and Mechanical Engineering, North China Electric Power University, Baoding, 071003, China
2 Guohua Sanhe Power Generation Co., Ltd., Langfang, 065200, China
* Corresponding Author: Fan Yang. Email:
Fluid Dynamics & Materials Processing 2023, 19(2), 379-397. https://doi.org/10.32604/fdmp.2022.020373
Received 19 November 2021; Accepted 01 April 2022; Issue published 29 August 2022
 View Full Text
 Download PDF
Abstract
Leakage occurring in the tube sockets of the main steam thermometers can seriously threaten the safe operation of coal-fired power plants. Here, assuming a 300 MW unit as a relevant testbed, this problem is investigated numerically through solution of the equations of fluid-dynamics in synergy with the mathematical treatment of relevant statistics. The results indicate that the steam can form a large-scale spiral flow inside the tube socket and continuously scour the inner wall. In the model with the protective casing setting angle of 60°, the average tangential fluid velocity can reach up to 4.8 m/s, which is about twice higher than that in the model with the protective casing setting angle of 0°. The wake disturbance generated by the flow around the thermo-sensitive body leads to differences in the fluid motion inside the tube sockets between the upstream and downstream thermometers. These differences are affected by the distance between the thermometers, the setting angle of protective casing, and other factors. The pressure of the main steam inside the tube socket for a R3 thermometer, located outside the curved pipeline, is about 1756 Pa higher than that of the L3 thermometer located outside the straight pipeline, indicating that the secondary flow generated in the curved pipeline is able to provide stronger energy for the large-scale spiral flow inside the tube socket. On the basis of these findings, an improvement scheme for the installation of longitudinal ribs in the tube sockets is proposed. The simulation results show that the average tangential velocity of the fluid within the near-wall area of tube sockets decreases by more than 90%, which should be enough to effectively alleviate the damage to the inner wall caused by high-pressure fluid or particles.Graphic Abstract
Keywords
Friction and wear are the major problems for the coal-fired power plants [1]. Many thermal equipment used in coal-fired power plants not only work in an environment with high temperature and pressure for a long time, but also suffer from scouring and impact caused by moving mediums such as steam and ash particles. Therefore, the performance degradation and service life shortening of these equipment are inevitable, which seriously threaten the secure and stable operation of power plants.
The phenomenon [2] that the solid particles carried by moving fluid impact the metal surface repeatedly and result in material falling off from the surface is called erosion, which is common in coal-fired power plants. The method combining computational fluid dynamics (CFD) with erosion theory is widely applied to the analysis for engineering cases. Das et al. [3,4] established a prediction model to explore the erosion phenomenon on the surface of boiler components caused by fly ash particles. Simulation results showed that the erosion rate tended to increase monotonously with the increase of environment temperature and particle impact velocity. The maximum erosion rate appeared at the impact angle of 30°. Dong et al. [5] revealed the evolution process of erosion on an economizer and explored the relationship between erosion rate and ash diameter. Yu et al. [6] proposed a prediction model combined gas-solid flow and catalyst erosion for a selective catalyst reactor, which was installed between the economizer and air preheater. The experimental results showed that the model was accurate for predicting the erosion of catalyst. Moreover, similar studies have also focus on the important equipment components such as steam turbine nozzles [7–9] and rotor blades [10,11].
In addition, experimental analysis is also a common method for the erosion research. Using an air jet erosion test rig, Singh et al. [12] analyzed the effects of temperature and particle impact angle on several boiler steels. Element analysis was carried out by Subramanian et al. [13] for a failed inducted draft fan blade using electron microscopy. It was found that the flue gas erosion led to pits on the blade, resulting in the production of fatigue cracks. In order to alleviate the damage caused by erosion, scholars are committed to create coatings with dense microstructure, high hardness and excellent resistance performance to erosion [14]. Many experiments had proved that the coatings were able to effectively improve the safety and economy of power plant equipment [15–20].
It is essential to arrange thermometers on the pipelines for operation monitoring. However, there are few studies devoting to erosion of thermometers. Thermometer is usually composed of a thermocouple and a protective casing for isolating the thermocouple and fluid. Moreover, a tube socket is needed to lock the thermometer on the pipeline. Leakage occurring in the tube sockets of the main steam thermometers directly threaten the safe operation of the coal-fired power plant. Under this background, this study intends to select the main steam pipelines of a 300 MW unit as the research object and explore the fluid flow inside the tube sockets.
In the past research work on numerical simulation for three-dimensional fluid flow inside pipelines [21–23], a certain two-dimensional slice of pipelines was often chosen to describe the flow characteristics by showing the distributions of velocity or streamlines. In this study, using the definition of velocity circulation, the three-dimensional flow characteristics inside the tube sockets were analyzed in synergy with the mathematical treatment of relevant statistics. Furthermore, the erosion mechanism inside the tube sockets was revealed and targeted improvement suggestions were put forward to escort the safe and stable operation of power plants. The novelties of this study include: (1) qualitative and quantitative analysis was conducted on the flow characteristics inside the tube sockets; (2) the failure reason for the tube socket was explained from the perspective of fluid dynamics; (3) based on the analysis for the numerical simulation results, feasible engineering improvement measures were proposed.
In this paper, the main steam pipelines belonging to a 300 MW unit are selected as the research objects. Fig. 1 shows the geometric structure of the pipelines. As shown in Fig. 1a, the main steam enters the main stop valves from the left and right pipeline respectively, and there are three thermometers installed horizontally on each pipeline. The structure of thermocouple protective casing is shown in Fig. 1b. Its unique thermo-sensitive body in the shape of triangular pyramid (referred to as “pyramid” in the following) is fixed with a mounting hole, which is 38 mm in diameter and located in the main steam pipeline. This assembly mode helps to avoid the shaking of pyramid as it extends into pipelines to detect the main steam temperature.
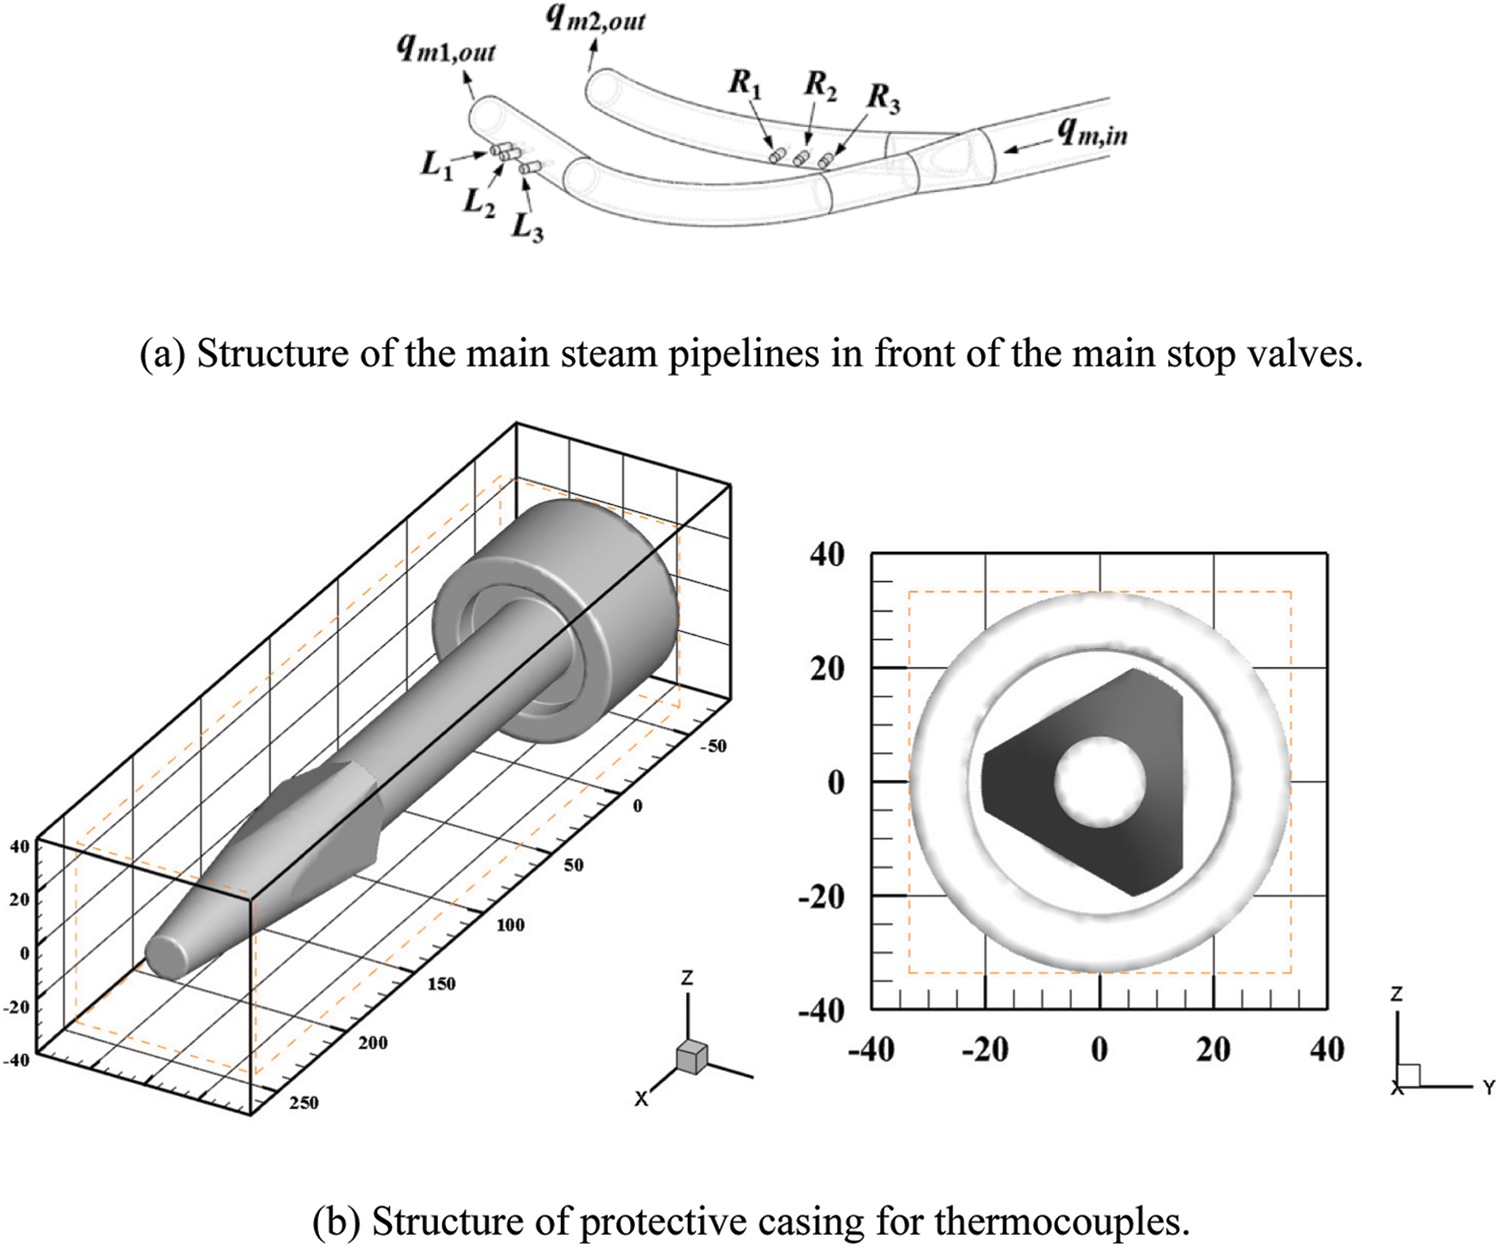
Figure 1: Geometric structure of the research objects
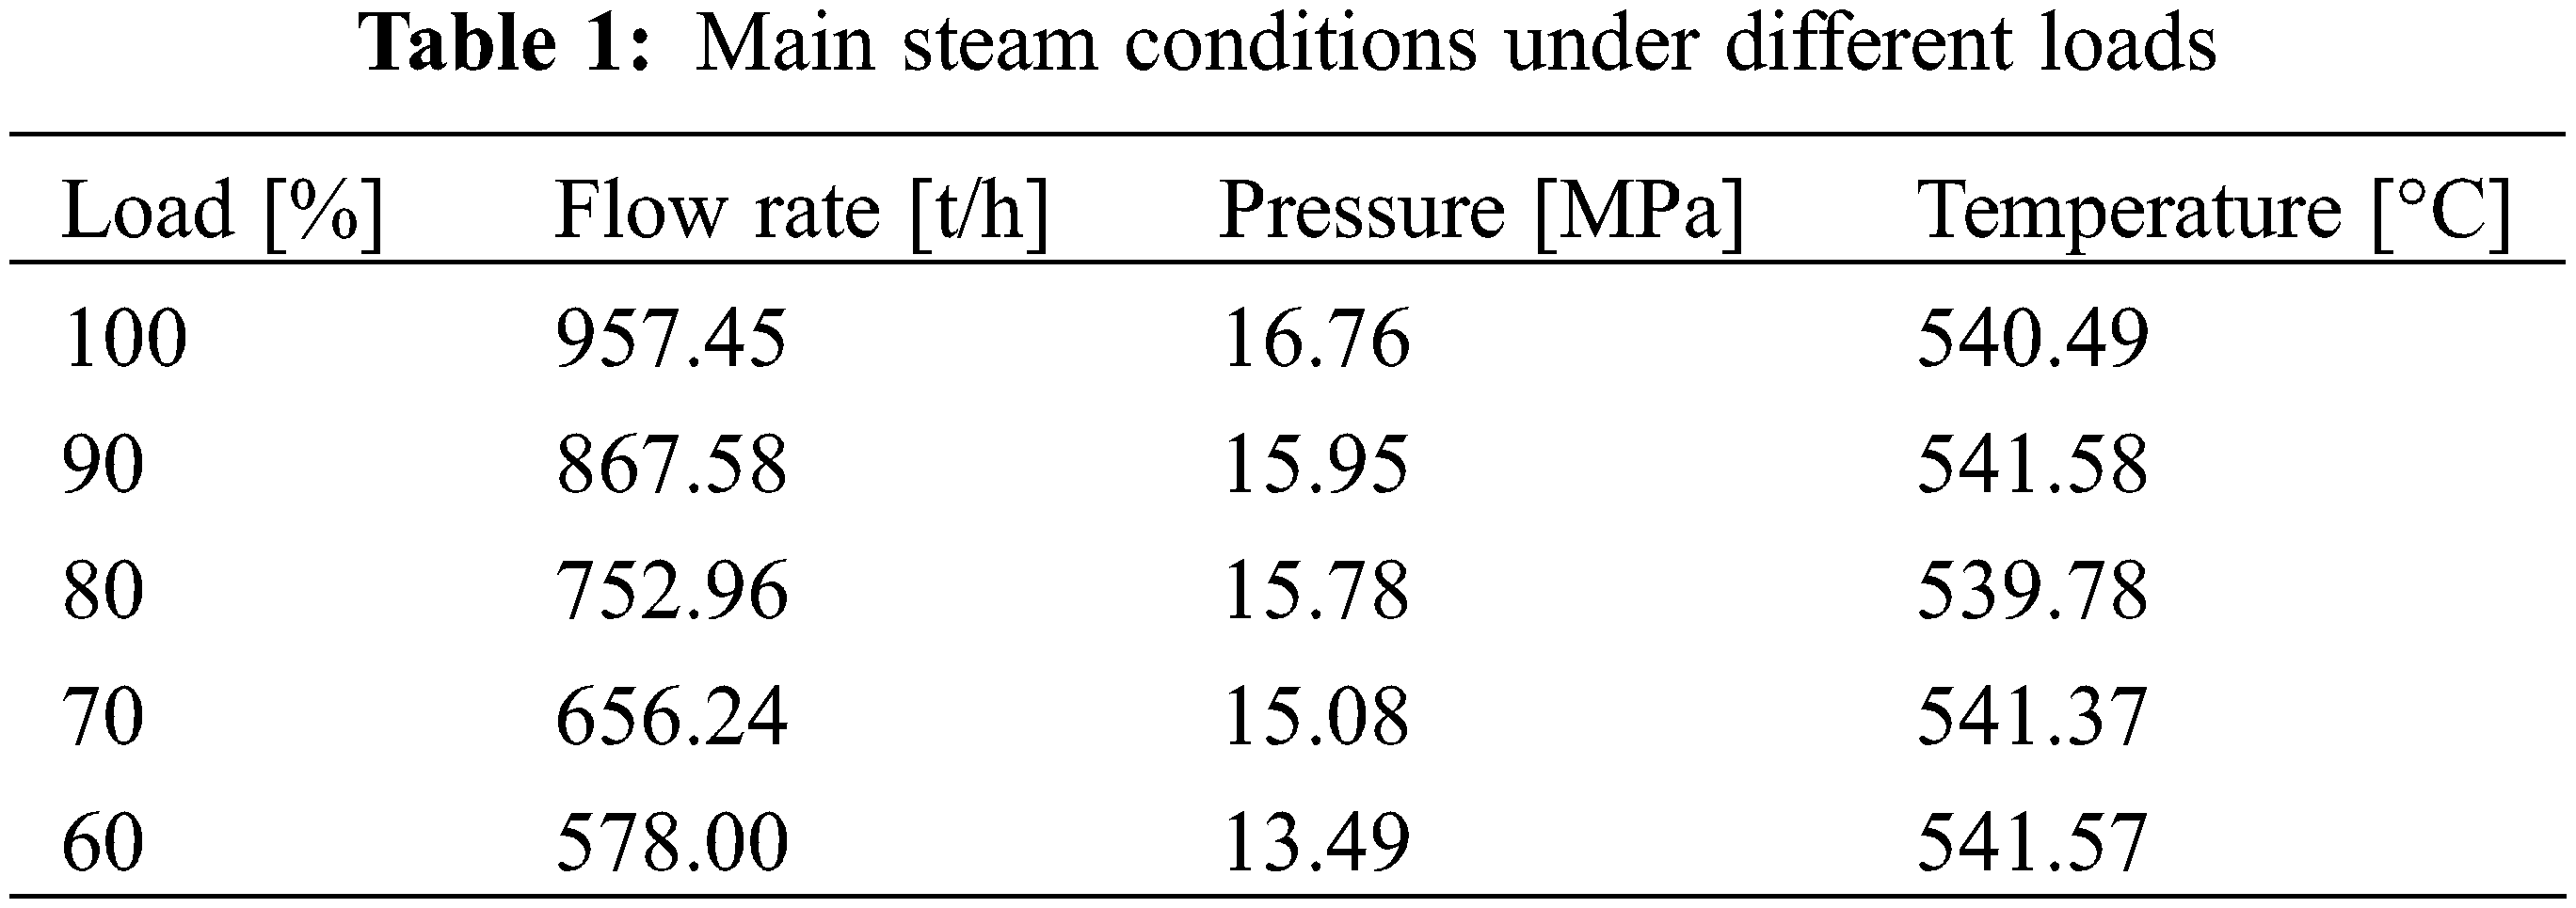
During the unit operation, a perforation leakage occurred in the tube socket for R3 thermometer, which was located at the up-stream of right pipeline. Fig. 2 shows the scene photographs for the right main steam pipeline and thermometers. It can be observed that the leakage point was located at the upper section of tube socket and 30 mm away from the weld. Besides, leakage site was a round hole about 5 mm in diameter and the inner wall within the upper section of tube socket was seriously damaged, where the wear traces caused by fluid or particles were obvious. It is worth mentioning that a pressure measuring point for the main steam is installed on the right pipeline, about 200 mm upstream of the R3 thermometer (the position indicated by white arrow shown in Fig. 2). The main steam conditions under different loads are shown in Table 1.
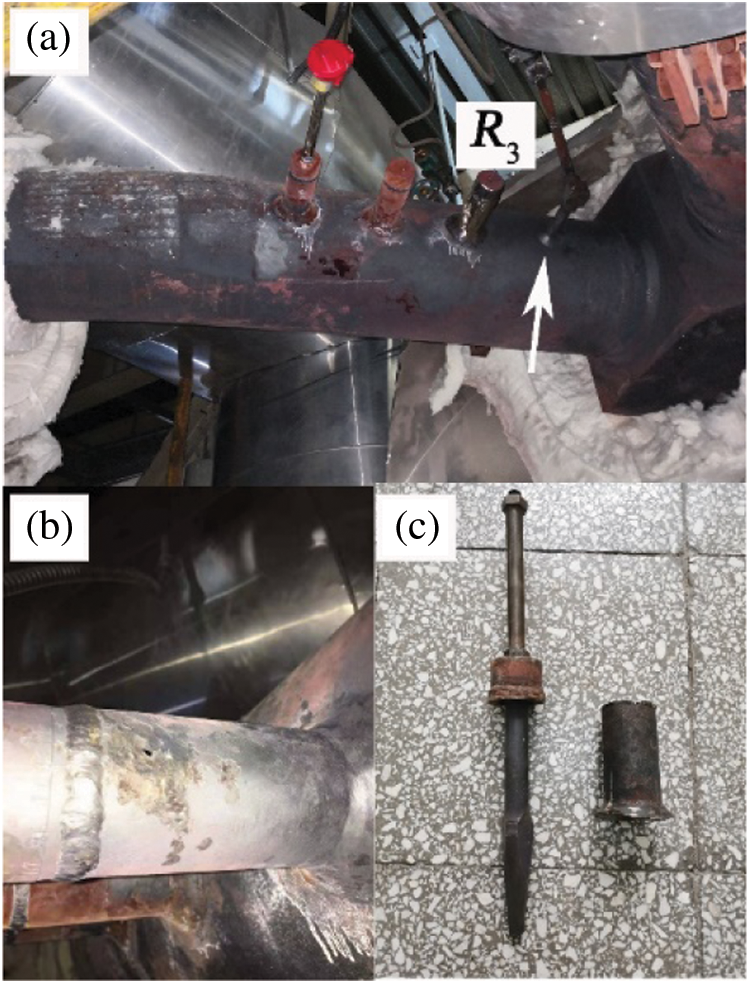
Figure 2: Scene photographs for the right main steam pipeline and thermometers
In response to this engineering failure, a full-scale model for the main steam pipelines with thermometers was established to simulate the flow field characteristics inside the tube sockets. In addition, the pyramid surfaces can be divided into flat surface and conical surface. Considering the effect of pyramid setting angle α on the internal flow field, the models were subdivided into two types through adjusting merely the pyramid setting angle: (1) model with the steam flow direction vertical to flat surface (α = 60°); (2) model with the steam flow direction vertical to conical surface (α = 0°), as shown in Fig. 3.
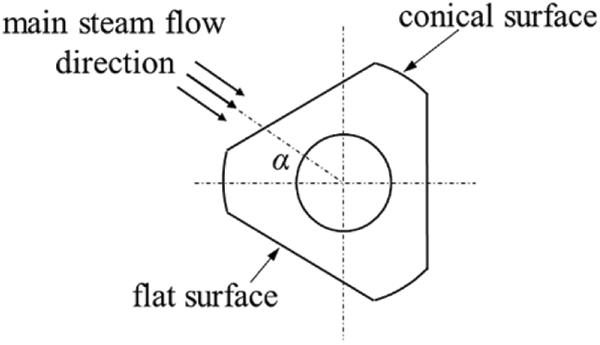
Figure 3: The pyramid setting angle
The motion of fluid in three-dimensional space is described by a set of partial differential equations, which are mathematical expressions of conservation laws of mass, momentum, and energy. In the engineering field, the Reynolds-Averaged Navier-Stokes (RANS) models are commonly used to simulate the fluid flow inside the pipelines and achieved good results [24–26]. In the RANS models, the continuity equation and Navier-Stokes equation can be expressed as:
where ρ is the fluid density, kg/m3; η is the dynamic viscosity, Pa·s.
In this paper, ANSYS FLUENT is used to numerically simulate the incompressible and steady flow field inside the main steam pipeline. Considering that secondary flow tends to form inside curved pipe [27,28], the realizability k-ε model is selected to calculate the Reynolds stress caused by turbulent fluctuation. In the realizability k-ε model, the eddy viscosity ηt is computed from:
where coefficient Cμ [29] is defined as follows:
The modeled transport equations for turbulent kinetic energy k and dissipation rate ε in the realizability k-ε model are:
where
In ANSYS FLUENT, C2 = 1.9, σk = 1.0, σε = 1.2. It is worth mentioning that since the steady numerical simulation is chosen for this research, the time terms (first term on the left side of equation) in Eqs. (1), (2), (5), and (6) are zero.
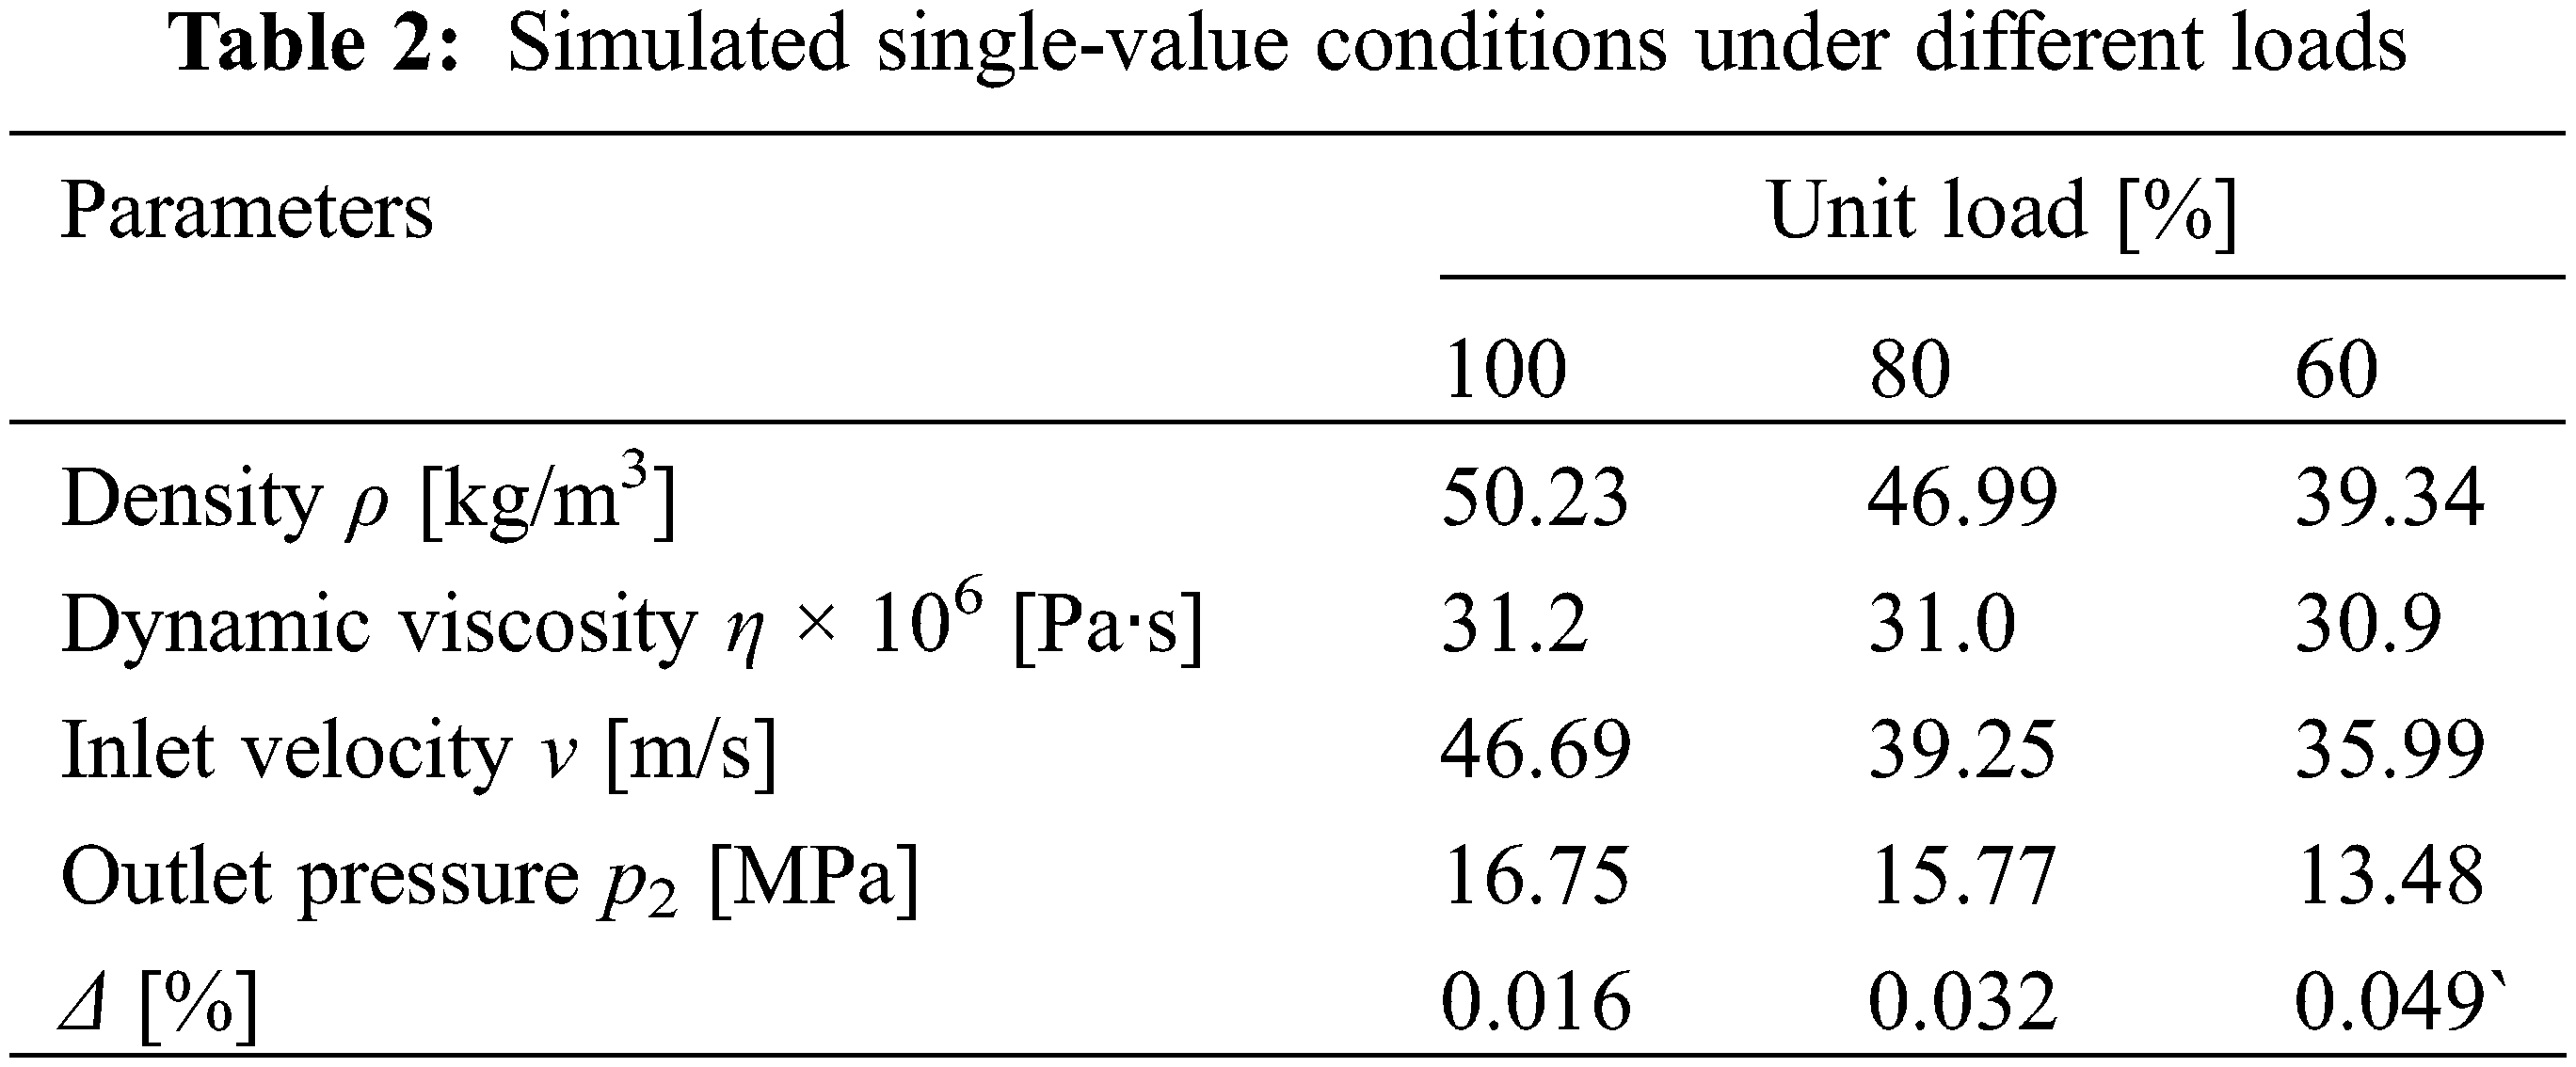
The velocity-inlet and pressure-outlet are set as boundary conditions. Considering that the pressure measuring point for main steam is only arranged on the right pipeline, it is assumed that the outlet pressure values of the left and right pipelines are consistent. The setting of simulated single-value conditions under three kinds of unit loads is shown in Table 2. In which Δ can be expressed as:
where ps and pm represent the simulated pressure and measured pressure at the position of pressure measuring point, respectively.
In the calculation, the Standard Wall Functions was used to bridge the viscosity-affected region between the wall and the fully-turbulent region; the SIMPLE algorithm was adopted for the pressure-velocity coupling; the momentum equation, turbulent kinetic energy and dissipative transport equation were in the second-order upwind scheme.
2.4 Mesh Independence Verification
Fig. 4 shows the variation tendency of pressure difference
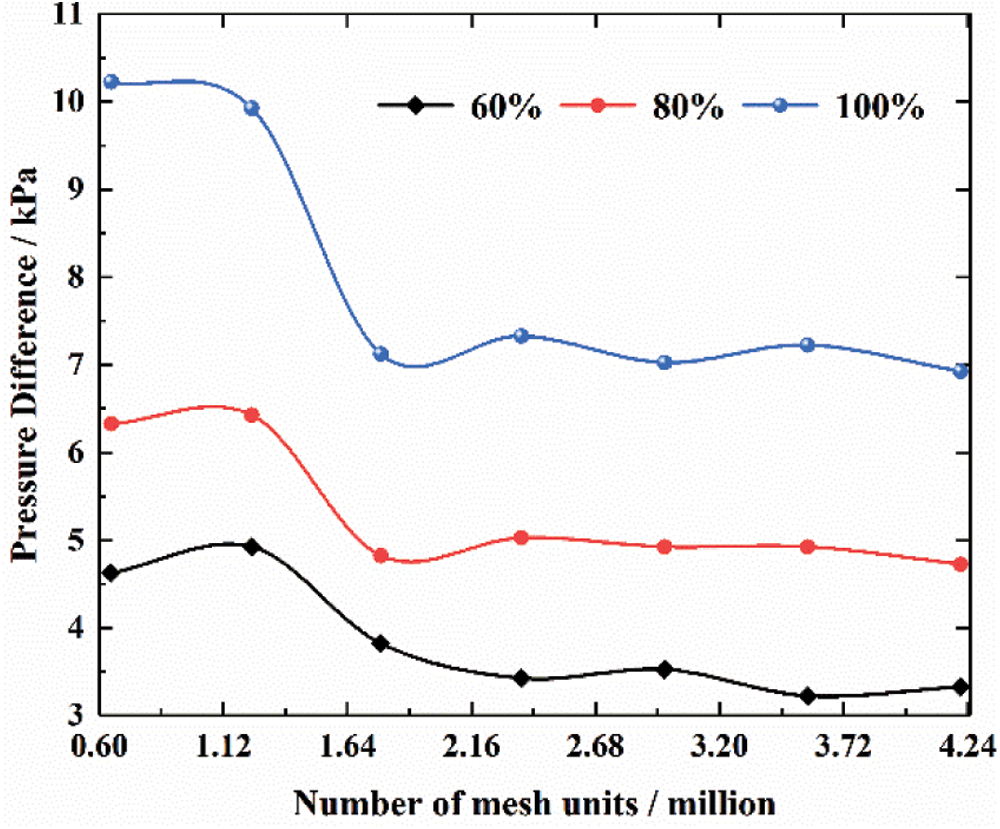
Figure 4: Variation tendency of the pressure difference Δp with number of mesh units
It can be seen from Fig. 4 that the pressure difference change slightly as the mesh number exceeds 2.4 × 10⁶. Therefore, under comprehensive consideration, the number of mesh adopted for the simulation was ultimately determined to be 3.57 × 10⁶.
3 Mathematical Average Statistics Method
Fig. 5 shows the schematic diagram of fluid domain inside a tube socket and its transverse planes. The axial direction of tube socket is defined as z direction and its positive direction points to the lower end plane (upper end plane z = 0, lower end plane z = 171 mm). In order to describe conveniently, the geometric structure of fluid domain inside tube socket is divided equally into the upper, middle and lower sections. The flow inside tube socket can be regarded as a three-dimensional fluid flow between concentric cylindrical surfaces [30,31], and the fluid velocity v at any position in space can be expressed as:
where vz is the axial velocity component, vu is the tangential velocity component and vr is the radial velocity component.
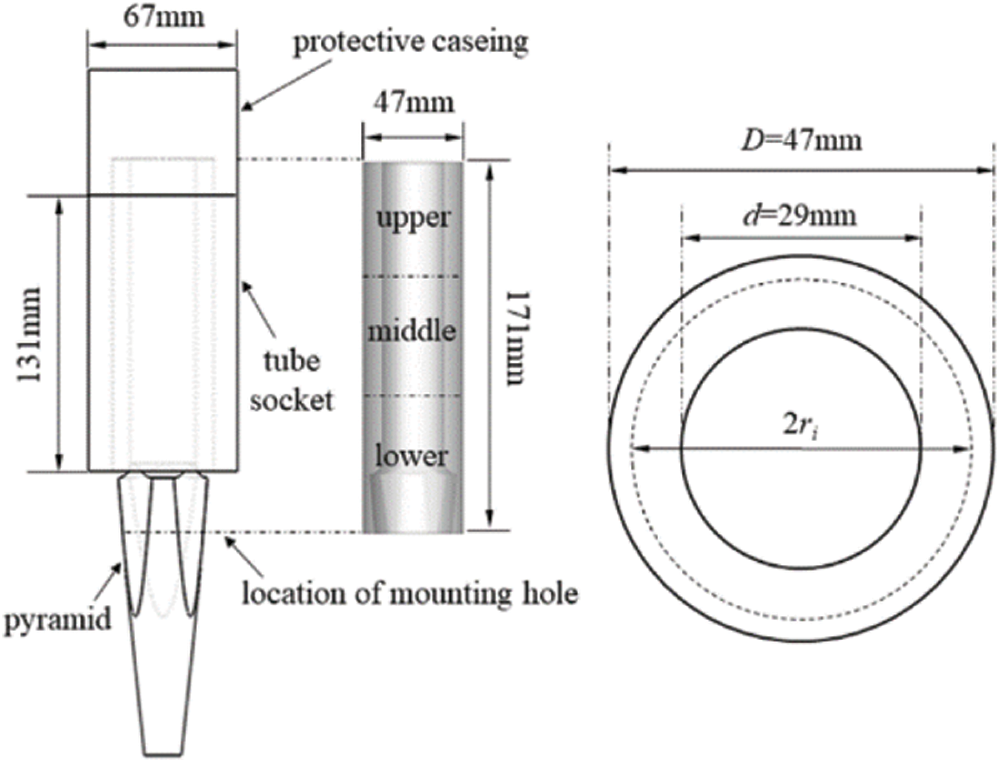
Figure 5: The schematic diagram of fluid domain inside a tube socket and its transverse planes
In order to represent the angle between velocity direction and transverse plane, the spiral angle θ is defined as:
Based on a mathematical average statistics method, the average fluid motion parameters within the near-wall region of tube sockets were extracted to analyze the internal flow field characteristics. The transverse planes at different locations were selected (z1 = 10 mm, z9 = 130 mm, axial step size Δz = 15 mm), and the average fluid motion parameters at different circumferential radius (r1 = 23 mm, r5 = 19 mm, radial step size Δr = 1 mm) on each transverse plane were calculated. The detailed information are as follows:
(1) average velocity on a circle with radius of ri is defined by the arithmetic mean value of velocity of all fluid particles, which are distributed on this circle:
(2) average tangential velocity on a circle with radius of ri is determined by the velocity circulation Γi around this circle:
(3) average spiral angle on a circle with radius of ri is expressed as:
where i = (1, 5), n = 2000.
4.1 Fluid Motion inside the Tube Socket for Typical Thermometer
In this section, the L3 thermometer, located at upstream of left main steam pipeline, is selected as a typical one to analyze the internal fluid flow characteristics under unit load of 80%.
4.1.1 Flow at Gap Entrances and Exits
Fig. 6 shows the mode of fluid entering and leaving the tube socket through gaps. Usually, three gaps appear as the pyramid fixed with mounting hole through line contact. When the fluid flow inside main steam pipelines is blocked by the pyramid surfaces, the fluid tends to enter the tube socket at high speed through these gaps and continuously scour the inner wall of tube socket.
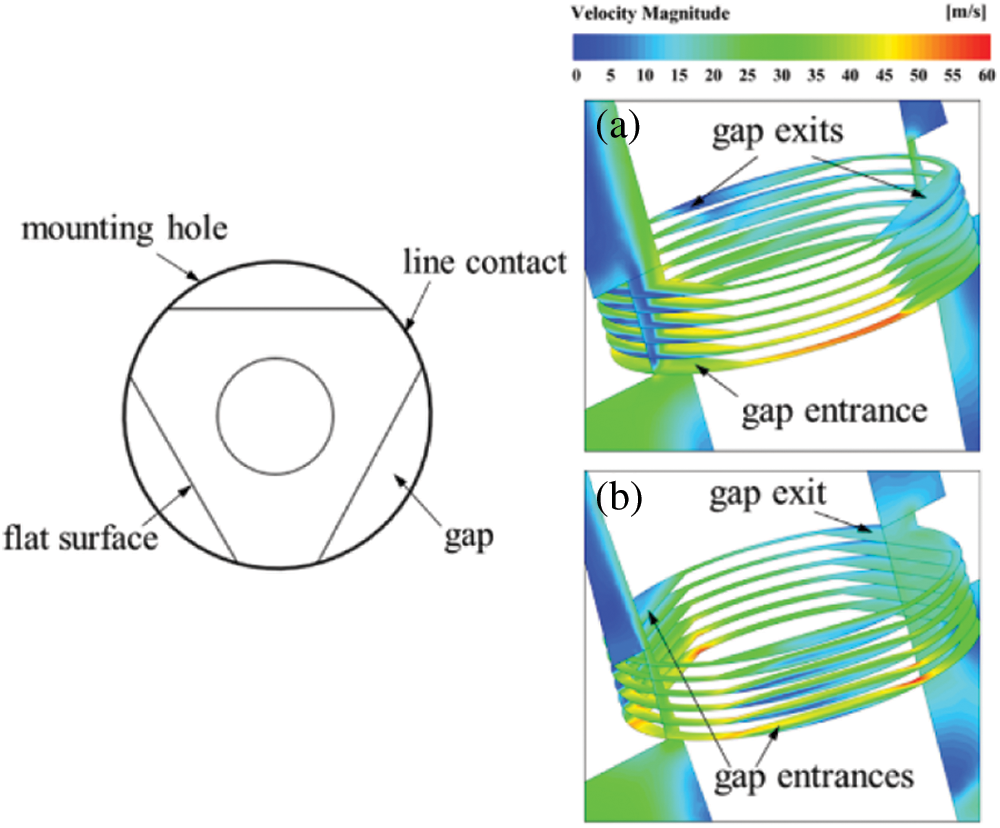
Figure 6: The mode of fluid entering and leaving the tube socket through gaps: (a) model with steam flow direction vertical to flat surface (α = 60°); (b) model with steam flow direction vertical to conical surface (α = 0°)
Under the model with pyramid setting angle of 60°, fluid usually enters the tube socket from one gap entrance and leaves from two gap exits. The maximum inlet velocity can reach 45 m/s. While the pyramid setting angle is 0°, the mode of fluid entering and leaving tube socket is opposite and the maximum inlet velocity is about 30 m/s.
4.1.2 Divided Flow Phenomenon inside Tube Socket
Fig. 7 shows the distribution of three-dimensional streamlines inside tube socket. It can be found that there is a divided flow phenomenon inside the tube socket, and its manifestations are different at two kinds of pyramid setting angles:
(1) As shown in Fig. 7a, when the pyramid setting angle is 60°, the main steam flow I deflects its trajectory within the lower section of fluid domain and leaves directly from an adjacent gap exit. In comparison, the remaining main steam flow II continues to move upward at a higher speed (10∼16 m/s). As a result of closed upper end plane within fluid domain, the continuous influx of main steam makes the upper section become a higher-pressure area. That is, an adverse pressure gradient area from the lower end plane to the upper end plane is formed in space within the tube socket. While main steam flow III reaches the upper-middle section, its axial velocity component attenuates to a state where it is difficult to overcome the pressure gradient to move upward as before. It follows that the main steam flow III deflects its trajectory and move downward, leaving tube socket from another gap exit. Finally, the main steam flow IV reaching the upper section forms a circular flow around the z-axis. According to the continuity theorem, the fluid velocity gradually decreases during the divided process.
(2) In comparison, the divided flow phenomenon inside tube socket is not obvious under the model with pyramid setting angle of 0°. The main steam flow I, which enters the tube socket from one of the gap entrances, spirally moves to the upper end plane carrying the main steam flow II. Then, it drops spirally close to the inner side of fluid domain (amount to the outer wall of protective casing) and leaves from the gap exit. Meanwhile, the main steam flow III, entering from another gap entrance, deflects its trajectory near the lower end plane and leaves the tube socket, as shown in Fig. 7b.
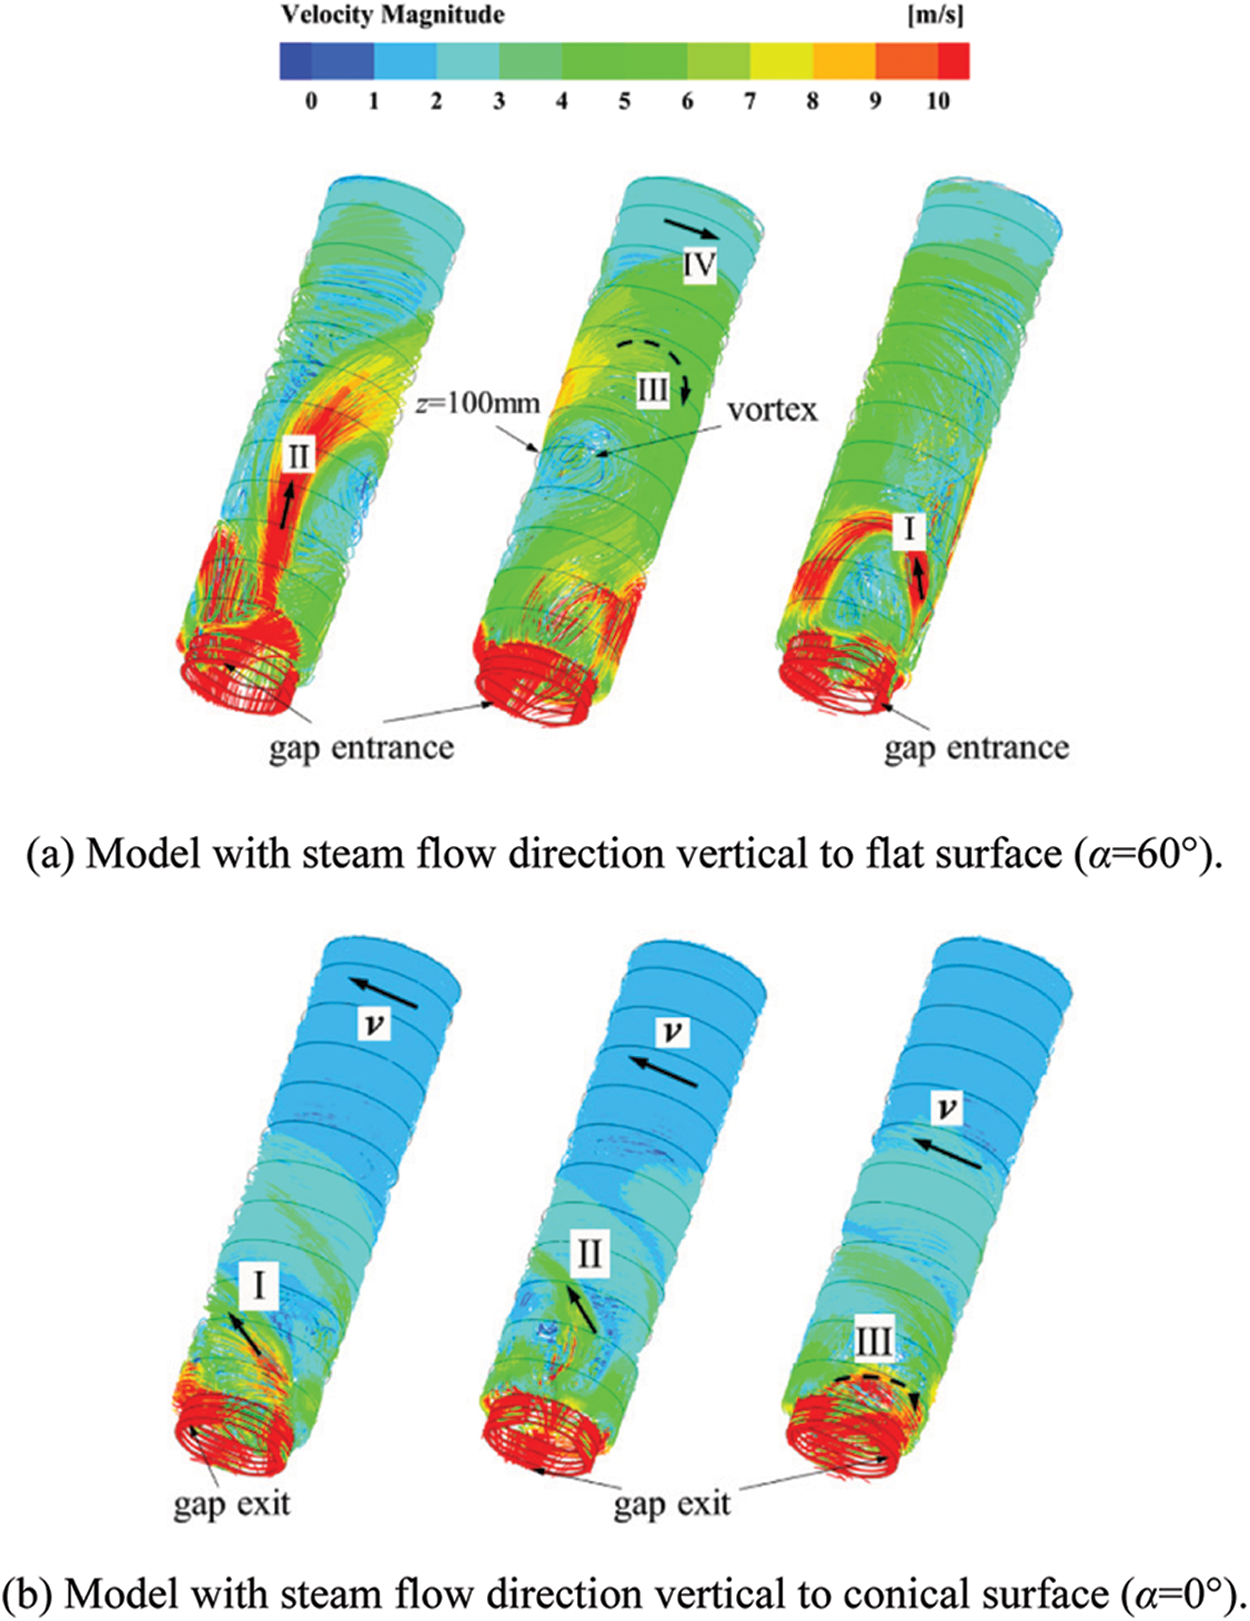
Figure 7: Distribution of three-dimensional streamlines inside tube socket
4.1.3 Distribution of Average Fluid Motion Parameters inside Tube Socket
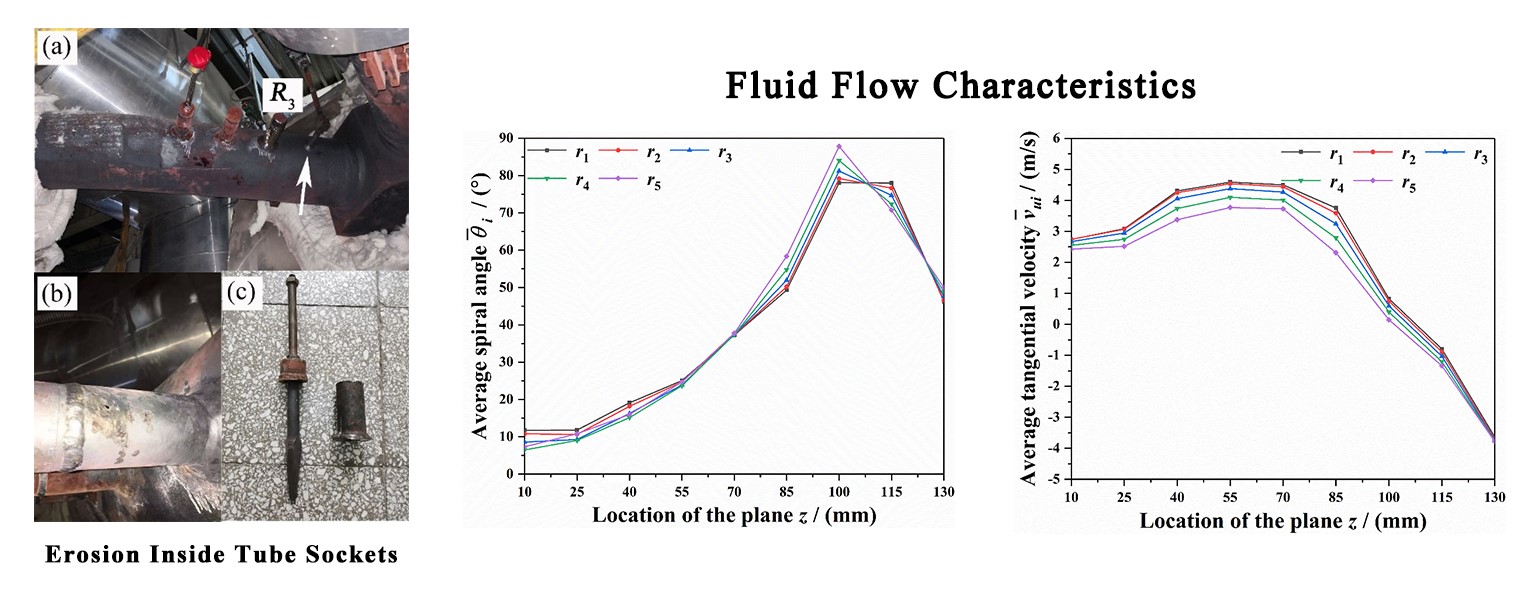
Fig. 8 shows the distribution of average fluid motion parameters inside tube socket at pyramid setting angle of 60°. During the process of the main steam moving to the upper end plane, the average velocity within the near-wall region of tube socket decreases from 5.5 m/s to 2.8 m/s. Besides, the average spiral angle gradually reduces to below 20°, indicating that the tangential fluid motion is gradually dominant in the middle and upper sections. Therefore, the average tangential velocity within the near-wall area is up to 4.8 m/s. It can be observed that the average spiral angle reaches the maximum value of 80° and the average tangential velocity is close to zero near the plane z = 100 mm. The reason for this phenomenon is that there is a vortex with large-scale and lower-speed within this region. In particular, the rotation direction of this vortex is basically perpendicular to the z-axis, as shown in Fig. 7a.
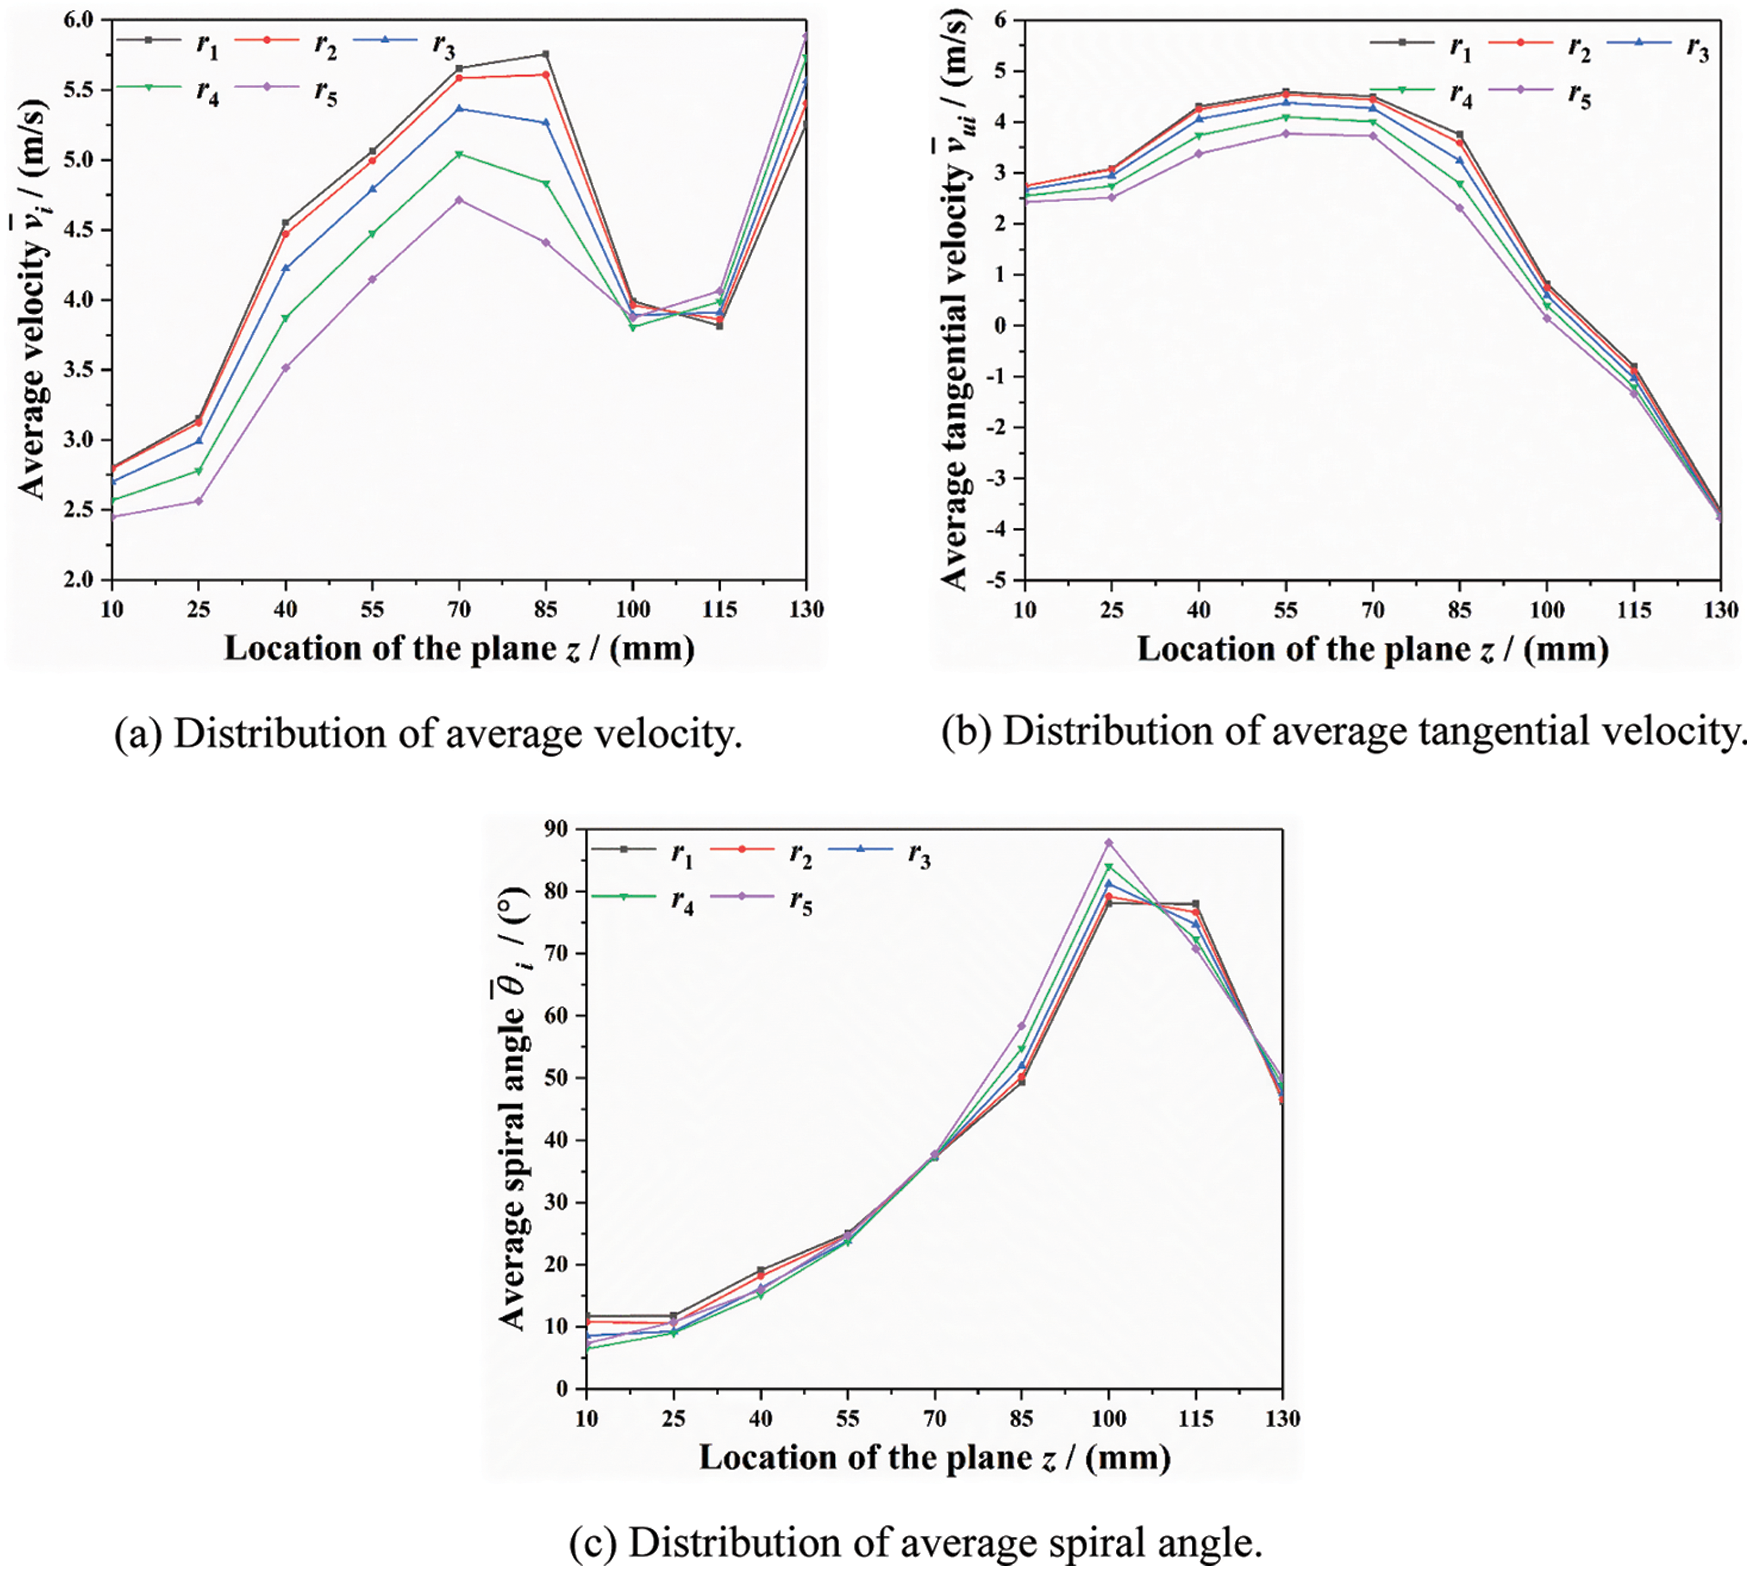
Figure 8: Distribution of average fluid motion parameters inside tube socket at pyramid setting angle of 60°
Fig. 9 shows the distribution of average fluid motion parameters inside tube socket at the pyramid setting angle of 0°. The fluid average spiral angle inside tube socket is comparatively small and basically maintained below 10° in the upper and middle sections (0–114 mm). Both of average velocity and average tangential velocity decrease gradually and are eventually maintained at about 1.6 m/s in the upper section, which is about 50% of the model with pyramid setting angle of 60°.
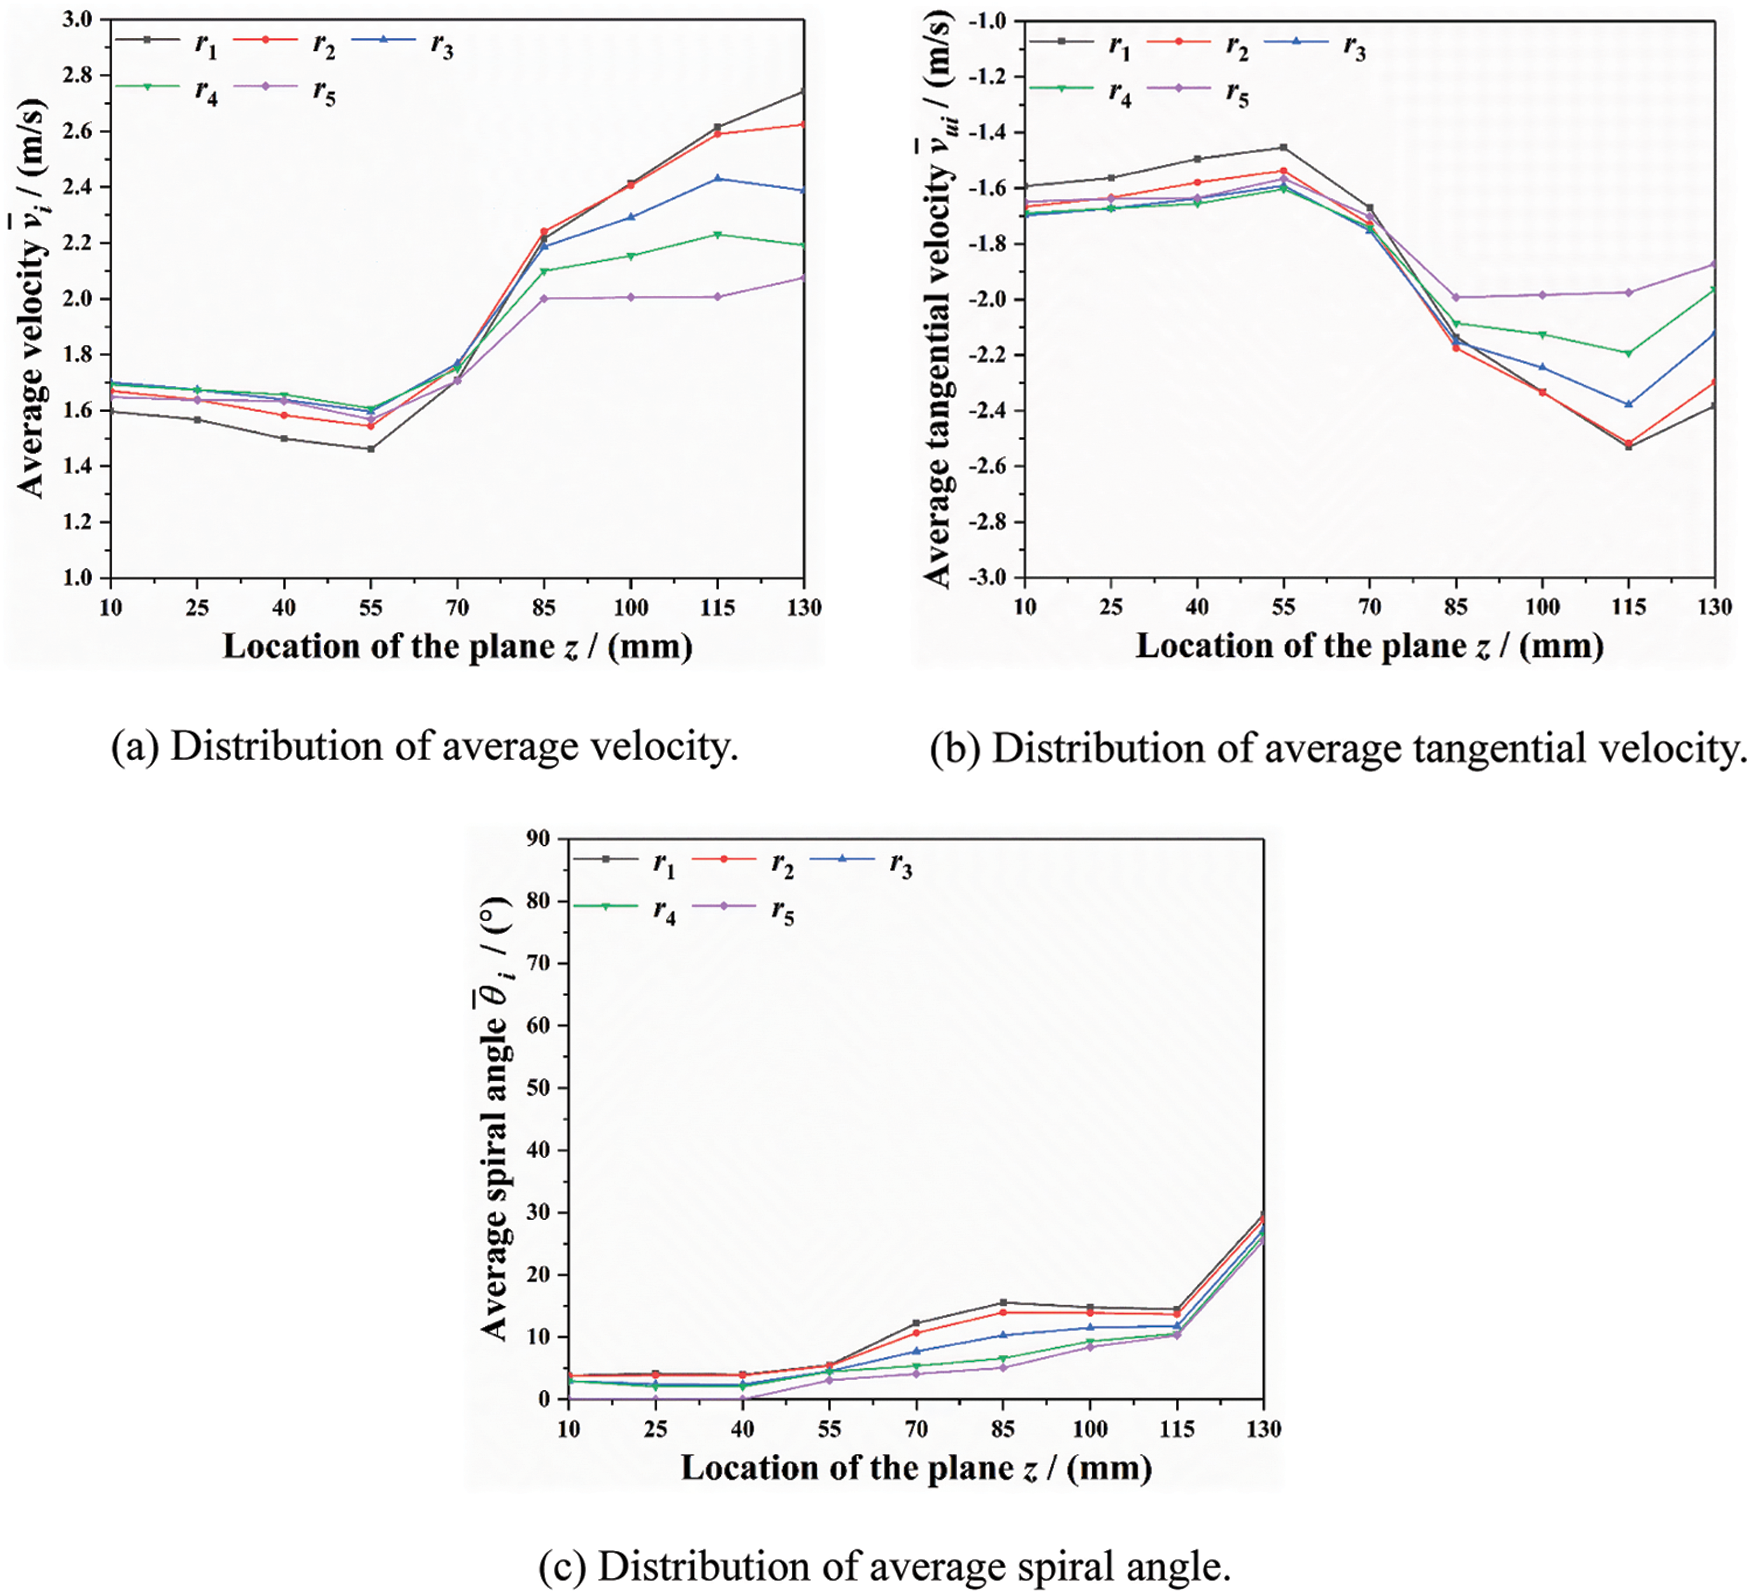
Figure 9: Distribution of average fluid motion parameters inside tube socket at pyramid setting angle of 0°
The reason for the differences mentioned above is that the mode of fluid entering tube socket through the gaps is impacted by the pyramid setting angle. When the model with pyramid setting angle of 60° is adopted, the main steam is blocked by the flat surface and then directly rushes to the upper end plane of tube socket at a high speed through the gap entrance. However, under the model with pyramid setting angle of 0°, the effect of blocking from the conical surface promotes main steam to move downstream around the pyramid. Meanwhile, part of main steam tends to enter the tube socket along the gap entrances and finally drive the internal fluid to form a circular flow around the z-axis.
Fig. 10 shows the actual pictures of a disintegrated tube socket. It can be seen from Fig. 10 that the inner surface of the tube socket suffered serious wear, and the local wall thickness was thinned to form an obvious pit. From the observation for wear traces on the inner wall, erosion mainly occurred at the middle and upper regions of tube socket. The morphology of inner wall shows obvious spiral erosion traces. The actual inner wall wear condition of tube socket is consistent with the simulation results: (1) a spiral flow with low spiral angle formed in the middle and upper regions of tube socket; (2) due to the entrapment effect of spiral flow on micro-particles and affected by the closured upper end plane of tube socket, the high-pressure steam or particles accumulate at the upper region of tube socket and repeatedly scour the inner wall, resulting in serious wear.
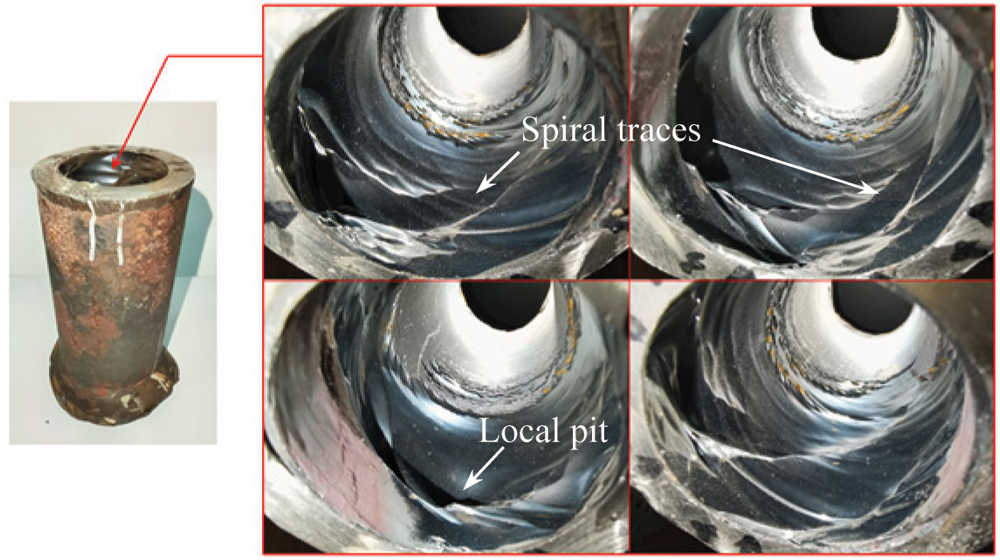
Figure 10: Actual pictures of a disintegrated tube socket
4.1.4 Secondary Flow inside Tube Socket
Vortex is the tendon of fluid movement, leading to a high concentration of kinetic energy around it [32]. Fig. 11 shows the distribution of streamlines on the meridian plane inside tube socket. It can be observed that there are couples of staggered Taylor vortices [33] on the meridian plane. The appearance of Taylor vortices indicates that there is a secondary flow inside tube socket [34]. While the fluid forms a spiral motion with low spiral angle, fluid particles are subjected to centrifugal force, which results in an increase of pressure in the near-wall region inside tube socket. Meanwhile, the adverse pressure gradient along the radial direction promotes the main steam to move towards the inner side of fluid domain, finally leading to a formation of secondary flow. Therefore, the Taylor vortices are only distributed in the middle and upper sections under the model with pyramid setting angle of 60°, where the average spiral angle is relatively small. In contrast, Taylor vortices are almost distributed throughout the meridian plane as the model with pyramid setting angle of 0° is adopted.
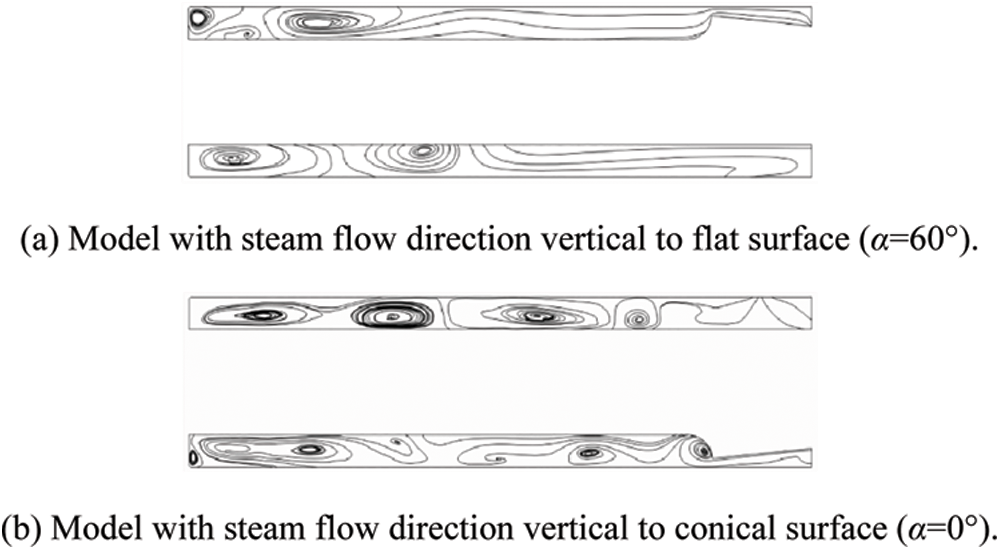
Figure 11: Distribution of streamlines on the meridian plane inside tube socket
4.2 Comparison and Analysis for Average Fluid Motion between Different Thermometers
For convenience of comparison, the arithmetic mean value of average fluid motion parameters on different circles (r1∼r5 in radius) is calculated for representing the fluid flow characteristics within the near-wall region of tube socket:
where n = 5.
4.2.1 Thermometers Located at the Left Main Steam Pipeline
As shown in Fig. 12, when the high-speed main steam flows inside the left pipeline, there is a wake behind the pyramid, resulting in changes in the velocity and flow direction of fluid within the near-wall area of pipeline [35,36]. Furthermore, the fluid motion inside downstream thermometer tends to be affected by the wake disturbance.
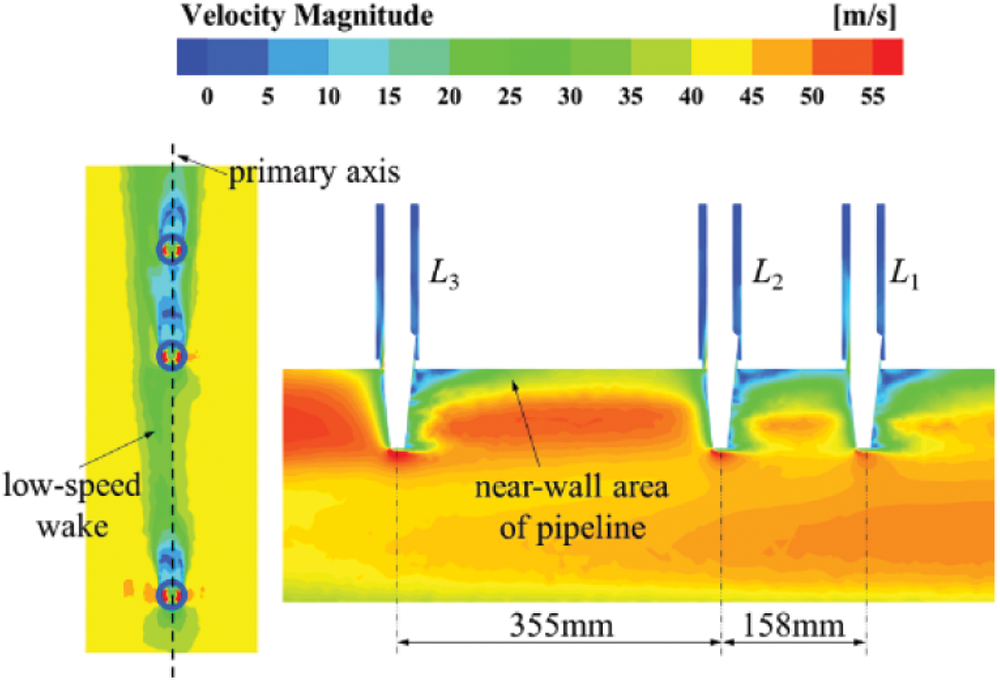
Figure 12: The lower-speed wake within the near-wall area of left main steam pipeline
Fig. 13 shows the distribution of average fluid motion parameters inside the tube sockets for L3, L2 and L1 thermometers. From Figs. 13a and 13b, it can be observed that the L3 thermometer is first impacted by the high-speed main steam, leading to the average velocity and average tangential velocity within the middle and upper sections higher than that inside the downstream thermometers.
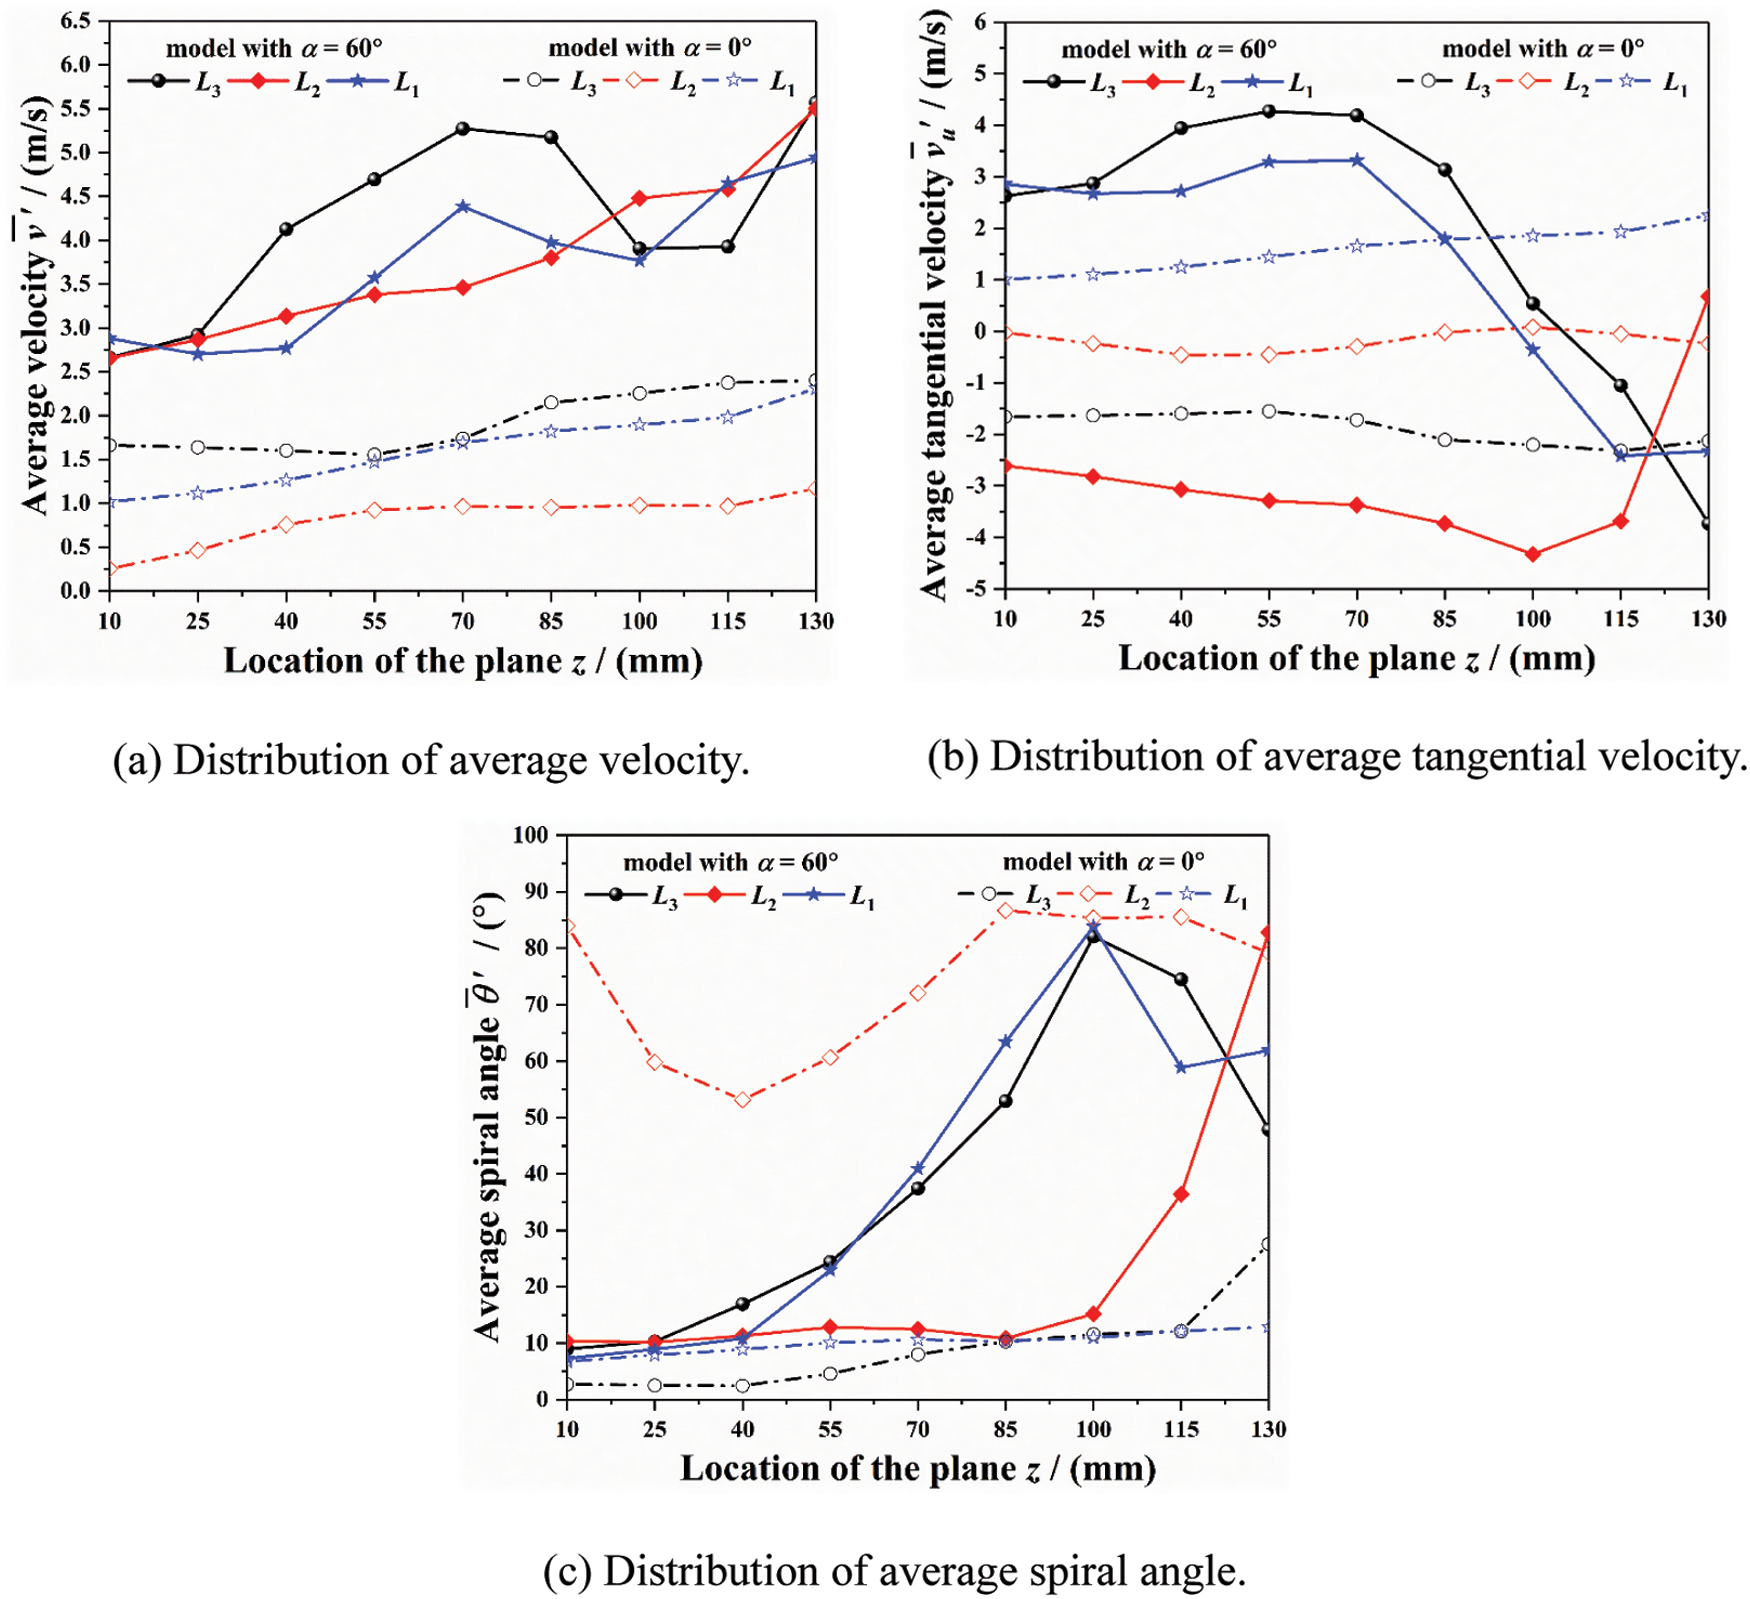
Figure 13: Distribution of average fluid motion parameters inside the tube sockets for L3, L2 and L1 thermometers
What is more, resulting from the large spacing between L3 and L2 thermometers, the lower-speed wake gradually deviates from the primary axis of pipeline after transmission and development, which has a great impact on the fluid motion inside the tube socket for L2 thermometer:
(1) when the model with pyramid setting angle of 60° is adopted, the wake disturbance has a significant impact on the fluid flow direction inside the tube socket for L2 thermometer, which is reflected in that the average spiral angle is stable at about 10° in the upper-middle section (57–100 mm), far lower than that inside L3 thermometer;
(2) when the model with pyramid setting angle of 0° is adopted, the wake disturbance has a significant effect on the fluid flow velocity inside the tube socket for L2 thermometer. It can be found that the average velocity only reaches 50% of that inside L3 thermometer. Besides, the maximum average tangential velocity is only about 0.5 m/s, which is also far lower than that inside L3 thermometer. The differences in the velocity indicates that the fluid flow entering and leaving the tube socket for L2 thermometer decreases compared to the model with pyramid setting angle of 60°.
In addition, due to the small spacing between L2 and L1 thermometers, the wake disturbance from the upstream has not yet had an obvious influence on the fluid motion inside tube socket for L1 thermometer. Therefore, the distributions of average fluid motion parameters inside L1 thermometer are similar to that within L3 thermometer.
4.2.2 Thermometers Located at Right Main Steam Pipeline
Fig. 14 shows the distribution of average fluid motion parameters inside the tube sockets for R3, R2 and R1 thermometers. In comparison with Fig. 13, it can be found that these thermometers located at the right pipeline have the lower internal fluid velocity. The reason is that it is easy to form a secondary flow inside the curved pipeline, leading to higher pressure and lower velocity within the outside area of curved pipeline.
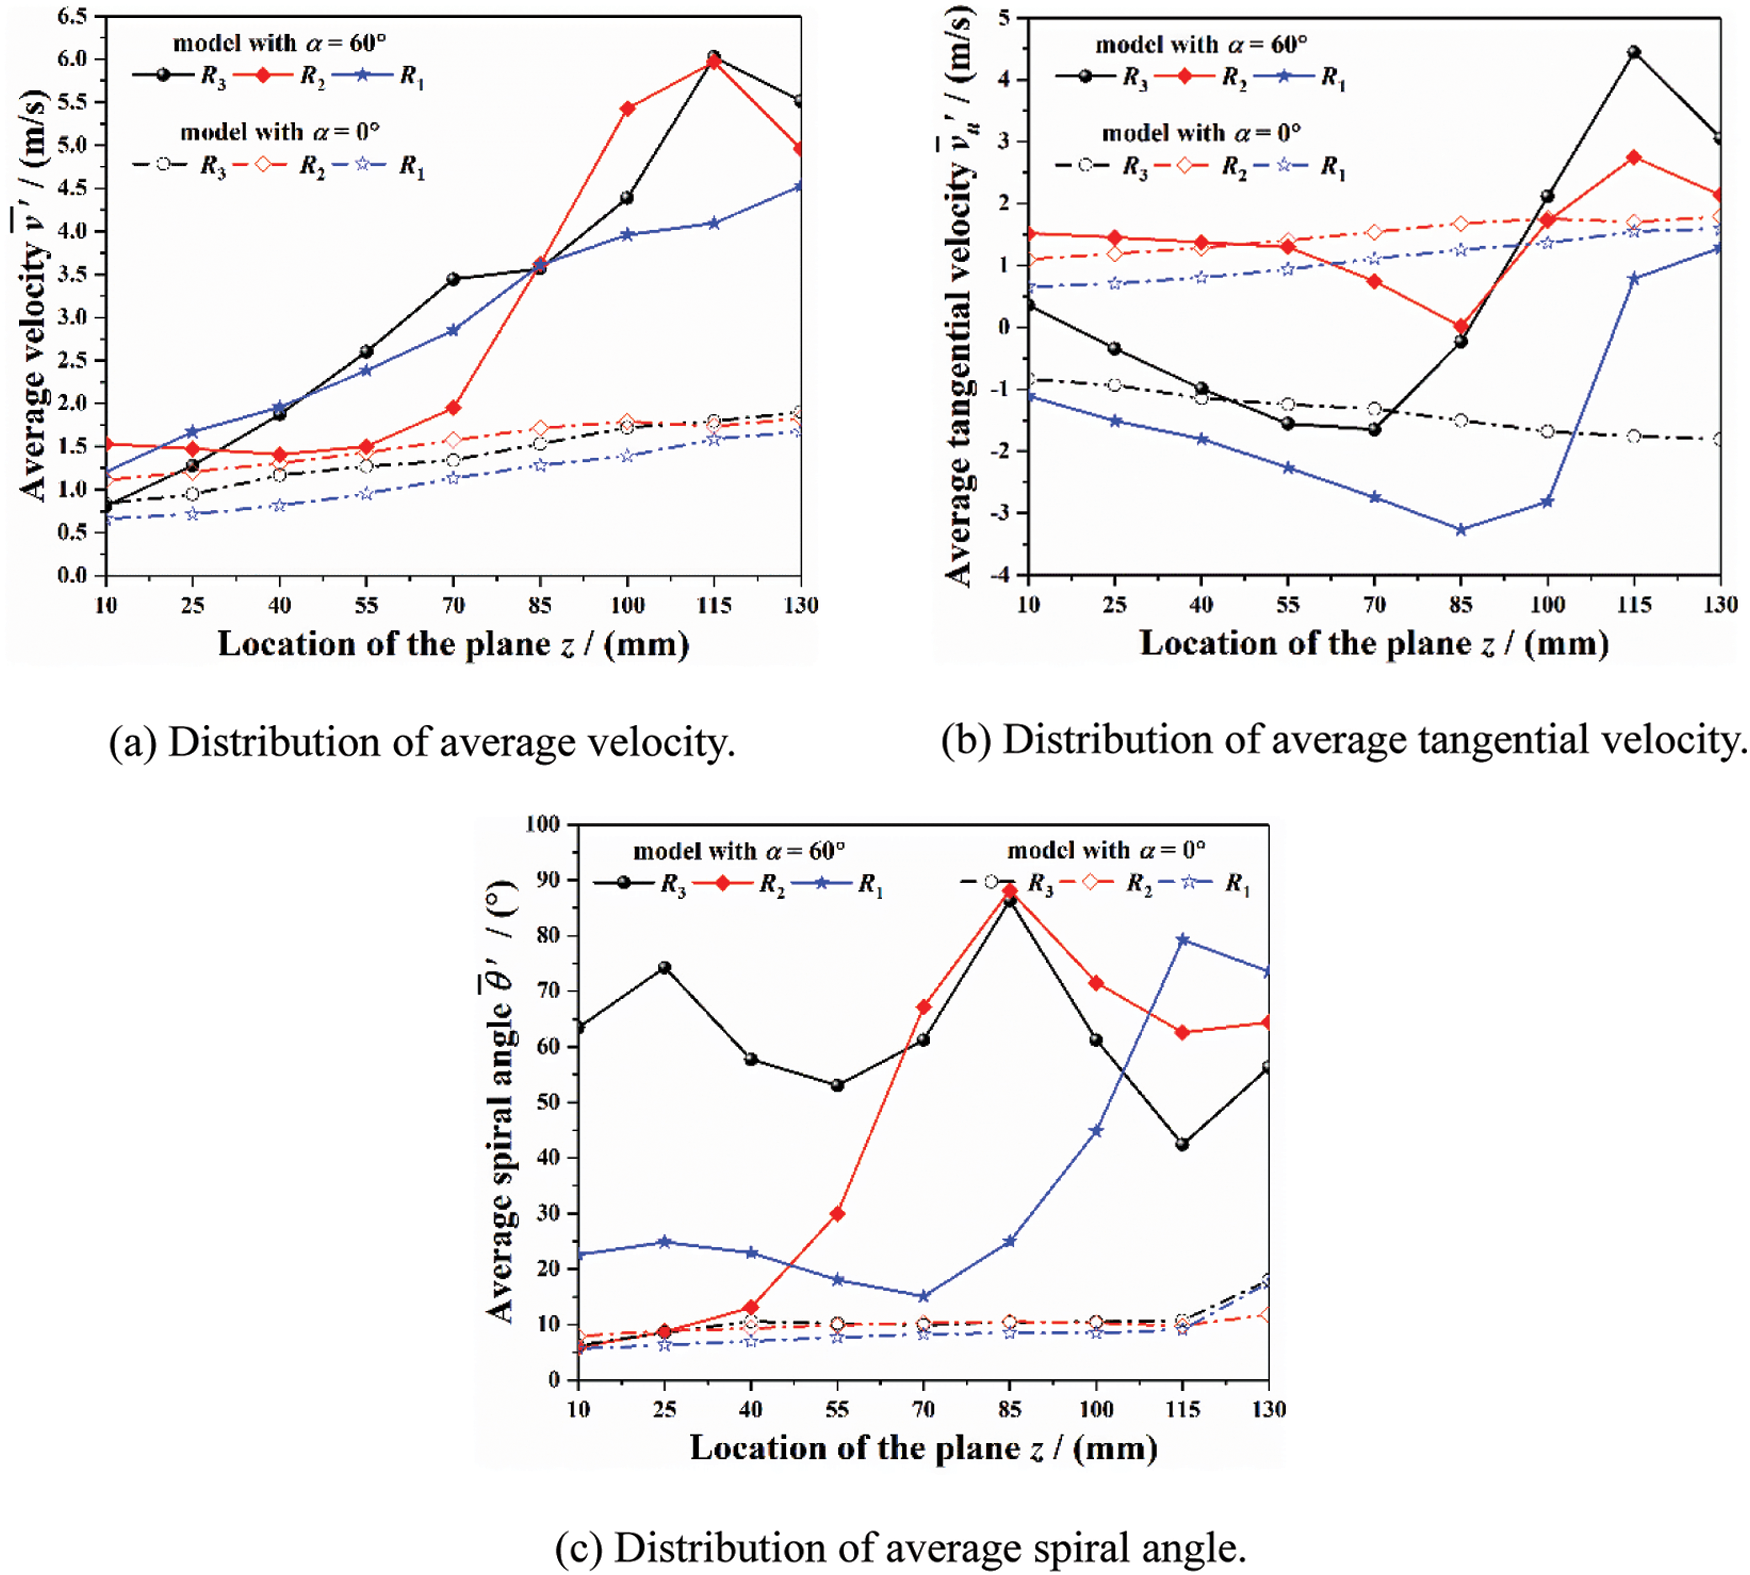
Figure 14: Distribution of average fluid motion parameters inside the tube sockets for R3, R2 and R1 thermometers
However, the higher pressure is beneficial for the main steam to overcome the adverse pressure gradient inside tube socket and continuously move towards the upper end plane. Therefore, while the model with pyramid setting angle of 60° is adopted, the average spiral angle inside the tube socket for R3 thermometer is relatively larger, and there is no “circular flow” (flow with average spiral angle less than 25°) even in the upper section. Instead, the average spiral angle is at the range of 50°–75° within this section. Moreover, the position of the vortex with larger-scale and lower-speed inside the tube socket for R2 thermometer (z = 85 mm) is higher than that inside R1 thermometer (z = 115 mm). Besides, the domain range of “circular flow” within the tube socket for R2 (0–50 mm) is smaller than that inside R1 (0–85 mm). The distributions of pressure within the near-wall region of these tube sockets are shown in Fig. 15, in which the Relative Pressure can be expressed as:
where pa refers to the absolute pressure and the constant C = 15.672 × 10⁶.
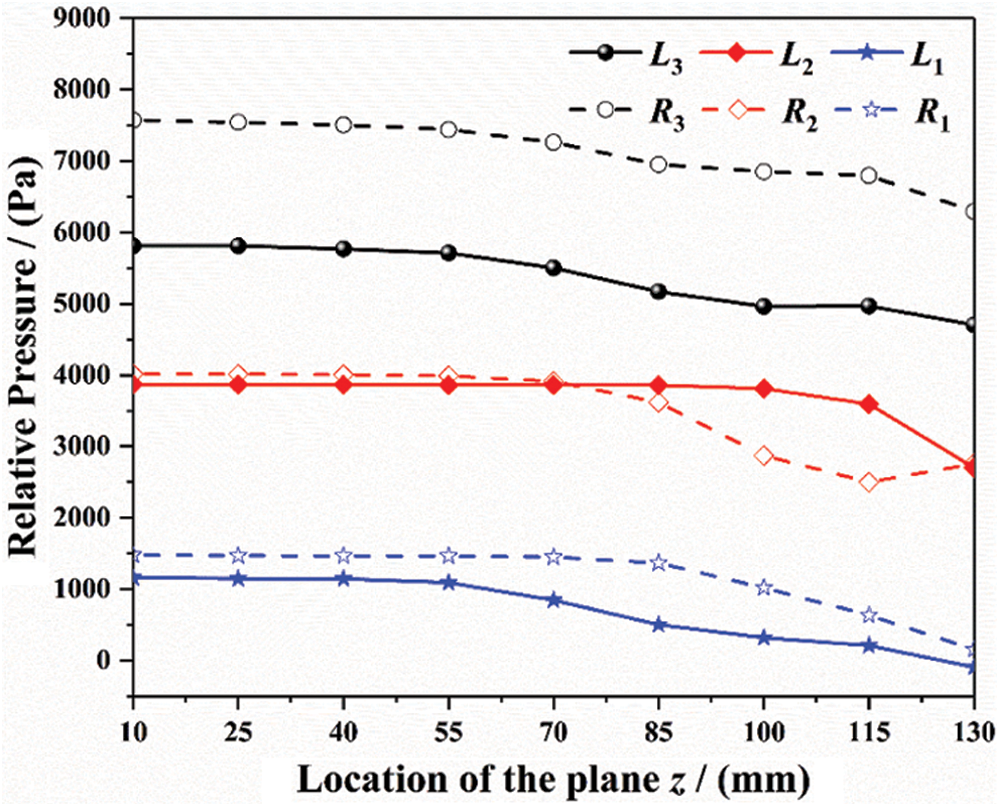
Figure 15: Distribution of relative pressure within the near-wall region inside the tube sockets (α = 60°)
For the model with pyramid setting angle of 0°, the fluid flows inside R3, R2 and R1 thermometers are relatively approximate. The average spiral angle inside each thermometer is basically maintained at about 10°, which means that the fluid flows inside these thermometers are still dominated by tangential motion. Besides, the average velocity or the average tangential velocity inside each thermometer changes slightly along z-axis, keeping in 1 m/s within the upper section.
4.3 Structure Modification for Tube Socket and Results Analysis
During the unit operation, the loads applied to the inner wall of tube sockets include the high-pressure main steam and solid particles carried by the main steam. The upper section of tube socket inevitably turns into an energy accumulation area as a result of the closed upper end plane. Therefore, the inner wall tends to suffer serious damage as the main steam forms a high-speed circular flow within this area.
Considering the fluid flow characteristics inside tube sockets and the feasibility of installation for protective casing, three longitudinal fins (equal length with tube socket, 131 mm) were designed on the inner wall of tube sockets and the optimization results were analyzed. Fig. 16 shows the schematic diagram of tube socket with longitudinal fins.
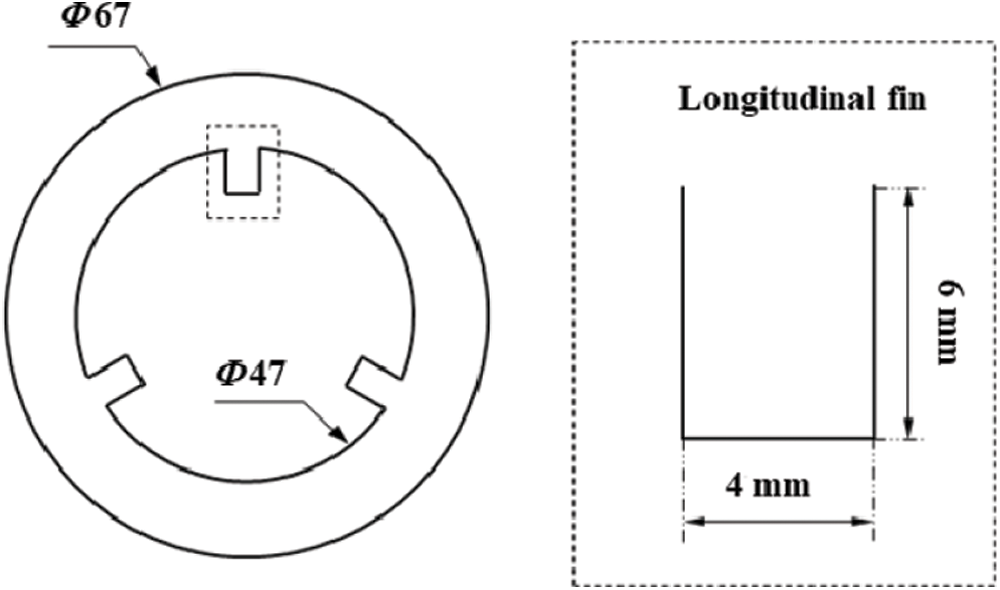
Figure 16: Schematic diagram of tube socket with longitudinal fins
Fig. 17 shows the distribution of average fluid motion parameters inside the tube socket for L3 thermometer. In comparison with the original model, the average velocity within upper-middle section (0–85 mm) decreases by about 50% as shown in Fig. 17a. This means that the kinetic energy of main steam inside tube socket can be effectively reduced by installing the longitudinal fins. As illustrated in the Figs. 17b and 17c, the average spiral angle is at the range of 70°–90° and the decreasing amplitude of average tangential velocity is more than 90%. From the comparison above, it can be concluded that the installation of longitudinal fins helps to change the original spiral flow pattern inside tube socket, which should be able to relieve the damage caused by fluid and solid particles.
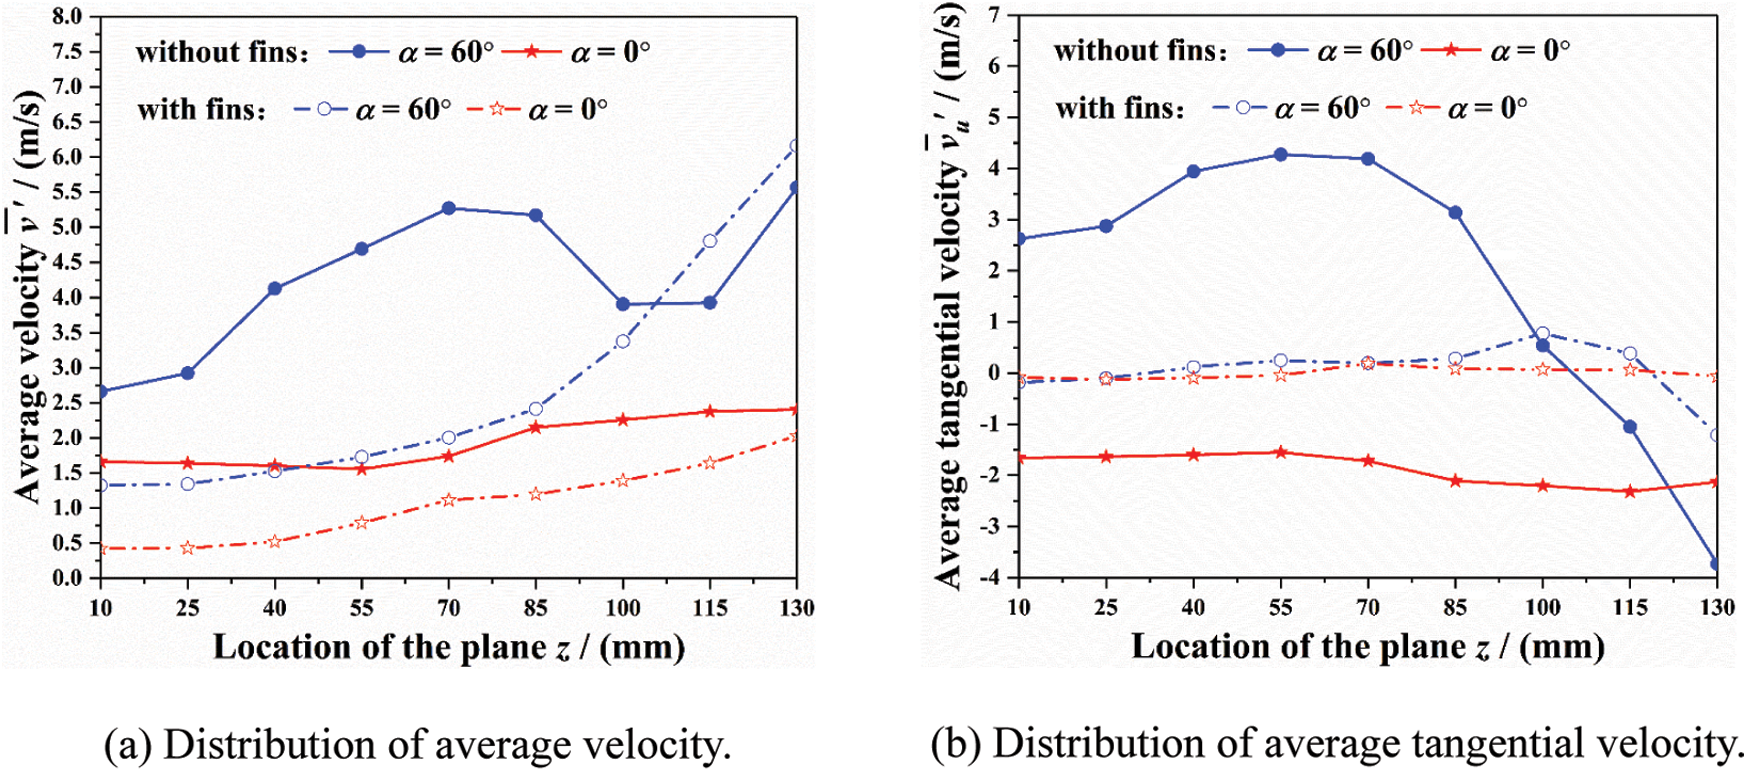
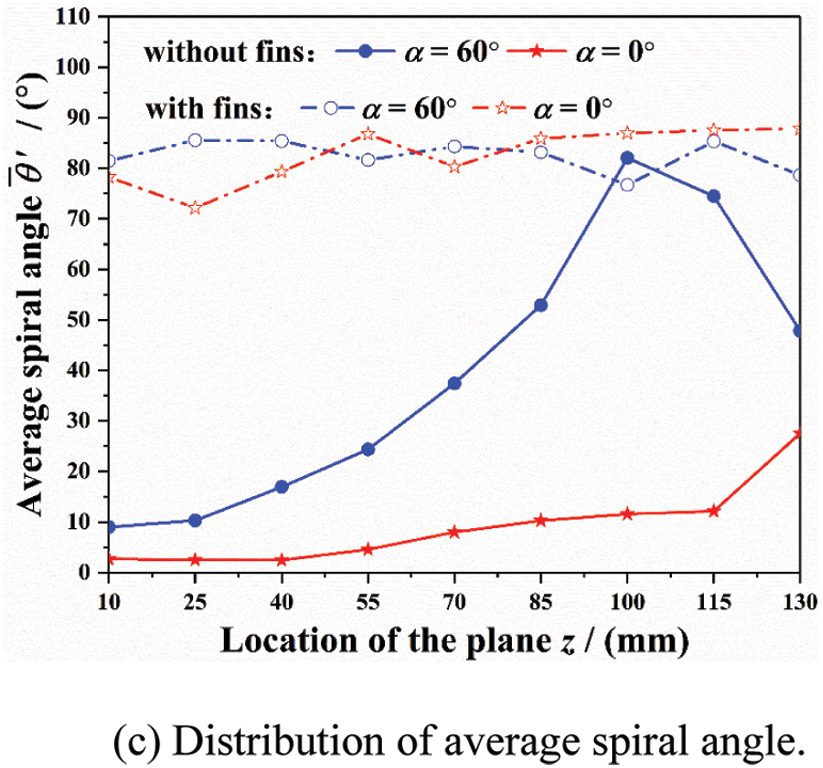
Figure 17: Distribution of average fluid motion para-meters inside the tube socket for L3 thermometer
(1) A large-scale spiral flow is formed inside the tube socket while the main steam enters through the gaps. Besides, resulting from the closed upper end plane, the main steam tends to form a high-speed circular flow within the upper section of tube socket, leading to serious damage on the inner wall.
(2) The setting angle of pyramid has a significant effect on the fluid motion inside tube sockets. While the pyramid setting angle is 0°, the tangential scouring velocity within upper section is only about 50% of that in the model with pyramid setting angle of 60°.
(3) The fluid motion inside tube socket is related to the location of thermometers. Usually, the thermometer located at upstream pipeline is first subjected to the impact from high-speed main steam, resulting in a higher scouring velocity inside tube socket. The wake disturbance from the upstream pyramid tends to affect the fluid motion inside downstream thermometers, and the influence degree is related to the distance between different thermometers and the pyramid setting angle.
(4) The installation of longitudinal fins on the inner wall of tube sockets is effective to reduce the fluid scouring velocity and change the original spiral flow pattern. Specifically, the decreasing amplitude of average tangential velocity is more than 90%, which should be conducive to alleviate the erosion of inner wall.
Funding Statement: The authors received no specific funding for this study.
Conflicts of Interest: The authors declare that they have no conflicts of interest to report regarding the present study.
References
1. Holmberg, K., Erdemir, A. (2017). Influence of tribology on global energy consumption, costs and emissions. Friction, 5, 263–284. DOI 10.1007/s40544-017-0183-5. [Google Scholar] [CrossRef]
2. Hutchings, I. M., Winter, R. E. (1974). Particle erosion of ductile metals: A mechanism of material removal. Wear, 27, 121–128. DOI 10.1016/0043-1648(74)90091-X. [Google Scholar] [CrossRef]
3. Das, S. K., Godiwalla, K. M., Hegde, S. S., Mehrotra, S. P., Dey, P. K. (2007). A mathematical model to characterize effect of silica content in the boiler fly ash on erosion behaviour of boiler grade steel. Journal of Materials Processing Technology, 204, 239–247. DOI 10.1016/j.jmatprotec.2007.11.055. [Google Scholar] [CrossRef]
4. Das, S. K., Godiwalla, K. M., Mehrotra, S. P., Sastry, K. K. M., Dey, P. K. (2006). Analytical model for erosion behaviour of impacted fly-ash particles on coal-fired boiler components. Sadhana, 31, 583–595. DOI 10.1007/BF02715915. [Google Scholar] [CrossRef]
5. Dong, Y., Qiao, Z., Si, F., Zhang, B., Yu, C. et al. (2018). A novel method for the prediction of erosion evolution process based on dynamic mesh and its applications. Catalysts, 8, 432. DOI 10.3390/catal8100432. [Google Scholar] [CrossRef]
6. Yu, C., Si, F. Q., Ren, S. J., Jiang, X. M. (2017). Experimental and numerical predictions of ash particle erosion in SCR monolithic catalysts for coal-fired utility boilers. Korean Journal of Chemical Engineering, 34, 1563–1575. DOI 10.1007/s11814-017-0001-9. [Google Scholar] [CrossRef]
7. Campos-Amezcua, A., Gallegos-Muñoz, A., Alejandro Romero, C., Mazur-Czerwiec, Z., Campos-Amezcua, R. (2007). Numerical investigation of the solid particle erosion rate in a steam turbine nozzle. Applied Thermal Engineering, 27, 2394–2403. DOI 10.1016/j.applthermaleng.2007.03.010. [Google Scholar] [CrossRef]
8. Campos-Amezcua, A., Mazur, Z., Gallegos-Muñoz, A., Romero-Colmenero, A., Riesco-Ávila, J. M. et al. (2007). Numerical study of erosion due to solid particles in steam turbine blades. Numerical Heat Transfer, Part A: Applications, 53, 667–684. DOI 10.1080/10407780701453933. [Google Scholar] [CrossRef]
9. Mazur, Z., Campos-Amezcua, R., Campos-Amezcua, A. (2009). Shape modification of an axial flow turbine nozzle to reduce erosion. International Journal of Numerical Methods for Heat & Fluid Flow, 19, 242–258. DOI 10.1108/09615530910930991. [Google Scholar] [CrossRef]
10. Ilieva, G. I. (2016). Erosion failure mechanisms in turbine stage with twisted rotor blade. Engineering Failure Analysis, 70, 90–104. DOI 10.1016/j.engfailanal.2016.07.008. [Google Scholar] [CrossRef]
11. Martínez, F. R., Velázquez, M. T., Martínez, A. A. R., Silva, F. S., Montes, S. A. et al. (2011). Theoretical and numerical analysis of the mechanical erosion in steam turbine blades. Part I. Energy and Power Engineering, 3, 227–237. [Google Scholar]
12. Singh, P. K., Mishra, S. B. (2020). Erosion behaviour of boiler component materials at room temperature and 400°C temperature. Materials Research Express, 7, 1–15. [Google Scholar]
13. Subramanian, C., Roy, H., Mondal, A., Ghosh, D., Laha, S. K. et al. (2021). Failure of induced draft-ID fan blade in coal fired boiler. Engineering Failure Analysis, 122, 105282. [Google Scholar]
14. Szymański, K., Hernas, A., Moskal, G., Myalska, H. (2015). Thermally sprayed coatings resistant to erosion and corrosion for power plant boilers–A review. Surface and Coatings Technology, 268, 153–164. [Google Scholar]
15. Mishra, S. B., Chandra, K., Prakash, S. (2017). Studies on erosion-corrosion behaviour of plasma sprayed Ni3Al coating in a coal-fired thermal power plant environment at 540 degrees C. Anti-Corrosion Methods and Materials, 64, 540–549. [Google Scholar]
16. Rumi, M. K., Nurmatov, S. R., Mansurova, É. P., Zufarov, M. A., Faiziev, S. A. et al. (2017). Materials for surface protection of heating boiler tubes. Glass and Ceramics, 74, 172–175. [Google Scholar]
17. Gomes, D. D. L., Cardoso, B. R., Furtado, H. C., Diniz, M. G. (2020). Characterization of Fly Ash and a protective coating for Brazilian thermal power plant boilers. Materials Research, 23(6), e20200257. [Google Scholar]
18. Vicenzi, J., Villanova, D. L., Lima, M. D., Takimi, A. S., Marques, C. M. et al. (2006). HVOF-Coatings against high temperature erosion (∼300°C) by coal fly ash in thermoelectric power plant. Materials & Design, 27, 236–242. [Google Scholar]
19. Sidhu, V. P. S., Goyal, K., Goyal, R. (2017). Comparative study of corrosion behaviour of HVOF-coated boiler steel in actual boiler environment of a thermal power plant. Journal of the Australian Ceramic Society, 53, 925–932. [Google Scholar]
20. Panwar, V., Grover, N. K., Chawla, V. (2019). Wear behaviour of plasma sprayed WC−12%Cο and Al2O3-3%TiO2 coatings on ASTM A36 steel used for I.D. fans in coal fired power plants. Materials Research Express, 6, 1065b6. [Google Scholar]
21. Yamagata, T., Ishizuka, A., Fujisawa, N. (2017). Numerical study on non-axisymmetric wall thinning in pipelines with swirling flow. Annals of Nuclear Energy, 101, 196–202. DOI 10.1016/j.anucene.2016.09.040. [Google Scholar] [CrossRef]
22. Chen, D. S., Wang, Y. X., Liu, Q., Lin, Z., Mao, W. (2021). Study on the eccentric jet-flow characteristics induced by the opening regulation with a gate valve. Proceedings of the Institution of Mechanical Engineers, Part C: Journal of Mechanical Engineering Science, 235(21), 5353–5364. DOI 10.1177/0954406221994889. [Google Scholar] [CrossRef]
23. Singh, J. P., Kumar, S., Mohapatra, S. K. (2017). Modelling of two phase solid-liquid flow in horizontal pipe using computational fluid dynamics technique. International Journal of Hydrogen Energy, 42(31), 20133–20137. DOI 10.1016/j.ijhydene.2017.06.060. [Google Scholar] [CrossRef]
24. Zhu, H., Lin, Y., Zeng, D., Ying, Z., Xie, J. et al. (2012). Numerical analysis of flow erosion on drill pipe in gas drilling. Engineering Failure Analysis, 22, 83–91. DOI 10.1016/j.engfailanal.2012.01.007. [Google Scholar] [CrossRef]
25. Zhu, H., Zhang, W., Feng, G., Qi, X. (2014). Fluid–structure interaction computational analysis of flow field, shear stress distribution and deformation of three-limb pipe. Engineering Failure Analysis, 42, 252–262. DOI 10.1016/j.engfailanal.2014.04.021. [Google Scholar] [CrossRef]
26. Zhu, H., Wang, J., Ba, B., Wu, Z., Wang, W. (2015). Numerical investigation of flow erosion and flow induced displacement of gas well relief line. Journal of Loss Prevention in the Process Industries, 37, 19–32. DOI 10.1016/j.jlp.2015.06.015. [Google Scholar] [CrossRef]
27. Zhang, P., Roberts, R. M., Benard, A. (2013). Numerical simulation of turbulent mist flows with liquid film formation in curved pipes using an eulerian-eulerian method. Journal of Fluids Engineering, 135(9), 091303. DOI 10.1115/1.4024264. [Google Scholar] [CrossRef]
28. Patankar, S. V., Pratap, V. S., Spalding, D. B. (2006). Prediction of turbulent flow in curved pipes. Journal of Fluid Mechanics, 67, 583–595. DOI 10.1017/S0022112075000481. [Google Scholar] [CrossRef]
29. Shih, T. H., Zhu, J., Lumley, J. L. (1995). A new reynolds stress algebraic equation model. Computer Methods in Applied Mechanics and Engineering, 125, 287–302. DOI 10.1016/0045-7825(95)00796-4. [Google Scholar] [CrossRef]
30. Azarn, M., Xu, T., Mabood, F., Khan, M. (2021). Non-linear radiative bioconvection flow of cross nano-material with gyrotatic microorganisms and activation energy. International Communications in Heat and Mass Transfer, 127, 105530. DOI 10.1016/j.icheatmasstransfer.2021.105530. [Google Scholar] [CrossRef]
31. Maa, B. (2022). Bioconvection and nonlinear thermal extrusion in development ofchemically reactive sutterby nano-material due to gyrotactic microorganisms. International Communications in Heat and Mass Transfer, 130, 105820. DOI 10.1016/j.icheatmasstransfer.2021.105820. [Google Scholar] [CrossRef]
32. Maouedj, R., Menni, Y., Inc, M., Chu, Y. M., Lorenzini, G. (2021). Simulating the turbulent hydrothermal behavior of oil/mwcnt nanofluid in a solar channel heat exchanger equipped with vortex generators. Computer Modeling in Engineering & Sciences, 126(3), 855–889. DOI 10.32604/cmes.2021.014524. [Google Scholar] [CrossRef]
33. Taylor, G. I. (1923). Stability of a viscous liquid contained between Two rotating cylinders. Philosophical Transactions of the Royal Society of London Series A, 223, 289–343. [Google Scholar]
34. Wu, J. Z., Ma, H. Y., Zhou, M. D. (2006). Vorticity and vortex dynamics. Berlin: Springer Berlin Heidelberg. [Google Scholar]
35. Azam, M., Xu, T., Khan, M. (2020). Numerical simulation for variable thermal properties and heat source/sink in flow of cross nanofluid over a moving cylinder. International Communications in Heat and Mass Transfer, 118(2), 104832. DOI 10.1016/j.icheatmasstransfer.2020.104832. [Google Scholar] [CrossRef]
36. Azarn, M., Xu, T., Shakoor, A., Khan, M. (2020). Effects of arrhenius activation energy in development of covalent bonding in axisymmetric flow of radiative-cross nanofluid. International Communications in Heat and Mass Transfer, 113, 104547. [Google Scholar]
Cite This Article
 Copyright © 2023 The Author(s). Published by Tech Science Press.
This work is licensed under a Creative Commons Attribution 4.0 International License , which permits unrestricted use, distribution, and reproduction in any medium, provided the original work is properly cited.
 Downloads
 Citation Tools