
 Submit a Paper
 Propose a Special lssue
 Open Access
ARTICLE

The Effect of Different Freeze-Thaw Cycles on Mortar Gas Permeability and Pore Structure
1 School of Civil Engineering, Architecture and Environment, Hubei University of Technology, Wuhan, China
2 CNRS, Centrale Lille, UMR9013-LaMcube-Laboratoire de Mécanique Multiphysique et Multiéchelle, Université de Lille, Lille, France
* Corresponding Author: Wei Chen. Email:
(This article belongs to the Special Issue: Advances in Fluid Dynamics and Functional Materials)
Fluid Dynamics & Materials Processing 2023, 19(6), 1623-1636. https://doi.org/10.32604/fdmp.2023.025083
Received 21 June 2022; Accepted 02 September 2022; Issue published 30 January 2023
 View Full Text
 Download PDF
Abstract
Two different freeze-thaw cycles (FTC) are considered in this study to assess the related impact on gas permeability and micro-pore structure of a mortar. These are the water-freezing/water-thawing (WF-WT) and the air-freezing/air-thawing (AF-AT) cycles. The problem is addressed experimentally through an advanced nuclear magnetic resonance (NMR) technique able to provide meaningful information on the relationships among gas permeability, pore structure, mechanical properties, and the number of cycles. It is shown that the mortar gas permeability increases with the number of FTCs, the increase factor being 20 and 12.83 after 40 cycles for the WF-WT and AF-AT, respectively. The results also confirm that gas permeability hysteresis phenomena occur during the confining pressure loading and unloading process.Keywords
Freeze–thaw damage to cement-based materials under the action of FTCs manifests in two ways: internal freeze-expansion cracking and surface erosion spalling [1]. The action of FTCs is one of the causes of the damage to and failure of building structures [2,3]. Currently, the problem of freeze–thaw damage has been studied more vigorously by scholars, and a great deal of research has been conducted on the effects of freeze–thaw damage on the mechanical properties and microstructural variation patterns of cement-based materials; remarkable results have been achieved in these previous studies [4–11]. Among them, hydrostatic pressure theory, osmotic pressure theory, and crystallization pressure theory have high recognition and influence [12,13]. Wang et al. [14] studied the variations in the compressive strength of concrete after different FTCs for different concentrations of salt solutions, and the results showed that the compressive strength of concrete decreased as the cycle times increased. Furthermore, an increase in the concentration of the sulfate solution resulted in more serious damage to the concrete as a result of FTCs. Shang et al. [15] studied the compressive and splitting strengths of different types of air-entrained concrete after rapid FTCs and established a concise mathematical formula for the relationship between mechanical behavior and the number of rapid FTCs. Wang et al. [16] studied mortars with different water-cement ratios and found that the proportion of internal macropores increased as the number of FTCs increased. Furthermore, he proposed a method to predict the remaining life of mortars after FTCs by fitting the deterioration of the pore structure and macroscopic FTCs. Freeze–thaw damage essentially degrades the durability of materials by destroying the pore structure, and gas permeability, which is an important indicator of durability, can visually reflect the changes in the pore structure. Therefore, the permeability properties of cement-based materials at depth after freeze–thaw damage need to be studied [17–20]. Kogbar et al. [21] found that FTCs increased the number and interconnection of microcracks based on acoustic emission, X-ray computing tomography and water and chloride permeability tests, and these changes further accelerated the deterioration of concrete and increased permeability. Yang et al. [22] found that under coupled freeze–thaw loading, the effect of FTCs on the permeability of concrete was greater than that of applied loads. At present, the main methods for testing gas permeability are the Cembureau method [23], OPI method [24,25] and Hamami method [26]. In this experiment, the quasi-steady-state flow method based on the Cembureau method was used. This method is advantageous because it only requires measurements of the pressure decay at the inlet end for a period of time to obtain the gas permeability at the inlet end. To study the variations in the internal microstructure of the material after FTCs, many scholars have also adopted different microscopic experimental methods; Zhang et al. [27] adopted mercury intrusion porosimetry (MIP) to determine the effects of FTCs on porosity and pore size distribution. Johannesson et al. [28] adopted the BET method to measure the adsorption and desorption of mortar and analyzed the effect of carbonation on the microstructure of cement paste. NMR is an important technique for characterizing porous materials, especially for volumetric measurements of the statistical properties of pore space. Therefore, NMR is widely used to study the internal structure of materials [29–32]. The NMR method, which can more accurately reflect the damage to the internal microstructure of the mortar, was adopted in this study to establish a relationship between the microscopic and macroscopic levels.
Overall, most current studies have focused on the mechanical properties of cement-based materials, while few studies on gas permeability have been conducted. Moreover, most freeze–thaw cycle experiments are WF-WT, whereas few scholars have investigated the effect of freeze–thaw damage on mortars from WF-WT and AF-AT. Therefore, this study focused on gas permeability. Variations in gas permeability and pore structure were investigated using two types of mortars under freeze–thaw damage. The relationships between the gas permeability, pore structure, and FTCs of mortars were further explored to provide theoretical support for the assessment of the durability of cement-based materials after freeze–thaw damage.
The cement used in this study was commercial ordinary Portland cement with a grade of P•O 42.5. Its physical properties include high strength, high heat of hydration, and good resistance to frost. Furthermore, it does not resist high temperature. The chemical compositions of the cement are shown in Table 1. In accordance with the Standard for Test Method of the Cement Mortar Strength (GB/T17671-2021), the mixture proportions of mortar are shown in Table 2. The fine aggregate was natural river sand with a fineness modulus of 2.6. The mortar specimens were cylindrical with a size of 50 mm × 100 mm. The specimens were demolded 24 h after casting and maintained in water containing quicklime for 56 d. Before starting the test, both ends of the specimens were polished until smooth before the permeability test.
In accordance with the Standard for Test Methods of Long-term Performance and Durability of Ordinary Concrete (GB/T50082-2009), this test used a programmable low temperature chamber for the FTCs of mortar. According to different cooling environments, this test was divided into two different FTCs: WF-WT and AF-AT. During the WF-WT test, the mortar was completely submerged in water, whereas for the AF-AT test, the saturated mortar specimens were first wrapped with cling film and placed in the low-temperature chamber. The variations in the mortar specimen mass were measured every five cycles, and the AF-AT specimens were vacuumed and saturated with water for two hours to ensure that sufficient water entered the mortar. One FTC lasted seven hours; the freezing and thawing processes each required two hours, followed by three hours of stabilization time at the minimum temperature. The minimum and maximum temperatures were set to −20°C and 20°C, respectively.
The instrument used for the mechanical test was an ETM series electronic universal testing machine. According to the Standard for Test Methods of Concrete Physical and Mechanical Properties (GB/T50081-2019), the loading indenter was first adjusted down to the specimen surface position with no initial pressure. The loading speed was referenced by the computer for pressure at a rate of 0.1 mm/min. A data acquisition system was used to obtain the loading force and displacement.
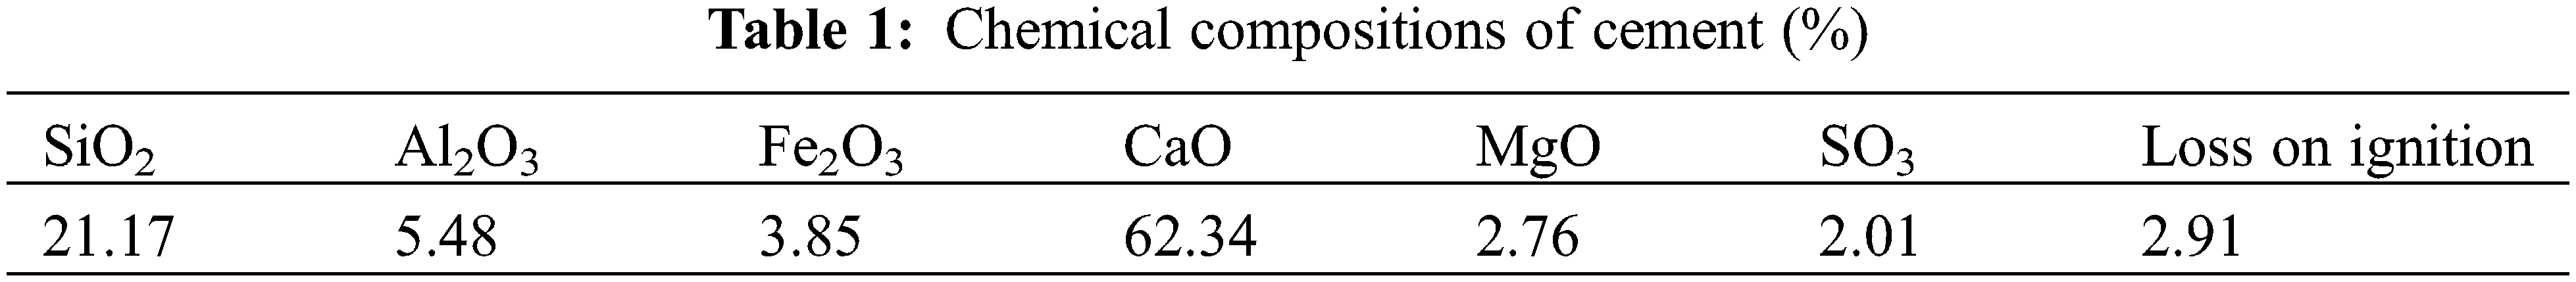
Gas permeability was measured with a high-precision and high-confinement gas permeability instrument introduced in and from France. The instrument mainly consists of a confining cell, a high-pressure servo oil pump, and a gas transmission reference system. The maximum loading confining pressure was 60 MPa, and the gas permeability measurement can reach 10−22 m2. In this test, an inert gas, argon, was adopted as the permeation medium. The simplified principle of the gas–liquid permeameter is shown in Fig. 1.
Figure 1: Simplified schematic diagram of the gas permeameter
Before the test, the specimens treated by FTCs were placed in the oven at 60°C for 48 h to eliminate the influence of free water in the pores of the specimens on the gas permeability test results. To protect the internal structure of the specimens from damage caused by high temperature, we adopted 60°C as the drying temperature. Before the gas permeability test, the mortar specimens were bound with a waterproof rubber sleeve to prevent the entry of the confining pressure oil during the test and to ensure gas transmission in a one-dimensional direction. The mortar specimen was then placed in the confining cell for the gas permeability test. The confining pressure was provided by a high-pressure servo oil pump and was loaded in steps from 3, 5, 10, 15 to 20 MPa, and finally unloaded to 3 MPa. The gas permeability was measured by a quasi-steady state flow method based on Darcy’s law:
where Kx is the apparent gas permeability coefficient in m2; Vx is the gas flow rate at x from the inlet end of the specimen in m/s; Qx is the corresponding gas flow rate in m³/s, A is the cross-sectional area of the specimen in m2; μ is the viscosity coefficient of argon, 2.25 × 10⁻⁵ Pa, s; and P(x) is the function of the air pressure inside the specimen with height.
Astable inlet air pressure was maintained using a storage tank at the inlet, and the outlet was connected to the atmosphere. The volume of the gas holder was V1, the gas pressure value in the holder before the start of the test was P1, and the air pressure decreased by ΔP1 in time t after the start of the test. Assuming that the mean value of the inlet air pressure, Pa, of permeation was the mean pressure of the buffer reservoir, P1-ΔP1/2, over a given time period, Δt, the ideal gas law then yields the mean flow rate of the specimen over the time period Δt as follows:
The formula for calculating the gas permeability coefficient is:
where L is the percolation path, i.e., the height of the specimen, and P0 is the atmospheric pressure.
The nuclear magnetic resonance (NMR) test was conducted with an NMR analyzer developed by Suzhou Newmark. The NMR relaxation time method was used to obtain information about the pore structure by detecting the signal amount of hydrogen atoms in the water-saturated specimen. Therefore, before the NMR test, the specimen needs to be water saturated. A higher signal intensity of hydrogen atoms indicated more water content and larger pores in the specimen and vice versa.
Fig. 2 shows the apparent variations of the mortar after 40 FTCs (left is AF-AT and right is WF-WT). Compared with AF-AT, the mortar after WF-WT exhibited serious apparent damage, with an uneven surface and clearly visible holes. This damage occurred mainly because the cement pastes on the surface of the mortar spalled to different degrees during the FTCs. Before the gas permeability test, the mortar surface was chiseled flat with high-strength plaster to prevent the rupture of the rubber jacket under the action of the confining pressure.
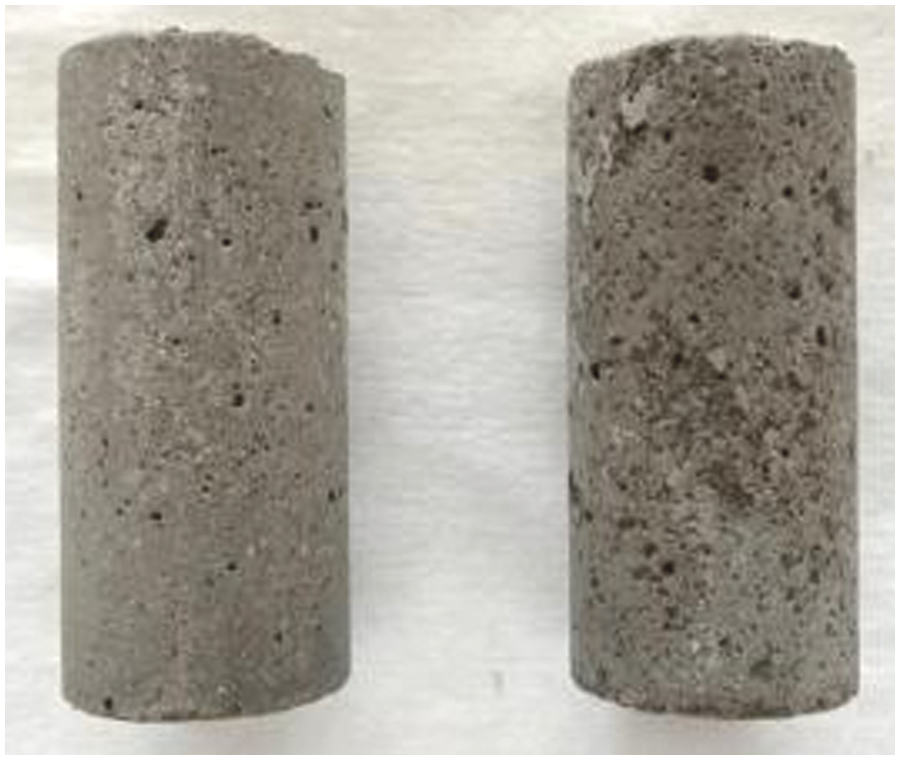
Figure 2: The apparent variations of mortar after FTCs
The variations in the mortar mass loss rate after FTCs are shown in Fig. 3. Under the two freeze–thaw mechanisms, the mass loss rate of the mortar increased as the number of cycles increased. After 40 FTCs, the mass loss rates under the WF-WT and AF-AT mechanisms were 0.27% and 0.16%, respectively. Wu et al. [33] studied the resistance to freeze-thaw of thermal insulating biobased lightweight concrete and showed that the mass loss of the concrete increased with time during the freeze-thaw test and that freeze-thaw failures developed particularly rapidly once obvious cracks formed on the surface of the concrete. During the initial AF-AT period, the mortar quality loss rate showed a negative value, indicating an increase in quality. This increase occurred because the moisture on the outer surface of the mortar is dissipated during the circulation process during the AF-AT process, resulting in a lower moisture content of the specimen. Therefore, some of the pores are left with no water and remain in a dry state; the hydrostatic pressure generated in the freezing process is small, and the surface flaking is not obvious. However, the surface of the mortar under the crystallization pressure produced a small number of microcracks because some of the pore water froze. The resulting microcracks absorbed water in the process of water saturation at the end of every five cycles. The mass of this part of the water was greater than the mass of mortar spalling on the surface, leading to an increase in quality after FTCs. For the WF-WT test, the pores remained saturated, and the greater hydrostatic pressure generated by the pore water freezing caused micro cracks on the mortar surface. As the FTC continued to increase, the free water in the pores inside the mortar repeatedly froze, and the resulting hydrostatic and crystallization pressure continuously increased. Under the combined action of the two, the microcrack generation and development rate on the mortar surface was accelerated, and serious mortar surface spalling occurred, which led to a decrease in quality.
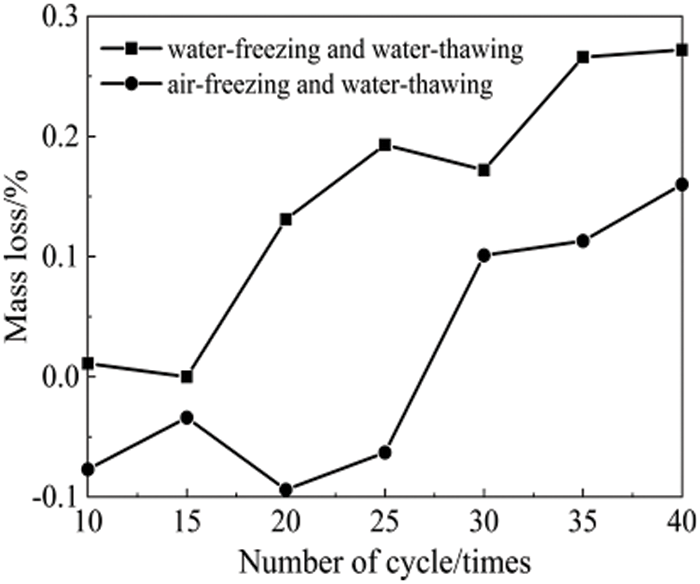
Figure 3: Variations in the mass loss rate
Fig. 4 represents the relationship between the compressive strength and the number of FTCs. The compressive strength of mortar under both freeze–thaw mechanisms gradually decreased as the number of FTCs increased. Compared to the control group (0 cycles), the compressive strengths after ten cycles under the WF-WT and AF-AT mechanisms were reduced by 5.7% and 10.1%, respectively. This result indicates that the freeze–thaw cycling action leads to a reduction in compressive strength. In the WF-WT mechanism, the compressive strength of mortar decreased by 30.85% after 40 cycles compared with ten cycles, while in the AF-AT mechanism, the compressive strength of mortar decreased by 24.01% after 40 cycles compared with ten cycles. The compressive strength of mortar decreased more under the WF-WT mechanism compared with the AF-AT mechanism, and the damage to the mortar was more serious. Lu et al. [34] studied four categories of damage modes: fatigue compression loading, FTC, fatigue compression loading followed by FTC, and FTC followed by fatigue compression loading on the dynamic compressive strength of concrete. The results showed that the compressive strength decreased linearly with an increasing number of FTCs under the single effect of FTC.
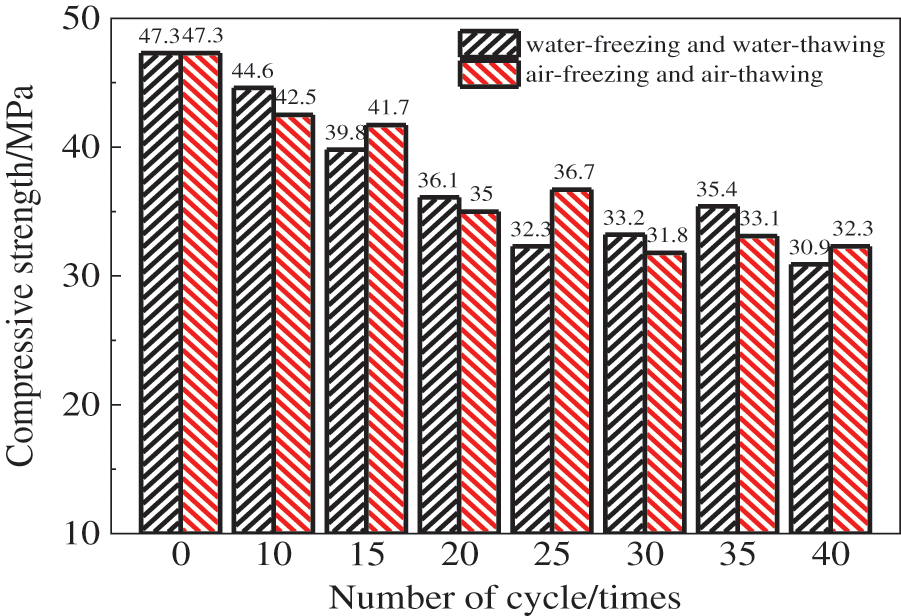
Figure 4: Variations in compressive strength of mortar
3.3 Gas Permeability of Mortar
3.3.1 Effect of the Number of Cycles
The initial gas permeability of the mortar under a 3-MPa confining pressure was analyzed after different numbers of FTCs. Fig. 5 shows that increasing the number of two FTCs increased the initial gas permeability of the mortar overall. Marciniak et al. [35] investigated the transport properties of cement mortars with different types of cement and water-cement ratios subjected to FTCs. Her study showed that the gas permeability increased with the number of FTCs, and the degree of freeze–thaw damage was greater for cement mortars made from Portland cement at higher water-cement ratios, which corroborates the results outlined above. When the mortar underwent 40 FTCs, the initial gas permeability increased 20-fold and 12.83-fold under the two mechanisms of WF-WT and AF-AT, respectively, compared with the reference group. This increase occurred mainly because the freezing of pore water inside the mortar during the FTC generated considerable hydrostatic pressure and crystallization pressure. The tensile strength of the internal material of the mortar could not withstand the combined action of the two, which damaged the internal pore structure and generated larger pores and microcracks, consequently increasing gas permeability of the mortar. Furthermore, the gas permeability under the two freeze–thaw mechanisms did not linearly increase with the number of cycles. The initial gas permeability was fitted to the segments (see Fig. 5), which shows that the variations of the initial gas permeability of the mortar were relatively stable between 25 cycles and 35 cycles. The initial gas permeability of the mortar increased sharply when more than 35 cycles were performed. Therefore, a critical threshold zone exists during the FTC from the damage accumulation zone to the acute damage zone in the mortar. Notably, before 25 cycles, the initial gas permeability was larger for air freezing and air thawing than for water freezing and water thawing. This difference occurred because the mortar specimen was fully submerged in water for the WT-WT process, and the liquid water in the internal pores of the specimen and the water in the external sink exert pressure on each other after freezing to offset part of the hydrostatic pressure, resulting in weakened damage to the pore structure.
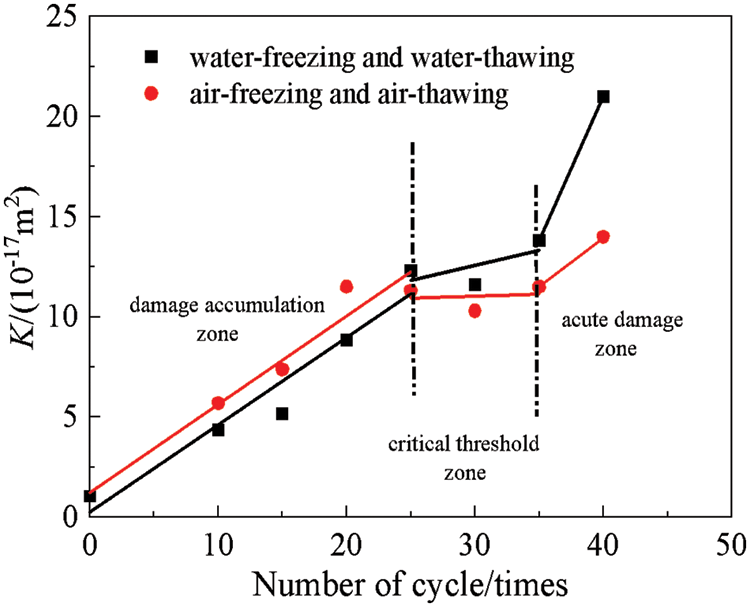
Figure 5: Variations in the initial permeability of mortar
3.3.2 Effect of Confining Pressure
Fig. 6 shows the variations in the mortar gas permeability with the confining pressure under different FTCs. The influence of the confining pressure on the mortar gas permeability was significant, and the mortar gas permeability gradually decreased as the confining pressure increased after FTCs. This relationship arose because the confining pressure subjects the mortar specimens to different degrees of extrusion, resulting in a smaller pore structure, which leads to a decrease in the gas permeability. Moreover, the gas permeability varied more significantly at lower confining pressures and more slowly at higher confining pressures, irrespective of freeze–thaw damage, which indicates that a threshold value exists for the effect of confining pressure on the gas permeability of mortar. When the confining pressure was loaded beyond this threshold, the gas permeability reduction rate slowed. Xue et al. [36] investigated basalt fiber reinforced concrete’s permeability and pore structure under the action of confining pressure after high temperature. The study showed that the permeability of the concrete specimens decreased with increasing confining pressure, and the permeability decreased most rapidly at the beginning of the confining pressure loading (3–5 MPa); as the confining pressure continued to increase (5–7 MPa), the permeability decreased slowly; finally, when the confining pressure was 7–8 MPa, the permeability stabilized. This study is consistent with our experimental results outlined above.
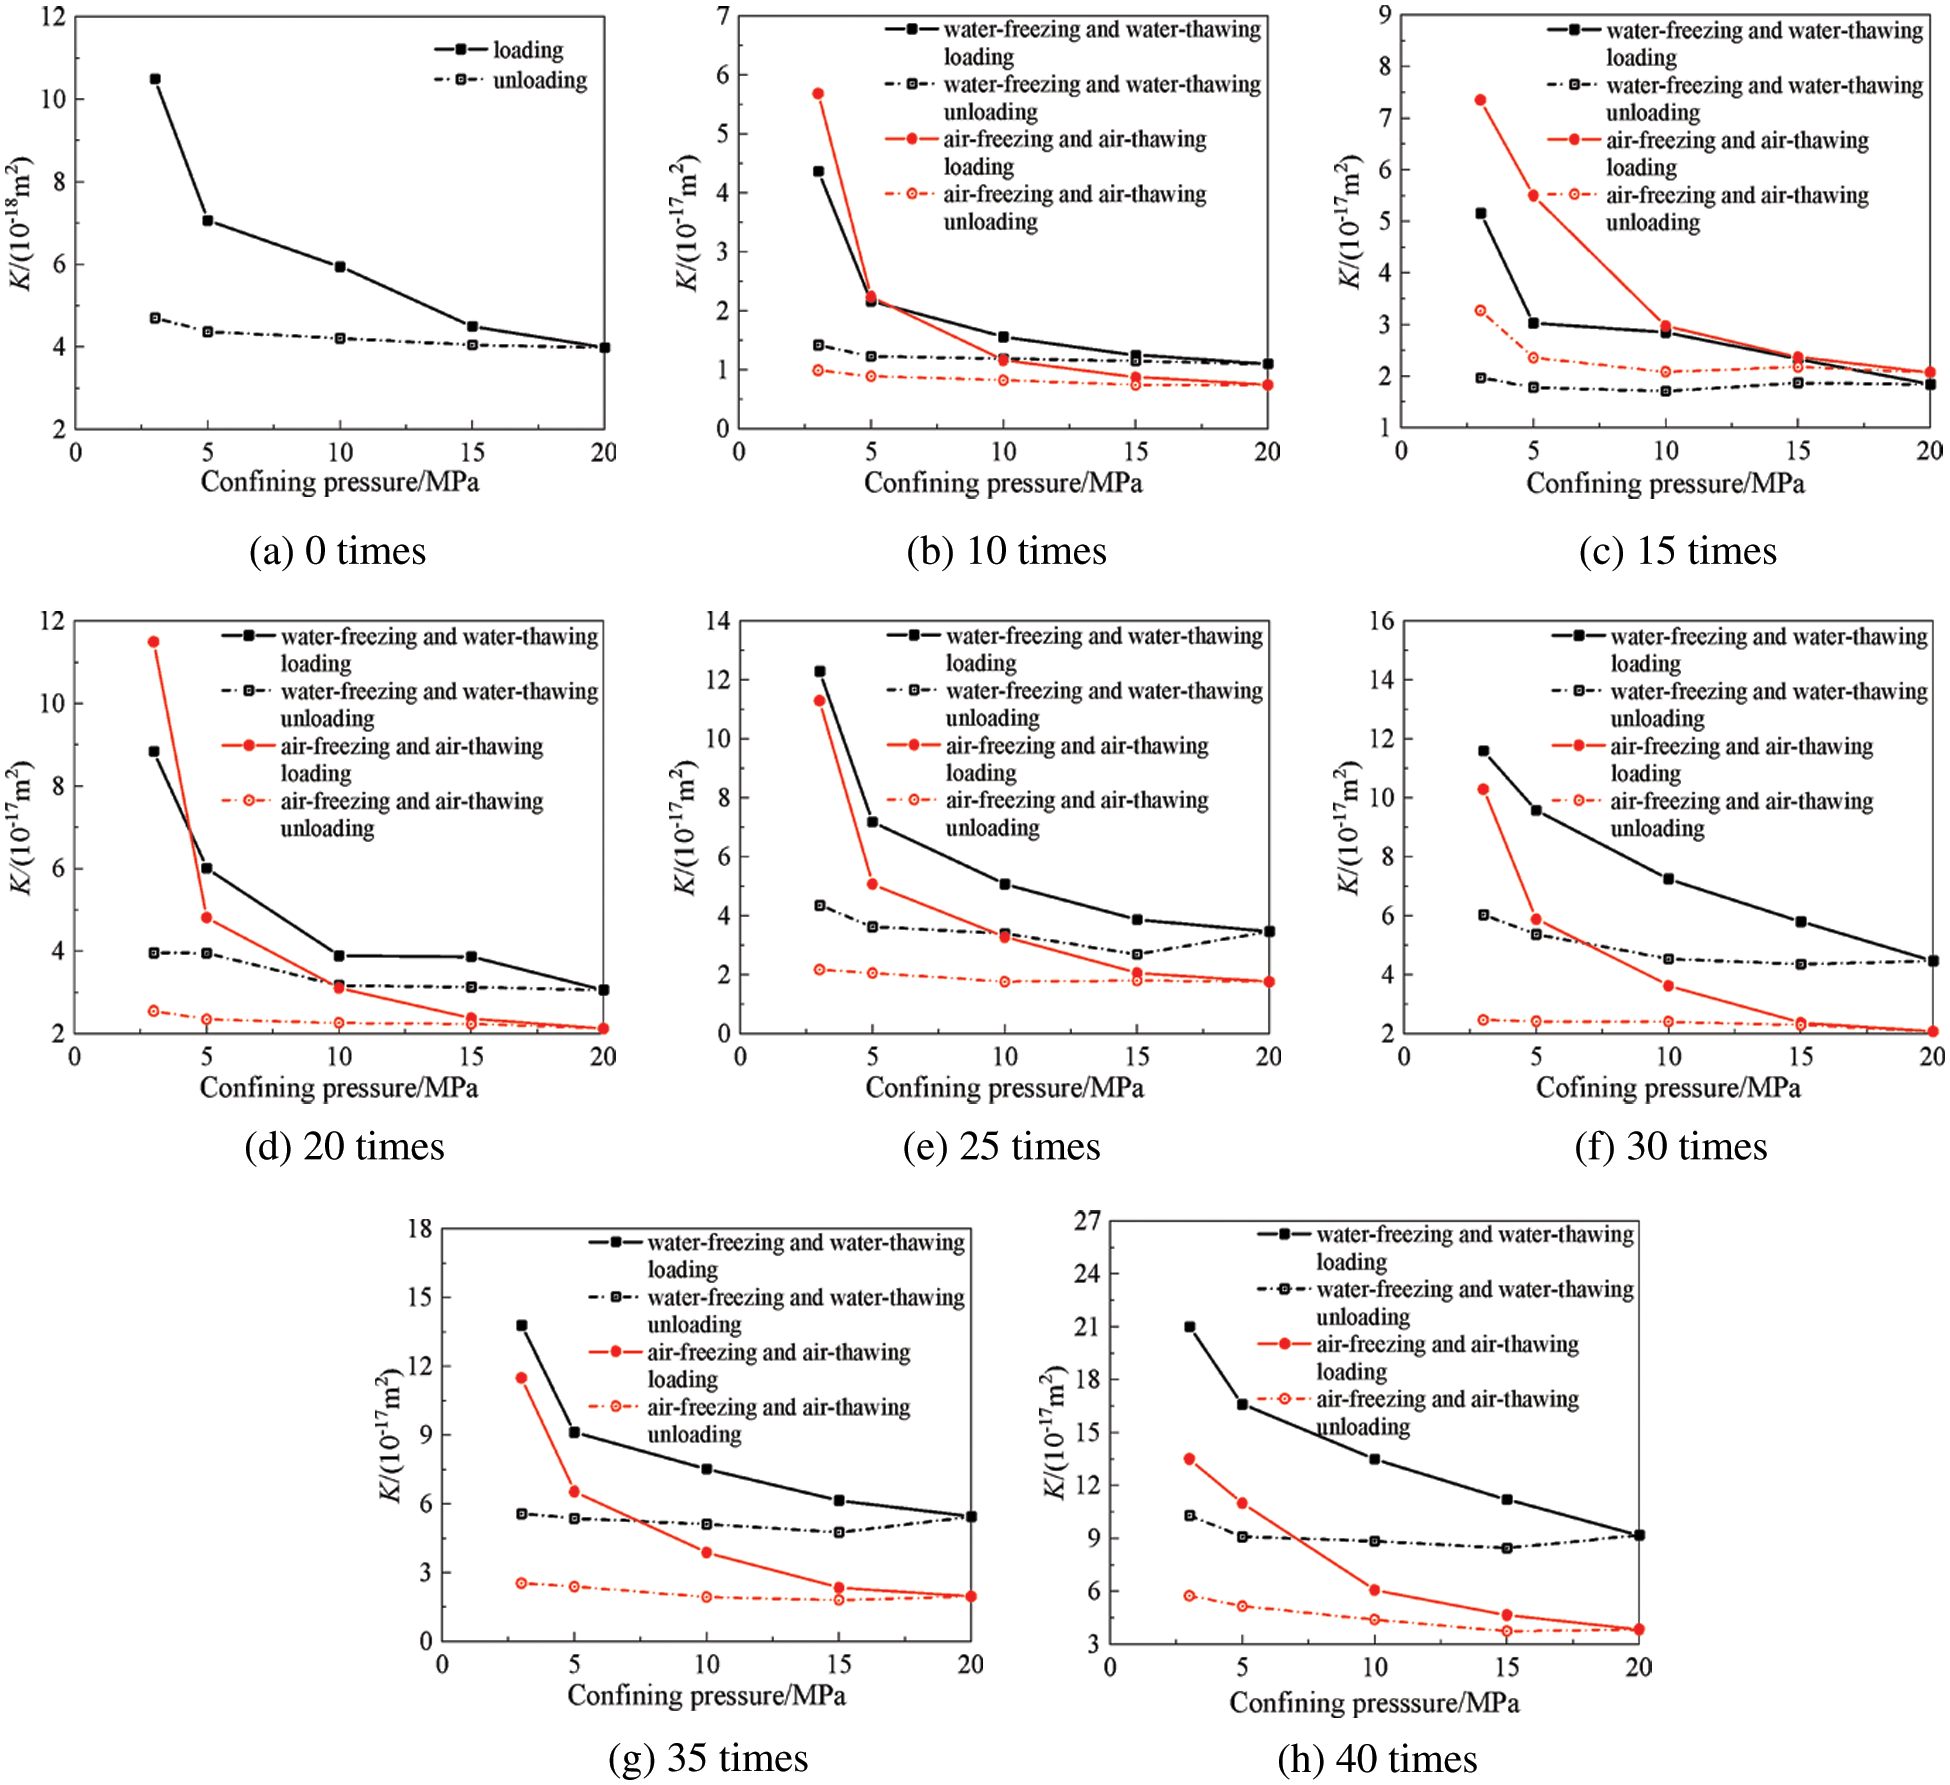
Figure 6: Variations in the gas permeability of mortar with confining pressure after FTCs
After the mortar was subjected to two different freeze–thaw mechanisms and various different numbers of FTCs, the mortar gas permeability decreased by approximately 50%–70% compared with the initial gas permeability when the confining pressure was increased from 3 MPa to 10 MPa. The mortar gas permeability decreased by approximately 30%–40% compared with the gas permeability at 10 MPa when the confining pressure increased to 20 MPa. The mortar gas permeability values all were highly sensitive to the confining pressure after different freeze–thaw damages. In this test, the mortar gas permeability was in the range of 3–10 MPa for the pressure-sensitive zone and in the range of 10–20 MPa for the pressure-insensitive zone.
The gas permeability of mortar under confining pressure was varied by changing the internal pore structure characteristics. After FTCs, many pores and microfractures were produced inside the mortar. When the confining pressure was low, the gas permeability of mortar significantly decreased as the confining pressure increased because the internal pore structure and penetrating fractures were compressed under confining pressure, which reduced the free path of gas and, thus, the gas flow [37]. When the confining pressure continued to increase, the mortar gas permeability decreased slowly because most of the pores and fractures inside it had already been closed, and only some very small pore structures could be altered; thus, the gas permeability only slightly changed at high confining pressures. Xue et al. [36] also confirmed this finding. To further explore the relationship between the confining pressure and the gas permeability of mortar, the results of gas permeability for all mortars after freeze–thaw damage at each loading confining pressure were also fitted and analyzed. The power function given by the following equation best fit the data:
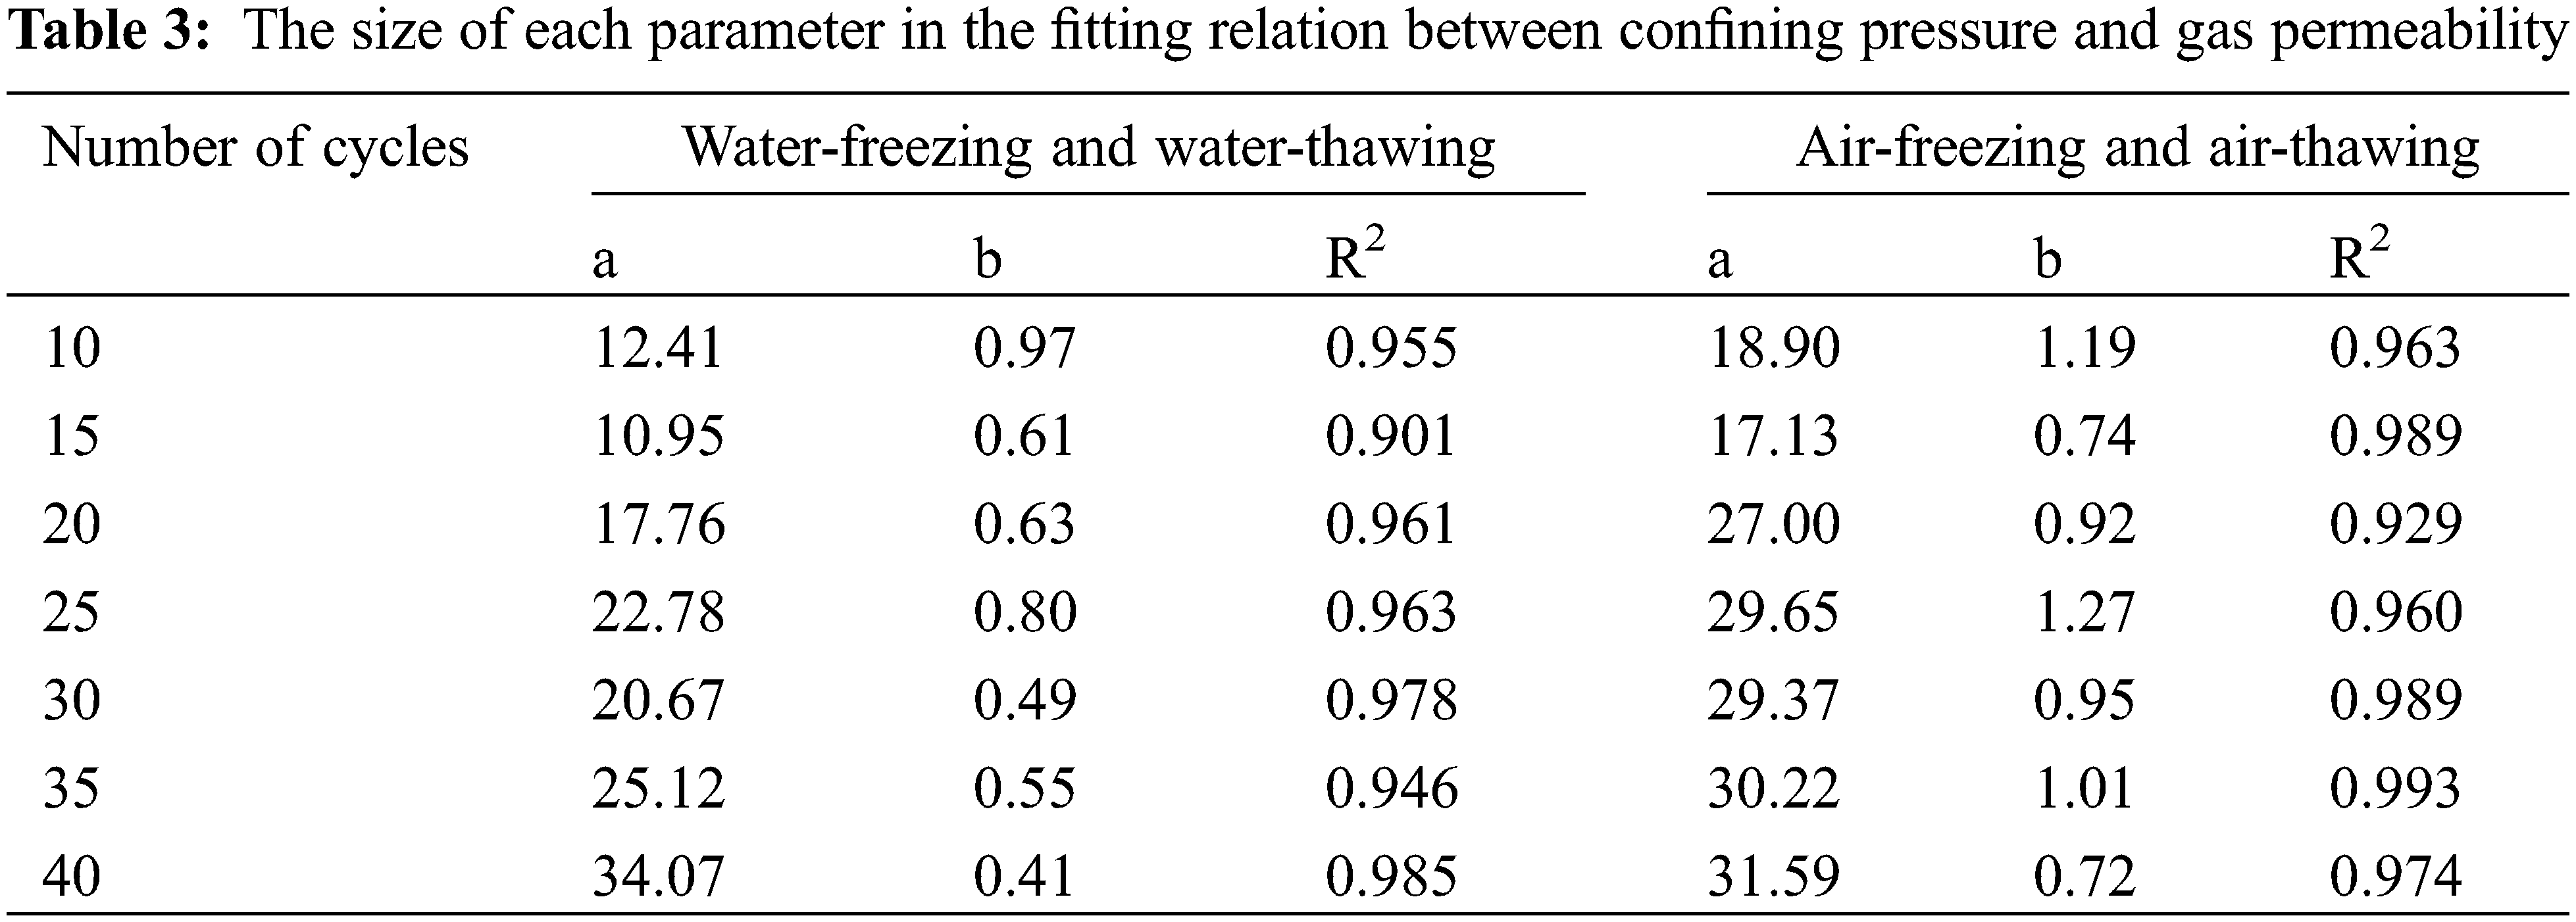
where K is the gas permeability in m²; Pc is the confining pressure in MPa; and a and b are the coefficients. The coefficients in the fitted relationship between the confining pressure and gas permeability after different FTCs obtained by fitting are shown in Table 3.
3.3.3 Hysteresis Effect on Gas Permeability
Fig. 6 reveals that the gas permeability varied more significantly at lower confining pressures and more moderately at higher confining pressures during both the loading and unloading stages. Compared with the gas permeability during the loading and unloading stages, the loading stage more significantly affected the mortar gas permeability. During loading and unloading, the gas permeability of the mortar slightly increased as the confining pressure decreased due to the recovery of the internal pore structure of the mortar. Nevertheless, the gas permeability could not recover to the initial level before loading, and the recovery of the gas permeability exhibited marked hysteresis.
To better analyze the hysteresis effect of mortar gas permeability after freeze–thaw damage, the difference in gas permeability under each loading and unloading condition was calculated for the same confining pressure, which yielded a law for the gas permeability difference as a function of the confining pressure after different freeze–thaw damages of mortar loading and unloading, as shown in Fig. 7. The difference in gas permeability of mortar after different freeze–thaw damages gradually decreased as the confining pressure increased. The difference was largest at a low confining pressure of 3 MPa, and the smaller the confining pressure was, the more difficult it was for the gas permeability of the mortar to return to the initial value. Conversely, higher confining pressures corresponded to a smaller difference in the gas permeability. This finding indicates that the brittle deformation of mortar is more sensitive to the confining pressure, and larger deformations can occur at a lower confining pressure, which decreased the mortar porosity and in turn reduced the mortar gas permeability. Furthermore, the regularity of the mortar hysteresis effect under the WF-WT mechanism was more pronounced than that of AF-AT. Under the same confining pressure, the hysteresis effect of mortar gas permeability gradually increased with the number of cycles. Under the AF-AT mechanism, although the gas permeability hysteresis effect was more discrete with increasing cycle times, it showed an overall increasing trend. This finding indicates that the number of FTCs affects the elastic–plastic deformation capacity of the mortar. Increasing the number of cycles reduces the likelihood of elastic deformation for the mortar and results in more pronounced plastic deformation. Therefore, recovery from deformation is less likely and the pore structure is more difficult to recover, which increases the difference in gas permeability.
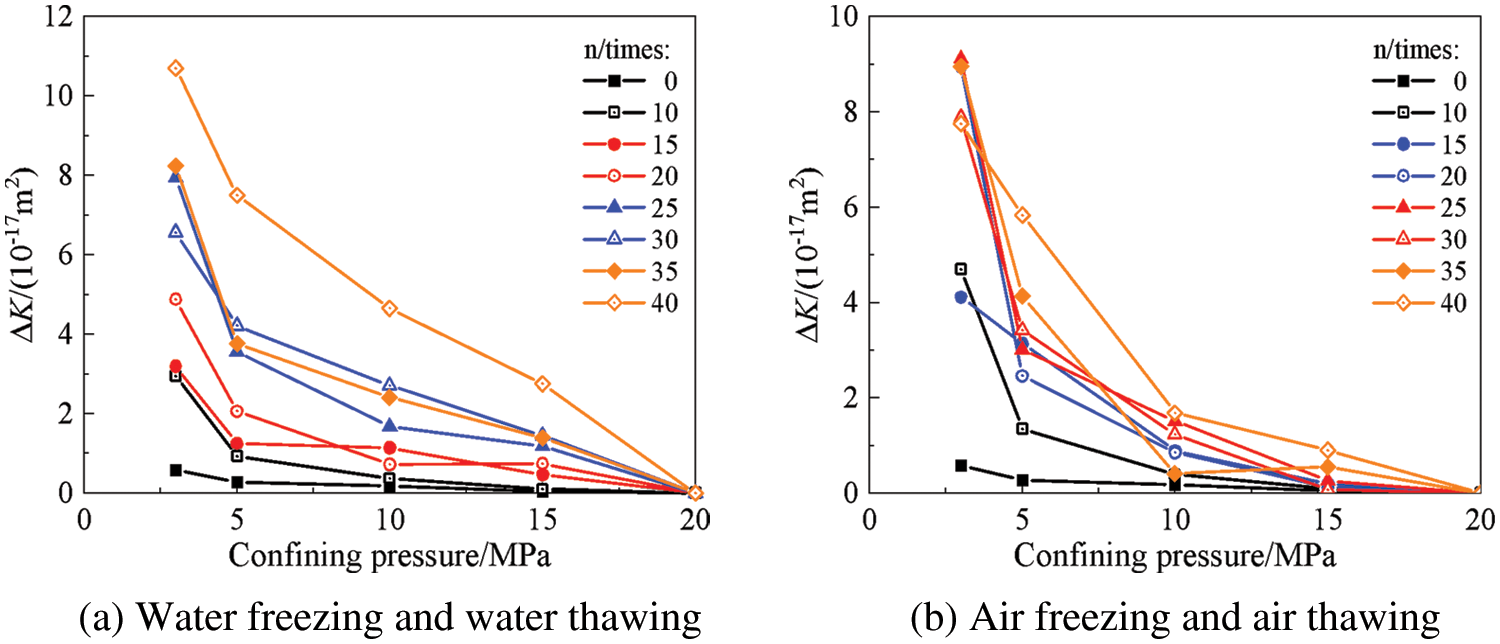
Figure 7: Variations in the gas permeability difference between mortar loading and unloading with confining pressure after FTCs
3.4 Analysis of the Mortar Pore Structure
The pore structure of the mortar after the FTCs was analyzed by nuclear magnetic resonance. In the T2 spectrum distribution, the relaxation time in the transverse x-axis is proportional to the pore size. The relaxation time inversely correlated with the pore size. The longitudinal y-axis represents the signal intensity. The signal intensity directly correlated with the number of pores. The variations in the T2 spectrum area reflect the variations in pore volume; a larger area indicated a larger volume of pores in the area corresponding to the pore diameter range.
Fig. 8 shows the variations in the T2 spectra of the mortar after the FTCs. Compared with the reference group (0 times), the pore structure inside the mortar varied significantly after FTCs. First, two peaks appeared in all T2 spectra, and the primary peaks were larger than the secondary peaks. Furthermore, the distributions of the primary peaks all occupied three orders of magnitude. The range relaxation time corresponding to the primary peak was shorter and represents the variations of micropores and small pores, while the second peak represents the variations of medium and large pores. In addition, the primary and secondary peaks of the T2 spectrum shifted to the right compared with the reference group for both WF-WT and AF-AT. When the mortar underwent 40 FTCs, the respective primary and secondary peak amplitudes increased by 1.49-and 1.94-fold for WF-WT and 1.60-and 1.8-fold for AF-AT compared with the reference group. Furthermore, Fig. 8 shows that the secondary peak amplitude of WF-WT was larger than that of AF-AT, indicating that some tiny pores evolved into large pores and that the number of large pores increased during the WF-WT process. This phenomenon arose mainly because more water-saturated pores are inside the mortar and the generated hydrostatic pressure and crystallization pressure are larger during the WF-WT process, and the effect on the mortar pore structure is consequently more significant.
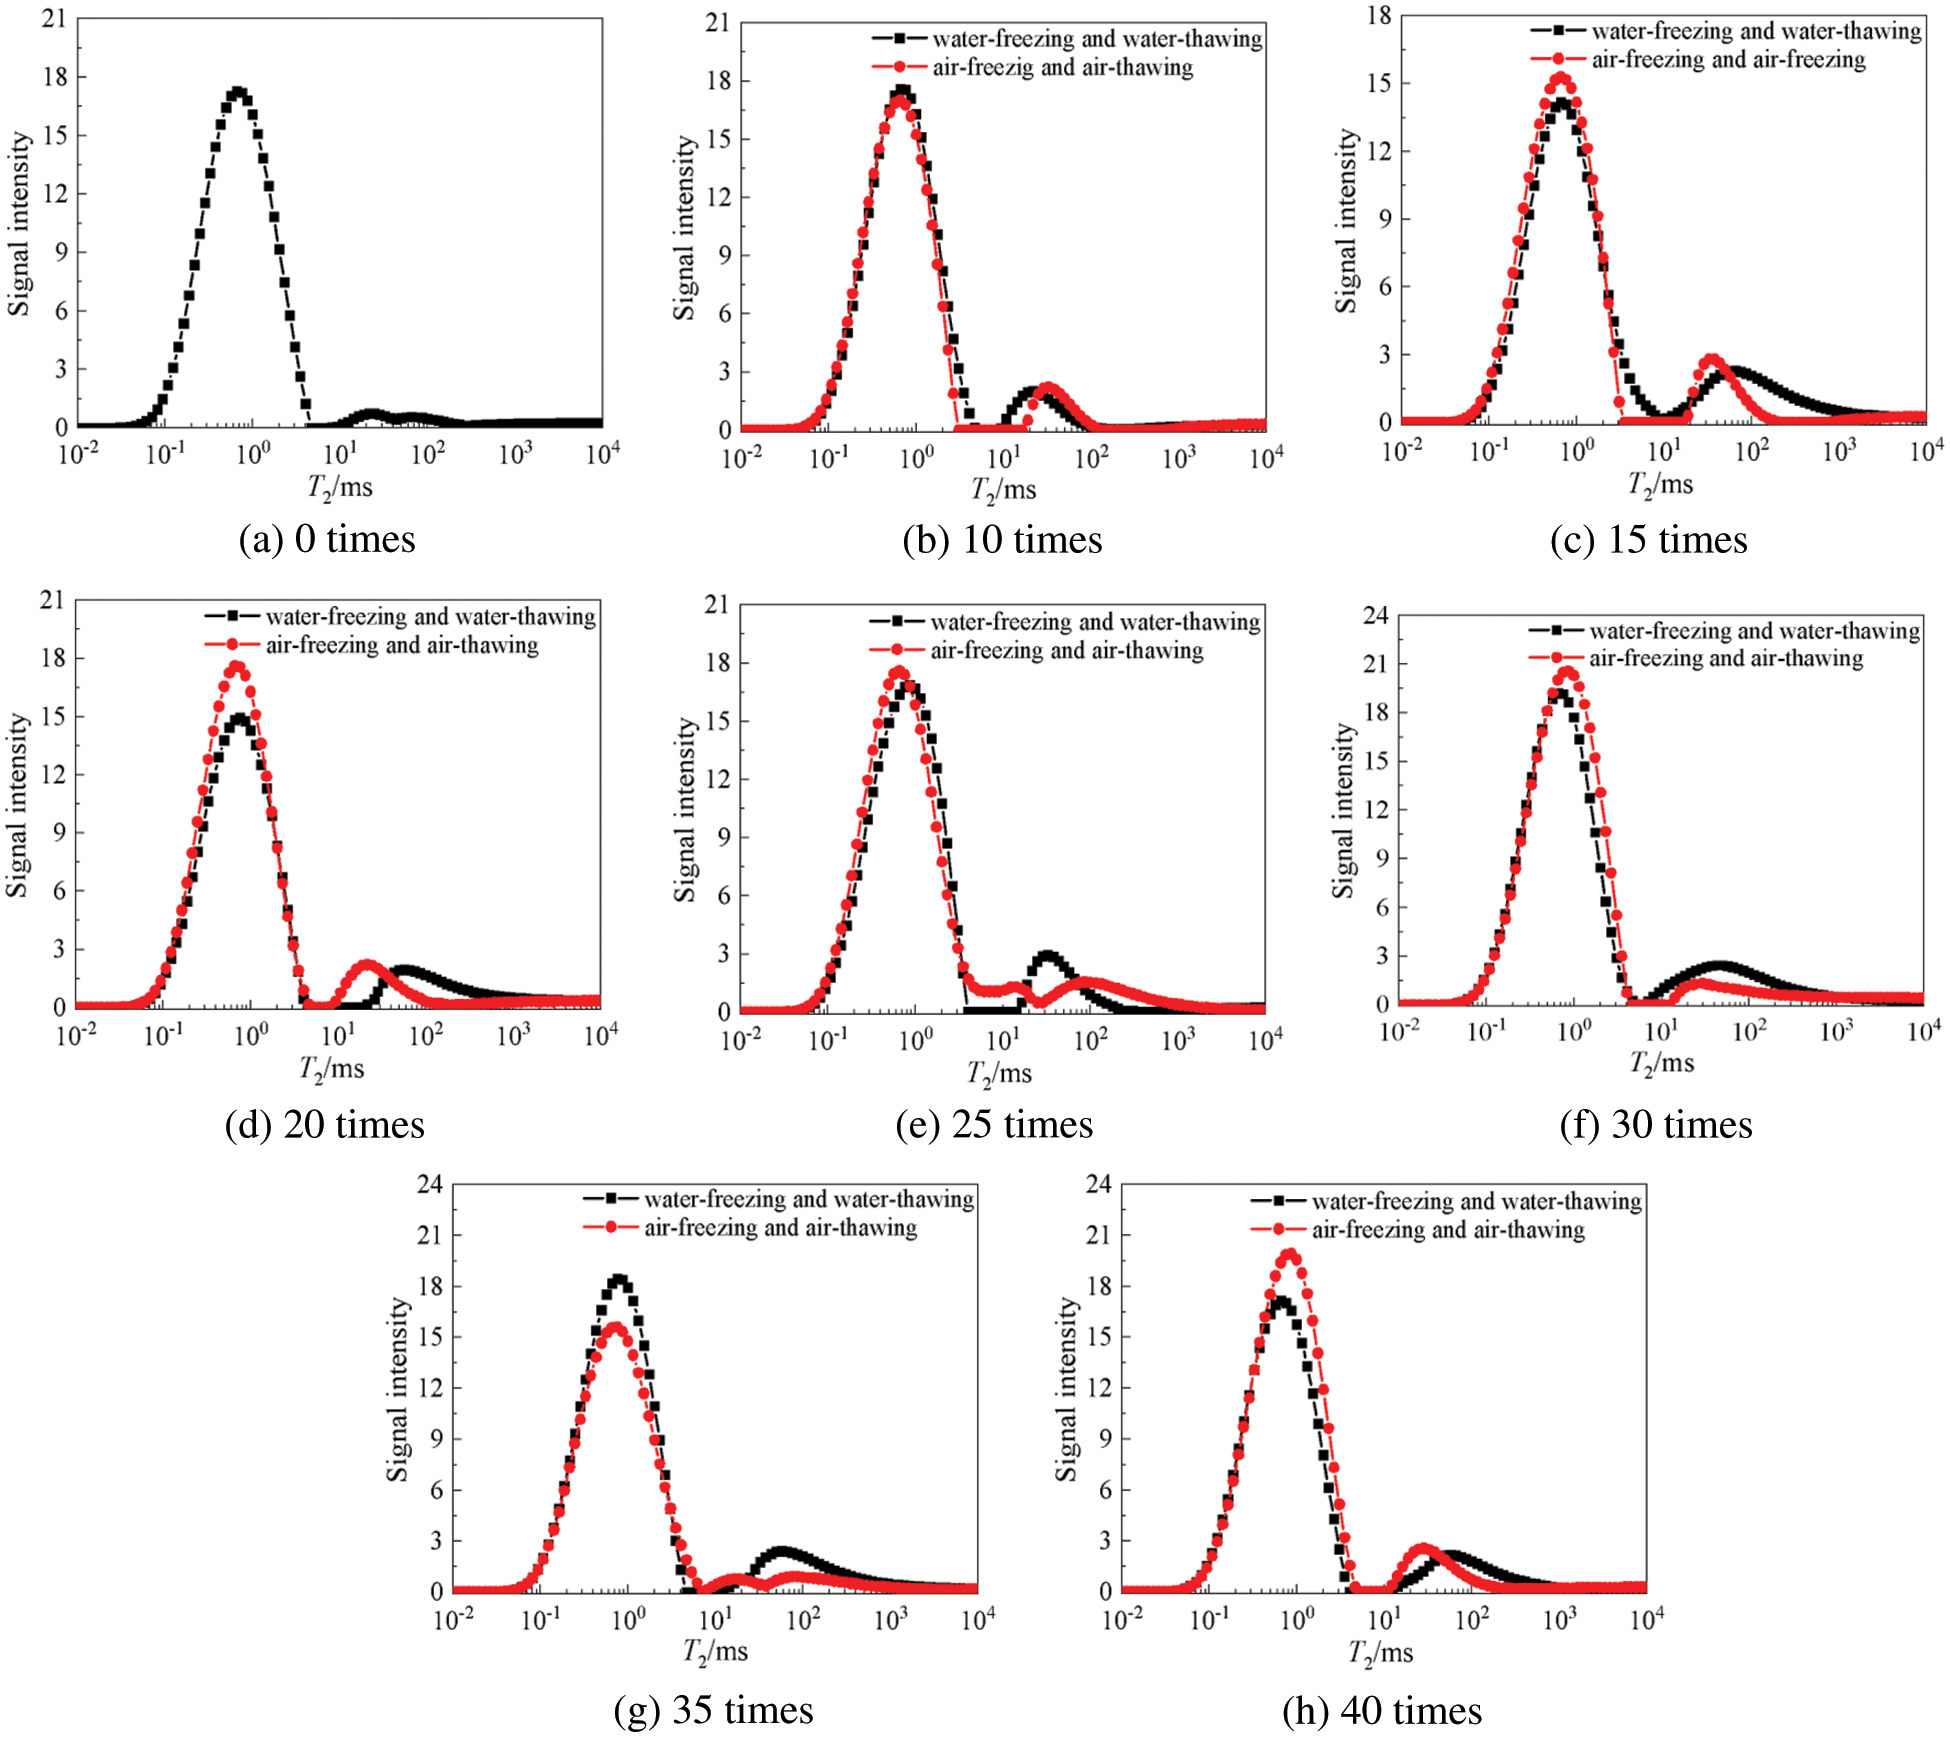
Figure 8: T2 spectrum of mortar after FTCs
The primary and secondary peak areas of the NMR T2 spectra can reflect the variations in pore volume in the corresponding pore size range. The primary peak area represents the variations in the tiny pore volume, and the secondary peak area represents the variations in the the medium-to-large pore volume. As shown in Fig. 9, with the increase in n the number of FTCs, the T2 spectra of mortars under both freeze–thaw mechanisms showed roughly an increasing trend in the primary and secondary peak areas. After 40 cycles, the respective primary and secondary peak areas increased 1.52- and 7.22-fold for WF-WT and 1.70- and 4.02-fold for AF-AT compared with the reference group. Furthermore, the secondary peak area of the mortar under both freeze–thaw mechanisms varied relatively smoothly between 20 cycles and 30 cycles and increased sharply after 30 cycles, i.e., the medium and large pores inside the mortar increased significantly. This behavior was approximately the same as the variations in the initial gas permeability of the mortar. Therefore, the variations in the large pores in the mortar can be assumed to be the main reason for the variations in gas permeability.
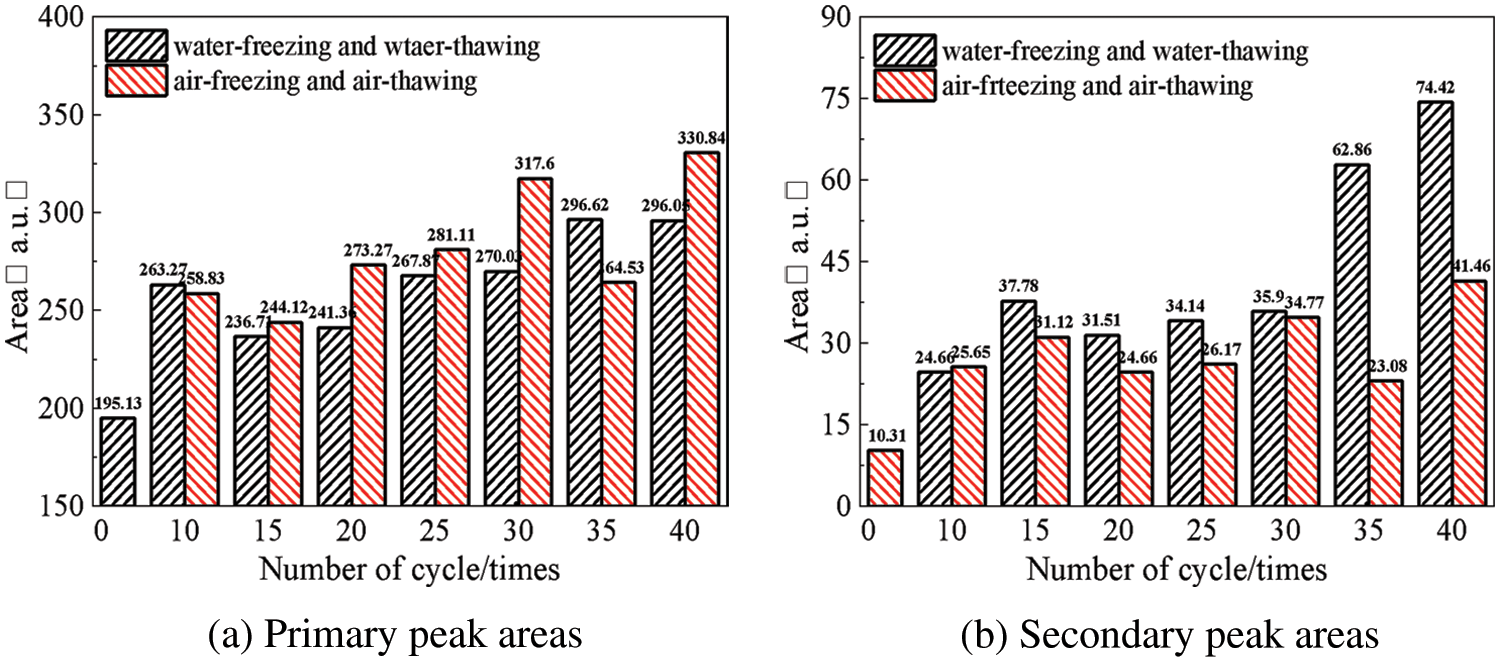
Figure 9: Variations in the primary and secondary peak areas of the mortar T2 spectrum after FTCs
1. With the increase in the number of FTCs, the initial gas permeability of mortar under the two freeze–thaw mechanisms showed an increasing trend. Compared with the reference group, the initial gas permeability of mortar under WF-WT and AF-AT increased 20-and 12.83-fold, respectively, after 40 FTCs. During the FTC, a critical threshold zone existed from the damage accumulation zone to the acute damage zone in the mortar.
2. With the increase in the number of FTCs, the compressive strength of mortar under both freeze–thaw mechanisms gradually decreased. Under the same conditions, the compressive strength of the mortar decreased by 30.85% and 24.01%, respectively.
3. The mortar gas permeability after the action of both freeze–thaw cycling mechanisms decreased with increasing confining pressure. An apparent threshold value existed for the influence of the confining pressure on the mortar gas permeability. In the process of loading and unloading the confining pressure, the mortar gas permeability exhibited significant hysteresis. Compared with AF-AT, the hysteresis effect of mortar gas permeability under the WF-WT mechanism was more significant.
4. The mortar pore structure varied significantly after the FTCs. As the number of FTCs increased, some tiny pores evolved into medium and large pores. Since pores are the main channels for gas infiltration inside the mortar, the number of medium and large pores increased, and the mortar gas permeability increased.
Funding Statement: This paper was supported by the National Natural Science Foundation of China (Grant No. 51709097).
Conflicts of Interest: The authors declare that they have no conflicts of interest to report regarding the present study.
References
1. Zheng, X. Y., Wang, Y. R., Zhang, S. Q., Xu, F., Zhu, X. P. et al. (2022). Research progress of the thermophysical and mechanical properties of concrete subjected to freeze-thaw cycles. Construction and Building Materials, 330, 127254. DOI 10.1016/j.conbuildmat.2022.127254. [Google Scholar] [CrossRef]
2. Chen, J. X., Deng, X. H., Luo, Y. B., He, L. C., Liu, Q. et al. (2015). Investigation of microstructural damage in shotcrete under a freeze–thaw environment. Construction and Building Materials, 83, 272–282. DOI 10.1016/j.conbuildmat.2015.02.042. [Google Scholar] [CrossRef]
3. Lee, G. C., Shih, T. S., Chang, K. C. (1988). Mechanical properties of concrete at low temperature. Journal of Cold Regions Engineering, 2(1), 13–24. DOI 10.1061/(ASCE)0887-381X(1988)2:1(13). [Google Scholar] [CrossRef]
4. Tang, B. X., Xie, R. F. (2020). Micromechanical properties of concrete under freezing-thawing condition. Russian Journal of Nondestructive Testing, 56(6), 527–539. DOI 10.1134/S1061830920060078. [Google Scholar] [CrossRef]
5. Soroushia, P., Nagi, M., Okwuegbu, A. (1992). Freeze-thaw durability of lightweight carbon fiber reinforced cement composites. Materials Journal, 89(5), 491–494. DOI 10.14359/2431. [Google Scholar] [CrossRef]
6. Marzouk, H., Jiang, K. J. (1995). Effects of freezing and thawing on the tension properties of high-strength concrete. Materials Journal, 91(6), 577–586. DOI 10.14359/1378. [Google Scholar] [CrossRef]
7. Kazberuk, M., Berkowski, P. (2017). Surface scaling resistance of concrete subjected to freeze-thaw cycles and sustained load. Procedia Engineering, 172, 513–520. DOI 10.1016/j.proeng.2017.02.060. [Google Scholar] [CrossRef]
8. Jacobsen, S. J., Sellevold, E., Matala, S. (1996). Frost durability of high strength concrete: The effect of internal cracking on ice formation. Cement and Concrete Research, 66(6), 919–931. DOI 10.1016/0008-8846(96)00066-X. [Google Scholar] [CrossRef]
9. Zhang, K., Zhou, J., Yin, Z. G. (2021). Experimental study on mechanical properties and pore structure deterioration of concrete under freeze–thaw cycles. Materials, 14, 6568. DOI 10.3390/MA14216568. [Google Scholar] [CrossRef]
10. Krstic, M., Davalos, J. F., Rossi, E., Figueiredo, S. C., Copuroglu, O. (2021). Freeze–thaw resistance and Air-void analysis of concrete with recycled glass–Pozzolan using X-ray micro-tomography. Materials, 14(1), 154. DOI 10.3390/ma14010154. [Google Scholar] [CrossRef]
11. Wang, Y. Z., Liu, Z., Fu, K., Li, Q. M., Wang, Y. C. (2019). Experimental studies on the chloride ion permeability of concrete considering the effect of freeze–thaw damage. Construction and Building Materials, 236(C), 117556, DOI 10.1016/j.conbuildmat.2019.117556. [Google Scholar] [CrossRef]
12. Powers, T. C. (1945). A working hypothesis for further studies of frost resistance. Journal of the ACI, 16(4), 245–272. DOI 10.14359/8684. [Google Scholar] [CrossRef]
13. Powers, T. C., Helmut, H. R. A. (1932). Theories of volume change in hardened portland cements paste during freezing. Highway Research Board, 32, 285–297. [Google Scholar]
14. Wang, R. J., Zhang, Q. J., Li, Y. (2022). Deterioration of concrete under the coupling effects of freeze–thaw cycles and other actions: A review. Construction and Building Materials, 319, 126045. DOI 10.1016/J.CONBUILDMAT.2021.126045. [Google Scholar] [CrossRef]
15. Shang, H. S., Cao, W. Q., Wang, B. (2014). Effect of fast freeze-thaw cycles on mechanical properties of ordinary-air-entrained concrete. The Scientific World Journal, 2014, 923032. DOI 10.1155/2014/923032. [Google Scholar] [CrossRef]
16. Wang, Y. Z., Yang, W. C., Ge, Y., Liu, P. H., Zhang, A. (2022). Analysis of freeze-thaw damage and pore structure deterioration of mortar by low-field NMR. Construction and Building Materials, 319, 126097. DOI 10.1016/J.CONBUILDMAT.2021.126097. [Google Scholar] [CrossRef]
17. Cheng, Z. R., Wang, Y. R., Zhao, J. H., Huang, C. L. (2022). Gas permeability prediction of mortar samples based on different methods. Crystals, 12(5), 581. DOI 10.3390/CRYST12050581. [Google Scholar] [CrossRef]
18. Chen, W., Han, Y. X., Agostini, F., Skoczylas, F., Corbeel, D. (2021). Permeability of a macro-cracked concrete effect of confining pressure and modelling. Materials, 14(4), 862–862. DOI 10.3390/MA14040862. [Google Scholar] [CrossRef]
19. Chen, W., Liu, J., Brue, F., Skoczylas, F., Davy, C. A. et al. (2012). Water retention and gas relative permeability of two industrial concretes. Cement and Concrete Research, 42, 1001–1013. DOI 10.1016/j.cemconres.2012.04.003. [Google Scholar] [CrossRef]
20. Zhan, Z., Chen, H., Zhang, Y., Cheng, R., Deng, G. (2022). A review of test methods for the determination of the permeability coefficient of gravelly soils used for embankment dams. Fluid Dynamics & Materials Processing, 18(1), 131–144. DOI 10.32604/fdmp.2022.017536. [Google Scholar] [CrossRef]
21. Kogbara, R. B., Iyengar, S. R., Grasley, Z. C., Rahman, S., Masad, E. A. et al. (2014). Relating damage evolution of concrete cooled to cryogenic temperatures to permeability. Cryogenics, 64, 21–28. DOI 10.1016/j.cryogenics.2014.09.001. [Google Scholar] [CrossRef]
22. Yang, L., Sun, W., Liu, C., Zhang, Y. S., Liang, F. (2017). Water absorption and chloride ion penetrability of concrete damaged by freeze-thawing and loading. Journal of Wuhan University of Technology-Materials Science Edition, 32(2), 330–337. DOI 10.1007/s11595-017-1599-5. [Google Scholar] [CrossRef]
23. Kollek, J. J. (1989). The determination of the permeability of concrete to oxygen by the CEMBUREAU method—A recommendation. Materials and Structures, 22, 225–230. DOI 10.1007/BF02472192. [Google Scholar] [CrossRef]
24. Villani, C., Loser, R., West, M. J., Bella, C. D., Lura, P. et al. (1991). An inter lab comparison of gas transport testing procedures: Oxygen permeability and oxygen diffusivity. Cement and Concrete Composites, 53, 357–366. DOI 10.1016/j.cemconcomp.2014.05.004. [Google Scholar] [CrossRef]
25. Salvoldi, B. G., Beushausen, H., Alexander, M. G. (2015). Oxygen permeability of concrete and its relation to carbonation. Construction and Building Materials, 85, 30–37. DOI 10.1016/j.conbuildmat.2015.02.019. [Google Scholar] [CrossRef]
26. Hamami, A. A., Turcry, P., Ait-Mokhtar, A. (2012). Influence of mix proportions on microstructure and gas permeability of cement pastes and mortars. Cement and Concrete Research, 42(2), 490–498. DOI 10.1016/j.cemconres.2011.11.019. [Google Scholar] [CrossRef]
27. Zhang, P., Wittmann, H. F., Vogel, M., Muller, H. S., Zhao, T. J. (2017). Influence of freeze-thaw cycles on capillary absorption and chloride penetration into concrete. Cement and Concrete Research, 100, 66–67. DOI 10.1016/j.cemconres.2017.05.018. [Google Scholar] [CrossRef]
28. Johannesson, B., Utgenannt, P. (2001). Microstructural changes caused by carbonation of cement mortar. Cement and Concrete Research, 31, 925–931. DOI 10.1016/S0008-8846(01)00498-7. [Google Scholar] [CrossRef]
29. Song, Y. Q. (2006). Novel NMR techniques for porous media research. Cement and Concrete Research, 37, 325–328. DOI 10.1016/j.cemconres.2006.02.013. [Google Scholar] [CrossRef]
30. Xue, S. B., Meng, F. Q., Zhang, P., Bao, J. W., Wang, L. J. et al. (2020). Influence of water re-curing on microstructure of heat-damaged cementmortar characterized by low-field NMR and MIP. Construction and Building Materials, 262, 120532. DOI 10.1016/j.conbuildmat.2020.120532. [Google Scholar] [CrossRef]
31. Zhou, C. S., Ren, F. Z., Qiang, Z., Xiao, L. Z. (2018). Pore-size resolved water vapor adsorption kinetics of white cement mortars as viewed from proton NMR relaxation. Cement and Concrete Research, 105, 31–43. DOI 10.1016/j.cemconres.2017.12.002. [Google Scholar] [CrossRef]
32. Fleury, M., Chevalier, T., Berthe, G., Dridi, W., Adadjic, M. (2020). Water diffusion measurements in cement paste, mortar and concretusing a fast NMR based technique. Construction and Building Materials, 259, 119843. DOI 10.1016/j.conbuildmat.2020.119843. [Google Scholar] [CrossRef]
33. Wu, F., Yu, Q. L., Liu, C. W. (2021). Durability of thermal insulating bio-based lightweight concrete: Understanding of heat treatment on bio-aggregates. Construction and Building Materials, 269, 121800. DOI 10.1016/j.conbuildmat.2020.121800. [Google Scholar] [CrossRef]
34. Lu, J. Z., Zhu, L. F., Tian, L. Z., Guo, L. (2017). Dynamic compressive strength of concrete damaged by fatigue loading and freeze-thaw cycling. Construction and Building Materials, 152, 847–855. DOI 10.1016/j.conbuildmat.2017.07.046. [Google Scholar] [CrossRef]
35. Marciniak, A., Koniorczyk, M., Bednarska, D., Grabowska, K. (2018). The transport properties of cement mortars subjected to freeze-thaw cycles. E3S Web of Conferences, 49, 00128. DOI 10.1051/e3sconf.20184900128. [Google Scholar] [CrossRef]
36. Xue, W. P., Gao, C., Shen, L., Liu, X. Y. (2021). Effect of confining pressure on permeability and pore structure of basalt fiber reinforced concrete after high temperature. Journal of Building Materials, 4, 742–748. DOI 10.3969/j.issn.1007-9629.2021.04.010. [Google Scholar] [CrossRef]
37. Wang, P., Zhang, X. (2022). Experimental study on seepage characteristics of a soil-rock mixture in a fault zone. Fluid Dynamics & Materials Processing, 18(2), 271–283. DOI 10.32604/fdmp.2022.017882. [Google Scholar] [CrossRef]
Cite This Article
 Copyright © 2023 The Author(s). Published by Tech Science Press.
This work is licensed under a Creative Commons Attribution 4.0 International License , which permits unrestricted use, distribution, and reproduction in any medium, provided the original work is properly cited.
 Downloads
 Citation Tools