
 Submit a Paper
 Propose a Special lssue
 Open Access
ARTICLE

Fluid-Dynamics Analysis and Structural Optimization of a 300 kW MicroGas Turbine Recuperator
Shanghai University of Electric Power, Shanghai, 201306, China
* Corresponding Authors: Weiting Jiang. Email: ; Tingni He. Email:
Fluid Dynamics & Materials Processing 2023, 19(6), 1447-1461. https://doi.org/10.32604/fdmp.2023.025269
Received 02 July 2022; Accepted 13 September 2022; Issue published 30 January 2023
 View Full Text
 Download PDF
Abstract
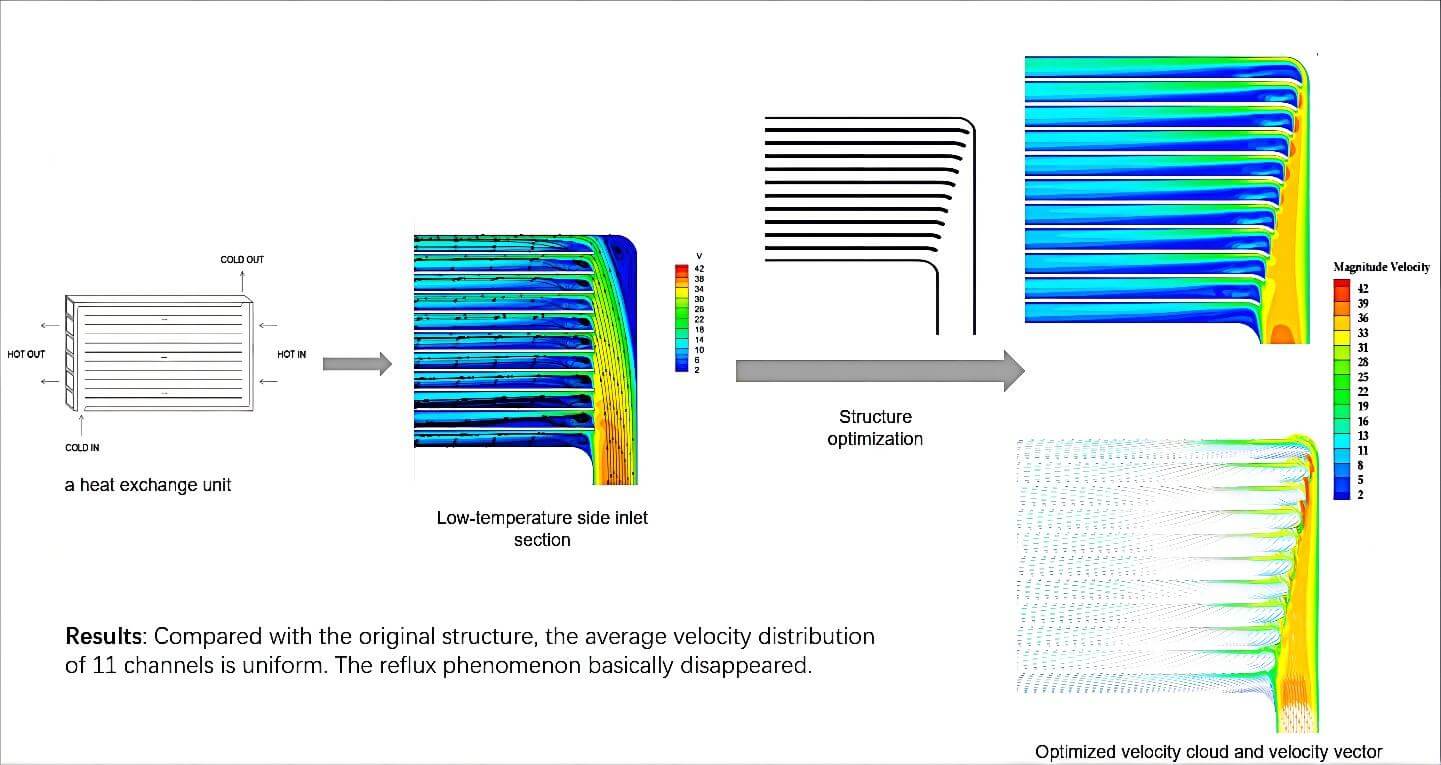
Computational Fluid Dynamics (CFD) is used here to reduce pressure loss and improve heat exchange efficiency in the recuperator associated with a gas turbine. First, numerical simulations of the high-temperature and low-temperature channels are performed and, the calculated results are compared with experimental data (to verify the reliability of the numerical method). Second, the flow field structure of the low-temperature side channel is critically analyzed, leading to the conclusion that the flow velocity distribution in the low-temperature side channel is uneven, and its resistance is significantly higher than that in the high-temperature side. Therefore, five alternate structural schemes are proposed for the optimization of the low-temperature side. In particular, to reduce the flow velocity in the upper channel, the rib length of each channel at the inlet of the low-temperature side region is adjusted. The performances of the 5 schemes are compared, leading to the identification of the configuration able to guarantee a uniform flow rate and minimize the pressure drop. Finally, the heat transfer performance of the optimized recuperator structure is evaluated, and it is shown that the effectiveness of the recuperator is increased by 1.5%.Graphic Abstract
Keywords
Nomenclature
| | Inlet pressure of low-temperature side, Pa |
| | Inlet pressure of high-temperature side, Pa |
| T | Temperature, °C |
| u | Velocity of fluid flow, m/s |
| | Specific heat, J/(kg·k) |
Greek Symbols
| | The regenerative degree of the recuperator |
| | Pressure loss of the high-temperature side, Pa |
| | Pressure loss of the low-temperature side, Pa |
| | The relative pressure loss of the high-temperature side, % |
| | The relative pressure loss of the low-temperature side, % |
| | Viscosity of the working fluids |
| | Density |
| | Thermal conductivity of the fluid |
| | Thermal conductivity of solids |
| Subscripts | |
| Max | Maximum |
| In | Inlet |
| Out | Outlet |
In recent years, the micro gas turbine has attracted increasing attention because of its flexible operation, low pollution emission, low maintenance cost, and high efficiency [1]. The key to improving the efficiency of a micro gas turbine is to use a regenerative cycle. Fig. 1 shows a schematic diagram of a micro gas turbine with a recuperator. After the air is pressurized from the compressor, it enters the recuperator for work. The waste heat generated by the recuperator enters the combustion chamber. Waste heat and fuel are burned in the combustion chamber. High-temperature and high-pressure gas from the combustion chamber drive the turbine to work. High-temperature gas discharged from the turbine enters the recuperator to heat the cold air. After the performed investigation, it was determined that the recuperator can save 30% to 40% fuel by preheating compressed air, and the overall efficiency of the gas turbine can also be improved to approximately 30%. In cogeneration applications, the comprehensive thermoelectric efficiency of a micro gas turbine is as high as approximately 85% [2].
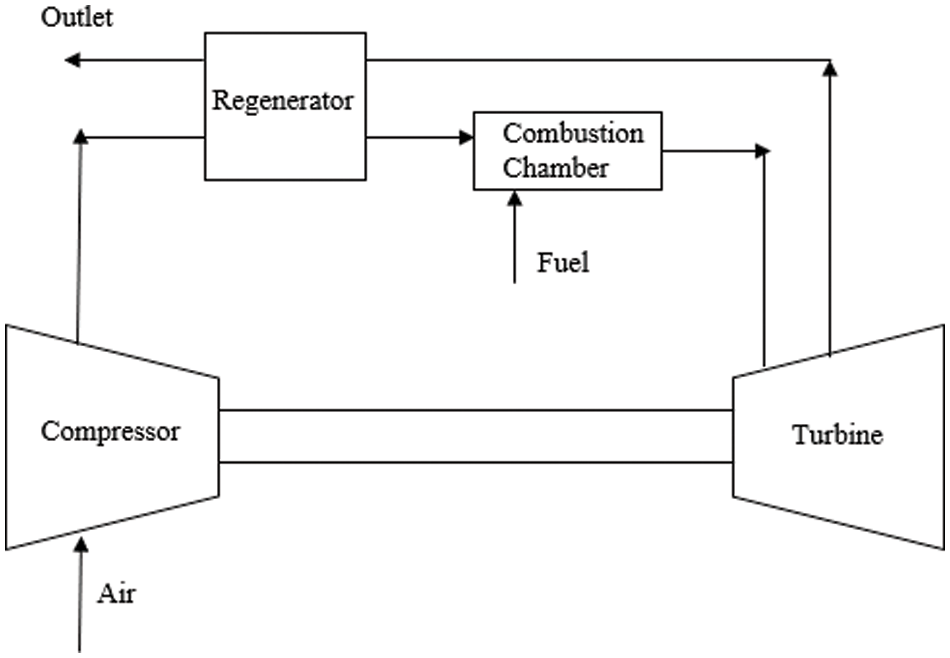
Figure 1: Schematic diagram of a micro gas turbine
The recuperator’s high-temperature side channel and low-temperature side channel are the core parts of the recuperator. The flow channel structure on both sides of the plate directly affects the recuperator’s flow and heat transfer performance. Many scholars have performed a considerable amount of research on the channel structure and fluid flow of the recuperator. In terms of structure, for example, Wen et al. [3] performed a numerical simulation of the flow field at the inlet of the heat exchanger. They found that an unreasonable inlet structure will lead to vortices and reflux. These conditions will make the internal flow field distribution extremely uneven and affect the heat transfer performance. Qi et al. [4] calculated the influence of various structural parameters in the recuperator on the heat exchange performance. They found that increasing the heat exchange area will also increase the regenerative degree of the recuperator. The regenerative degree of the recuperator is equal to the ratio of the actual heat exchange effect of the recuperator to the ideal heat exchange effect. At the same time, if the cross-sectional area and equivalent diameter of the channel are reduced, the pressure loss will increase. Cao et al. [5] found that the total pressure drop can be balanced by changing the method of working fluid flows into and out of the heat exchanger. This method improves the flow distribution characteristics of the heat exchanger. Liu et al. [6] changed the channel structure of the annular recuperator and then studied the recuperator’s heat transfer and flow characteristics. They found that with the same equivalent diameter and other parameters unchanged, increasing the amplitude and decreasing the period can strengthen the heat transfer. Campell [7] compared various plate-fin heat transfer surfaces. The obtained results show that the heat exchanger with a smaller equivalent diameter has better heat transfer performance. At the same time, the sawtooth fin surface with the minimum hydraulic diameter can obtain the minimum volume of the heat exchange core. Cui et al. [8] optimized the gas turbine heat exchanger. They took the minimum entropy production as the optimization objective. The fin spacing and ripple angle were reduced compared with the original parameters. They concluded that the optimization reduced the pressure loss of plate-fin heat exchangers. Ling et al. [9] optimized the structure of the microchannel heat exchanger. They designed interlaced and parallel structures. The obtained results show that the heat transfer performance of interlaced microchannels is improved by 65.4%. In terms of fluid flow, for example, Rao et al. [10] established a mathematical model and summarized the influence law of the uneven flow rate of the fluid in the channel on the heat transfer coefficient. Bhutta et al. [11] used the CFD method to simulate uneven flow and pressure drop in a heat exchanger. The simulation results are in good agreement with the experimental results. The correctness of the CFD simulation method was confirmed. Galeazzo et al. [12] established the four-layer fluid model of a plate heat exchanger. They numerically simulated the uneven fluid distribution in each channel. In addition, the optimization study of structure and performance is indispensable. Hanafizadeh et al. [13] used Genetic Algorithm (GA) and a Non-dominated sorting Genetic Algorithm (NSGA-II) for single-objective and multi-objective optimization, respectively. The pressure drop, exergy efficiency, and total cost were selected as the three important objective functions of the recuperator. They indicated a very good match between the multi-objective and the single-objective optimum values regarding exergy efficiency and total cost; however, significant differences were observed for pressure drop. Maghsoudi et al. [14] studied four plate-fin heat exchangers with 200 kw micro-turbines. Multi-objective optimization algorithm, NSGA-II, is employed to maximize the efficiency of the recuperator and minimize its total cost, simultaneously. They obtained feasible ranges of pressure drop Reynolds number and regenerator efficiency based on the penalty function. Maghsoudi et al. [15] proposed a multi-factor theoretical methodology for analyzing, optimizing, and comparing potential plate-fin recuperators incorporated into micro gas turbines. Energetic, exergetic, economic and environmental factors are covered.
The core structure of the recuperator is closely related to its flow and heat transfer performance. From the experimental data [16], the pressure loss of the low-temperature side channel is significantly higher than that of the high-temperature side channel, and the average velocity of each channel section on the low-temperature side is very different. The uneven velocity distribution affects the pressure distribution. At the same time, the heat exchange area cannot be fully applied. Due to the uneven distribution of fluid on the low-temperature side, the structure of the channel on the low-temperature side is optimized under the condition that pressure loss is allowed. To reduce the flow velocity of the upper channel, the rib length of each channel at the inlet of the low-temperature side region is adjusted. Each rib is a certain length longer than the previous one. Simultaneously, this study further chamfers the rib heads near the inlet diversion area in each scheme. This method can reduce pressure loss. And further observe whether the heat transfer performance of the optimized structure is improved.
High-temperature and low-temperature plates are stacked and welded together to form a recuperator. As shown in Fig. 2, this study selects a single structural unit for numerical simulation calculation. The regenerator adopts the counter-current flow arrangement. At this time, the average temperature difference is the highest per unit length for fluid per unit mass. In this section, high-temperature side channels and low-temperature side channels are selected to verify the numerical methods.
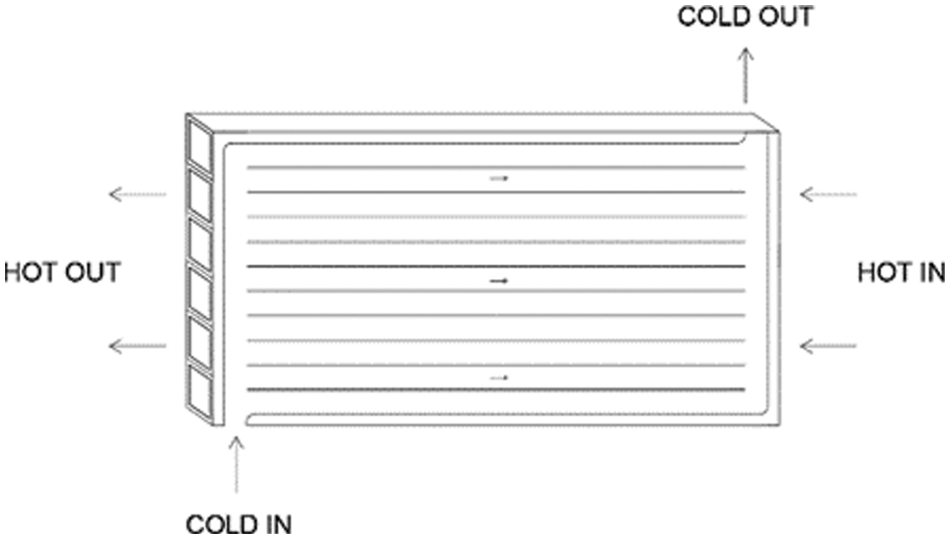
Figure 2: Schematic diagram of a heat exchange unit
2.1 High-Temperature Side Channel Verification
2.1.1 Mesh Generation, Boundary Conditions and Numerical Method of High-Temperature Side Channel
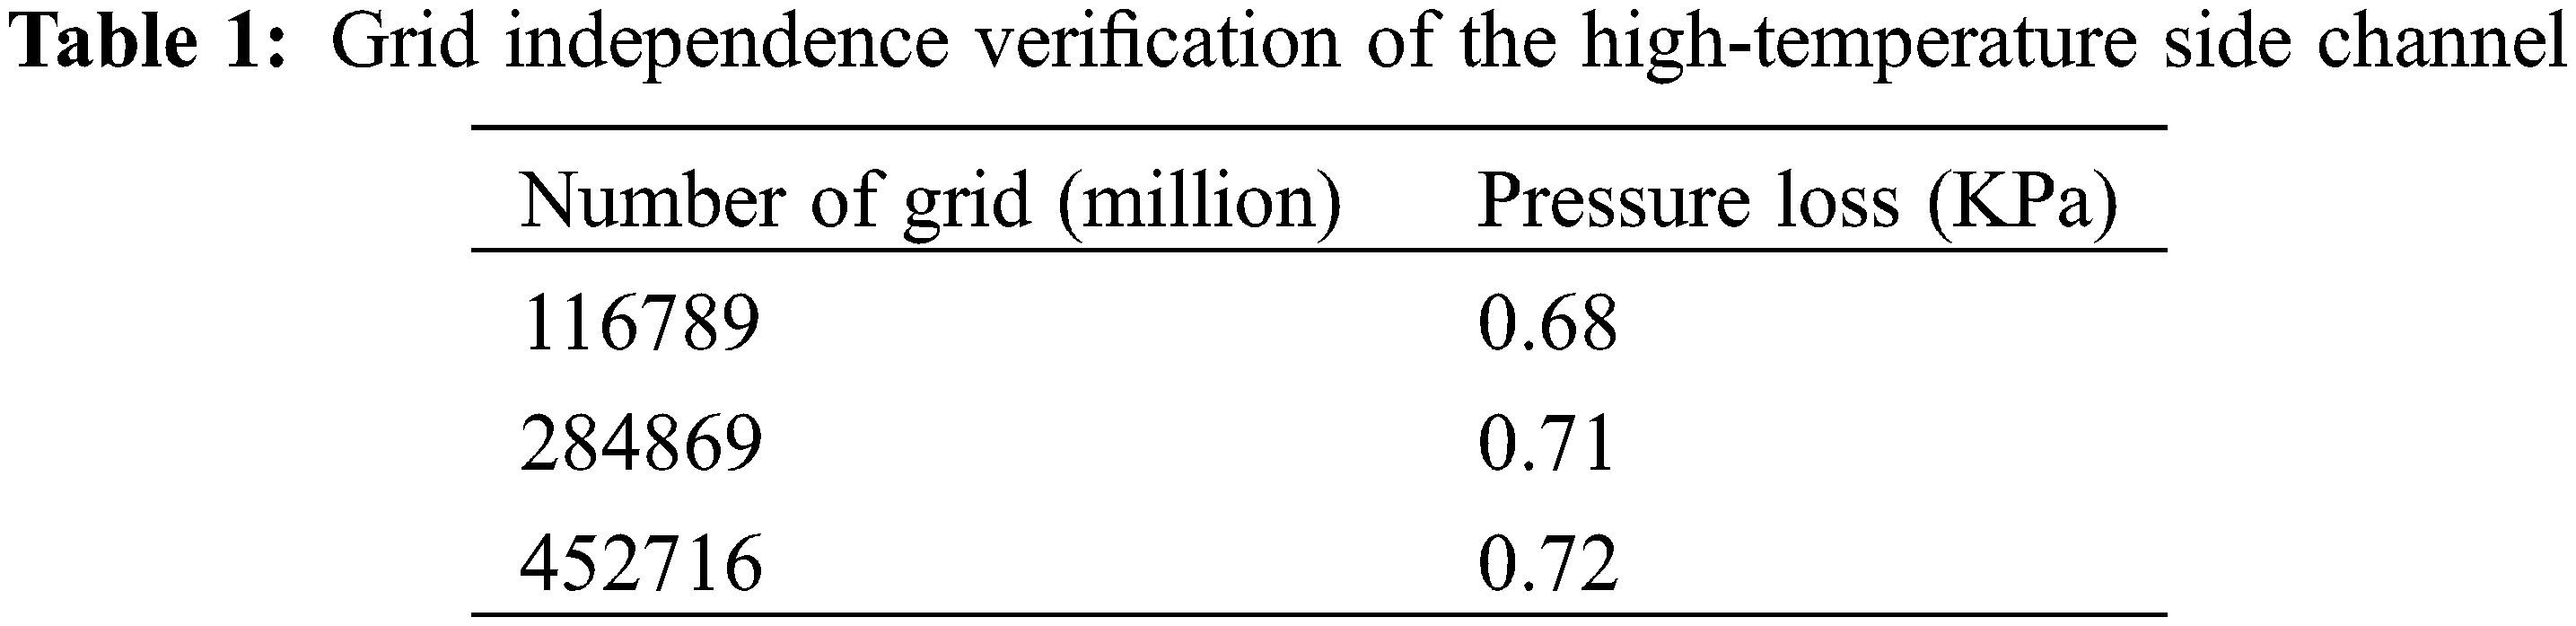
The high-temperature side channels in the plate recuperator are rectangular straight channels. The flow direction of the working fluids in the channel does not change. Fig. 3 shows a single channel on the high-temperature side. According to the experimental data in the literature [16], the rectangular channel is 3.05 mm wide, 2.6 mm high, and 610 mm long. These data are consistent with the actual size of the original channel. In this chapter, the channel is meshed by ICEM software. The greater the number of meshes in a certain range, the longer will be the solving process, although the computational accuracy is improved. In addition, if the number of grids is too small, the error of the results will be larger. To verify the grid independence, three sets of grid generation schemes are designed in this study. The three schemes are solved in fluent software. As in Table 1, the table shows the high-temperature side channel pressure loss at an inlet flow rate of 0.147 kg/s. The grids of the three schemes are 116789, 284869, and 452716, respectively. When the number of grids is more than 300000, the change in calculation results is very small. Considering the computing resources, scheme 2 is chosen for the simulation calculation of the entire model. The number of cell grids in scheme 2 is 284869.
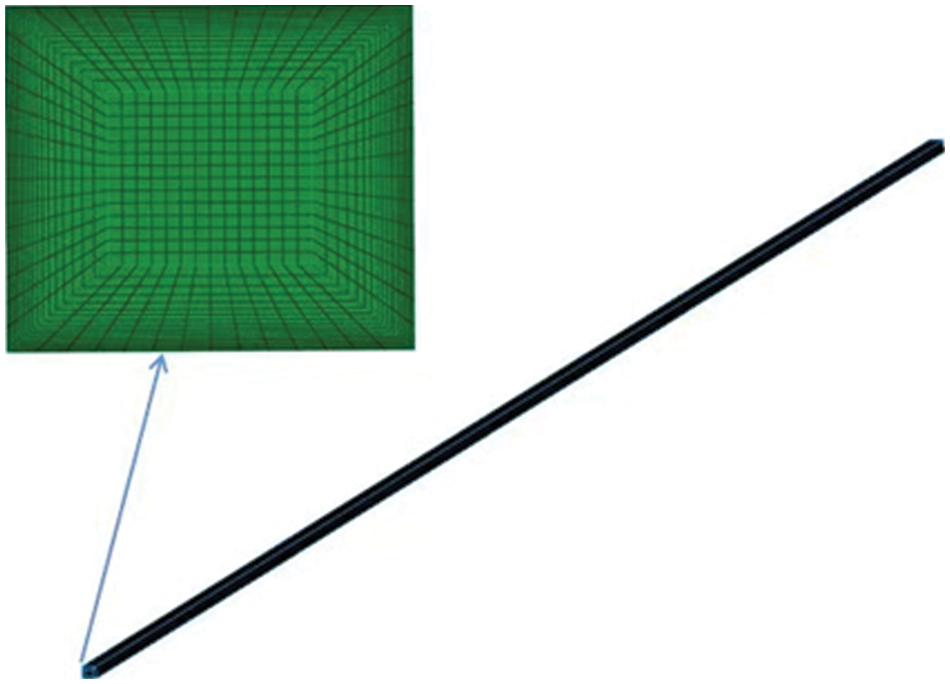
Figure 3: High-temperature side channel unit
The flow model is laminar flow. The velocity pressure coupling method is the SIMPLEC algorithm. The flow involved is incompressible. The second-order upwind scheme is adopted in the calculation. In the meantime, the residual absolute criteria are set as 10−6. The boundary conditions are the flow inlet and pressure outlet. In numerical calculation, the inlet pressure is 113 KPa, and the inlet temperature is 564°C. The physical parameters of gas are constant. As follows, its governing equations are in turn: the continuity equation and momentum equation [17].
2.1.2 Analysis of High-Temperature Side Channel Verification Results
The relative pressure loss of the high-temperature side is equal to the ratio of the pressure difference between the inlet and outlet of the high-temperature side and the inlet pressure of the high-temperature side. The following is the calculation formula:
Fig. 4 compares the simulated value of the relative pressure loss on the high-temperature side with the experimental value [16]. The flow rate of the imported working fluids increases and the pressure loss also increases. The maximum error between the test and simulation values is 4.3%. The error is within the allowable range.
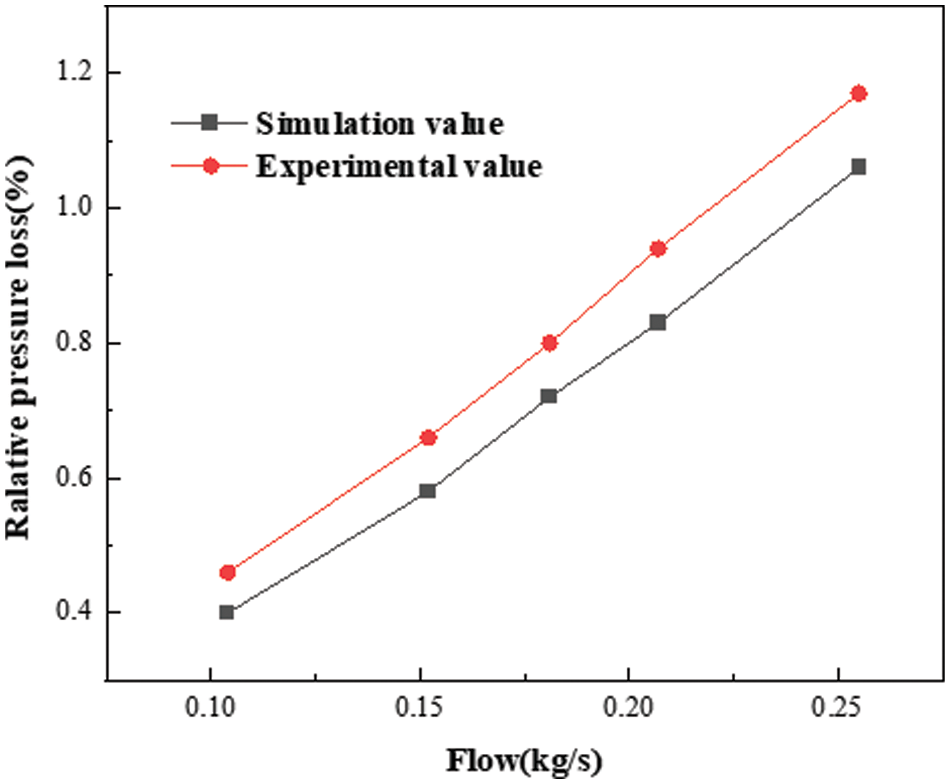
Figure 4: Comparison between the simulated and experimental values of the relative pressure loss on the high-temperature side
2.2 Low-Temperature Side Channel Verification
2.2.1 Mesh Generation, Boundary Conditions and Numerical Method of the Low-Temperature Side Channel
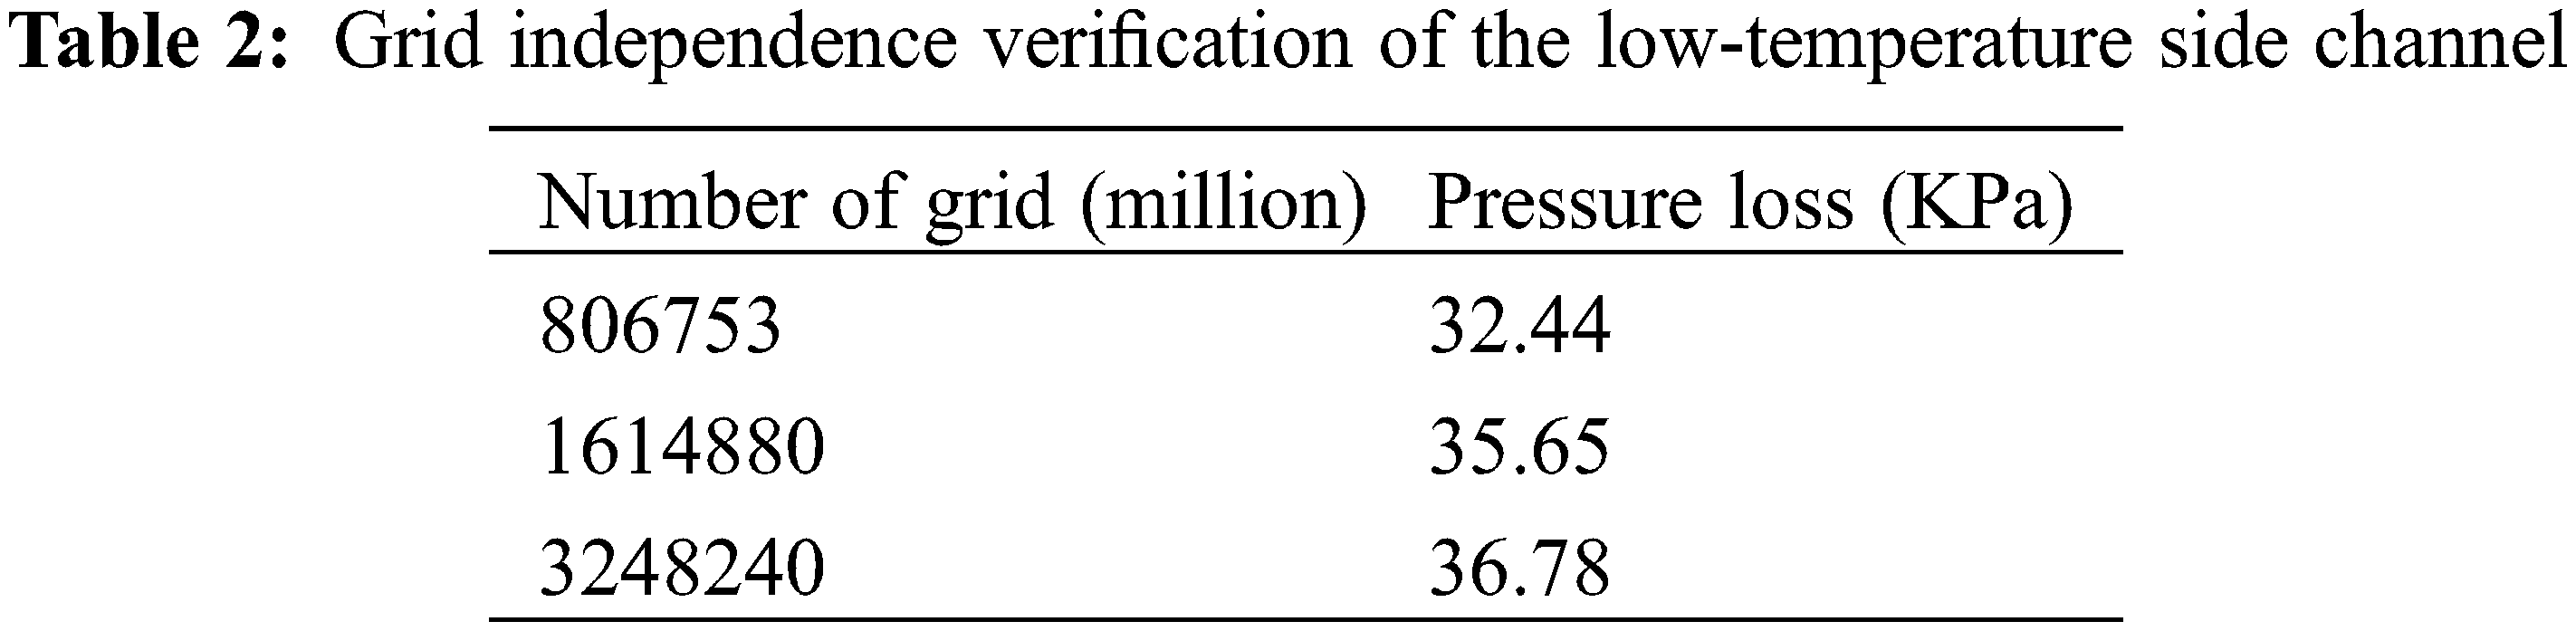
The low-temperature side plate of the plate recuperator is composed of many low-temperature units. As shown in Fig. 5, a single subregion includes an inlet diversion area, countercurrent heat transfer area and outlet diversion area. The flow path of the working fluids in the channel is similar to a Z-shape. The working fluids first flow from the inlet. The working fluids enter the countercurrent heat exchange zone after 90° transformation. The heat transfer of the working fluids is mainly in the countercurrent heat transfer zone. Finally, the working fluids turn 90°, and the working fluids flow out from the outlet. According to the experimental data in the literature [16], the inlet is 4.05 mm wide and 0.9 mm high, the countercurrent area is 1.55 mm wide, and the total length is 465 mm. These data are consistent with the actual size of the original channel. As shown in Fig. 5, the channel is meshed by ICEM software. The core idea is to divide the computing area of continuous space into sufficiently small areas. The distribution of physical quantities in the calculation area is obtained by applying the fluid control equation. To eliminate the influence of mesh size on the calculation results then, three sets of grid generation schemes are designed in this study. The three schemes are solved in fluent software. Table 2 shows the low-temperature side channel pressure loss at an inlet flow rate of 0.183 kg/s. The grids of the three schemes are 806753, 1614880, and 3248240, respectively. When the number of grids is more than 1600000, the change in calculation results is very small. Considering the computing resources, scheme 2 is chosen for the simulation calculation of the entire model. The number of cell grids in scheme 2 is 1614880.

Figure 5: Low-temperature side channel model
The flow model is laminar flow. The velocity pressure coupling method is the PISO algorithm. The flow involved is incompressible. The second-order upwind scheme is adopted in the calculation. The residual absolute criteria are set as 10−6. The boundary conditions are the flow inlet and pressure outlet. The inlet pressure is 400 KPa, and the inlet temperature is 300°C. In the numerical calculation, the governing equations used can be referred to Section 2.1.1.
2.2.2 Analysis of Low-Temperature Side Channel Verification Results
The relative pressure loss of the low-temperature side is equal to the ratio of the pressure difference between the inlet and outlet of the low-temperature side and the inlet pressure of the low-temperature side. The following is the calculation formula:
Fig. 6 compares the relative pressure loss on the low-temperature side and the test value [16]. The flow rate of the imported working fluids increases and the pressure loss also increases. The numerical results are within the allowable error range. Due to the structural change in the flow channel at the corner of the inlet diversion zone and the countercurrent heat exchange zone, a large pressure drop occurs. The flow rate of the imported working fluids increases and the calculation error also increases.
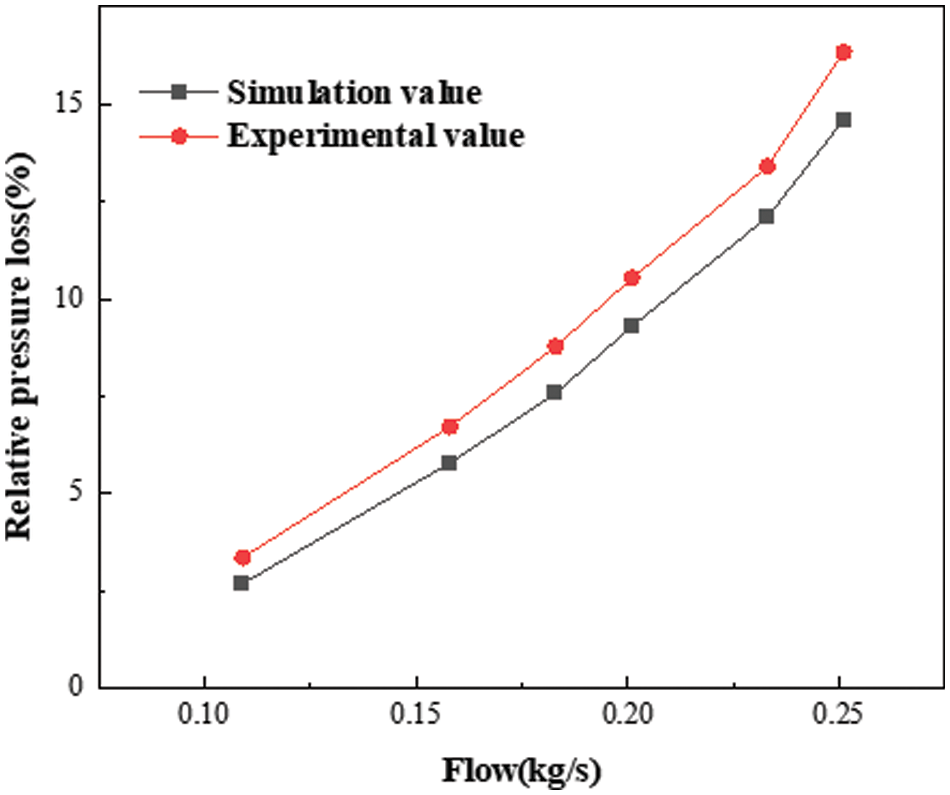
Figure 6: Comparison between the simulated and experimental values of the relative pressure loss on the low-temperature side
3 Flow Analysis and Structural Optimization of the Low-Temperature Side Channel of the Recuperator
3.1 Flow Analysis of the Low-Temperature Side Channel of the Recuperator
The total distance of the working fluids entering the low-temperature side channel unit is equal. The flow path of the working fluids in the channel is Z-shaped. From the experimental data [16], the pressure loss of the low-temperature side channel is significantly higher than that of the high-temperature side channel. To reduce the total pressure drop of the recuperator then, this section describes the in-depth investigation of the fluid flow on the low-temperature side and its further structure optimization.
Fig. 7 shows the velocity vector diagram at the inlet diversion. The working fluids have clear reflux at the corner of the inlet diversion zone and the countercurrent heat exchange zone. Reflux disturbs the wall boundary layer. Although the boundary layer becomes thinner, it increases the friction resistance and pressure loss between the fluid and the wall. Reflux hinders fluid flow, resulting in an uneven flow distribution in the internal channel of the countercurrent heat exchange zone. As a result, the velocity distribution also becomes uneven. Fig. 8 shows the pressure cloud diagram at the inlet diversion. The difference in pressure drop between the outlet and inlet of the channel on the low-temperature side also leads to uneven fluid distribution in the channel. Through calculation, the average pressure drop in the transition section between the inlet diversion zone and countercurrent heat exchange zone is 1068.5 Pa.
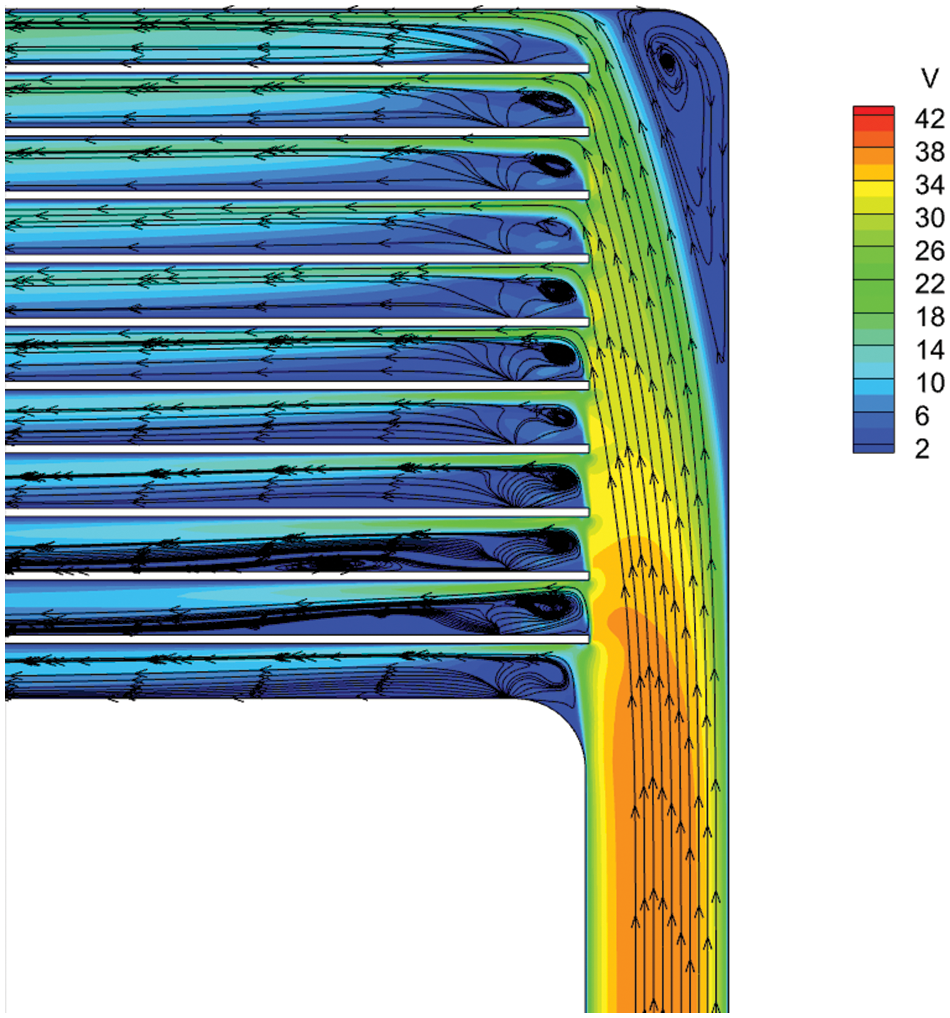
Figure 7: Velocity vector diagram of the original structure
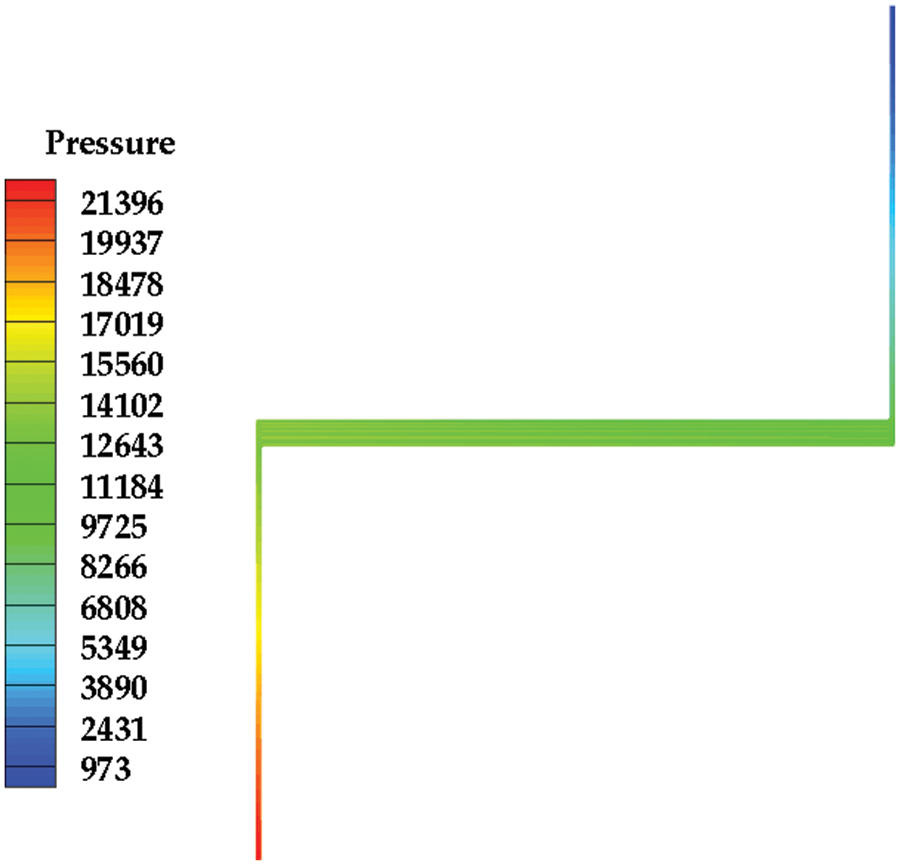
Figure 8: Pressure cloud diagram of the original structure
This study defines the channel closest to the inlet diversion area as channel 1. From bottom to top, there are 11 channels in total. Fig. 9 shows a velocity cloud diagram of the countercurrent heat exchange zone of the channel on the low-temperature side. The flow velocity dramatically varies in the transition area. The internal flow velocity of 11 channels is uneven.
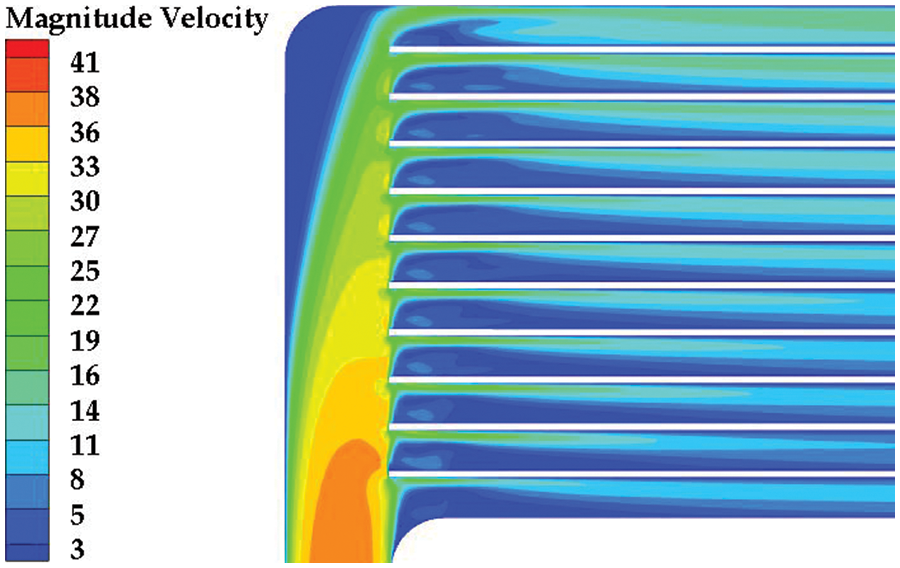
Figure 9: Velocity cloud diagram of the original structure
As shown in Fig. 10, in this section, we further calculate the flow velocity in the middle section of 11 channels. The variation range of the internal middle section of 11 channels is 2–8 m/s. The average velocity of the first two channels shows a decreasing trend. This is because the working fluids enter the countercurrent heat transfer zone and need to change their flow direction. The farther is the internal channel from the inlet, the higher is the pressure. As a result, the average velocity of the middle section of the remaining 9 channels increases.
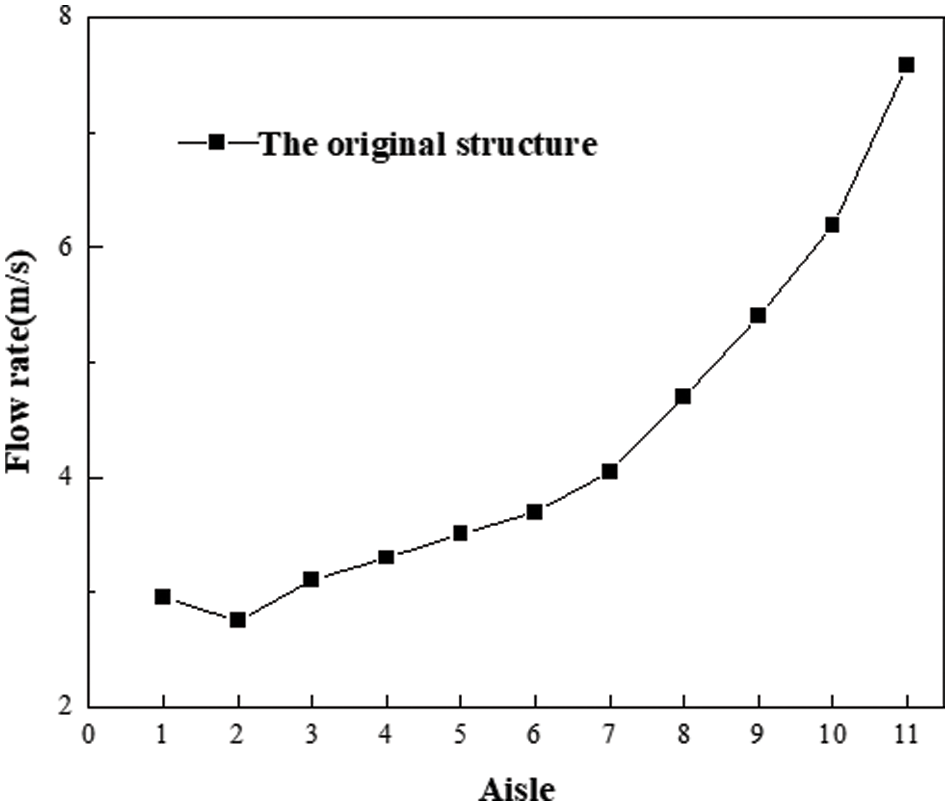
Figure 10: Channel section velocity of the original structure
After analyzing the data, it is found that the channel structure will cause an uneven flow distribution and increased pressure loss. The heat exchange area cannot be fully utilized. The heat exchange area will not be fully utilized. The heat exchange performance of the recuperator will decline. Therefore, this study should focus on the inlet structure of each subarea channel on the low-temperature side and optimize it.
3.2 Low-Temperature Side Structure Optimization of the Recuperator
Due to the uneven channel flow distribution in the countercurrent heat exchange zone and backflow in the transition section, the structure of the low-temperature side of the plate recuperator is optimized in this section. As shown in Fig. 11, this study improves the flow velocity in 11 channels by changing the channel structure. The flow velocity in the 11 channels increases from bottom to top. To reduce the flow velocity of the upper channel, the rib length of each channel at the inlet of the low-temperature side region is adjusted. Each rib is a certain length longer than the previous one. The elongation is 0.1, 0.15, 0.25, 0.32 and 0.39 mm, respectively. There are five optimization schemes in total. This study further chamfers the rib heads near the inlet diversion area in each scheme. This method can improve the reflux phenomenon at the entrance of 11 channels and reduce pressure loss.
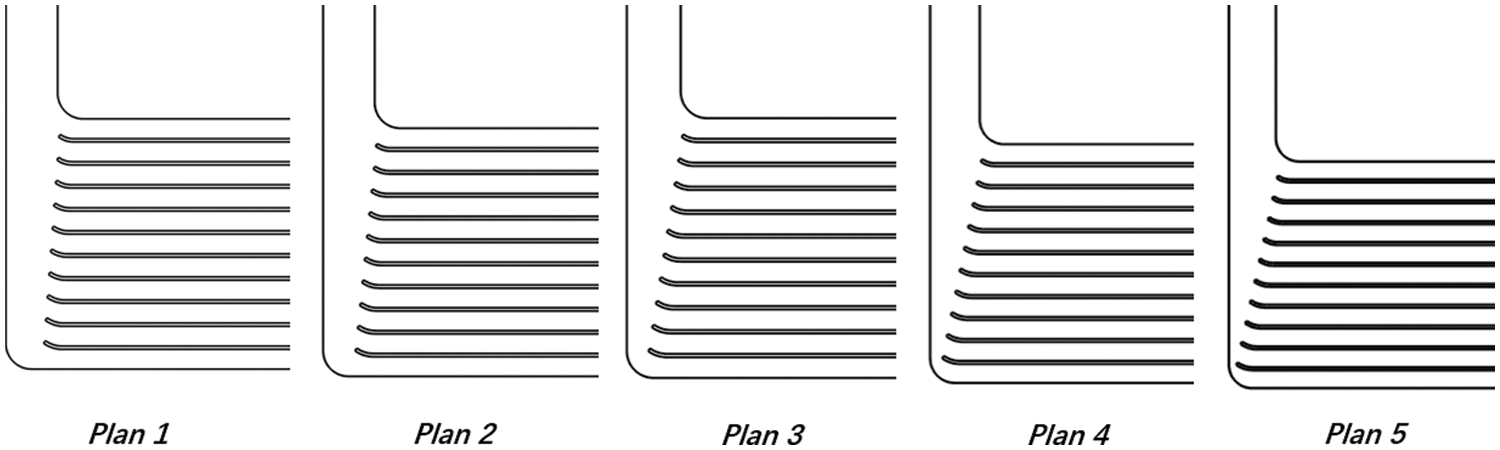
Figure 11: Improvement scheme
As shown in Fig. 12, the flow rates in the channels of the five schemes have been improved. Plan 5 has the smoothest trend. After improvement, the average flow rate in 11 channels changed from 2–8 m/s to 4–5.5 m/s. The flow rate of 11 channels on the low-temperature side is more average. Figs. 13–17 are the velocity vector and velocity cloud diagrams of the five schemes, respectively. The result of scheme 5 is better. The flow rate distribution of 11 channels in scheme 5 is the most uniform. Reflux at the inlet basically disappears. scheme 5 has a clear effect on the working fluid flow distribution. After calculation, the average pressure drop of the transition section between the inlet diversion zone and counterflow heat exchange zone of the five schemes are 1190.82, 1073.66, 970.69, 848.72 and 790.89 Pa, respectively. The average pressure drop of the transition section of the original structure is 1068.502 Pa. Scheme 5 reduces the pressure drop by 25% compared with the original structure. This study selects the scheme with a uniform flow rate and minimum pressure drop as the best scheme for the low-temperature side channel. Fig. 18 shows the low-temperature side structure of scheme 5. This section will further study the heat exchange performance of the optimized structure.
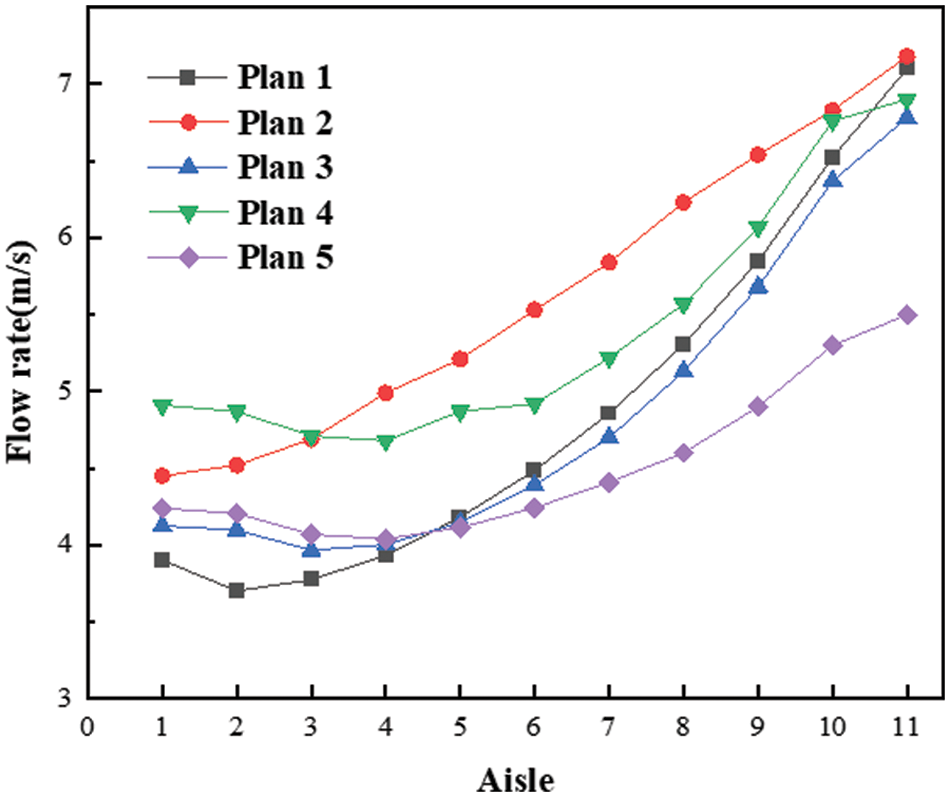
Figure 12: Velocity comparison of the middle section in the countercurrent heat exchange zone on the low-temperature side
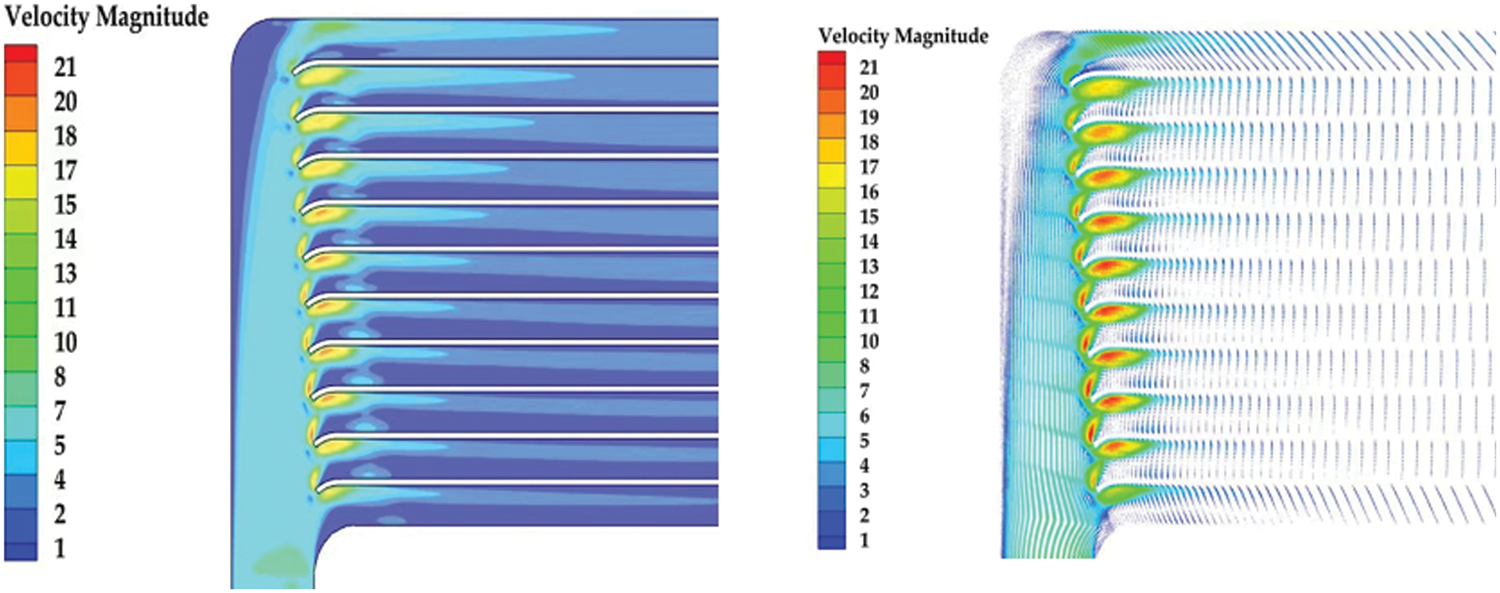
Figure 13: Optimized velocity cloud and velocity vector diagram in scheme 1
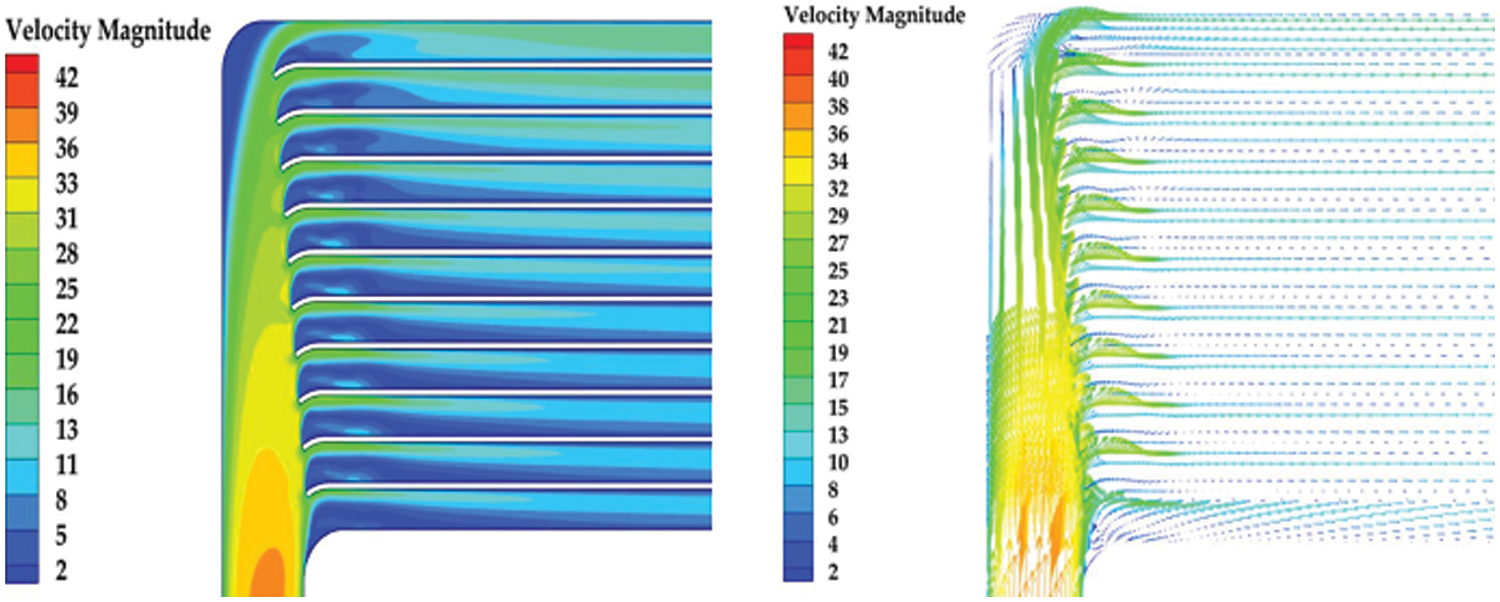
Figure 14: Optimized velocity cloud and velocity vector diagram in scheme 2
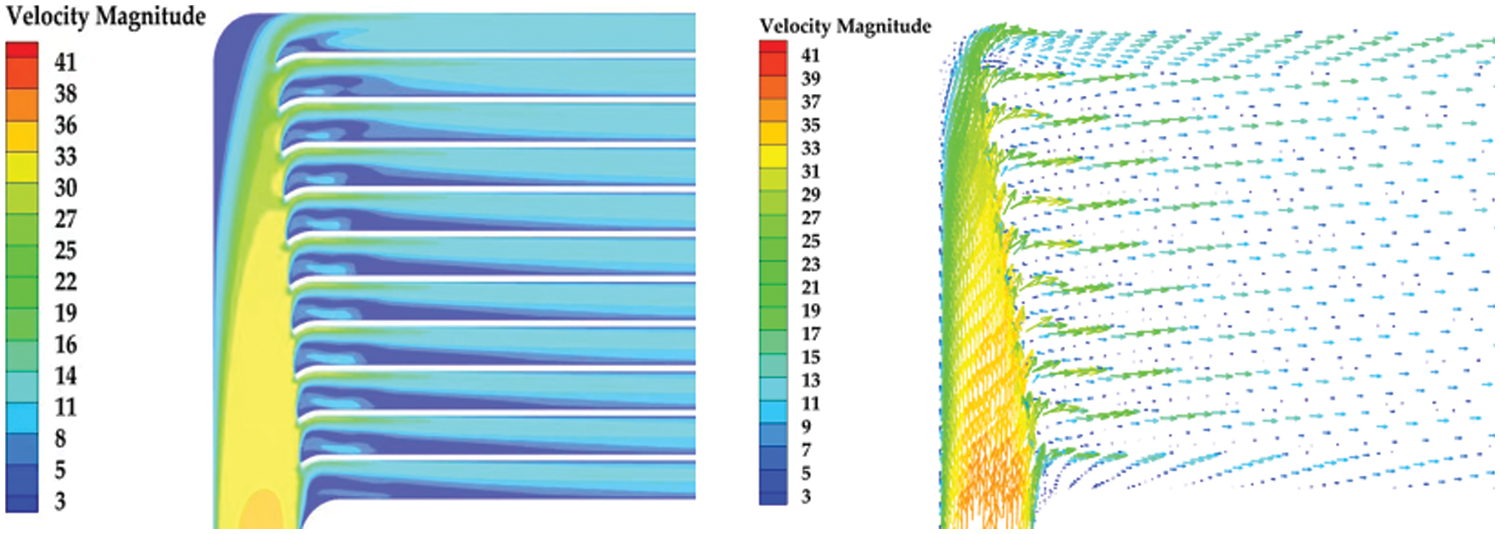
Figure 15: Optimized velocity cloud and velocity vector diagram in scheme 3
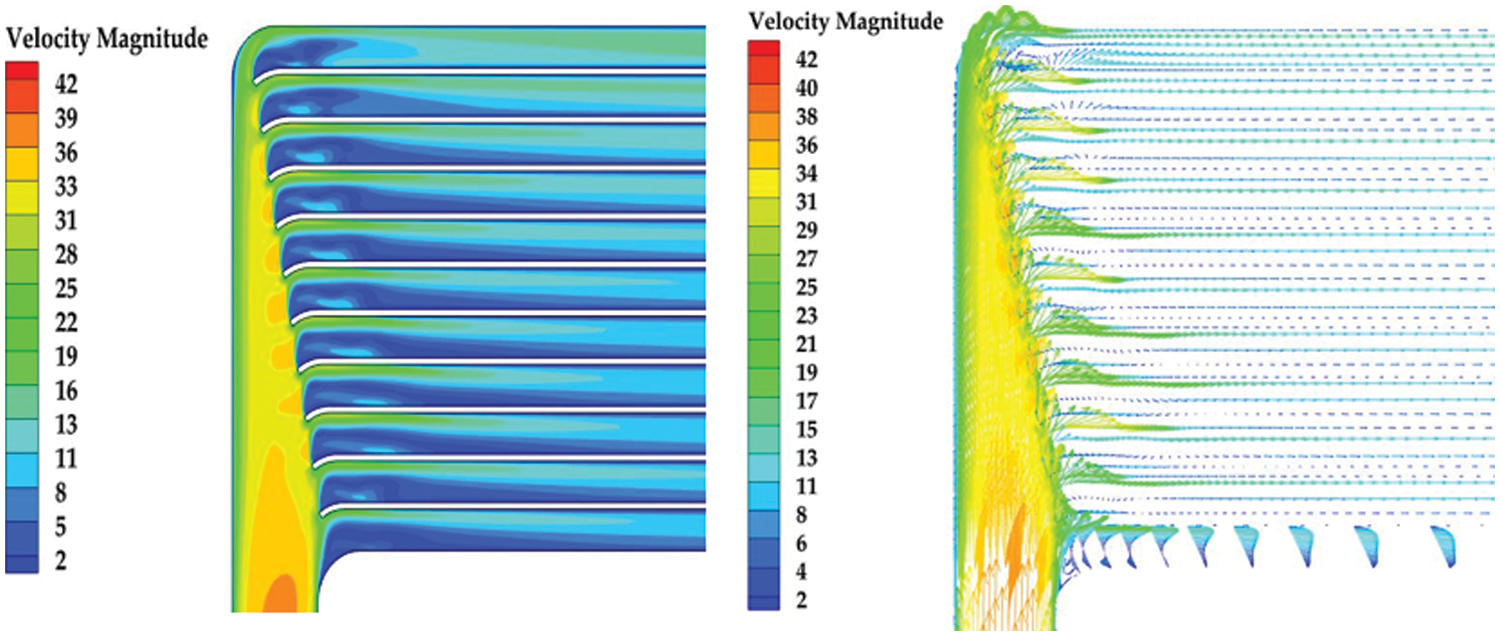
Figure 16: Optimized velocity cloud and velocity vector diagram in scheme 4
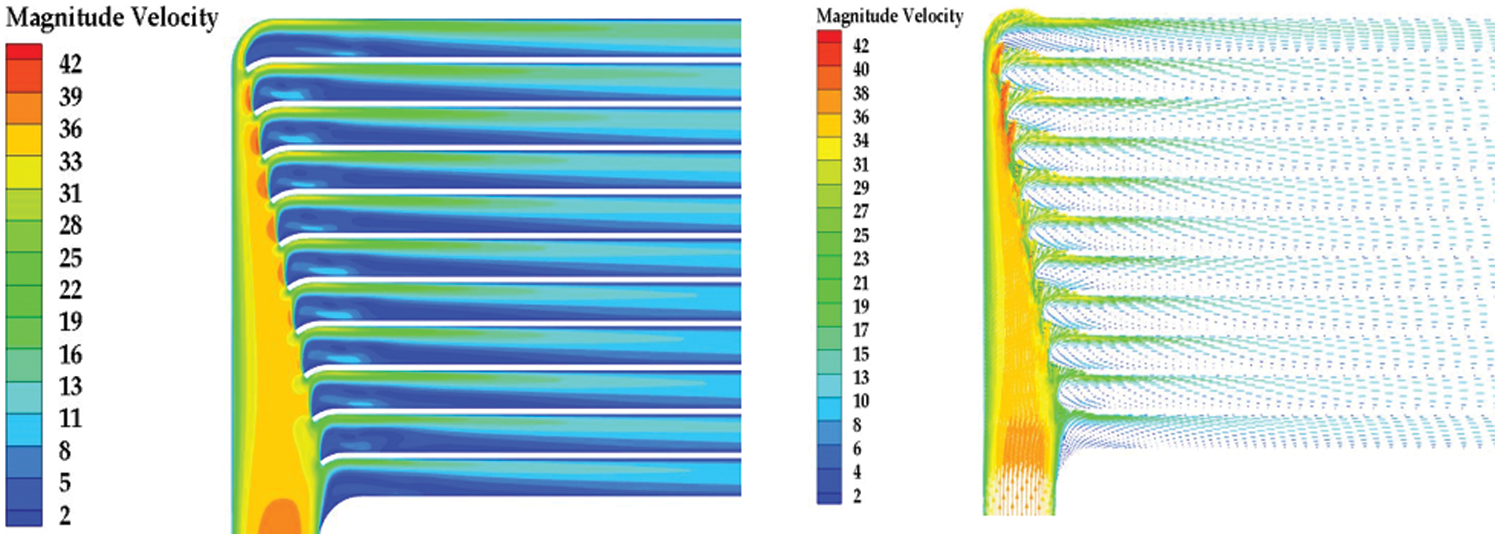
Figure 17: Optimized velocity cloud and velocity vector diagram in scheme 5
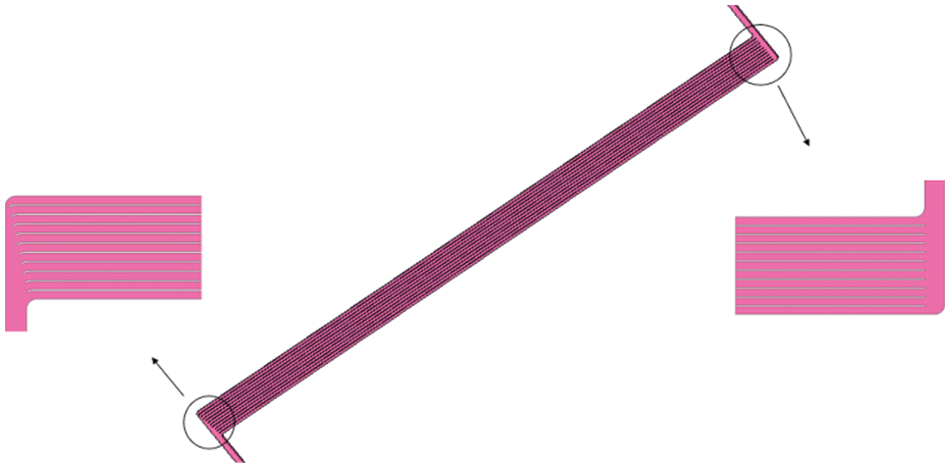
Figure 18: Optimized structural diagram
3.3 Heat Exchange Performance Simulation of the Optimized Structure
As shown in Fig. 19, due to the repeatability of each unit and the complex structure of the low-temperature side channel, 11 low-temperature internal channels and 6 high-temperature side channels and a solid wall in a single subregion of the low-temperature side are selected as a heat exchange unit. The heat exchange unit is meshed in ICEM software. Fig. 19 shows a grid division structure diagram of the cross-section of the heat exchange unit. The other conditions remain unchanged, the flow rate of the working fluid on one side is changed, and the heat exchanger heat recovery is calculated. The regenerative degree of the recuperator can be used to measure the heat transfer performance of the recuperator. The regenerative degree of the recuperator is equal to the ratio of the actual heat exchange effect of the recuperator to the ideal heat exchange effect. The following is the calculation formula [16]:
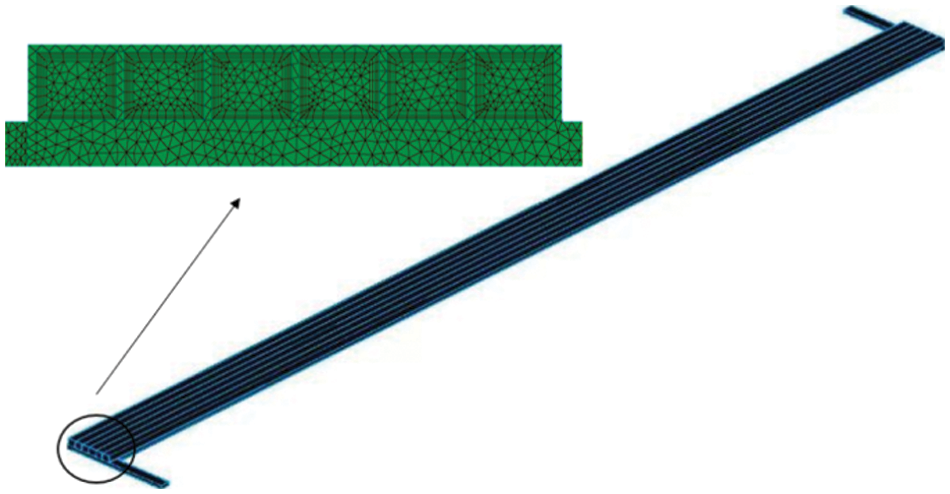
Figure 19: Structure diagram of a heat exchange unit and section meshing diagram
In the formula, the molecule is the maximum of the actual temperature difference between hot and cold gases, and the denominator is the maximum of the ideal temperature difference between hot and cold gases. Besides the continuity equation and momentum equation, this model also includes the heat transfer process. For the fluid region and solid region, the energy equation is as follows [17]:
Fig. 20a shows the changing trend of the regenerative degree by changing the inlet flow at the high-temperature side. With the increase in the inlet flow at the high-temperature side, the regenerative degree of the recuperator also increases. The larger the flow is, the slower the regenerative degree growth trend is observed. After calculation, the average regenerative degree of the optimized structure is approximately 1.5% higher than that of the original structure. Fig. 20b shows the changing trend of the regenerative degree by changing the inlet flow at the low-temperature side. With the increase in the inlet flow at the low-temperature side, the regenerative degree of the recuperator decreases. The average regenerative degree of the optimized structure is approximately 1.2% higher than that of the original structure. Under the design conditions, the heat recovery of the optimized recuperator is 1.5% higher than that of the original structure. The regeneration of the recuperator is closely related to the inlet flow rate of the working fluids. The optimized channel structure improves the heat exchange performance in the low-temperature side counterflow heat exchange zone.
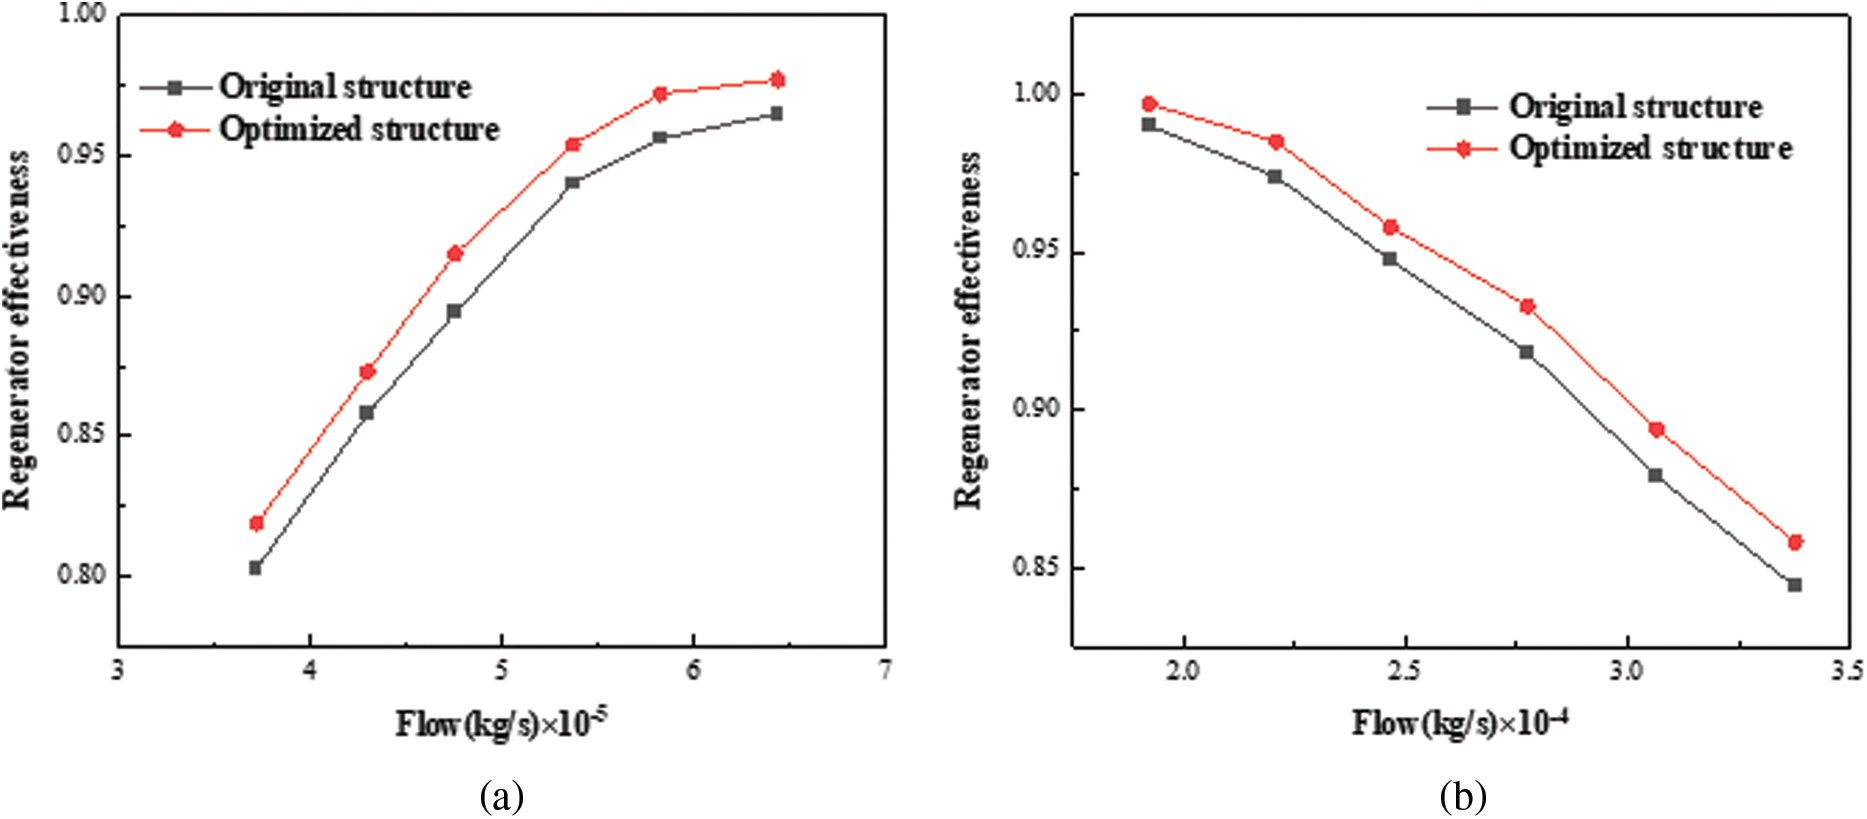
Figure 20: Effect of high- and low-temperature side inlet mass flow variation on the degree of recuperator effectiveness
In this study, the numerical simulation and structural optimization of the 300 kW micro gas turbine recuperator are performed. The influence of the channel structure on the recuperator’s flow and heat transfer characteristics is studied. It provides a reference for the design of the recuperator. The obtained results show the following:
1. A single heat transfer unit on the low-temperature side and a single heat transfer unit on the high-temperature side were selected for modelling. The calculated results are compared with the experimental results [16]. The numerical results are within the allowable error range. The feasibility of the calculation method in this study is confirmed.
2. The channel velocity in the countercurrent heat transfer zone on the low-temperature side of the original structure is uneven. The average velocity of the 11 channel sections is 2–8 m/s. Reflux occurs at the corner of the inlet diversion zone and countercurrent heat exchange zone. Under the condition that the pressure loss meets the design requirements, the rib length of the channel at the entrance is increased by 0.39 mm from bottom to top, and the fillet is processed. After improvement, the average velocity distribution of 11 channels is uniform. The variation range is 4–5.5 m/s. Compared with the original structure, the average pressure drop in the transition section between the inlet diversion zone and the core heat exchange zone is reduced by 25%. The reflux phenomenon basically disappeared.
3. The regeneration of the recuperator is closely related to the inlet flow rate of the working fluids. After optimization, the effectiveness of the recuperator is increased by 1.5% under design conditions. The heat exchange performance of the recuperator has been improved.
Due to the time limit, there are still many deficiencies in the research for 300 kW micro gas turbine recuperator, and there are some parts that need to be further improved and studied. On the one hand, it has yet been able to verify the correctness of the simulation through experiments. On the other hand, the scope of this research is not comprehensive enough, and the actual situation and working conditions should be taken into account.
Funding Statement: This research is supported by the Scientific Problem Tackling Program of Science and Technology Commission of Shanghai Municipality (18DZ1202000) and the Shanghai Local University Project “Research and Application of Key Technologies of New Efficient Micro Gas Turbine System” (No. 19020500900).
Conflicts of Interest: The authors declare that they have no conflicts of interest to report regarding the present study.
References
1. Zhao, S. H. (2001). Development of new concept micro gas turbine. Gas Turbine Technology, 14(2), 8–13. [Google Scholar]
2. Weng, Y. W., Wen, X. Y., Weng, S. L. (2017). Gas turbine technology and development. Chinese Journal of Nature, 39(1), 43–47. [Google Scholar]
3. Wen, J., Li, Y. Z., Zhou, A. M., Zhang, K. (2006). Numerical and experimental investigation of inside flow patterns of the entrance configuration in plate-fin heat exchanger. Journal of Huazhong University of Science and Technology (Nature Science Edition), 34(7), 5–8. [Google Scholar]
4. Qi, M., Xu, G. Q. (2009). Structure optimization for micro-turbine recuperator. Gas Turbine Experiment and Research, 22(2), 26–29. [Google Scholar]
5. Cao, X. W., Shi, Q., Peng, W. S. (2019). Structural optimization and performance numerical simulation of plate-fin heat exchanger. Oil and gas Storage and Transportation, 38(9), 1048–1053. [Google Scholar]
6. Liu, C. Y., Xu, Z. P., Zhang, L., Zhang, W. R., Wang, C. J. (2010). Numerical and experimental study on flow and heat transfer performance of annular primary surface recuperator in microturbine. Journal of University of Shanghai for Science and Technology, 32(2), 191–195. [Google Scholar]
7. Campbell, J. F., Rohsenow, W. M. (1992). Gas turbine regenerators: A method for selecting the optimum plate-finned surface pair for minimum core volume. International Journal of Heat and Mass Transfer, 35(12), 3441–3450. DOI 10.1016/0017-9310(92)90230-P. [Google Scholar] [CrossRef]
8. Cui, N., Sun, W. C., Tang, Q. C., Wang, J. W. (2019). Characteristic analysis and structure optimization of the plate-fin heat exchanger in a gas turbine. Journal of Chinese Society of Power Engineering, 39(11), 884–892. [Google Scholar]
9. Ling, W. S., Zhou, W., Liu, C. Z., Zhou, F., Yuan, D. et al. (2020). Structure and geometric dimension optimization of interlaced microchannel for heat transfer performance enhancement. Applied Thermal Engineering, 170, 1359–4311. DOI 10.1016/j.applthermaleng.2020.115011. [Google Scholar] [CrossRef]
10. Rao, B. P., Kumar, P. K., Das, S. K. (2002). Effect of flow distribution to the channels on the thermal performance of a plate heat exchanger. Chemical Engineering and Processing, 41(1), 49–58. DOI 10.1016/S0255-2701(01)00105-2. [Google Scholar] [CrossRef]
11. Bhutta, M. M. A., Hayat, N., Bashir, M. H., Khan, R. A., Ahmad, K. N. et al. (2011). CFD applications in various heat exchangers design: A review. Applied Thermal Engineering, 32, 1–12. [Google Scholar]
12. Galeazzo, F. C. C., Miura, R. Y., Gut, J. A. W., Tadini, C. C. (2006). Experimental and numerical heat transfer in a plate heat exchanger. Chemical Engineering Science, 61(21), 7133–7138. [Google Scholar]
13. Hanafizadeh, P., Maghsoudi, P. (2017). Exergy, economy and pressure drop analyses for optimal design of recuperator used in microturbine. Energy Equipment and Systems, 5(2), 95–113. [Google Scholar]
14. Maghsoudi, P., Sadeghi, S., Hanafizadeh, P. (2017). Thermoeconomic optimization and comparison of plate-fin heat exchangers using louver, offset strip, triangular and rectangular fins applied in 200 KW microturbines. Journal of Heat Transfer, 139(10). [Google Scholar]
15. Maghsoudi, P., Sadeghi, S., Xiong, Q. G., Aminossadati, S. M. (2019). A multi-factor methodology for evaluation and optimization of plate-fin recuperators for micro gas turbine applications considering payback period as universal objective function. International Journal of Numerical Methods for Heat & Fluid Flow, 30(5), 2411–2438. [Google Scholar]
16. Shi, X. S. (2020). Study on flow and heat transfer characteristics of micro gas turbine recuperator (Ph.D. Thesis). University of Chinese Academy of Sciences, China. [Google Scholar]
17. Li, S., Sund, N. B. (2018). Numerical study on thermal performance of non-uniform flow channel designs for cooling plates of PEM fuel cells. Numerical Heat Transfer, 74(1), 917–930. [Google Scholar]
Cite This Article
 Copyright © 2023 The Author(s). Published by Tech Science Press.
This work is licensed under a Creative Commons Attribution 4.0 International License , which permits unrestricted use, distribution, and reproduction in any medium, provided the original work is properly cited.
 Downloads
 Citation Tools