
 Submit a Paper
 Propose a Special lssue
 Open Access
ARTICLE

Interaction of Foam and Microemulsion Components in Low-Tension-Gas Flooding
School of Petroleum Engineering, Changzhou University, Changzhou, 213164, China
* Corresponding Author: Jun Yang. Email:
Fluid Dynamics & Materials Processing 2023, 19(7), 1951-1961. https://doi.org/10.32604/fdmp.2023.026115
Received 17 August 2022; Accepted 11 October 2022; Issue published 08 March 2023
 View Full Text
 Download PDF
Abstract
Low-Tension-Foam (LTF) flooding is an emerging enhanced oil recovery technique for low-permeability carbonate reservoirs. Foam capacity is closely related to the salinity environment (or, equivalently, the phase behavior of the oil/water/surfactant system). Therefore, the interactions between microemulsion and foam components are of primary importance in the LTF process. In this study, the phase behavior of an oil/water/surfactant system under equilibrium is analyzed, firstly by assuming perfect mixing. Meanwhile, the formation kinetics of microemulsion are monitored through a novel low-field NMR technique, which is able to provide quantitative assessment on the microemulsion evolution characteristics. Then, foam stability is examined in the absence and in the presence of Winsor-I and Winsor-III type microemulsions. It is revealed that foam stability depends on the oil solubilization (oil swollen micelle size). A decrease in the oil swollen micelle size and micellar structure effectiveness, in conjunction with an increasing salinity, leads to lower foam stability in the presence of a Winsor-III type microemulsion.Keywords
Low permeability reservoirs are characterized by high heterogeneity and low permeability, making conventional water/gas flooding, water alternating gas (WAG) and polymer flooding inefficient due to strong channeling, and poor injectivity. Miscible flooding is most effective EOR method for low permeability reservoirs with the pressure higher than minimum miscible pressure (MMP). However, for low permeability, high salinity reservoirs with low reservoir pressure when miscibility between oil and gaseous solvent (CO2) cannot be achieved, very limited EOR methods are applicable. In this regard, low tension foam (LTF) flooding, which is analogy to current alkali-surfactant-polymer (ASP) process, and combines features of microemulsion flooding and foam flooding, becomes a promising EOR technique [1–3].
Low-Tension-Gas flooding combines the advantages of surfactant flooding and foam flooding. In a typical LTF process, negative salinity gradient strategy is commonly applied, i.e., at the first stage, a surfactant system with a higher salinity (henceforth called Winsor-III surfactant system) is injected into porous media to generate Winsor-III microemulsions in-situ; at the second stage, the surfactant system with a lower salinity which corresponds to water-in-oil (i.e., Winsor-I) microemulsion (henceforth called Winsor-I surfactant system) is co-injected with gas to generate foam. The basic principles behind this strategy are that the ultra-low IFT [4] accompanied with the formation of Winsor-III microemulsion, which enables the mobilization of trapped oil and the generation of foam which provides mobility control, and thus enlarges the sweep efficiency [5]. The majority of studies in the area of LGF process are phenomenological, via core flooding or sandpacked model flooding, although verified the viability of LTF flooding as a tertiary EOR method in low permeability formations, only global quantities are measured and only quantitative information on local displacement dynamics is inferred. Zhao et al. [6] performed LTF flooding in tight-carbonate and tight-sandstone cores. They asserted the dominate role of gas/liquid injection rate, and the resulting foam quality (fg) in LTF process success and addressed that LTF flooding applies low injection rate (fg = 50%) to prevent unrealistic pressure drop and the accompanying poor injectivity. Das et al. [3] performed a comprehensive study to investigate the influence of operation conditions, onset of gas injection, foam quality, as well as salinity profile on the LTF performance as a secondary and tertiary EOR method in low permeability carbonate reservoirs with high salinity. Dong et al. [1] performed LTF flooding in fractured carbonate cores at high salinity (23% TDS) and high temperature. By comparing the ultimate oil recovery factors of water-alternating-gas (WAG) flooding and LTF flooding, an increase of 60% OOIP was observed, owing to the combined effect of IFT reduction and mobility control. They further postulated that even sporadic foam lamellae existing in the matrix are able to provide substantial flow resistance to improve the sweep efficiency.
However, considering the fact that multiple mechanisms come into play in LTF flooding, the state of art in this area is still incomplete. To begin with, a LTF process requires the in-situ formation of the microemulsion. The dynamics of in-situ microemulsion formation in porous media during LTF flooding is complicated. In fact, the evolution of in-situ microemulsion is a phase change process where initially homogenous oil and aqueous surfactant solution come into contact and mixed into microemulsion phase. At the first stage of LTF flooding, the propagation of surfactant in porous media by advection and diffusion results in the formation of in-situ microemulsion, and the ultra-low IFT is established; the displacement becomes quasi-miscible. Microemulsion formation alters the local thermodynamic properties (i.e., IFT, viscosity, wettability), and thus the flow flied of multi-phase in porous media. The change of global flow field in turn affects the advection of surfactant, and consequently the formation of the microemulsion. In other words, the flow flied, surfactant concentration field, and the phase flied are coupled during LTG flooding. Unsal et al. [7] investigated the emulsification process of an anionic surfactant internal olefin sulfonate (IOS) with n-decane under flowing conditions in a microfluidic T-junction, and revealed the clear link between the phase behavior of the S/O/W system under dynamic and equilibrium conditions. Tagavifar et al. [8] obtained the qualitative information on how the phase change and emulsification relate to the flow patterns in a 2.5D micromodel. However, the interplay of flow, mixing, and emulsification kinetics of the surfactant/oil/water (S/O/W) system is far from clarified. In addition, at the second stage of LTG flooding, the interactions between foam and microemulsion govern the EOR efficiency. A variety of studies have been performed in the context of pore-level foam-oil interactions in microfluidic studies. Osei-Bonsu et al. [9] addressed the difference on the impact of oil on foam properties at bulk- and pore-scale using a Hele–Shaw study. Conn et al. [10–12] used polydimethylsiloxane (PDMS) microfluidic chips in the presence of a fracture in parallel to the flow direction. Their studies show that despite the detrimental effect of oil on foam, the displacement efficiency of foam flooding is guaranteed by the “smart rheology” of foam. However, less attention is paid on foam-microemulsion interactions. Pioneering studies by Das et al. [3] investigated the displacement patterns during LTF flooding using different injection schemes for the first time in a glass microfluidic chip. Their study provides insights on the impact of foam on the transition characteristics of non-equilibrated emulsions during LTF flooding, but only on the qualitative level.
This study thus pertains to the general field of the interaction between foam and microemulsions, which are ubiquitous in industrial applications where microemulsion is generated intentionally to create ultra-low IFT to mobilize residual oil, and foam is formed to control gas mobility.
The surfactant solutions used in this study are the mixture of internal olefin sulfonate (IOS), sodium dodecyl sulfate (SDS) and a co-solvent 2-butanol (SBA) at the concentration ratio of 1:7:10. 1-dodecanol (C12) is used as the oleic phase and 0.005 wt% of highly oil-soluble red dye (oil red O) is added into the oil. Sodium chloride (NaCl) concentration varies for a salinity scan. Distilled water. All chemicals are purchased from Sigma Aldrich, Inc., Canada. All experiments are performed at ambient conditions (Tamb = 21°C, Patm = 1 atm), unless otherwise specified.
2.2 Macroscopic Equilibrium Phase Behavior Oil/Surfactant/Water System
The equilibrium phase behavior of oil/surfactant/water system is analyzed based on salinity scan method. Multiple 15 mL test tubes containing 5.0 mL 1-dodecanol and 5.0 mL surfactant solution of different NaCl salinities are prepared (WOR = 1). The NaCl salinity varies from 0 to 10 wt% with 0.1 wt% increments. The oil/surfactant/water systems are mixed thoroughly by a magnetic stirrer at the speed of 8000 for 30 min to attain homogeneity, and then the mixtures are allowed to equilibrate for 15 days prior to phase classification. Once at equilibrium, the solubilization of oil and water is analyzed by visually inspecting the tubes under white (polychromatic) reflected light. The solubilization ratio (SR) is defined as the volume of the oil (Vo) or water (Vw) to that of the surfactant (Vs) in the microemulsion phase (Eqs. (1)–(2)) [8],
where Vo, and Vw are the volume of solubilized oil and water in microemulsion, respectively. ρH2O and ρs are the density of water and surfactant, respectively. Note that to allow data treatment, the surfactant is assumed to entirely and homogeneously distributed in the microemulsion phase.
2.3 Interfacial Tension Measurement
After equilibrium, the microemulsion phase is collected from each tube for interfacial tension (IFT) analysis. The IFT between the microemulsion and the aqueous phase is measured using a spinning drop tensiometer. The glass capillary with 4 mm inner diameter (sample holder) is first filled with the aqueous phase, then a microemulsion droplet is carefully injected into capillary using a syringe needle. The capillary is placed in the measuring chamber of the tensiometer. The measurements are taken at the spin rate of 8000 rpm. The photographs of the microemulsion droplet are taken using the high-solution camera and the IFT values are calculated accordingly. The average equilibrium IFT values of ten repeated measurements are reported. The IFT between the microemulsion and the oleic phase is too low such that it is difficult to obtain a stable reading, and therefore Chun-Huh equation (Eq. (3)), which predicts ultralow IFT from microemulsion solubilization, is applied to calculate the IFT value based on solubilization capacity [13],
where C is assumed to have a typical value of 0.3.
2.4 Compositional Gradient in Oil/Surfactant/Water System
Low-Field Nuclear Magnetic Resonance (NMR) acquisitions is performed using a MQR spectrometer from Oxford instruments equipped with a 1.8 cm diameter probe. 3 mL aqueous phase is placed in a glass tube with approximately 2 cm in height. The system is equilibrated for 50 min before each test. The acquisition time for each measurement is 100 s. It is assumed that surfactant molecules in Winsor-III type system is distributed uniformly and entirely in the intermediate phase between excess brine and oil at equilibrium and those in Winsor-I type system is distributed throughout the aqueous phase. The emulsification kinetics is monitored for 7 days. Note that since the hydrogen index (HI) of the SDS solution (HISDS = 1.02), and n-butanol (HIn-butanol = 1.01) and brine (HIBrine = 0.98) is similar, it is difficult to obtain the desired quantities of three phases in terms of density profiles alone. Therefore, we follow the methodology proposed by Herrera et al. [14], that is, the phases are distinguished in terms of the relaxation time contrast.
2.5 Bulk Foam Properties in the Presence and in the Absence of Microemulsions
In this study, the surfactant/co-solvent solution is pre-equilibrated with oil at the volume ratio of 1:1 for more than 15 days. After that, the formed microemulsion is extracted repeatedly from the glass tube using a suction. Foam is generated using Ross-miles method. 50 mL of the aqueous phase is slowly poured into a glass column. CO2 is injected into to the column at a constant flowrate of 10 min/cm3. The gas injection terminates as soon as the height of foam becomes constant. Parafilm is used to cover the top of the column to avoid humidity effect. The foam height is recorded over time, until the foam height reaches half of its initial value. To evaluate foam ability and foam stability in the presence of microemulsion. 1 mL of microemulsion is added into the aqueous phase before gas injection. The detailed procedures of generating microemulsion can be found in Zhao et al. [4].
3.1 Equilibrium Phase Behavior of Oil/Surfactant/Water System
Salinity scan method is used to establish a Winsor-type phase behavior. Fig. 1 shows the phase transition (i.e., from Winsor-I to Winsor-III to Winsor-II) of the oil/surfactant/water system at the SDS/n-butanol relative concentration (RC, wt%/wt%) of 0.4 as a function of salinity of the aqueous phase. Oil is dyed with red for a better view. As expected, at low salinities (S ≤ 4 wt%), the surfactant bears an affinity for the aqueous phase, and Winsor-I type microemulsion forms; at intermediate salinities (4 < S ≤ 8.5 wt%), the surfactant has a similar affinity for the oleic and aqueous phases, and the systems separate into three different phases, i.e., water, microemulsion, and oil phases; and at high salinities (S > 8.5 wt%), the surfactant bears an affinity for the oil phase, and Winsor-II type microemulsion forms.
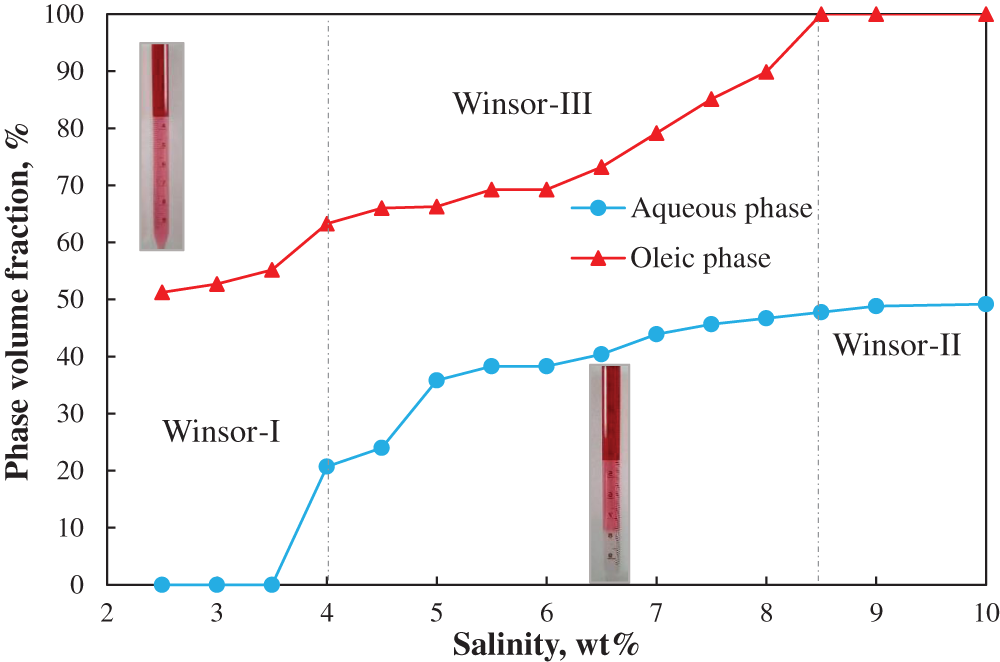
Figure 1: Salinity scans at constant surfactant/co-solvent ratio of 4:5
Fig. 2 complements Fig. 1 by showing the solubilization ratios. As seen, the measured optimal solubilization ratio is approximately 16 and the optimal salinity (S*) at which affinity of surfactant with the aqueous and oil phase is balanced (SRo = SRw) is 5 wt%. The interfacial tension values within Winsor-III environment are illustrated in Fig. 3. The IFTs between oil and microemulsions (with the aqueous phase salinity corresponding to Winsor-III microemulsions) are calculated to be on the order of 10−3 mN/m (ultra-low IFT) by Chun-Huh equation based on the solubilization ratios. The IFTs between microemulsion and aqueous phase are measured using the spinning drop tensiometer. Twenty measurements are taken for each system at each spinning rate, and the average value is taken by excluding the maximum and minimum values. It is seen that all IFT are ultra-low, i.e., below 1 × 10 − 3 mN/m.
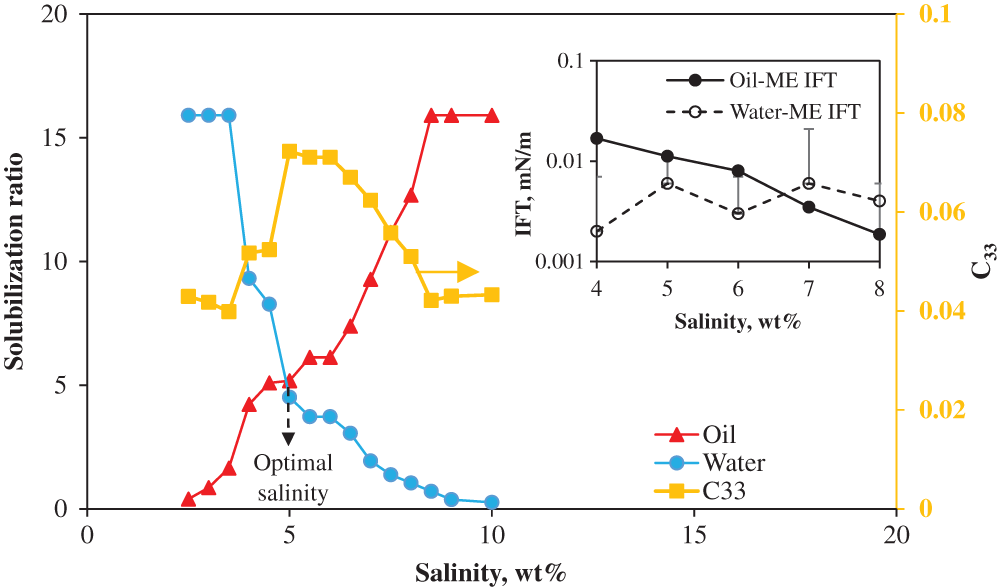
Figure 2: Solubilization ratios at constant surfactant/co-solvent ratio of 4:5. C33 denotes the concentration of surfactant in the microemulsion phase (insert: the IFT between oil and microemulsion, and between water and microemulsion)
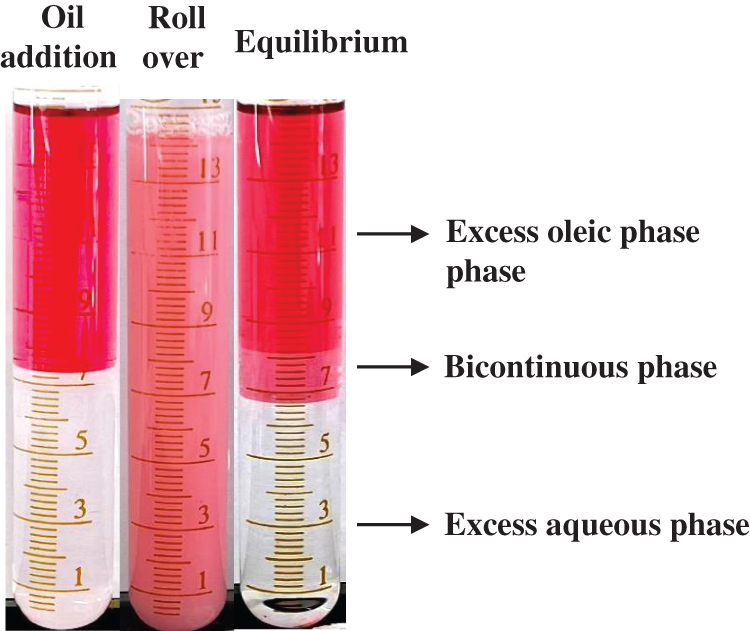
Figure 3: Photographs of the oil/surfactant/water system: (a) after oil addition into the aqueous phase; (b) after rollover of the test tube; (c) at equilibrium at the salinity of 8 wt%. The equilibrium state is captured after mixing and standing at ambient conditions for 24 h
It is known that the volume fraction of oil in the water-oil mixture is given by Hirasaki [15],
The mass fractions of surfactant molecules and co-solvent on water are given as,
where m denotes the mass and V denotes the volume, respectively. The subscript c stands for co-solvent. Enlightened by the model proposed by Hirasaki [15], the microemulsion composition and phase volume fractions are calculated using Eqs. (4)–(6) (Table 1),

where the superscripts w, o and ip denote water, oil and interface pseudophases. Kao is the partitioning coefficient between oil and water. Kas is the partitioning coefficient of the interface pseudophase water. Cpi is the pseudophase concentration. Based on Table 1, the Kao and Kas are fitted to be 0.7 and 23.2, respectively, indicating a stronger affinity of cosolvent for the interface when compared with brine and oil.
The phase behavior of the surfactant/oil/water system is further studied using three different SDS/n-butanol relative concentrations (RC), i.e., RC = 1:1, 1:5, 4:5. The results show that the equilibration time of the oil/surfactant/water system depends on the concentration ratio between surfactant and co-solvent. The formation of microemulsion becomes slower, and the opacity of the middle microemulsion phase decreases with increasing RC; RC controls the composition, volume, and viscosity of the bicontinuous microemulsion [16].
3.2 Formation Kinetics of Microemulsion
Kinetic studies are performed by using the Low-field nuclear magnetic resonance (NMR) (see detailed methodology and principle in Herrera et al. [14]. The pioneering NMR method allows the simultaneous quantification of different compositions along the tube height during spontaneous microemulsion formation and evolution. The composition profiles before and after the addition of paraffin below optimal salinity are shown in Fig. 4. 0.5 wt% of IOS, 3.5 wt% of SDS and 5 wt% of SBA in 6 wt% NaCl brine are used as the aqueous phase. As seen from Fig. 4b, the co-solvent (marked with yellow) progressively migrates at the oil/water interface. As time proceeds, the bicontinuous phase becomes thicken, which is in consistence with the growth of the bicontinuous phase observed during salinity scan. The system now is composed of oil and aqueous phases with a turbid interface (Fig. 4b). The energy induced by the evolution of liquid crystal [14] enables the additional solubilization of oil and water that eventually leads to a thickening of the microemulsion phase (Fig. 4c).
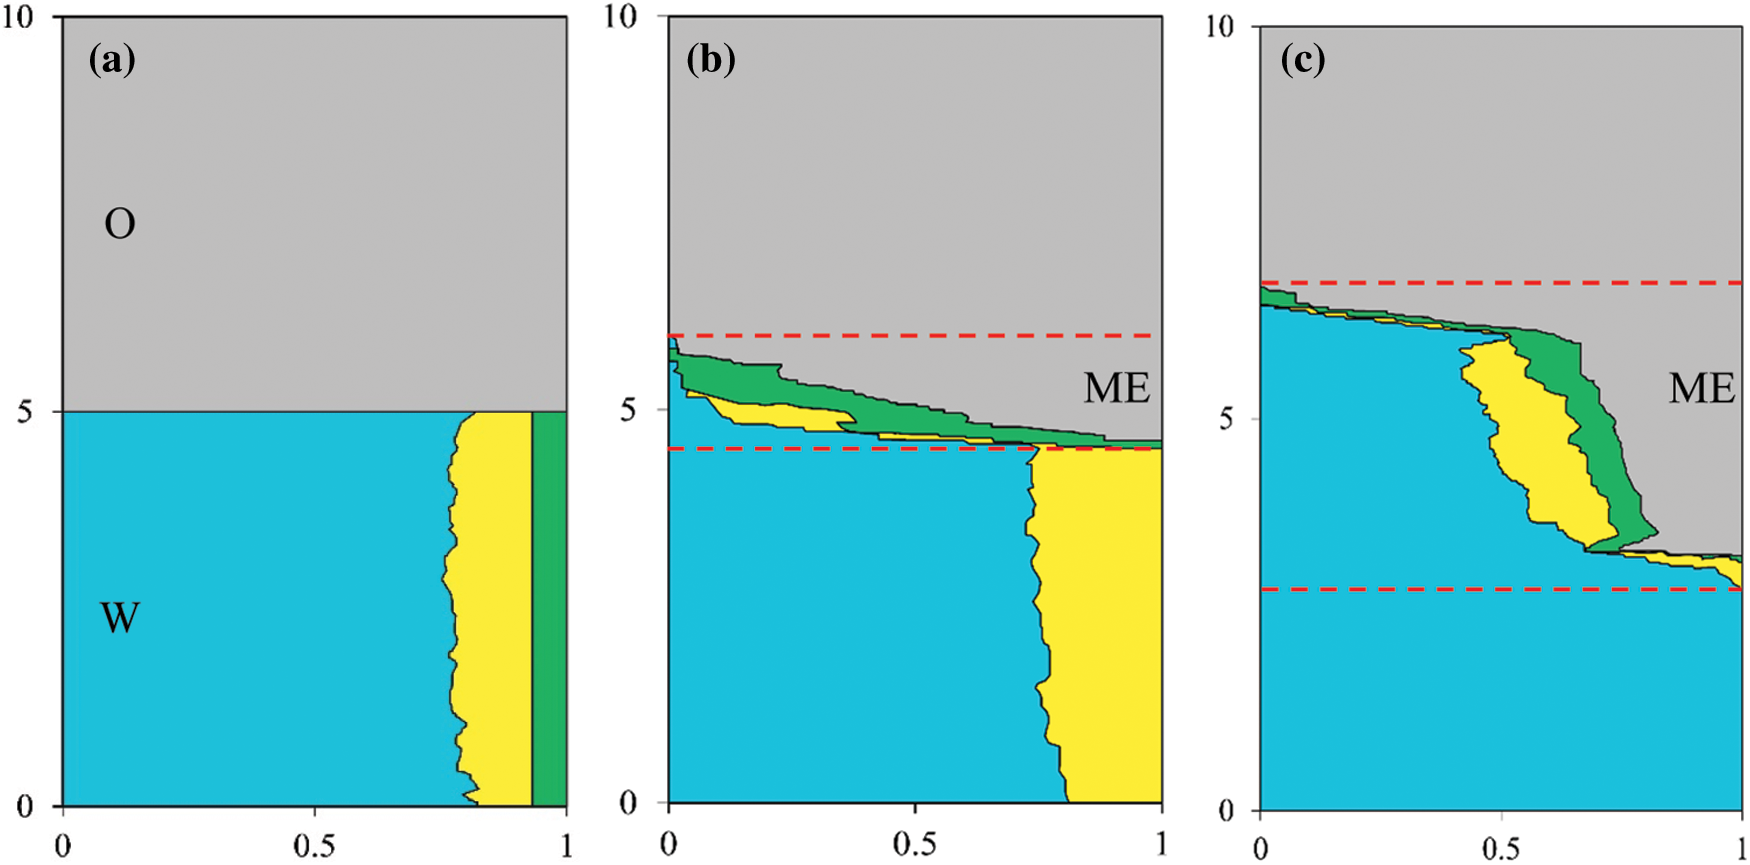
Figure 4: Volume fractions as a function of the relative height in glass tube at equilibrium times of (a) 0 h, (b) 0.5 h, and (c) 150 h, respectively. Grey, blue, yellow and green colors denote oil, brine, cosolvent (n-butanol) and surfactant, respectively
3.3 Bulk-Scale Foam Capacity in the Absence and in the Presence of Microemulsion
Foam stability is evaluated by the decrease in the foam volume with time. As indicated previously, 100 mL of foaming agent is used and the resulting initial foam height with and without Winsor-III type microemulsion (ME) are 121 and 91 cm3, respectively. The formed foam bubbles are finer and more homogeneous, and the mean size of foam bubbles is much smaller in the absence of microemulsion (Fig. 5). The formed bubbles in the presence of ME possess high polydispersity, leading to stronger foam coalescence. However, in the case of Winsor I type ME, foam height with microemulsion is initially similar to, and gradually surpasses that without microemulsion, indicating that Winsor-I environment is favorable for foam formation (Fig. 6). This further explains why at the first stage of LTG flooding, the salinity which corresponds to Winsor-III type ME is used (to create ultra-low IFT environment), but at the second stage, the salinity is altered to the value corresponding to Winsor-I type ME before foam injection (to generate strong foam for mobility control). As illustrated in Section 3.1, the salinity environment of Winsor-I type ME is lower than that of Winsor-III type ME. As the salinity increases, the repulsion between hydrophilic headgroups decreases, allowing for closer packing of the electrical double layers, which results in larger micelles as shown in Fig. 7, greater oil solubilization per micelle and consequently weaker foam stability [17].
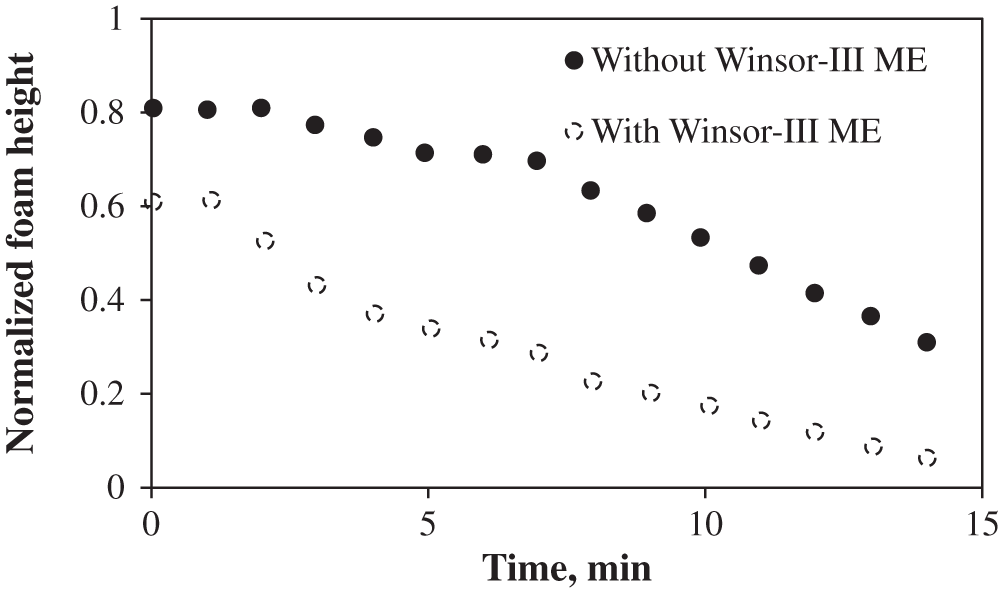
Figure 5: Foam height with time in the absence and in the presence of Winsor-III type microemulsion
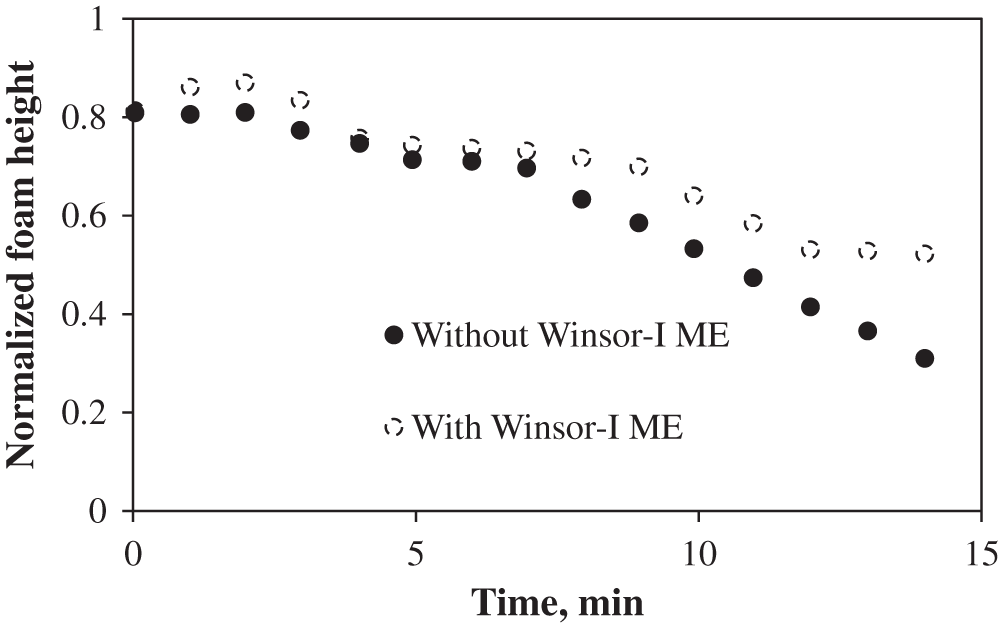
Figure 6: Foam height with time in the absence and in the presence of Winsor-I type microemulsion
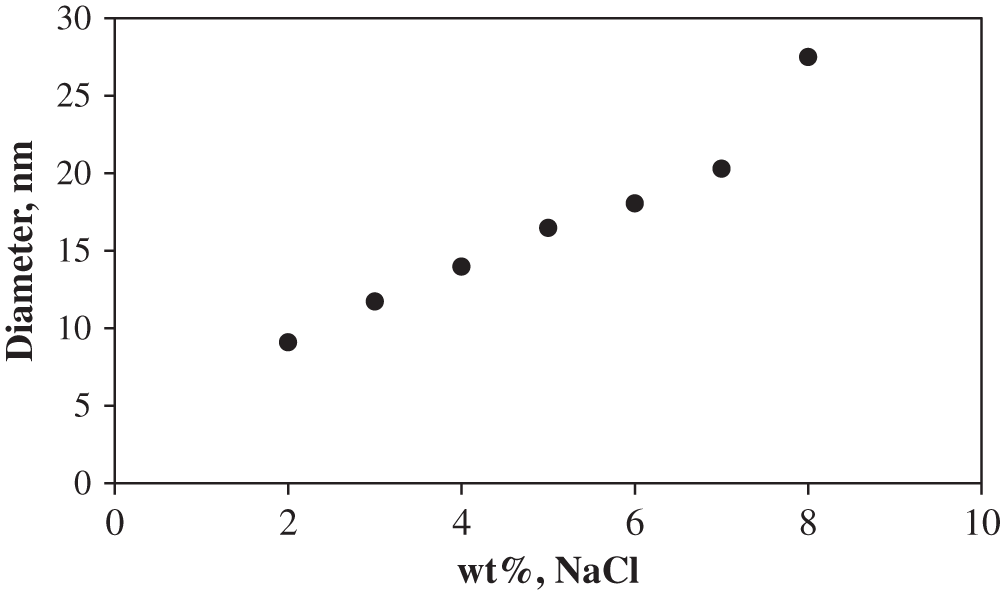
Figure 7: Micelle diameter as a function of salinity measured by dynamic light scattering
In fact, the stability of foam column is related to the thinning of foam film between neighboring bubbles. Fig. 8 shows the evolution of single foam film thinning in the absence and in the presence of microemulsion. It can be seen that the rate of film thinning is faster in the presence of microemulsion. It is known that the “dark spots” are foam film regions that no longer contains micelles, and the appearance of “dark spots” implies the thinning of foam film. In Fig. 8b-2, multiple small dark spots appear at the top part of the film after only 45 s after foam film formation. A possible explanation is that the solubilization of oil within in the surfactant micelles weakens the micellar layering, and therefore the formation of “dark spots” becomes more favorable, thereby destabilizing the foam film. The destabilizing of foam film leads to the formation of continuous gas flow, which accelerates the step-wise foam film thinning process, and eventually to the lower bulk foam stability [18].
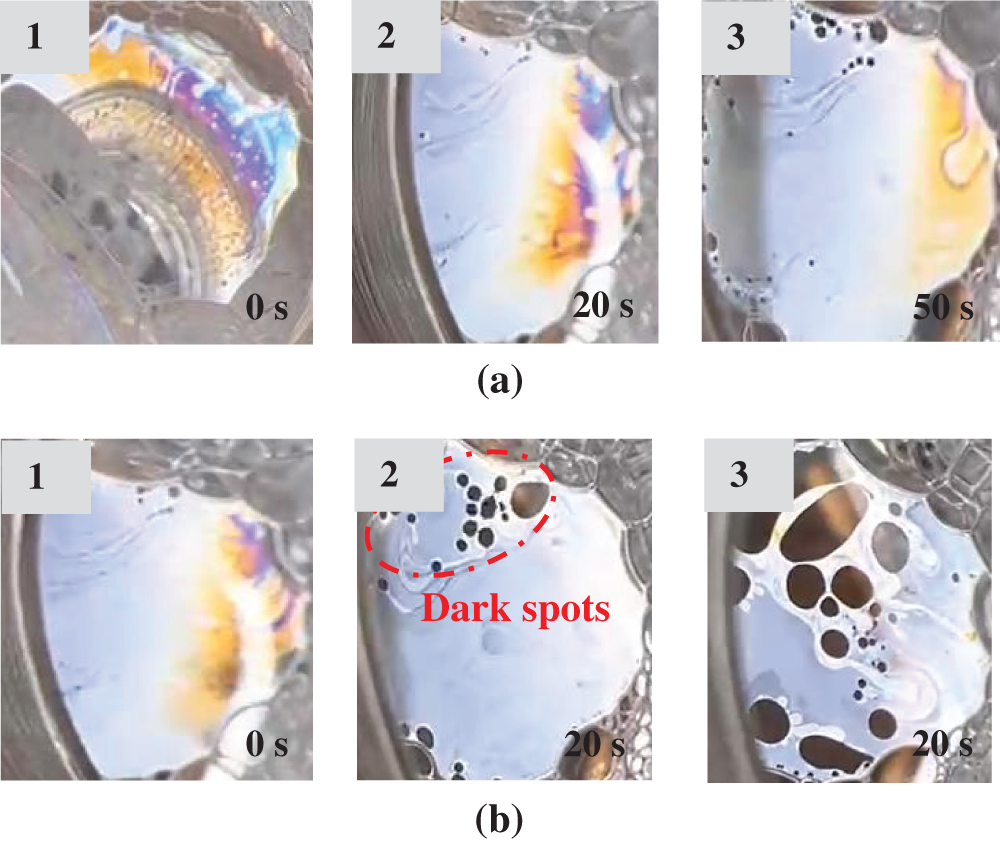
Figure 8: Evolution of the inclined single film thinning (a) in the absence and (b) in the presence of Winsor-III type microemulsion
(1) The phase behavior of the quinary system of oil/water/surfactant system at constant surfactant mixture composition and oil-to-water ratio over full range of salinities is observed. The solubilization ratio is highly controlled by co-solvent/surfactant concentration ratios. As the concentration ratio increases, the formation of microemulsion becomes quicker and the opacity of the microemulsion phase decreases.
(2) The kinetics of microemulsion formation is investigated using the novel low-field NMR. It is found that the compositional gradients observed along the sample height is closely linked to the corresponding phase diagram of oil/water/surfactant system under equilibrium conditions.
(3) In case of Winsor-I type microemulsion, oil droplets are dispersed in foam films and accumulates at the plateau borders and slows down film thinning process, resulting in more stable foam. In case of Winsor-III type microemulsion, oil solubilized in micelles, suppressing micellar stratification, and therefore accelerating foam coalescence. The interactions between microemulsion and foam can be explained by the action of solubilized oil within the foam film, which varies with salinity.
This study provides interesting route to further understand the formation kinetics of microemulsion, as well as the interactions between foam and microemulsion, which shed lights on the displacement mechanisms of low-tension-gas flooding in low permeability reservoirs.
Acknowledgement: The project is supported by Mitacs (IT15506).
Funding Statement: The authors received no specific funding for this study.
Availability of Data and Materials: The data that support the findings of this study are available from the corresponding author upon reasonable request.
Conflicts of Interest: The authors declare that they have no conflicts of interest to report regarding the present study.
References
1. Dong, P., Puerto, M., Jian, G., Ma, K., Mateen, K. et al. (2018). Exploring low-IFT foam EOR in fractured carbonates: Success and particular challenges of sub-10-mD limestone. SPE Annual Technical Conference and Exhibition, Dallas, Texas, USA. https://doi.org/10.2118/191725-MS [Google Scholar] [CrossRef]
2. Das, A., Nguyen, N., Farajzadeh, R., Southwick, J. G., Vincent-Bonnieu, S. et al. (2019). Experimental study of injection strategy for Low-Tension-Gas flooding in low permeability, high salinity carbonate reservoirs. Journal of Petroleum Science and Engineering, 184, 106564. https://doi.org/10.1016/j.petrol.2019.106564 [Google Scholar] [CrossRef]
3. Das, A., Nguyen, N., Nguyen, Q. P. (2020). Low tension gas flooding for secondary oil recovery in low-permeability, high-salinity reservoirs. Fuel, 264, 116601. https://doi.org/10.1016/j.fuel.2019.116601 [Google Scholar] [CrossRef]
4. Zhao, J., Torabi, F., Yang, J. (2020). Pore network investigation of gas trapping and mobility during foam propagation using invasion percolation with memory. Transport in Porous Media, 134, 195–230. https://doi.org/10.1007/s11242-020-01442-9 [Google Scholar] [CrossRef]
5. Szlendak, S. M., Nguyen, N. M., Nguyen, Q. P. (2016). Investigation of localized displacement phenomenon for low-tension-gas (LTG) injection in tight formations. Journal of Petroleum Science and Engineering, 142, 36–45. https://doi.org/10.1016/j.petrol.2016.01.042 [Google Scholar] [CrossRef]
6. Zhao, J., Torabi, F., Yang, J. (2021). Role of viscous forces in foam flow in porous media at the pore level. Industrial & Engineering Chemistry Research, 60(7), 3156–3173. https://doi.org/10.1021/acs.iecr.0c05735 [Google Scholar] [CrossRef]
7. Unsal, E., Broens, M., Armstrong, R. T. (2016). Pore scale dynamics of microemulsion formation. Langmuir, 32(28), 7096–7108. https://doi.org/10.1021/acs.langmuir.6b00821 [Google Scholar] [PubMed] [CrossRef]
8. Tagavifar, M., Xu, K., Jang, S. H., Balhoff, M. T., Pope, G. A. (2017). Spontaneous and flow-driven interfacial phase change: Dynamics of microemulsion formation at the pore scale. Langmuir, 33(45), 13077–13086. https://doi.org/10.1021/acs.langmuir.7b02856 [Google Scholar] [PubMed] [CrossRef]
9. Osei-Bonsu, K., Shokri, N., Grassia, P. (2016). Fundamental investigation of foam flow in a liquid-filled hele-shaw cell. Journal of Colloid and Interface Science, 462, 288–296 https://doi.org/10.1016/j.jcis.2015.10.017 [Google Scholar] [PubMed] [CrossRef]
10. Conn, C. A., Ma, K., Hirasaki, G. J., Biswal, S. L. (2014). Visualizing oil displacement with foam in a microfluidic device with permeability contrast. Lab on a Chip, 14(20), 3968–3977. https://doi.org/10.1039/C4LC00620H [Google Scholar] [PubMed] [CrossRef]
11. Xiao, S., Zeng, Y., Vavra, E. D., He, P., Puerto, M. et al. (2017). Destabilization, propagation, and generation of surfactant-stabilized foam during crude oil displacement in heterogeneous model porous media. Langmuir, 34(3), 739–749. https://doi.org/10.1021/acs.langmuir.7b02766 [Google Scholar] [PubMed] [CrossRef]
12. Ma, J., X, S., Luo, J., Zhao, T., Yu, H. et al. (2019). Molecular dynamics simulation insight into interfacial stability and fluidity properties of microemulsions. Langmuir, 35(42), 13636–13645. https://doi.org/10.1021/acs.langmuir.9b02325 [Google Scholar] [PubMed] [CrossRef]
13. Unsal, E., Ruecker, M., Berg, S., Bartels, W. B., Bonnin, A. (2019). Imaging of compositional gradients during in-situ emulsification using X-ray micro-tomography. Journal of Colloid and Interface Science, 550, 159–169. https://doi.org/10.1016/j.jcis.2019.04.068 [Google Scholar] [PubMed] [CrossRef]
14. Herrera, D., Chevalier, T., Fleury, M., Dalmazzone, C. (2021). Quantification of microemulsion systems using low-field T1-weighted imaging. Magnetic Resonance Imaging, 83, 160–168. https://doi.org/10.1016/j.mri.2021.08.002 [Google Scholar] [PubMed] [CrossRef]
15. Hirasaki, G. J. (1982). Interpretation of the change in optimal salinity with overall surfactant concentration. Society of Petroleum Engineers Journal, 22(6), 971–982. https://doi.org/10.2118/10063-PA [Google Scholar] [CrossRef]
16. Broens, M., Unsal, E. (2018). Emulsification kinetics during quasi-miscible flow in dead-end pores. Advances in Water Resources, 113, 13–22. https://doi.org/10.1016/j.advwatres.2018.01.001 [Google Scholar] [CrossRef]
17. Jong, S. Y. C., Nguyen, Q. P. (2018). Effect of microemulsion on foam stability. Applied Nanoscience, 8(3), 231–239. https://doi.org/10.1007/s13204-018-0808-7 [Google Scholar] [CrossRef]
18. Weiss, J., McClements, D. J. (2000). Mass transport phenomena in oil-in-water emulsions containing surfactant micelles: Solubilization. Langmuir, 16(14), 5879–5883. https://doi.org/10.1021/la9914763 [Google Scholar] [CrossRef]
Cite This Article
 Copyright © 2023 The Author(s). Published by Tech Science Press.
This work is licensed under a Creative Commons Attribution 4.0 International License , which permits unrestricted use, distribution, and reproduction in any medium, provided the original work is properly cited.
 Downloads
 Citation Tools