
 Submit a Paper
 Propose a Special lssue
 Open Access
ARTICLE

A Model for Predicting the Erosion Rate Induced by the Use of a Selective Catalytic Reduction Denitrification Technology in Cement Kilns Flue Gas
1 School of Civil Engineering and Architecture, Anhui University of Technology, Ma’anshan, 243032, China
2 School of Energy and Environment, Anhui University of Technology, Ma’anshan, 243002, China
3 Anhui Weida Environment Protection Science & Technology Co., Ltd., Hefei, 230041, China
* Corresponding Author: Fuping Qian. Email:
Fluid Dynamics & Materials Processing 2023, 19(8), 1997-2011. https://doi.org/10.32604/fdmp.2023.026373
Received 01 September 2022; Accepted 30 January 2023; Issue published 04 April 2023
 View Full Text
 Download PDF
Abstract
Selective catalytic reduction (SCR) is a technology by which nitrogen oxides are converted with the aid of a catalyst into diatomic nitrogen and water. It is known that the catalyst can be easily eroded if a cement kiln with a high-dust content is considered. To understand this process, numerical simulations have been carried out considering a single catalyst channel in order to study the collision and erosion of fly ash and catalysts at meso scale. Based on a response surface methodology, the effects of five factors on the erosion rate have been studied, namely, the catalyst particle velocity, the particle size, the particle concentration, the incidence angle and the catalyst porosity. The results show that the influence of particle velocity, particle size and particle concentration is statistically significant and the particle size and incidence angle have a significant effect on the erosion rate. A quadratic polynomial prediction model for the erosion rate of honeycomb catalysts in cement kiln SCR reactors is finally proposed to support the future optimization of these systems.Graphic Abstract
Keywords
With the rapid development of the cement industry, cement kiln tail pollutant emissions have become an important sources of nitrogen oxide (NOx) emissions [1,2]. NOx is one of the main substances causing haze weather, which seriously endangers the atmospheric environment and human health. Achieving low NOx emissions from the cement industry is one of the main strategies for air pollution control.
Selective catalytic reduction (SCR) denitrification technology is widely used for its high denitrification efficiency, stable and reliable operation [3]. SCR is also gradually becoming the mainstream denitrification technology in the European cement industry. The existing SCR denitrification process for cement kiln is mainly arranged with high dust [4]. The general technical route is to set SCR reactor at the outlet of the first-stage preheater of the cement kiln to meet the optimal reaction temperature window of the existing commercial vanadium tungsten-titanium catalysts, with the flue gas temperature of approximately 280°C–350°C and the dust concentration of approximately 80–100 g/Nm3 [5]. However, the high dust concentration and small particle size in the flue gas at the outlet of the primary preheater under the high-temperature arrangement process in actual operation can easily cause the blockage and erosion of the catalyst, shorten the catalyst life and threaten the performance of the SCR system [6,7].
Current research on honeycomb catalyst erosion is mainly focused on SCR system in coal-fired power stations. In laboratory-scale studies, catalyst samples are exposed to particle erosion environments, and erosion is evaluated in terms of material mass loss [8]. Nandakishora et al. [9] investigated the erosion of catalysts using speciated quartz powder (SiO2) to simulate fly ash, continuously changing the fly ash impact angle, and found that the erosion rate of catalysts increased with the fly ash impact angle. Parsi et al. [10] found that the impact angle, hardness, concentration, velocity and strength of the material of the particles all had an effect on the erosion rate of plastic materials. However, due to the differences between laboratory and field conditions, the erosion degree of a individual catalyst sample cannot represent the erosion of the entire catalyst layer. Therefore, it is necessary to simulate the operating environment of the catalyst based on cement kiln flue gas characteristics to establish an erosion model that represents the real SCR geometry.
Computational fluid dynamics (CFD) simulation is widely used in the design and optimization of SCR systems in coal-fired power plants. The catalyst layer consists of thousands of catalyst units, dividing the reactor into countless gas channels. The mesh in the CFD model must be detailed enough to exceed the computational power of current computers and must therefore be simplified. Researchers [11] often used the porous media model to simplify the internal region of the catalyst layer. Xu et al. [12] established a 3D CFD model of SCR reactor to analyze catalyst failure but did not report quantitative results on erosion rates. An et al. [13] used numerical simulation method to optimize the arrangement of guiding plate for a certain SCR system to improve the localized catalyst erosion problem. Yu et al. [14] performed CFD analysis of the wear at the inlet of single-layer catalyst in a coal-fired power plant and obtained the magnitude of wear in different areas of the catalyst. However, the porous media model can only include viscous and inertial loss terms in the momentum equation, which cannot accurately represent the complex structure of the inner catalytic layer. Therefore, it is difficult to describe the collision process between the ash particles and the real catalyst wall, which increases the difficulty of catalyst erosion modeling. Moreover, the above studies was only for a specific SCR system and is not representative for other models.
Considering the problem that few existing research have been applied to SCR denitrification system in cement kiln, based on the characteristics of the large fly ash concentration and small particle size in cement kilns, we studied the SCR denitrification catalyst in cement kiln by CFD simulation and response surface methodology (RSM). We simulated the collision and erosion between particles and catalysts under meso scale and investigated the effects of particle velocity, particle size, particle concentration, incidence angle, catalyst porosity on catalyst erosion rate to give a quadratic polynomial prediction model for the erosion rate of honeycomb catalyst in a cement kiln SCR denitrification reactor.
ANSYS®-FLUENT 19.0 software was used to simulate the honeycomb SCR denitrification catalyst model based on the actual structure of the catalyst to restore the real honeycomb square shape, as shown in Fig. 1. The model length was 100 mm. The model had an entrance section and exit section, both being 5 mm long, which were set on the top and the bottom of the catalyst section, respectively.
Figure 1: Geometric model of a single-channel honeycomb SCR catalyst
2.2 Numerical Calculation Model
The simulation was based on the Euler-Lagrange method with pressure-based solver for numerical calculations. The flue gas flow in the catalyst channel is a three-dimensional turbulent flow with large Reynolds number, so the standard k-ε model is widely used for its strong applicability and high calculation accuracy [14]. The temperature condition for catalyst wear is normal temperature, ignoring the compressibility of the fluid. In the rectangular coordinate system, the basic differential control equations are:
where, ρ is the density of the fluid, kg/m3; t is the time of flow, s; u is the fluid velocity, m/s;
where, the turbulent kinematic viscosity reads:
Turbulent kinetic energy kf and turbulent dissipation rate ε formulas are:
where, Gk is the turbulent kinetic energy caused by the average velocity gradient; σk and σε are the Prandt numbers of the turbulent kinetic energy kf and the turbulent diffusivity ε, respectively; Sk and Ss are user-defined source terms. The constants values C1ε = 1.44, C2ε = 1.92, σk = 1.0, σε = 1.3.
2.2.2 Particle Motion Equation
In this work, dust particles are dispersed phase. The Lagrangian trajectory model was used to calculate the particle trajectory, ignoring the collision between particles and the rotation of particles themselves. The particle motion equation is:
where, up, uf are particle velocity and fluid velocity, respectively; FD is the drag force of fluid; g is the acceleration of gravity; ρp is the density of particles; Fother is the other force acting on the particle.
2.2.3 Interaction Force between Fluid and Particle
In the two-phase flow process, the drag force and the particle’s own gravity account for a large role, while other forces have little effect and can be neglected in the calculation process. The expression for the drag force is:
where, CD is the drag coefficient; Rep is the solid Reynolds number; μf is the dynamic viscosity, and a1, a2, and a3 are constants.
2.2.4 Wall Erosion and Rebound Model
The results of Pereira et al. [15] showed that when different erosion equations combined with different wall bounce models are used to simulate erosion, the simulated values agreed better with the experimental values when the erosion equations proposed by Oka et al. [16] combined with the Grant et al. [17] bounce model is used for the erosion calculations. The catalyst erosion model, based on the framework provided by Oka et al., is a general erosion model applicable to any impact condition and any type of material. The formula is as follows:
(1) Oka erosion equation
where, ρw is the density of the wall material, HV is the Vickers number, dp and u are the particle diameter and the impact velocity, d′p and u′ are the reference particle size and reference velocity, respectively, f(α) is the ratio of erosion damage at arbitrary angles, k0, k1, k2, k3 are constant and exponents, respectively.
(2) Grant and Tabakoff wall bounce model
where, et is the tangential velocity recovery coefficient; en is the normal velocity recovery coefficient; α is the fly ash impact angle.
The SIMPLE algorithm is used to solve the gas-solid two-phase flow field, taking full account of the coupling effect between the gas-solid phases, and the first-order upwind scheme is used for pressure interpolation. In the numerical simulation of catalyst wear, the whole calculation process is divided into two steps to ensure the accuracy and reliability of numerical simulation: (1) Under the steady state condition, the gas phase flow field is first calculated and solved, and the residual condition is set as 10−5; (2) Under the condition of convergence of the calculation results in the first step, the DPM model is added to the steady state field to conduct the coupling calculation between gas and solid phases until the statistical average values of the parameters of gas phase and particle phase reach stability. At this time, it is considered that the two-phase solution process has converged.
2.3 Grid Independence Verification
To eliminate the influence of grid number on the accuracy of numerical calculation, the grid independence of the geometric model was verified, and the maximum erosion rate values were calculated for each model under different grid numbers as shown in Fig. 2, where the porosity φ is defined as the ratio of the volume of channels within the catalyst to the total volume of the catalyst. The maximum erosion rate of the catalyst decreases as the number of grids increases and eventually remains constant for a range of grid numbers. In this work, 800,000, 1,000,000, 1,100,000 and 1,200,000 grids were selected for the calculation of four catalysts with porosity φ = 0.672, 0.747, 0.794 and 0.826, respectively.
Figure 2: Grid-dependent validation of catalysts with different porosity
2.4 Verification of Numerical Calculation Model
To verify the validity of the numerical simulation, we compared the simulation results with the experimental data from literature [18]. Fig. 3 shows that the error of the two results is basically within 15%, which proves the validity of the mathematical model. The error may be due to the fact that the erosion material used in the simulation is quartz, while the experimental material is a mixture of three abrasives with differences in material density and hardness.
Figure 3: Comparison of experimental and simulated values of maximum erosion rate
3.1 Response Surface Methodology and Analysis of Variance (ANOVA)
Response surface methodology (RSM), a statistical experimental design used for optimization, was used to evaluate the impact factors and their interactions by modeling a continuous variable surface. We choose the quadratic response surface equation considering of all primary, secondary, and interaction terms. The response surface equation can be expressed as [19]:
where, Y is the objective function or response; Xi is the independent variable; βi, βii, βij represent the regression coefficients of the primary, secondary, and interaction terms, respectively; m is the number of influencing factors; e is the error, with two sources of error, namely, experimental error and under-fitting error.
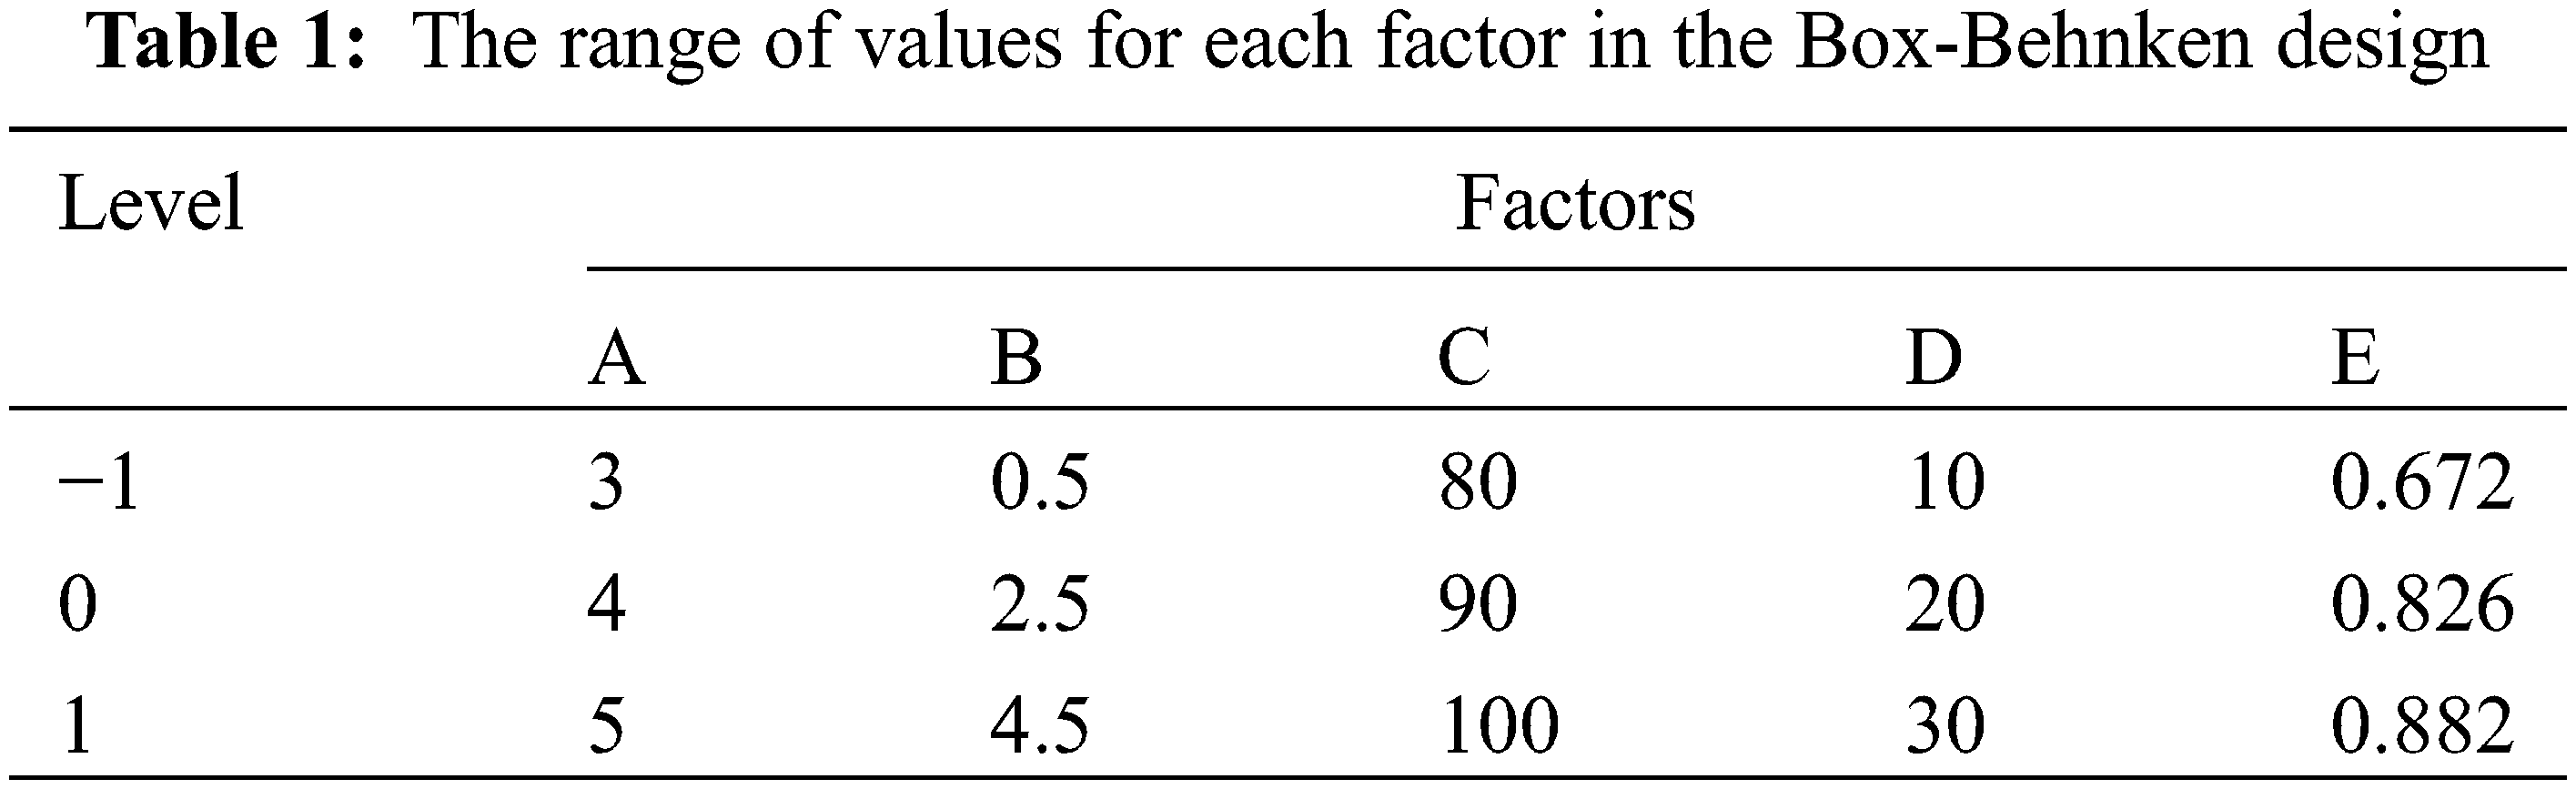
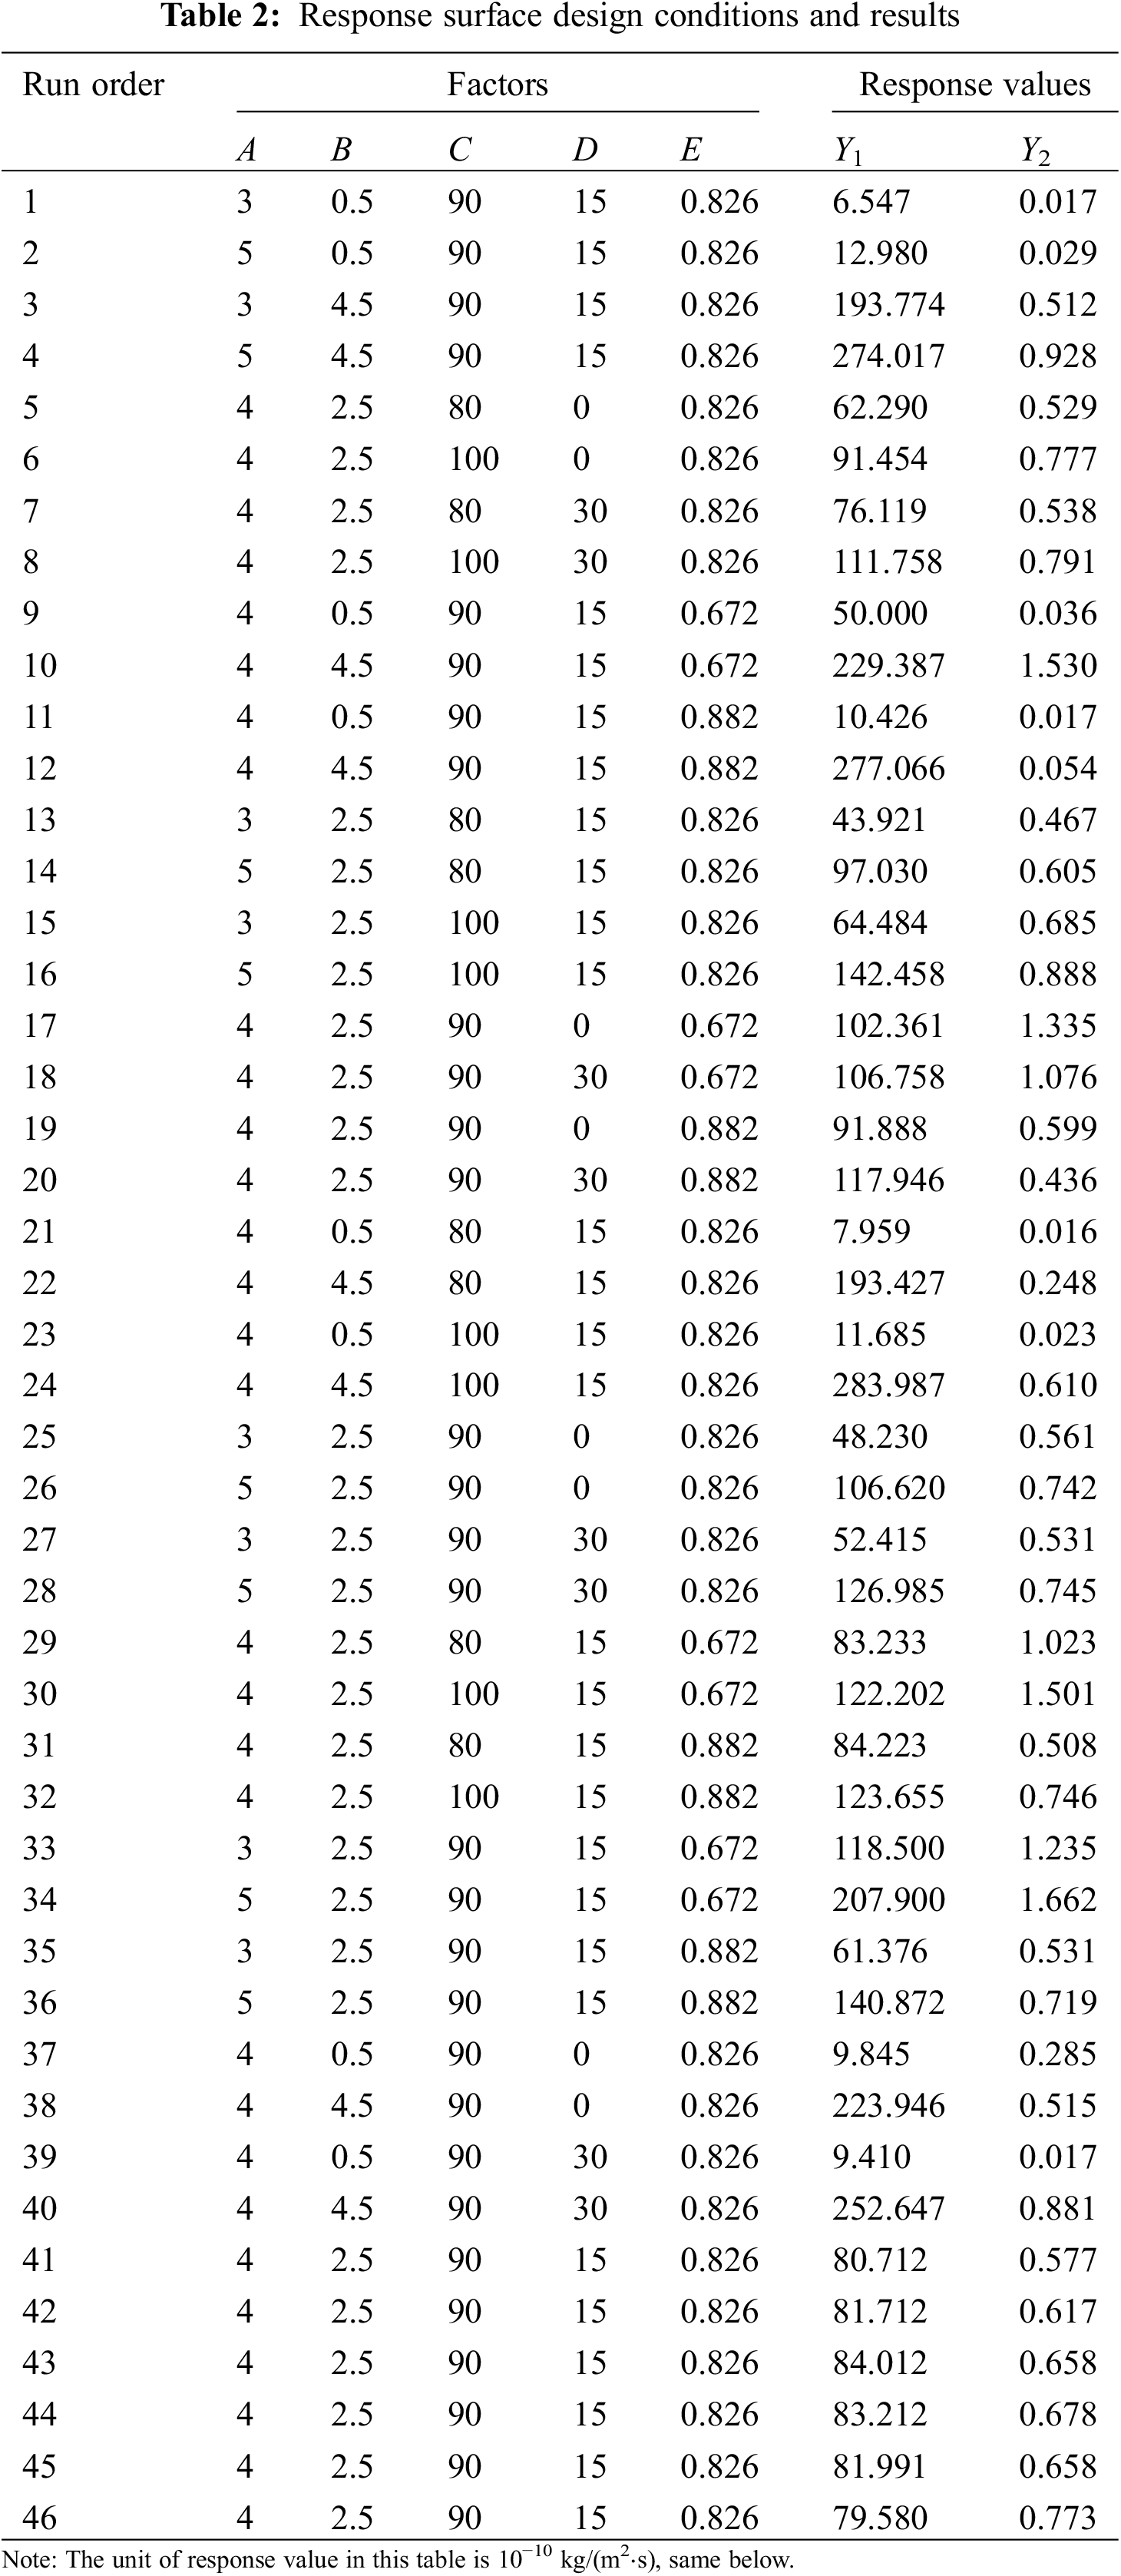
The Box-Behnken response surface design is a design method that finds optimal conditions among multiple factors, using fewer design solutions to obtain and analyze a data set [20]. In this paper, the Box-Behnken design was used to evaluate the significance of five variables influencing the erosion rate of the cement kiln honeycomb catalyst, including particle velocity A, particle size B, particle concentration C, incident angle D, and catalyst porosity E. The design included 40 different combinations of independent variables and 6 groups of central point combinations for a total of 46 combinations, coded 1–46, with variance tests between high (+) and low (−) levels. The response values coded as the upper end wall erosion rate Y1 and the channel wall erosion rate Y2. Before the experiment, the lowest and highest levels of each variable were selected based on actual engineering conditions [21–23]. The rows and columns in Table 1 represent the experimental combinations and independent variables, respectively.
3.1.2 Test Results and Analysis of Variance
The results from the experimental design for each response are given in Table 2, and the analysis of variance (ANOVA) is given in Table 3.
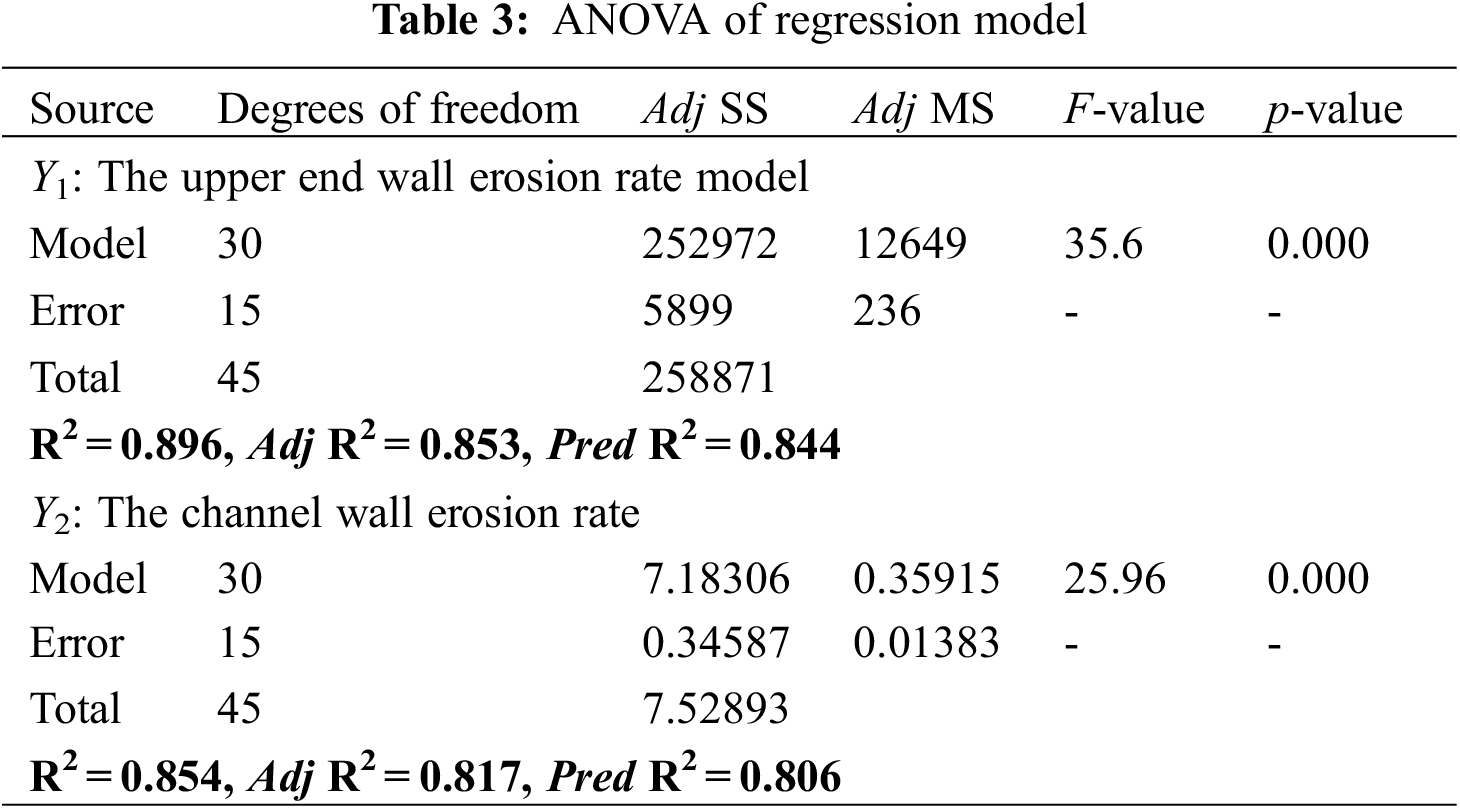
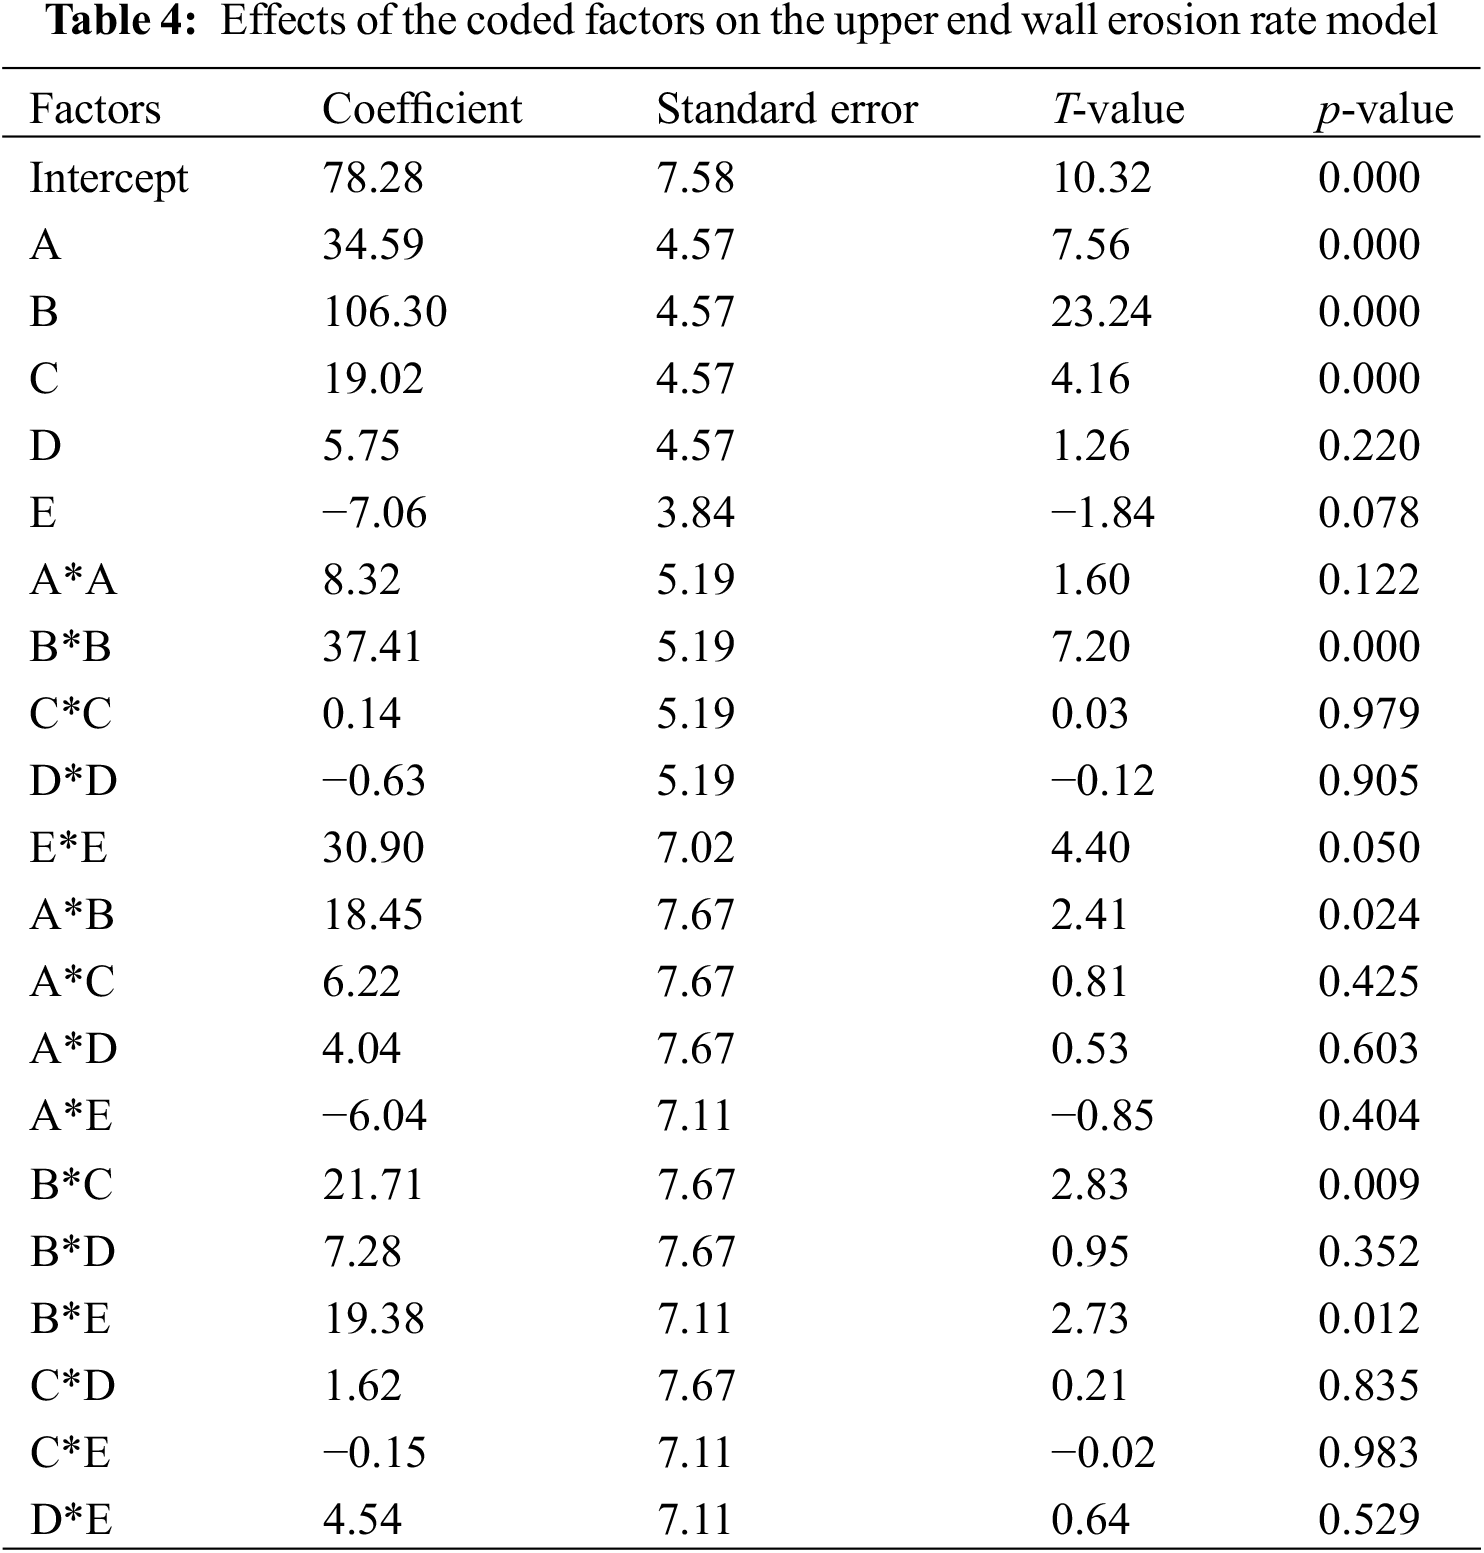
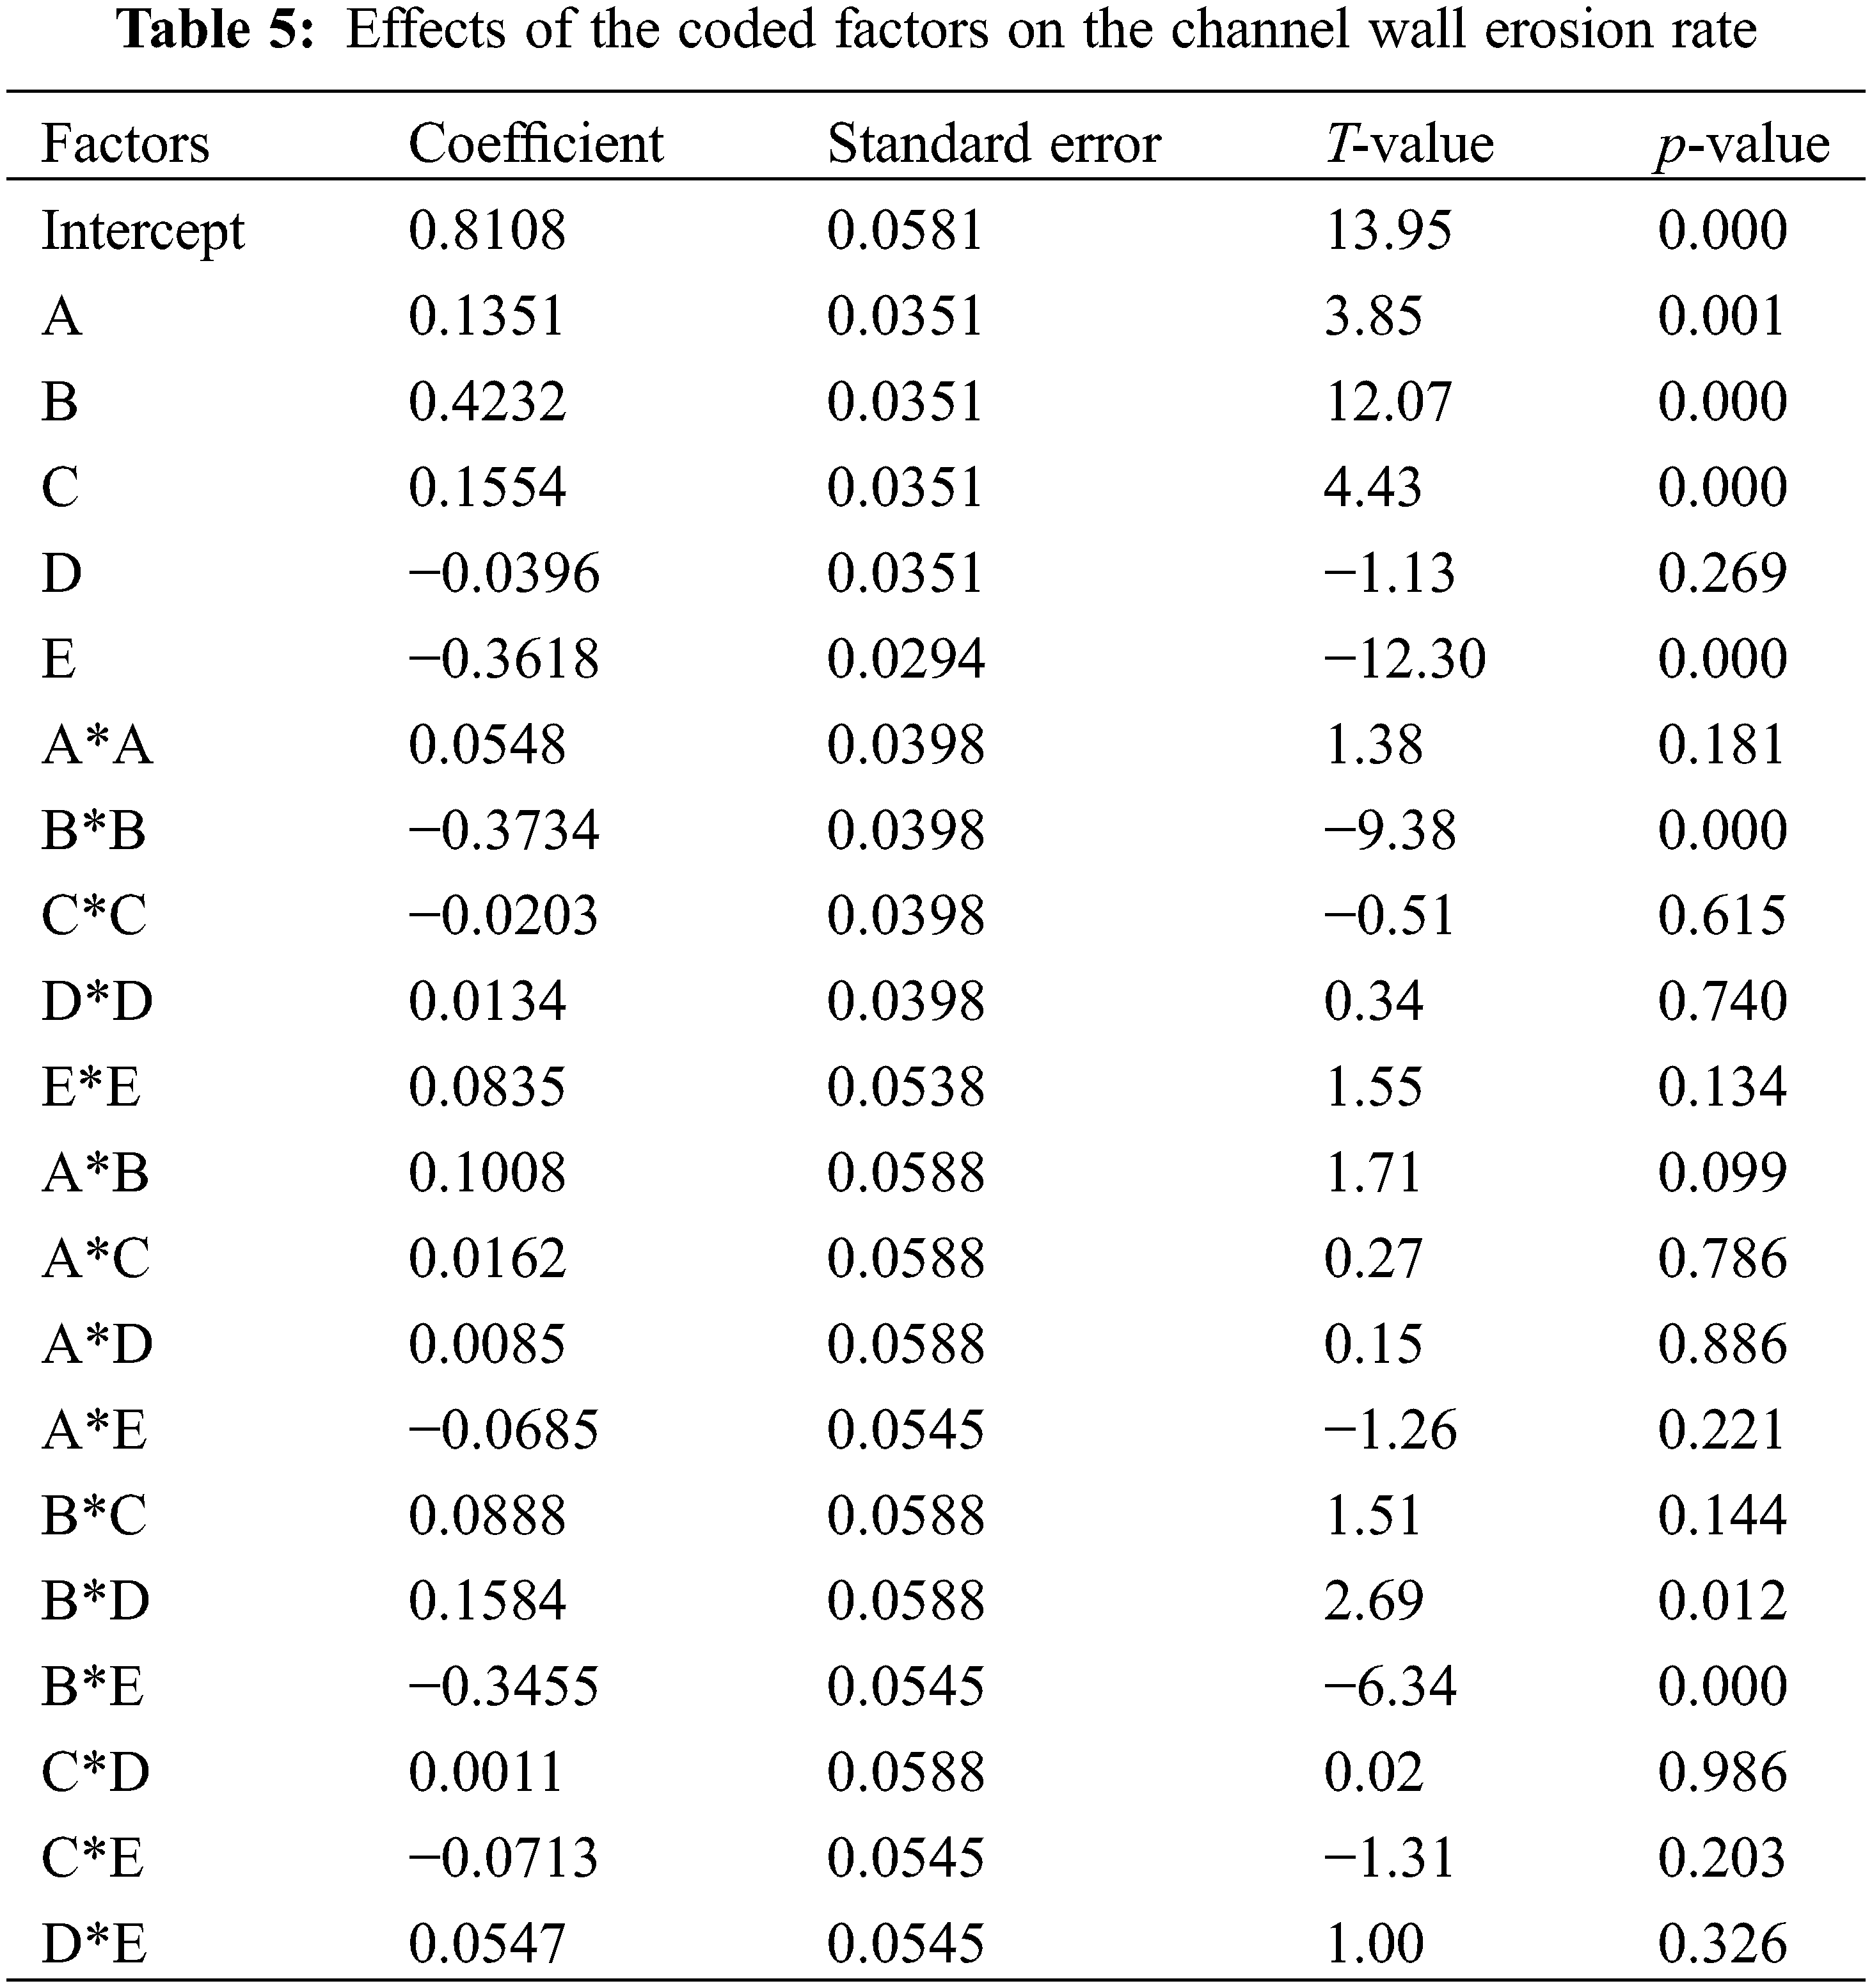
Regression analysis of the experimental design and data was carried out using Design Expert (8.0) software. Both Pred R2 and Adj R2 of this model are close to 1, with good fits and high feasibility, so the model could fully reflect the relationship between each factors and the response values. Eqs. (10) and (11) are the quadratic polynomial regression model equations between independent factors and coded unit responses, and the effects of coding factors are examined in Tables 4 and 5, where the p-value > 0.05, it means that the degree of influence of the coefficient is not within the 95% confidence interval and is considered to be insignificant.
3.1.3 Response Surface Interaction Analysis
Fig. 4 shows the response surface of the honeycomb catalyst erosion rate in a cement kiln SCR denitrification reactor under various factors. The response surface of erosion rate can be visualized as a function of two elements of the upper end wall and the channel wall erosion rate model. As shown in Figs. 4a and 4b, for a constant particle concentration, the erosion rate increases with the particle velocity and the particle size. The relationship between erosion rate and particle velocity is consistent with the research results from literature [18]. Variations in particle velocity have a smaller effect on the erosion rate when the particle size is small and a larger effect on the erosion rate when the particle size is large. As shown in Figs. 4c and 4d, for constant particle size, the erosion rate increases with the increase of the particle velocity. When the particle concentration is low, the variation in particle velocity affects the erosion rate to a lesser extent, and when the particle concentration is high, the variation in particle velocity affects the erosion rate to a greater extent. The results from the literature [24] are consistent with the trend of the results of this study. As shown in Figs. 4e and 4f, when the particle velocity is constant, the erosion rate increases with the increase of particle size and particle concentration. When the particle size is small, the change in particle concentration has a smaller degree of influence on the erosion rate, and when the particle size is large, the change in particle concentration has a greater degree of influence on the erosion rate. The relationship between erosion rate and particle size is consistent with the results from the literature [25].
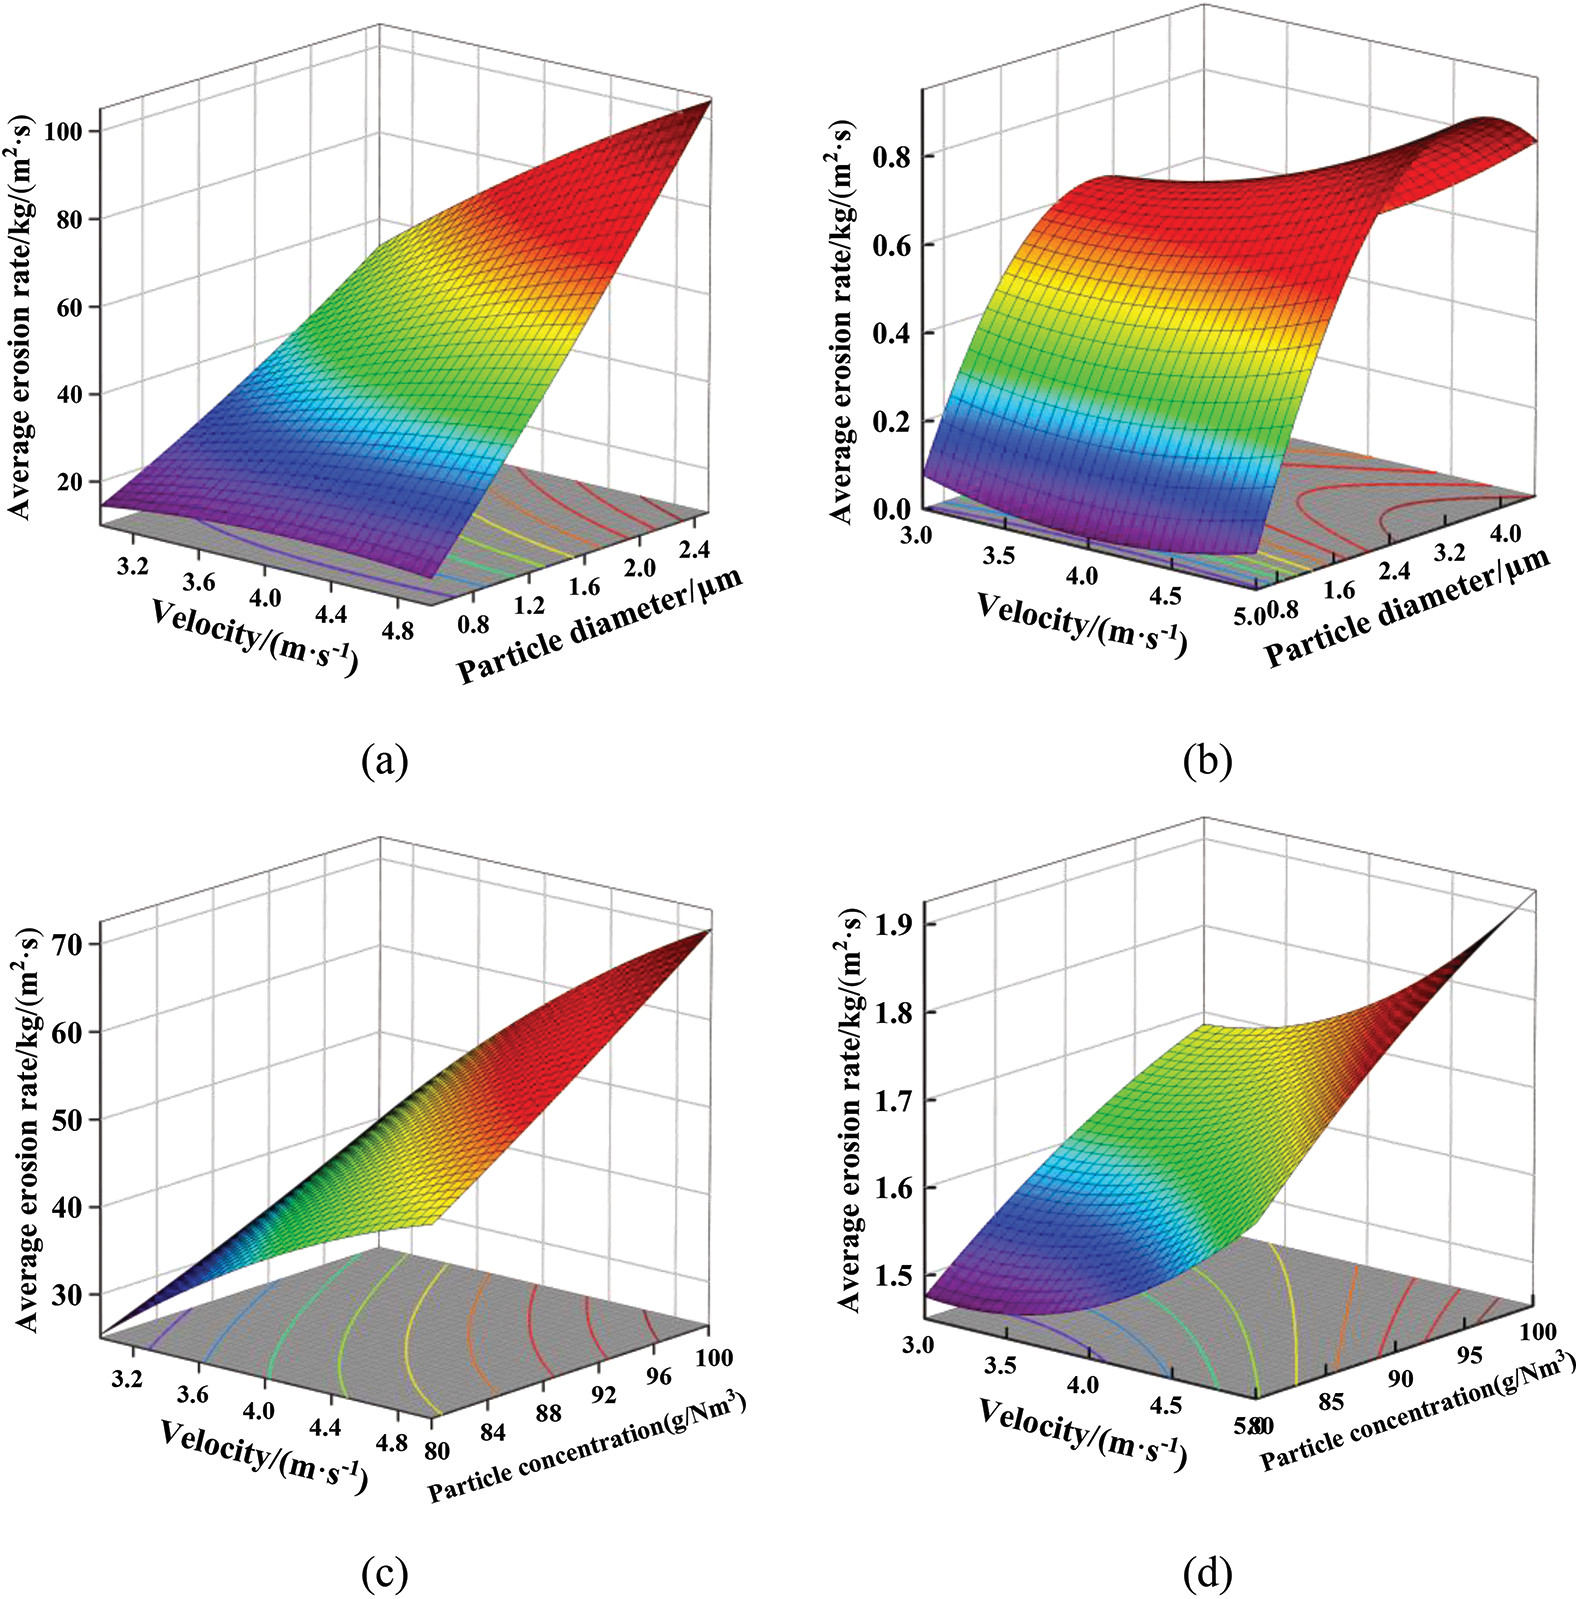
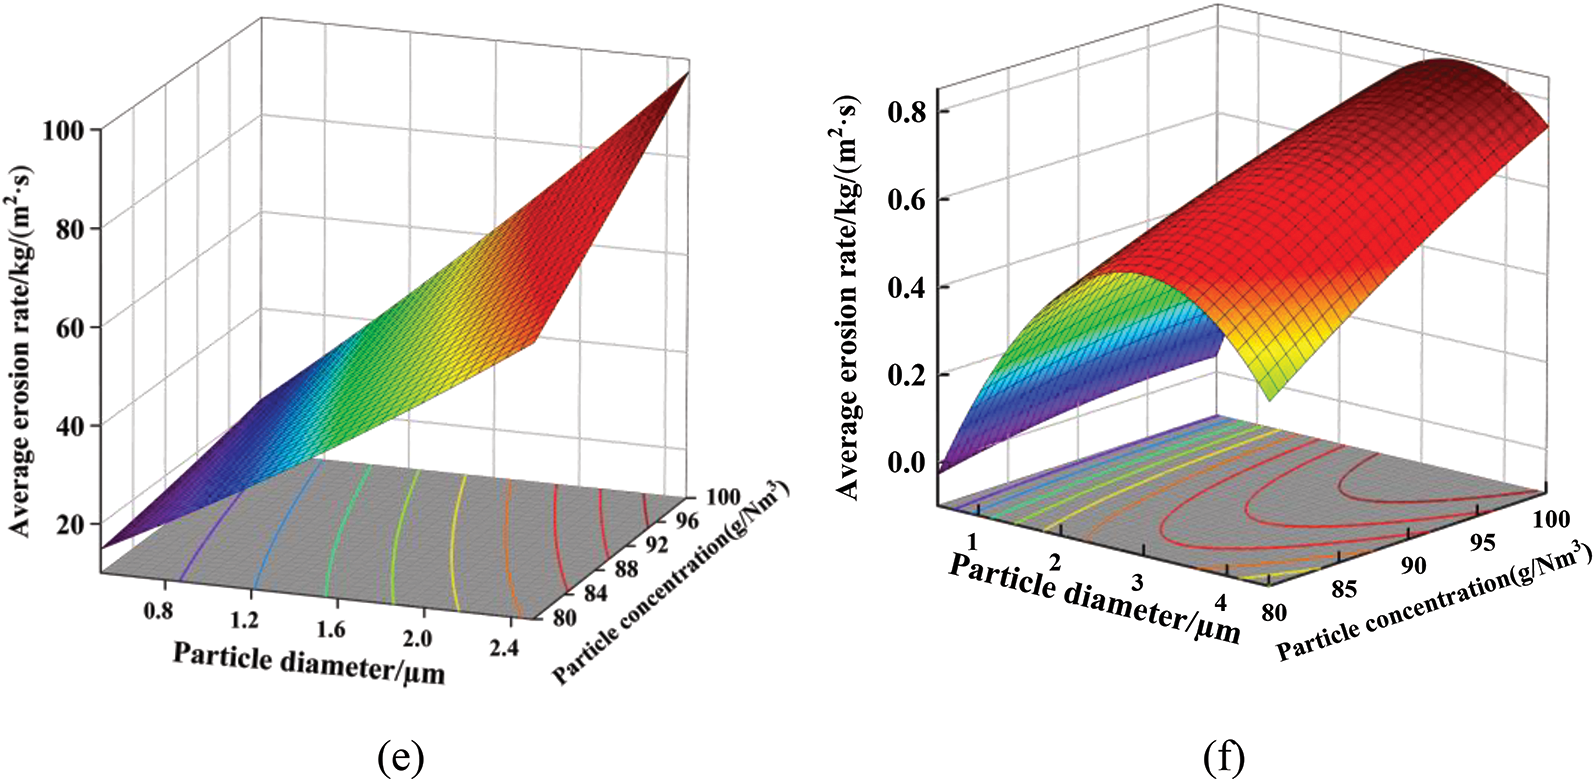
Figure 4: Response surface of catalyst erosion rate under the interaction of different factors
As shown in Fig. 5, the erosion rate of both the upper end face and the channel wall increase with the particle velocity under the same conditions, and the erosion rate of upper end face was much greater than that of channel wall, so the significance of each factor of the upper end face could be considered as the main factor. After removing insignificant factors or other interactions, the three main factors including particle velocity A, particle size B, and particle concentration C were comprehensively selected as important parameters for further optimization.
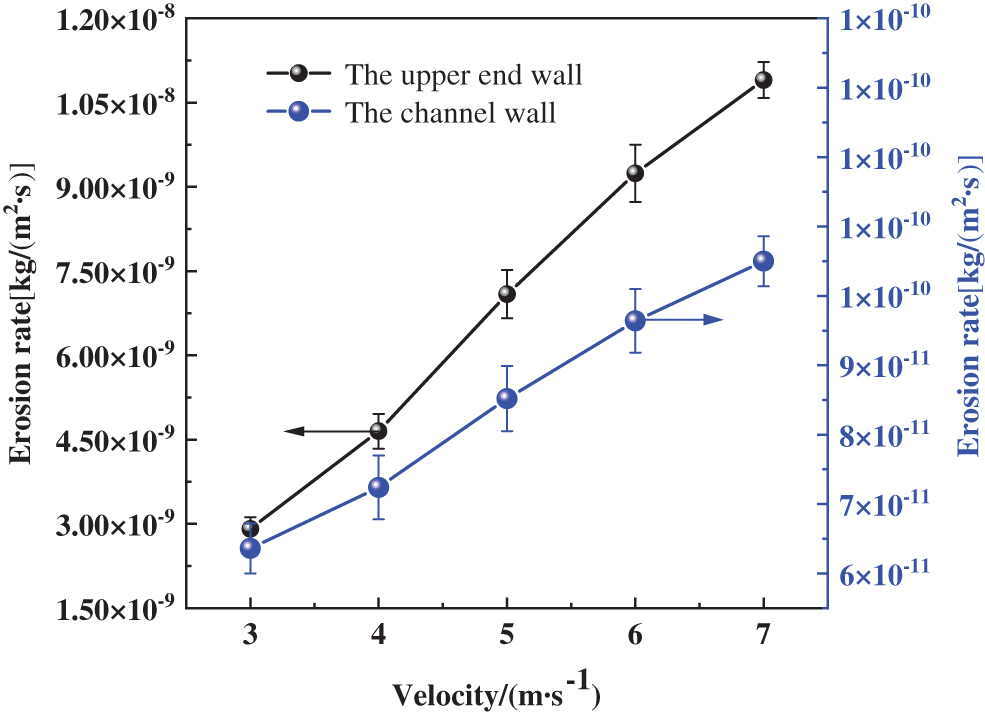
Figure 5: Comparison of erosion rates of different parts
3.2 Evolution of the Response Surface Model
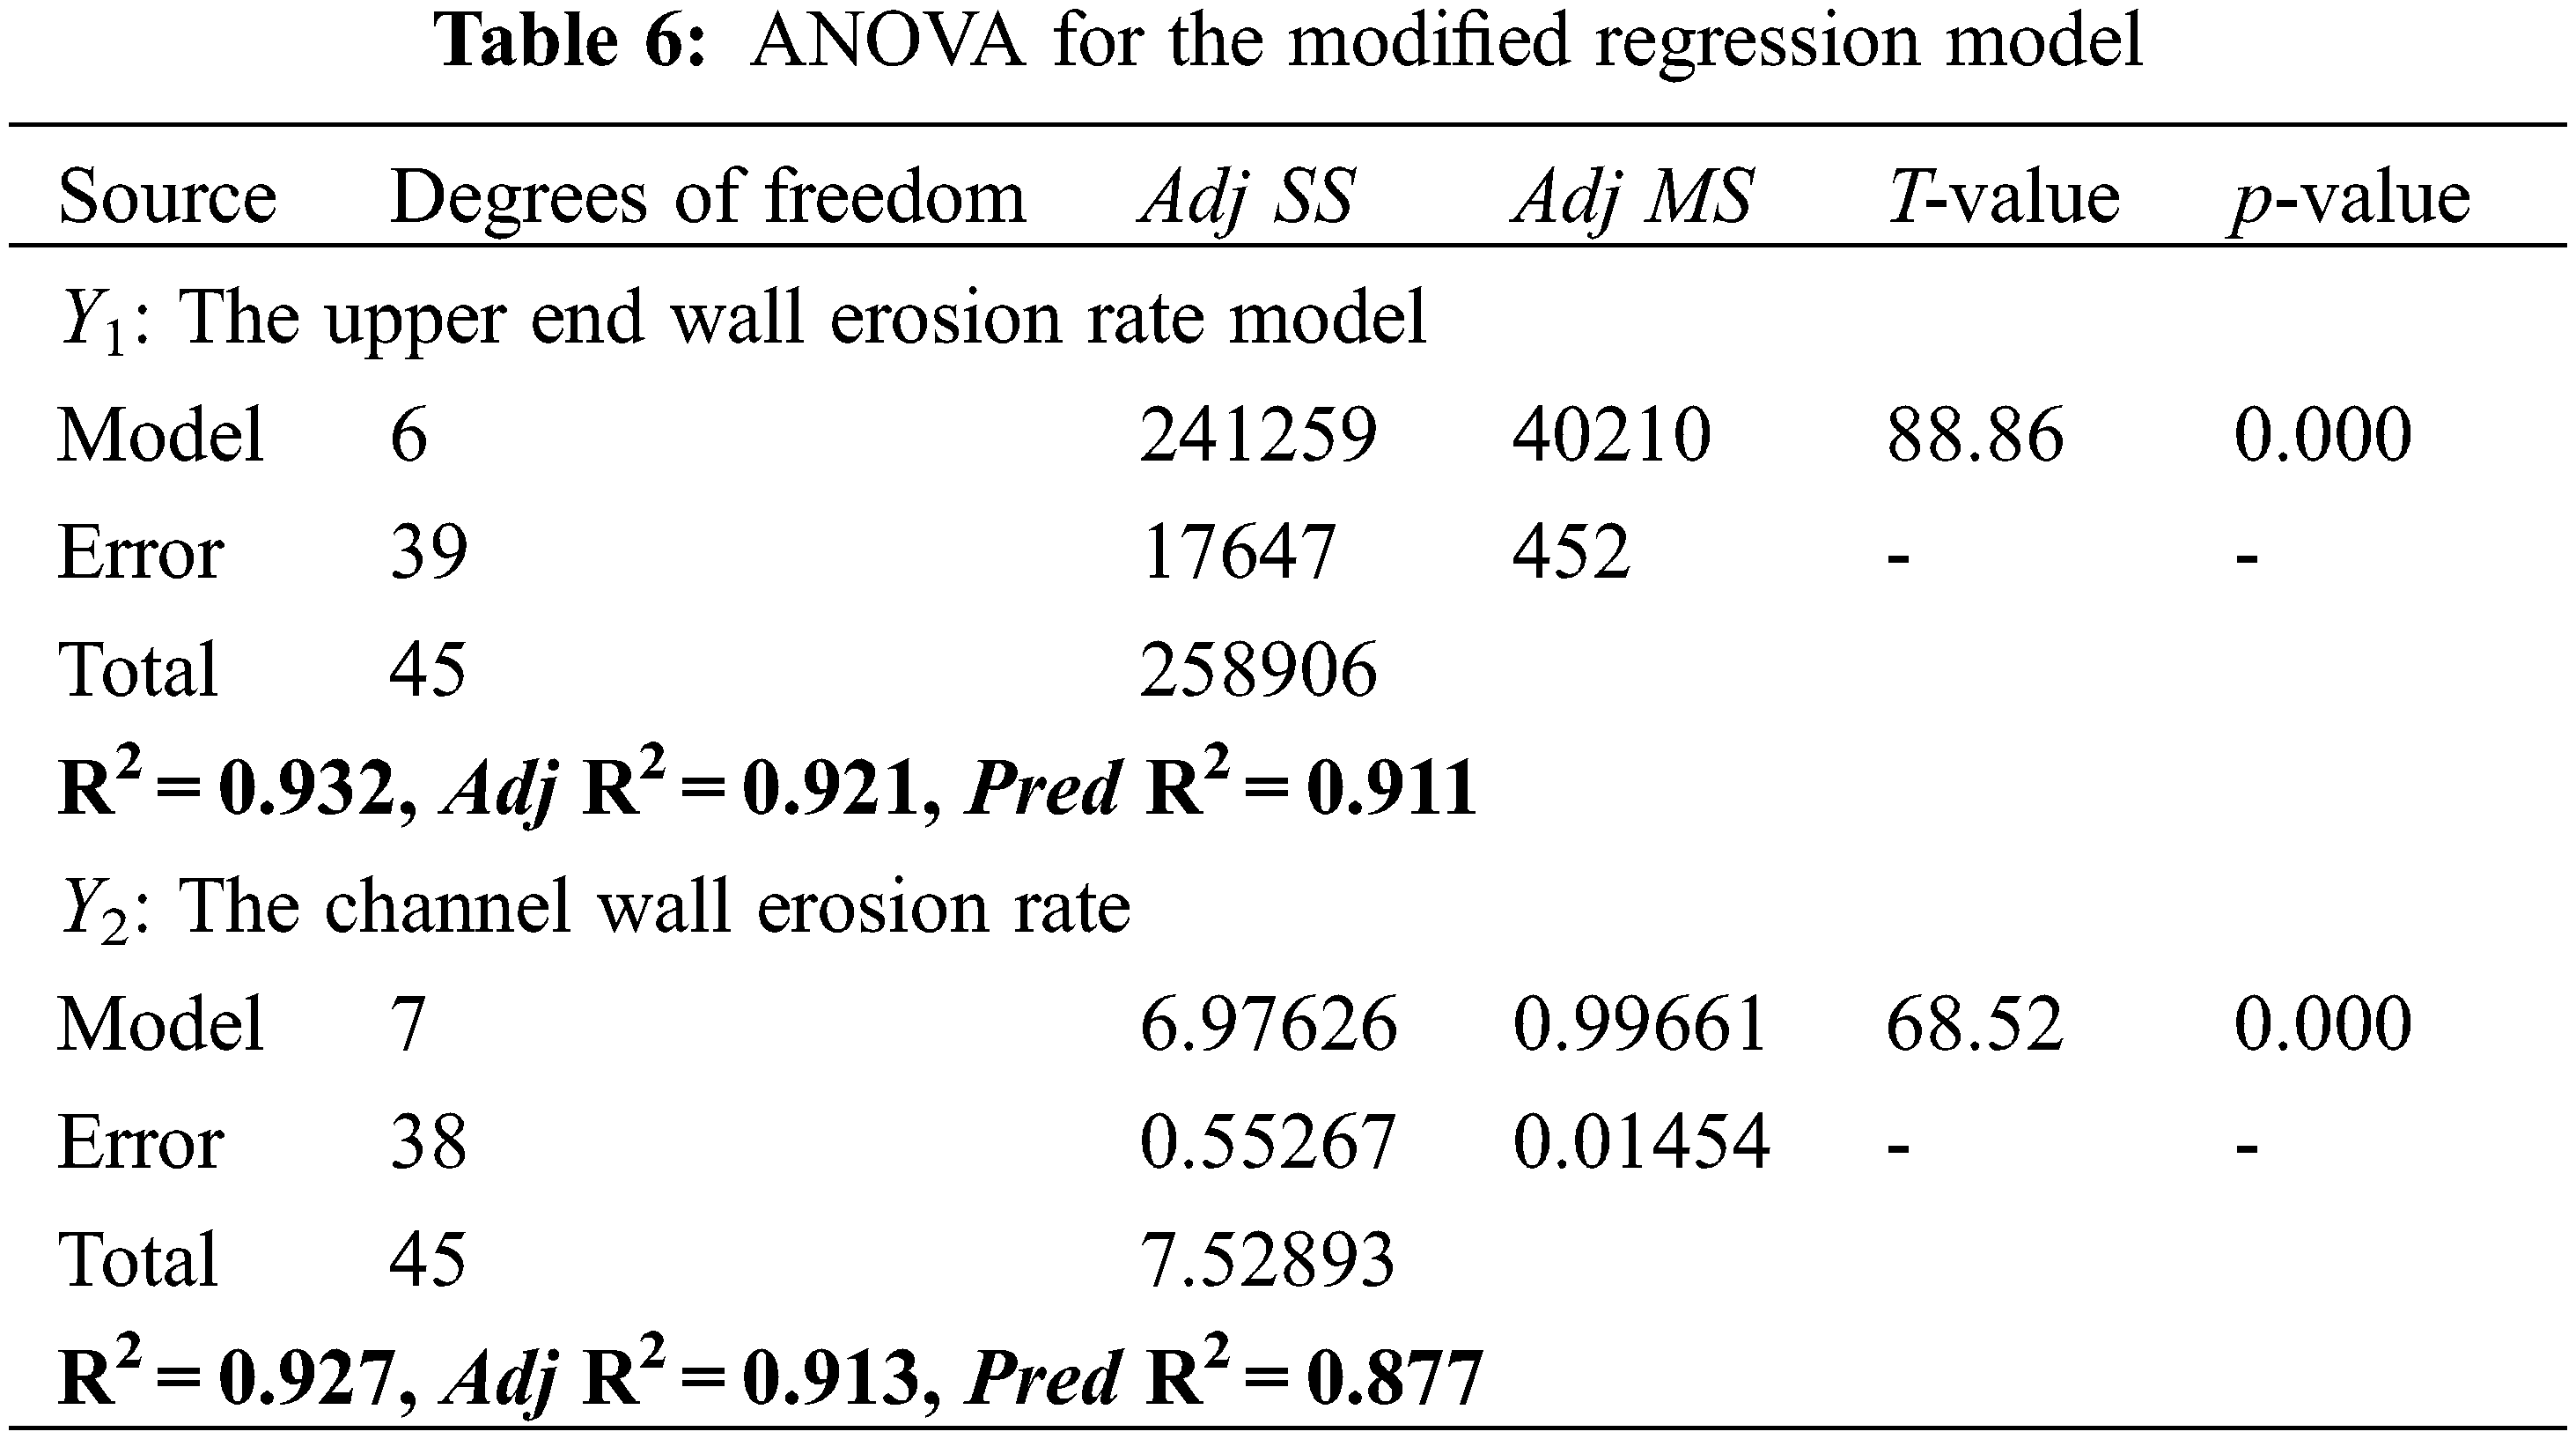
Since some factors in the model can be ignored, such as 7 of the 20 model terms in Eq. (12) are regarded as significant. Therefore, only these 7 terms are retained to construct the new evolutionary model, as described in Eq. (14) for the upper end wall erosion rate model and Eq. (15) for the channel wall erosion rate model.
To evaluate the performance of the new model, an ANOVA was performed on the original data using the Eqs. (14) and (15). The results of the ANOVA for the modified regression model are given in Table 6. The results show that the significance of each factors on the objective function is greatly improved. The determination coefficients R2 for the upper end wall model and the channel wall model were 0.932 and 0.927, respectively.
The erosion of different parts of the SCR denitrification catalyst in cement kilns was investigated using response surface methodology (RSM). The influence of particle parameters and catalyst structure parameters on the catalyst erosion rate were comprehensively investigated. The following can be concluded:
1. Numerical simulations in this study show good agreement between the erosion rate and experimental data under the meso scale, and the deviation between the simulated and experimental erosion rate values was within acceptable limits, thus demonstrating that the numerical model used can accurately describe the erosion pattern of the SCR denitrification catalyst.
2. Each factor has a different mechanism for catalyst erosion, and the values for the end face erosion rate are much greater than those for all other areas. The particle velocity and particle size have the most significant effect on erosion at the end face and pore wall areas.
3. Particle velocity, particle size and particle concentration have the most significant effects on the catalyst erosion rate, and the interaction between particle size and angle of incidence has a significant effect on the model. The regression model was further optimized to fit a quadratic polynomial prediction model for the erosion rate, which can provide guidance and basis for practical engineering.
4. The proposition of considering the real catalyst structure and taking comprehensive consideration of multiple factors as an important index of optimization which had been both ignored in previous studies, contribute to a more practical and more reasonable structure optimization.
Acknowledgement: The authors would like to thank the editor and the anonymous reviewers for their insightful comments and helpful suggestions to improve the quality of this manuscript, which significantly enhanced the paper’s presentation.
Funding Statement: This work was supported by the Eco-Environment Project of the Key Research and Development Program of Anhui Province (No. 202104i07020016).
Conflicts of Interest: The authors declare that they have no conflicts of interest to report regarding the present study.
References
1. Hua, S. B., Tian, H. Z., Wang, K., Zhu, C. Y., Gao, J. J. et al. (2016). Atmospheric emission inventory of hazardous air pollutants from China’s cement plants: Temporal trends, spatial variation characteristics and scenario projections. Atmospheric Environment, 128, 1–9. https://doi.org/10.1016/j.atmosenv.2015.12.056 [Google Scholar] [CrossRef]
2. Cai, J., Wu, H., Ren, Q., Lin, L., Zhou, T. et al. (2020). Innovative NOx reduction from cement kiln and pilot-scale experimental verification. Fuel Processing Technology, 199, 106306. https://doi.org/10.1016/j.fuproc.2019.106306 [Google Scholar] [CrossRef]
3. Praveena, V., Martin, M. L. J. (2018). A review on various after treatment techniques to reduce NOx emissions in a CI engine. Journal of the Energy Institute, 91(5), 704–720. https://doi.org/10.1016/j.joei.2017.05.010 [Google Scholar] [CrossRef]
4. Neuffer, B., Laney, M. (2007). Alternative control techniques document update-NOx emissions from new cement kilns. United States Environmental Protection Agency, 1, 85–92. https://www3.epa.gov/ttn/catc/dir1/cement_updt_1107.pdf. [Google Scholar]
5. Shen, W., Liu, Y., Yan, B., Wang, J., He, P. et al. (2017). Cement industry of China: Driving force, environment impact and sustainable development. Renewable and Sustainable Energy Reviews, 75, 618–628. https://doi.org/10.1016/j.rser.2016.11.033 [Google Scholar] [CrossRef]
6. Benson, S. A., Laumb, J. D., Crocker, C. R., Pavlish, J. H. (2005). SCR catalyst performance in flue gases derived from subbituminous and lignite coals. Fuel Processing Technology, 86(5), 577–613. https://doi.org/10.1016/j.fuproc.2004.07.004 [Google Scholar] [CrossRef]
7. Strege, J. R., Zygarlicke, C. J., Folkedahl, B. C., McCollor, D. P. (2008). SCR deactivation in a full-scale cofired utility boiler. Fuel, 87(7), 1341–1347. https://doi.org/10.1016/j.fuel.2007.06.017 [Google Scholar] [CrossRef]
8. Gan, L., Lei, S., Yu, J., Ma, H., Yamamoto, Y. et al. (2015). Development of highly active coated monolith SCR catalyst with strong abrasion resistance for low-temperature application. Frontiers of Environmental Science & Engineering, 9(6), 979–987. https://doi.org/10.1007/s11783-015-0824-8 [Google Scholar] [CrossRef]
9. Nandakishora, Y., Siddaraju, C., Rajath, S., Thirupathi, G., Madhusoodana, C. D. (2018). Design of air jet erosion test setup to evaluate erosion profiles in selective catalytic reduction (SCR) honeycomb modules. Materials Today: Proceedings, 5(11), 24548–24557. https://doi.org/10.1016/j.matpr.2018.10.252 [Google Scholar] [CrossRef]
10. Parsi, M., Najmi, K., Najafifard, F., Hassani, S., McLaury, B. S. et al. (2014). A comprehensive review of solid particle erosion modeling for oil and gas wells and pipelines applications. Journal of Natural Gas Science and Engineering, 21, 850–873. https://doi.org/10.1016/j.jngse.2014.10.001 [Google Scholar] [CrossRef]
11. Bazmi, M., Hashemabadi, S. H., Bayat, M. (2011). Modification of ergun equation for application in trickle bed reactors randomly packed with trilobe particles using computational fluid dynamics technique. Korean Journal of Chemical Engineering, 28(6), 1340–1346. https://doi.org/10.1007/s11814-010-0525-8 [Google Scholar] [CrossRef]
12. Xu, Y., Zhang, Y., Liu, F., Shi, W., Yuan, J. (2014). CFD analysis on the catalyst layer breakage failure of an SCR-DeNOx system for a 350 MW coal-fired power plant. Computers & Chemical Engineering, 69, 119–127. https://doi.org/10.1016/j.compchemeng.2014.07.012 [Google Scholar] [CrossRef]
13. An, J., Luo, X. (2022). Numerical simulation of ash erosion in the selective catalytic reduction catalyst of power plant boiler. Energy Reports, 8, 1313–1321. https://doi.org/10.1016/j.egyr.2021.11.169 [Google Scholar] [CrossRef]
14. Yu, C., Si, F., Ren, S., Jiang, X. (2017). Experimental and numerical predictions of ash particle erosion in SCR monolithic catalysts for coal-fired utility boilers. The Korean Journal of Chemical Engineering, 34(5), 1563–1575. https://doi.org/10.1007/s11814-017-0001-9 [Google Scholar] [CrossRef]
15. Pereira, G. C., de Souza, F. J., de Moro Martins, D. A. (2014). Numerical prediction of the erosion due to the particles in elbows. Powder Technology, 261(7), 105–117. https://doi.org/10.1016/j.powtec.2014.04.033 [Google Scholar] [CrossRef]
16. Oka, Y. I., Mihara, S., Yoshida, T. (2009). Impact-angle dependence and estimation of erosion damage to ceramic materials caused by solid particle impact. Erosion, 267(1–4), 129–135. https://doi.org/10.1016/j.erosion.2008.12.091 [Google Scholar] [CrossRef]
17. Grant, G., Tabakoff, W. (1975). Erosion prediction in turbomachinery resulting from environmental solid particles. Journal of Aircraft, 12(5), 471–478. https://doi.org/10.2514/3.59826 [Google Scholar] [CrossRef]
18. Xu, X. L. (2015). Study of erosion on SCR honeycomb catalyst (Master Thesis). Zhejiang University, China. http://cdmd.cnki.com.cn/Article/CDMD-10335-1016052779.htm. [Google Scholar]
19. Zhu, X., Qian, F., Lu, J., Zhang, H. (2013). Numerical study of solid volume fraction and pressure drop of fibrous media by response surface method. Chemical Engineering and Technology, 36(5), 788–794. https://doi.org/10.1002/ceat.201200512 [Google Scholar] [CrossRef]
20. Khatib, I., Chow, M. Y., Ruan, J., Cipolla, D., Chan, H. (2021). Modeling of a spray drying method to produce ciprofloxacin nanocrystals inside the liposomes utilizing a response surface methodology: Box-Behnken experimental design. International Journal of Pharmaceutics, 597, 120277. https://doi.org/10.1016/j.ijpharm.2021.120277 [Google Scholar] [PubMed] [CrossRef]
21. Gupta, R. K., Majumdar, D., Trivedi, J. V., Bhanarkar, A. D. (2012). Particulate matter and elemental emissions from a cement kiln. Fuel Processing Technology, 104, 343–351. https://doi.org/10.1016/j.fuproc.2012.06.007 [Google Scholar] [CrossRef]
22. van Oss, H. G., Padovani, A. C. (2003). Cement manufacture and the environment part II: Environmental challenges and opportunities. Journal of Industrial Ecology, 7(1), 93–126. https://doi.org/10.1162/108819803766729212 [Google Scholar] [CrossRef]
23. Liu, H., Fang, J., Li, J. (2021). Pilot test of the low temperature SCR technology in cement plant. IOP Conference Series: Earth and Environmental Science, 651(4), 42001. https://doi.org/10.1088/1755-1315/651/4/042001 [Google Scholar] [CrossRef]
24. Yan, J. F., Zhao, X. B. (2019). Testing and numerical simulation on the abrasion of SCR catalysts. Electric Power, 52(5), 170–175 (in Chinese). 10.11930j.issn.1004-9649.201808099 [Google Scholar]
25. Zhang, Z. Y., Dong, Y. S., Si, F. Q., Jiang, X. M. (2020). Study on erosion characteristics of SCR system catalyst with fly ash. Journal of Engineering for Thermal Energy and Power, 35(4), 128–134 (in Chinese). https://doi.org/10.16146/j.cnki.rndlgc.2020.04.018 [Google Scholar] [CrossRef]
Cite This Article
 Copyright © 2023 The Author(s). Published by Tech Science Press.
This work is licensed under a Creative Commons Attribution 4.0 International License , which permits unrestricted use, distribution, and reproduction in any medium, provided the original work is properly cited.
 Downloads
 Citation Tools