
 Submit a Paper
 Propose a Special lssue
 Open Access
ARTICLE

Improving Crude Oil Flow Using Graphene Flakes under an Applied Electric Field
1 Environment Research Center, University of Technology-Iraq, Baghdad, Iraq
2 Chemical Engineering Department, University of Technology-Iraq, Baghdad, Iraq
3 Nanotechnology and Advanced Materials Research Center, University of Technology-Iraq, Baghdad, Iraq
4 Electromechanical Engineering Department, University of Technology-Iraq, Baghdad, Iraq
* Corresponding Author: Thaer Al-Jadir. Email:
(This article belongs to the Special Issue: Recent advancements in thermal fluid flow applications)
Fluid Dynamics & Materials Processing 2023, 19(8), 2067-2081. https://doi.org/10.32604/fdmp.2023.027156
Received 17 October 2022; Accepted 10 January 2023; Issue published 04 April 2023
 View Full Text
 Download PDF
Abstract
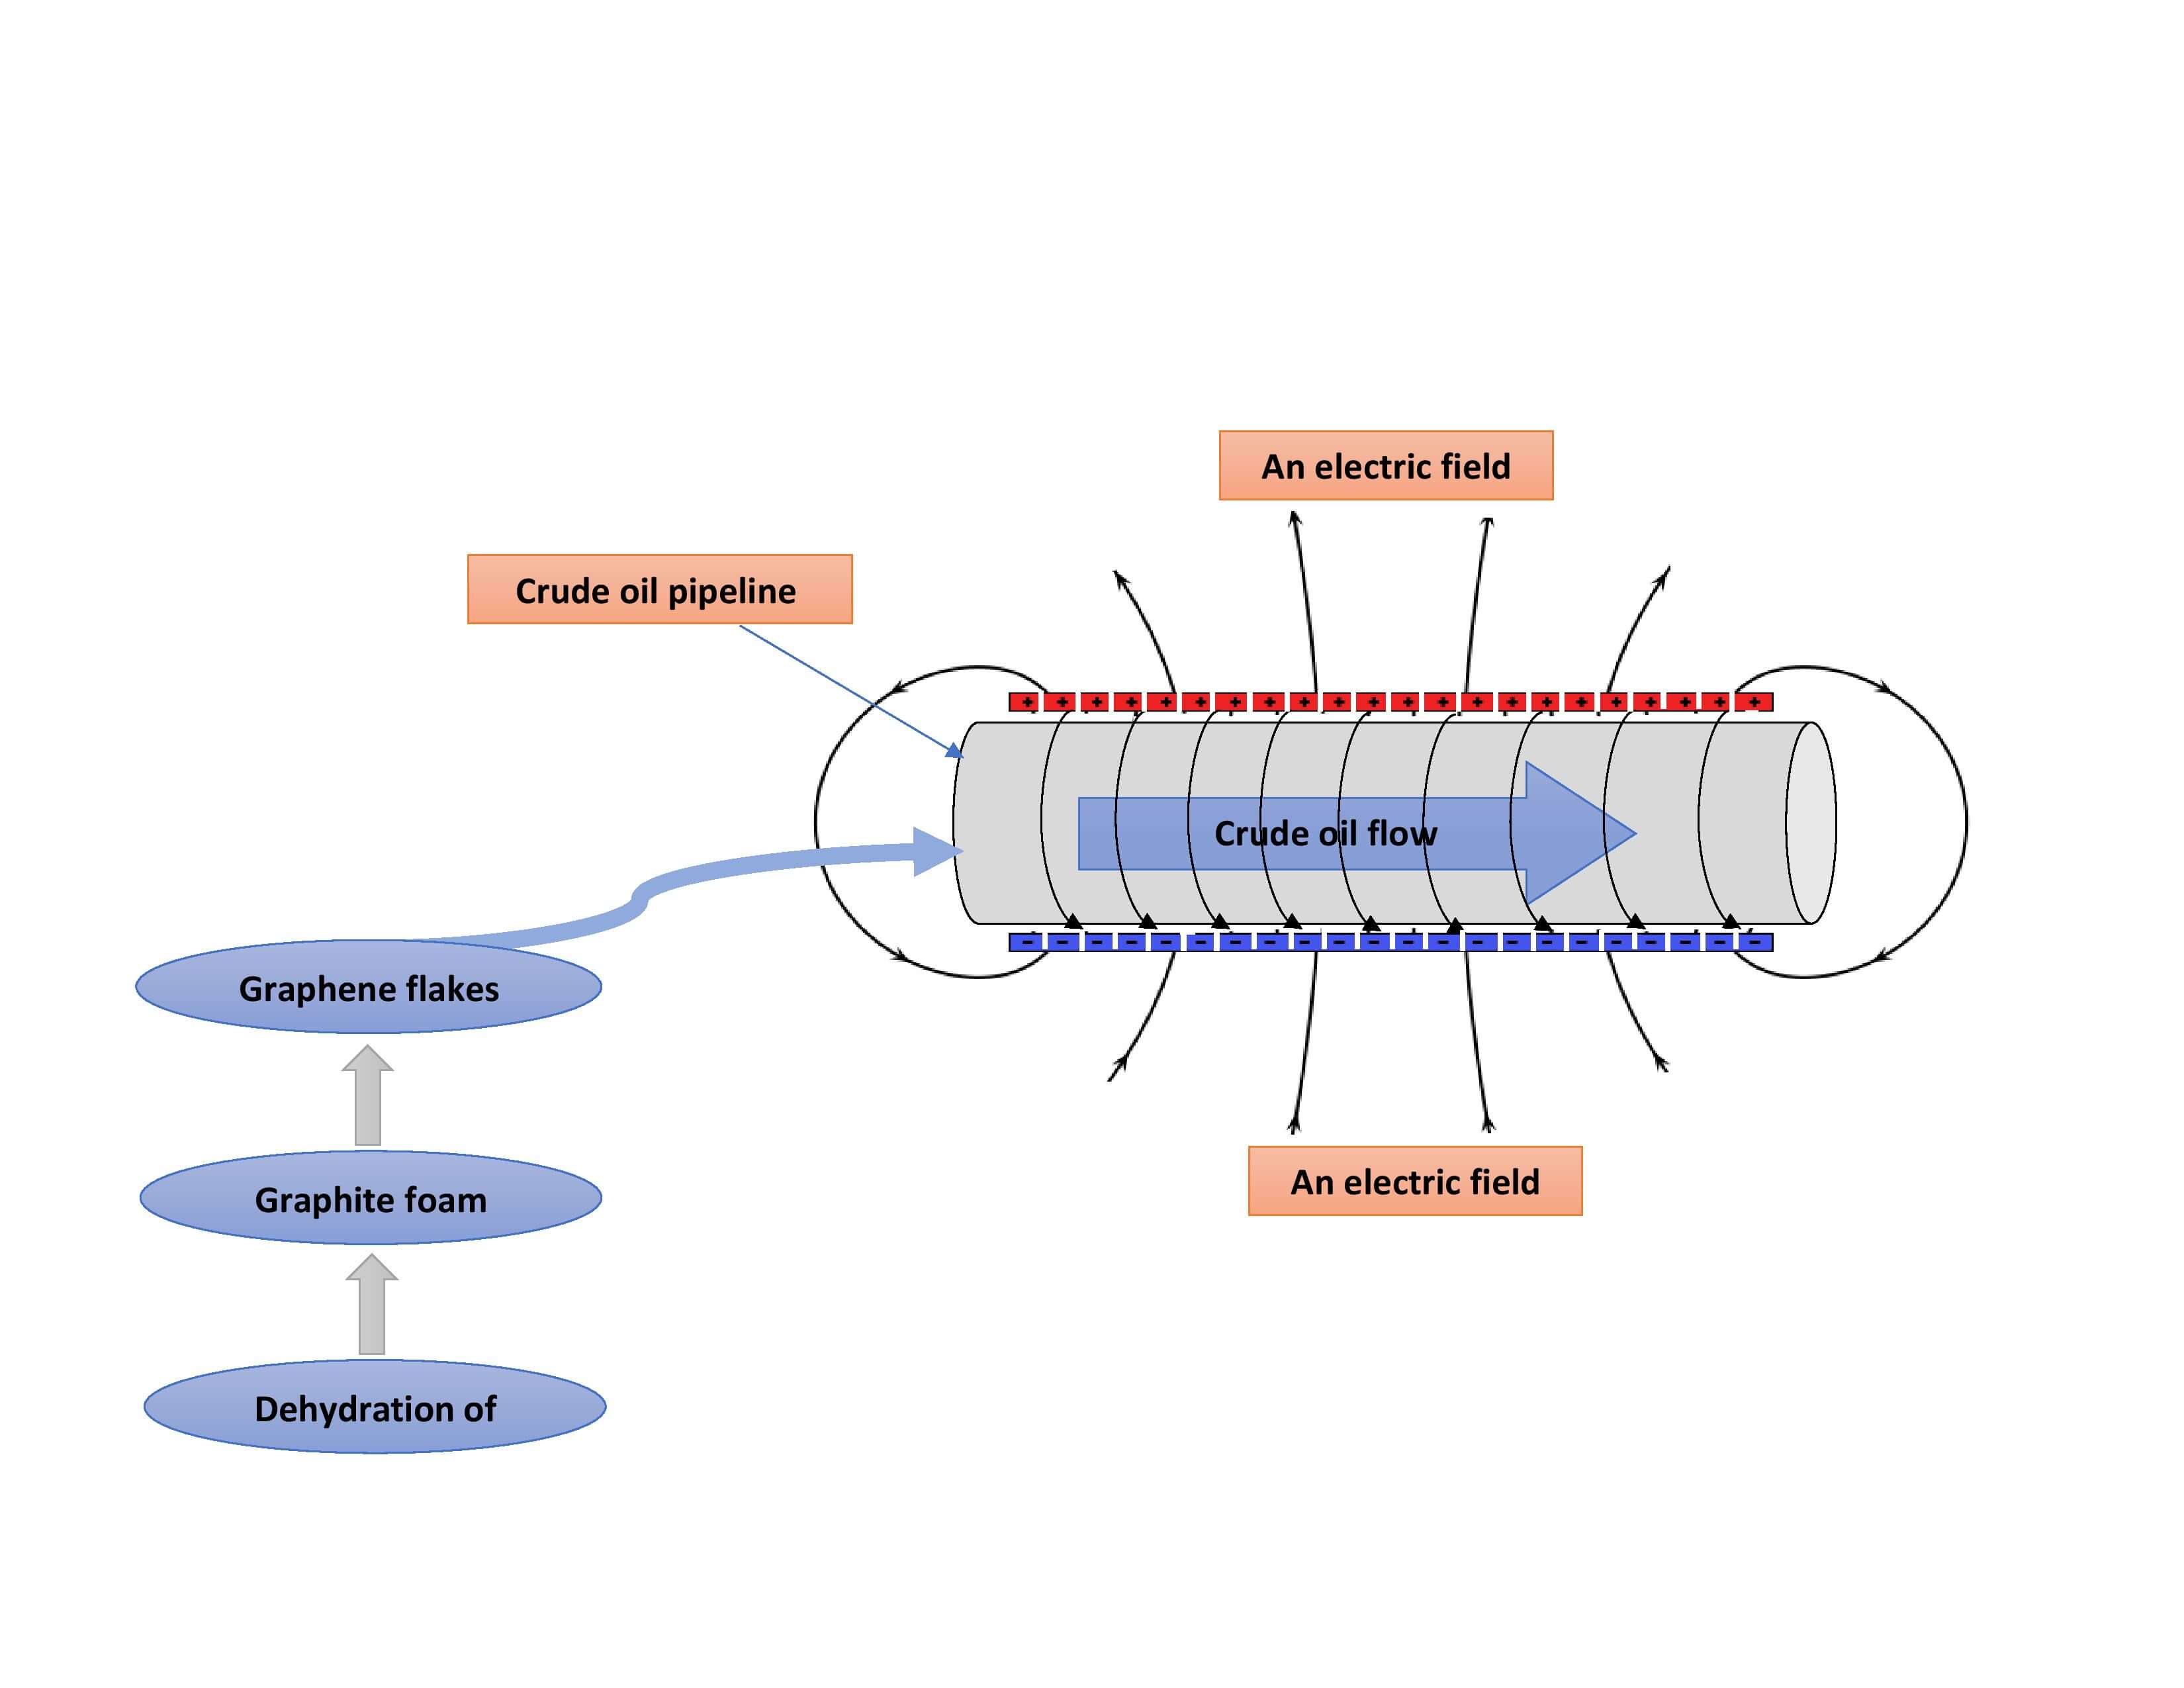
Graphene flakes (GF) have been prepared and assessed as a material for improving flow in oil pipelines under the effect of an electric field. In particular, different amounts of GFs have been considered in order to determine the optimal flow conditions. The GFs were prepared from graphite foam, derived from the dehydration of sugar with a particle size of 500–600 μm, which was dispersed in ethanol and exfoliated in a ball mill under a shear force. After 15 h of exfoliation, sonication, and subsequent high-speed centrifugation at 3000 rpm, irregular-shaped GFs of 50–140 nm were produced and characterized using scanning electron microscopy, X-ray diffractometry, atomic force microscopy, and Raman spectroscopy. The prepared graphene sheets have been found to display excellent morphology and good graphitic structure. Experiments on flow improvement were conducted using the central composite rotatable design method for three parameters: stimulation time (15, 30, 45, and 60 s), applied voltage (150, 170, 200, and 220 V), and concentration of the GFs (0, 100, 200, and 400 mg/L). The optimal conditions for improved crude oil flow were then determined using the STATISTICA and WinQSB software packages. The results have confirmed the effectiveness of the use of the prepared GFs as a flow improver for crude oil, where the flow improvement is essentially a result of a reduction in viscosity and suppression of friction in the crude oil system.Graphic Abstract
Keywords
Crude oil is the major global energy source, transported to where needed through pipelines. Although these pipelines present a safe and efficient way of transporting crude oil, they have shortcomings, such as interactions occurring between asphaltene and paraffin structures, falls in pressure within the pipes, and a high amount of energy required for the pumping of the oil [1–4]. The main factor of the high energy consumption in crude oil pipelines and other transportation systems has been attributed to drag [5,6] that arises because of high viscosity and friction of the oil against the pipe walls, phenomena that require a high amount of energy to overcome to enable the oil to be efficiently pumped through pipelines [7]. Flow improvement can be achieved by enhancing the fluid-mechanical efficiency of the oil using a material referred to as a flow improver, which significantly reduces the friction of crude oil in oil pipelines, thus reducing pumping energy consumption [8]. Different types of flow improvers and drag reducers can be used in this process, such as surfactants, fibers, and polymers, all of which efficiently reduce the turbulent friction inside pipelines [9–12]. An electric field can be used to reduce the viscosity and improve the flow of crude oil by applying a specific voltage to the oil for a certain period of time to produce an effective electric field inside the pipe. Thus, the asphaltene and paraffin particles present in crude oil are rearranged into short chains under the influence of the electric field to enhance the sliding of fluid layers without or with minimum shear stress, a technique that effectively reduces pumping energy consumption [13–16].
In recent years, graphene has been heavily researched [17] owing to its excellent properties, such as mechanical stiffness, strength and elasticity, and very high electrical and thermal conductivity, making it an ideal candidate to replace other materials in existing applications [18]. The properties of graphene are highly dependent on its number of layers and the quality of its crystal lattice [19]. The techniques for synthesizing graphene can generally be classified as top-down or bottom-up approaches [20]. Top-down methods start from graphite, with the separation of its stacked sheets achieved by overcoming the enormous van der Waals interactions between the graphite layers [21]. Key challenges in this area include effective separation of the layers without damaging the sheets and preventing the re-agglomeration of the sheets once the layers have been exfoliated [22]. The preparation of graphene using mechanical techniques involves the use of mechanical forces to separate graphene sheets from each other [23]. Such techniques are used when graphene of the highest quality is required, and the method does not change the chemical structure of graphene [24]. Moreover, graphite exfoliation is the best method for graphene production as it can be used for large-scale production at a low cost [25]. Ball milling is an established method used in powder technology to generate shear force [26]. In this process, hundreds of carbon layers are dispersed in a solvent and milled to exfoliate them into graphene. Graphite layers are organized into bulk graphite via weak van der Waals forces, which can withstand exfoliation. However, the shear forces generated using a high-energy ball mill have sufficient energy to overcome the van der Waals forces between the graphite layers, thus leading to the successful exfoliation of graphite to graphene [27]. The industrial applications of graphene require large-scale and cost-effective production methods. However, it is very important to achieve balance between the cost of fabrication and final material quality [28]. Dehydration reactions involve the loss of water molecules from a material, driven by a dehydrating agent such as concentrated sulfuric acid (H2SO4), concentrated phosphoric acid, or a hot ceramic. An example of such a reaction is the dehydration of sucrose, which is an exothermic reaction process in which pure graphite foam and water are generated as products in the presence of dilute H2SO4. A major development in this area is the effective separation of the graphite layers without damaging the sheets using residual concentrated H2SO4 and water to prevent the re-agglomeration of the sheets after exfoliation of the layers [29–32].
The aim of this study was to prepare graphene flakes (GFs) via the wet ball milling of pure graphite foam derived from the dehydration of sugar. To date, no study has focused on using GFs as a material to reduce drag and improve flow in crude oil pipelines as the main disadvantage of this is the aggregation of graphene due to interparticle forces. To reduce this aggregation, an electric field can be used to introduce a repulsive force between the graphene particles. Thus, this study details the concurrent use of GFs and an effective electric field to improve flow in crude oil pipes. Optimization techniques employing STATSTICA and WinQSB software were used to derive a model equation representing the drop in pressure inside a crude oil pipeline and to predict the optimal conditions for flow. The proposed model was then validated using experimental data.
Graphite foam was prepared via the dehydration of sugar. Under fume hood extraction, commercial granulated sugar (50 g) was added to a 500-mL beaker, which was then placed in a metal pan filled with sand. Concentrated H2SO4 was then added to the beaker under the continuous stirring of a glass rod. Eq. (1) shows the reaction involved in the dehydration reaction of sugar.
The color of the reaction mixture changed from white to yellow and then to black; then, the mixture began to extend outside the beaker to form a so-called graphite column, as shown in Fig. 1A. The clean graphite foam containing residual H2SO4 and water resulting from the reaction was then placed in a ball mill for wet milling. Zirconia balls of 3.0–5.5 mm in diameter were added to the ball mill, and the graphite foam was milled in the presence of ethanol (99.7%) at a rotation speed of 3000 rpm for 15 h to ensure that the shear stress was dominant, with the weight of the milled graphite powder measured as 30 g. The small volume of ethanol added to the milling process improves the intercalation of the exfoliating material within the graphene layers, leading to a special type of exfoliation. The dark graphite slurry obtained from the ball milling process was ultrasonicated at 750 W for 30 min to break down any aggregated particles in the slurry before being filtered through pre-moistened 100-μm filtration paper in a Büchner funnel to remove the hard clusters formed in the milling procedure. The resulting reaction mixture was then subjected to centrifugation at 3000 rpm for 15 min to remove any macroscopic aggregates. The shear force of the ball milling/ultrasonication in the presence of ethanol led to the formation of a uniform, highly stable, black suspension of the graphene. After evaporating the solvent and washing the product multiple times using ethanol, a high-purity dehydrated powder was obtained. The product was structurally characterized by X-ray diffractometry (XRD) and Raman spectroscopy. Furthermore, the morphologies of the graphite powder and the prepared graphene sheets were analyzed using scanning electron microscopy (SEM). The experimental and practical steps involved in the preparation of the GFs are shown in Fig. 1.
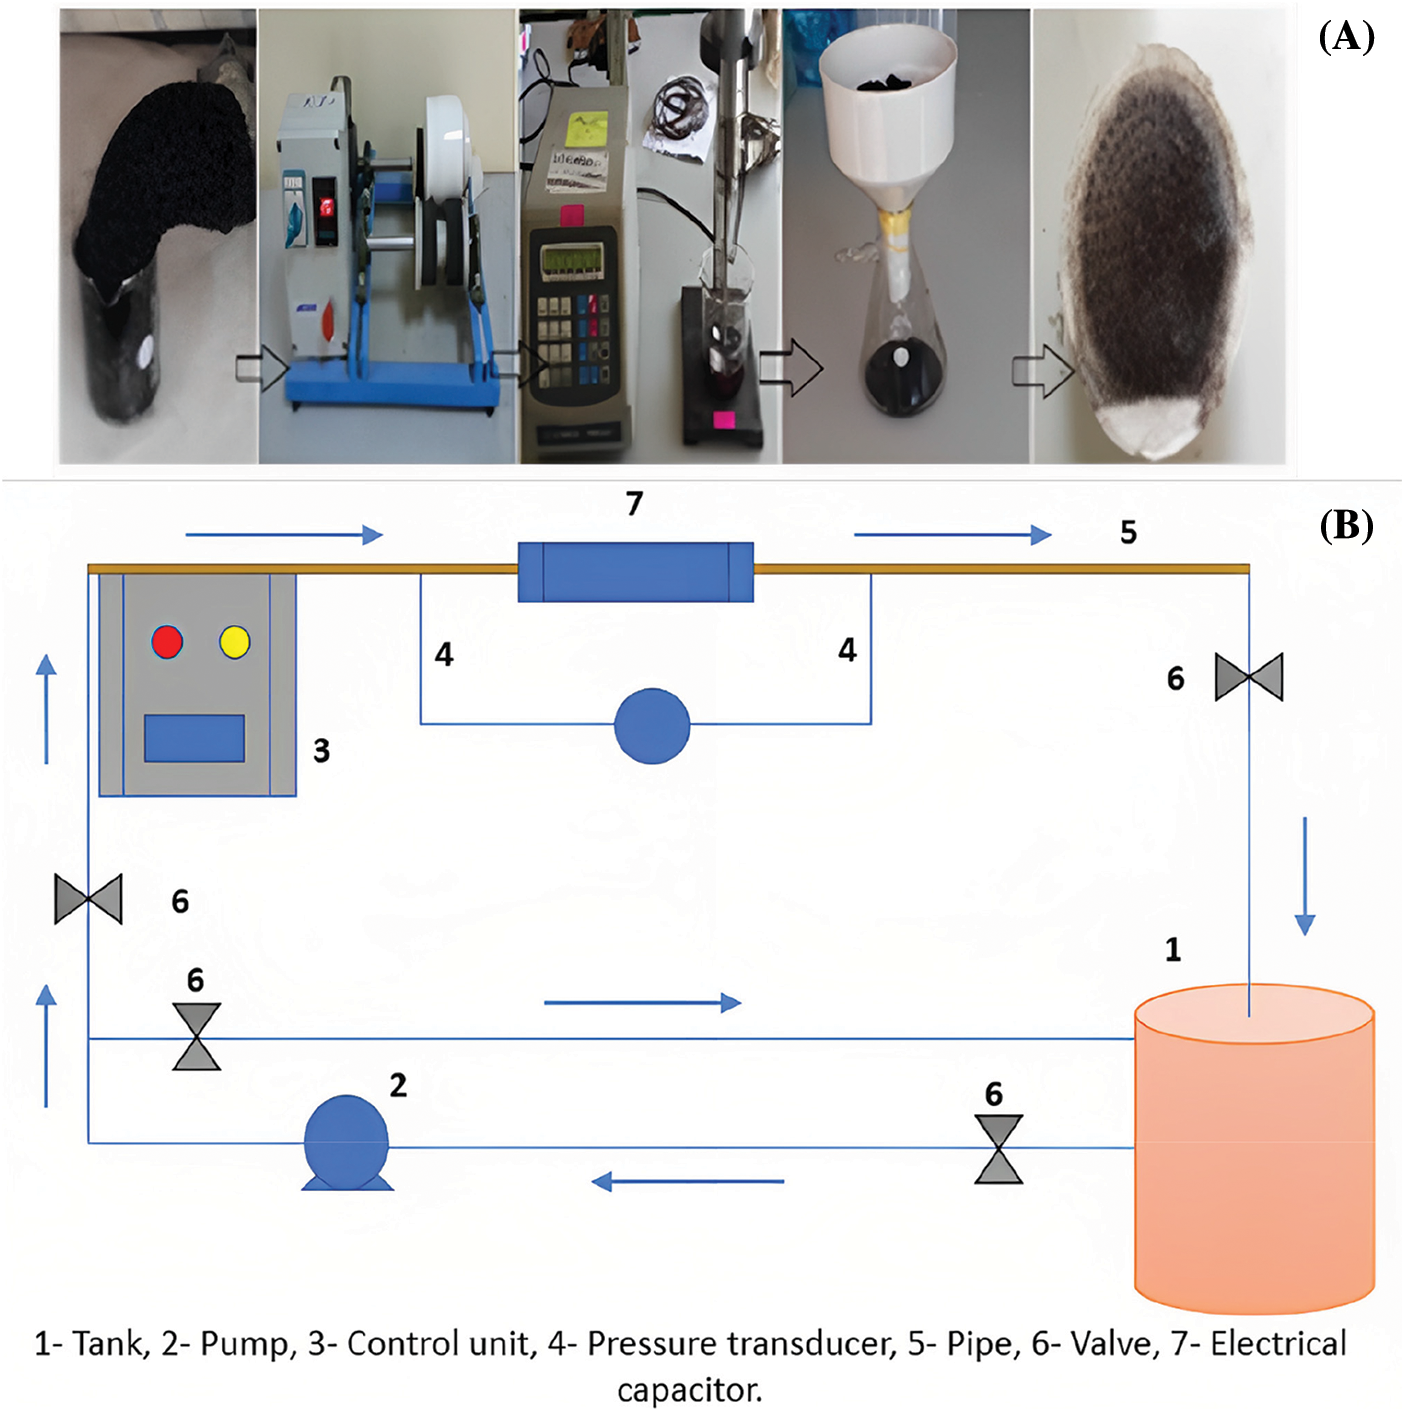
Figure 1: (A) Experimental steps for the preparation of graphine flakes, (B) Schematic digram of circulating flow system
2.2 The Circulating Flow System and Experimental Procedure
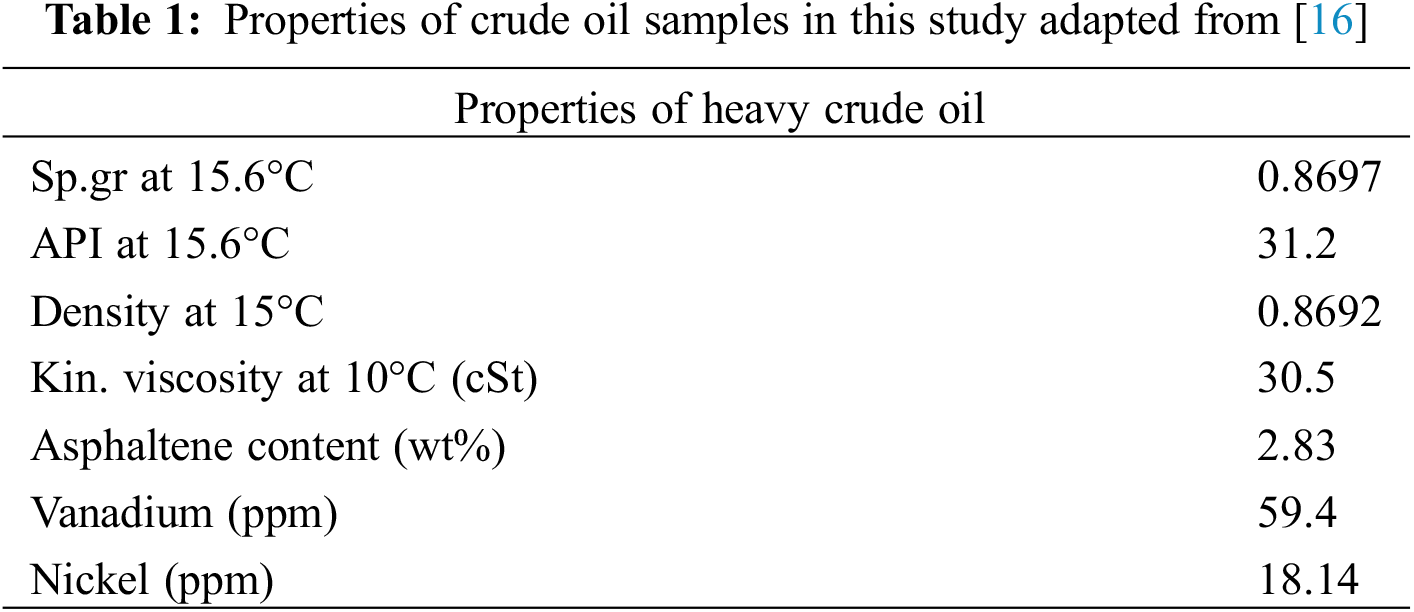
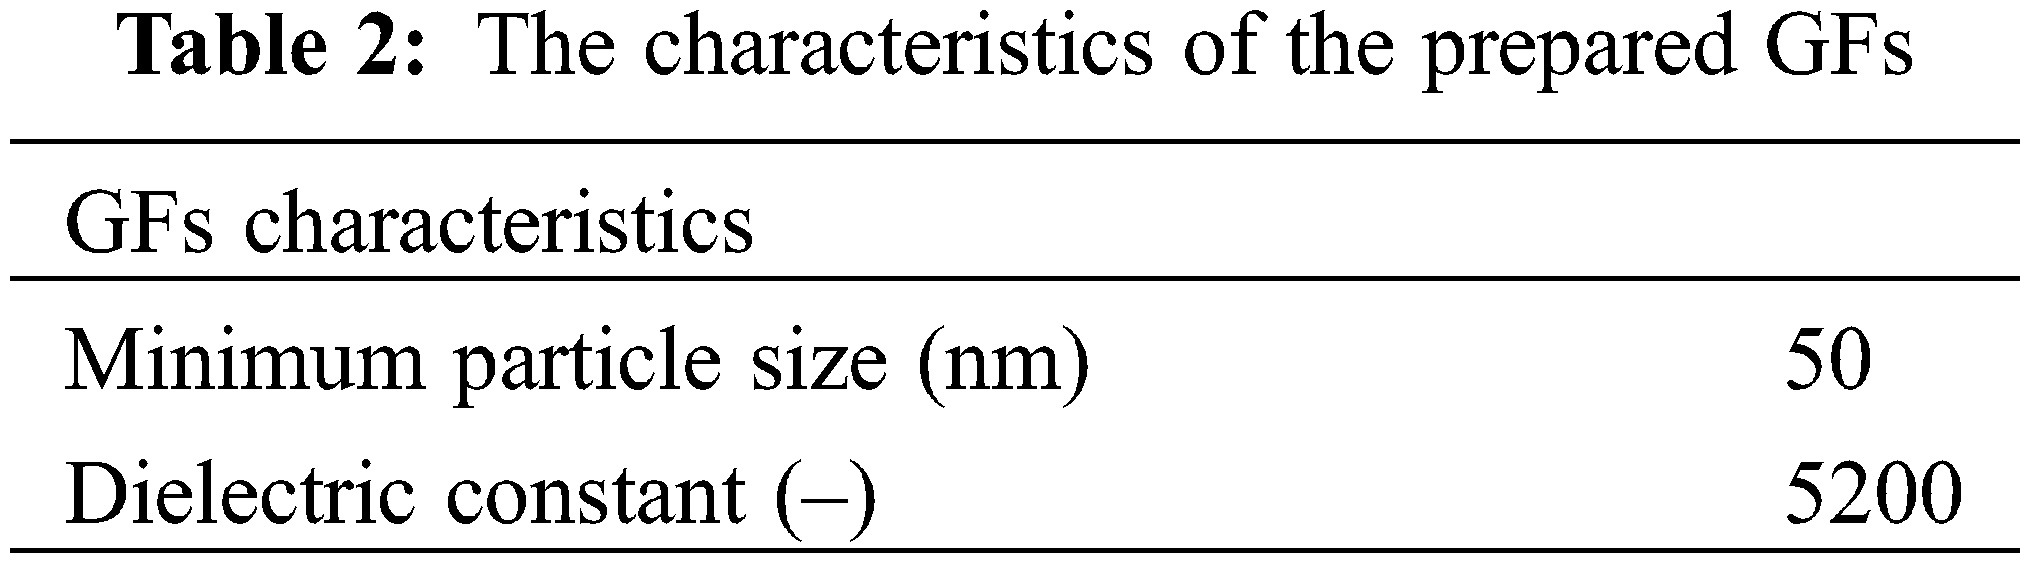
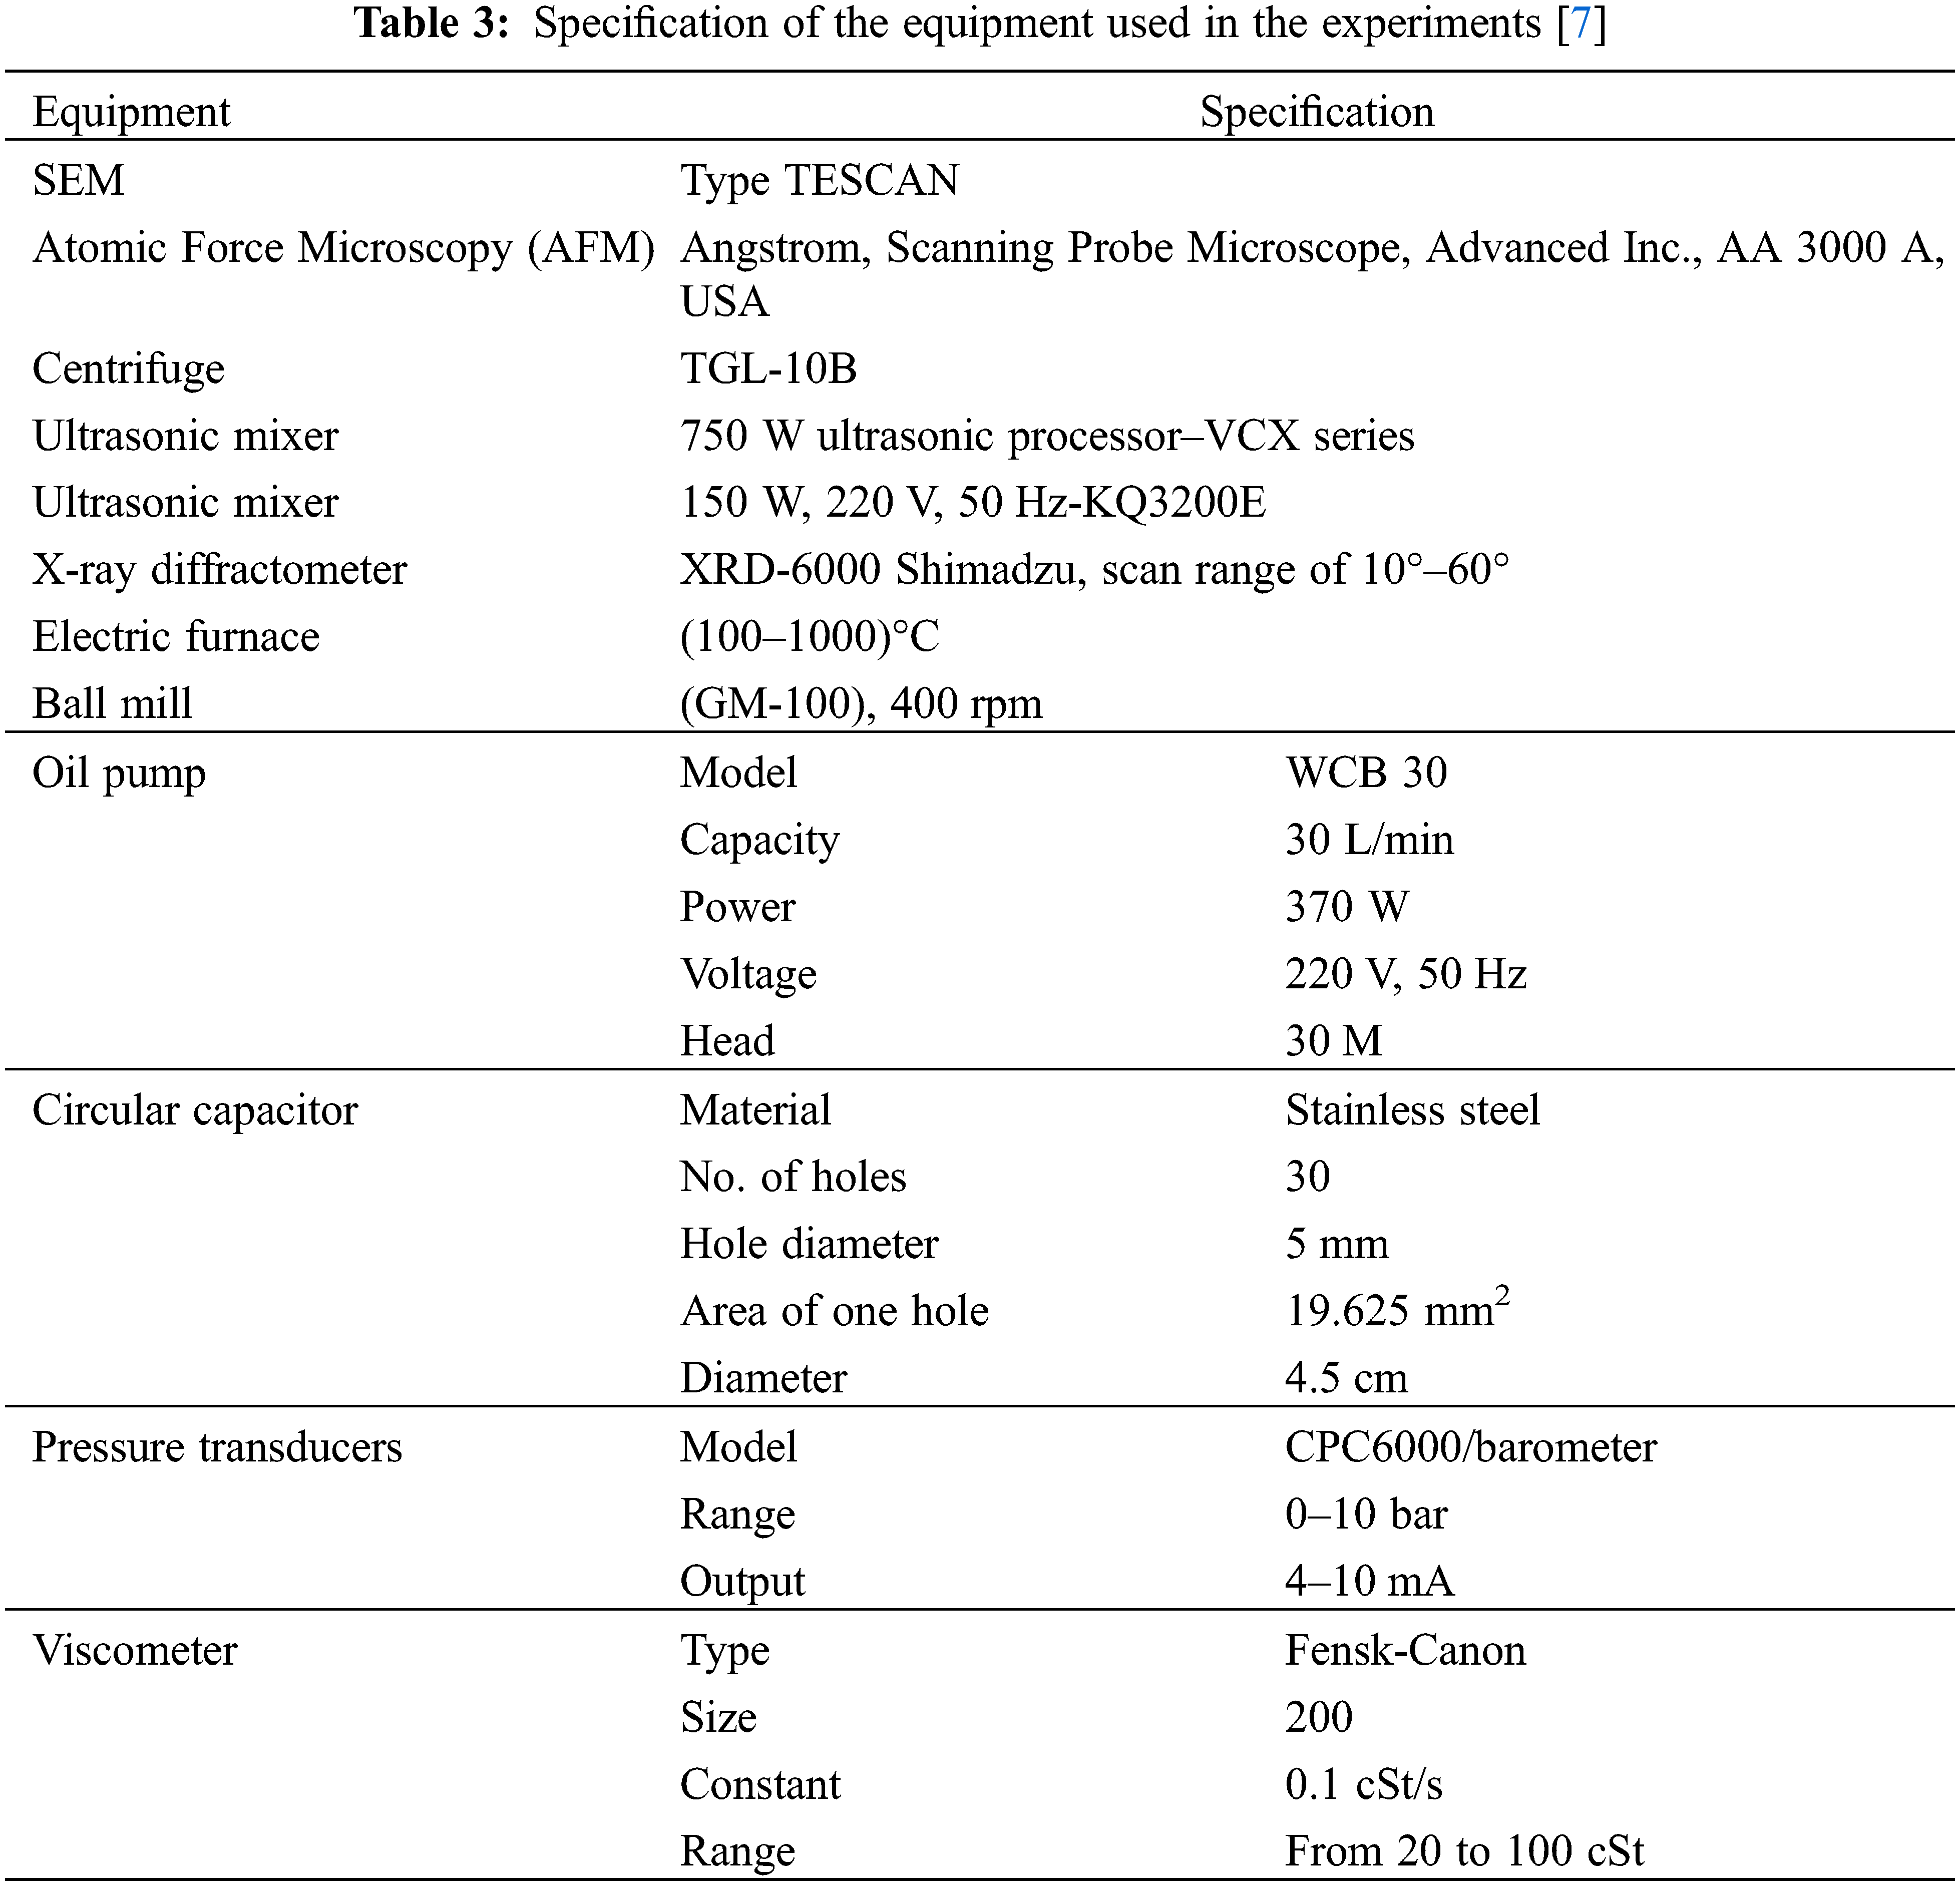
The application of the prepared GFs to improve the flow of crude oil was tested in a circulating crude oil flow system comprising a pump, an oil pipe with an internal diameter of 4.5 cm and a length of 1.5 m, valves, pressure transducers, and a voltage regulation device. An electric field was applied to the system using an electrical capacitor, the design and specifications of which are detailed in previous work [10]. Fig. 1B shows a schematic diagram of the circulating flow system. In accordance with the central composite rotatable design (CCRD) method, 20 experiments were implemented to investigate the impact that three experimental parameters have on the process, namely, the applied voltage (150, 170, and 220 V), the stimulation time (15, 30, and 60 s), and the concentration of the GFs (100, 200, and 400 mg/L), in addition to their interaction effects. GF concentrations were moderated using an ultrasonic mixer. All of the experiments were performed at 30°C ± 2°C. The differential pressure inside the pipe and crude oil viscosity were investigated using a suitable measuring device to probe the drag reduction and flow improvement efficiency. Crude oil samples were obtained from the Al-Doora refinery in Baghdad, Iraq, the physical properties and specifications of which are listed in Tables 1 and 2. In addition, the specifications of the circulating flow system equipment and capacitor used in the experiments are listed in Table 3. The optimization of the process was achieved using a systematic method in the experimental design employing the CCRD technique. The optimization method used has been previously described in detail in the literature [7,12,33].
The experimentally measured pressure drop and viscosity values were used to calculate the Reynolds number (the ratio of inertial to viscous forces in a fluid), the shear stress, friction factor, and the corresponding pumping power consumption as follows [7]:
where u is the fluid velocity, which remains constant at 1.253 cm/s; d represents the internal diameter of the pipe, which is 4.3 cm; and μ is the dynamic viscosity (c.p).
where Jf is the friction factor.
where ε represents the pumping power consumption in W; Δp represents the drop in pressure in Pa; and ξ is the pump efficiency, which has a value of 0.85.
3.1 Structural Characterization of the Prepared GFs
Structural analysis of the graphite powder (starting material) and produced graphene sheets was achieved by XRD and Raman spectroscopy analysis. Figs. 2A and 2B show the XRD patterns of the bulk graphite and graphene, from which it can be seen that bulk graphite exhibits an obvious peak at 2θ = 26.5°. This peak, shown in Fig. 2A, is extremely sharp and intense, thus indicating that the graphite powder is highly crystalline. In contrast, from Fig. 2B, it can be seen that the XRD pattern of the graphene features peaks that are very wide with low intensity, thus revealing it to be polycrystalline, which can be attributed to the decrease in its crystal size due to it being milled at high speed (300 rpm) for a long time period (15 h) in the presence of a solvent. Raman spectroscopy can be used to determine valuable structural information on graphene, in terms of its defects, the stacking of its layers, and crystallite size. Carbon materials usually exhibit fingerprints in Raman spectra in the form of D-, G-, and 2D-band peaks at around 1350, 1580, and 2700 cm−1, respectively, because of the variation in their electron bands. Figs. 2C and 2D show a comparison of the Raman spectra of graphite and graphene. The two most intense peaks in the spectra are the G-band peak, which results from the doubly degenerate zone center E2g mode of the material and is located at around 1580 cm−1, and the 2D-band peak that represents second-order zone-boundary phonons and is located at around 2700 cm−1. The latter peak can be deconvoluted into four bands in the case of few-layered graphene.
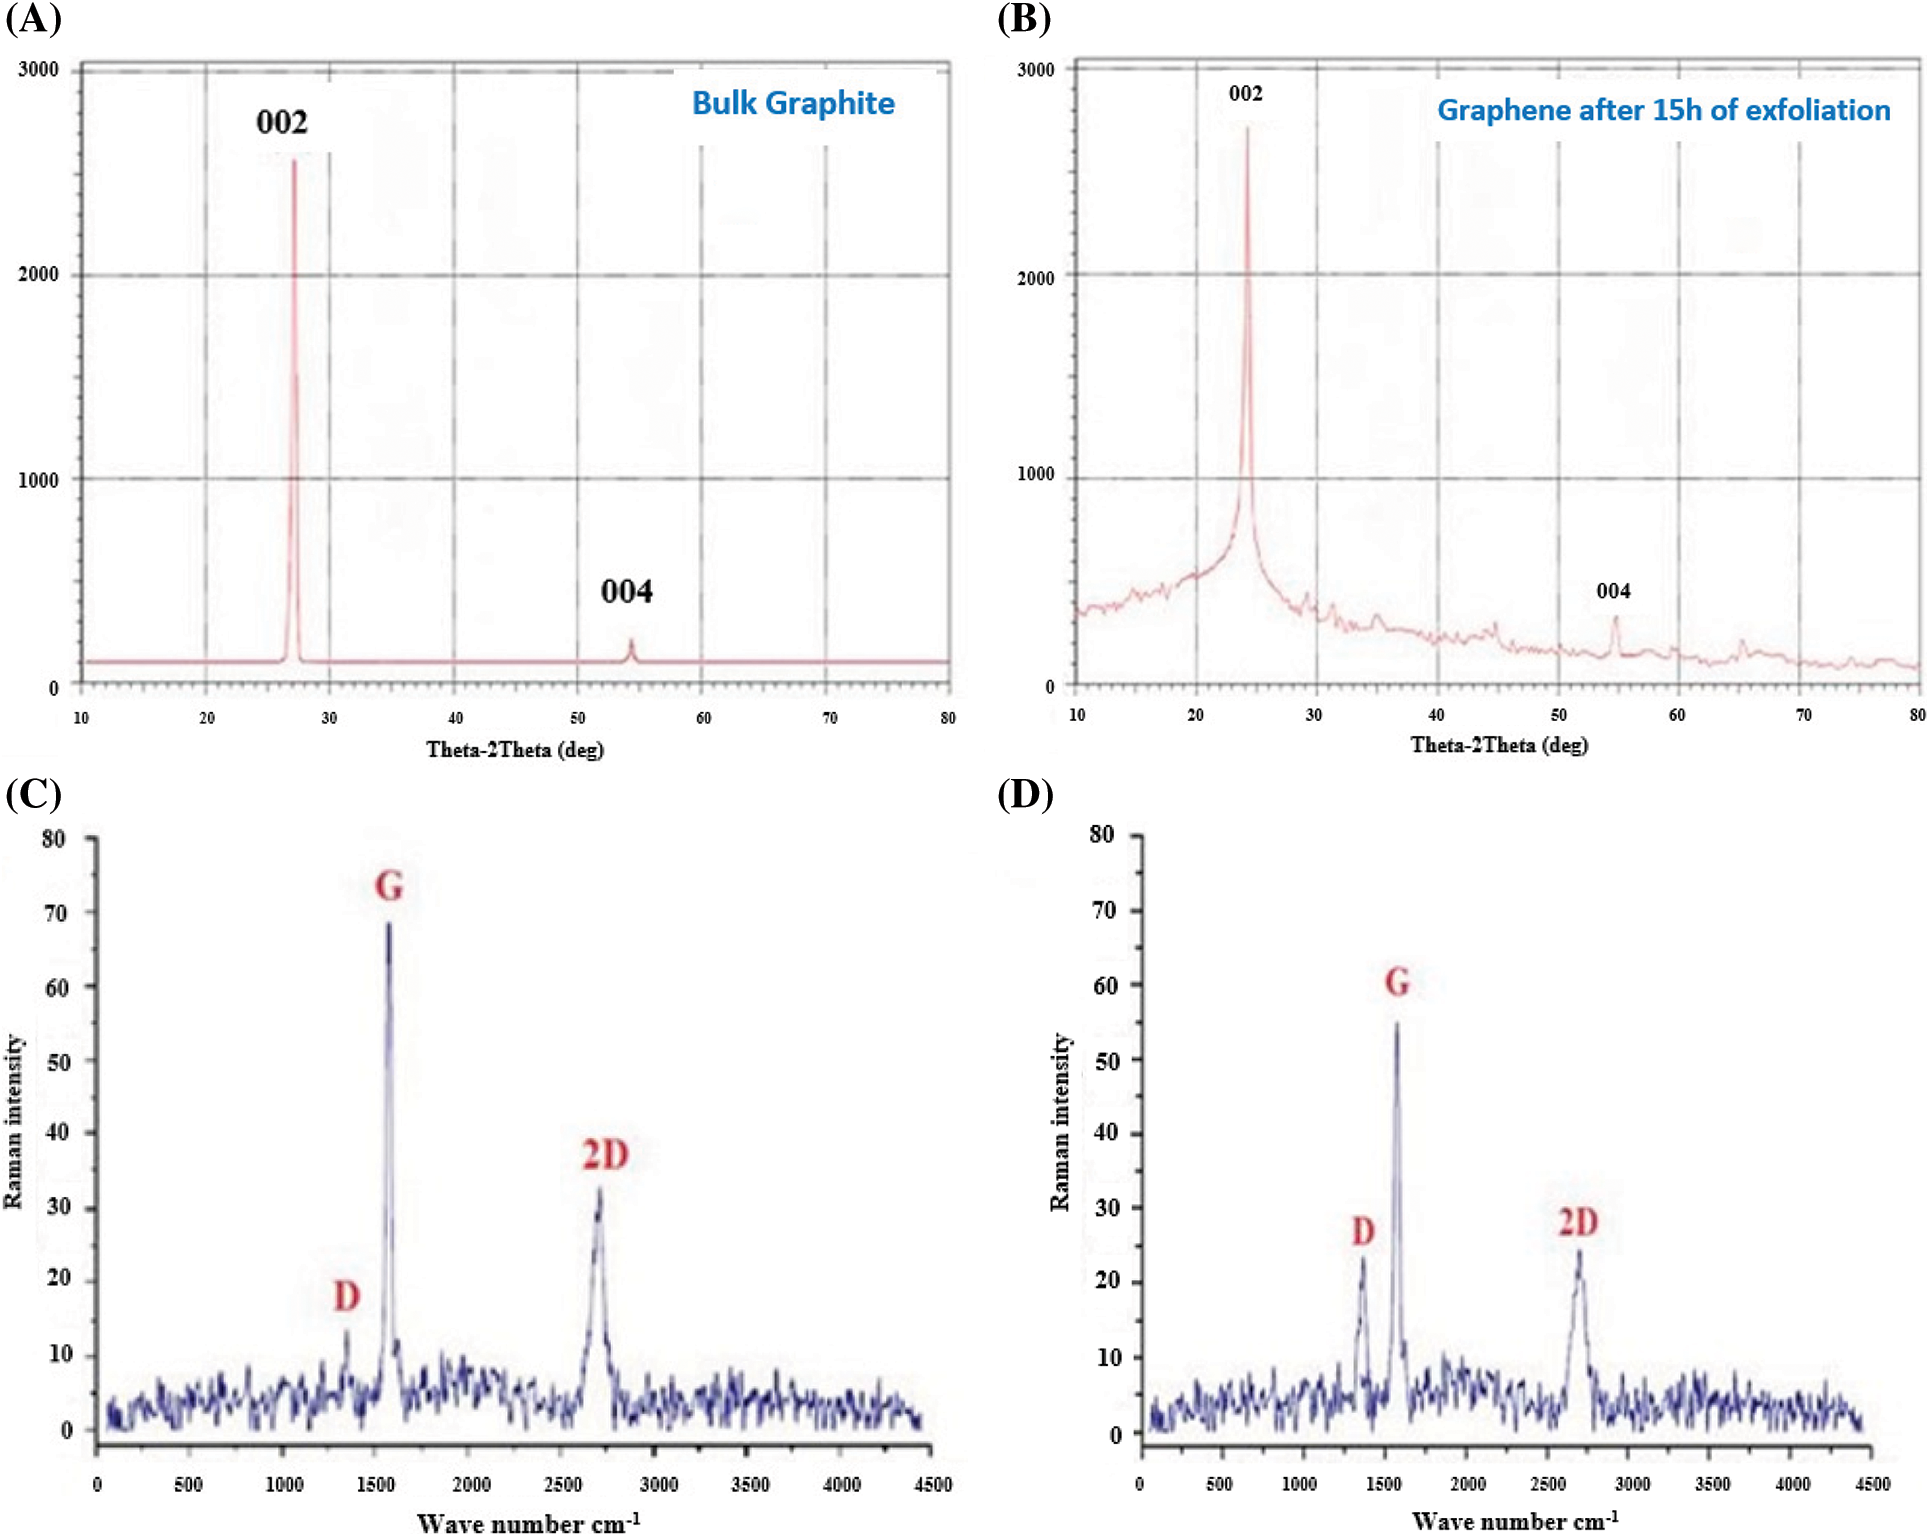
Figure 2: XRD patterns for ((A) bulk graphite, and (B) graphene), Raman spectrum for ((C) graphite, and (D) graphene)
Furthermore, the G-band intensity of graphene is lower than that of graphite as the intensity of this band increases linearly with an increase in the number of layers in the measured material. The D-band peak at around 1350 cm−1 can be attributed to the breathing modes of sp2 rings in the graphene and is only present if the material being measured features defects. The intensity of this peak is related not only related to the amount of disorder in the graphene but also to the edges of sub-micrometer flakes. Fig. 3 shows atomic force microscopy (AFM) data that indicate the surface morphology of the three (3D) and two-dimensional (2D) particles of graphene as distribution plots. The AFM data shows that the measured sample features irregularly shaped graphene sheets of non-uniform thickness that have lateral dimensions with an average grain size of 90.21 nm. From the SEM images shown in Figs. 4 and 5, it can be observed that the AFM images indicate the non-uniform distribution of the particles in terms of their size and shape, meaning that the prepared graphene might be characterized by a group of high-density 3D clusters with small agglomerations on their surface. Various shapes, heights, and sizes of particles can be observed, indicating the crumpled and wavy structure of the graphene due to its deformity during the exfoliation process. The exfoliation of graphite layers occurs as there is a strong interaction between the basic planes of the graphite and the solvent, where the solvent minimizes the interfacial tension between the liquid and the GFs. Based on the results, the product synthesized in this study was proven to be graphene. The synthesis process was enhanced using an organic solvent as a milling medium to promote non-destructive exfoliation, which was confirmed in the characterization of the prepared samples. These results are in accordance with those of Al-Sherbini et al. [34].
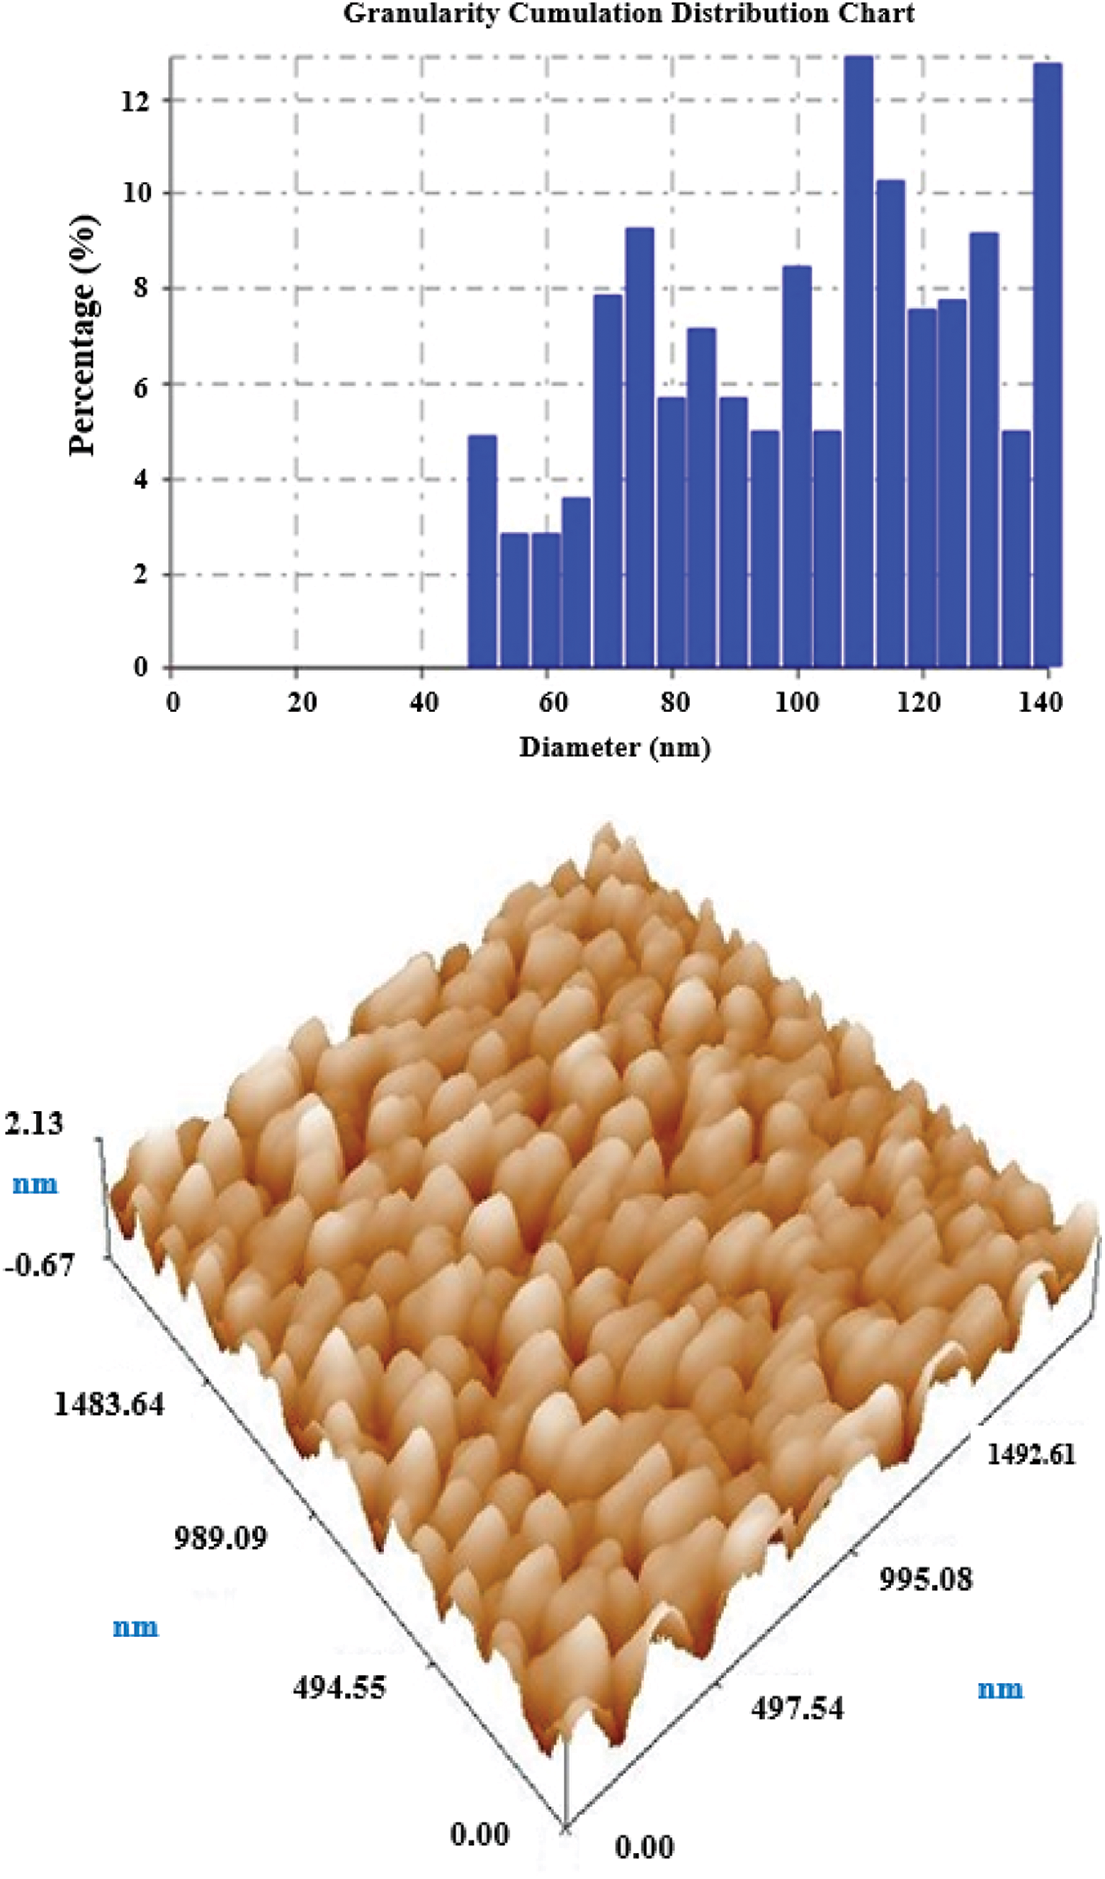
Figure 3: 3D distribution chart and AFM image for graphene powder
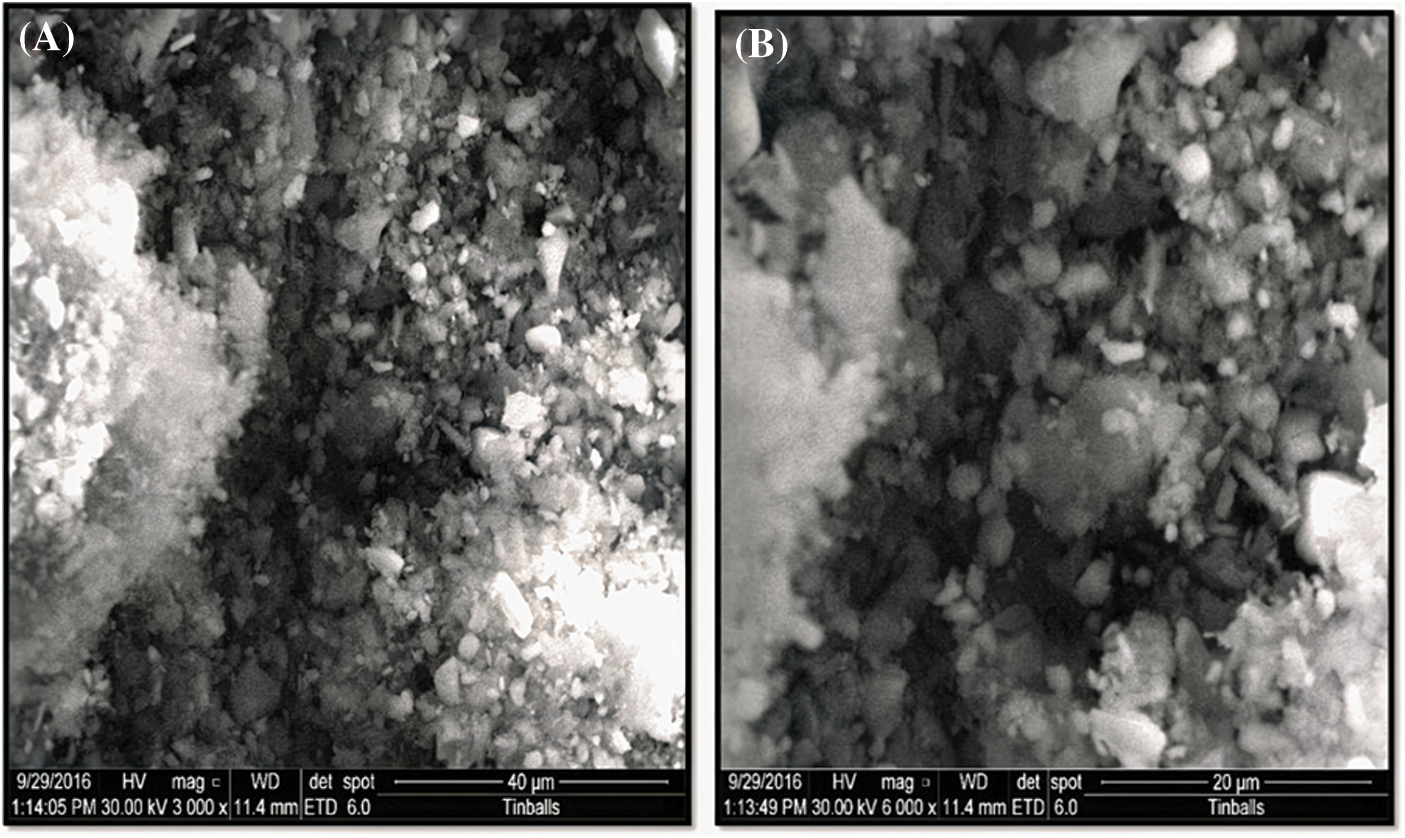
Figure 4: (A)–(B) SEM images of graphite powder
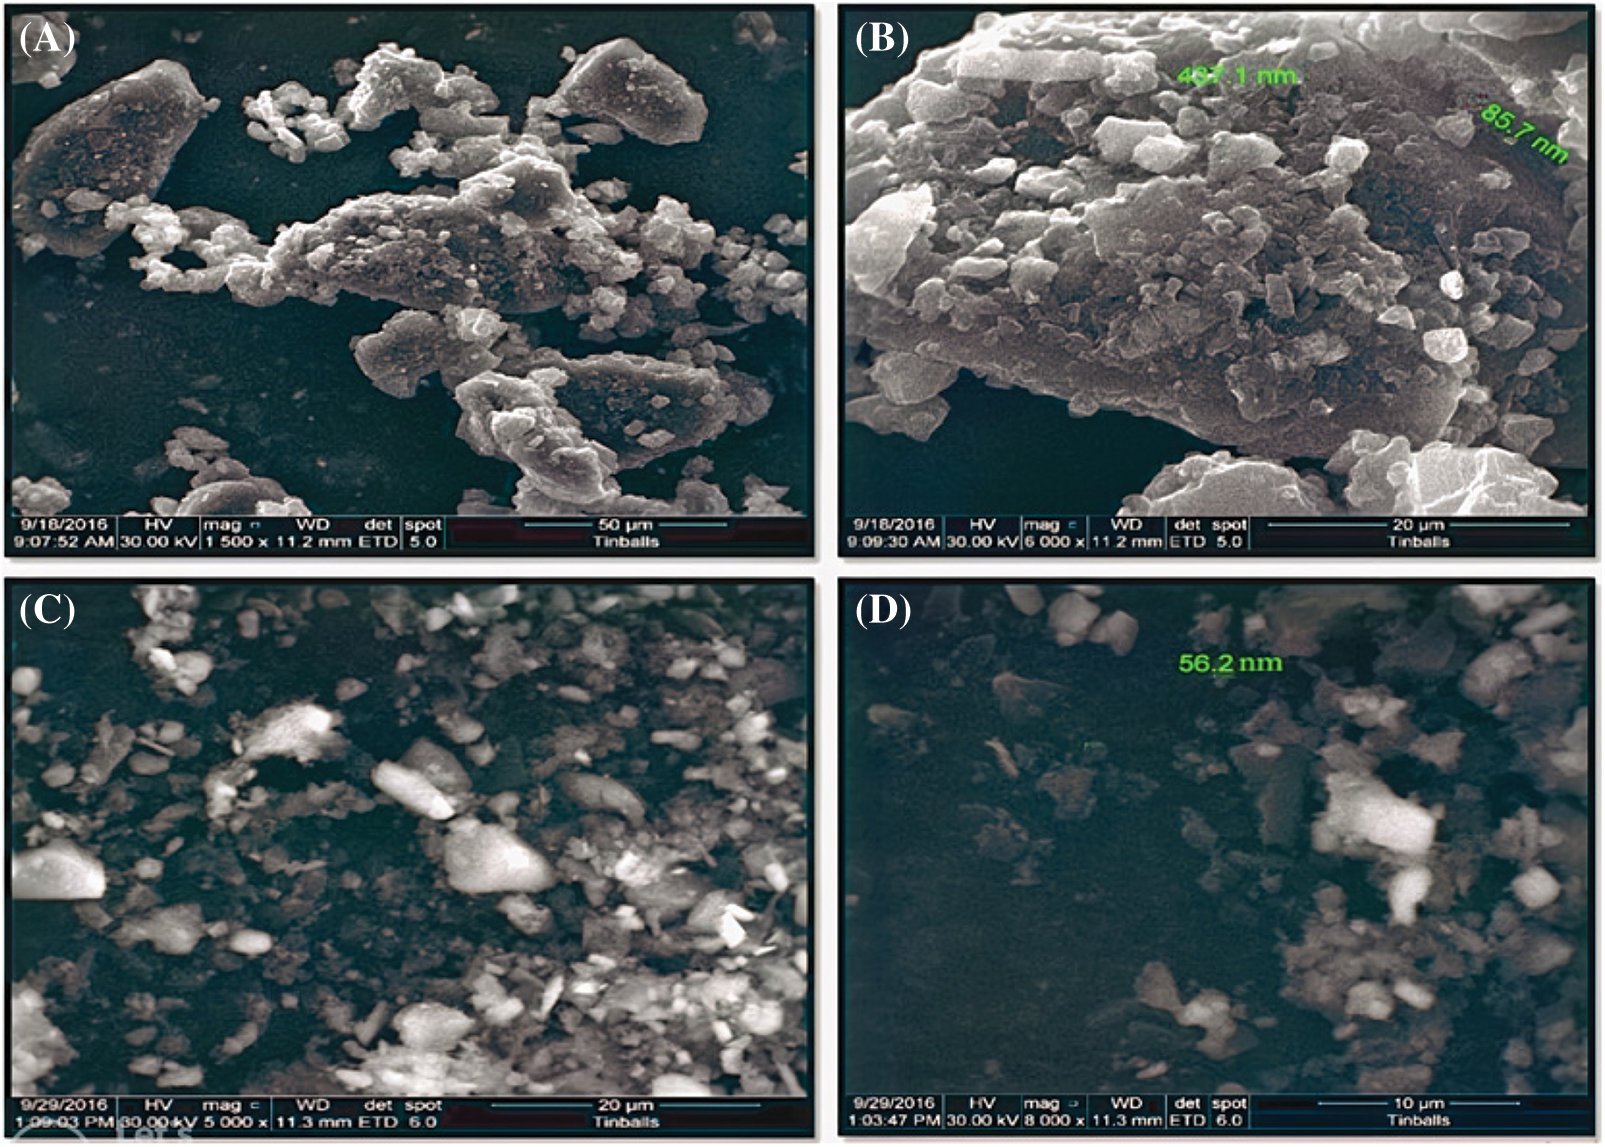
Figure 5: 3D image for (A)–(B) graphene powder before sonication, and (C)–(D) graphene flakes after sonication
3.2 Fluid Flow Characteristics Results
Table 4 shows the experimental pressure drop values and crude oil viscosity measurements in addition to the results of the calculations of fluid flow characteristics processed using the CCRD technique. The Reynolds number, shear stress, friction factor, and power consumption results show the obvious impact that the GFs have on the drop in pressure in the crude oil system. Moreover, the electric field intensity had a significant impact on reducing the viscosity of the crude oil. The best flow characteristics are observed under optimal operating conditions. The Reynolds number was enhanced when the viscosity of crude oil was reduced at a constant pumping flow rate. The reduction in viscosity is a result of the application of an electric field, which leads to the GFs and asphaltene and paraffin molecules being arranged in short chains that slide over each other to minimize flow resistance and friction. Shear stress dramatically decreases with a reduction in viscosity. The effects of the operating conditions on the drop in pressure and power consumption are discussed in the following sections.
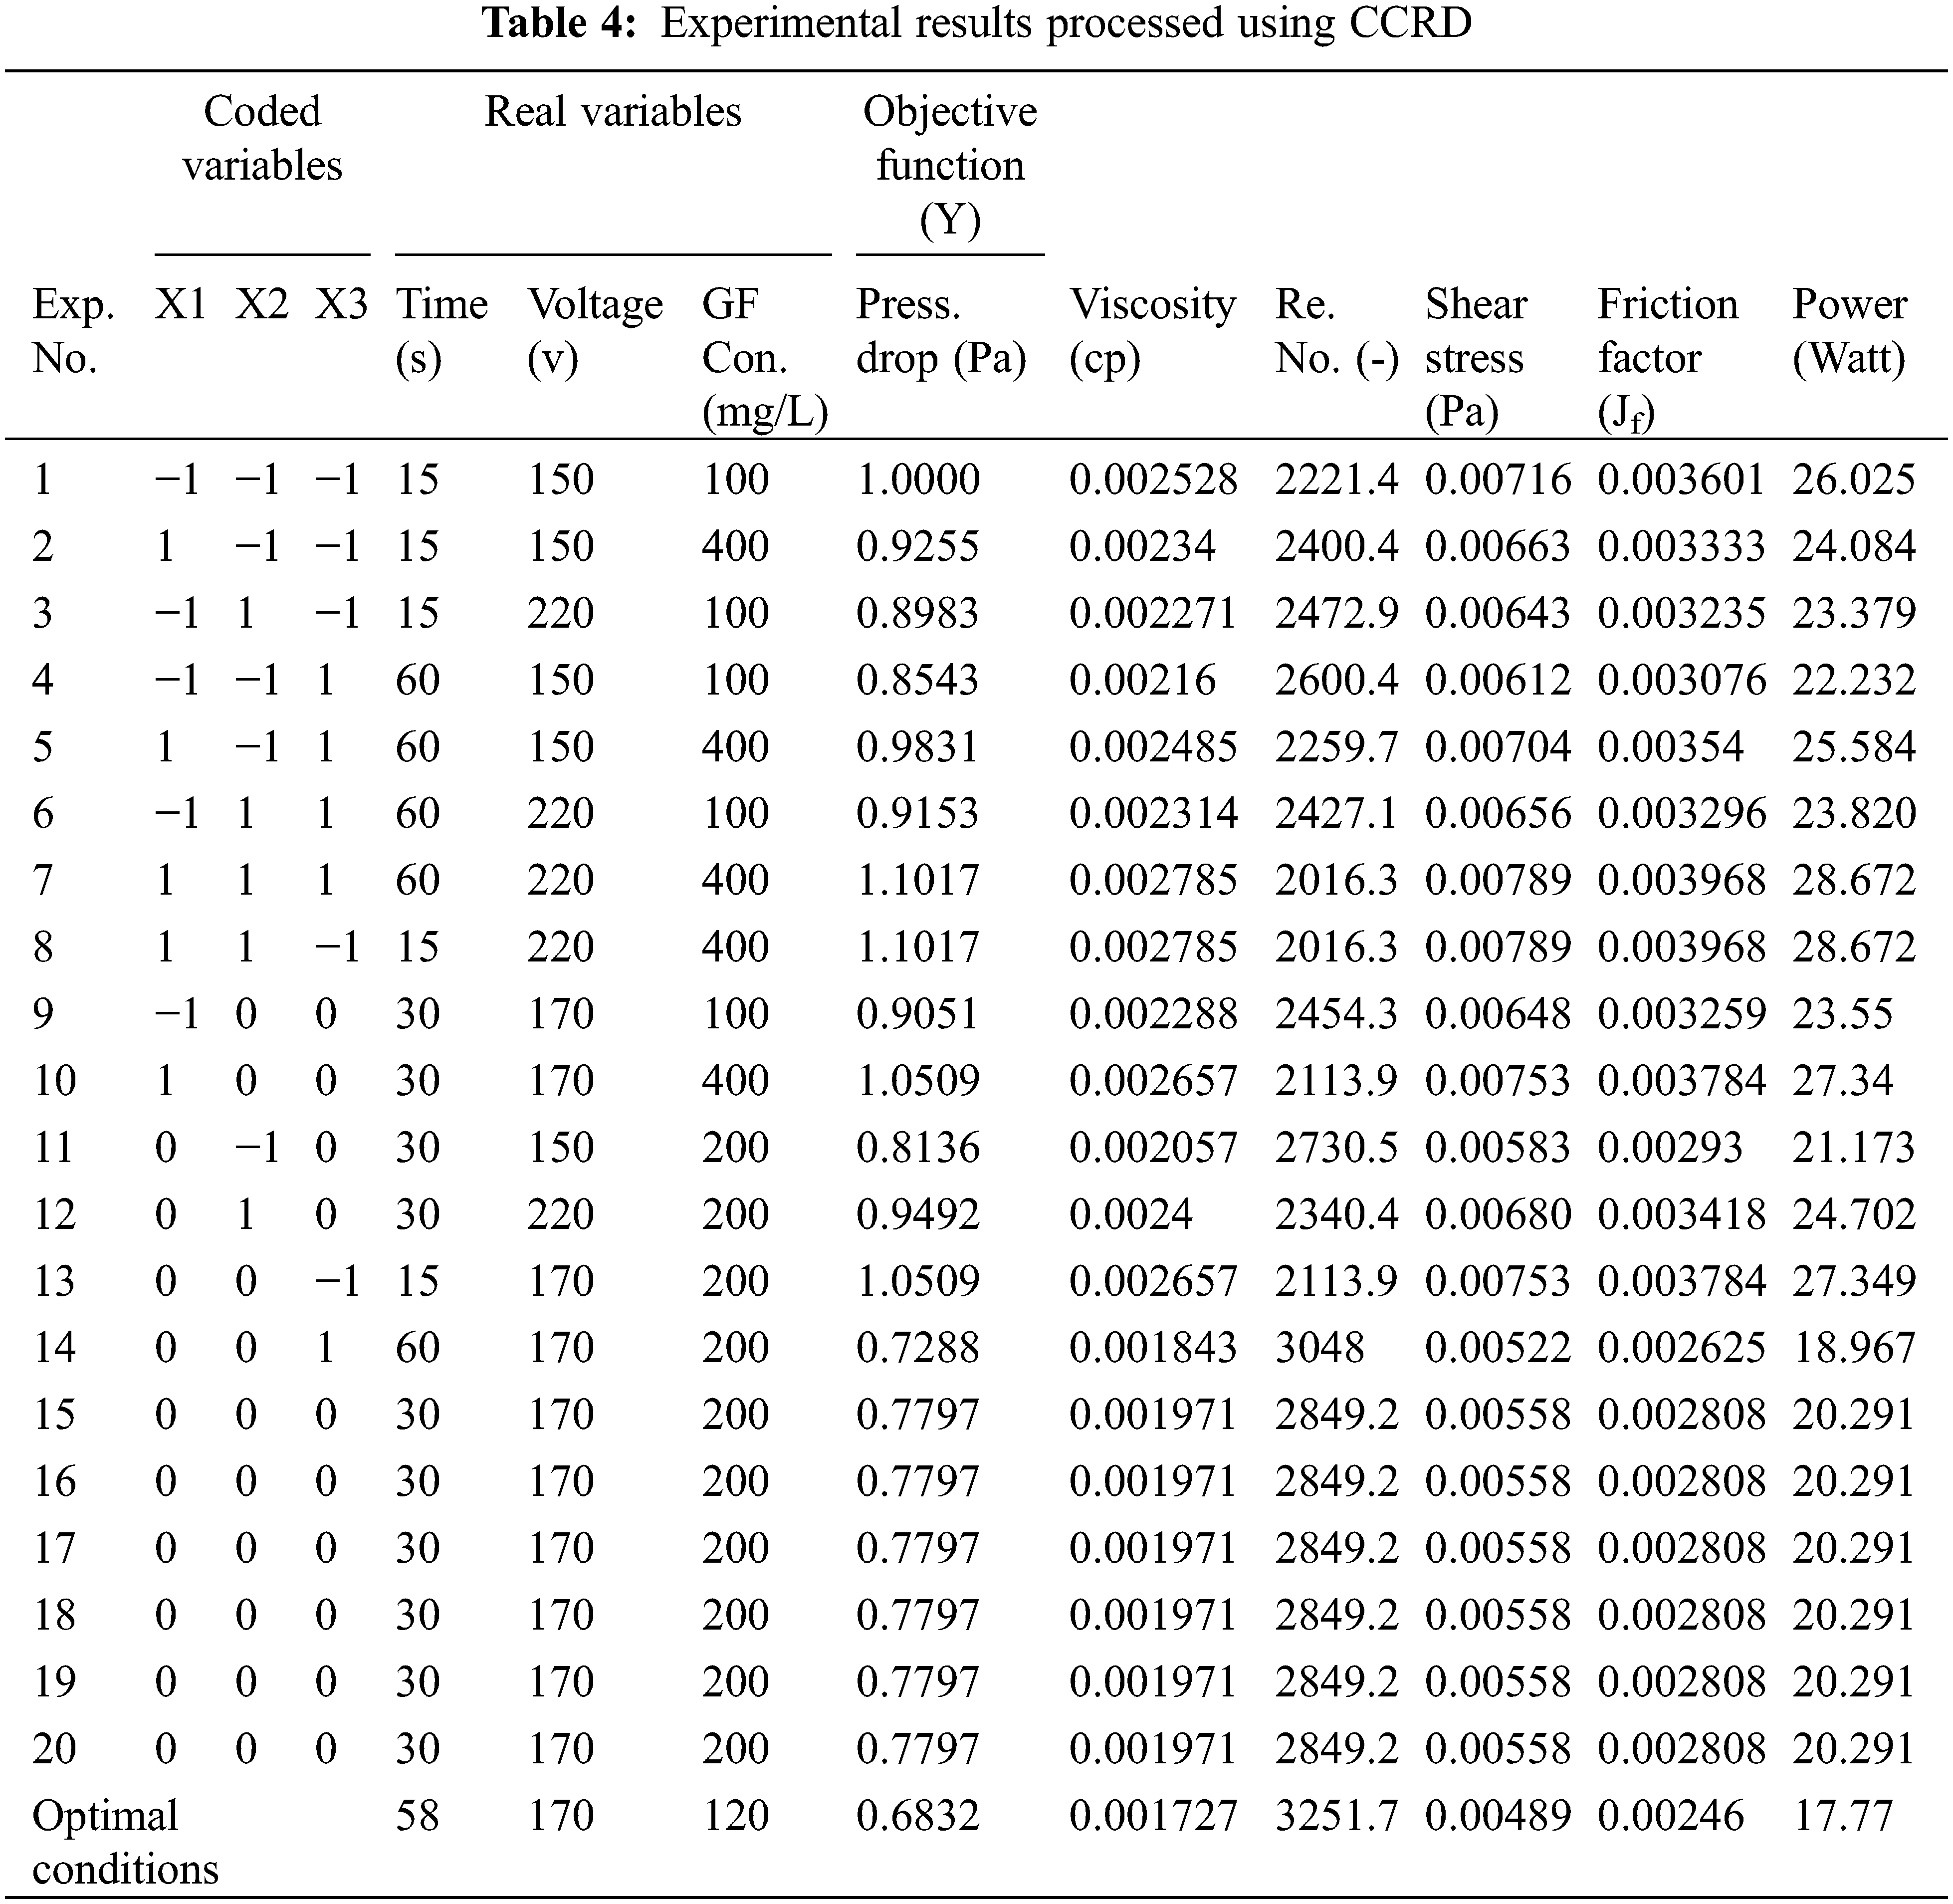
Table 4 shows the optimal conditions calculated using the WinQSB version 1.0 software. The objective function as a drop in crude oil pressure was devised using a polynomial formulation, represented by the following:
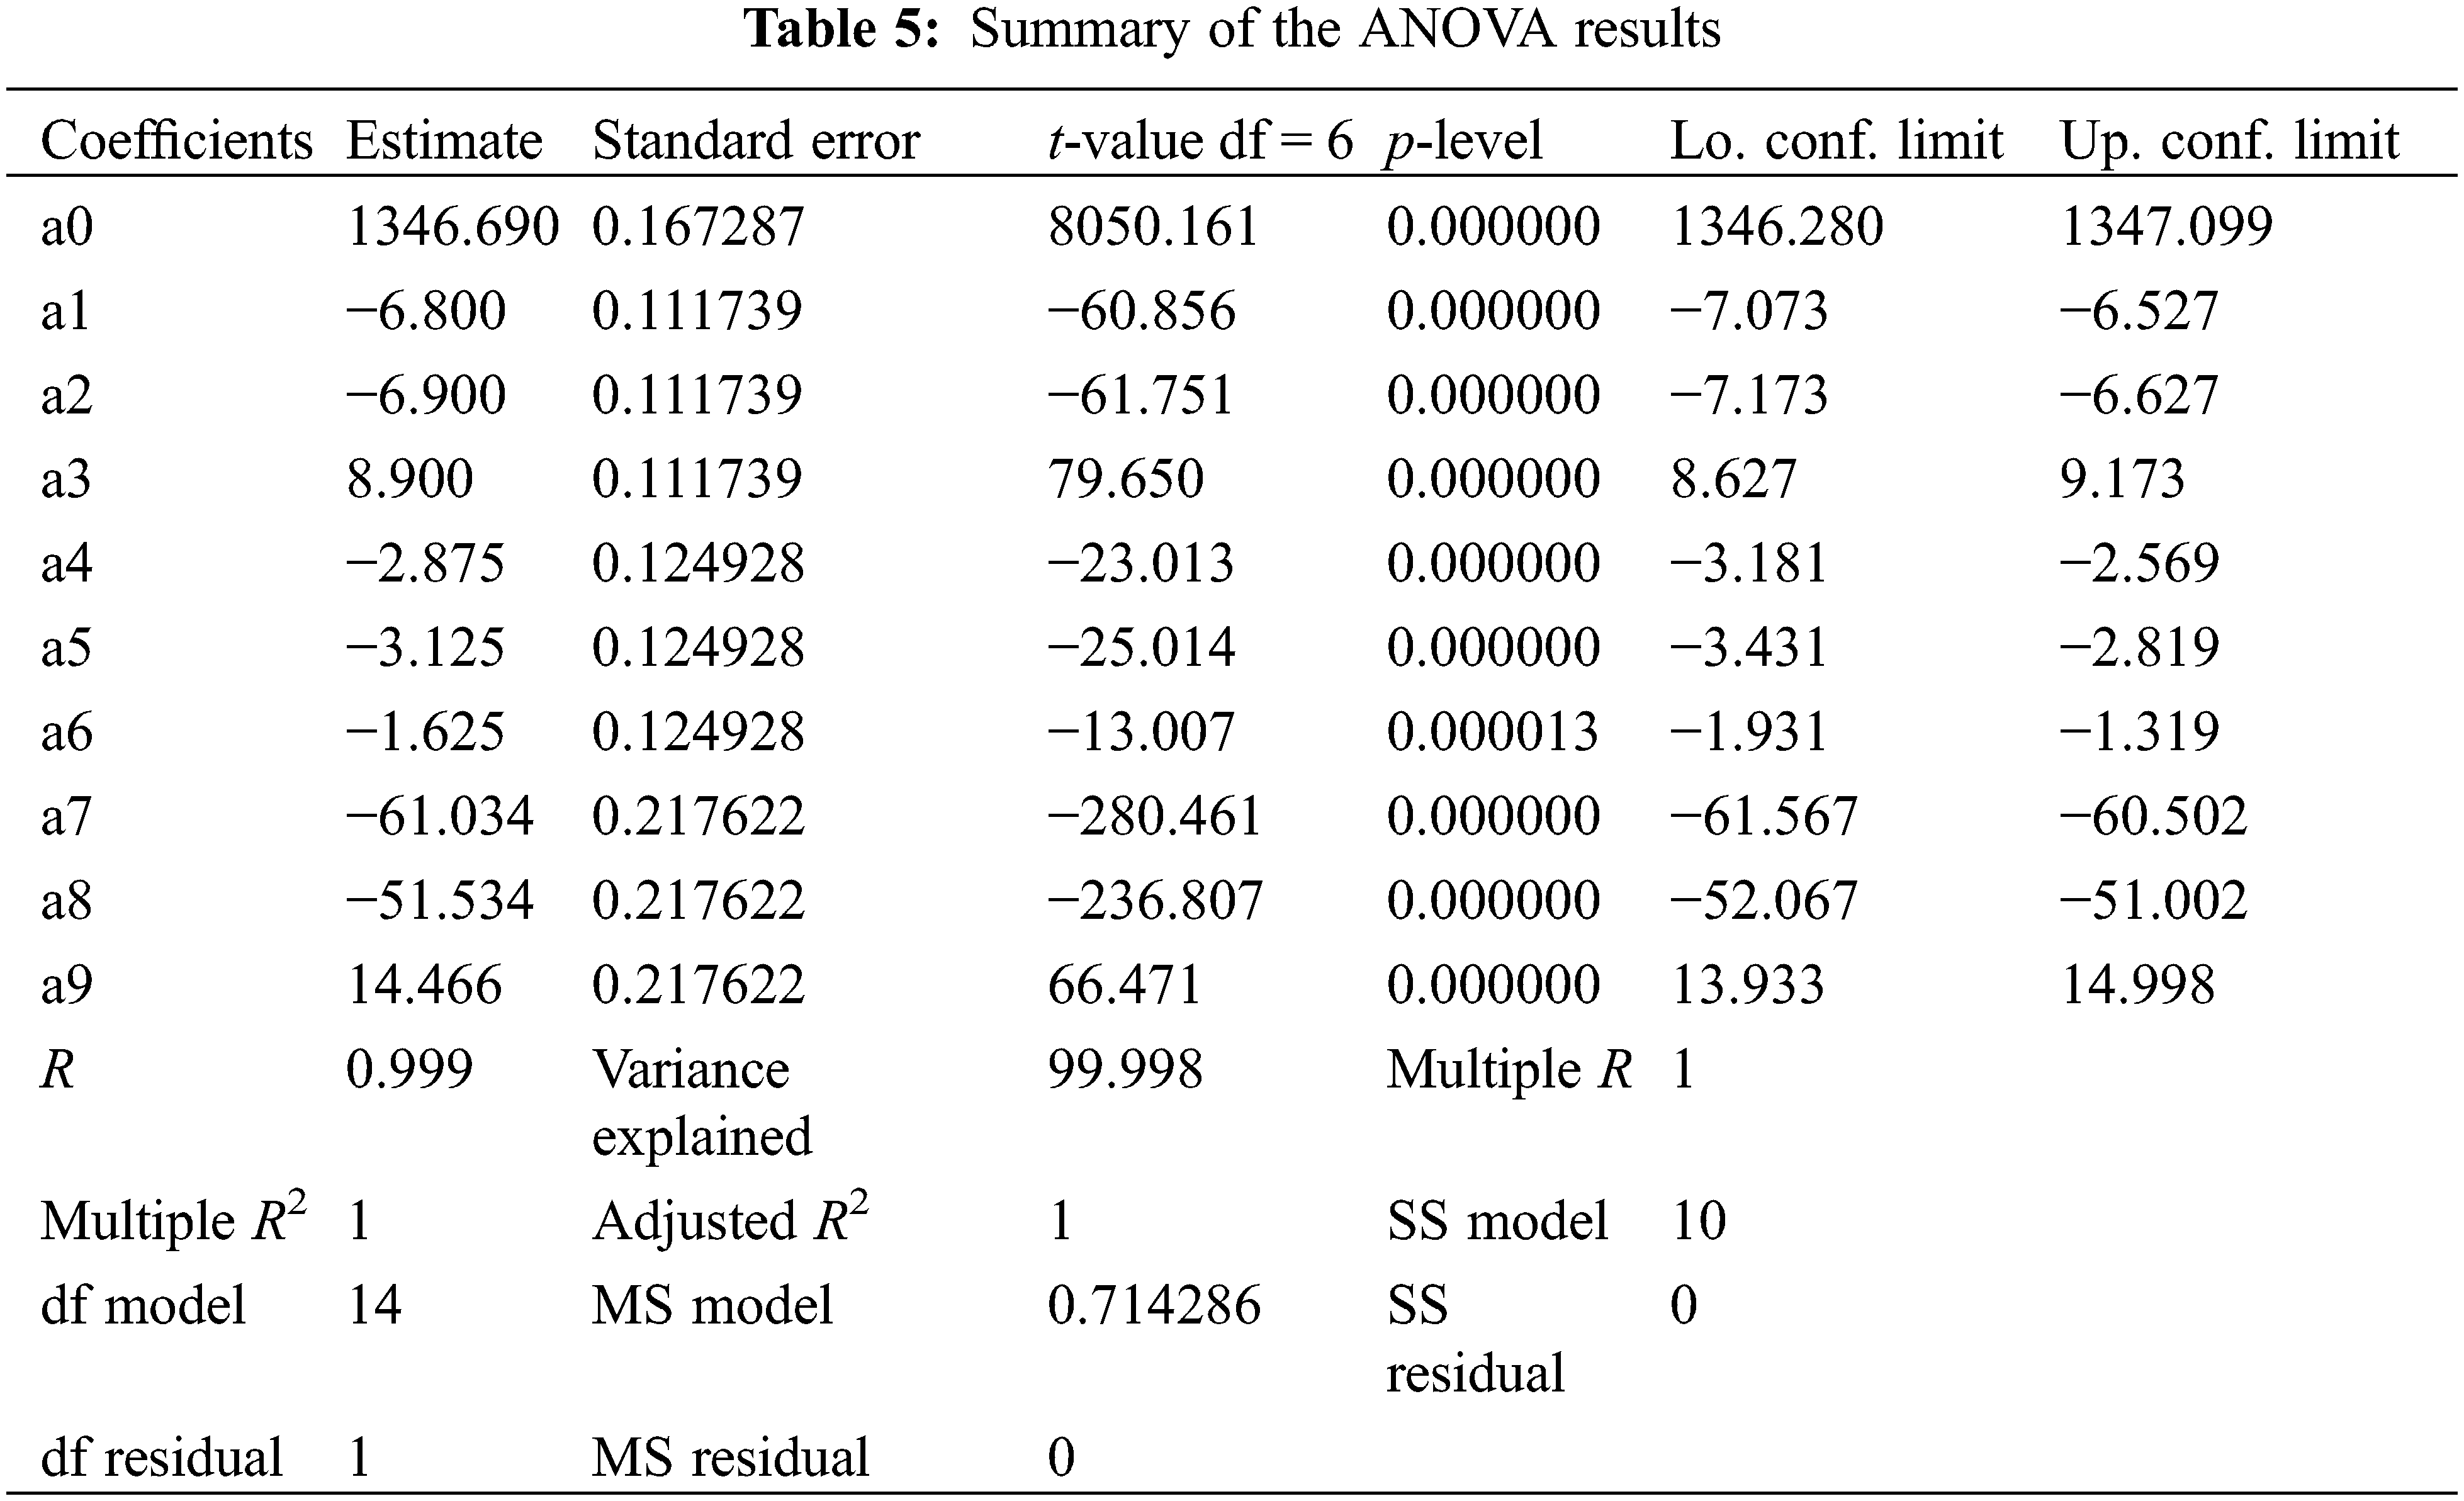
The STATISTICA version 8.0 software was used to obtain the polynomial coefficients. The values of these coefficients and analysis of variance (ANOVA) results are listed in Table 5, which are in good agreement with the experimental data. The results indicate that higher R2 values were obtained using the model than the adjusted R2 values for all of the investigated conditions. Thus, the statistical acceptance of the model was proven.
3.4 Impact of the Addition of GFs
Fig. 6A shows the impact that the addition of the GFs has on the drop in crude oil pressure under the optimal conditions according to the stimulation time and applied voltage. In the absence of the GFs, the pressure drop was 0.985 Pa. When specific amounts of the GFs were added to the system, there was a sharp increase in the pressure drop, with the lowest pressure drop of 0.683 Pa observed for 120 mg/L of GFs. The concentrations of GFs were tested, with the pressure drop observed to increase gradually at the concentrations of (0, 100, 200, and 400 mg/L). The exegesis of the positive impact of the GFs can be attributed to two factors. First, the increased dielectric constant of the GFs of around 5200 at 30 kHz had a condensing impact on the electrical field. Second, the nanoscale-sized GFs act as a flow improver, with their shape and morphology providing layers for fluid sliding and lubricant properties in addition to their dispersion as suspended particles during fluid flow. The physical basis of the enhancement in the flow rate of crude oil can be explained by the theory of liquid suspensions. The crude oil flows in straight lines according to the effect and orientation of the electric field. The adverse effects observed on the crude oil flow for GF concentrations above 120 mg/L is a result of greater doses that lump the flow rate and increase the viscosity of the oil. In addition, nanoparticles are present in the liquid that form clusters and hinder the flow of the oil. It can be concluded that the pressure drop decreases by 30.66% under optimal conditions. Fig. 6B shows the effect that the flow improvement under the influence of the GFs has on the pumping power consumption. It has been previously mentioned that the power consumption is based on the drop in pressure inside the pipe. Thus, the lowest power consumption of 17.77 W for the pumping of heavy crude oil was achieved using an optimal amount of the GFs of 120 mg/L, compared with 25.5 W in the absence of the GFs. The power consumption increased in line with an increase in the concentration of the GFs above 120 mg/L due to an increase in the value of the pressure drop.
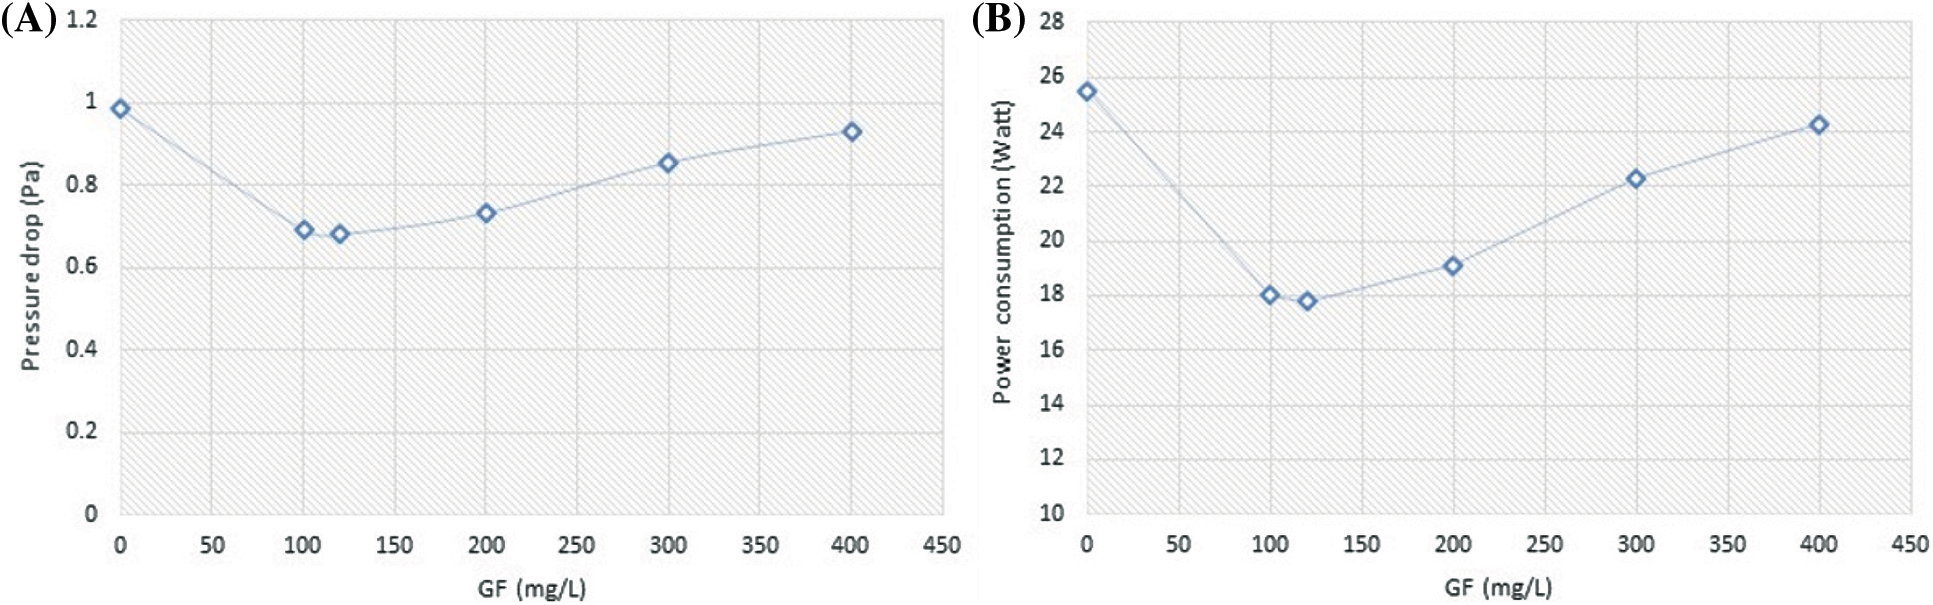
Figure 6: Effect of GF concentration on (A) at pressure drop, (B) power consumption at optimum conditions (Time = 55 s, Voltage = 150 V)
3.5 Effect of Electrical Field Intensity
Figs. 7A and 7B show that the voltage applied has a great impact on increasing the pressure drop and meeting the required power consumption. Moreover, a high voltage was observed to have an adverse effect on the values of the pressure drop and power consumed increased gradually beyond 150 V. The reason for this trend is that when crude oil is not subjected to an electric field, the nanoparticles in the oil are randomly distributed, whereas when the crude oil is exposed to an electric field, the particles suspended in the oil are polarized (polarization effects) and driven in a certain direction by the effect of the electric field [35]. The particles suspended in solution become less randomly arranged and rearrange into short chains according to the electric field lines. Strong electric fields also interact with the fluid medium in which the particles are suspended, generating forces that act on the fluid and its flow, in addition to the high dielectric constant of the suspended GF leading to a concentration of the electric field. Also, the electric field presents a great advantage since it generates an effective repulsive force between the nanoparticles, somewhat preventing their agglomeration. These results are significant as not only is the flow rate of the crude oil improved, but also turbulence is inhibited in the pipeline. These results are in accordance with those of Tao et al. [1], and Alwasiti et al. [7].
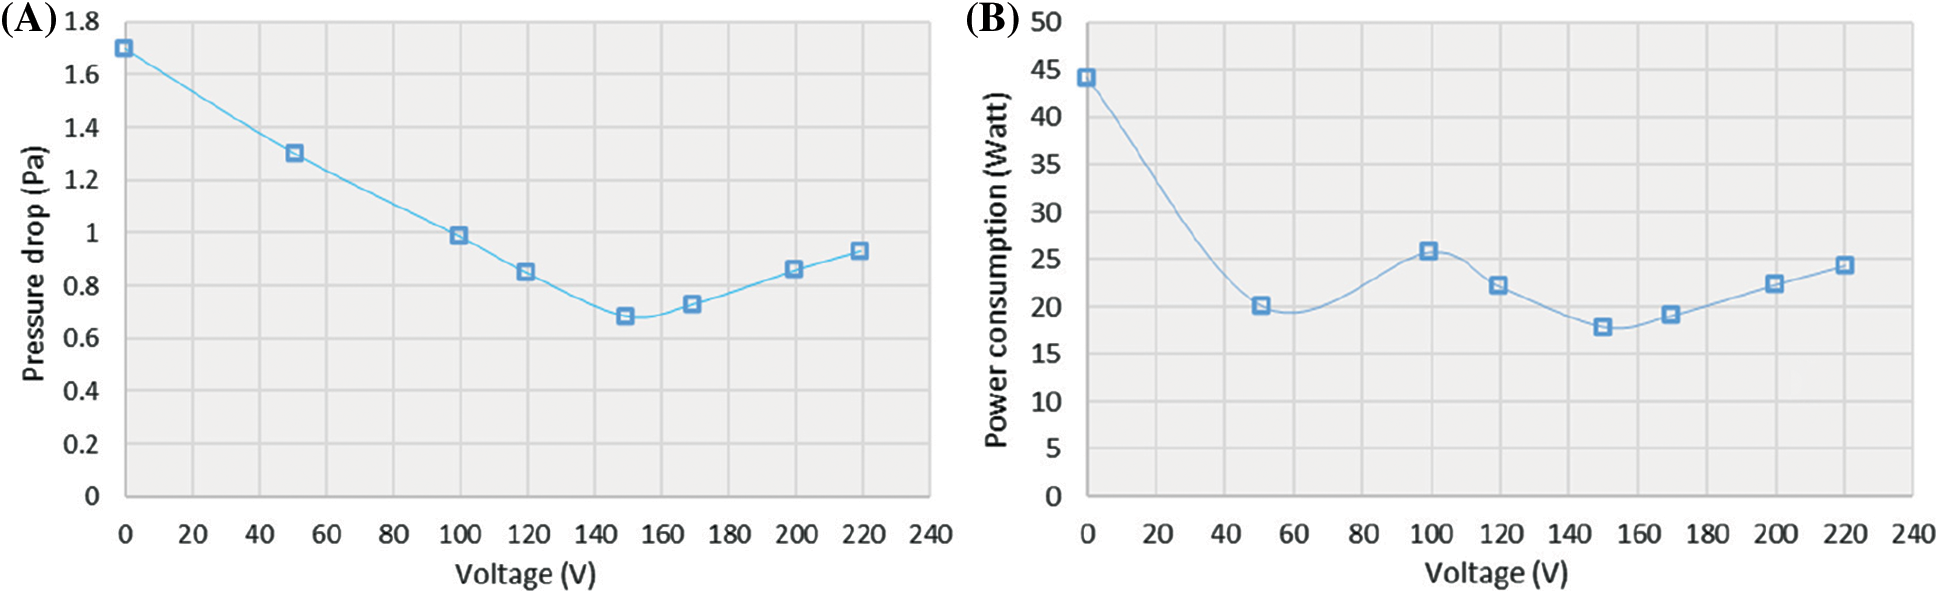
Figure 7: Effect of voltage on (A) pressure drop, (B) power consumption at optimum conditions (Time = 55 s, GF = 120 mg/L)
3.6 Effect of Stimulation Time
The stimulation time has a great effect on the impact that the electric field on the pressure drop and power consumption, where the optimal value was determined as 55 s, with the best pressure drop and lowest pumping power consumption values being 0.683 Pa and 17.77 W, respectively. When the stimulation time was far from optimal, the pressure drop and pumping power consumption values increased gradually until values of 0.8 Pa and 20.8 W were reached after 65 s, respectively. This is because over a short time period, there is not enough time for the arrangement of suspended asphalt and paraffin particles in addition to GFs, while the optimal time of 55 s represents the most effective time for the straight chains to configurate. These short chains of nanoparticles act as a lubricant to promote fluid flow. During longer test periods, the chains of short particles chains thicken and increase the viscosity of the system, leading to the agglomeration of particles and a build-up of clusters, thus resulting in increased shear stress and drag. Figs. 8A and 8B show the relationship between the stimulation time, the pressure drop, and the pumping power consumption, where the results are in accordance with those of Tao et al. [1].
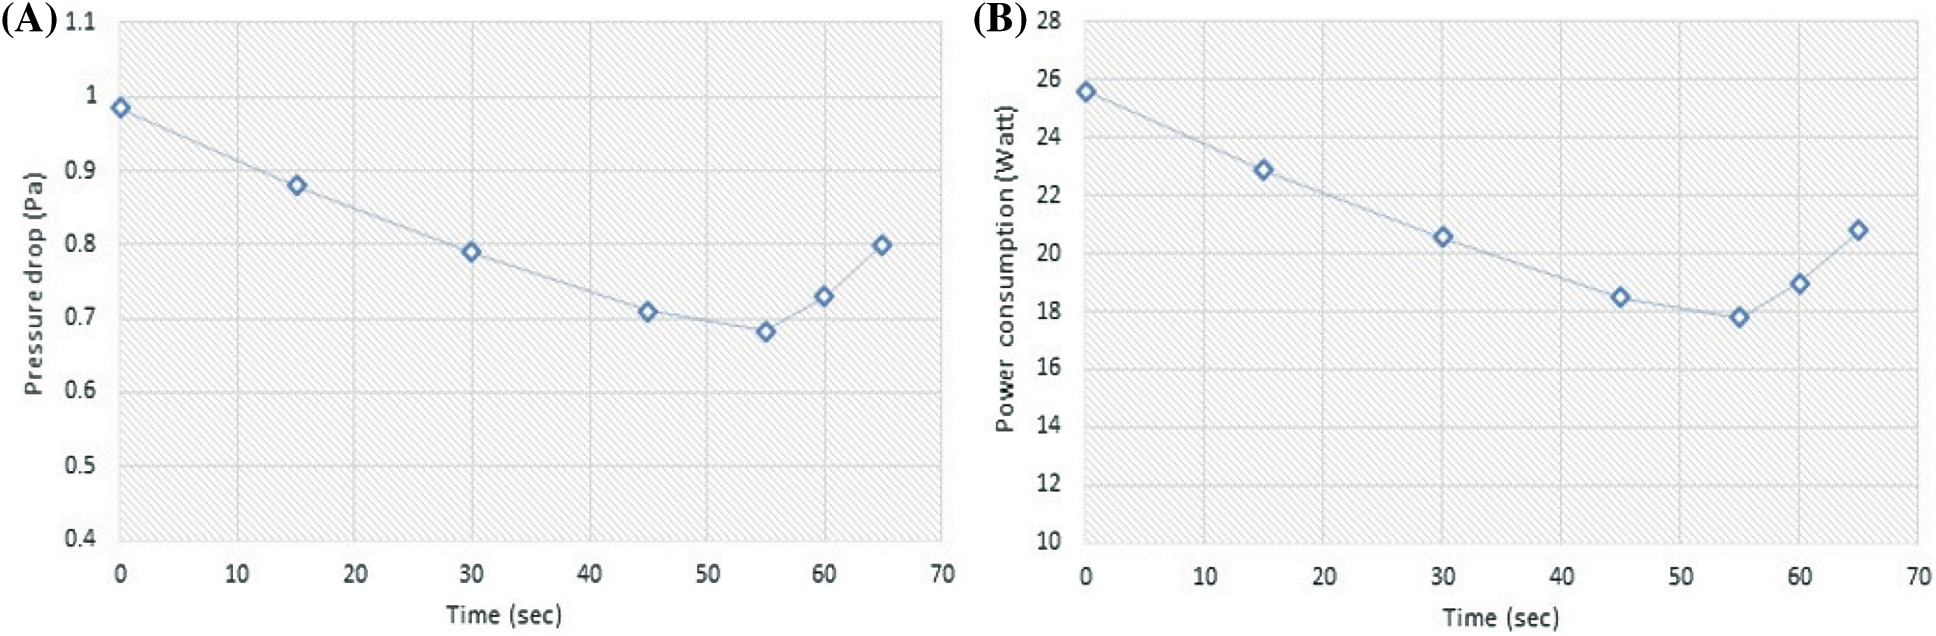
Figure 8: Effect of stimulation time on (A) pressure drop, (B) power consumption at optimum condition (GF = 120 mg/L, Voltage = 150 V)
Exfoliation is a cost-effective method for the production of graphene sheets of around 50–140 nm in size from graphite foam derived from the dehydration of sugar with a particle size of 500–600 μm. The exfoliated graphene sheets exhibit good morphology and structural characteristics, as well as featuring a considerable number of defects. The shape and position of the 2D-band of the graphene in its Raman spectrum provided evidence for the formation of thin graphene layers. Investigations on the reduction of drag in pipes through which oil flows indicated that the prepared graphene sheets are very effective as a flow improver for heavy crude oil. The presence of the graphene in the crude oil significantly enhances the efficiency of the applied electric field, consequently reducing the power required for the pumping of the oil. The experimental and optimization results showed that the lowest pressure drop value and pumping power consumption were attained under the optimal measured conditions. Overall, the results revealed that graphene is a cost-effective and environmentally friendly flow improver in the presence of an electric field compared to other chemicals and techniques used for improving the fluidity of heavy crude oil in pipelines.
Funding Statement: The authors received no specific funding for this study.
Conflicts of Interest: The authors declare that they have no conflicts of interest to report regarding the present study.
References
1. Tao, R., Tang, H. (2014). Reducing viscosity of paraffin base crude oil with electric field for oil production and transportation. Fuel, 118, 69–72. https://doi.org/10.1016/j.fuel.2013.10.056 [Google Scholar] [CrossRef]
2. Karami, H. R., Mowla, D. (2012). Investigation of the effects of various parameters on pressure drop reduction in crude oil pipelines by drag reducing agents. Journal of Non-Newtonian Fluid Mechanics, 177–178, 37–45. https://doi.org/10.1016/j.jnnfm.2012.04.001 [Google Scholar] [CrossRef]
3. Edward, O. A., Abdulbari, H. A. (2015). Drag reduction efficiency of CTABr and nanosilica particles using rotating disk apparatus (RDA). Australian Journal of Basic and Applied Sciences, 9(8), 136–144. [Google Scholar]
4. Hazlina, H., Azizi, A., Husna, A. (2014). An overview of viscosity reducers in heavy crude oil production. Perth: CHEMECA. Western Australia Paper No. 838. [Google Scholar]
5. Abdulbari, H. A., Kor, Y. K. (2011). Studying the effect of magnetic force on increasing the drag reduction performance of suspended solids on the turbulent flow in pipelines: An experimental approach. International Journal of Environmental Science and Development, 2(4), 264–267. https://doi.org/10.7763/IJESD.2011.V2.135 [Google Scholar] [CrossRef]
6. Ibrahim, R. I., Odah, M. K., Shafeeq, D. A. (2022). An overview on most effective DRAs in crude oil pipelines. Engineering and Technology Journal, 10(37), 391–397. [Google Scholar]
7. Alwasiti, A. A., Ibrahim, R. I. (2019). Improving the flowability of heavy crude oil in pipelines using prepared nanosilica: Experimental investigation and CFD simulation. Petroleum & Coal Journal, 61(6), 1455–1467. [Google Scholar]
8. Ibrahim, R. I., Odah, M. K., Shafeeq, D. A. (2020). Preparation and application of natural and low cost palm fibers as an effective drag reducing agent for flow improvement in Iraqi crude oil pipelines. Anbar Journal of Engineering Sciences, 2(8), 88–93. https://doi.org/10.37649/aengs.2020.171277 [Google Scholar] [CrossRef]
9. Al-Roomi, Y., George, R., Elgibaly, A., Elkamel, A. (2004). Use of a novel surfactant for improving the transportability/transportation of heavy/viscous crude oils. Journal of Petroleum Science and Engineering, 42(2–4), 235–243. https://doi.org/10.1016/j.petrol.2003.12.014 [Google Scholar] [CrossRef]
10. White, F. M. (2009). Fluid mechanics, 7th edition New York, USA: McGraw-Hill, a Business Unit of the McGraw-Hill Companies, Inc. [Google Scholar]
11. Deng, J., You, Y., Sahajwalla, V., Joshi, R. K. (2016). Transforming waste into carbon-based nanomaterials. Carbon, 96, 105–115. https://doi.org/10.1016/j.carbon.2015.09.033 [Google Scholar] [CrossRef]
12. Jalal, N. I., Ibrahim, R. I., Odah, M. K. (2019). Flow improvement and viscosity reduction for crude oil pipelines transportation using dilution and electrical field. Engineering and Technology Journal, 40(1), 66–75. https://doi.org/10.30684/etj.v40i1.2192 [Google Scholar] [CrossRef]
13. Tao, R., Xu, X. (2006). Reducing the viscosity of crude oil by pulsed electric or magnetic field. Energy Fuels, 20(5), 2046–2051. https://doi.org/10.1021/ef060072x [Google Scholar] [CrossRef]
14. Tao, R., Gu, G. Q. (2015). Suppressing turbulence and enhancing liquid suspension flow in pipelines with electrorheology. Physical Review, 91(1), 012304. [Google Scholar] [PubMed]
15. Terzopoulou, Z., Kyzas, G. Z., Bikiaris, D. N. (2015). Recent advances in nanocomposite materials of graphene derivatives with polysaccharides. Materials, 8(2), 652–83. https://doi.org/10.3390/ma8020652 [Google Scholar] [PubMed] [CrossRef]
16. Ibrahim, R. I., Oudah, M. K., Hassan, A. F. (2017). Viscosity reduction for flowability enhancement in Iraqi crude oil pipelines using novel capacitor and locally prepared nanosilica. Journal of Petroleum Science & Engineering, 156, 356–365. https://doi.org/10.1016/j.petrol.2017.05.028 [Google Scholar] [CrossRef]
17. Ibrahim, R. I., Oudah, M. K., Al-Mufti, A. M. (2022). An innovative graphene-supercapacitor for the treatment of crude oil viscosity at low temperatures. Journal of Petroleum Science & Engineering, 209, 109829. https://doi.org/10.1016/j.petrol.2021.109829 [Google Scholar] [CrossRef]
18. McAllister, M. J., Li, J. L., Adamson, D. H., Schniepp, H. C., Abdala, A. A. et al. (2007). Single sheet functionalized graphene oxid therm expansion graphite. Chemistry of Materials, 19(18), 4396–4404. https://doi.org/10.1021/cm0630800 [Google Scholar] [CrossRef]
19. Stankovich, S., Dikin, D. A., Piner, R. D., Kohlhaas, K. A., Kleinhammes, A. et al. (2007). Synthesis of graphene-based nanosheets via chemical reduction of exfoliated graphite oxide. Carbon, 45(7), 1558–65. https://doi.org/10.1016/j.carbon.2007.02.034 [Google Scholar] [CrossRef]
20. Lü, M., Li, J., Yang, X., Zhang, C., Yang, J. et al. (2013). Applications of graphene-based materials in environmental protection and detection. Chinese Science Bulletin, 58(22), 2698–2710. https://doi.org/10.1007/s11434-013-5887-y [Google Scholar] [CrossRef]
21. Pimenta, M. A., Dresselhaus, G., Dresselhaus, M. S., Cançado, L. G., Jorio, A. et al. (2007). Studying disorder in graphite-based systems by Raman spectroscopy. Physical Chemistry Chemical Physics, 9(11), 1276–1291. https://doi.org/10.1039/B613962K [Google Scholar] [PubMed] [CrossRef]
22. Beams, R., Cançado, L. G., Novotny, L. (2015). Raman characterization of defects and dopants in graphene. Journal of Physics: Condensed Matter, 27(8), 083002. https://doi.org/10.1088/0953-8984/27/8/083002 [Google Scholar] [PubMed] [CrossRef]
23. Wahab, H. S., Ali, S. H., Abdul-Hussein, A. M. (2015). Synthesis and characterization of graphene by Raman spectroscopy. Materials Sciences and Applications, 1(3), 130–135. [Google Scholar]
24. Zhao, W., Wu, F., Wu, H., Chen, G. (2010). Preparation colloidal dispersions graphene sheets org solvents using ball milling. Journal of Nanomaterials, 155, 1–5. [Google Scholar]
25. Fan, X., Chang, D. W., Chen, X., Baek, J., Dai, L. (2016). Functionalized graphene nanoplatelets from ball milling for energy applications. Current Opinion in Chemical Engineering, 11, 52–58. https://doi.org/10.1016/j.coche.2016.01.003 [Google Scholar] [CrossRef]
26. Kumar, G. R., Jayasankar, K., Das, S. K., Dash, T., Dash, A. et al. (2016). Shear-force-dominated dual-drive planetary ball milling for the scalable production of graphene and its electrocatalytic application with Pd nanostructures. Royal Society of Chemistry Advanced, 6(24), 20067–20073. https://doi.org/10.1039/C5RA24810H [Google Scholar] [CrossRef]
27. Singh, V., Joung, D., Zhai, L., Das, S., Khondaker, S. I. et al. (2011). Graphene based materials: Past, present and future. Progress in Materials Science, 56(8), 1178–1271. https://doi.org/10.1016/j.pmatsci.2011.03.003 [Google Scholar] [CrossRef]
28. Salman, A. D., Jani, G. H., Fatalla, A. A. (2017). Comparative study of the effect of incorporating SiO2 nano-particles on properties of polymethyl methacrylate denture bases. Biomed Pharmacol Journal, 10(3), 1525–1535. https://doi.org/10.13005/bpj [Google Scholar] [CrossRef]
29. Del Rio-Castillo, A. E., Merino, C., Díez-Barra, E., Vázquez, E. (2011). Selective suspension of single layer graphene mechano-chemically exfoliated from carbon nanofibers. Berlin, Heidelberg: Tsinghua University Press and Springer-Verlag. [Google Scholar]
30. Jeon, I. Y., Choi, H. J., Jung, S. M., Seo, J. M., Kim, M. J. et al. (2013). Large-scale production of edge-selectively functionalized graphene nanoplatelets via ball milling and their use as metal-free electrocatalysts for oxygen reduction reaction. The Journal of the American Chemical Society, 135(4), 1386–1393. https://doi.org/10.1021/ja3091643 [Google Scholar] [PubMed] [CrossRef]
31. Zhao, W., Wu, F., Wu, H., Chen, G. (2010). Preparation colloidal dispersions graphene sheets organic solvents using ball milling. Journal of Nanomater, 2010, 528235. https://doi.org/10.1155/2010/528235 [Google Scholar] [CrossRef]
32. Aparna, R., Sivakumar, N., Balakrishnan, A., Sreekumar Nair, A., Nair, S. V. et al. (2013). An effective route to produce few-layer graphene using combinatorial ball milling and strong aqueous exfoliants. The Journal of Renewable and Sustainable Energy, 5(3), 033123. https://doi.org/10.1063/1.4809794 [Google Scholar] [CrossRef]
33. Saleh, N. J., Ibrahim, R. I., Salman, A. D. (2015). Characterization of nano-silica prepared from local silica sand and its application in cement mortar using optimization technique. The Journal of Renewable and Sustainable Energy, 26(4), 1123–1133. https://doi.org/10.1016/j.apt.2015.05.008 [Google Scholar] [CrossRef]
34. Al-Sherbini, A. S., Bakr, M., Ghoneim, I., Saad, M. (2017). Exfoliation of graphene sheets via high energy wet milling of graphite in 2-ethylhexanol and kerosene. Journal of Advanced Research, 8(3), 209–215. https://doi.org/10.1016/j.jare.2017.01.004 [Google Scholar] [PubMed] [CrossRef]
35. Huang, L., Massa, L., Matta, C. F. (2014). A graphene flake under external electric fields reconstructed from field-perturbed kernels. Carbon, 76, 310–320. https://doi.org/10.1016/j.carbon.2014.04.082 [Google Scholar] [CrossRef]
Cite This Article
 Copyright © 2023 The Author(s). Published by Tech Science Press.
This work is licensed under a Creative Commons Attribution 4.0 International License , which permits unrestricted use, distribution, and reproduction in any medium, provided the original work is properly cited.
 Downloads
 Citation Tools