
 Submit a Paper
 Propose a Special lssue
 Open Access
ARTICLE
Experimental and Numerical Investigation on the Aerodynamic Characteristics of High-Speed Pantographs with Supporting Beam Wind Deflectors
1
Postgraduate Department, China Academy of Railway Sciences, Beijing, 100081, China
2
Locomotive & Car Research Institute, China Academy of Railway Sciences Corporation Limited, Beijing, 100081, China
* Corresponding Author: Shiyang Song. Email:
Fluid Dynamics & Materials Processing 2024, 20(1), 127-145. https://doi.org/10.32604/fdmp.2023.030137
Received 23 March 2023; Accepted 13 June 2023; Issue published 08 November 2023
 View Full Text
 Download PDF
Abstract
Aiming to mitigate the aerodynamic lift force imbalance between pantograph strips, which exacerbates wear and affects the current collection performance of the pantograph-catenary system, a study has been conducted to support the beam deflector optimization using a combination of experimental measurements and computational fluid dynamics (CFD) simulations. The results demonstrate that the size, position, and installation orientation of the wind deflectors significantly influence the amount of force compensation. They also indicate that the front strip deflectors should be installed downwards and the rear strip deflectors upwards, thereby forming a “π” shape. Moreover, the lift force compensation provided by the wind deflectors increases with the size of the deflector. Alternative wind compensation strategies, such as control circuits, are also discussed, putting emphasis on the pros and cons of various pantograph types and wind compensation approaches.Keywords
Nomenclature
| | Acceleration |
| | x component of measured acceleration |
| | Area |
| | Lift coefficient |
| | Frictional force |
| | Aerodynamic lift force |
| | Pantograph impact force |
| | Pantograph static lift force |
| | x component of measured force |
| | Gravitational coefficient |
| | Fluid density |
| | Fluid pressure |
| | Stress tensor |
| | Coefficient of friction |
| | Turbulent viscosity |
| | Fluid dynamic viscosity |
The double-strip pantograph is a widely used type of pantograph for high-speed rail, with two carbon strips that are in contact with the overhead cables to deliver power to the locomotives. Despite the expectation of uniform contact force across each strip, achieving this is challenging due to complex aerodynamic effects. This leads to two issues that can impact the performance and longevity of the pantograph:
(1) Mechanically, a strip experiencing greater contact force experiences greater wear during its service life. This is because, based on Coulomb’s law of friction, the frictional force is equal to the normal force multiplied by the coefficient of friction (see Eq. (1)). The two strips are expected to have the same coefficient of friction, but the one with a stronger aerodynamic lift force constantly works with more friction and wears out at a faster rate.
where
(2) Electrically, contact impedance depends on how well the two surfaces make contact. Weaker contacts have lower resistance, resulting in more current passing through them. When the force is insufficient to keep the strips in contact with the overhead electrical cables, arcing may occur and cause damage to the pantograph-catenary system.
To mitigate the identified issues, wind deflectors are used to balance the aerodynamic forces acting on the pantograph. However, most studies have primarily addressed the general aerodynamics of pantographs. For instance, Pombo et al. [1] proposed a model to study aerodynamic forces on the pantograph-catenary system and found that wind loads tend to cause an increase in contact forces. AbdelGawad et al. [2] examined the aerodynamic noise of high-speed pantographs in different operating conditions and concluded that using elliptic-edge cross-section bars may reduce aerodynamic noise at the pantograph head. Li et al. [3] analyzed the pantograph aerodynamic noise distribution and discovered that airflow leads to amplification in sound pressure levels in the knuckle-upstream direction and attenuation in the knuckle-downstream direction. Tan et al. [4] investigated the aerodynamic noises of pantographs due to different pantograph angles and determined that near-field aerodynamic noises on the longitudinal symmetrical plane of pantographs are distributed at the lower arm, middle hinge joints, and bases. Yan et al. [5] explored the distribution of aerodynamic drag forces of high-speed pantographs with CFD simulation and established that the pressure drag of the strip and base contributes the most to aerodynamic drag forces. Cheng et al. [6] focused on the effects of tunnel buffer structures on the aerodynamic forces of high-speed pantographs and noted that both aerodynamic lift and drag fluctuations are decreased at the entrance and exit of tunnels with bell mouth or side-opening buffer structures. Dai et al. [7] analyzed the effect of the diameters of upper and lower arms on the aerodynamic lift force of high-speed pantographs and pointed out the relationship between changes in size of different arms and the aerodynamic lift force change in high-speed pantographs. Watroba [8] proposed a numerical model using ANSYS CFX to calculate the aerodynamic forces exerted on the pantograph and found that the drag coefficient at a working height of 3000 mm is approximately 118% higher than at 1000 mm. Vo-Van et al. [9] incorporated aerodynamic forces into the pantograph-catenary dynamic simulation and revealed that aerodynamic irregularities only affect the mean contact force. Shaltout et al. [10] explored the aerodynamic noise of a high-speed pantograph under various operational conditions and suggested that the employment of an elliptic cross-section leads to a 23.1% decrease in the acoustic sound pressure when the pantograph operates at 250 km/h. Mitsumoji et al. [11] applied a flow control method to mitigate the aerodynamic noise generated by a pantograph panhead and showed that the air suction near the separation point minimizes the narrow band aerodynamic noise originating from the panhead. Siano et al. [12] undertook an aerodynamic and aeroacoustics analysis of a high-speed pantograph model to reduce aerodynamic noise and discussed the possibility to develop a new design of the pantograph for high-speed trains. Ikeda et al. [13] considered a low-noise pantograph characterized by its few components with smooth forms and verified that the aerodynamic noise was reduced through wind tunnel and line tests. Collina et al. [14] presented an active control method for high-speed pantographs and validated the viability of the presented control scheme through numerical simulation. Kim et al. [15] evaluated the influence of cavity flow control on the aerodynamic noise of high-speed pantographs and concluded that noise radiated from the sides and the top can be significantly reduced by rounding the cavity edges.
Some studies have specifically targeted double-strip pantographs, such as Li et al. [16], who studied the aerodynamic noise characteristics of high-speed pantographs with strip spacing ranging from 0 to 540 mm; Dai et al. [17], who analyzed the aerodynamic performance of high-speed pantographs with strip spacing between 100 and 700 mm; Dai et al. [18], who performed a numerical study on the aerodynamic performance of four different head shapes of pantographs; and Shi et al. [19], who conducted a numerical analysis on the aerodynamic noise generated by a simplified double-strip pantograph. However, these studies mainly focused on strip spacing, head shapes, and aerodynamic noise characteristics.
In contrast, research specifically targeting wind deflectors has been limited. Dai et al. [20] investigated the baffle angles of crossbar-mounted wind deflectors for optimal aerodynamic performance, but the type of wind deflectors, supporting beam deflectors, has not been thoroughly studied (Supporting beam deflectors can balance the force difference between the two strips, while crossbar deflectors are used for reducing aerodynamic lift when the pantograph travels in the knuckle-downstream direction (Maaß [21])). Furthermore, while some studies have addressed the aerodynamics of pantographs in general, there is a lack of research focusing on the optimization of supporting beam wind deflectors to balance the force difference between the two strips of double-strip pantographs.
As shown in Fig. 1, six independent deflectors are equipped on a double-strip pantograph, four located underneath the supporting beams (Nos. 1, 3, 4, 6) and two under the crossbar (Nos. 2 and 5).
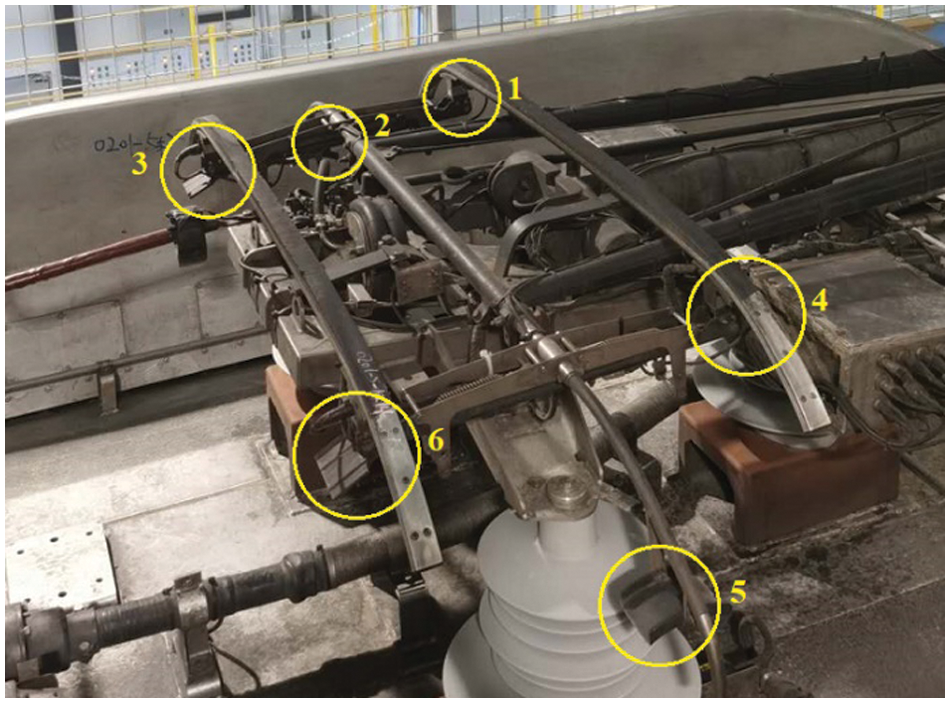
Figure 1: Locations of wind deflectors
Wind deflectors Nos. 3, 5, and 6 are visible in the photo, while the other three are obscured from view. A close-up shot is shown in Fig. 2.
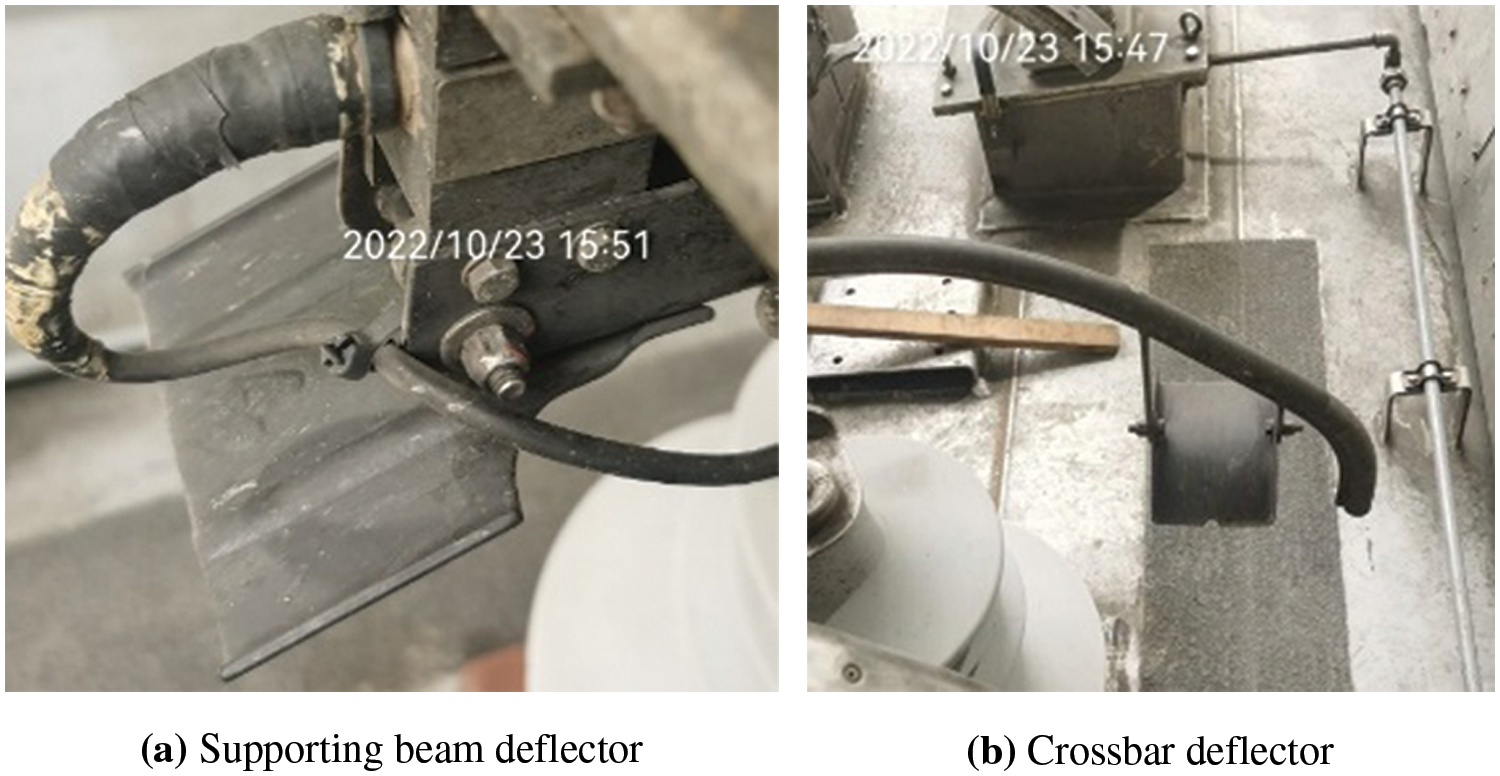
Figure 2: Two different types of wind deflectors
Some pantograph models may have additional or fewer deflectors. For example, the DSA380 has only two supporting beam deflectors instead of four. Older models may have an additional center wind adjuster, but it has become obsolete in the later models and is therefore not included in this study.
This study specifically focuses on the aerodynamic performance of the supporting beam deflectors during the knuckle-upstream direction travel, as high-speed trains use the rear pantograph more frequently for operation (illustrated in Fig. 3). The purpose of this study is to investigate the aerodynamic performance of the supporting beam deflectors and optimize their design to reduce the force difference between the two strips and improve the longevity and performance of the double-strip pantograph.
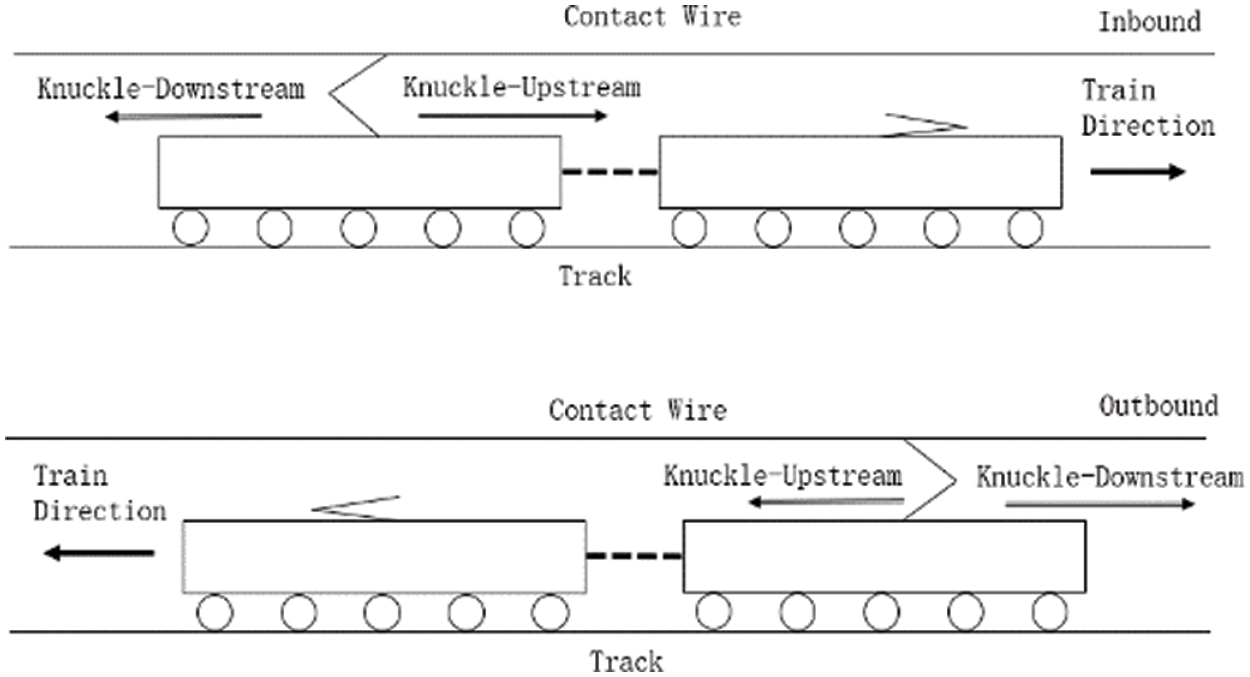
Figure 3: Operating direction
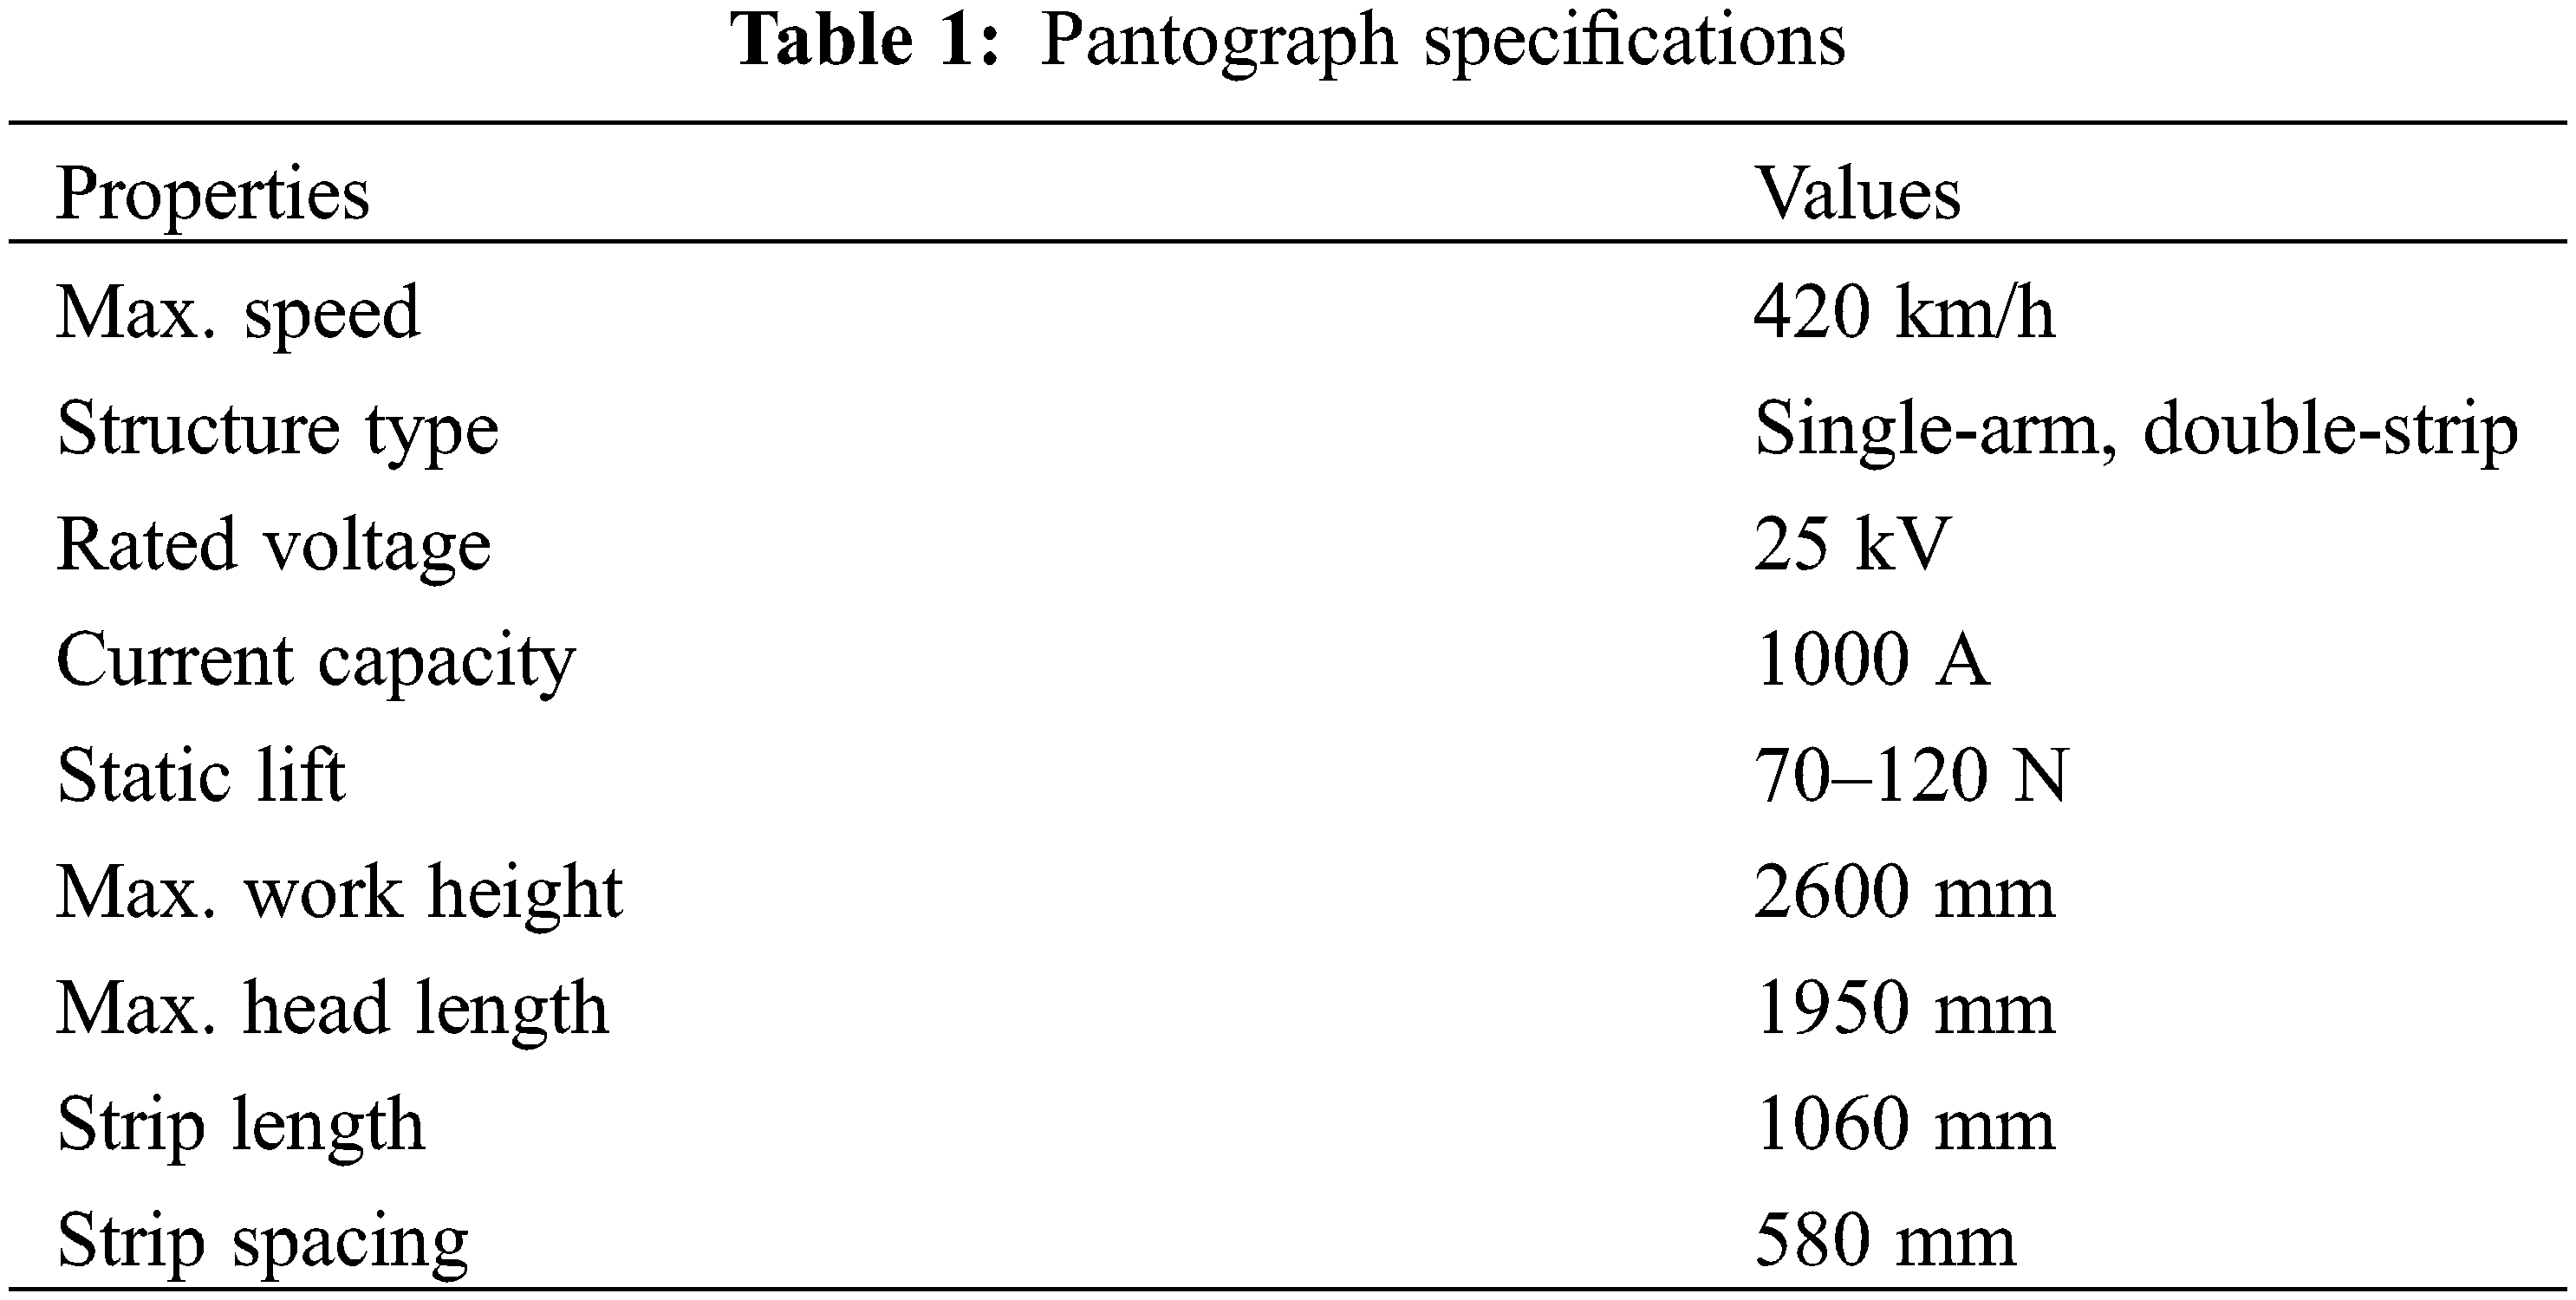
To carry out the experimental investigation, the wind deflectors were initially removed from the supporting beams. A specific pantograph model featuring a single-arm double-strip structure was used, rated voltage of 25 kV, current capacity of 1000 A, static lift force ranging from 70 to 120 N, and other relevant specifications as detailed in Table 1.
Four pressure sensors were installed, one at each end of the supporting beam, as shown in Fig. 4, to measure the total force acting on each strip. Four accelerometers were also installed next to the pressure sensors for measurement of acceleration. The use of accelerometers was deemed necessary to account for the impact force caused by vibration in addition to the aerodynamic force and static lift of the pantograph. This vibration can be harmonic or irregular, resulting from contact wire irregularities, such as hard spots.
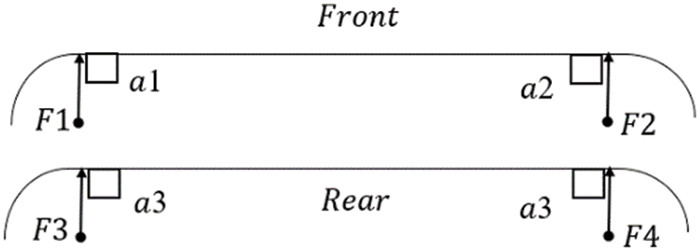
Figure 4: Sensors and accelerometer placement layout
The aerodynamic force was mathematically calculated using Newton’s second law and the measured accelerations, with the static lift force being known.
where
where
The signal processing schematic is shown in Fig. 5.

Figure 5: Data collection system schematics
The experiment was conducted as a full-scale test on an ordinary operating train on a regular operating line between two cities, covering 146.6 km. Sensors were installed on the rear pantograph, which was elevated to its standard operating height during the experiment. The train started from a standstill (0 km/h) and accelerated to a target maximum speed of 350 km/h. Measurements were taken continuously, beginning when the train was at rest and continuing throughout the trip. This real-world test setup was chosen over a wind tunnel experiment to account for the various operational factors and conditions that the pantograph would encounter during its normal use.
The results of the experiment showed that the force acting on the front strip was noticeably higher than the rear strip, as shown in Fig. 6. The test was repeated multiple times on different lines, all of which resulted in similar outcomes.

Figure 6: Measurements without deflectors
Subsequently, the wind deflectors were mounted back on, and with the assistance of support technicians sent by the pantograph manufacturer, the position of the deflector was finely tuned for optimal performance. As shown in Fig. 7, the discrepancy in force between the two strips was significantly reduced.

Figure 7: Measurements with deflectors
To further investigate the performance of the wind deflectors, numerical simulations were conducted using the commercial software ANSYS Fluent. The geometry of the pantograph was modeled based on the specifications listed in Table 1. The computational domain was set up with a length of 50 m, a width of 15 m, and a height of 7.5 m. The pantograph was placed at the center of the domain, with a strip spacing set at 580 mm. The computational domain’s inlet was designated as the velocity inlet boundary, with the input flow velocity specified. The outlet of the domain was established as the pressure outlet boundary with a static pressure of 0. The top and both sides of the domain were defined as symmetric boundary conditions, while the pantograph surface and the bottom of the computational domain were assigned as no-slip boundaries. Given that the maximum flow velocity in this investigation does not exceed a Mach number of 0.3, the fluid is assumed to be incompressible.
The setup is illustrated in Fig. 8.
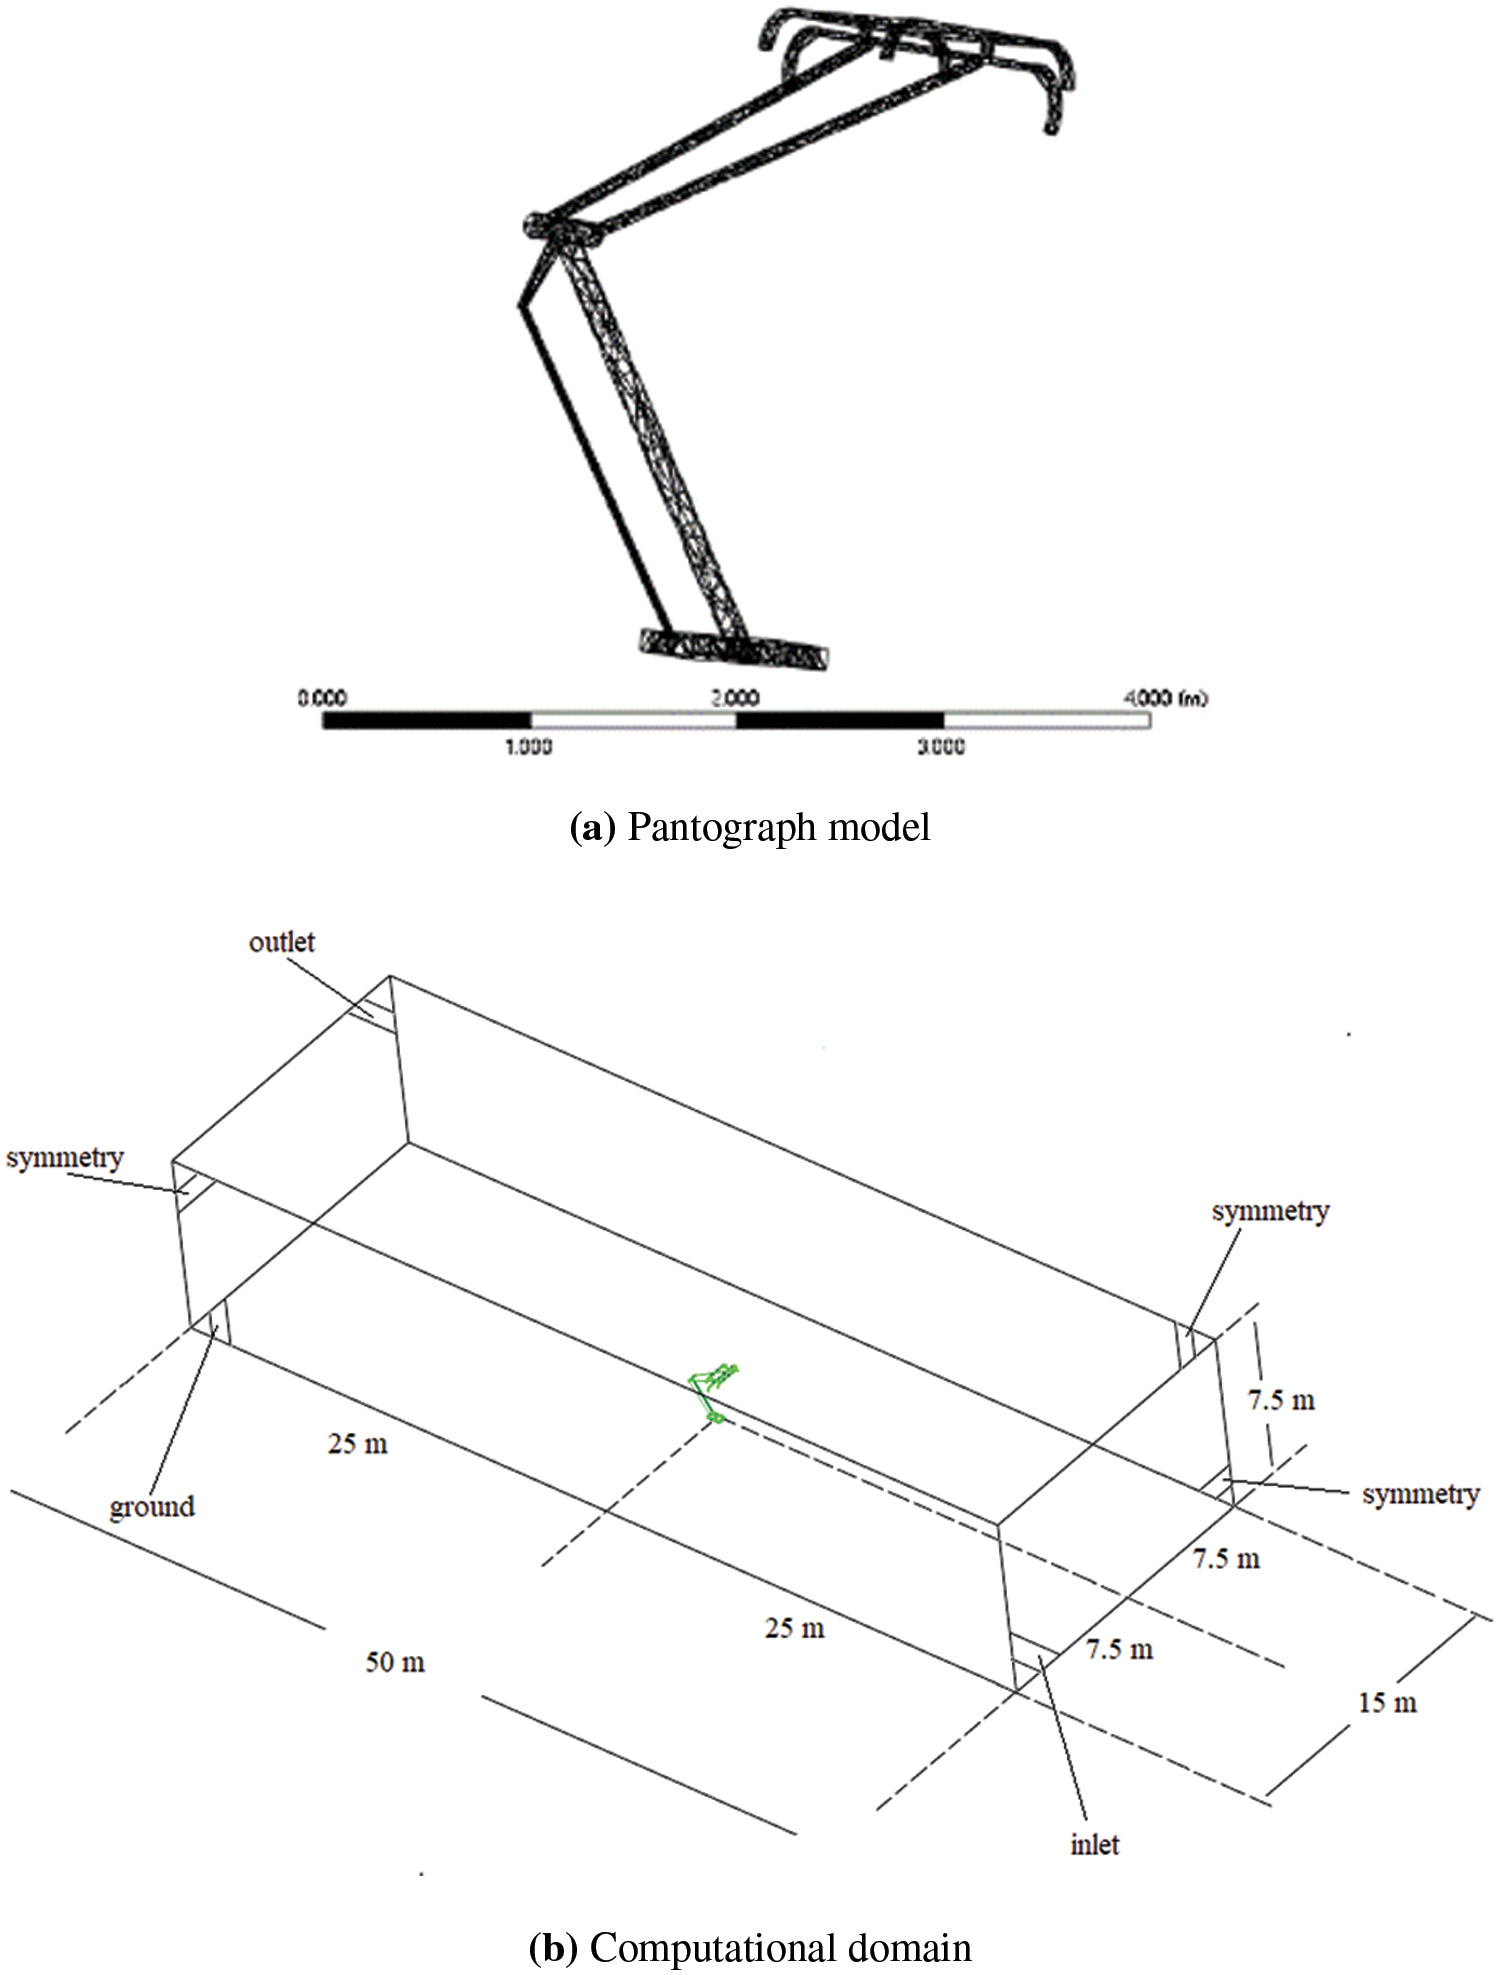
Figure 8: Simulation setup
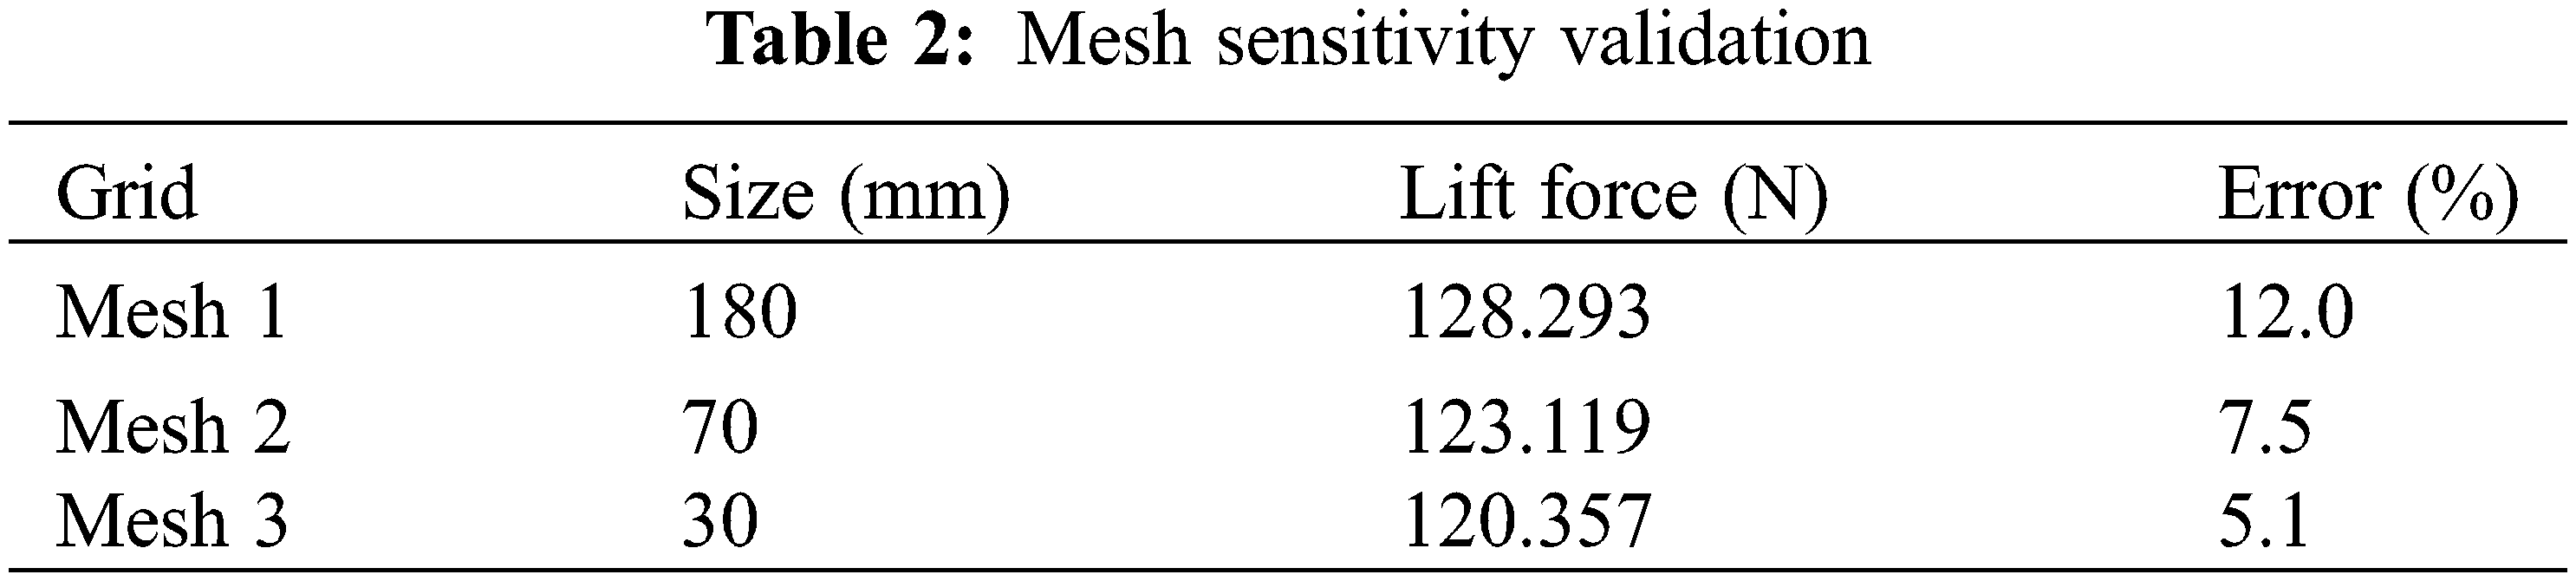
The grid size was set at 30 mm, resulting in 2.96 million nodes and 2.12 million meshing elements. The boundary layer was set at 15 with a growth rate of 1.2, as illustrated in Fig. 9. The grid size of 180 and 70 mm were less accurate, with 0.71 million nodes and 0.59 million meshing elements, and 1.61 million nodes and 1.16 million meshing elements, respectively. Table 2 presents the overall lift force values for the pantograph without supporting beam wind deflectors at a speed of 350 km/h, derived from three distinct grid sizes. The percentage error was determined by comparing these values against the experimental data, which corresponds to the statistical average of measurements taken at the same speed (114.550 N for 350 km/h).

Figure 9: Meshing illustration
The choice of a turbulence model plays a crucial role in the accuracy of the simulation results. Among the most used models in pantograph aerodynamic studies are the k-ε model and the SST k-ω model. The k-ε model has been used in several studies, such as Bocciolone et al. [22], Song et al. [23], Li et al. [24], Li et al. [25], and Arsenea et al. [26]. It is a well-established model that is based on the transport equations for turbulence kinetic energy and its dissipation rate. Another popular model is the SST k-ω model, which has been employed in studies such as Dai et al. [27], Zhang et al. [28], Carnevale et al. [29], Tan et al. [30], Sun et al. [31], Brambilla et al. [32], Kim et al. [33], and Raz et al. [34]. This model is a modified version of the original k-ω model, in which a cross-diffusion expansion is added at the end of the equation using a multiplication factor. This allows the turbulence model to switch between acting as the k-ε model or the original k-ω model for calculations involving flows with a large adverse pressure gradient.
In this study, the SST k-ω model was implemented due to its accuracy and wide application in the field of pantograph aerodynamics. The governing equations are shown below.
Mass equation for an incompressible fluid:
Momentum equation for an incompressible fluid:
The SST k-ω model equation:
where
The Semi-Implicit Method for Pressure Linked Equations (SIMPLE) approach was selected for the pressure-velocity coupling. The spatial discretization of the momentum, turbulent kinetic energy, and specific dissipation rate equations employed a second-order upwind scheme. Transient simulations were initially conducted to provide the initial field for the convergent steady-state results. A second-order implicit scheme was chosen for temporal discretization, providing better accuracy for transient simulations than first-order schemes. The time step size was set at 10−4 s, maintaining the Courant-Friedrichs-Lewy number below 1 to ensure numerical convergence within each time step.
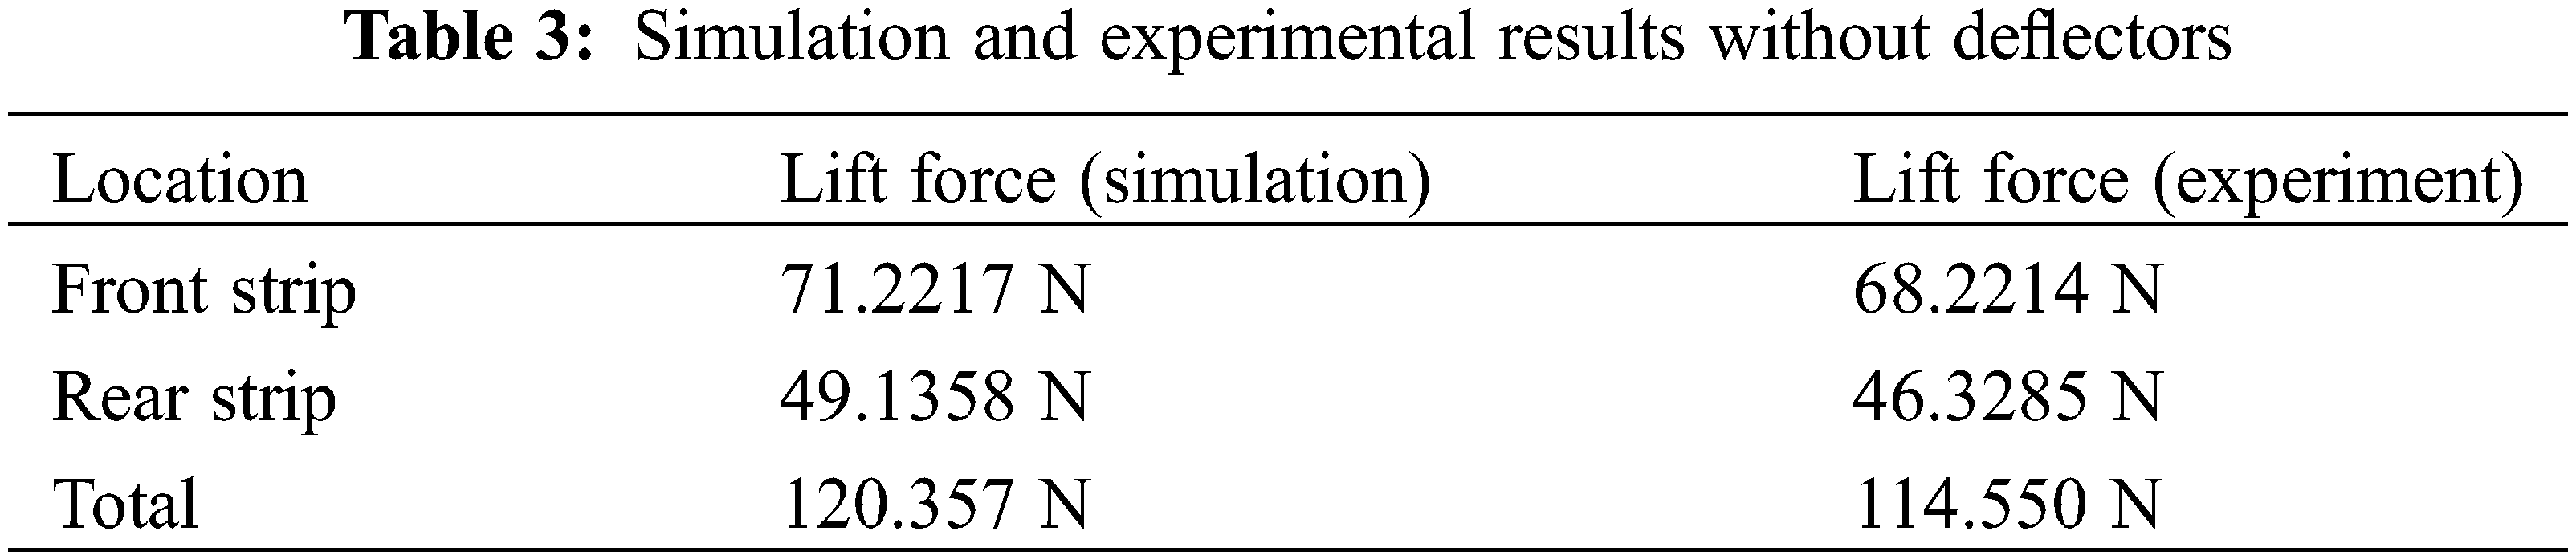
Table 3 shows the simulated results at a flow speed of 350 km/h, along with the experimental results, which correspond to the statistical average of measurements taken at the same speed.
The velocity contour plots depicted in Fig. 10 demonstrate a notable difference in speed between the front and rear strips, with the former exhibiting a higher velocity. This phenomenon can be attributed to the occurrence of boundary layer separation, which involves the detachment of the boundary layer from the surface, subsequently forming a wake. The separation arises due to an adverse pressure gradient, leading to a decrease in kinetic energy within the boundary layer and ultimately causing it to separate from the surface.
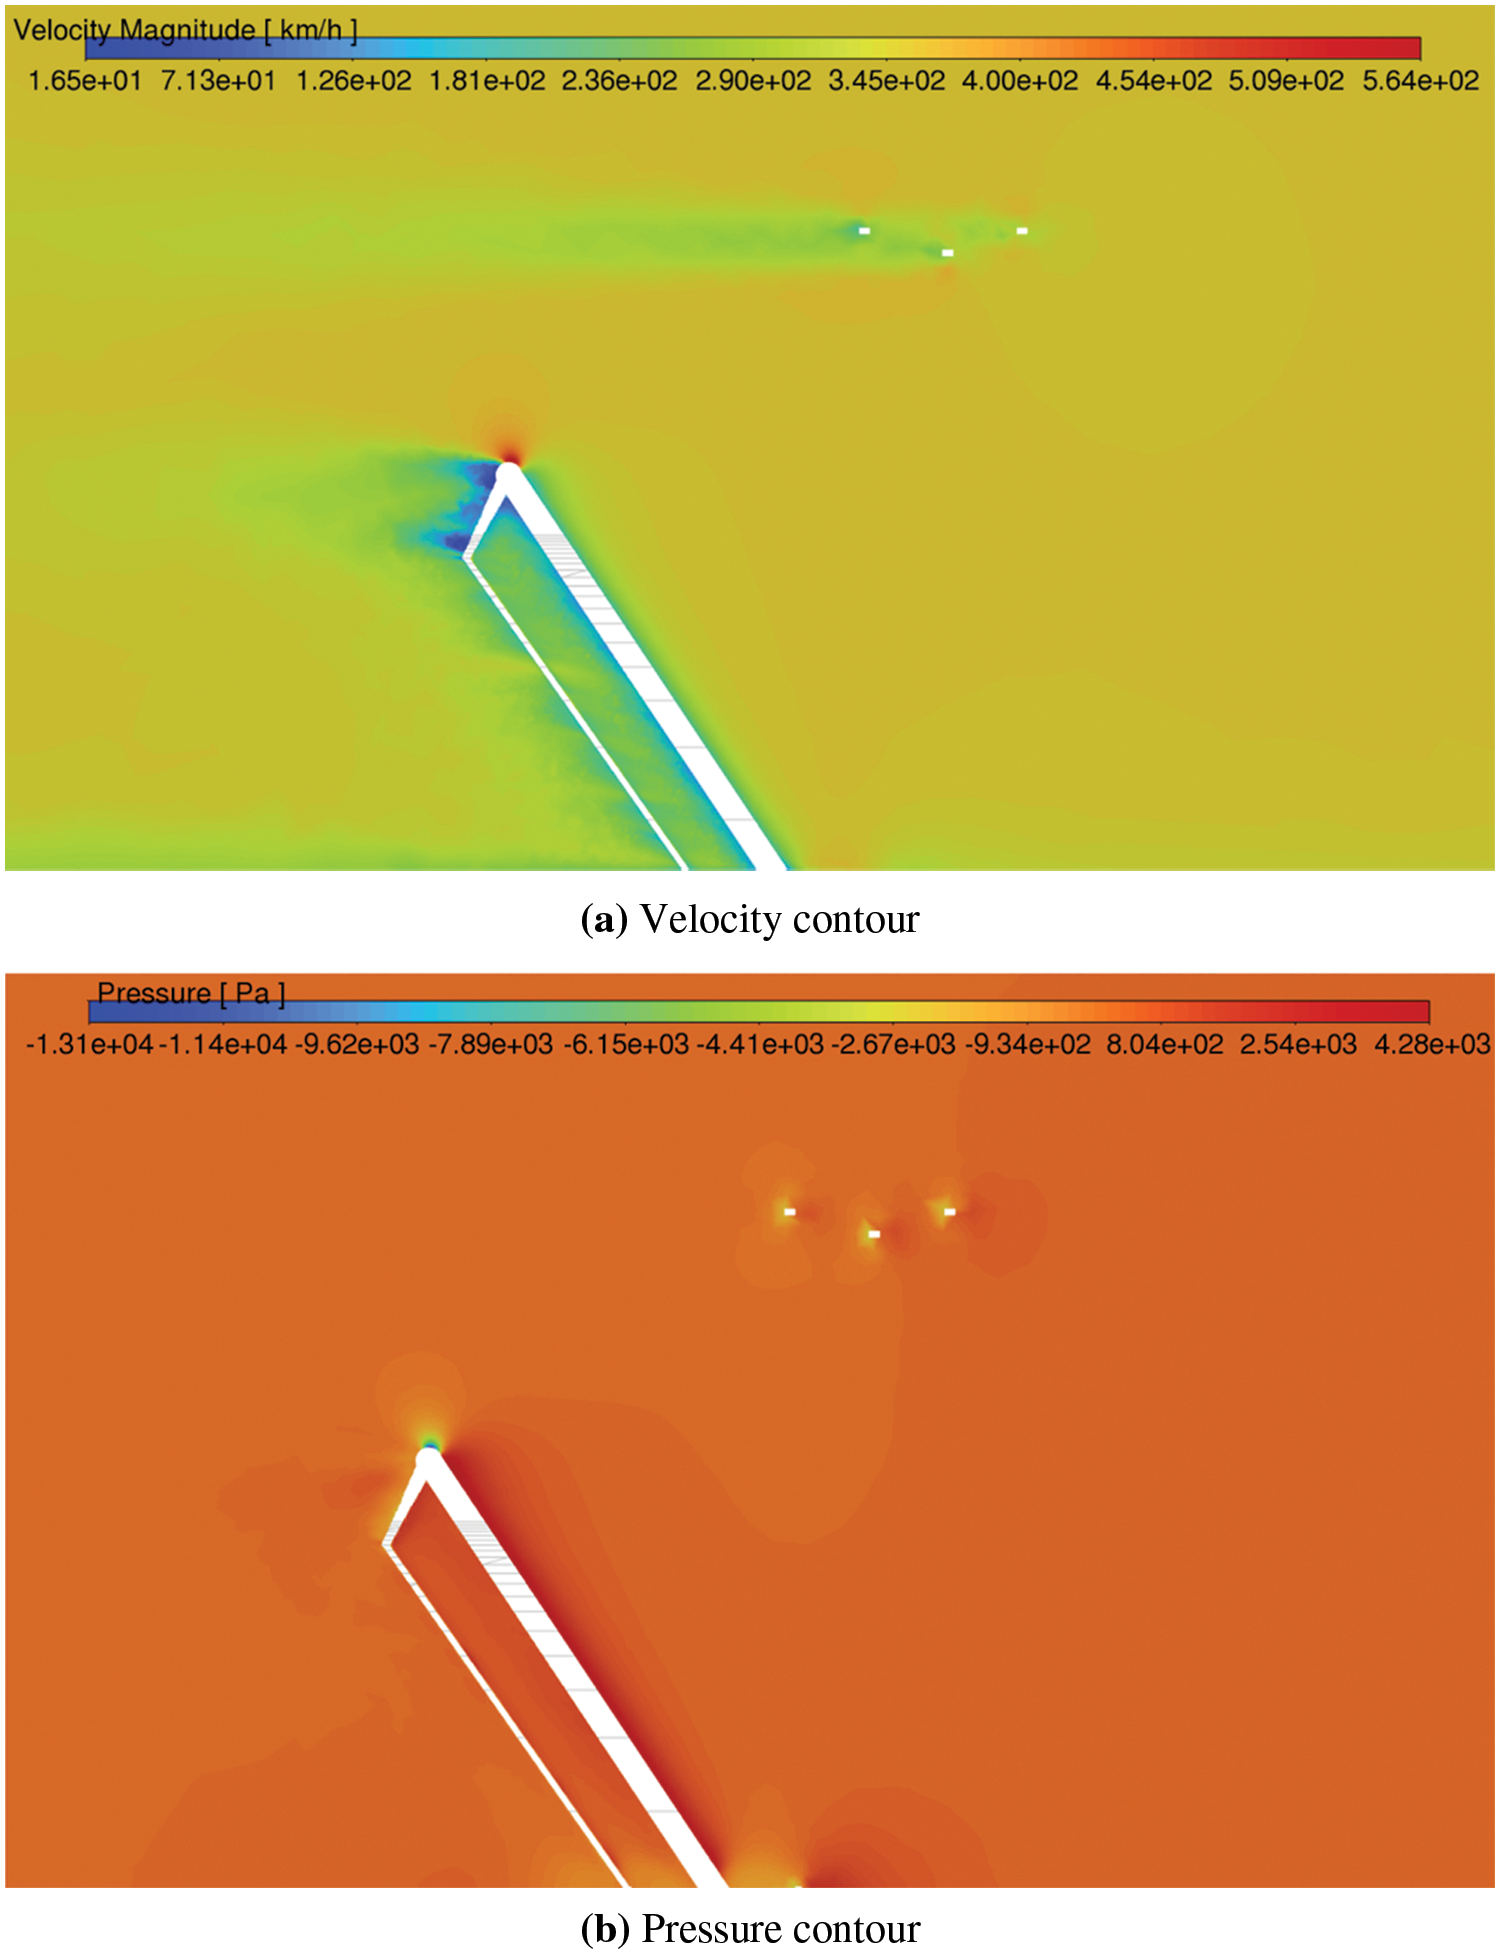
Figure 10: Contour plots without deflectors
The presence of a reverse flow within the separation zone frequently generates an airflow vortex, contributing to the increased speed of the front strip in comparison to the rear strip. This concept is similarly applicable to the observed increase in velocity at the juncture of the upper and lower arms.
As delineated in Eq. (12), the aerodynamic lift force is directly proportional to the square of the flow velocity. Therefore, the higher speed at the front strip indicates a greater value of lift, which can result in uneven force distribution across the strips. Similarly, the pressure at the front strip is also higher than at the rear strip.
where
Next, in the CFD model, wind deflectors were added based on the recommended position by the manufacturers (see Fig. 11). The computational domain and other parameters remained unchanged.

Figure 11: Deflector model
The new simulation results are presented in Table 4 and indicate that the wind deflectors caused a decrease in the force compensation at the front strip, while increasing it at the rear strip. The total lift force remained slightly lower than in the previous simulation without the deflectors. The experimental outcomes are included as well to facilitate a comparison between the two sets of results.

The corresponding contour plots in Fig. 12 demonstrate a more balanced velocity and pressure distribution between the two strips with the wind deflectors installed. The velocity contour plot in Fig. 12a shows a reduced velocity differential between the front and rear strips, indicating that the wind deflectors helped to mitigate the airflow separation issue observed in the previous simulation. Similarly, the pressure contour plot in Fig. 12b shows a more uniform pressure distribution across the strips with the deflectors, indicating a more effective flow control.
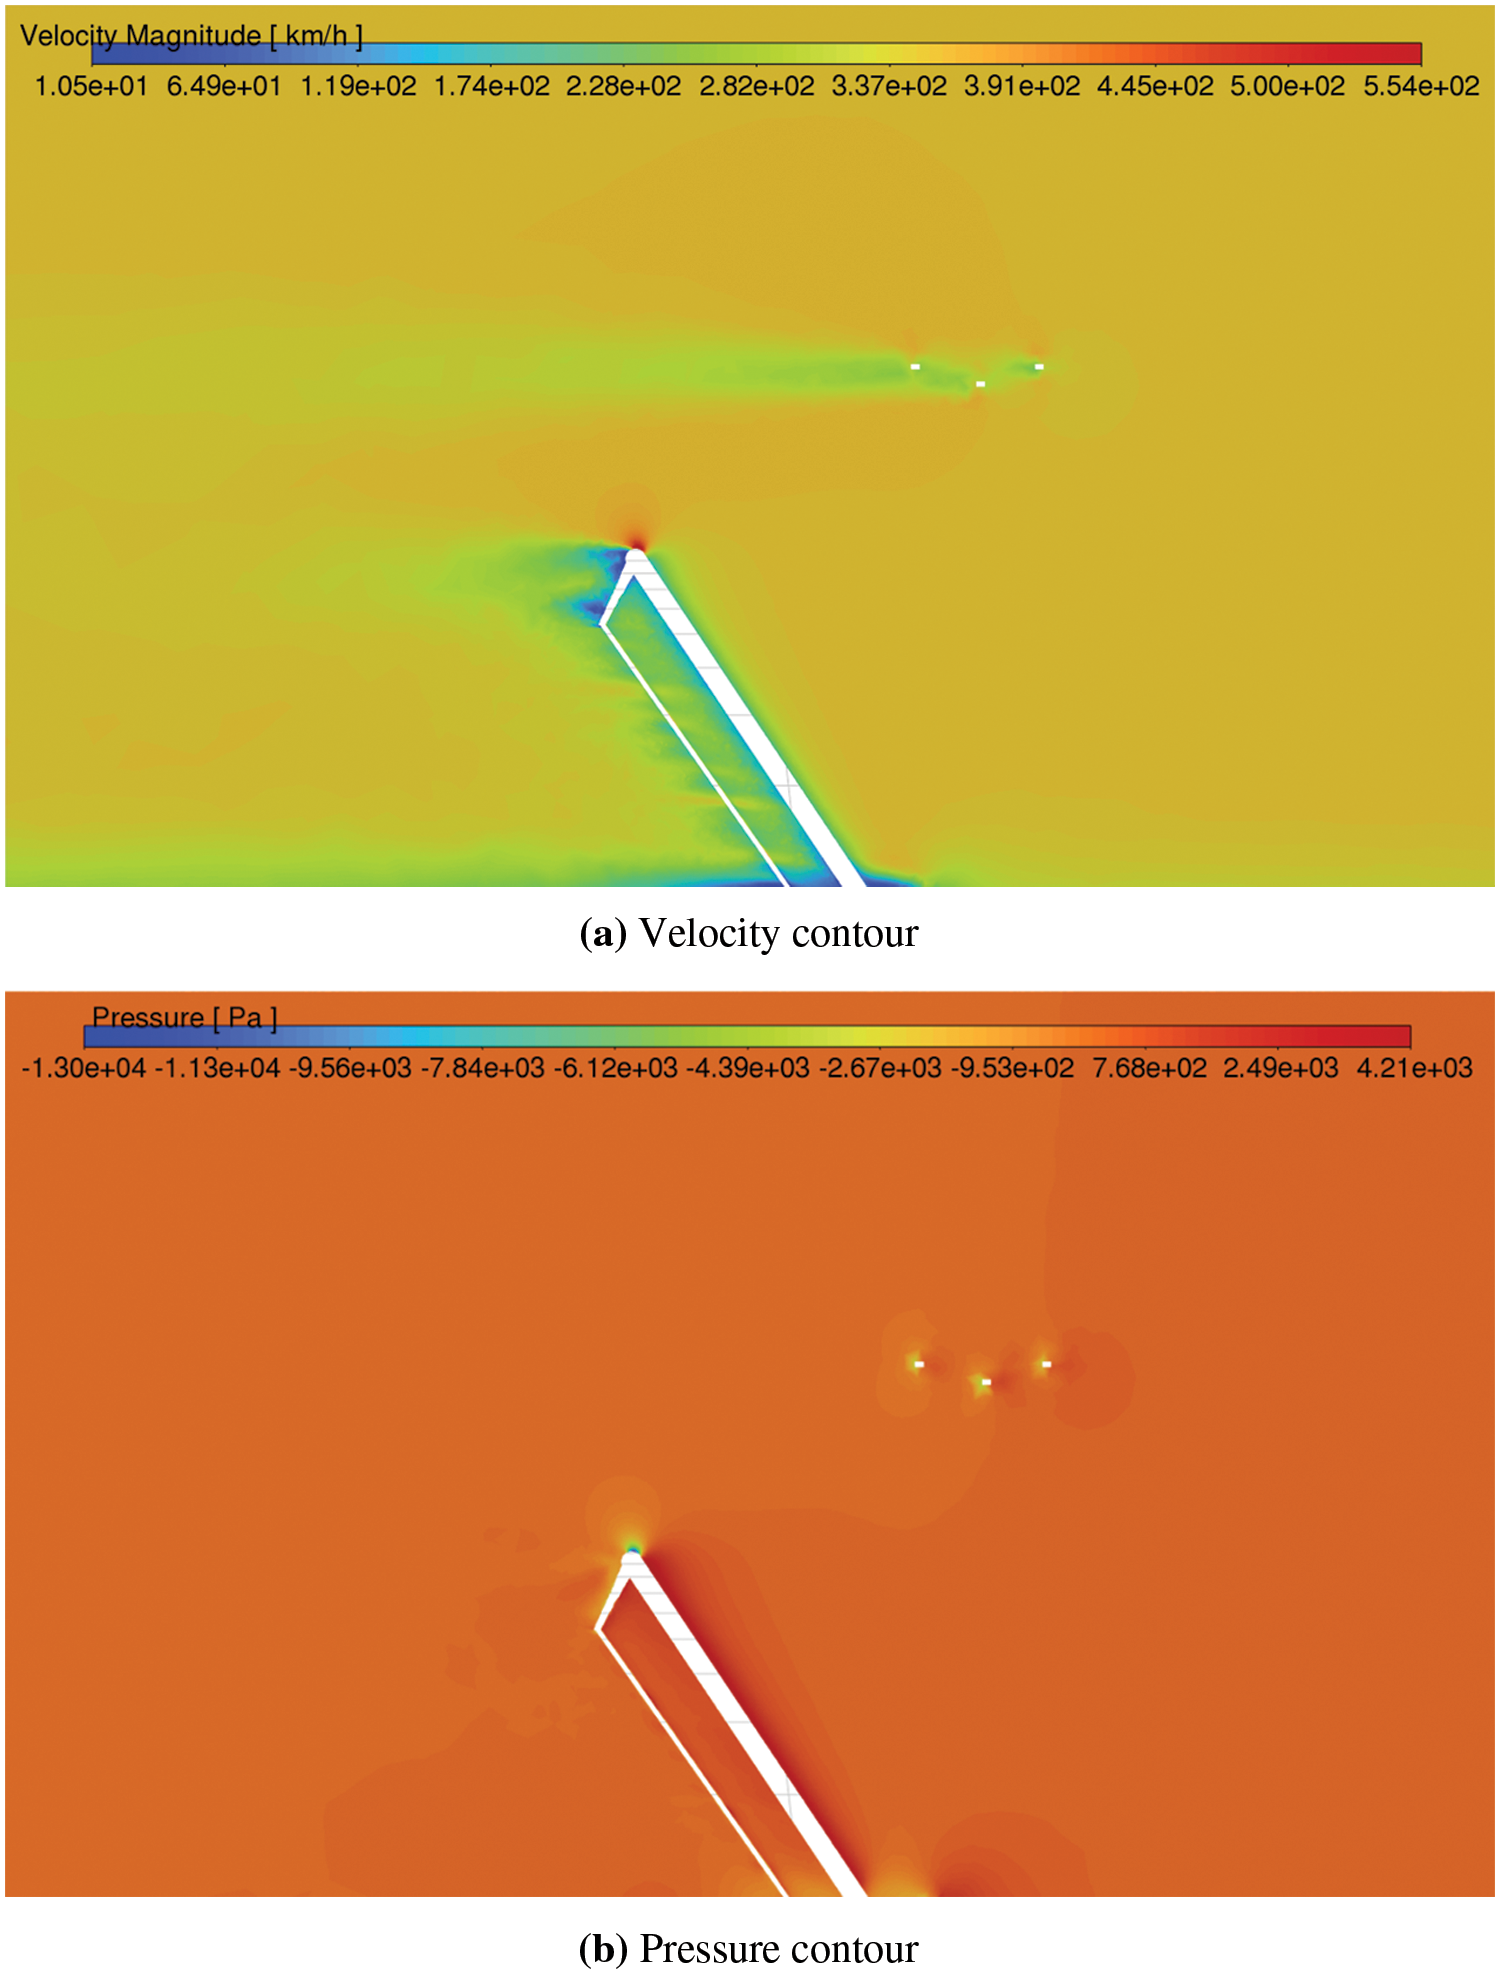
Figure 12: Contour plots with deflectors
In Fig. 13, the pressure streamline plot shows the effect of the wind deflectors on the airflow around the pantograph. The streamline’s pattern illustrates how the deflectors redirect the airflow and reduce the turbulence near the strips, resulting in a more balanced pressure distribution across the strips. These simulation results demonstrate that the wind deflectors have a positive impact on the aerodynamic performance of the pantograph.

Figure 13: Deflector pressure streamline plot
For optimization, various factors such as installation direction, shift range, and size are considered. The options available for the supporting beam deflectors during operation are limited to installation direction (upwards, downwards, or removal) and sliding screw position adjustments. The installation direction affects the compensation of the aerodynamic lift, as demonstrated in Fig. 14. A “π” shaped installation with the front deflector facing downwards and the rear deflector facing upwards is commonly used.

Figure 14: Deflector installation directions
In addition, the shift range of the deflectors is also a crucial factor, with a shift range of only approximately 1.3 cm for the particular type of pantograph studied in this article. However, in the simulation, a maximum shift range of 3 centimeters was assumed, as shown in Fig. 15.
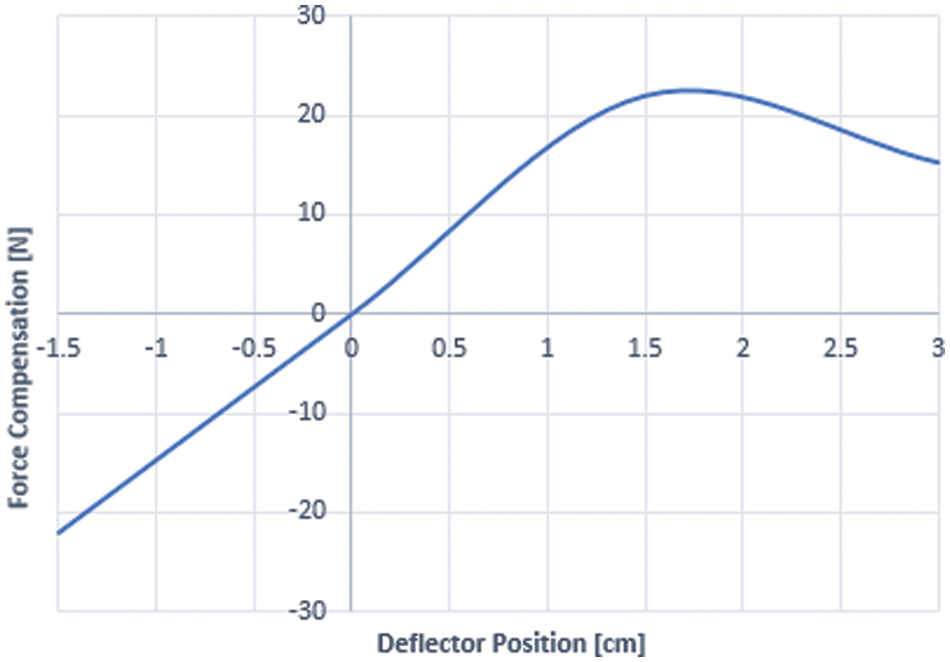
Figure 15: Lift compensation vs. deflector position
The size of the wind deflector is another important consideration, as the force compensated is proportional to the area of the deflector, as illustrated in Table 5 and Fig. 16.


Figure 16: Lift compensation vs. size plot at 1.3 cm
A lift compensation of approximately 22 N is required for the pantograph used in this study, and feasible deflector sizes are listed in Table 6. It is important to note that the overall aerodynamic characteristics of the pantograph must also be considered during design. For example, the size of the deflectors in the downwards orientation should not exceed that in the upwards orientation to reduce the overall aerodynamic lift. By considering all these factors, the wind deflectors can be optimized to achieve the desired performance.

The use of wind deflectors is not the only approach available to address pantograph aerodynamics. One alternative is to use control circuits in place of or in conjunction with wind deflectors. Both passive and open-loop active control valves have already been adopted with some pantograph models. The closed-loop active control valve is still under development and involves sending force and acceleration measurement data to a control unit, which then calculates the amount of pressure compensation required to achieve the target lift force value. A proportional valve or high-frequency regulator then responds accordingly. However, this approach presents certain challenges such as the high cost of customized sensors, difficulty in data collection in a high-speed environment, and the high precision control requirement for the hysteresis drive system.
Another alternative is the use of a single-strip pantograph (see Fig. 17), which only has one strip, eliminating the problem of uneven pressure between strips. Additionally, it is lightweight and compact in size, which facilitates maintenance and reduces impact force as per Eqs. (5) and (6). However, single-strip pantographs have less electrical redundancy and are structurally weaker than double-strip pantographs. Therefore, railway operators need to weigh the pros and cons when selecting the most suitable pantograph type and wind compensation strategy for their operations.
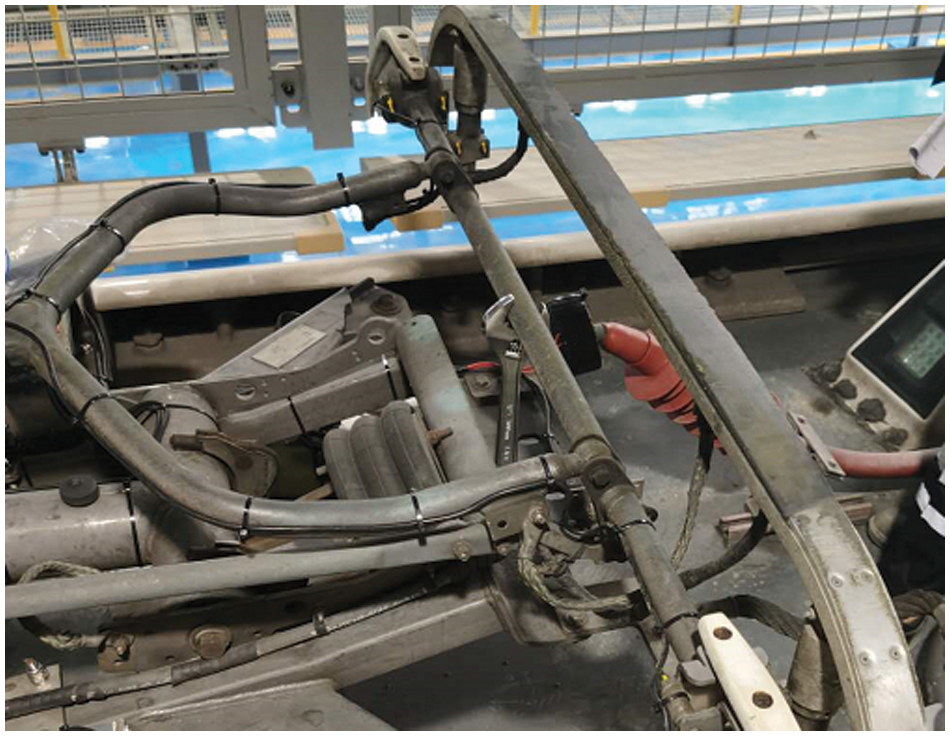
Figure 17: Single-strip pantograph
It is essential to consider all possible alternatives and their advantages and disadvantages when optimizing pantograph aerodynamics. The decision must be based on a thorough understanding of the trade-offs between different approaches, considering their specific requirements in terms of cost, reliability, and performance. Additionally, it is essential to consider the potential impact of external factors such as operating speed. A comprehensive optimization process that considers all of these factors is necessary to ensure optimal current collection performance for the pantograph-catenary system.
This study provides a comprehensive understanding of the aerodynamic properties of high-speed pantographs equipped with supporting beam wind deflectors, based on both experimental and numerical analyses. The key findings and recommendations are summarized below:
(1) Proper installation and configuration of supporting beam wind deflectors contribute to a more balanced lift force distribution between the front and rear strips. The lift force on the front strip decreases by 9.67 N, while it increases on the rear strip by 7.33 N, resulting in a reduction in the lift force difference from 22 to 4.9 N. The numerical results are in close agreement with the experimental measurements, and both sets of data demonstrate a reduced force difference.
(2) Optimal aerodynamic performance can be achieved by considering various factors, including deflector size, position, and installation orientation. A “π” shaped configuration, where the front strip deflectors are installed downwards and the rear strip deflectors upwards, is recommended. Four possible solutions for 22 N force compensation are: 60 cm × 70 cm rear deflectors combined with 60 cm × 70 cm front deflectors, 70 cm × 80 cm rear deflectors combined with 90 cm × 100 cm front deflectors, 90 cm × 100 cm rear deflectors only, or 80 cm × 95 cm front deflectors only.
(3) While using wind deflectors is an effective approach for compensating lift forces, it is essential to evaluate other alternatives based on operational needs. Railway operators should weigh the pros and cons of different pantograph types and wind compensation strategies to ensure optimal current collection performance for the pantograph-catenary system.
Acknowledgement: The author would like to thank the on-site field personnel for their support throughout the data collection process. This work was encouraged by the China Academy of Railway Sciences, China.
Funding Statement: No external fund has been received for this study.
Author Contributions: The authors confirm contribution to the paper as follows: study conception and design: Shiyang Song; data collection: Tongxin Han; analysis and interpretation of results: Shiyang Song; draft manuscript preparation: Shiyang Song. All authors reviewed the results and approved the final version of the manuscript.
Availability of Data and Materials: The data associated with this study can be released upon reasonable request.
Conflicts of Interest: The authors declare that they have no conflicts of interest to report regarding the present study.
References
1. Pombo, J., Ambrósio, J., Pereira, M., Rauter, F., Collina, A. et al. (2009). Influence of the aerodynamic forces on the pantograph-catenary system for high-speed trains. Vehicle System Dynamics, 47(11), 1327–1347. [Google Scholar]
2. AbdelGawad, A., Aljameel, N., Shaltout, R. (2022). Computational modelling of the aerodynamic noise of the full-scale pantograph of high-speed trains. Journal of Advanced Research in Fluid Mechanics and Thermal Sciences, 93(1), 94–109. [Google Scholar]
3. Li, H., Liu, X., Thompson, D., Squicciarini, G. (2022). The distribution of pantograph aerodynamic noise on train external surfaces and the influence of flow. Applied Acoustics, 188, 108542. [Google Scholar]
4. Tan, J., Bai, B., Xu, X., Yang, X. (2017). Numerical computation for the impact of pantograph angles on the near-field and far-field aerodynamic noises of pantographs. Journal of Vibroengineering, 19(8), 6471–6484. [Google Scholar]
5. Yan, Y., Xu, X., Wang, X., Geng, H., Huang, S. (2022). Simulation optimization study on aerodynamic drag reduction of high-speed pantograph. Mechanics in Engineering, 44(2), 276–284. [Google Scholar]
6. Cheng, J., Guo, D., Yang, G., Ji, Z., Chen, D. (2022). Research on effects of tunnel buffer structures on the aerodynamic force of the pantograph. Proceedings of the ASME, 2022 Fluids Engineering Division Summer Meeting, Toronto, Canada. [Google Scholar]
7. Dai, Z., Li, T., Zhou, N., Zhang, J., Zhang, W. (2022). Effect of upper and lower arms diameters on aerodynamic uplift force of high-speed pantograph. Journal of Traffic and Transportation Engineering, 22(4), 210–222. [Google Scholar]
8. Watroba, P. (2015). Numerical simulation of aerodynamic forces which have an impact on the pantograph. 21st International Conference Engineering Mechanics, Svratka, Czech Republic. [Google Scholar]
9. Vo-Van, O., Massat, J., Laurent, C., Balmes, E. (2014). Introduction of variability into pantograph-catenary dynamic simulations. Vehicle System Dynamics, 52(10), 1254–1269. [Google Scholar]
10. Shaltout, R., Aljameel, N., Abdelgawad, A. (2022). Modeling and simulation of the aerodynamic noise of high-speed train’s pantograph. Journal of Engineering, 2022, 1164017. [Google Scholar]
11. Mitsumoji, T., Sueki, T., Yamazaki, N., Sato, Y., Ikeda, M. et al. (2015). Aerodynamic noise reduction of a pantograph panhead by applying a flow control method. Noise and Vibration Mitigation for Rail Transportation Systems, 126, 515–522. [Google Scholar]
12. Siano, D., Viscardi, M., Donisi, F., Napolitano, P. (2014). Numerical modeling and experimental evaluation of an high-speed train pantograph aerodynamic noise. 5th International Conference on Automotive and Transportation Systems (ICAT 14), Cambridge, USA. [Google Scholar]
13. Ikeda, M., Manabe, K. (2000). Development of low noise pantograph with passive lift suppression mechanism of panhead. Quarterly Report of RTRI, 41(4), 177–181. [Google Scholar]
14. Collina, A., Facchinetti, A., Resta, F. (2007). A feasibility study of an aerodynamic control for a high speed pantograph. 2007 IEEE/ASME International Conference on Advanced Intelligent Mechatronics, Zurich, Switzerland. [Google Scholar]
15. Kim, H., Hu, Z., Thompson, D. (2020). Effect of cavity flow control on high-speed train pantograph and roof aerodynamic noise. Railway Engineering Science, 28, 54–74. [Google Scholar]
16. Li, T., Deng, Q., Zhang, W., Zhang, J. (2020). Study on the aerodynamic noise characteristics of high-speed pantographs with different strip spacings. Journal of Wind Engineering and Industrial Aerodynamics, 202, 104191. [Google Scholar]
17. Dai, Z., Li, T., Deng, J., Zhou, N., Zhang, W. (2022). Effect of the strip spacing on the aerodynamic performance of a high-speed double-strip pantograph. Vehicle System Dynamics, 60(10), 3358–3374. [Google Scholar]
18. Dai, Z., Li, T., Zhang, W., Zhang, J. (2020). Numerical study on aerodynamic performance of high-speed pantograph with double strips. Fluid Dynamics & Materials Processing, 16(1), 31–40. https://doi.org/10.32604/fdmp.2020.07661 [Google Scholar] [CrossRef]
19. Shi, J., Ge, S., Sheng, X. (2021). Numerical investigation on the aerodynamic noise generated by a simplified double-strip pantograph. Fluid Dynamics & Materials Processing, 18(2), 463–480. https://doi.org/10.32604/fdmp.2022.017508 [Google Scholar] [CrossRef]
20. Dai, Z., Li, T., Zhou, N., Zhang, J., Zhang, W. (2021). Numerical simulation and optimization of aerodynamic uplift force of a high-speed pantograph. Railway Engineering Science, 30, 117–128. [Google Scholar]
21. Maaß, J. (2021). Insulator for a rail vehicle and pantograph. Germany, DE102019121932A1. https://register.dpma.de/DPMAregister/pat/PatSchrifteneinsicht?docId=DE102019121932A1 [Google Scholar]
22. Bocciolone, M., Resta, D., Rocchi, A., Tosi, A., Collina, A. (2007). Pantograph aerodynamic effects on the pantograph-catenary interaction. Vehicle System Dynamics, 44, 560–570. [Google Scholar]
23. Song, Y., Liu, Z., Wang, H., Lu, X., Zhang, J. (2016). Nonlinear analysis of wind-induced vibration of high-speed railway catenary and its influence on pantograph-catenary interaction. Vehicle System Dynamics, 54(6), 723–747. [Google Scholar]
24. Li, R., Zhang, W., Zhou, N., Liu, B., Zou, D. et al. (2016). Influence of a high-speed train passing through a tunnel on pantograph aerodynamics and pantograph-catenary interaction. Proceedings of the Institution of Mechanical Engineers, Part F: Journal of Rail and Rapid Transit, 231(2), 198–210. [Google Scholar]
25. Li, R., Zhou, N., Zhang, W., Mei, G., Chen, Z. (2012). Calculation method and analysis of pantograph aerodynamic lifting force. Journal of the China Railway Society, 34(8), 26–32. [Google Scholar]
26. Arsenea, S., Sebesan, I., Popaa, G. (2014). The influence of wind on the pantograph placed on the railway electric vehicles bodywork. 5th World Conference on Learning Teaching and Educational Leadership (WCLTA 2014), Prague, Czech Republic. [Google Scholar]
27. Dai, Z., Li, T., Zhou, N., Zhang, J., Zhang, W. (2022). Numerical simulation and optimization of aerodynamic uplift force of a high-speed pantograph. Railway Engineering Science, 30, 117–128. [Google Scholar]
28. Zhang, L., Zhang, J., Li, T., Zhang, W. (2017). Influence of pantograph fixing position on aerodynamic characteristics of high-speed trains. Journal of Modern Transportation, 25, 34–39. [Google Scholar]
29. Carnevale, M., Facchinetti, A., Rocch, D. (2017). Procedure to assess the role of railway pantograph components in generating the aerodynamic uplift. Journal of Wind Engineering and Industrial Aerodynamic, 160, 16–29. [Google Scholar]
30. Tan, X., Xie, P., Yang, Z., Gao, J. (2019). Adaptability of turbulence models for pantograph aerodynamic noise simulation. Shock and Vibration, 5, 1–20. [Google Scholar]
31. Sun, Z., Yao, S., Wei, L., Yao, Y., Yang, G. (2021). Numerical investigation on the influence of the streamlined structures of the high-speed train’s noise on aerodynamic performances. Applied Science, 11(2), 784. [Google Scholar]
32. Brambilla, E., Carnevale, M., Facchinetti, A., Rocchi, D. (2022). Influence of train roof boundary layer on the pantograph aerodynamic uplift: A proposal for a simplified evaluation method. Journal of Wind Engineering and Industrial Aerodynamics, 231, 105212. [Google Scholar]
33. Kim, H., Hu, Z., Thompson, D. (2020). Numerical investigation of the effect of cavity flow on high speed train pantograph aerodynamic noise. Journal of Wind Engineering and Industrial Aerodynamics, 201, 104159. [Google Scholar]
34. Raz, L., Zahalka, M., Chval, Z. (2016). Reduction of pantograph influence on energy consumption. Proceedings of the 27th DAAAM International Symposium, Vienna, Austria. [Google Scholar]
Cite This Article
 Copyright © 2024 The Author(s). Published by Tech Science Press.
This work is licensed under a Creative Commons Attribution 4.0 International License , which permits unrestricted use, distribution, and reproduction in any medium, provided the original work is properly cited.
 Downloads
 Citation Tools