
 Submit a Paper
 Propose a Special lssue
 Open Access
ARTICLE

Influence of Flap Parameters on the Aerodynamic Performance of a Wind-Turbine Airfoil
1 Mechanical College, Shanghai DianJi University, Shanghai, 201306, China
2 College of Energy Engineering, Xinjiang Institute of Technology, Urumqi, 830091, China
* Corresponding Author: Baohua Li. Email:
Fluid Dynamics & Materials Processing 2024, 20(4), 771-786. https://doi.org/10.32604/fdmp.2023.029584
Received 27 February 2023; Accepted 13 June 2023; Issue published 28 March 2024
 View Full Text
 Download PDF
Abstract
A numerical method has been used to analyze the flow field related to a NACA 0015 airfoil with and without a flap and assess the influence of the flap height and angle on the surface pressure coefficient, lift coefficient, and drag coefficient. The numerical results demonstrate that the flap can effectively improve the lift coefficient of the airfoil; however, at small attack angles, its influence is significantly reduced. When the angle of attack exceeds the critical stall angle and the flap height is 1.5% of the chord length, the influence of the flap becomes very evident. As the flap height increases, the starting point of the separation vortex gradually moves forward and generates a larger wake vortex. Optimal aerodynamic characteristics are obtained for 1.5% (of the chord length) flap height and a 45° flap angle; in this case, the separation vortex is effectively reduced.Keywords
Nomenclature
| C | Chord length |
| D | Flap thickness |
| L | Flap height |
| | Flap angle |
Wind-power generation is the most important form of wind energy utilization. A wind turbine converts wind energy into electrical energy, and the wind turbine blade is its main component. Therefore, improving the power generation efficiency of wind turbines as much as possible by adding flaps with a predetermined blade length is an important issue. The efficient use of wind energy will change the global energy pattern, eliminate dependence on fossil fuels, and reduce environmental pollution.
Several studies on blades involving flaps and the analysis of the aerodynamic characteristics and development trends of wind turbines with flaps have recently been undertaken globally, such as that by Zhang et al. [1]. The aeroelastic load calculation and stability of wind turbines were analyzed to solve the overall design problem. Wang et al. [2] used two turbulence models to simulate Gurney flaps numerically at different heights and verified that the addition of flaps improves aerodynamic characteristics. Chen et al. [3] numerically simulated an S823 airfoil and showed that the aerodynamic performance could be improved by adding flaps. Chen et al. [4] studied the effect of a triangular flap on the aerodynamic characteristics of a wind turbine blade airfoil. The results showed that triangular flaps can improve the aerodynamic force of a two-dimensional airfoil and a three-dimensional wind turbine. Chen et al. [5] numerically simulated the influence of an active Gurney flap on the unsteady aerodynamic characteristics of a vertical-axis wind turbine blade under an oscillating inflow. Gurney flaps improve the aerodynamic characteristics of wind turbines under unsteady aerodynamic forces. Yang et al. [6] numerically simulated a Phase VI wind turbine with flaps of different heights. The aerodynamic performance of wind turbines can be effectively improved by installing Gurney flaps of a certain height on their blades. An increase in flap height first increased and then decreased the performance. He et al. [7] studied the aerodynamic characteristics of wind-turbine flaps using wind-tunnel experiments. The experiments proved that the addition of flaps can increase the lift of the wind turbines. Zhu et al. [8] conducted performance-comparison tests on wind turbines equipped with Gurney flaps using a low-speed wind tunnel. Mohammad et al. [9] used a Phase VI wind turbine to study different near-wall grids. Through a study of different wall grids, the influence of wall grids on the aerodynamic performance of wind turbines was determined. Lee [10] used a wind tunnel test method to analyze the aerodynamic characteristics of flaps with different porosity heights. The results indicated that different porosities and heights could effectively improve the aerodynamic performance of the airfoil. Deman et al. [11] tested the pressure distributions of static and oscillating trailing-edge flaps. Riyadh et al. [12] analyzed the effects of slits on a wind turbine under different conditions. The results showed that the slot geometry improved the aerodynamic performance of the wind turbine in different inlet flow environments. Li et al. [13] studied the influence of the flap length on the hydrodynamic characteristics of airfoils. The results showed that the flap length provided better aerodynamic lift for wind turbines in a hydraulic environment. Dai et al. [14] designed a double-fork tip structure and analyzed its vibrational characteristics. A double-fork tip-structured wind turbine can effectively increase the total output power of wind turbines. Li et al. [15] used a fluent numerical simulation method to reveal the interaction and determine the relationship between the aerodynamic performance of an airfoil and flap gap width. The results indicate that the flap gap width can effectively improve the aerodynamic force of the wind turbine. Wang et al. [16] improved the aerodynamic performance of a multi-wing centrifugal fan by obtaining the starting attitude of the fish for a body-like design. The results showed that the body-like design could improve the aerodynamic force of the fan and thus improve its efficiency. Wu et al. [17] analyzed the influence of five different tip configurations on the flow field characteristics, tip vortex structure, pressure coefficient distribution, and blade load of a 2 MW wind turbine. The results showed that the output power can be improved by adding different tip structures. Jiang et al. [18] conducted computational fluid dynamics analysis on the influence of vortex generators on the aerodynamic performance of a Phase VI wind turbine under different inflow wind speeds. The results showed that increasing the vortex generator improved the power of the Phase VI wind turbine and optimized its flow field. Li et al. [19] explored the influence of the number of blades on the aerodynamic characteristics of a vertical-axis wind turbine with a curved straight wing at the blade trailing edge. Their results showed that blades with different curvatures have power enhancement effects on vertical-axis wind turbines. Sima et al. [20] studied the influence of different installation positions on the airfoil flow by installing a small plate at the front edge of the airfoil suction. The results indicated that the installation angle affected the output power of the wind turbine, which was mainly distributed at the leading edge. Cui et al. [21] numerically analyzed the flow field characteristics of a Goni flap airfoil at a low Reynolds number. Hamzah et al. [22] confirmed the effect of the slot, but further experimental investigations on the influence of the slot design on the drag and aerodynamic noise of fixed and rotating blades are required.
In this paper, the aerodynamic characteristics of dynamic trailing edge flaps, flaps with different porosities and heights, and flaps with different incoming flow conditions were investigated. The aerodynamic characteristics of airfoils with flaps of different heights and attack angles were analyzed using numerical simulations, and their interactions were investigated.
2 Calculation Model and Preliminary Treatment
At the trailing edge of the airfoil, 1% of the chord length C was set as the flap thickness D; 1%, 1.5%, 2%, and 2.5% of C were set as the flap heights L; and the flap angles were 15°, 30°, 45°, 60°, and 90°. The airfoil flap parameters are shown in Fig. 1.
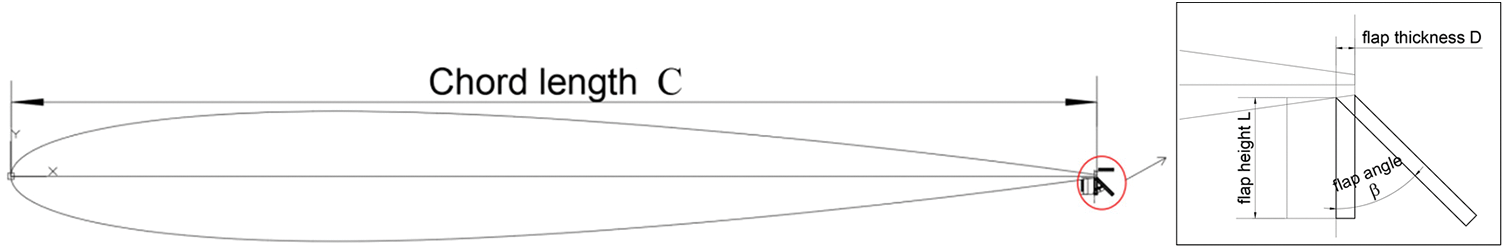
Figure 1: Flap diagram
To study the aerodynamic performance of the flaps at different angles of attack, the flow field calculation region was divided into the rotating and stationary regions of the control airfoil at different angles of attack. To reduce the number of numerical computations required to create a C-type structure grid in the computational domain of the model, all the airfoil and flap wall grids in the rotating region were encrypted. The velocity inlet boundary, pressure outlet, and mesh size of the airfoil wall were 15C, 20C, and 5 × 10⁻⁵C away from the airfoil, respectively, and the number of grid nodes in the outer basin was 70,170. The grid diagrams are shown in Figs. 2 and 3.
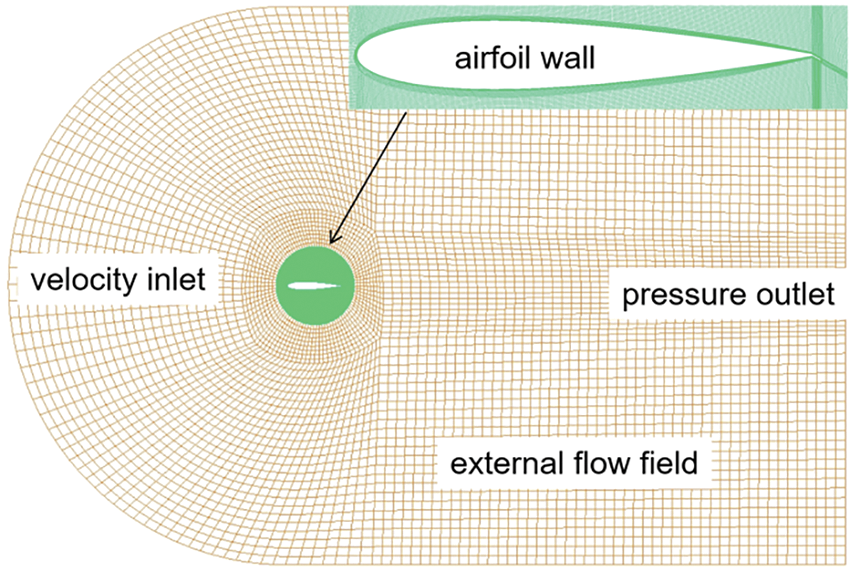
Figure 2: Schematic of the airfoil integral grid
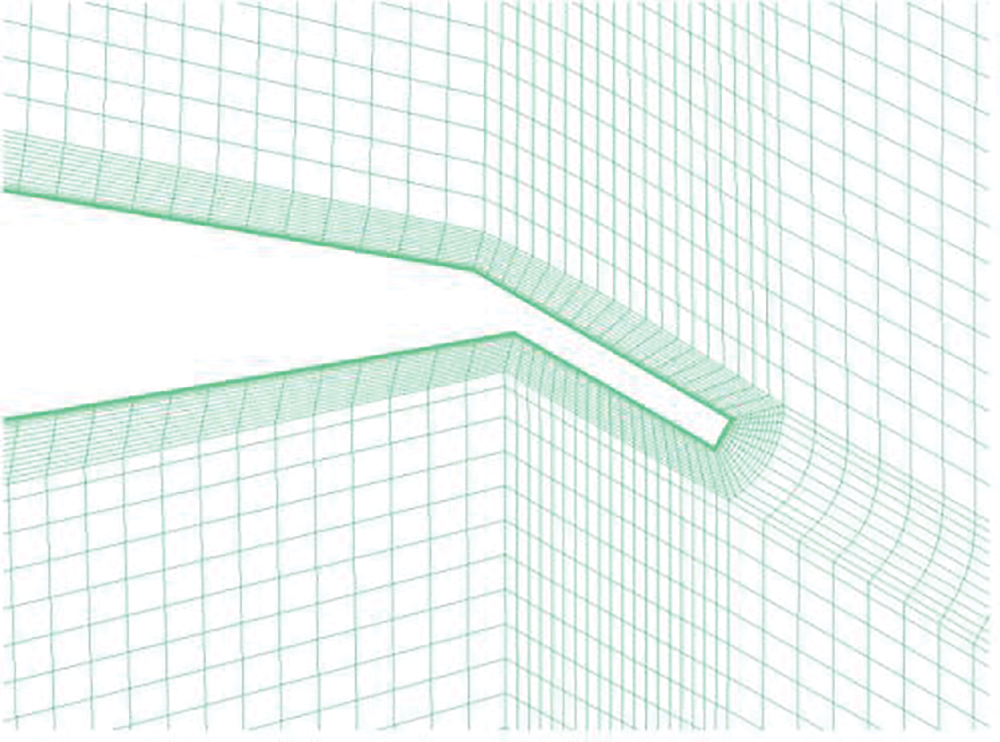
Figure 3: Schematic of the trailing edge flap grid
2.2 Governing Equation and Turbulence Model
The flow around wind airfoils is a low-speed flow problem, and when the airfoils are at a high or stall angle of attack, separation vortices are generated, which are mainly caused by fluid viscosity. Therefore, incompressible Navier-Stokes equations were used for the calculation, the turbulence transfer k–ω model was used, and the control equation is as follows:
conservation of mass equations:
momentum conservation equation:
where
The pressure-velocity coupling method of the SIMPLE algorithm [23] is used in the Fluent calculation [24], and an analytical solution can be obtained by treating speed and pressure as two unknown quantities and limiting the relationship between them. There are two main key points in the SIMPLE algorithm. The solution process of the SIMPLE algorithm is as follows:
(1) The momentum equation is solved by the given initial pressure or the pressure of the previous iteration step, but the velocity variable obtained does not necessarily satisfy the continuity equation.
(2) Solve the pressure according to the pressure Poisson equation.
(3) The obtained pressure correction speed is used to meet the continuity equation.
(4) If the velocity does not satisfy the momentum equation, go back to step (1) and repeat the cycle until it is satisfied.
vortex viscosity:
turbulent kinetic energy equation:
Air was assumed to be an ideal gas, and the inlet and outlet were set as the speed inlet and pressure outlet, respectively. The pressure in the fluid domain was set to 0 Pa so that the pressure in the boundary condition was the absolute pressure. The boundary condition, static pressure of the incoming flow, and wind speed of the incoming flow were set to far pressure, standard atmospheric pressure, and 8 m/s, respectively. Based on the actual working angle of the wind turbine blade attack range, the inlet angle of the attack range was 0°–20°. The convergence values of the residual change and energy and component residuals were set to 10−3 and 10−6, respectively, and the residual values of k and ω of the flow field between adjacent iterations were set to 10−6.
2.3 Calculation Accuracy Verification
To ensure the reliability of the numerical calculation method adopted in this study, Fig. 4 shows a comparison between the numerical calculation results of the National Advisory Committee for Aeronautics symmetric airfoil 0015 and the experimental results published in the literature [5]. The lift coefficients obtained from the computational fluid dynamics numerical calculations are consistent with the experimental results. As shown in Fig. 5, the value of the airfoil wall y+ was less than 1, and the mesh satisfied the calculation conditions.
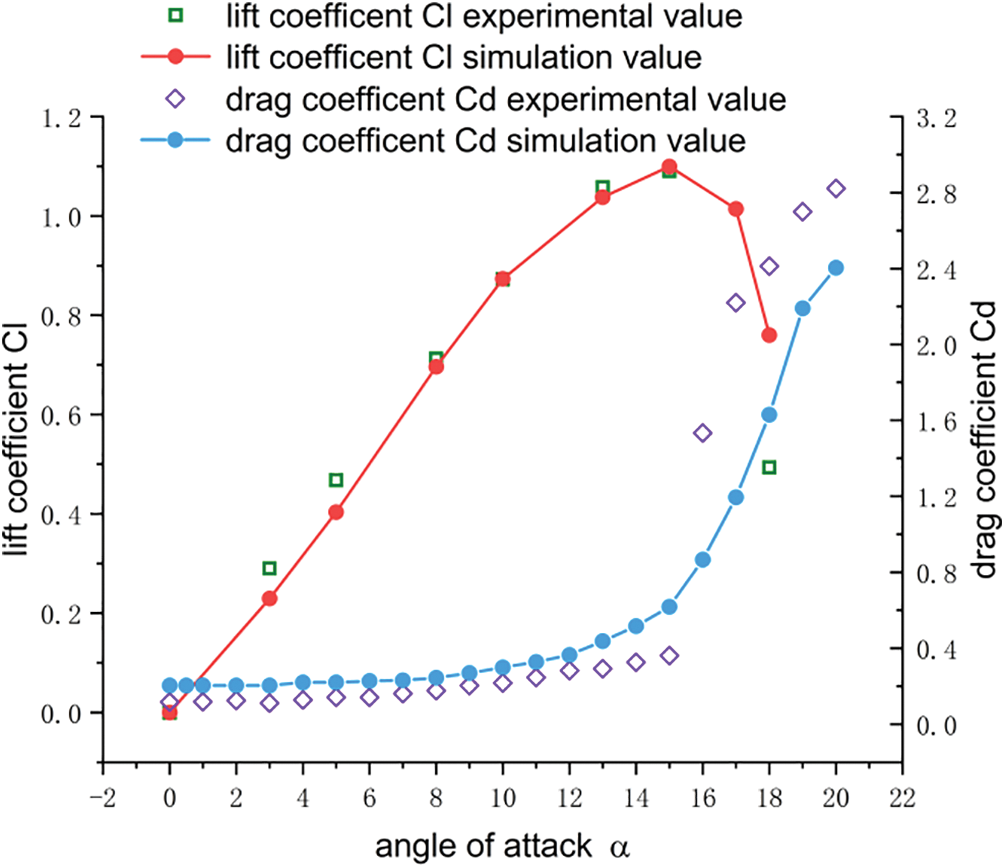
Figure 4: Comparison of lift and drag coefficients
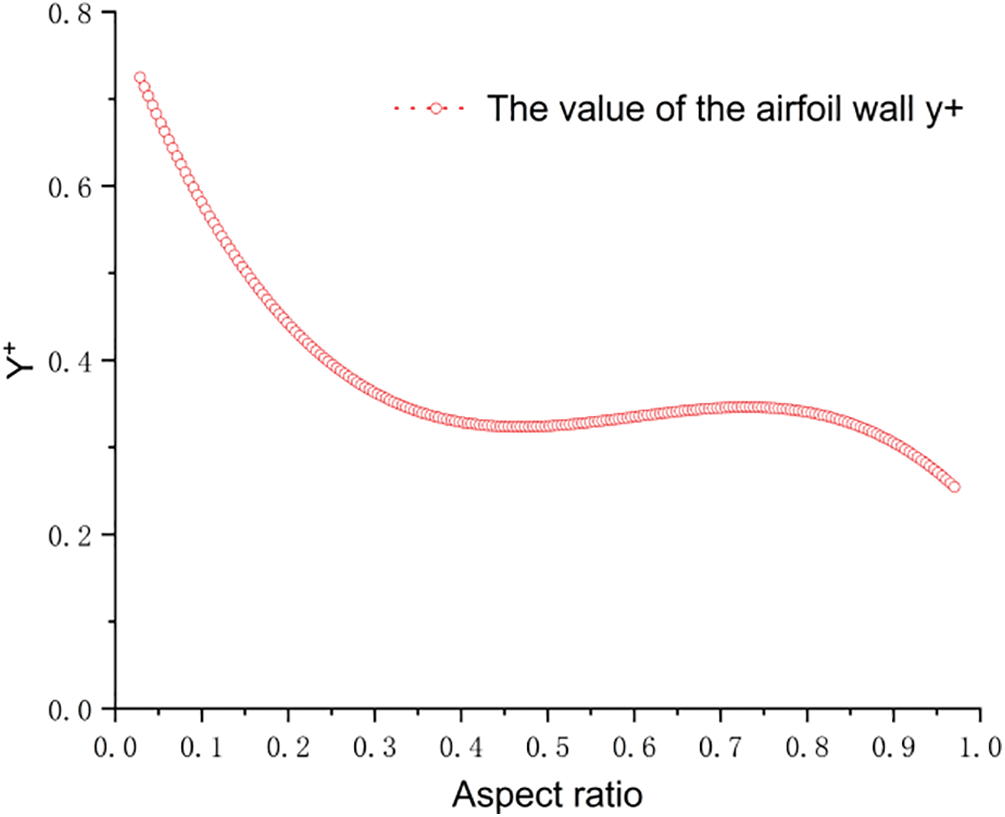
Figure 5: The y+ value of the airfoil wall
The airfoil reached the angle of attack before stalling. The lift coefficients of the numerical simulation and experimental results were identical; the airfoil angle of attack was lower than the critical angle of attack stalled. The lift and drag coefficients calculated using the numerical simulation method were identical to those obtained with the experimental results. The airfoil stall at the angle of attack was higher than the critical angle of attack, the error was within an acceptable threshold, and the increasing trend curve was consistent. These results confirm the accuracy of the numerical simulation method used in this study. For the simulation results and analysis of the flap height influence on the airfoil profile, we took the characteristic size of the airfoil to remove the chord length of the airfoil, the density was the density of air under standard conditions, the dynamic viscosity was
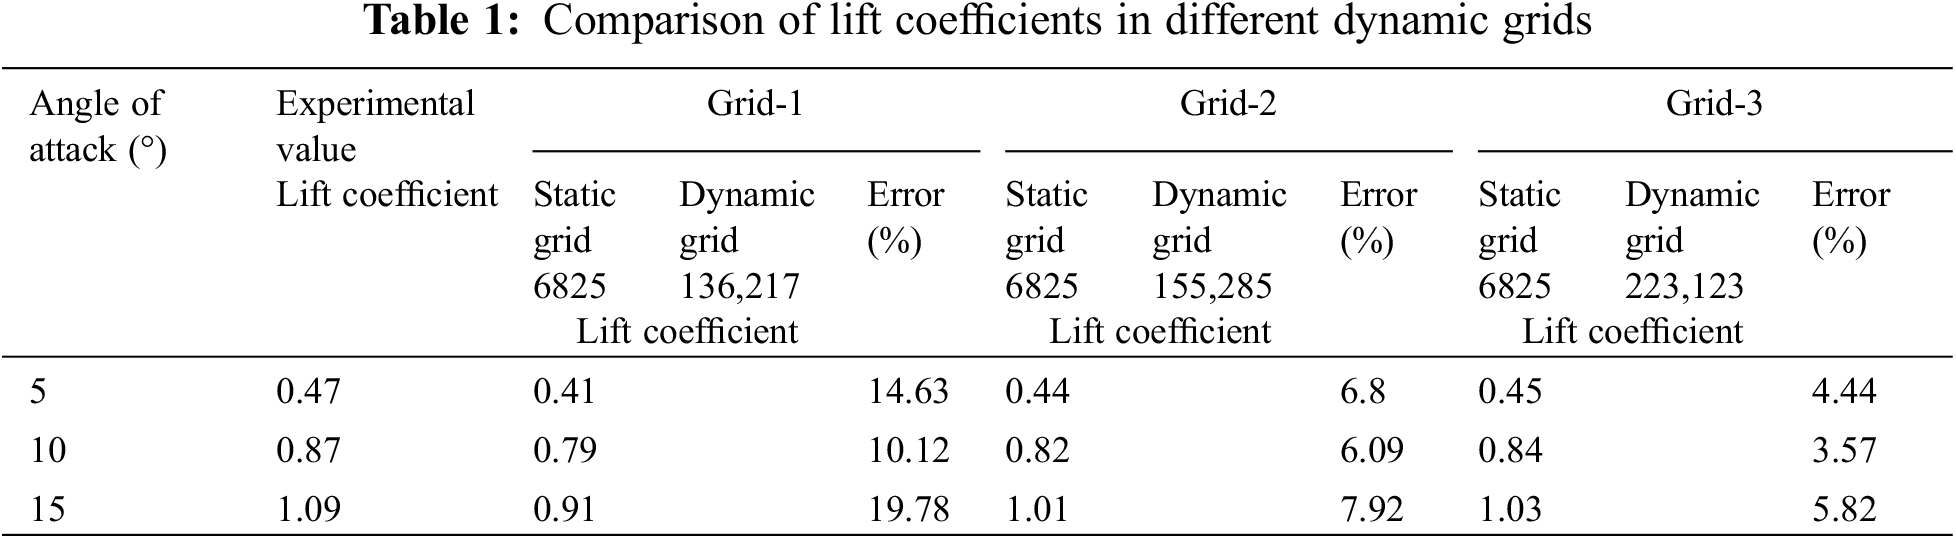
2.3.1 Grid Independence Verification
The rotating-region airfoil had an O-grid topology. The first layer of mesh on the airfoil surface was arranged within the range of the dimensionless wall distance y+ < 1, and the normal expansion rate of the boundary layer mesh did not exceed 1.1 to ensure a good capture of the flow characteristics in the boundary layer. Three different grids were used that were expanded at the boundary layer with expansion rates of 1.1, 0.8, and 0.5, respectively. The lift coefficients of the three different grids with attack angles of 5°, 10°, and 15°, respectively, were numerically calculated. As presented in Table 1, the error between the lift coefficient simulated by Grid-3 and the experimental value was minimal, whereas the calculation error of Grid-2 was within an acceptable range, and the calculation time was faster. Therefore, Grid-2 was selected for the simulation.
2.3.2 Pressure Coefficient Distribution Diagram
Fig. 6 shows the distribution of the pressure coefficient on the airfoil surface at different flap heights for attack angles of 0°, 5°, 10°, 15°, and 20°.
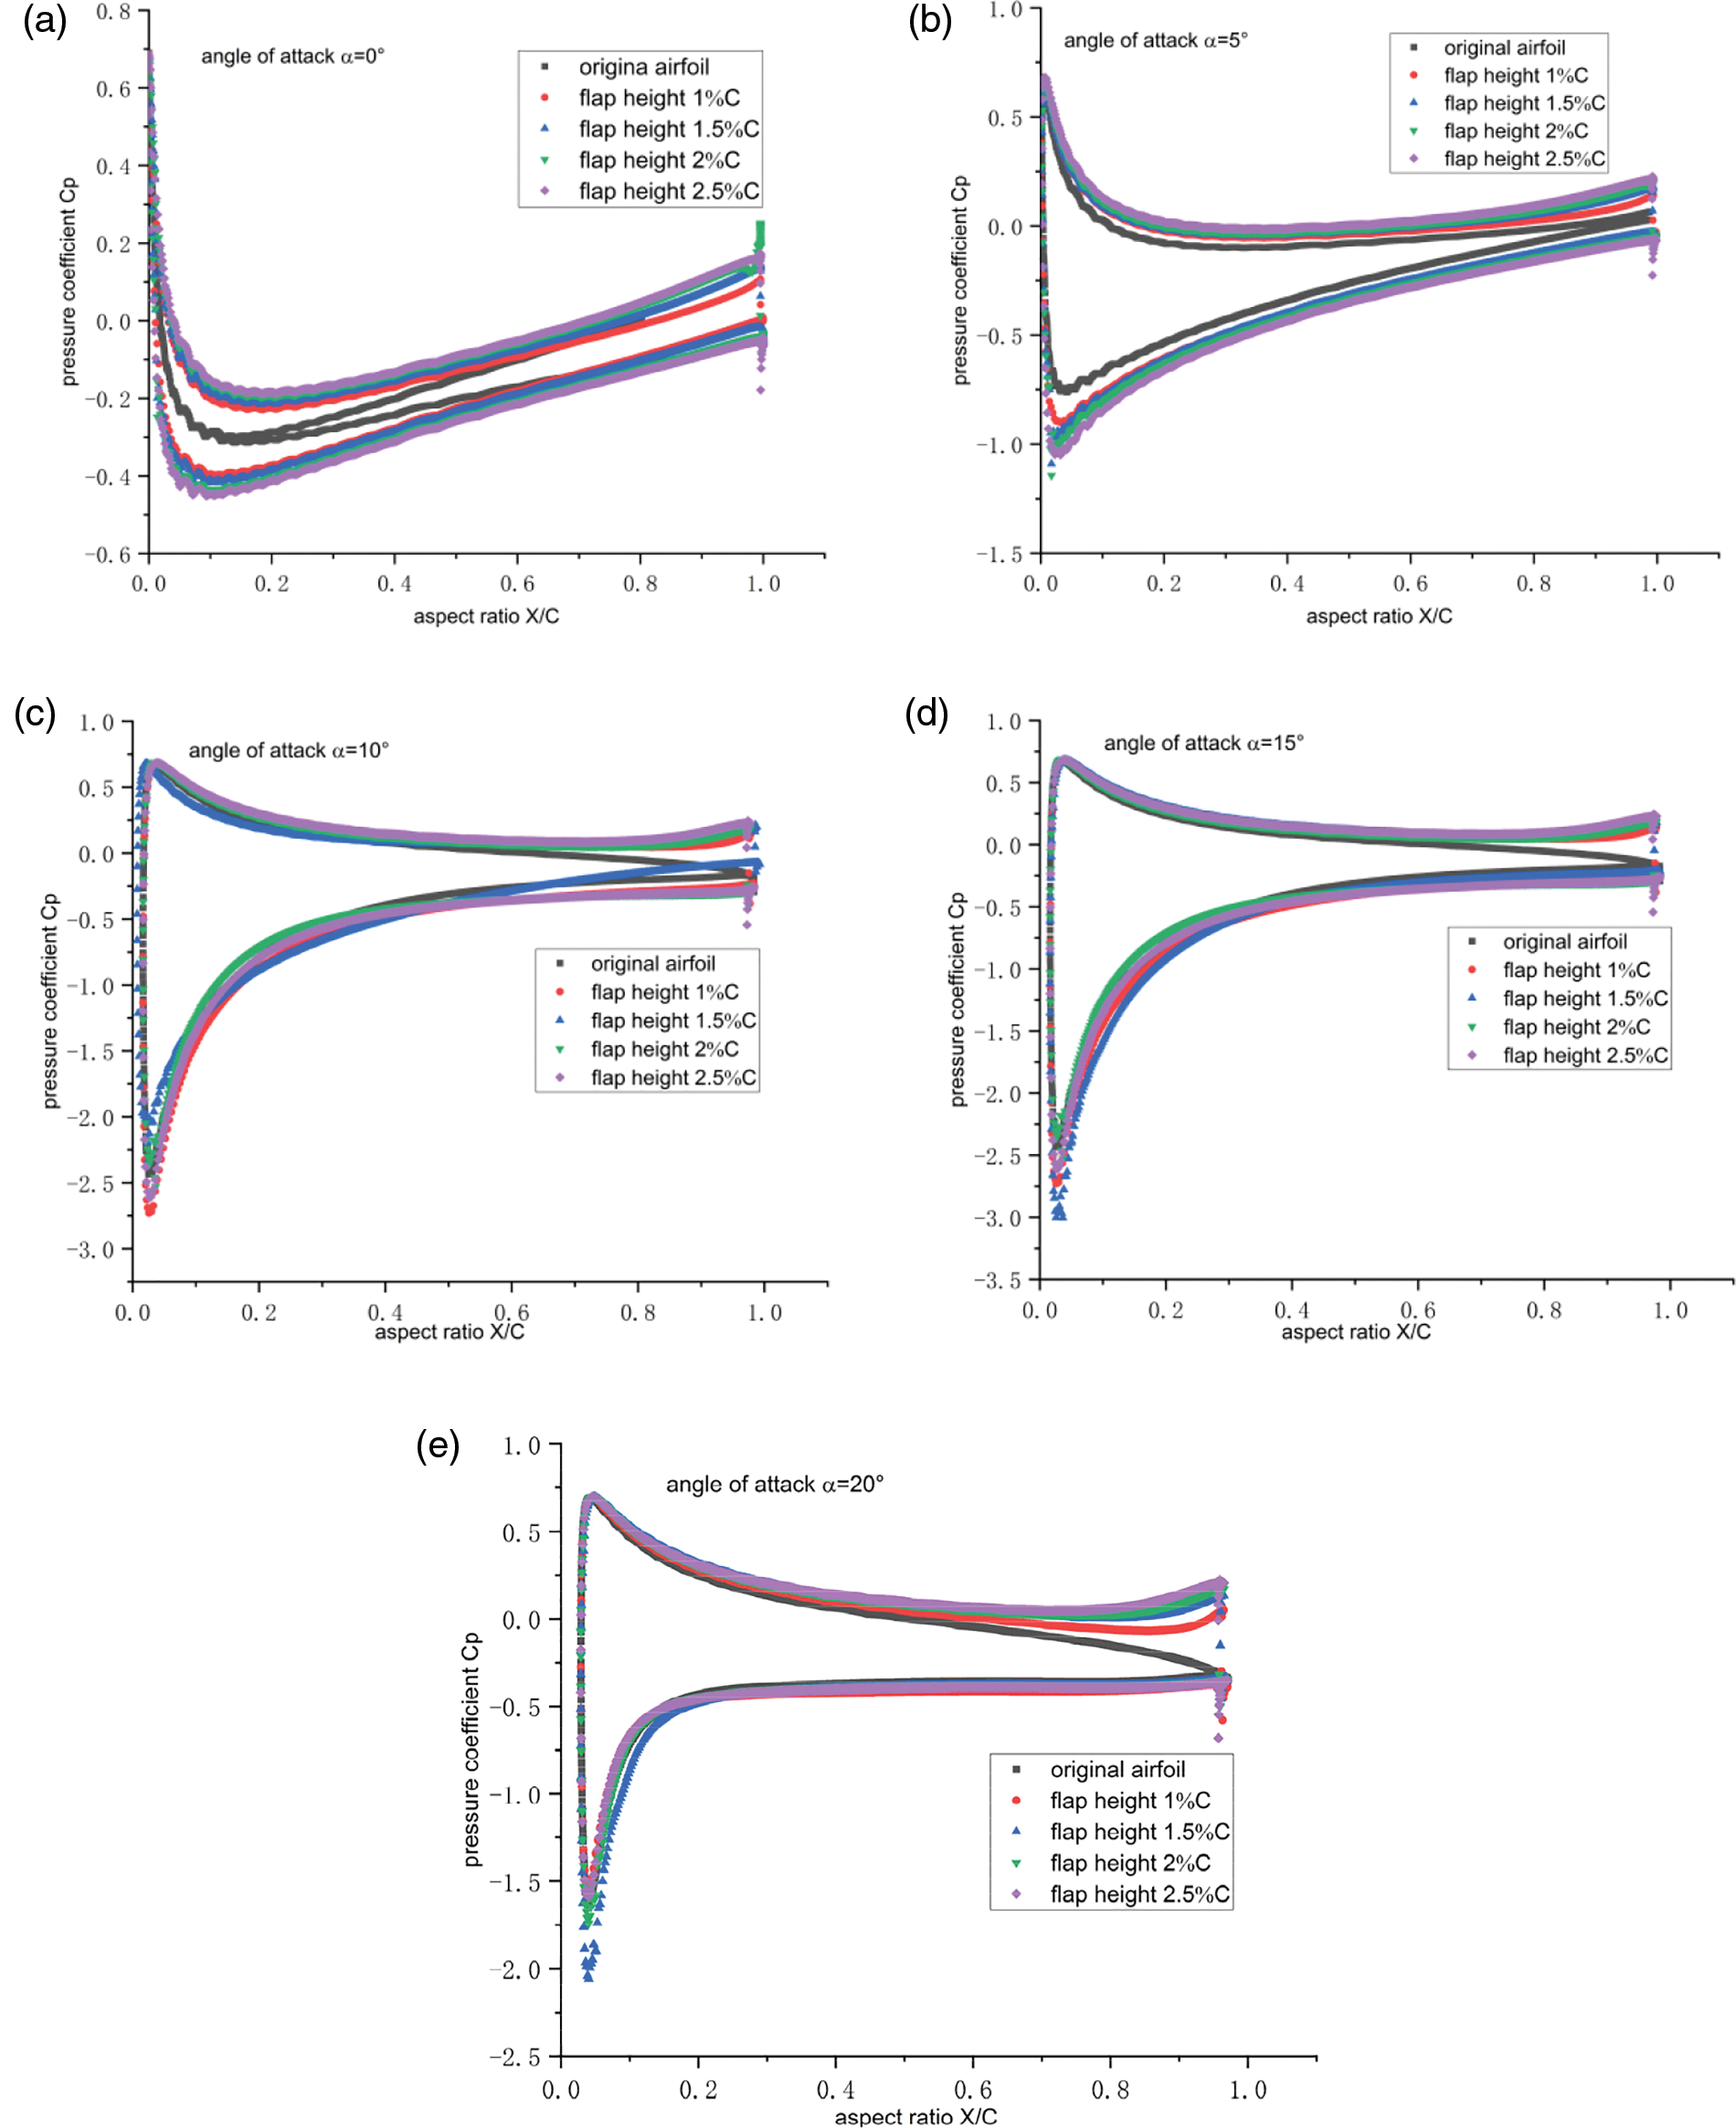
Figure 6: Pressure coefficient distributions at different attack angles (a) 0°, (b) 5°, (c) 10°, (d) 15°, and (e) 20°
The pressure coefficient of the airfoil was obtained by an integral calculation of the pressure on the airfoil surface. The lift force obtained by the airfoil increased as the area surrounded by the upper and lower curves increased. Fig. 6 shows that the addition of flaps had a significant influence on the distribution of the airfoil pressure coefficient. When the angles of attack were 0° and 5°, the airfoil pressure coefficient of the suction surface decreased and increased, respectively, as the flap height increased, resulting in a higher lift in the airfoil. When the angle of attack was 10°, the airfoil with a flap height of 2%C exhibited a better lift enhancement. When the airfoil angles of attack were 15° and 20°, the airfoil stalled. The airfoil with a flap height of 1.5%C had a lower pressure coefficient on the suction surface, resulting in a larger lift force. Under stall conditions, the airfoil exhibited the best lift-increase effect.
2.3.3 Lift Coefficient and Drag Coefficient
As shown in Fig. 7, increasing the angle of attack gradually increased the lift coefficient Cl. After the stall angle of attack is reached, the lift coefficient Cl decreases drastically. At this point, as shown in Fig. 8, the drag coefficient continues to increase. It can be observed from the lift coefficient curve that the lift coefficient increases with an increase in flap height. In contrast to the original airfoil, the airfoil with flaps increased the airfoil stall angle of attack. When the stall angle of attack was greater than that of the airfoil, the airfoil with a flap height of 1.5%C had a higher lift coefficient, and a similar effect was observed in Figs. 6d and 6e. As shown in Fig. 9, an increase in the flap height increased the lift-to-drag ratio.
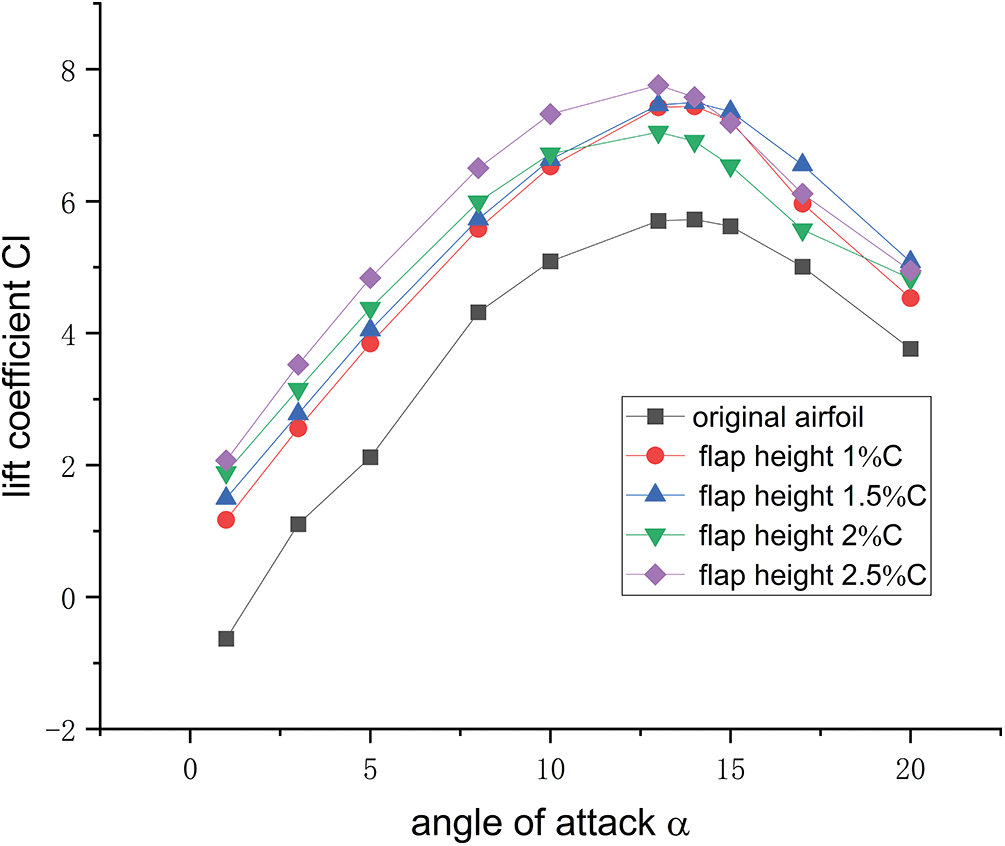
Figure 7: Lift coefficient at different angles of attack
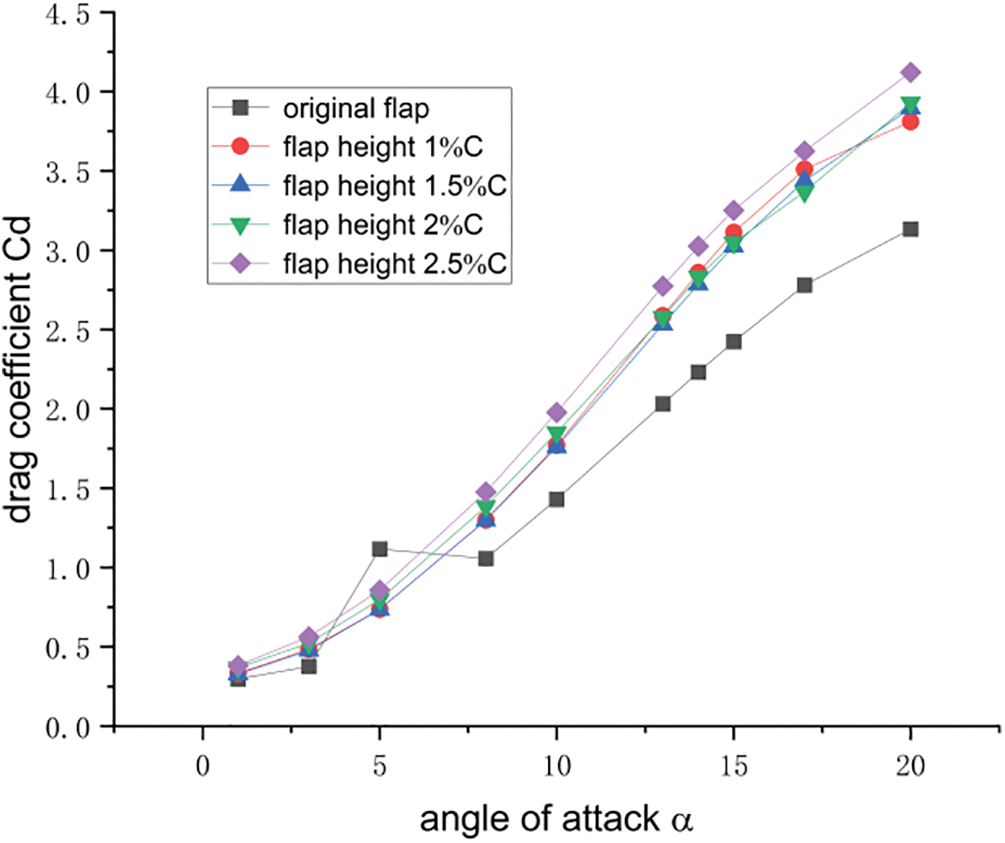
Figure 8: Drag coefficient at different angles of attack
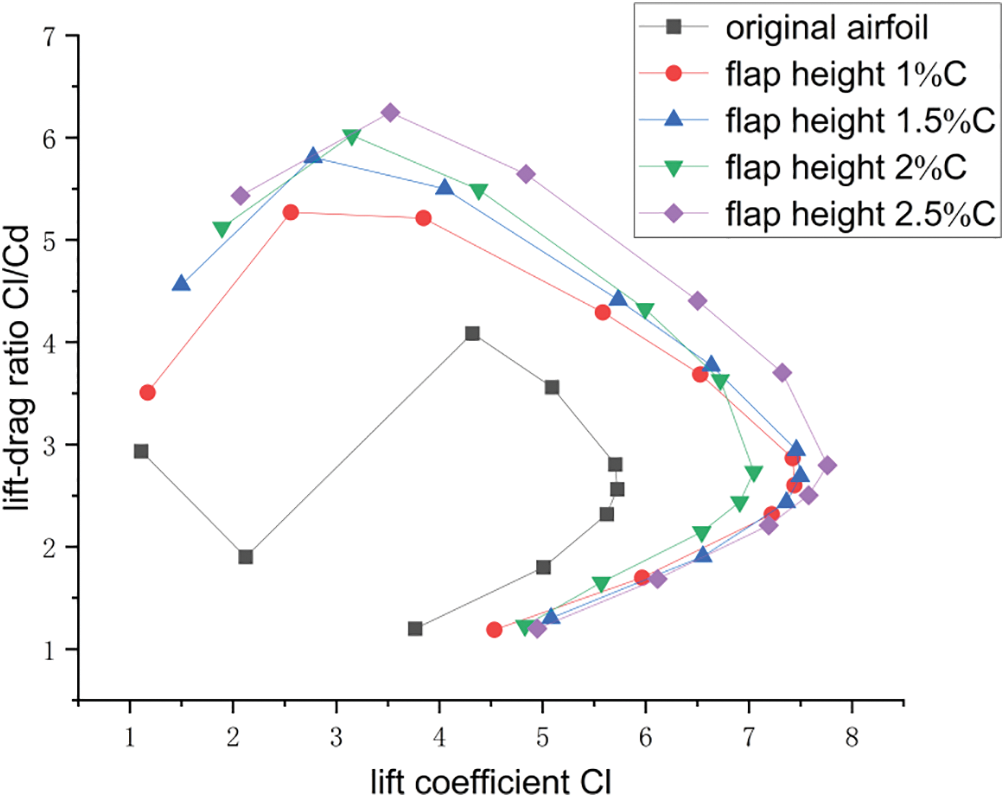
Figure 9: Lift coefficient-lift coefficient/drag coefficients
2.3.4 Airfoil Flow Field and Pressure Cloud Contours
At low angles of attack, the airfoil flow fields with flap heights of 1% C, 1.5% C, 2% C, and 2.5% C were identical to those of the original airfoil, and the effect of the change in flap height on the flow field was not significant. Fig. 10 shows that the low-pressure areas of the four airfoils with different flap heights were larger than those of the original airfoils. When the angles of attack were 0°, 5°, and 10°, and the flap length was 2%C, the range of the low-pressure area at the corresponding position was at the maximum. The low- and high-pressure areas on the pressure surfaces of the four aerofoils involving the flaps increased significantly. The pressure-coefficient cloud diagram shown in Fig. 6 further confirms that the aerodynamic characteristics of the airfoils can be significantly improved by installing flaps. When the flap length was 2%C, the changes in the pressure distribution and flow field structure were the most evident, and the airfoil exhibited optimal aerodynamic characteristics.
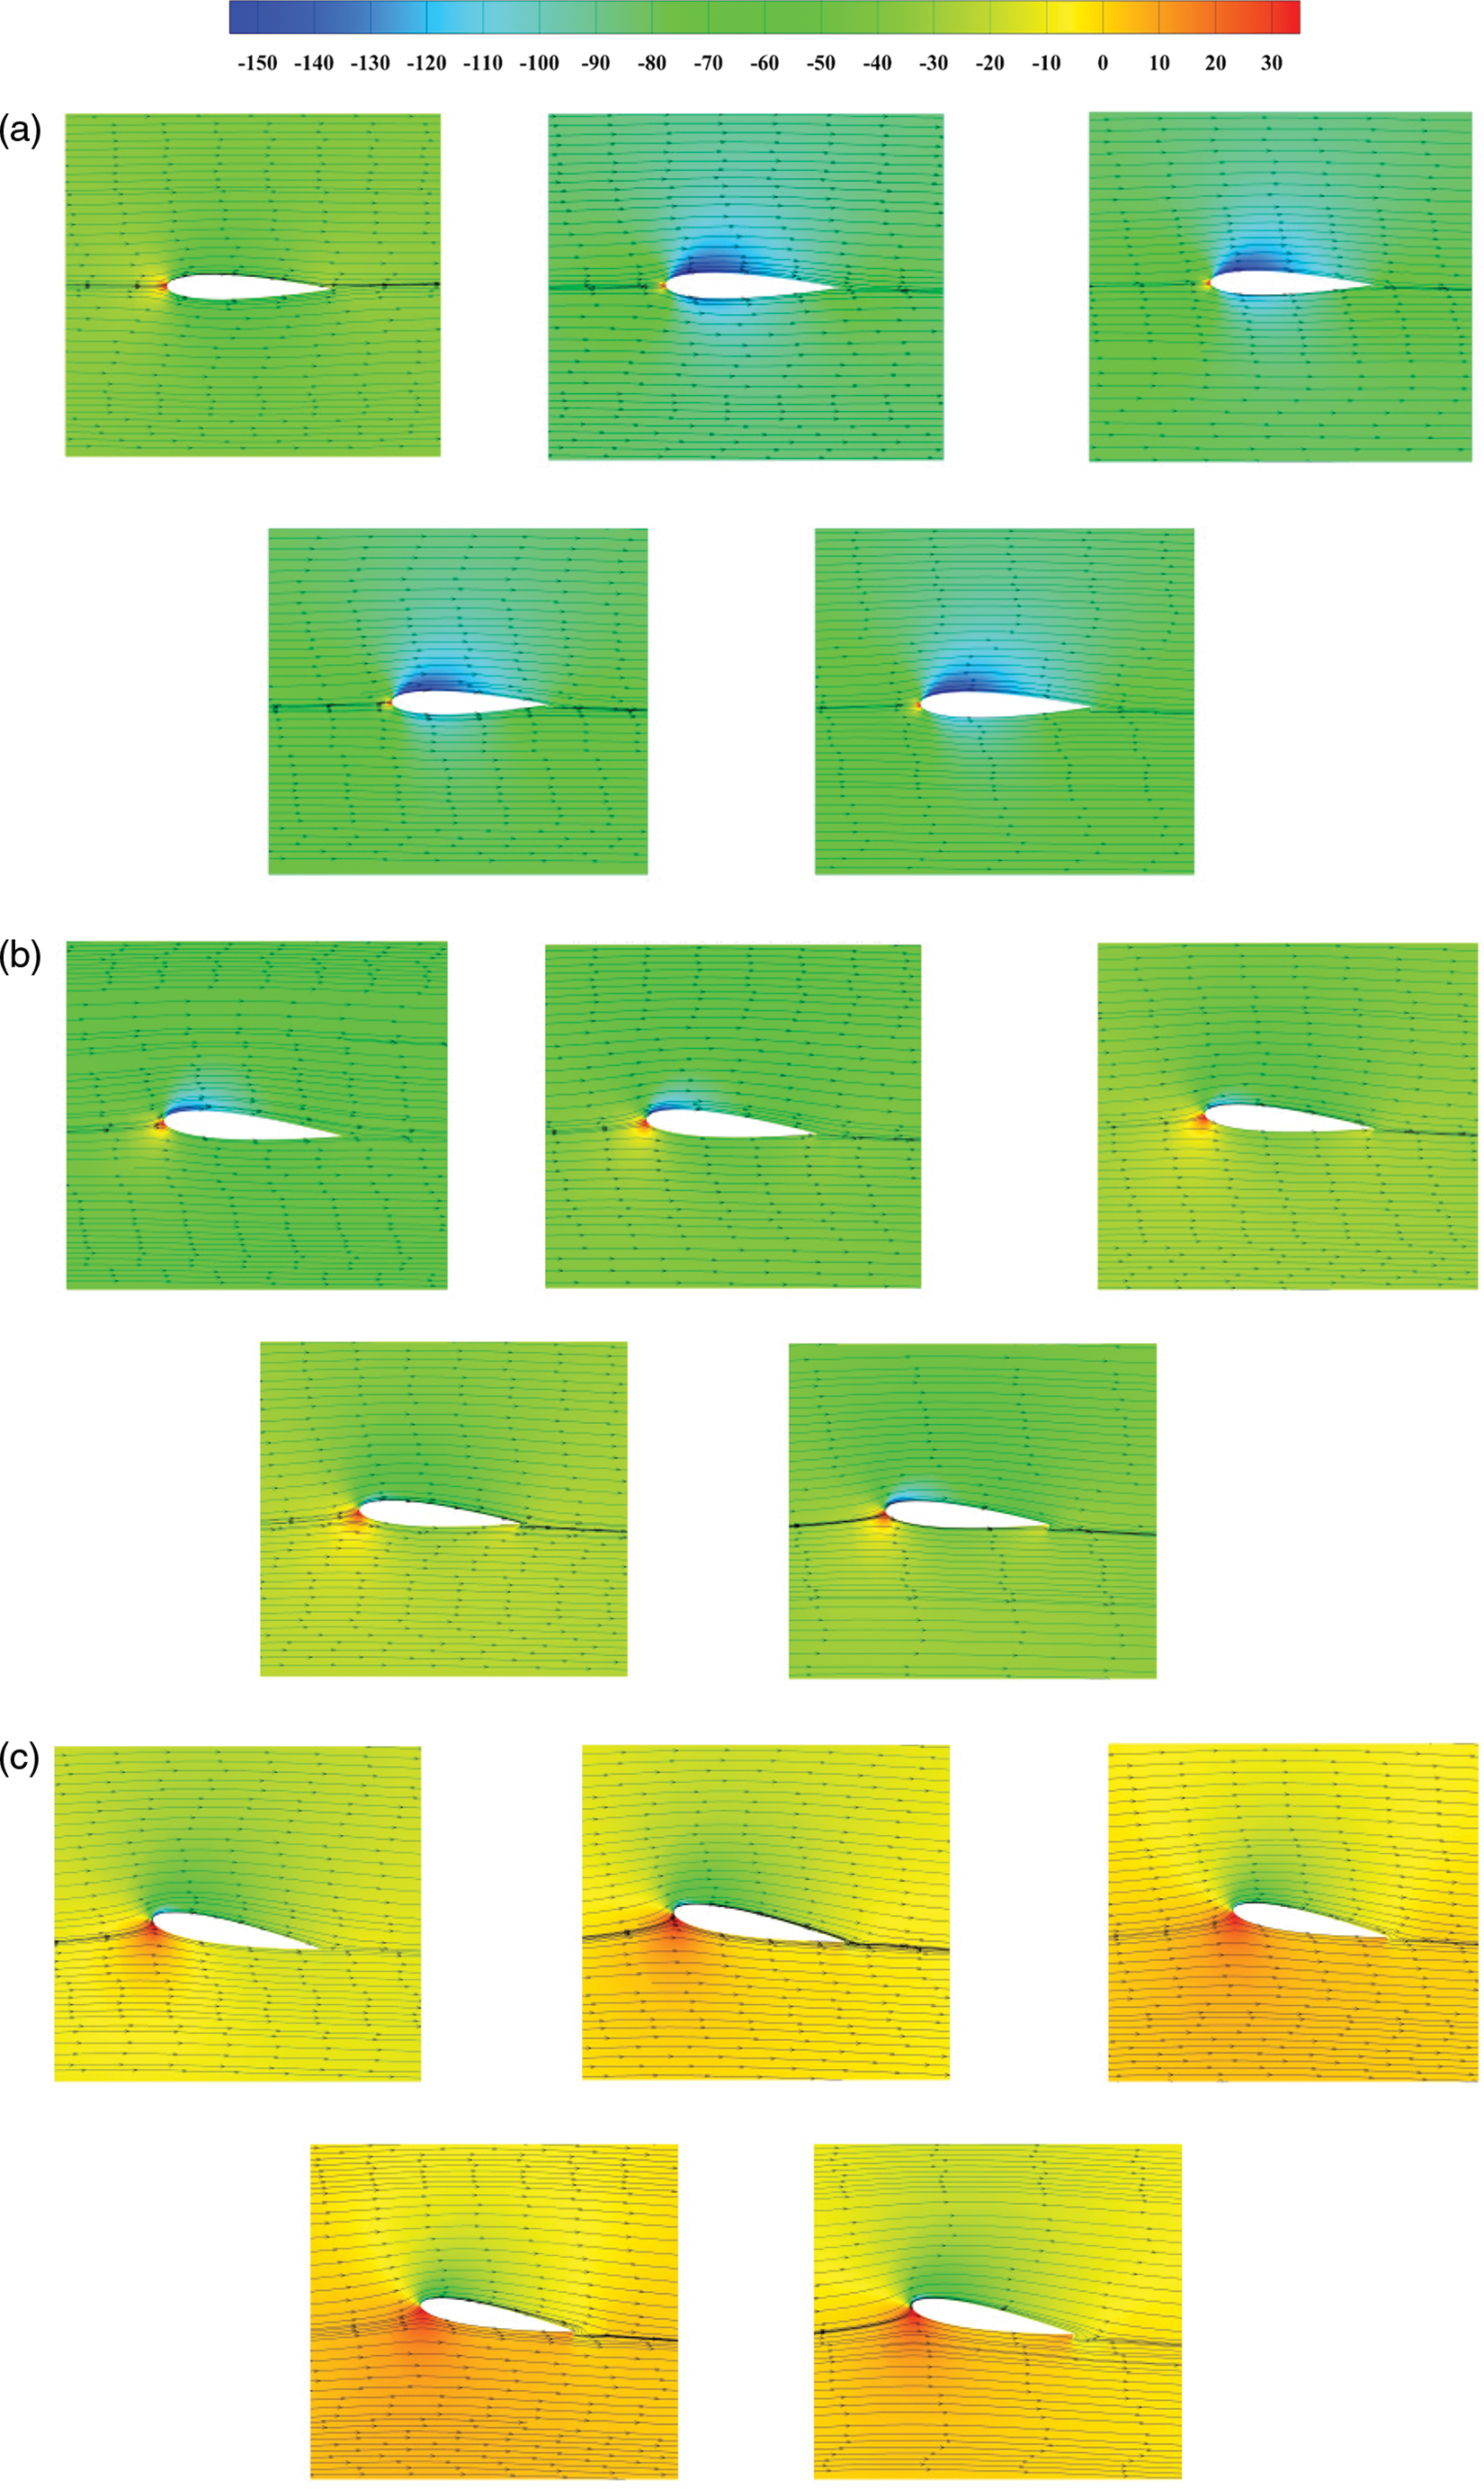
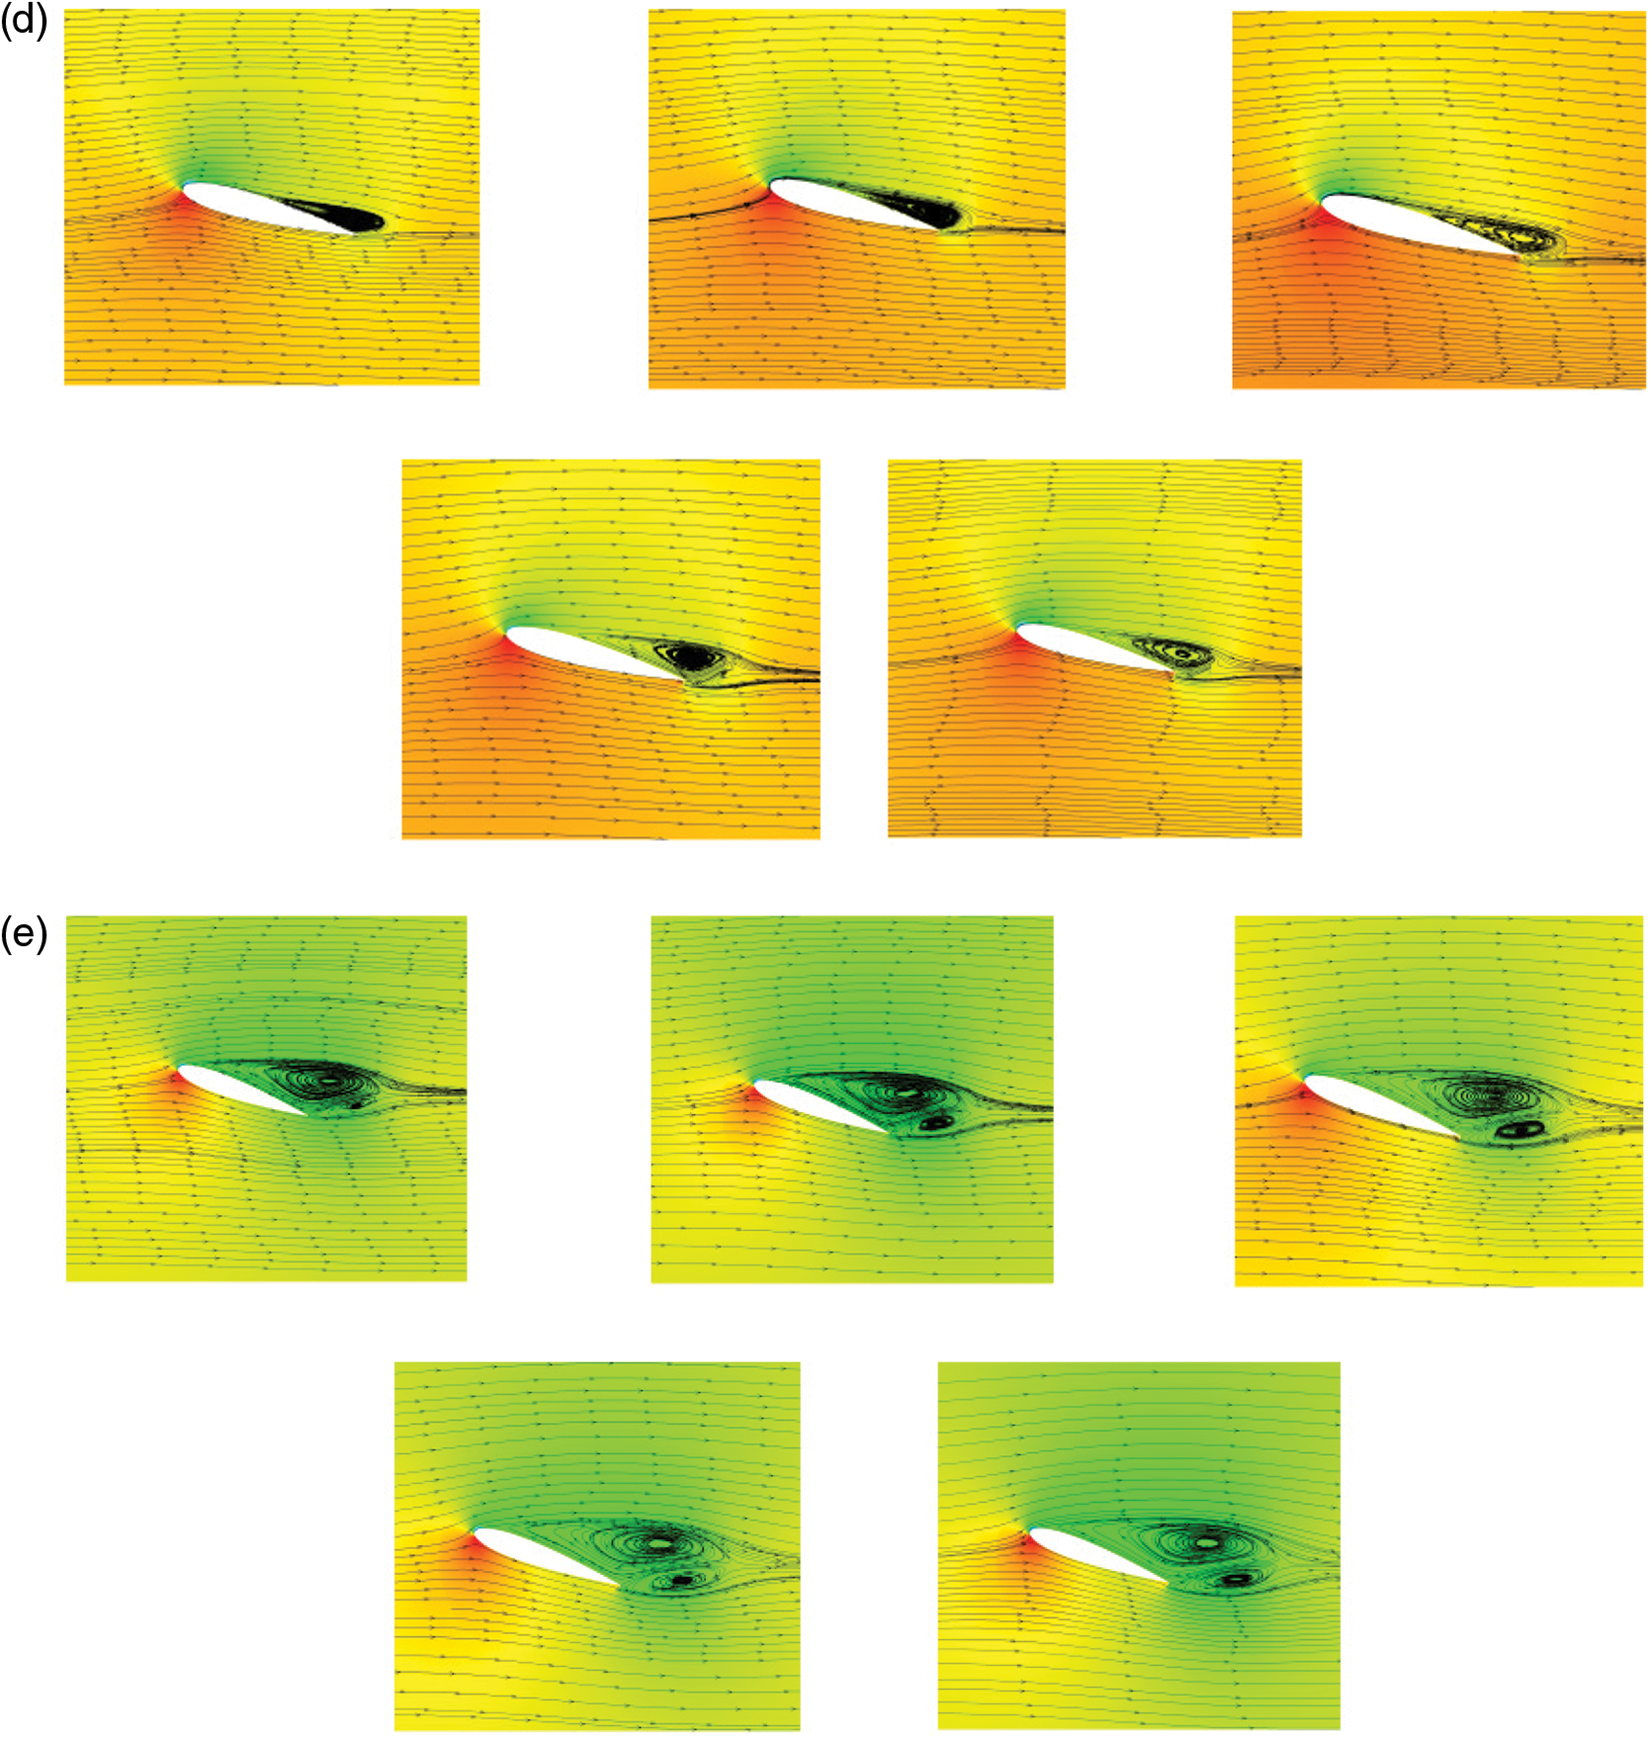
Figure 10: Flow field and pressure distributions at different attack angles (a) 0°, (b) 5°, (c) 10°, (d) 15°, and (e) 20°
As shown in Fig. 7, when the angle of attack was 15°, the airfoil was in a critical stall state. As shown in Fig. 10, a separation vortex was generated at the tail of the original airfoil, and the starting point of the separation vortex was at 1/4 chord ahead of the leading edge. The high-pressure area of the airfoil was concentrated at 1/4 chord ahead and the low-pressure area decreased slightly. None of the four airfoil separation vortices with flaps exceeded 2/3 chord of the airfoil’s leading edge. At a flap length of 1.5%C, the airfoil exhibited the best aerodynamic characteristics. When the angle of attack was 20°, the airfoil was in a complete stall state and a separation vortex was generated closer to the leading-edge point. With an increase in the flap height, the starting point of the vortex was closer to the leading-edge point, and the separation vortex tended to increase gradually. At this time, the flap length was 1.5%C and the low-pressure area on the suction surface had a larger value. At this instant, the airfoil exhibited optimal aerodynamic characteristics.
2.4 Influence of Flap Angle on Airfoil
According to the above analysis, the aerodynamic performance is optimal when the flap height is 2%C at a small angle of attack. At an angle of attack of 10°, the flap angles at the 2%C flap height were 15°, 30°, 45°, 60°, and 90°.
Figs. 11 and 12 demonstrate that, at a low angle of attack, the flap angle had a slight influence on the flow field. When the flap angle was 45°, the low-pressure and high-pressure values on the airfoil suction surface were lower and higher, respectively, and the airfoil exhibited the optimum aerodynamic performance at this angle.
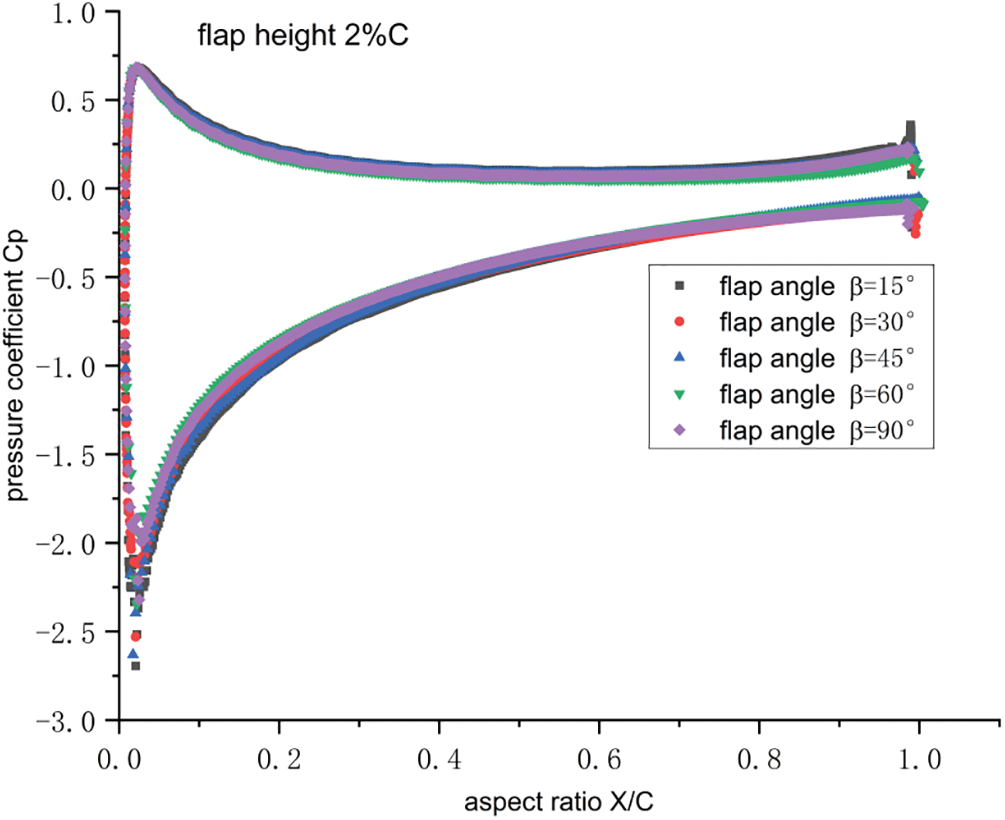
Figure 11: Pressure coefficient distribution at 2%C and different flap angles
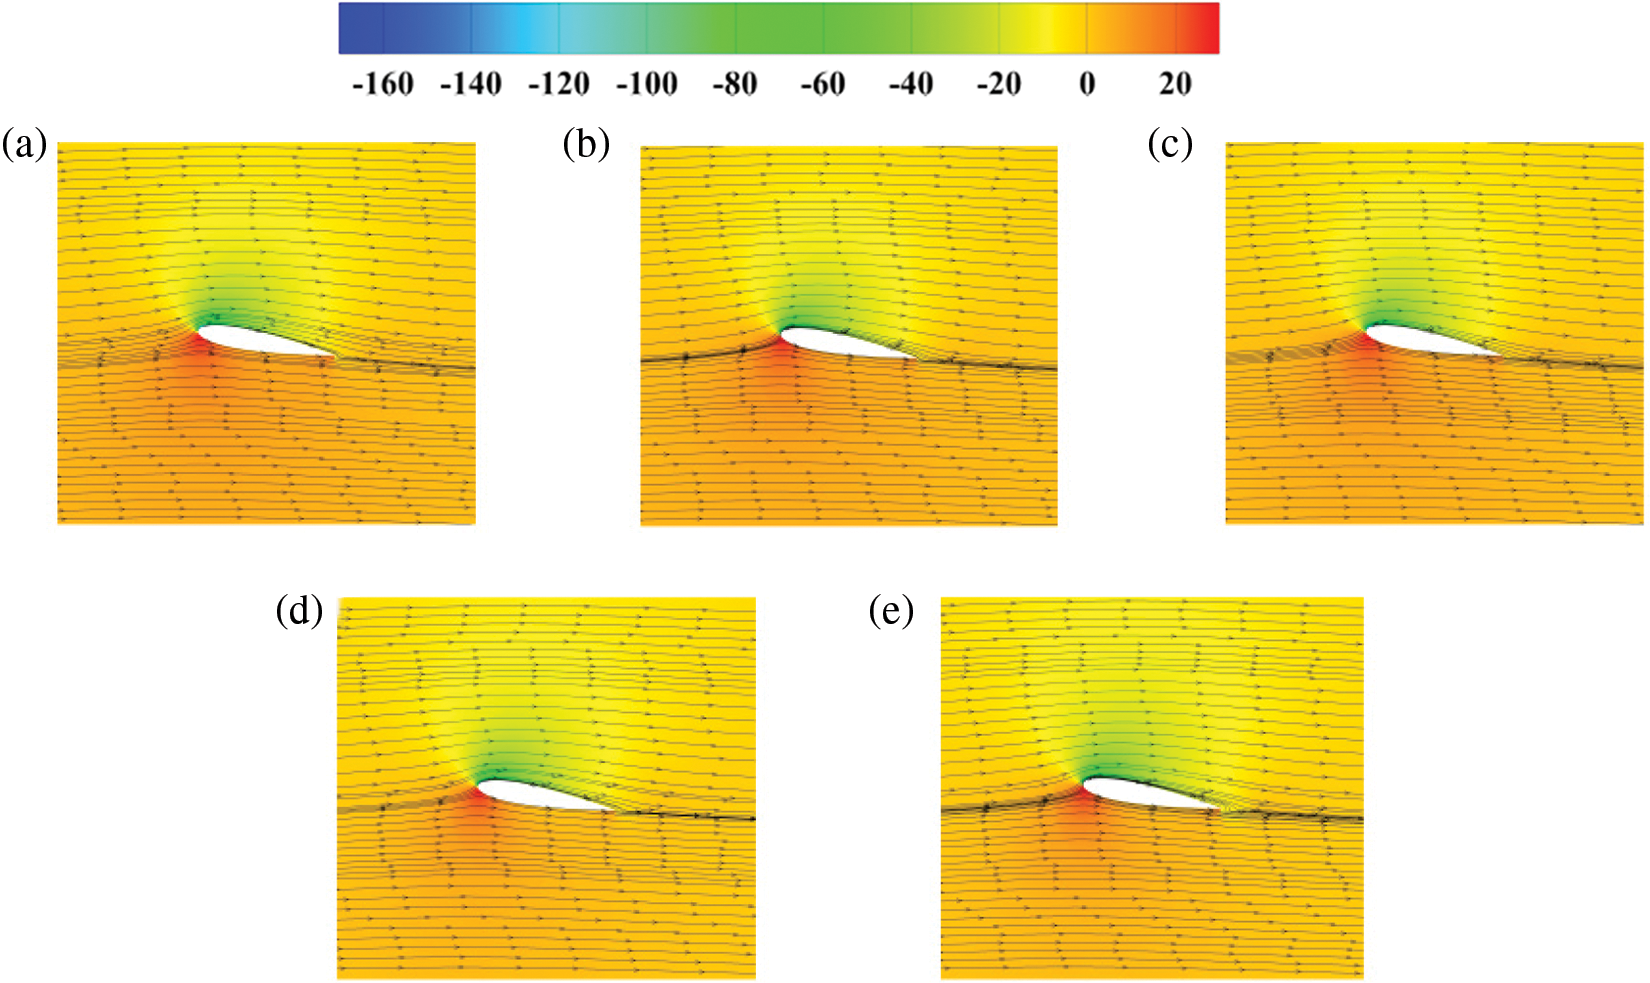
Figure 12: Flow field and pressure distributions at flap height of 2%C and different flap angles (a) 15°, (b) 30°, (c) 45°, (d) 60°, and (e) 90°
When the angle of attack was 15°, the flap angles at 1.5%C flap height were 15°, 30°, 45°, 60°, and 90°.
Figs. 13 and 14 demonstrate that airfoils with different flap angles exhibit similar trends in the pressure coefficient distribution. When the flap angle was 45°, the maximum static pressure difference of the airfoil was 245.52 Pa, which effectively reduced the generation of the separation vortex, and the airfoil exhibited the best aerodynamic performance.
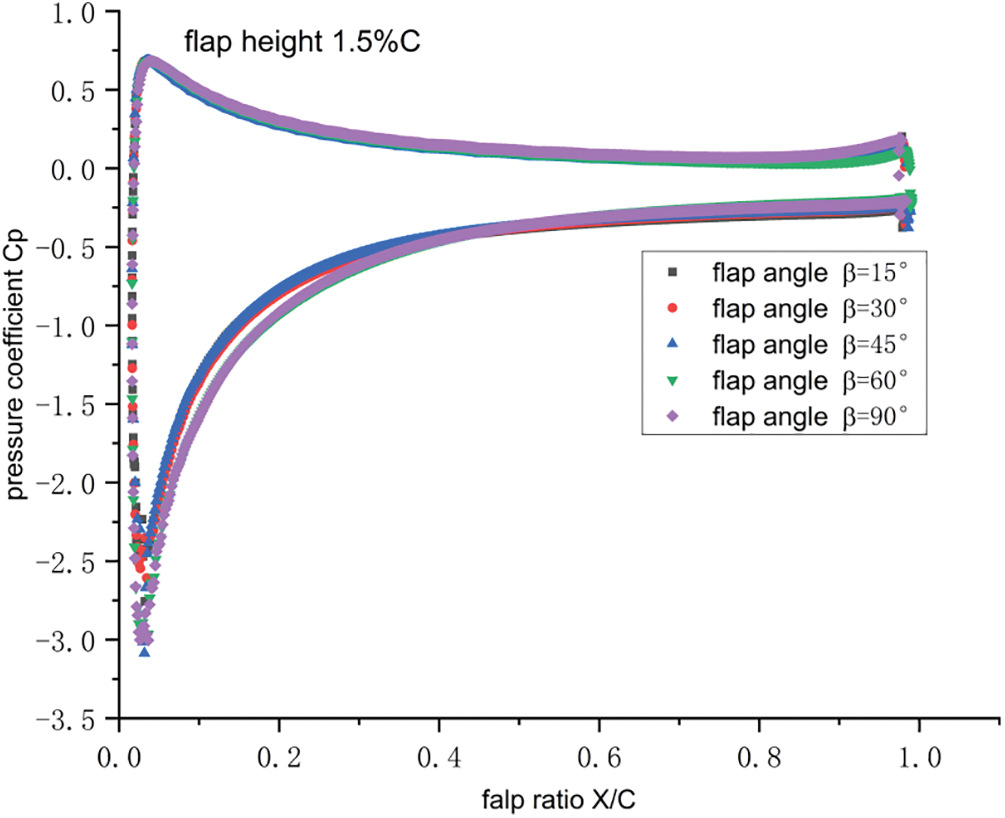
Figure 13: Pressure coefficient distribution at flap height 1.5%C and different flap angles
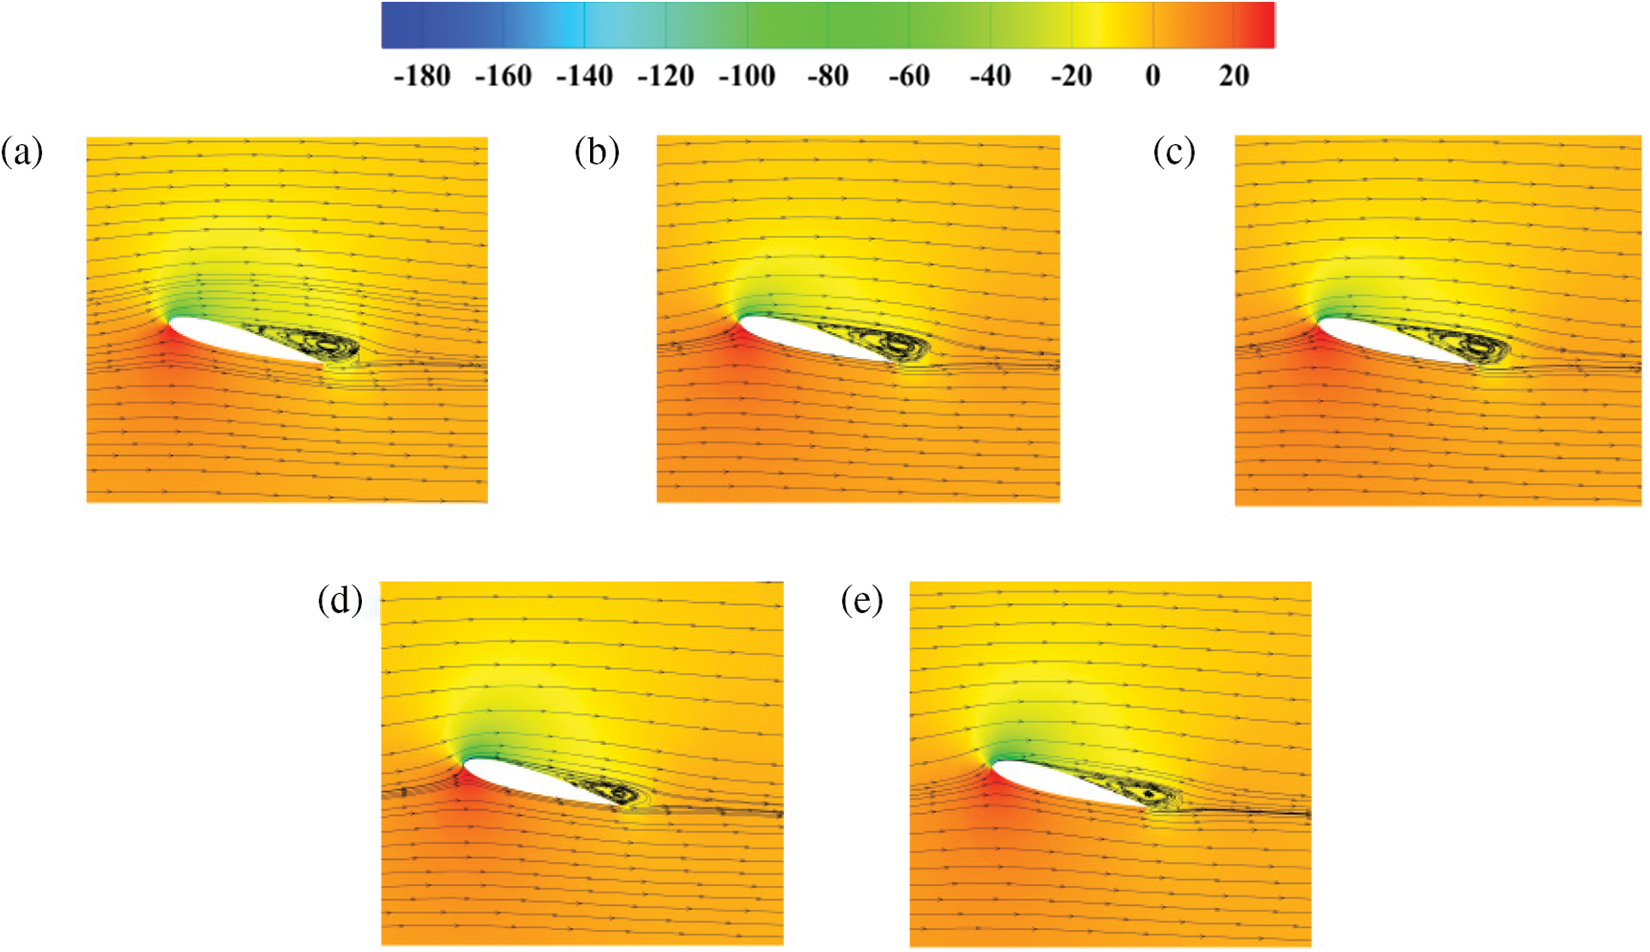
Figure 14: Flow field and pressure distributions at a flap height of 1.5%C and different flap angles (a) 15°, (b) 30°, (c) 45°, (d) 60°, and (e) 90°
Figs. 15 and 16 show that at a small angle of attack and a flap angle of 45°, the airfoil had the maximum lift-to-drag ratio, which was 7% higher than that at a flap angle of 90°. When the flap angle was 60°, the lift-to-drag ratio of the airfoil was at its maximum, which was 18.91% higher than that at a flap angle of 15°. In contrast to the flap angle of 45°, the lift-to-drag ratio increased by 18.33%. As shown in Fig. 14, a larger separation vorticity is generated at the trailing edge in the stall state, and the aerodynamic performance is drastically reduced. Therefore, reducing the generation of separation vorticity was crucial, and 45° was the optimum flap angle. In summary, the airfoil exhibited the best aerodynamic performance at a flap angle of 45° at different attack angles.
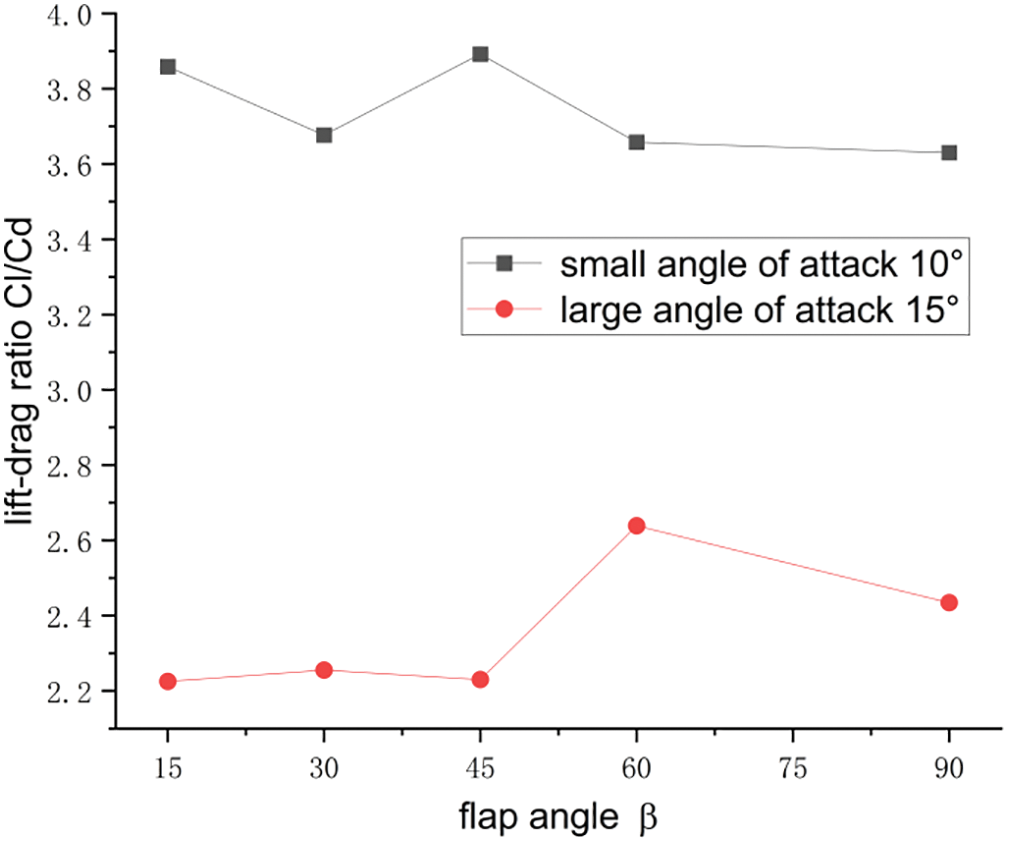
Figure 15: Lift-drag ratios at different flap angles
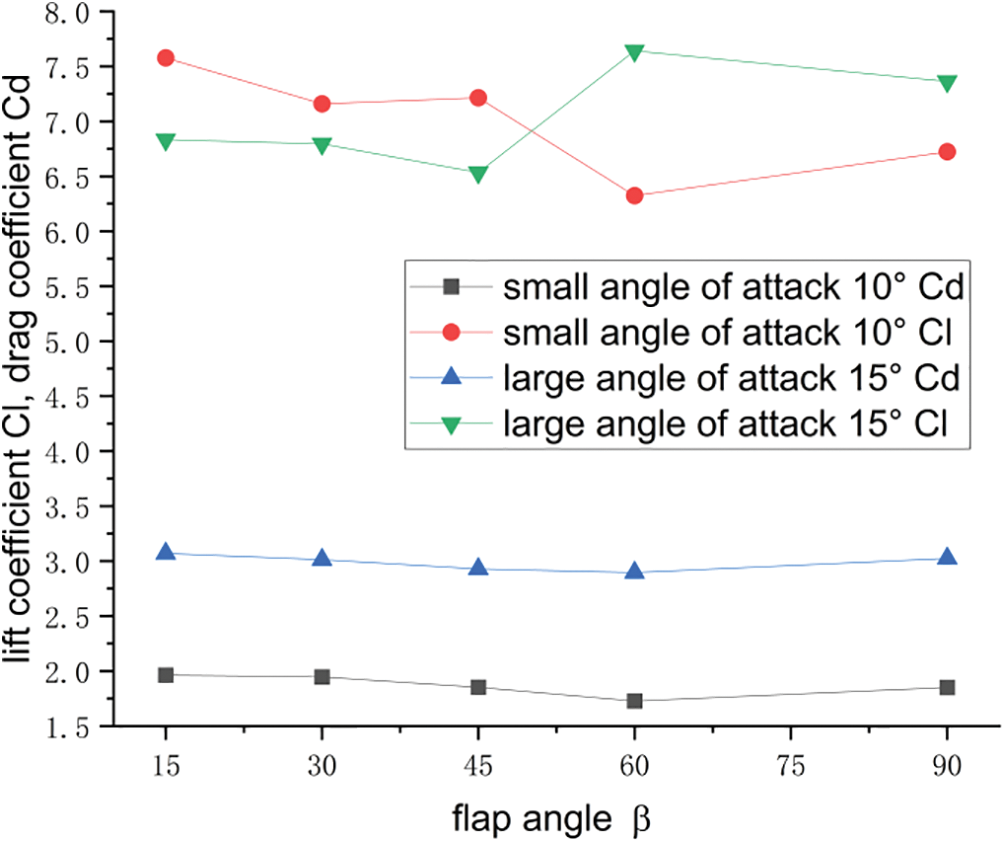
Figure 16: Lift and drag coefficients at different flap angles
A numerical simulation analysis was performed by establishing airfoil models with different flap heights and angles. The flow field variation and surface pressure coefficient distribution of the airfoil at different attack angles were compared and analyzed, and the optimal flap height and angle were selected. Three main conclusions were drawn from this study:
(1) The pressure coefficient curves of the airfoil at different flap heights indicated that the flap increased the low-pressure and high-pressure areas on the suction and pressure surfaces of the airfoil, respectively, thus improving the aerodynamic performance of the airfoil.
(2) Before the airfoil reached the stall angle of attack, the flap had a significant effect on the airfoil suction surface, whereas the pressure surface had a small effect on the flow field of the airfoil. When the airfoil reached the stall angle of attack, the flap had a significant influence on the pressure and suction surfaces as well as on the flow field; thus, the separation vortex gradually moved forward as the flap height increased.
(3) When the angle of attack was within a small angle of attack range, the flap height was 2%C, and the flap angle was 45°, the aerodynamic performance of the airfoil was optimal. However, when the angle of attack was within a large angle of attack range, the flap height was 1.5%C, and the flap angle was 45°, the generation of the separation vortex was significantly reduced, thus achieving the best aerodynamic performance.
Acknowledgement: None.
Funding Statement: This study was supported by the National Natural Science Foundation Project (Grant Numbers 51966018 and 51466015) and the Key Research & Development Program of Xinjiang (Grant Number 2022B01003).
Author Contributions: The authors confirm contribution to the paper as follows: study conception and design: Baohua Li; data collection: Cong Wang, Kunju Shi; analysis and interpretation of results: Jingan Cui, Yuanjun Dai. All authors reviewed the results and approved the final version of the manuscript.
Availability of Data and Materials: Airfoil data is available on the NACA website.
Conflicts of Interest: The authors declare that they have no conflicts of interest to report regarding the present study.
References
1. Zhang, X. W., Chen, Y. (2013). Overall design technology for large-scale wind turbine development. Progress in New Energy, 1(3), 218–223 (In Chinese). [Google Scholar]
2. Wang, Q., Huang, F., Xu, Z. (2011). Numerical simulation of influence of GURNEY flaps on aerodynamic characteristics of wind turbine blade airfoils. Fluid Machinery, 6, 21–24 (In Chinese). [Google Scholar]
3. Chen, J. Q., Ma, P., Xue, J. N. (2008). Numerical simulation of influence of flaps on aerodynamic characteristics of wind turbine blade airfoils. Fan Technology, 6, 14–16+34 (In Chinese). [Google Scholar]
4. Chen, Z. G., Li, K. L., Yang, B. (2018). Numerical study on the configuration and aerodynamic characteristics of triangular flap of wind turbine blades. Journal of Power Engineering, 38(4), 316–320+328 (In Chinese). [Google Scholar]
5. Chen, Xu, J., Dai, R. (2021). Numerical study of the aerodynamic performance of the active flap. Journal of Engineering Thermophysics, 42(4), 922–927 (In Chinese). [Google Scholar]
6. Yang, R., Guo, R., Zhang, K. K. (2020). Effects of flap height on aerodynamic performance of wind turbine. Journal of Solar Energy, 41(1), 248–253. [Google Scholar]
7. He, K. S., Chen, Y., Xiu, L. W. (2021). Aerodynamic characteristics and damping performance of wind turbine trailing edge flap. Vibration and Impact, 40(1), 198–206 (In Chinese). [Google Scholar]
8. Zhu, W. X., Yu, G. L., Tian, M. F. (2008). Research on improving wind turbine performance with Gurney flap. Renewable Energy, 2, 24–26. [Google Scholar]
9. Mohammad, M., Ya, J. S., Yong, H. X. (2012). Effects of near-wall grid spacing on SST-K-ω model using NREL Phase VI horizontal axis wind turbine. Journal of Wind Engineering and Industrial Aerodynamics, 107–108, 94–105. [Google Scholar]
10. Lee, T. (2009). Aerodynamic characteristics of airfoil with perforated gurney-type flaps. Journal of Aircraft, 46(2), 542–548. [Google Scholar]
11. Deman, T., Dowell, E. H. (2012). Aerodynamic loading for an airfoil with an oscillating gurney flap. Journal of Aircraft, 44(4), 1245–1257. [Google Scholar]
12. Riyadh, B., Abdelouaheb, D., Adrian, I., Ramzi, M. (2016). Aerodynamic performance analysis of slotted airfoils for application to wind turbine blades. Journal of Wind Engineering and Industrial Aerodynamics, 151, 79–99. [Google Scholar]
13. Li, R. J., Li, C., Li, Q. Q. (2016). The influence of flap length on airfoil hydrodynamic characteristics. The Journal of Water Resources and Hydraulic Engineering, 27(1), 158–162 (In Chinese). [Google Scholar]
14. Dai, Y. J., He, K., Li, B. H., Zhai, M. C. (2022). Effect of double-fork blade tip structure on wind turbine vibration. Journal of Drainage and Irrigation Machinery Engineering, 40(3), 276–281 (In Chinese). [Google Scholar]
15. Li, R. J., Zu, H. Y., Li, C. (2016). Effect of flap slot relative width on airfoil dynamic aerodynamic performance. Thermal Power Engineering, 31(4), 7 (In Chinese). [Google Scholar]
16. Wang, J. H., Gong, D. Q., Liu, X. M., Tian, C. Y., Wang, Y. et al. (2022). The aerodynamic performance of a multi-wing centrifugal fan with C-type start-up blade was studied. Journal of Xi’an Jiaotong University, 56(9), 57–68 (In Chinese). [Google Scholar]
17. Wu, J. H., Zhu, C. Y., Chen, K., Wang, T. G., Zhao, N. (2020). Effects of different tip configurations on aerodynamic characteristics of large wind turbine blades. Journal of Engineering Thermophysics, 41(11), 2742–2746. [Google Scholar]
18. Jiang, R. F., Zhao, Z. Z., Feng, J. X., Meng, L. Y., Chen, M. et al. (2021). Numerical study on flow control of wind turbine blade by vortex generator. Journal of Engineering Thermophysics, 41(12), 3170–3177. [Google Scholar]
19. Li, Y., Zhang, T. T., Tian, C., Feng, F., Zheng, Y. F. et al. (2017). Numerical simulation of torque characteristics of vertical axis wind turbine with curved blade trailing edge. Journal of Northeast Agricultural University, 48(3), 72–79 (In Chinese). [Google Scholar]
20. Sima, H., Tong, H., Wu, Z. C., Huang, D. G. (2019). Experimental study on the influence of leading edge microplate on airfoil aerodynamic performance. Thermal Power Engineering, 34(11),116–122 (In Chinese). [Google Scholar]
21. Cui, Z., Gao, H., Han, D., Li, J. B. (2018). The influence of Goni flap on low Reynolds number airfoil flow field is studied. Computer Simulation, 35(7), 15–21 (In Chinese). [Google Scholar]
22. Hamzah, J., Laith, A. S., Abdulkareem, K., Till, B. (2023). Aerodynamics improvement of DU97-W-300 wind turbine flat-back airfoil using slot-induced air jet. International Journal of Thermofluids, 17, 100267. [Google Scholar]
23. van, D., Jeffrey, P., George, D. R. (1984). Enhancements of the SIMPLE method for predicting incompressible fluid flows. Numerical Heat Transfer, 7(2), 147–163. [Google Scholar]
24. Cui, X. W., Lai, H. X., Zhao, L. (2014). Comparison of time discrete formats based on SIMPLE algorithm. Journal of Engineering Thermophysics, 35(3), 476–479. [Google Scholar]
Cite This Article
 Copyright © 2024 The Author(s). Published by Tech Science Press.
This work is licensed under a Creative Commons Attribution 4.0 International License , which permits unrestricted use, distribution, and reproduction in any medium, provided the original work is properly cited.
 Downloads
 Citation Tools