
 Submit a Paper
 Propose a Special lssue
 Open Access
ARTICLE

Impact of Proppant Embedding on Long-Term Fracture Conductivity and Shale Gas Production Decline
1 Development Department, PetroChina Southwest Oil & Gasfield Company, Chengdu, 610000, China
2 PetroChina Southwest Oil & Gasfield Company, Chengdu, 610051, China
3 Shale Gas Research Institute, PetroChina Southwest Oil & Gasfield Company, Chengdu, 610056, China
4 State Key Laboratory of Oil and Gas Reservoir Geology and Exploitation, Southwest Petroleum University, Chengdu, 610500, China
* Corresponding Author: Weiyi Luo. Email:
(This article belongs to the Special Issue: Fluid and Thermal Dynamics in the Development of Unconventional Resources III)
Fluid Dynamics & Materials Processing 2025, 21(10), 2613-2628. https://doi.org/10.32604/fdmp.2025.069772
Received 30 June 2025; Accepted 28 September 2025; Issue published 30 October 2025
 View Full Text
 Download PDF
Abstract
In shale gas reservoir stimulation, proppants are essential for sustaining fracture conductivity. However, increasing closing stress causes proppants to embed into the rock matrix, leading to a progressive decline in fracture permeability and conductivity. Furthermore, rock creep contributes to long-term reductions in fracture performance. To elucidate the combined effects of proppant embedding and rock creep on sustained conductivity, this study conducted controlled experiments examining conductivity decay in propped fractures under varying closing stresses, explicitly accounting for both mechanisms. An embedded discrete fracture model was developed to simulate reservoir production under different conductivity decay scenarios, while evaluating the influence of proppant parameters on fracture performance. The results demonstrate that fracture conductivity diminishes rapidly with increasing stress, yet at 50 MPa, the decline becomes less pronounced. Simulated production profiles show strong agreement with actual gas well data, confirming the model’s accuracy and predictive capability. These findings suggest that employing a high proppant concentration with smaller particle size (5 kg/m2, 70/140 mesh) is effective for maintaining long-term fracture conductivity and enhancing shale gas recovery. This study provides a rigorous framework for optimizing proppant selection and designing stimulation strategies that maximize reservoir performance over time.Keywords
In recent years, the petroleum industry has conducted extensive oil and gas exploration work in shale-bearing areas, and several large shale oil and gas fields have been discovered around the world. Due to the compactness of shale reservoirs, hydraulic fracturing technology must be used to modify the reservoirs. Artificial fractures generated under closing stress will gradually close. Therefore, proppants must be placed in the artificial fractures to support the fractures and maintain a certain flow capacity. However, the fractures will gradually close due to the closing stress, causing the proppants to embed into the fracture walls. This phenomenon causes changes in the flow capacity of the cracks, thereby affecting production. Li et al. [1] analyzed the laws of proppant embedding from both macro and micro perspectives through theoretical analysis and experimental research on single proppant embedding. Lu et al. [2] proposed a numerical model of the elastic-plastic deformation of proppants embedded in rough fracture surfaces and combined it with mechanical experiments. The results showed that the degree of proppant embedding varied in different areas of the rough fracture surface. Lu et al. [3]. conducted shale self-permeability experiments, established a mathematical model of hydration depth, and constructed a mathematical model of coarse crack proppant embedding that considers the entire elastic-plastic-plastic stage. The observation results show that as the closing stress increases, the degree of proppant embedding in the oil-based shale is significantly weaker than that in the distilled water-based shale. The embedding of proppants affects the flow capacity of fractures, which in turn affects overall production. Therefore, it is also very important to consider production assessment methods that take proppant embedding into account. Chen et al. [4] proposed a novel DeepONet embedded physical information neural network (DE-PINN), which demonstrated better performance than traditional data-driven machine learning models in predicting productivity and cumulative yield. Xue et al. [5] established three data-driven models to reevaluate the oil content of long-producing wells. The results showed that the radio frequency model performed best, with an accuracy rate of 95.07%, while the neural network model had the poorest predictive ability, with an accuracy rate of only 79.8%. Tian et al. [6] used Gaussian membership functions to define fuzzy levels and the entropy weight method to determine the weights of the principal components, thereby establishing a fuzzy comprehensive evaluation model for reservoir quality. Field applications showed that the average prediction accuracy rate for the cumulative oil production per kilometer of fracture length within 12 months for 10 injection wells was 91.8%. In summary, within the field of proppant embedding research, the integration of theoretical models and experimental studies has established a relatively comprehensive research framework. This spans from the microscopic behaviour of individual particles to the macroscopic design of multi-particle sand placements, from coal seams to shales, and from dry conditions to hydrated conditions. According to prior reports, factors influencing proppant embedding typically include proppant particle size, proppant modulus, surface roughness, rock modulus, and Poisson’s ratio. Notably, proppant embedding impacts long-term flow capacity; consequently, investigating its effects on sustained flow capacity and production decline is essential.
Enhancing the comprehension of the viscoelastic mechanical properties of reservoir rocks is becoming increasingly crucial due to the extensive development of unconventional oil and gas resources [7,8,9,10]. The current experimental investigation into the dynamic effects of viscoelasticity in rock materials has largely established that the power law distribution, characterized by a long tail and low attenuation, significantly outperforms the previously utilized exponential distribution for fitting creep or relaxation curves [11,12,13,14]. Fractional-order calculus, which preserves the convolutional properties of Volterra genetic integrals, is more suitable for describing time-dependent, path-dependent, and nonlocal properties [15,16,17], and the creep decay pattern obtained from the fractional-order eigenequations is precisely in the power-law form. Consequently, the utilization of fractional-order calculus for rock viscoelasticity has progressively increased in recent years [18,19,20]. Many scholars have made important contributions in the fields of creep test data correction and fractional-order numerical methods [21,22,23].
Di Paola et al. [24] posited that in relaxation trials, the variation of stressors aligns more closely with a power law distribution than with an exponential distribution. They experimentally verified the accuracy of the fractional order model and pointed out the advantages of the fractional order model over the classical component model. Ma et al. [25] proposed a rock salt creep damage model by introducing a non-steady-state modular component into the Burgers viscoelastic model. Wang et al. [26] established a new nonlinear viscoelastic plastic creep model for deep soft rock based on the Nishihara model, replacing the classical linear element with a nonlinear rheological element containing an exponential equation. This model can describe the three stages of rock nonlinearity. Similarly, Ou et al. [27] developed a novel nonlinear viscoelastic plastic soil rheological model based on the Nishihara model by incorporating a nonlinear Hookean element. This model effectively captures the rheological characteristics of both artificial and natural soft clays. Meng et al. [28] provided a fractional-order description of the time-dependent mechanical behavior of strain-softened materials. They derived leading order fitting formulas that can compute experimental curves of strain-softened materials at different degrees of strain, and the variable order problem was considered to be a superposition form of numerical integration.
A comparative analysis of the aforementioned studies on reservoir rock creep behavior indicates that some scholars have made progress in this field [29,30,31]. However, current research primarily focuses on optimizing classical models and validating theoretical frameworks through experimental data fitting, lacking a systematic integration of productivity models. Building on this foundation, this study derives empirical formulas for reservoir rock creep through experimental fitting and directly integrates them into productivity models to quantitatively analyze the dynamic impact of creep effects on gas well productivity. This approach avoids the limitations of complex theoretical derivations, clearly elucidates the correlation between the viscoelastic mechanical behavior of rocks and productivity decline, and provides actionable theoretical support for practical development.
This study establishes a conductivity attenuation model based on experimental fitting and simulates gas well productivity using an embedded discrete fracture model. Subsequently, the simulation results were compared with real-world data to validate the model’s accuracy. Finally, the effects of proppant embedment depth, rock creep, and various proppant parameters on fracture flow capacity and gas production were analyzed.
2 Experimental Fitting of Flow Conductivity Attenuation Model
In order to analyze the effects of proppant embedment and creep on fracture flow conductivity, this study investigated the decay patterns of fracture flow conductivity under different proppant filling conditions through long-term flow experiments. Empirical formulas are fitted based on experimental results to assign values to fracture unit grids in the gas well productivity model.
2.1 Origin of Experimental Rock Samples
The rock samples for the fracture flow conductivity experiments were collected from shale outcrops in the western Chongqing and Luzhou regions, which exhibit typical geological characteristics of marine shale reservoirs. Field geological surveys were conducted to select samples with intact bedding planes and well-developed natural microfracture networks.
The long-term flow conductivity experiments utilized the FCS-842 fracture conductivity testing system developed by TEMCO Inc. (Tulsa, OK, USA). This system is designed to determine fracturing conductivity or proppant-packed layer permeability under simulated downhole conditions in the laboratory. It evaluates the long-term fracture conductivity relationships between proppants, fracturing fluid systems, hydrocarbon types, or flow rates. Key parameters include a maximum closure pressure of 138 MPa, a maximum temperature of 177°C, and a fluid flow rate of 0–50 mL/min. The system meets API standards and satisfies the requirements for oil and gas field development (Fig. 1).
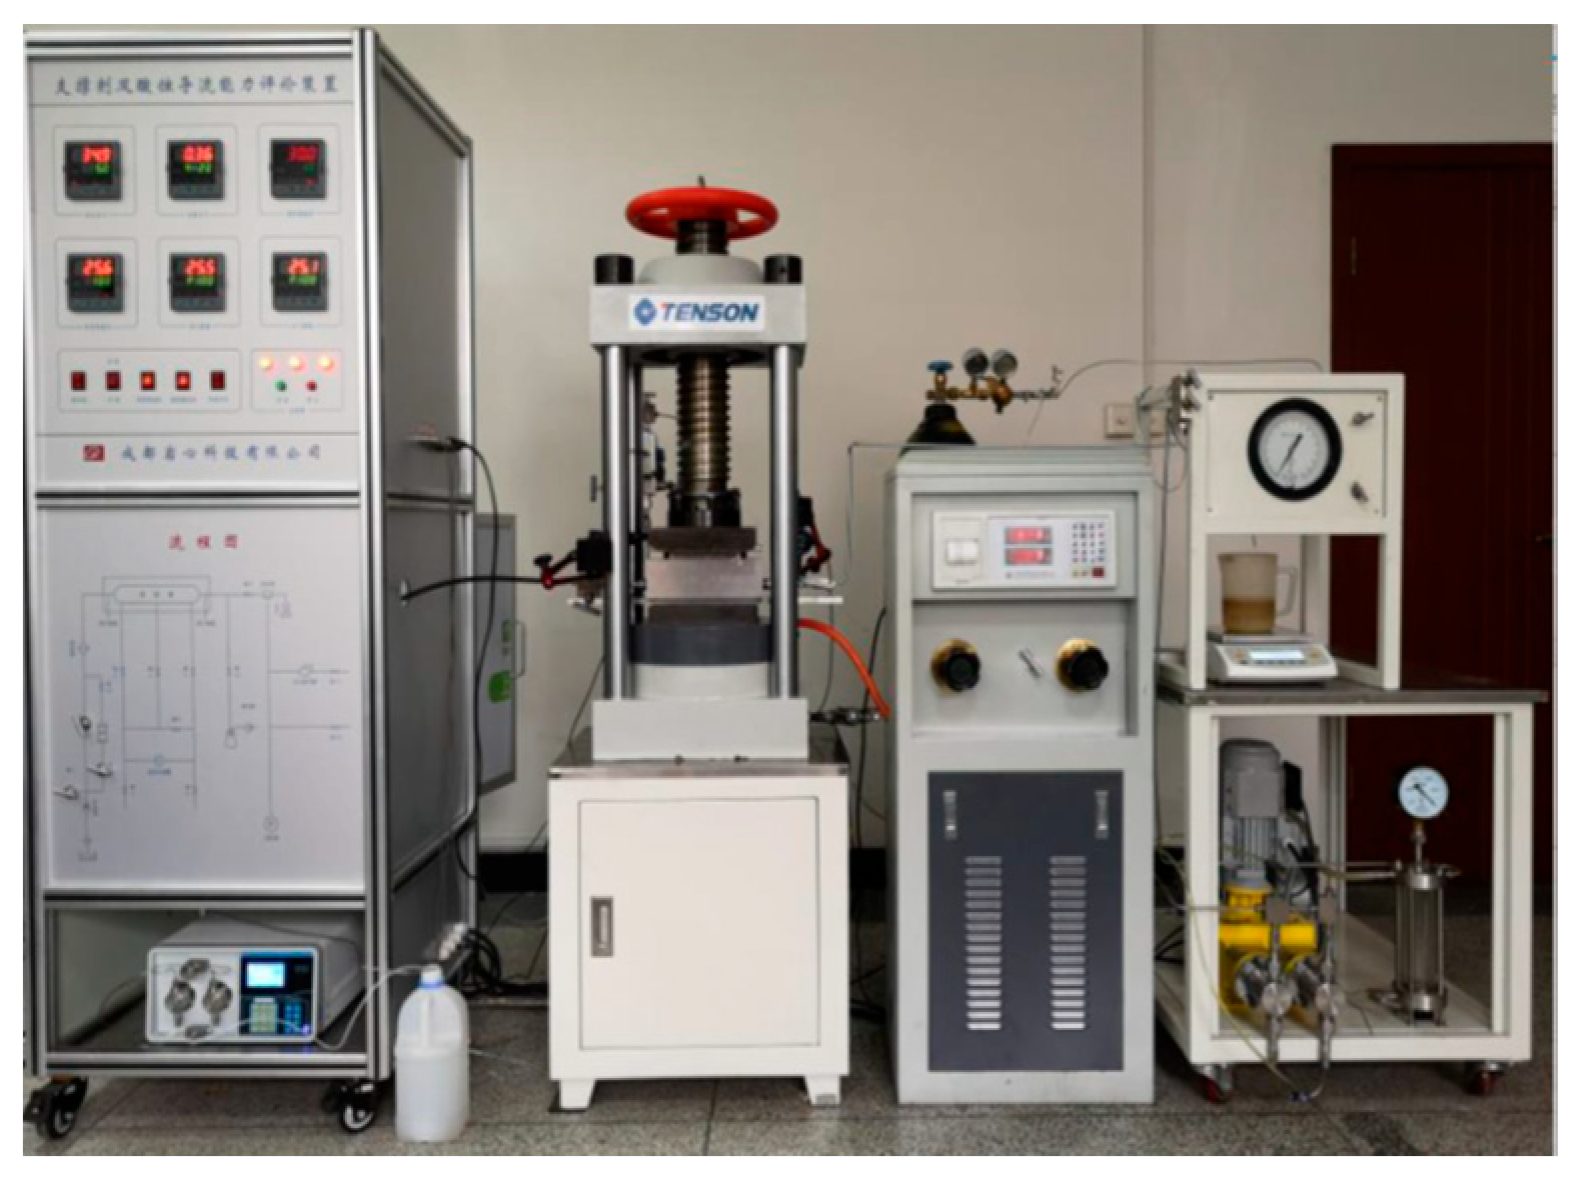
Figure 1: Fracture flow conductivity testing apparatus.
Experimental rock plates were prepared perpendicular to the bedding direction to maximize fluid contact with shale bedding. The preparation steps are as follows:
Irregular shale outcrops were cut into square plates measuring 180–182 mm in length, 40–42 mm in width, and 15–17 mm in height using rock processing equipment. The end faces of the plates were polished and further refined to dimensions of 177.4 ± 0.4 mm in length, 37.6 ± 0.5 mm in width, and 12 ± 0.5 mm in thickness. The plate ends were curved to match the testing apparatus (Fig. 2), with thickness variations controlled within 0.02 mm (Fig. 3).
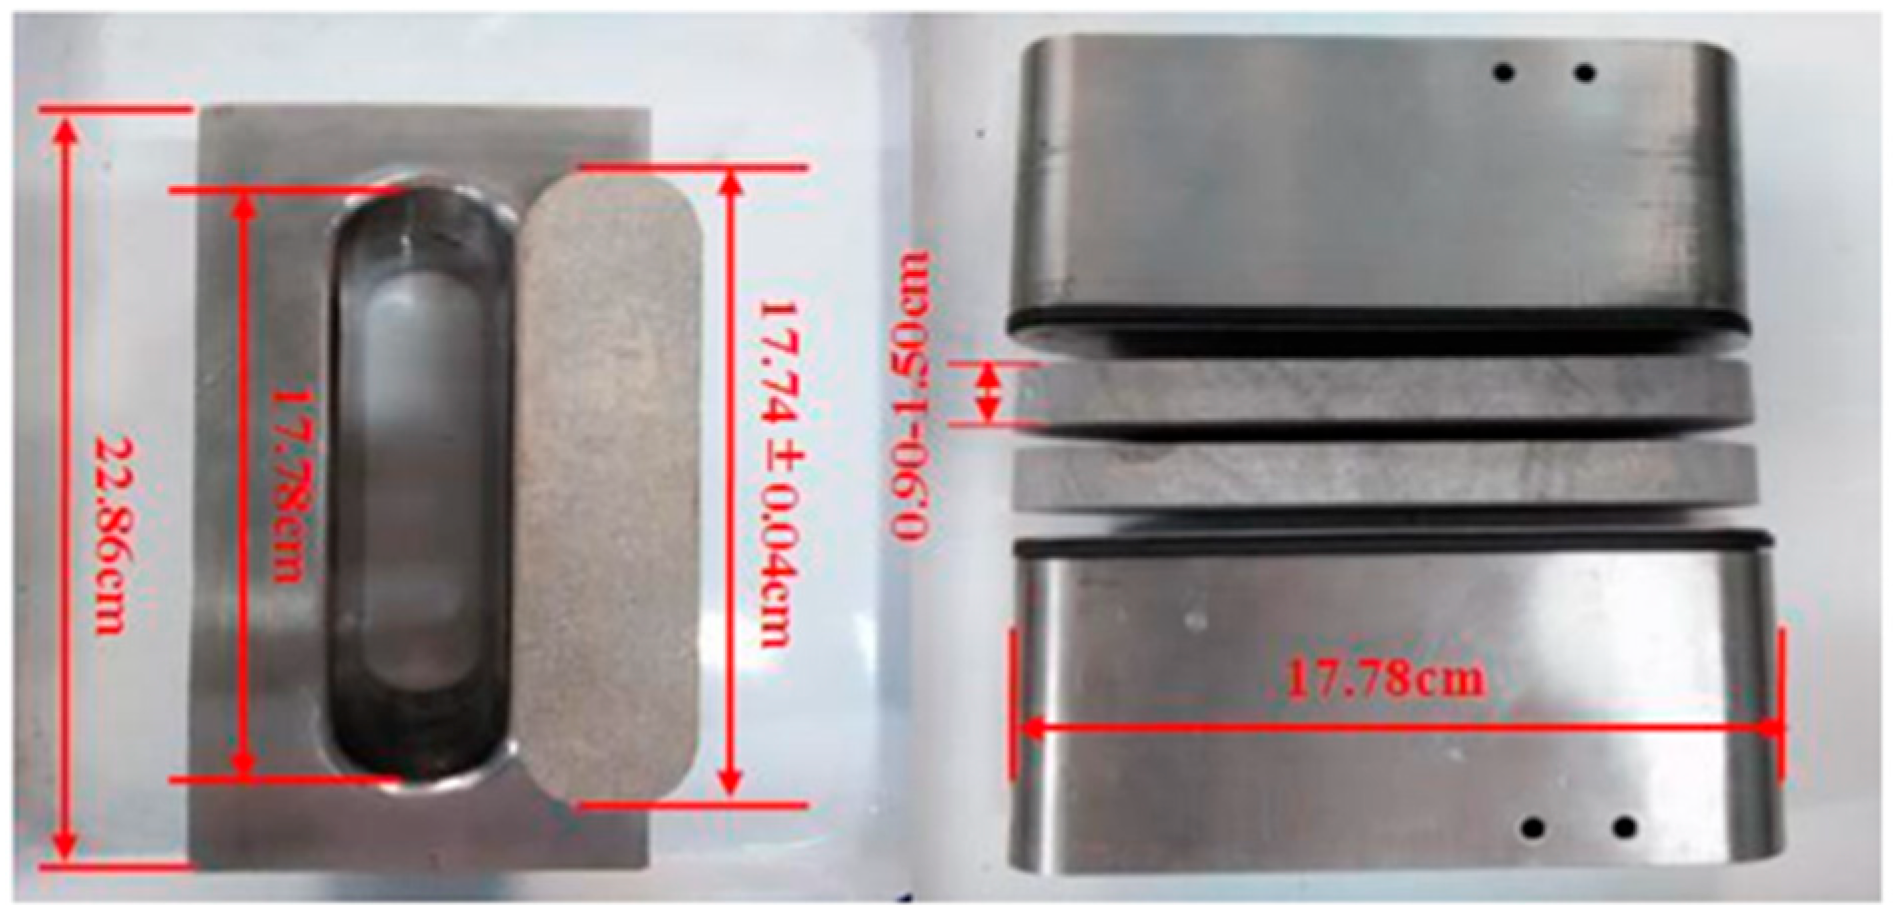
Figure 2: Dimensions of rock samples.
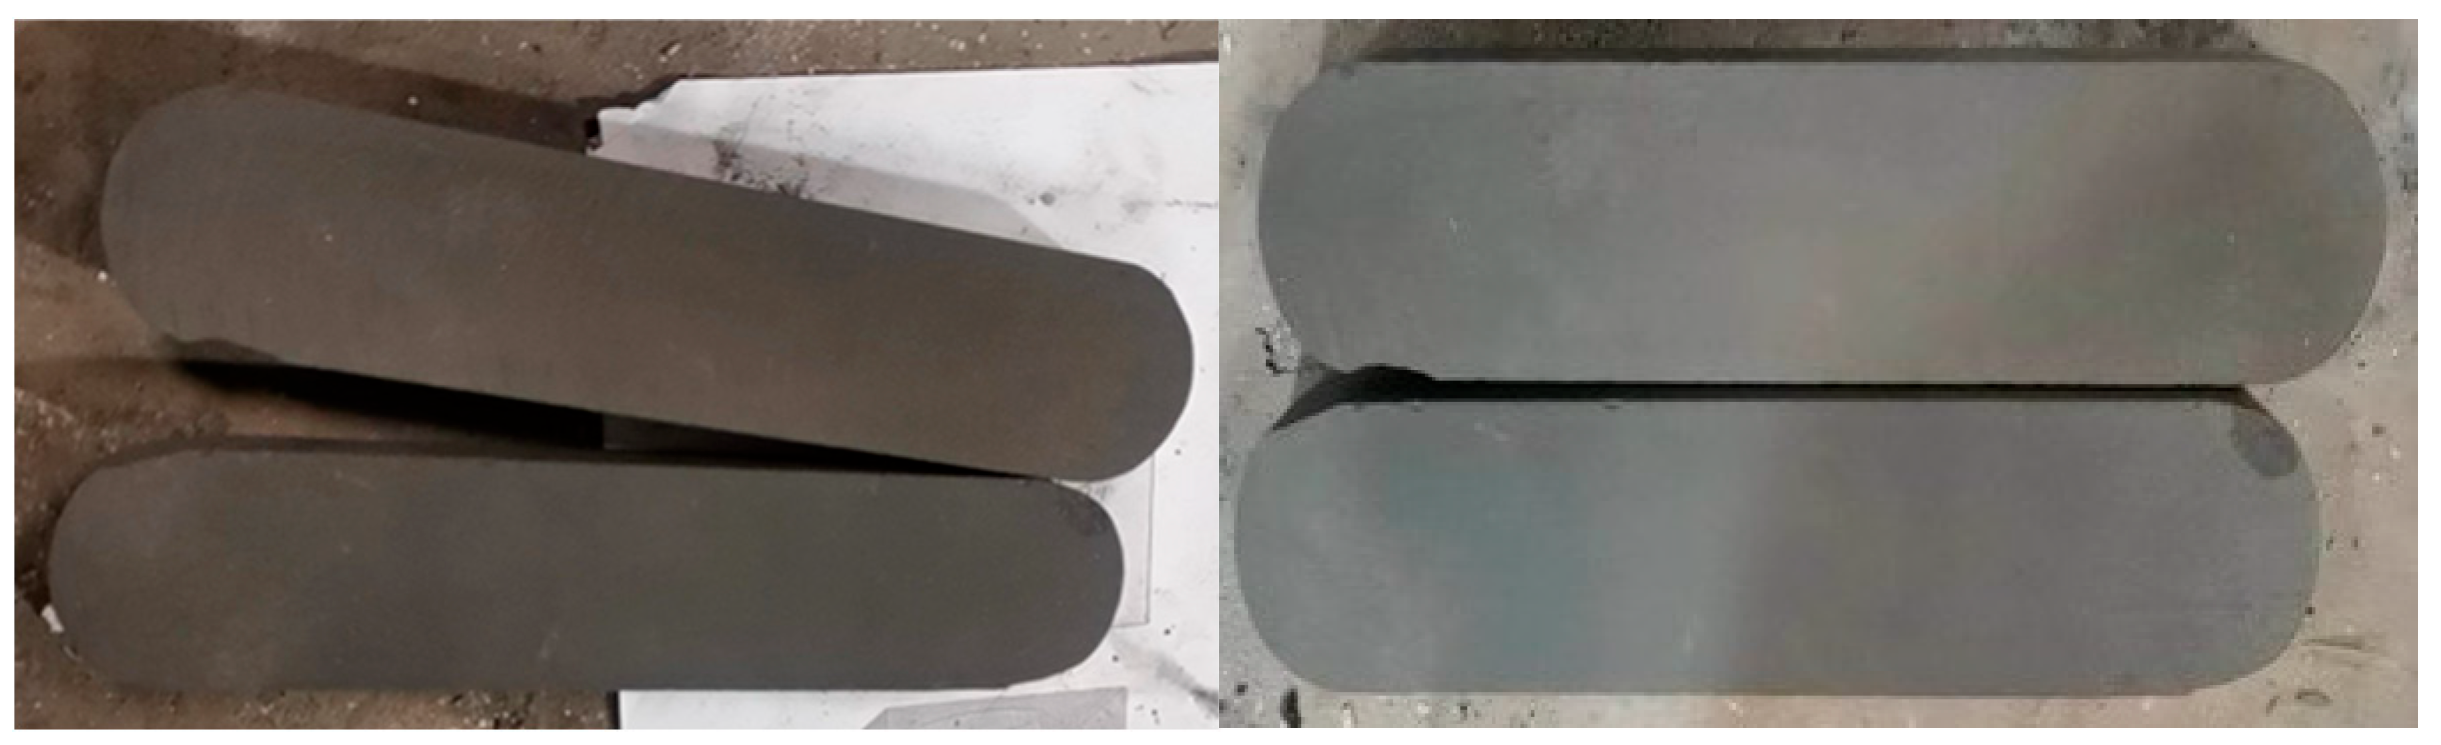
Figure 3: Processed rock plates.
The experimental apparatus operates based on Darcy’s Law:
Using an API-standard modified flow cell with
The conductivity of the proppant-packed layer is expressed as:
Closure pressure was incrementally applied starting at 5 MPa, with steps of 15 MPa up to 50 MPa (4 pressure points total). Each pressure level was maintained for 50 ± 2 h. To simulate actual reservoir conditions, the temperature was set to 60°C, and the fluid flow rate was 2 mL/min (Table 1):
Table 1: Experimental plan.
| Number | Proppant | Grain Size | Sand Concentration (kg/m2) |
|---|---|---|---|
| 1 | ceramsite | 40/70 | 2.5 |
| 2 | ceramsite | 40/70 | 5.0 |
| 3 | ceramsite | 70/140 | 2.5 |
| 4 | ceramsite | 70/140 | 5.0 |
| 5 | silica sand | 40/70 | 2.5 |
| 6 | silica sand | 40/70 | 5.0 |
| 7 | silica sand | 70/140 | 2.5 |
| 8 | silica sand | 70/140 | 5.0 |
The experimental results for flow conductivity are shown below (Fig. 4):
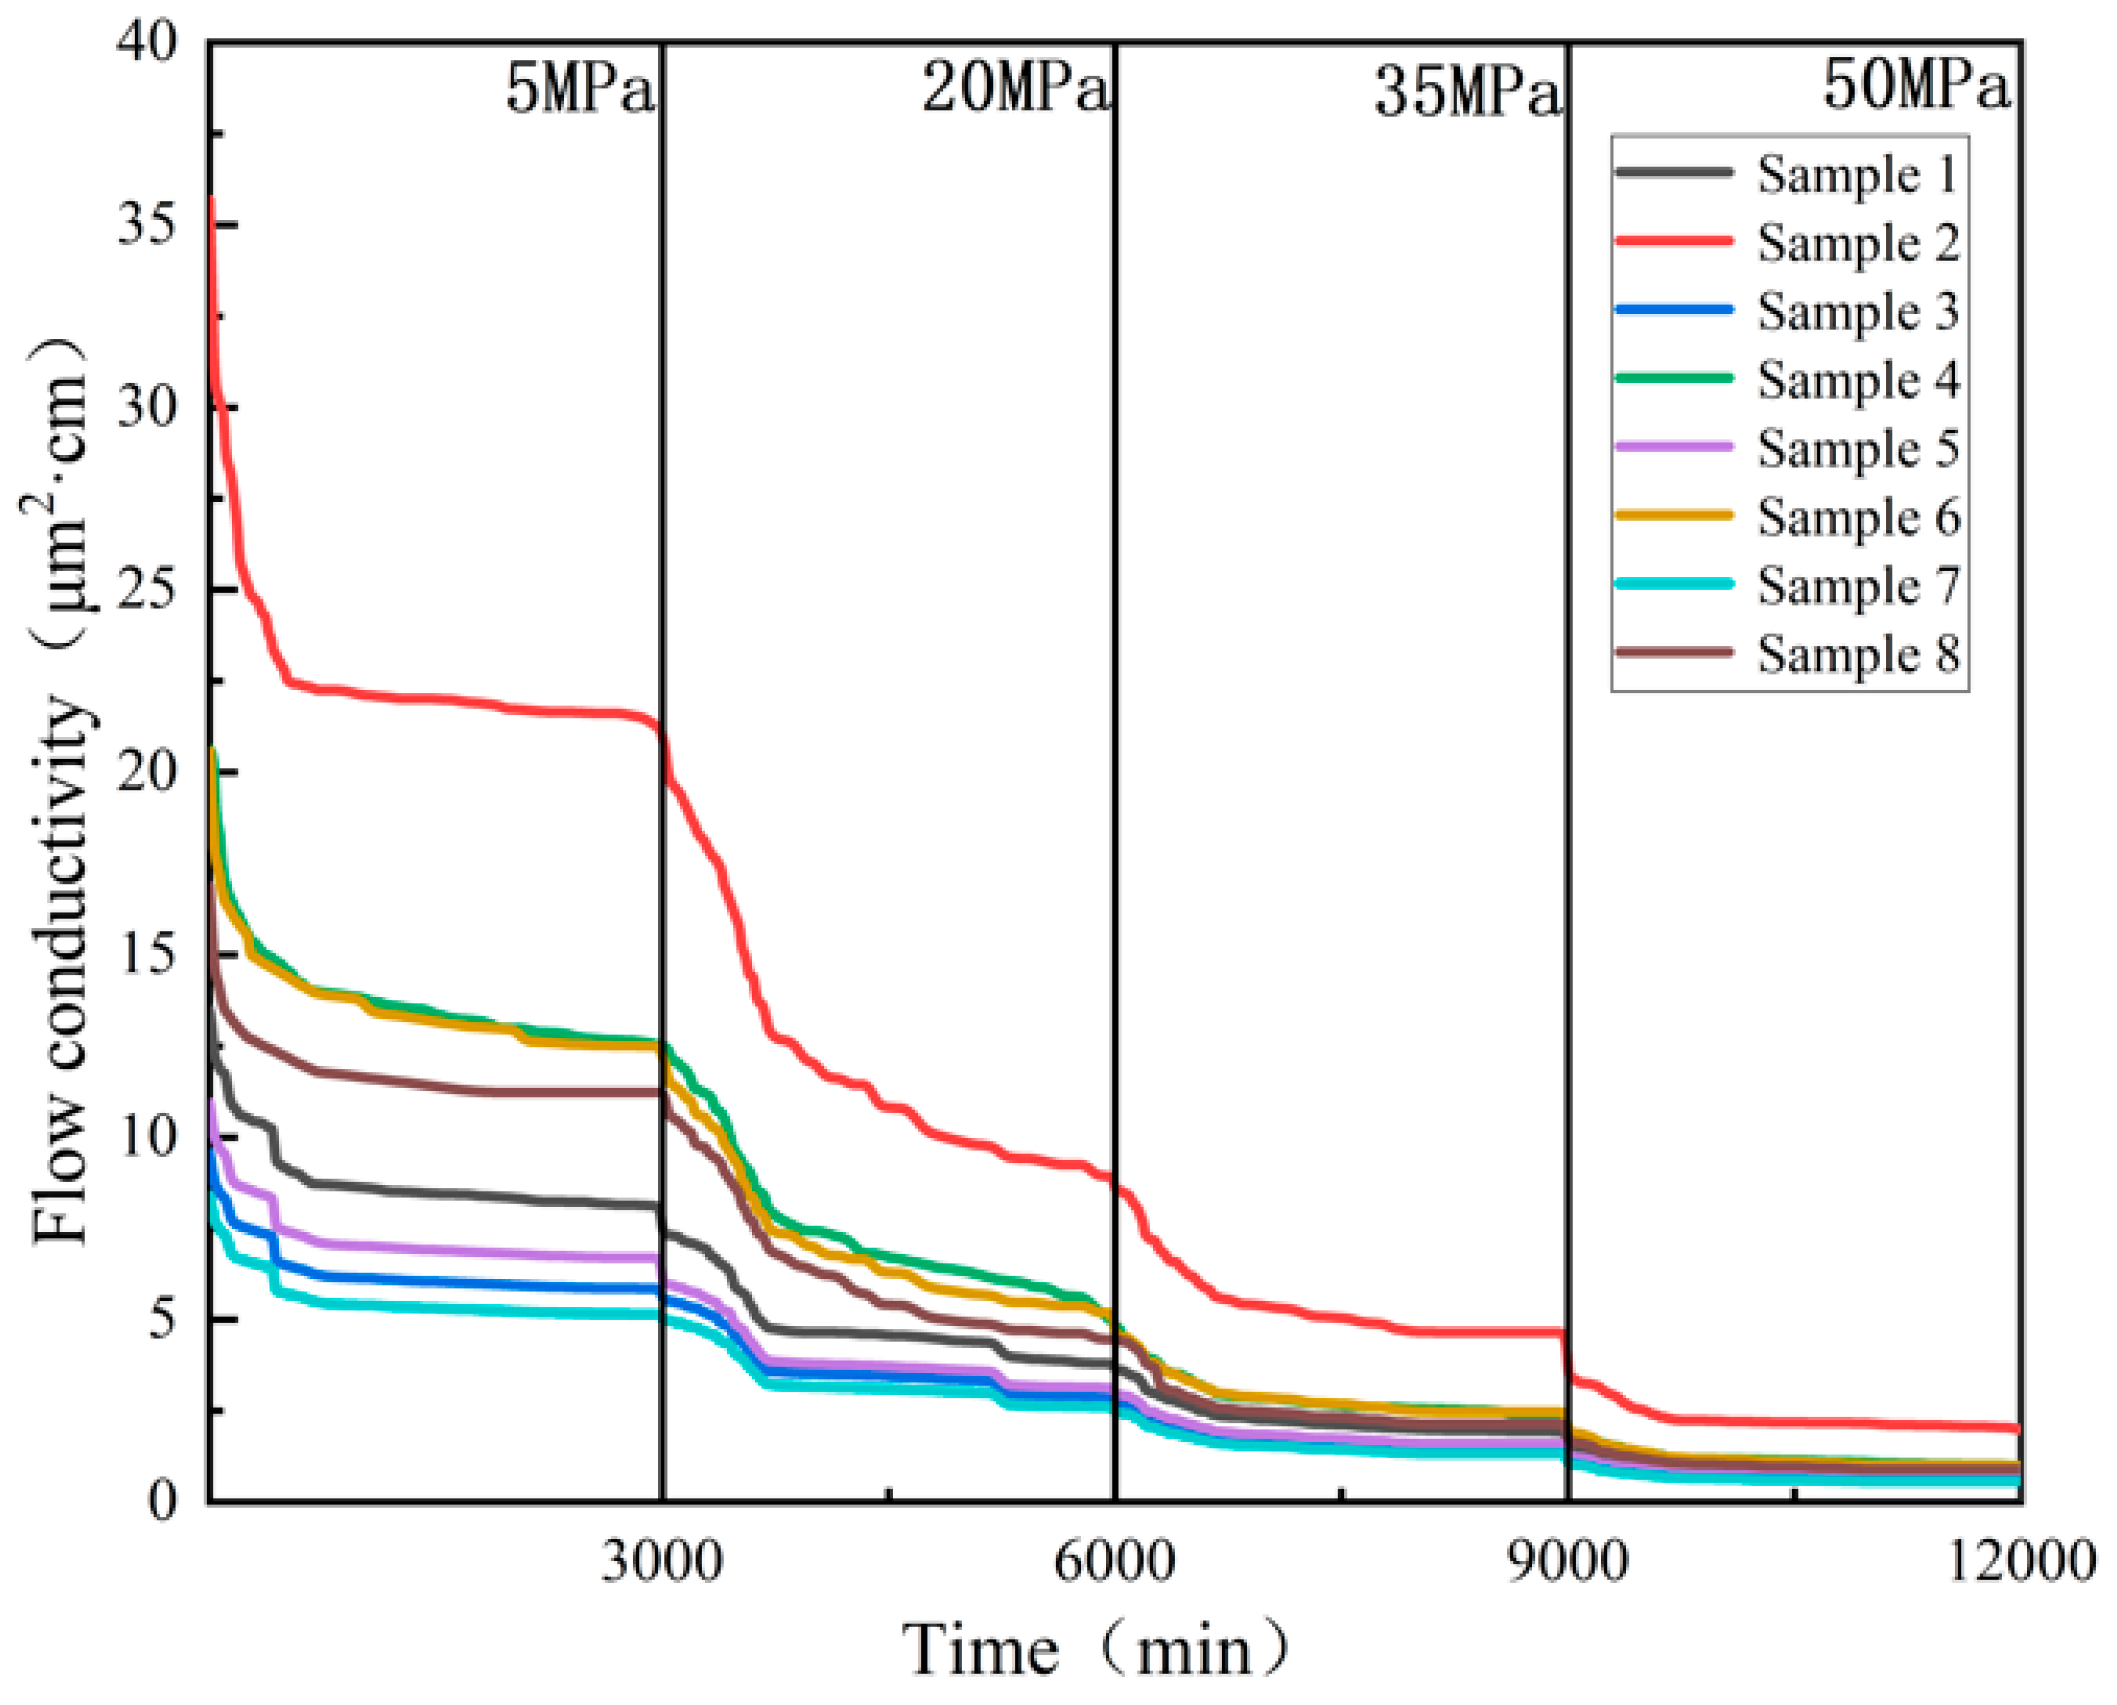
Figure 4: Experimental results of flow conductivity.
An exponential function was used to fit the long-term conductivity results under segmented closure stresses:
The fitting results are as follows (Fig. 5):
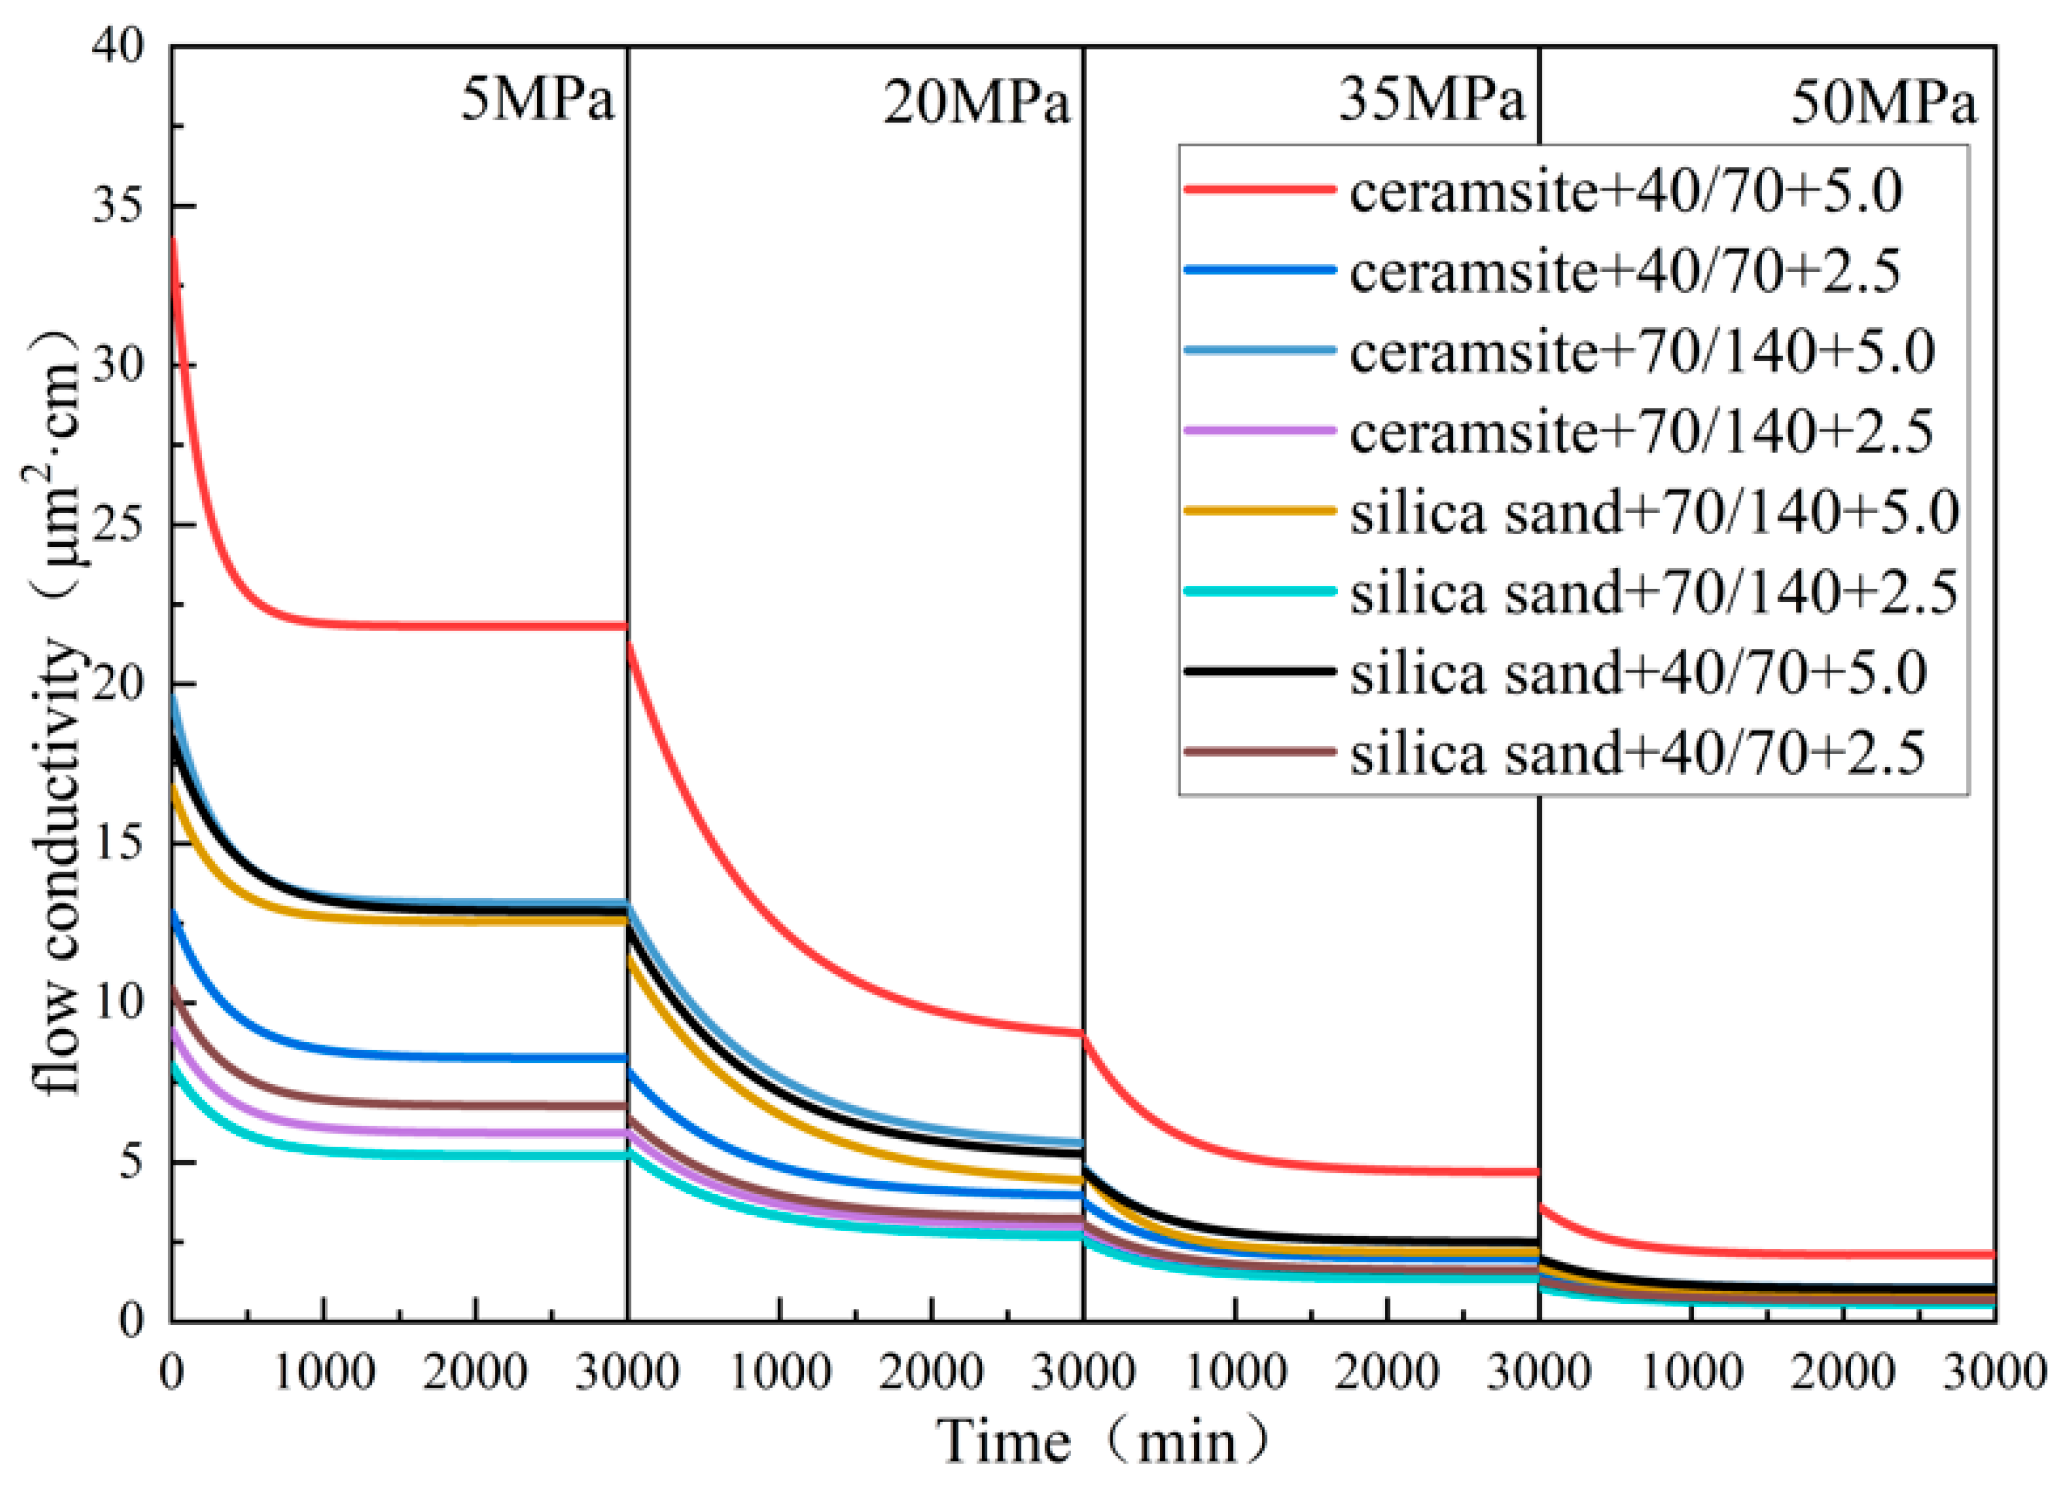
Figure 5: Fitted results of flow conductivity experiments.
As shown in Table 2, Table 3, Table 4 and Table 5 below, the larger the particle size, the higher the sand concentration and the higher the initial flow capacity. Under the same conditions, overall, expanded clay aggregate provides better support than quartz sand. The larger the particle size, the higher the sand concentration, and the lower the flow capacity decay rate.
Table 2: Fitted results of fracture conductivity at 5 MPa.
| Proppant | Grain Size | Sand Concentration (kg/m2) | Fitting Parameters | ||
|---|---|---|---|---|---|
| A | B | C | |||
| ceramsite | 40/70 | 2.5 | 4.580 | 348.000 | 8.270 |
| ceramsite | 40/70 | 5.0 | 12.155 | 202.486 | 21.815 |
| ceramsite | 70/140 | 2.5 | 3.229 | 341.918 | 5.918 |
| ceramsite | 70/140 | 5.0 | 6.480 | 295.853 | 13.133 |
| silica sand | 40/70 | 2.5 | 3.694 | 341.917 | 6.770 |
| silica sand | 40/70 | 5.0 | 5.458 | 370.981 | 12.868 |
| silica sand | 70/140 | 2.5 | 2.842 | 341.917 | 5.208 |
| silica sand | 70/140 | 5.0 | 4.214 | 299.735 | 12.552 |
Table 3: Fitted results of fracture conductivity at 20 MPa.
| Proppant | Grain Size | Sand Concentration (kg/m2) | Fitting Parameters | ||
|---|---|---|---|---|---|
| A | B | C | |||
| ceramsite | 40/70 | 2.5 | 3.958 | 701.232 | 3.910 |
| ceramsite | 40/70 | 5.0 | 12.513 | 811.134 | 8.727 |
| ceramsite | 70/140 | 2.5 | 2.976 | 709.673 | 2.951 |
| ceramsite | 70/140 | 5.0 | 7.612 | 819.902 | 5.411 |
| silica sand | 40/70 | 2.5 | 3.214 | 709.673 | 3.187 |
| silica sand | 40/70 | 5.0 | 7.276 | 810.873 | 5.075 |
| silica sand | 70/140 | 2.5 | 2.678 | 709.673 | 2.656 |
| silica sand | 70/140 | 5.0 | 7.206 | 874.940 | 4.197 |
Table 4: Fitted results of fracture conductivity at 35 MPa.
| Proppant | Grain Size | Sand Concentration (kg/m2) | Fitting Parameters | ||
|---|---|---|---|---|---|
| A | B | C | |||
| ceramsite | 40/70 | 2.5 | 1.785 | 487.676 | 1.974 |
| ceramsite | 40/70 | 5.0 | 4.207 | 494.879 | 4.678 |
| ceramsite | 70/140 | 2.5 | 1.360 | 510.233 | 1.475 |
| ceramsite | 70/140 | 5.0 | 2.351 | 476.992 | 2.494 |
| silica sand | 40/70 | 2.5 | 1.450 | 494.879 | 1.613 |
| silica sand | 40/70 | 5.0 | 2.245 | 494.880 | 2.497 |
| silica sand | 70/140 | 2.5 | 1.209 | 494.877 | 1.344 |
| silica sand | 70/140 | 5.0 | 2.588 | 392.290 | 2.179 |
Table 5: Fitted results of fracture conductivity at 50 MPa.
| Proppant | Grain Size | Sand Concentration (kg/m2) | Fitting Parameters | ||
|---|---|---|---|---|---|
| A | B | C | |||
| ceramsite | 40/70 | 2.5 | 0.754 | 486.788 | 0.835 |
| ceramsite | 40/70 | 5.0 | 1.512 | 417.465 | 2.090 |
| ceramsite | 70/140 | 2.5 | 0.566 | 494.880 | 0.630 |
| ceramsite | 70/140 | 5.0 | 0.920 | 457.394 | 1.066 |
| silica sand | 40/70 | 2.5 | 0.612 | 494.881 | 0.680 |
| silica sand | 40/70 | 5.0 | 0.957 | 501.624 | 1.022 |
| silica sand | 70/140 | 2.5 | 0.510 | 494.880 | 0.567 |
| silica sand | 70/140 | 5.0 | 0.809 | 494.876 | 0.900 |
3 Embedded Discrete Fracture Model
This study develops a gas reservoir fracturing capacity model that accounts for the decline in conductivity to examine the impact of proppant embedding and creep on fracture conductivity and shale gas production based on the following assumptions:
- (1)The fracturing fluid is distributed in the artificial main fracture and microfracture network, which is a two-phase gas-water flow, and the fracturing fluid can percolate into the matrix under the action of capillary force.
- (2)Relative independence between the gas-water phases, disregarding water evaporation and gas dissolution in water.
- (3)Capillary forces are present only in the matrix and microfracture network; the main cracks are more open and permeable, and the capillary forces are ignored.
- (4)The reservoir model is two-dimensional and fluid gravity is ignored.
- (5)Changes in temperature during fluid flow are not considered.
Then, the flux exchange between the matrix and the crack can be obtained as:
The flow exchange between intersecting fractures is:
Based on the basic theory of seepage mechanics, the gas seepage equation in the matrix can be expressed as:
The gas seepage equation in the fractures is expressed as:
4 Basic Parameters and Model Validation
To validate the correctness of the model, the physical property parameters of the reservoir in the target block were selected for the simulation. The parameters for the model validation are presented in Table 6.
Table 6: Parameters used for model validation.
| Parameter | Value | Parameter | Value |
|---|---|---|---|
| Reservoir pressure (MPa) | 20 | Reservoir temperature (K) | 328 |
| Reservoir size (m × m) | 700 × 340 | SRV size (m × m) | 540 × 220 |
| Matrix porosity | 0.08 | Main fracture porosity | 0.8 |
| Micro-fracture network porosity | 0.00022 | Micro-fracture network permeability (D) | 2.08 × 10⁻⁶ |
| Main fracture permeability (D) | 8.33 | Matrix permeability (D) | 2.6 × 10⁻⁴ |
| Matrix density (kg/m3) | 2500 | Strata thickness (m) | 10 |
| Rock compressibility (MPa−1) | 0.0001 | Langmuir volume (m3/kg) | 0.015 |
| Langmuir pressure (MPa) | 2.5 | Main crack width (m) | 0.001 |
| Main crack half length (m) | 65 | Main crack spacing (m) | 100 |
| Number of main cracks | 3 | Wellbore radius (m) | 0.05 |
This model is a dual-pore medium model, where the permeability of the main fracture far exceeds that of the reservoir and microfracture network. Therefore, capillary forces in the main fracture are neglected, and the gas phase pressure is equal to the water phase pressure. Based on the continuity equation and the momentum equation, the differential equations for gas phase and water phase flow in the main fracture can be derived. The gas phase flow equation is shown below:
The gas phase equation is:
The gas phase saturation and water phase saturation in the main fracture satisfy the following relationship.
For microcrack networks, the continuity equation and momentum equation can be used to obtain the differential equations for gas and water phase flow in microcracks. The liquid phase flow equation is shown below:
The liquid phase seepage equation is as follows:
The gas phase saturation and water phase saturation in a microcrack network satisfy the following relationship.
In microcracks, capillary forces caused by interfacial tension play an important role in fluid distribution and cannot be ignored. The gas phase and water phase pressures in the microcrack network satisfy the following equations:
The continuous equation and the equation of motion can be used to obtain the differential equations for gas phase and water phase seepage in the matrix. The liquid phase seepage equation is shown below:
The gas phase seepage equation in the matrix can be expressed as:
The gas phase saturation and water phase saturation in the matrix system satisfy the following relationship:
The gas phase pressure, liquid phase pressure, and capillary force in the matrix system satisfy the following equation:
The cumulative gas production of this study’s model and comparison curve of the cumulative gas production of real gas wells were obtained by setting the flow pressure at the bottom of the well to 10 MPa (Fig. 6). The figure illustrates that the two cumulative gas production curves are closely aligned, yet the disparity between them will progressively widen over time, consistent with the established laws, thereby validating the accuracy of the model presented in this paper.
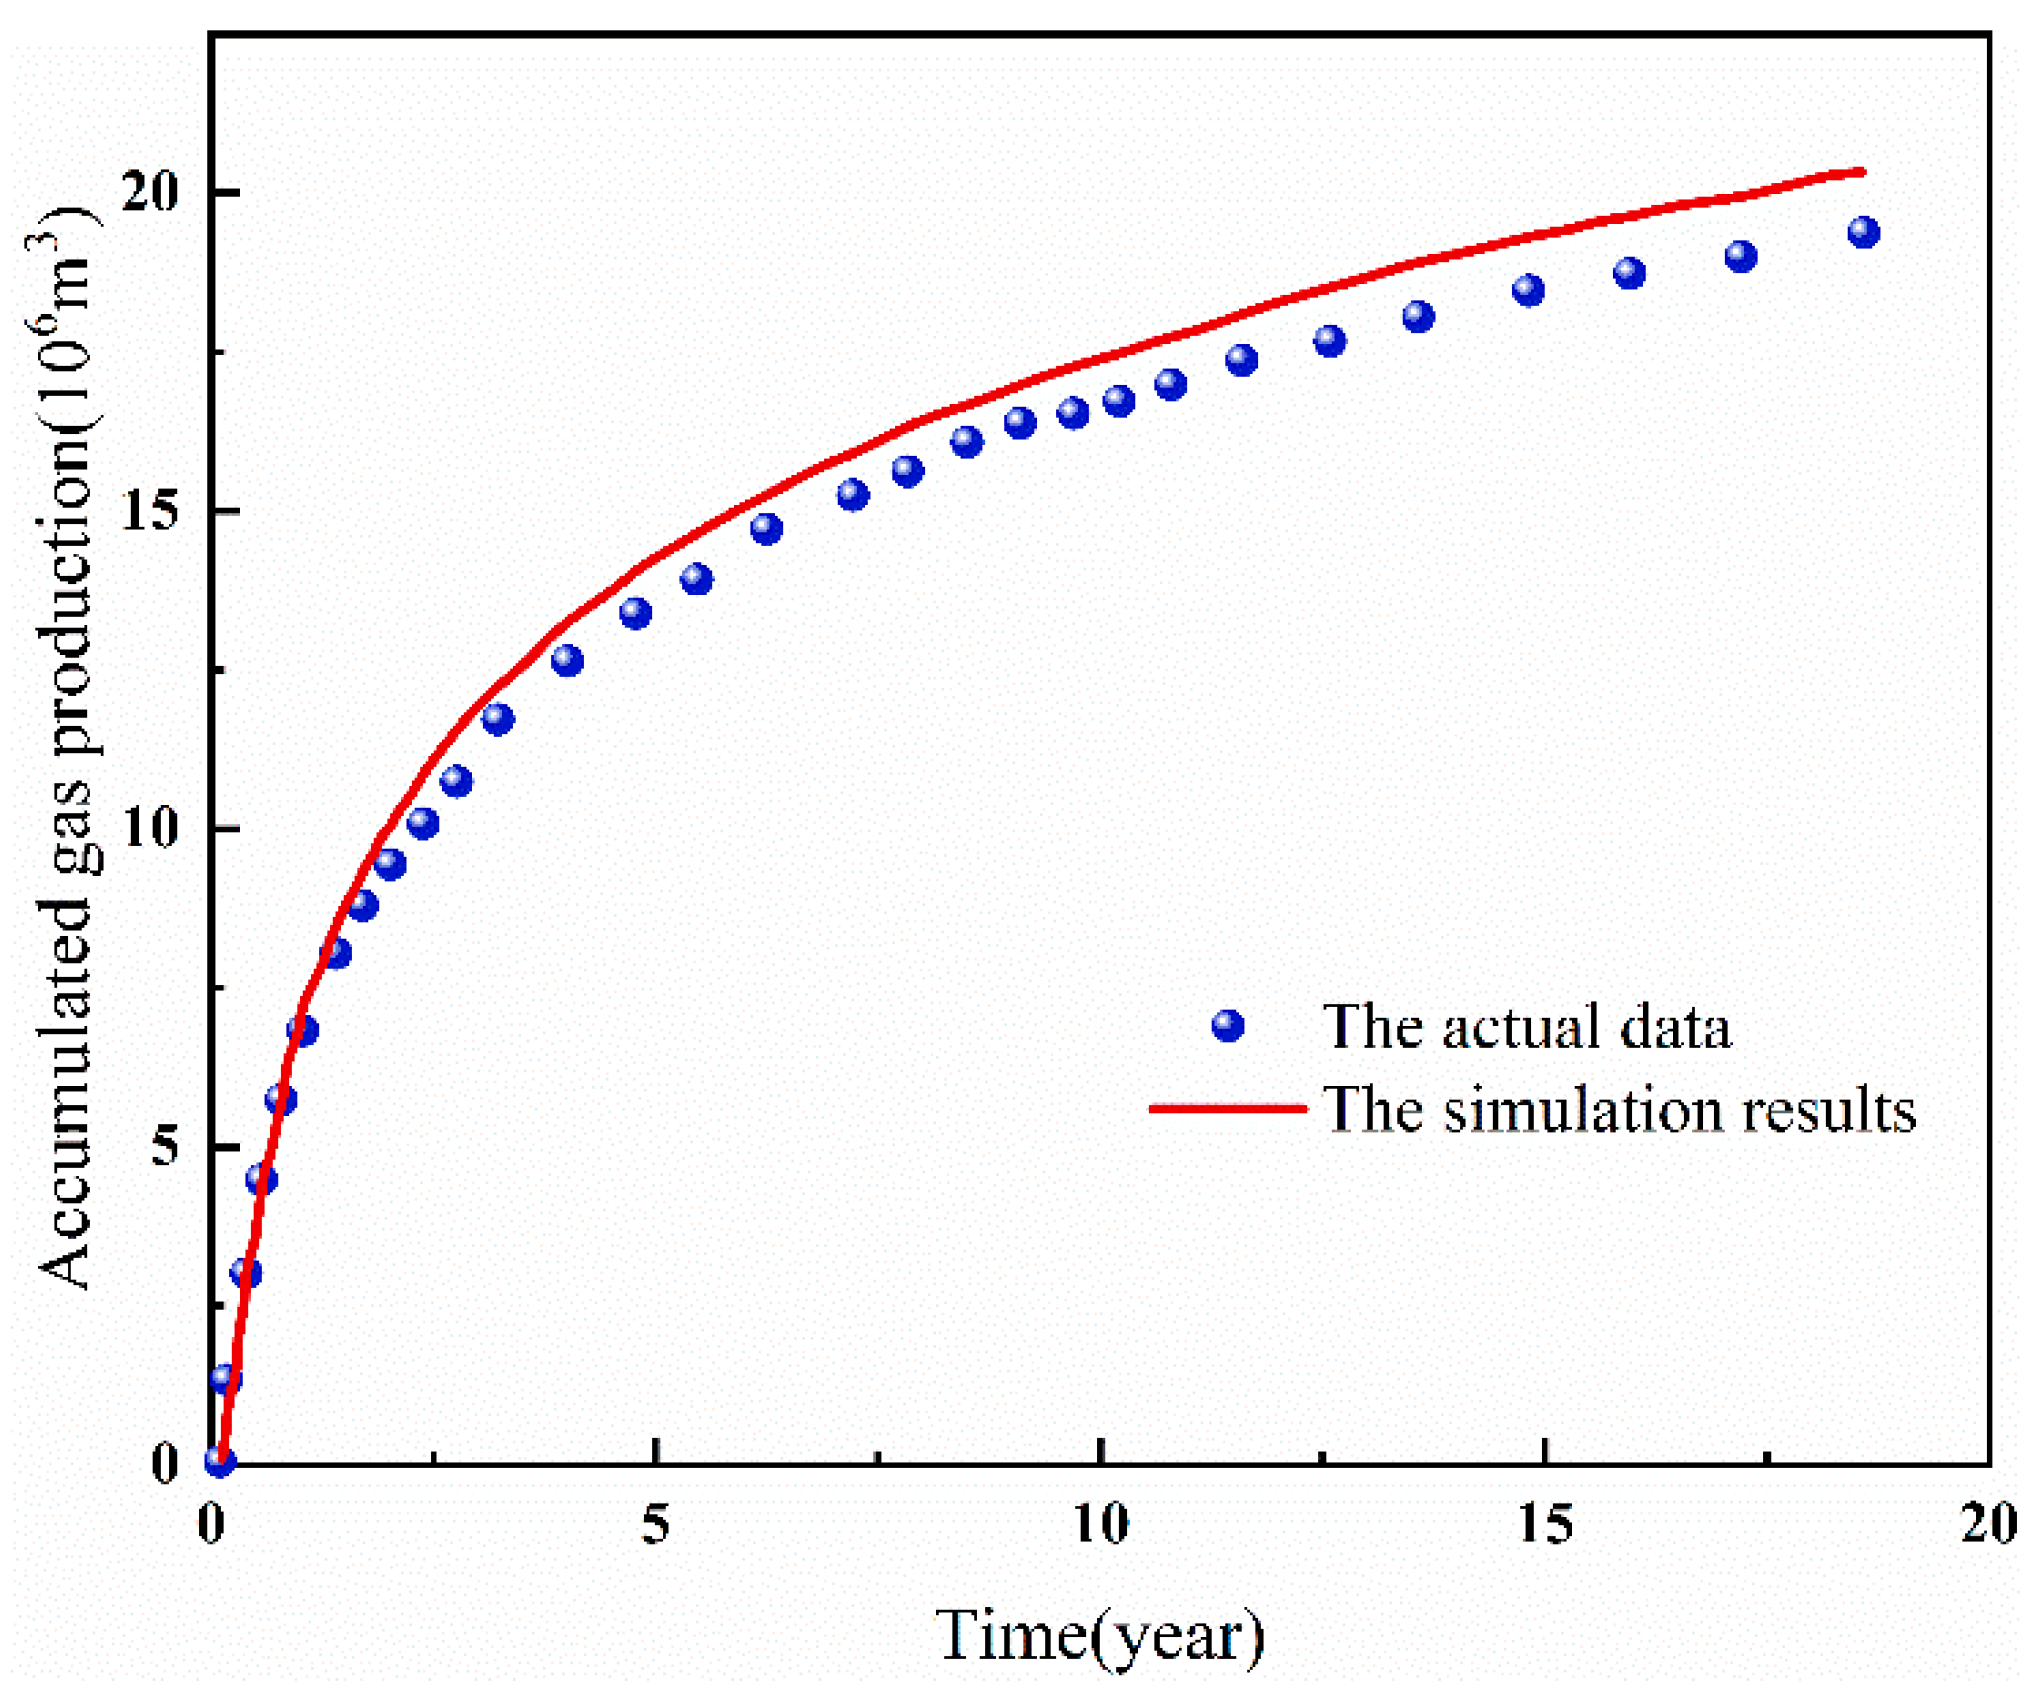
Figure 6: Cumulative gas production comparison curve.
5 Simulation Results and Discussion
5.1 Simulation Results under Different Flow Diversion Capacity Decay Modes
The variable conductivity model, which accounts for proppant embedding, and the conductivity attenuation model, which considers rock creep, are utilized in the established capacity model to simulate and analyze the capacity under various conductivity attenuation scenarios. The simulation results show that when cracks occur, they affect production. That is, the geometric shape of the cracks is related to production, which is consistent with the conclusions of Marembo Micheal et al. [32].
The aforementioned figure illustrates that the disparity between the capacity simulation results and those obtained without accounting for conductivity attenuation was relatively small when only proppant embedding was considered. However, the results of the capacity simulations produced large differences from those of the other two sets of simulations after considering rock creep. A subsequent study indicated that the influence of rock creep on gas well production was more significant than that of proppant embedding, thereby highlighting that rock creep predominantly affects the fracture conductivity. As shown in Fig. 7d, the simulation results of the production capacity model that took into account proppant embedding and rock creep showed a trend of first increasing and then decreasing in daily production compared to the other two sets of simulation results.
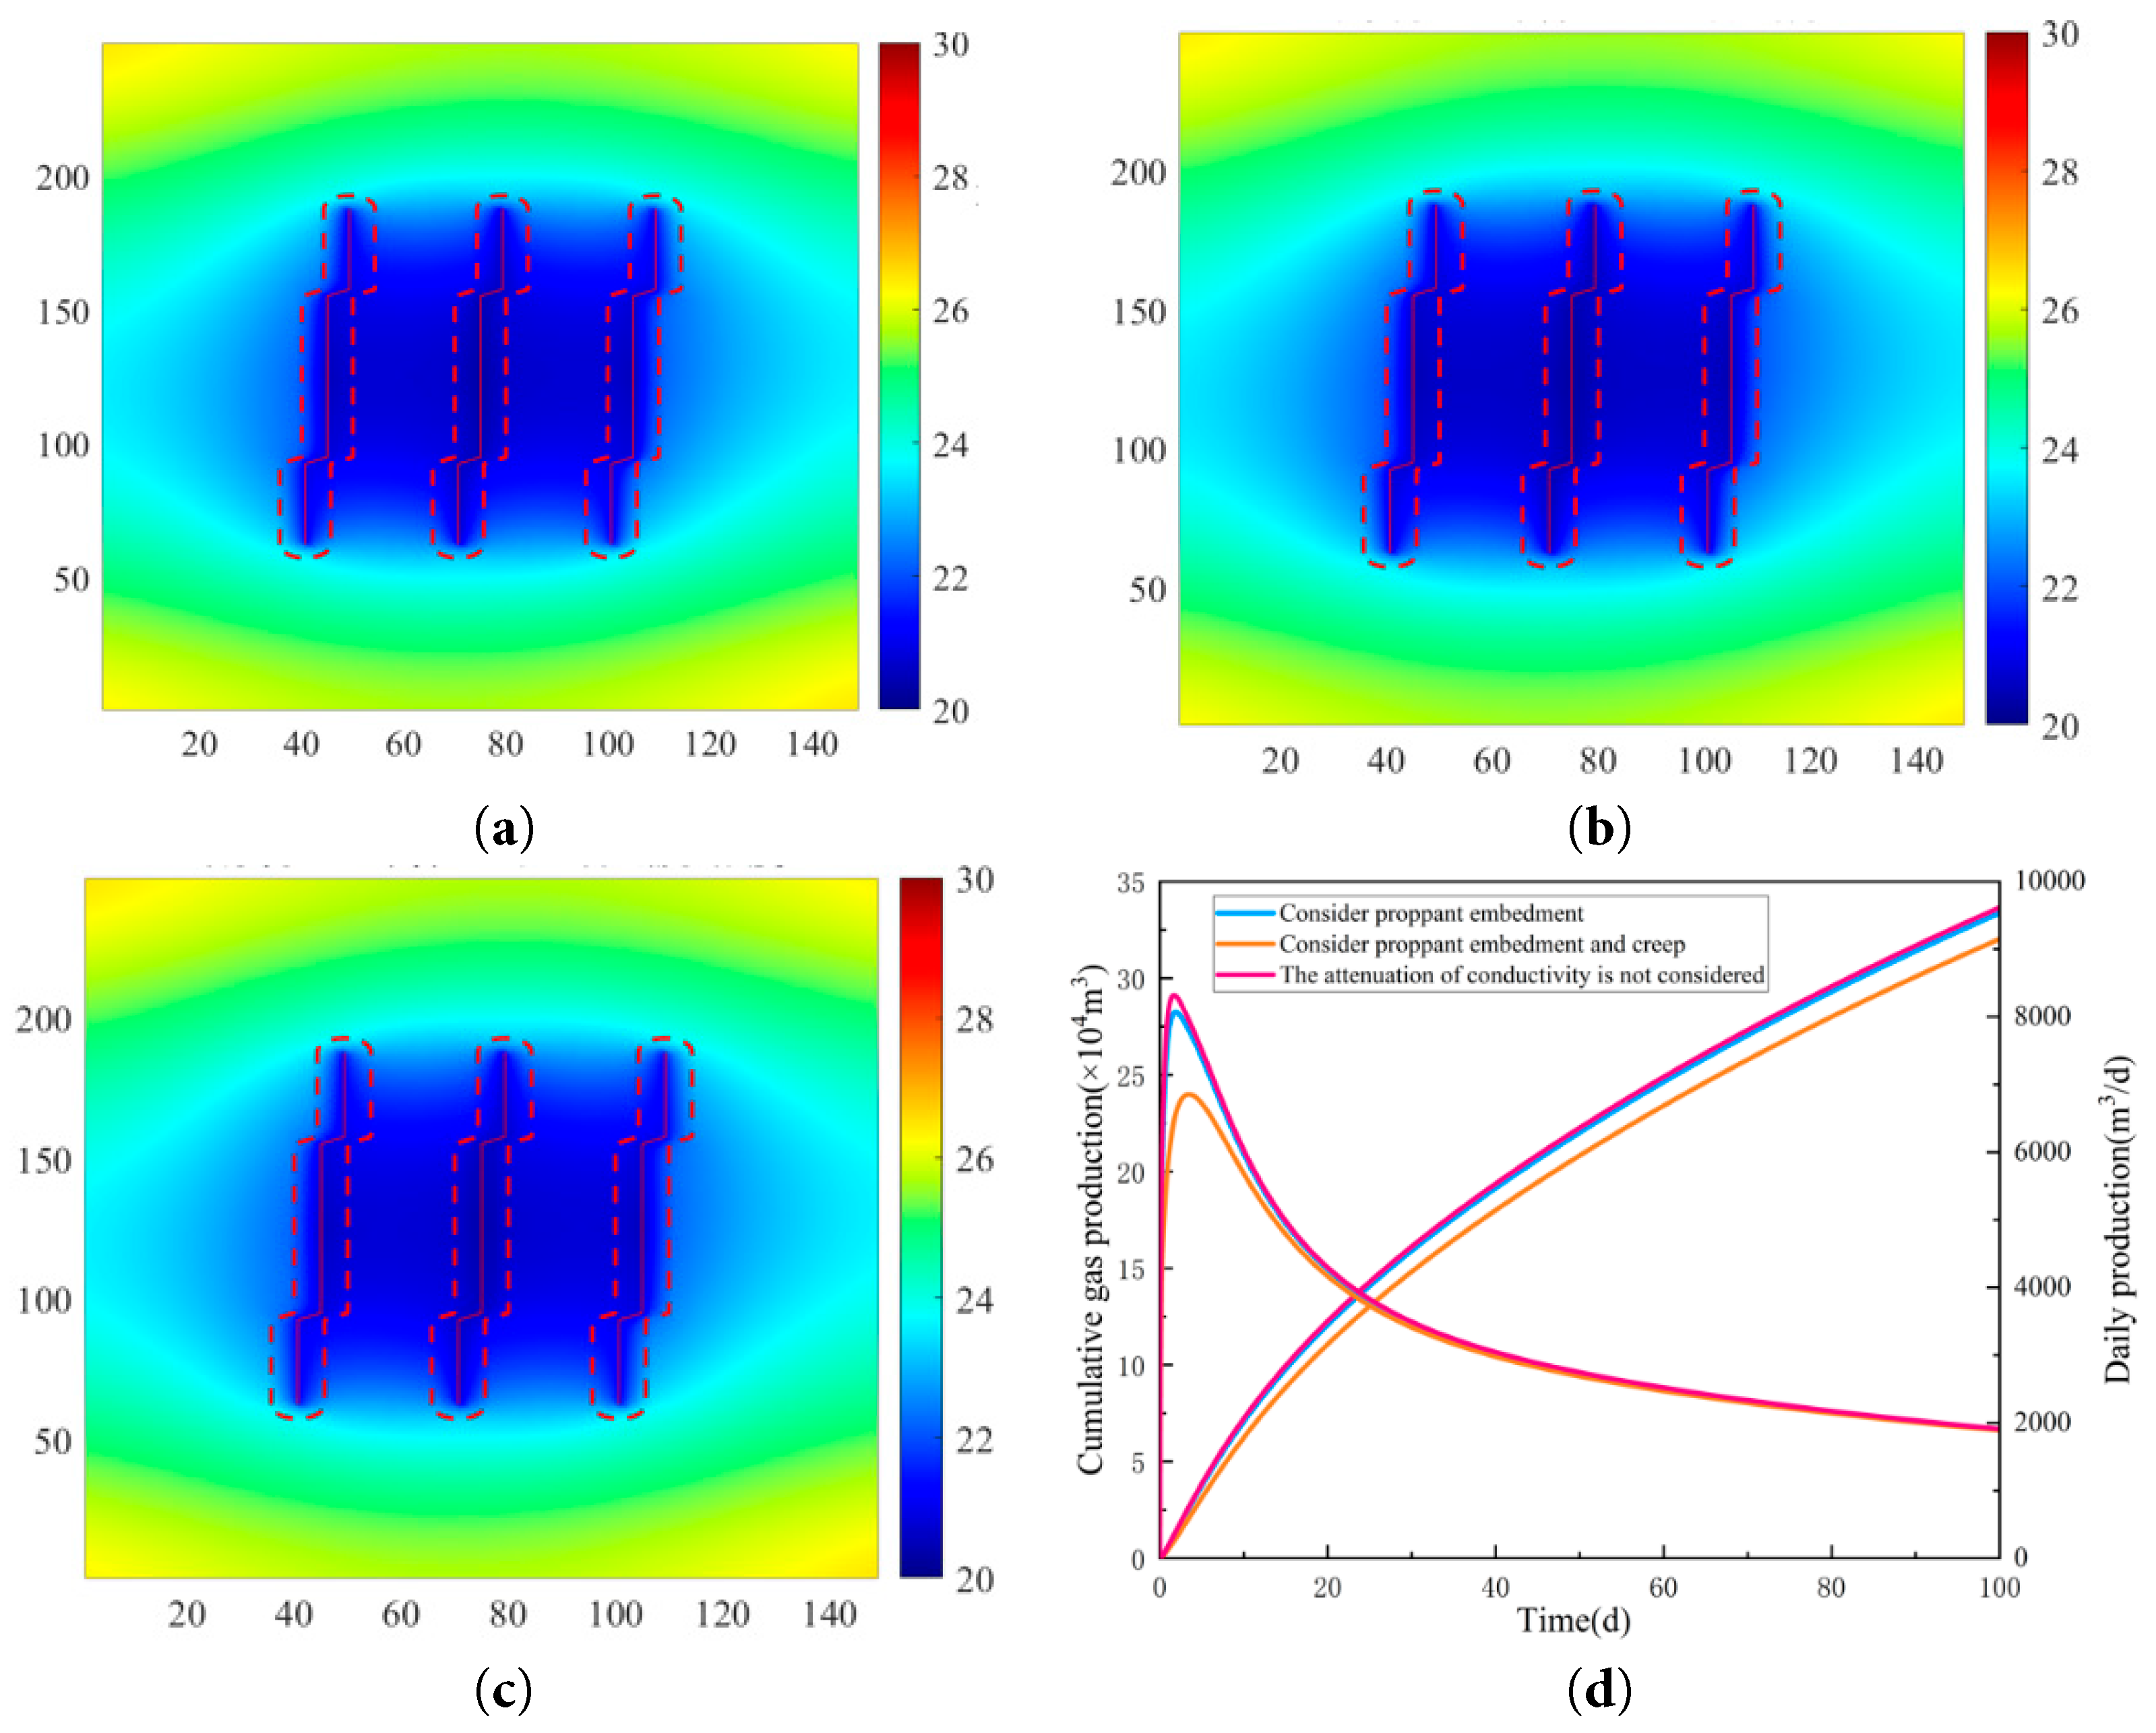
Figure 7: Comparison of pressure cloud and capacity simulation under different conductivity attenuation models: (a) Considering proppant embedment and creep; (b) Considering proppant embedment; (c) The attenuation of conductivity is not considered; (d) Comparison of capacity simulations under different modes of conductivity attenuation.
5.2 Study on the Influence of Fracture Flow Conductivity
To determine the effects of proppant parameters on fracture conductivity and gas well performance, simulations were conducted for reservoirs with proppant modulus values in the range of 5000 < E2 < 40,000 (Fig. 8).
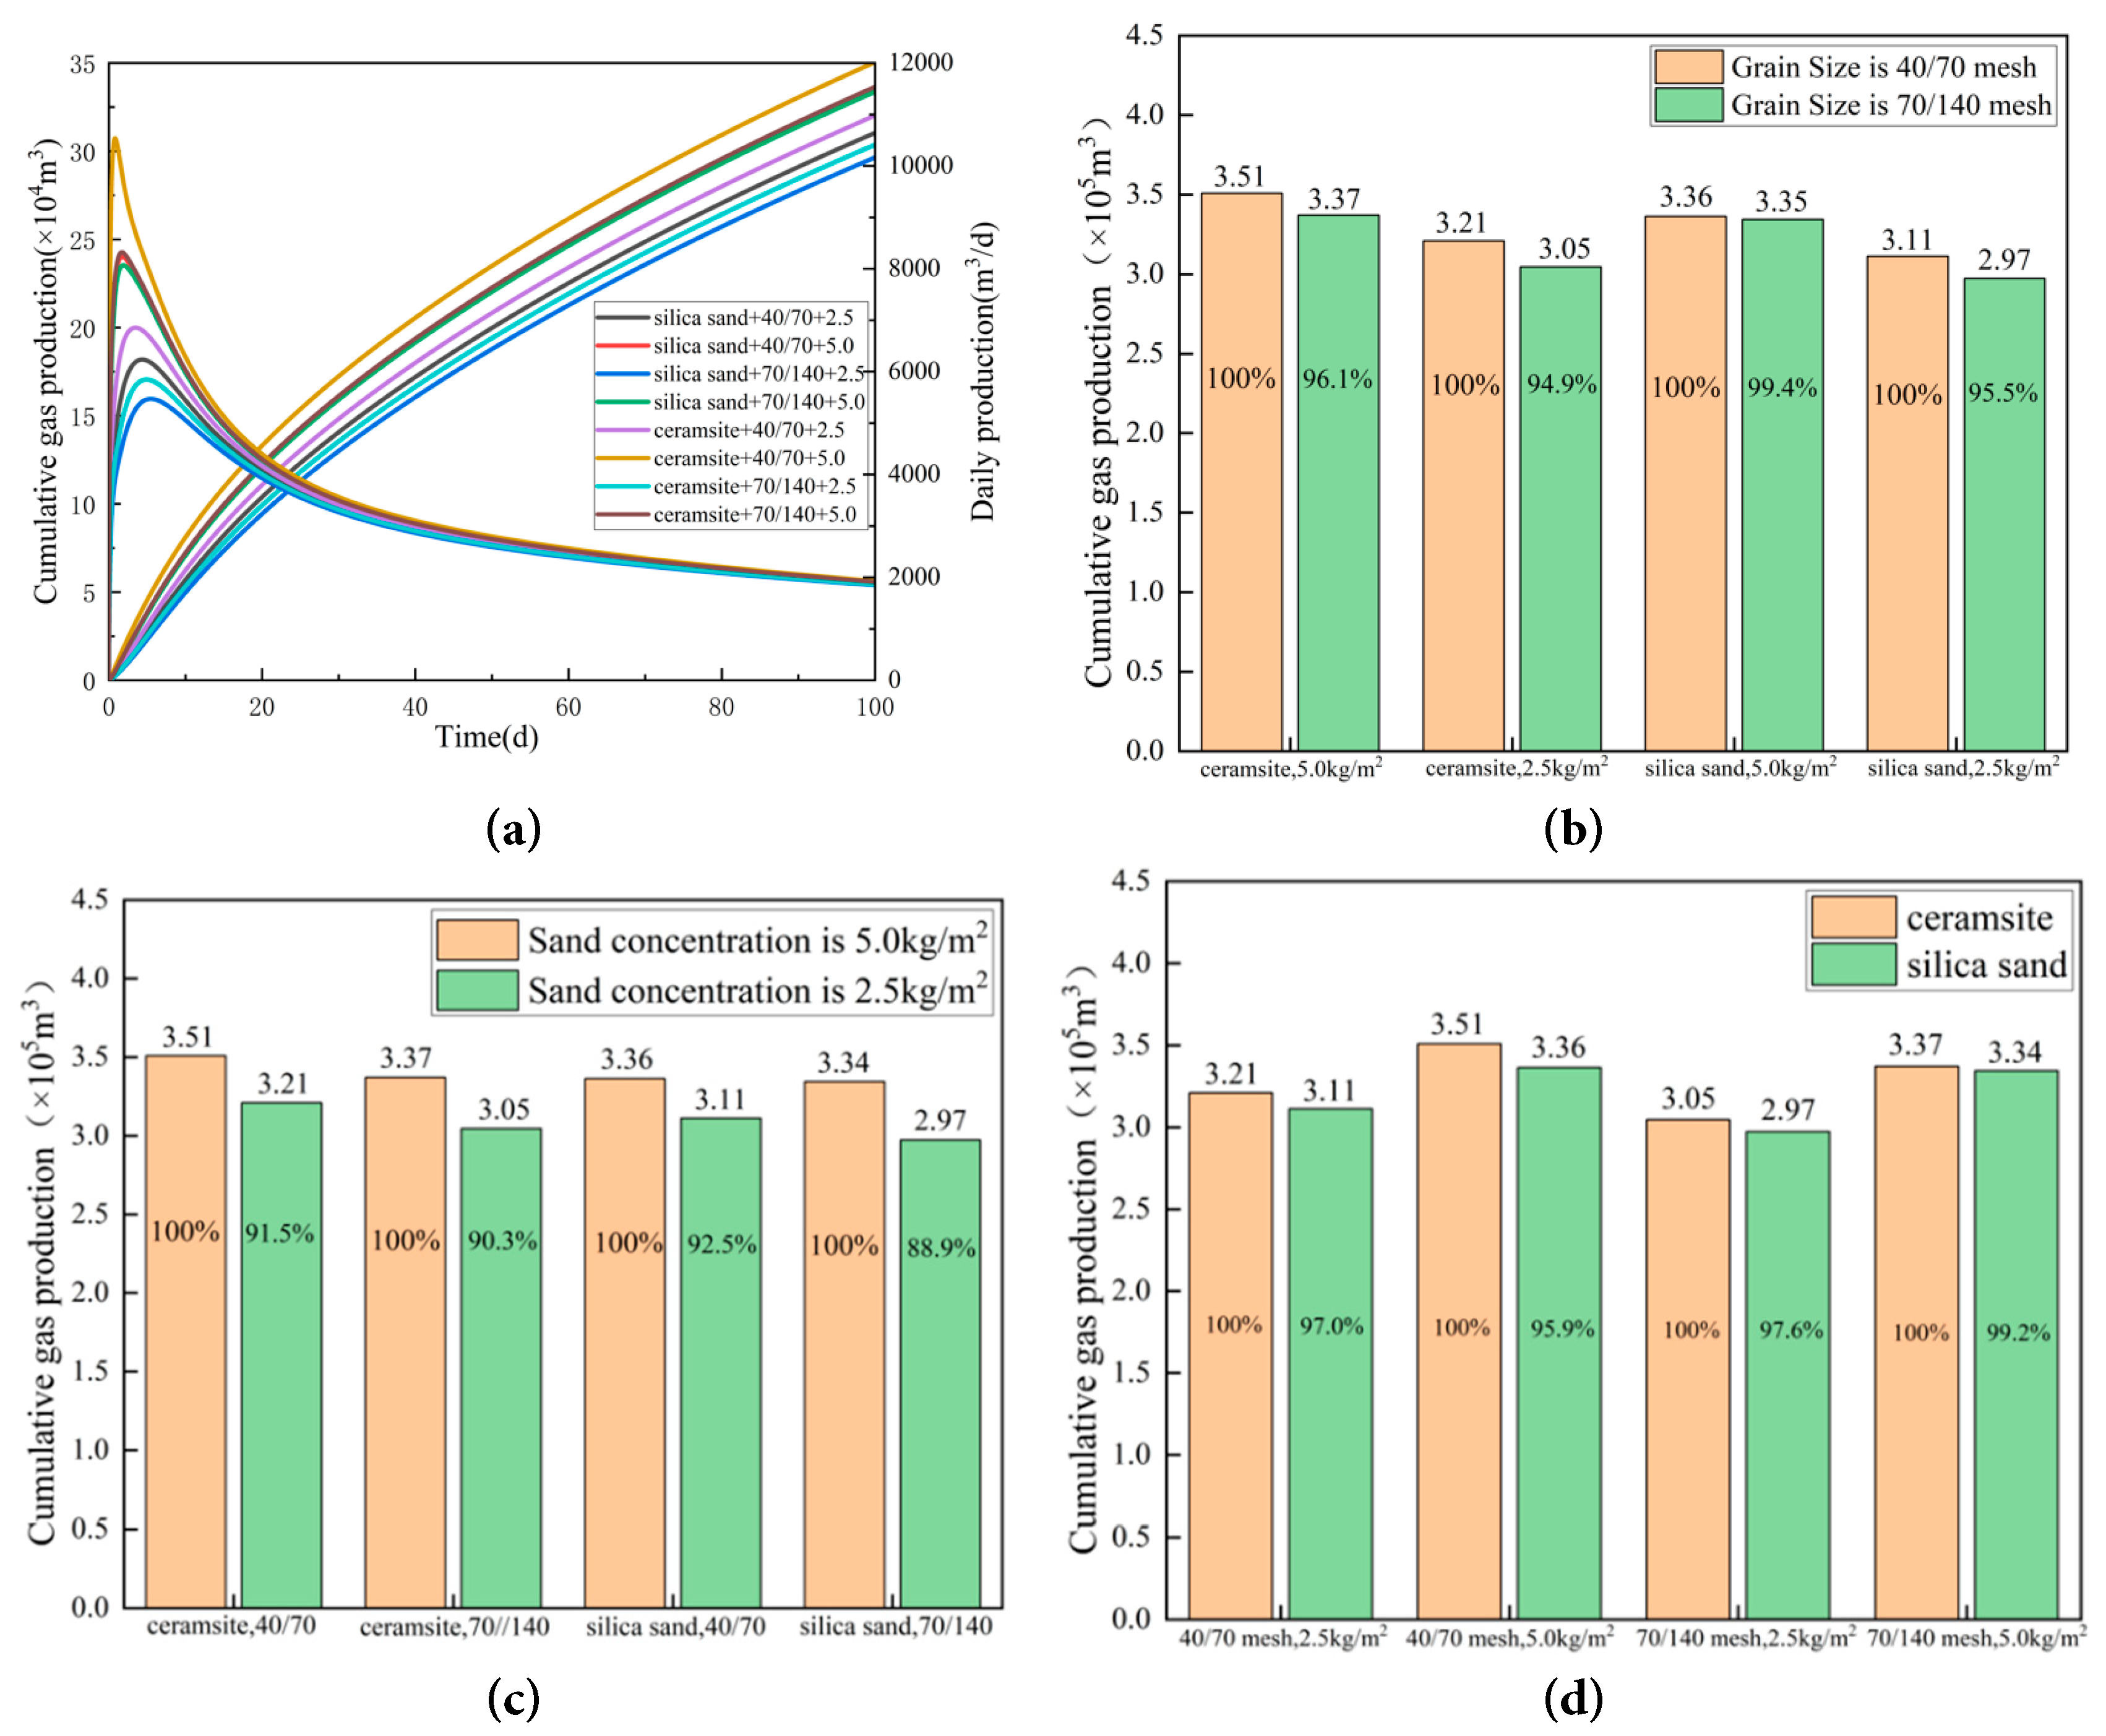
Figure 8: Comparison of capacity simulation with different proppant sizes: (a) Considering proppant embedment and creep; (b) Considering proppant embedment; (c) The attenuation of conductivity is not considered; (d) Comparison of capacity simulations under different modes of conductivity attenuation.
Impact of Proppant Concentration on Productivity. Reducing proppant concentration from 5 kg/m2 to 2.5 kg/m2 resulted in an average productivity decline of 9.20%. The maximum decline (11.11%) occurred with quartz sand (70/140 mesh), while the minimum decline (7.48%) occurred with quartz sand (40/70 mesh). The ceramic proppant group showed an average decline of 9.10%, and the quartz sand group 9.29%, with minimal difference between the two.
Impact of Particle Size on Productivity. Reducing particle size from 40/70 mesh to 70/140 mesh led to an average productivity decline of 3.52%. The maximum decline (5.13%) occurred with ceramic proppants at 2.5 kg/m2, while the minimum decline (0.57%) occurred with quartz sand at 5 kg/m2. The ceramic proppant group exhibited an average decline of 4.52%, and the quartz sand group 2.52%.
Impact of Proppant Type on Productivity. Switching from ceramic proppants to quartz sand caused an average productivity decline of 2.59%. The maximum decline (4.13%) occurred at 5 kg/m2 with 40/70 mesh quartz sand, while the minimum decline (0.80%) occurred at 5 kg/m2 with 70/140 mesh quartz sand.
Conclusions. The order of impact on productivity is proppant concentration (average decline 9.20%) > particle size (3.52%) > proppant type (2.59%). Proppant concentration is the key factor. Particle size has a greater impact on ceramic proppants than on quartz sand. Under the same conditions, increasing particle size enhances productivity more effectively for ceramic proppants. For optimal productivity, ceramic proppants should be used with high concentrations and large particle sizes. Considering cost, quartz sand is recommended with high concentrations and small particle sizes to ensure long-term reservoir stimulation.
This study established a fracture conductivity decay model based on experimental fitting. By integrating a nested discrete fracture model, it investigated production capacity simulations under different fracture conductivity decay patterns while examining the influence of proppant parameters on fracture conductivity. The following conclusions were drawn:
- 1.The initial crack drainage capacity of sand with a concentration of 5 kg/m2 is higher than that of sand with a concentration of 2.5 kg/m2. However, as the closing stress increases, the crack drainage capacity decreases rapidly and stabilizes at a stress of 50 MPa. Expanded clay aggregate has a higher initial crack drainage capacity than quartz sand.
- 2.The influence of rock creep on fracture conductivity is more significant than that of proppant embedment on fracture conductivity.
- 3.For damage-controllable reservoirs with a viscous modulus ranging from 5000 to 40,000 MPa, the order of influence of a single-proppant system on productivity is: proppant concentration (average attenuation of 9.20%) > particle size (3.52%) > proppant type (2.59%).
Acknowledgement:
Funding Statement: This study was supported by the National Natural Science Foundation of China (Nos. 52204051, 52304046).
Author Contributions: The authors confirm contribution to the paper as follows: Conceptualization, Junchen Liu; methodology, Feng Zhou; software, Junfu Zhang; validation, Xiaofeng Lu, Xiaojin Zhou; formal analysis, Xianjun He and Fuguo Xia; investigation, Weiyi Luo; resources, Junchen Liu; data curation, Junchen Liu; writing—original draft preparation, Junchen Liu; writing—review and editing, Junchen Liu; visualization, Yurou Du; supervision, Junchen Liu; project administration, Junchen Liu; funding acquisition, Junchen Liu. All authors reviewed the results and approved the final version of the manuscript.
Availability of Data and Materials: The data presented in this study are available on request from the corresponding author.
Ethics Approval: Not applicable.
Conflicts of Interest: The authors declare no conflicts of interest to report regarding the present study.
References
1. Li H , Huang B , Cheng Q , Zhao X , Chen B , Zhao L . Mechanism of single proppant pressure embedded in coal seam fracture. Energy Fuels. 2021; 35( 9): 7756– 67. doi:10.1021/acs.energyfuels.0c04360. [Google Scholar] [CrossRef]
2. Lu C , Liu J , Huang F , Wang J , Zhou G , Wang J , et al. Numerical simulation of proppant embedment in rough surfaces based on full reverse reconstruction. J Pet Explor Prod Technol. 2022; 12( 9): 2599– 608. doi:10.1007/s13202-022-01512-2. [Google Scholar] [CrossRef]
3. Lu C , Zeng Q , Liu J , Ma Z , Shao X , Tang L , et al. Proppant embedment in rough fractures considering shale hydration. Energy Rep. 2023; 9: 5146– 54. doi:10.1016/j.egyr.2023.04.268. [Google Scholar] [CrossRef]
4. Chen J , Yu H , Li B , Zhang H , Jin X , Meng S , et al. DeepONet-embedded physics-informed neural network for production prediction of multiscale shale matrix–fracture system. Phys Fluids. 2025; 37( 1): 016608. doi:10.1063/5.0245212. [Google Scholar] [CrossRef]
5. Xue Y , Cao C , Jin Q , Wang Q . Re-evaluation of oil bearing for wells with long production histories in low permeability reservoirs using data-driven models. Energies. 2023; 16( 2): 677. doi:10.3390/en16020677. [Google Scholar] [CrossRef]
6. Tian F , Fu Y , Liu X , Li D , Jia Y , Shao L , et al. A comprehensive evaluation of shale oil reservoir quality. Processes. 2024; 12( 3): 472. doi:10.3390/pr12030472. [Google Scholar] [CrossRef]
7. Tonglou GU . Key geological issues and main controls on accumulation and enrichment of Chinese shale gas. Pet Explor Dev. 2016; 43( 3): 349– 59. doi:10.1016/S1876-3804(16)30042-8. [Google Scholar] [CrossRef]
8. Peng Y , Ye J , Li Y , Chen Y , Li Z , Zhang D . Development and performance evaluation of novel self-degradable preformed particulate gels with high-temperature and high-salinity resistance. SPE J. 2025; 30( 03): 1105– 15. doi:10.2118/224404-PA. [Google Scholar] [CrossRef]
9. Peng Y , Ma H , Li Z , Zhou L , Zhao J , Wen X . Material balance evaluation method for water-bearing gas reservoirs considering the influence of relative permeability. Pet Sci Technol. 2025; 43( 5): 570– 85. doi:10.1080/10916466.2024.2306148. [Google Scholar] [CrossRef]
10. Guo J , Lu Q , He Y . Key issues and explorations in shale gas fracturing. Nat Gas Ind B. 2023; 10( 2): 183– 97. doi:10.1016/j.ngib.2023.02.002. [Google Scholar] [CrossRef]
11. Peng Y , Luo A , Li Y , Wu Y , Xu W , Sepehrnoori K . Fractional model for simulating long-term fracture conductivity decay of shale gas and its influences on the well production. Fuel. 2023; 351: 129052. doi:10.1016/j.fuel.2023.129052. [Google Scholar] [CrossRef]
12. Yu H , Shi G , Liu H , Deng X , Cui X , Pan G , et al. A nonlinear viscoelastic stress relaxation model of rock based on fractional calculus. J Basic Sci Eng. 2019; 27( 1): 199– 209. [Google Scholar]
13. Zhang L , Liu Y , Yang Q . Creep and relaxation of rock mass based on thermodynamics with internal state varibales. Yanshi Lixue Yu Gongcheng Xuebao. 2015; 34( 4): 755– 62. [Google Scholar]
14. Zhao YL , Tang JZ , Fu CC , Wan W , Luo SL . Rheological test of separation between viscoelastic-plastic strains and creep damage model. Chin J Rock Mech Eng. 2016; 35( 7): 1297– 308. [Google Scholar]
15. Peng Y , Zhao J , Sepehrnoori K , Li Z , Xu F . Study of delayed creep fracture initiation and propagation based on semi-analytical fractional model. Appl Math Model. 2019; 72: 700– 15. doi:10.1016/j.apm.2019.03.034. [Google Scholar] [CrossRef]
16. Wei E , Hu B , Li J , Cui K , Zhang Z , Cui A , et al. Nonlinear viscoelastic-plastic creep model of rock based on fractional calculus. Adv Civ Eng. 2022; 2022( 1): 3063972. doi:10.1155/2022/3063972. [Google Scholar] [CrossRef]
17. Kamdem TC , Richard KG , Béda T . Modeling the mechanical behavior of rock during plastic flow using fractional calculus theory. Appl Math Model. 2024; 130: 790– 805. doi:10.1016/j.apm.2024.03.025. [Google Scholar] [CrossRef]
18. Du J , Hu L , Meegoda JN , Zhang G . Shale softening:Observations, phenomenological behavior, and mechanisms. Appl Clay Sci. 2018; 161: 290– 300. doi:10.1016/j.clay.2018.04.033. [Google Scholar] [CrossRef]
19. Peng Y , Zhao J , Sepehrnoori K , Li Y , Yu W , Zeng J . Study of the heat transfer in the wellbore during acid/hydraulic fracturing using a semianalytical transient model. SPE J. 2019; 24( 02): 877– 90. doi:10.2118/194206-PA. [Google Scholar] [CrossRef]
20. Niedziela M , Wlazło J . Notes on computational aspects of the fractional-order viscoelastic model. J Eng Math. 2017; 108( 1): 91– 105. doi:10.1007/s10665-017-9911-0. [Google Scholar] [CrossRef]
21. Zhou H , Jia W , Xie S , Su T , Zhang L , Ma B , et al. A statistical damage-based fractional creep model for Beishan granite. Mech Time-Depend Mater. 2023; 27( 1): 163– 83. doi:10.1007/s11043-021-09535-8. [Google Scholar] [CrossRef]
22. Yao W , Hu B , Zhan H , Ma C , Zhao N . A novel unsteady fractal derivative creep model for soft interlayers with varying water contents. KSCE J Civ Eng. 2019; 23( 12): 5064– 75. doi:10.1007/s12205-019-1820-5. [Google Scholar] [CrossRef]
23. Zhou FX , Wang LY , Liu ZY , Zhao WC . A viscoelastic-viscoplastic mechanical model of time-dependent materials based on variable-order fractional derivative. Mech Time-Depend Mater. 2022; 26( 3): 699– 717. doi:10.1007/s11043-021-09508-x. [Google Scholar] [CrossRef]
24. Di Paola M , Pirrotta A , Valenza A . Visco-elastic behavior through fractional calculus: an easier method for best fitting experimental results. Mech Mater. 2011; 43( 12): 799– 806. doi:10.1016/j.mechmat.2011.08.016. [Google Scholar] [CrossRef]
25. Ma L , Wang M , Zhang N , Fan P , Li J . A variable-parameter creep damage model incorporating the effects of loading frequency for rock salt and its application in a bedded storage cavern. Rock Mech Rock Eng. 2017; 50( 9): 2495– 509. doi:10.1007/s00603-017-1236-9. [Google Scholar] [CrossRef]
26. Wang YC , Wang YY . Study on nonlinear viscoelasto-plastic creep model of deep soft rock. Adv Mater Res. 2012; 430: 168– 72. doi:10.4028/www.scientific.net/AMR.430-432.168. [Google Scholar] [CrossRef]
27. Ou ZF , Fang YG . The influence of organic matter content on the rheological model parameters of soft clay. Soil Mech Found Eng. 2017; 54( 4): 283– 8. doi:10.1007/s11204-017-9470-4. [Google Scholar] [CrossRef]
28. Meng R , Yin D , Zhou C , Wu H . Fractional description of time-dependent mechanical property evolution in materials with strain softening behavior. Appl Math Model. 2016; 40( 1): 398– 406. doi:10.1016/j.apm.2015.04.055. [Google Scholar] [CrossRef]
29. Atanacković TM , Konjik S , Pilipović S , Zorica D . Complex order fractional derivatives in viscoelasticity. Mech Time-Depend Mater. 2016; 20( 2): 175– 95. doi:10.1007/s11043-016-9290-3. [Google Scholar] [CrossRef]
30. Cai W , Chen W , Xu W . Characterizing the creep of viscoelastic materials by fractal derivative models. Int J Non-Linear Mech. 2016; 87: 58– 63. doi:10.1016/j.ijnonlinmec.2016.10.001. [Google Scholar] [CrossRef]
31. Musto M , Alfano G . A fractional rate-dependent cohesive-zone model. Int J Numer Methods Eng. 2015; 103( 5): 313– 41. doi:10.1002/nme.4885. [Google Scholar] [CrossRef]
32. Micheal M , Yu H , Meng S , Xu W , Huang H , Huang M , et al. Gas production from shale reservoirs with bifurcating fractures: a modified quadruple-domain model coupling microseismic events. Energy. 2023; 278: 127780. doi:10.1016/j.energy.2023.127780. [Google Scholar] [CrossRef]
Cite This Article
 Copyright © 2025 The Author(s). Published by Tech Science Press.
This work is licensed under a Creative Commons Attribution 4.0 International License , which permits unrestricted use, distribution, and reproduction in any medium, provided the original work is properly cited.
 Downloads
 Citation Tools