
 Submit a Paper
 Propose a Special lssue
 Open Access
ARTICLE

Impact of Window-to-Wall Ratio on Thermal Comfort and Energy Performance of Hybrid Cooling Systems
1 School of Civil Engineering and Architecture, Southwest University of Science and Technology, Mianyang, 621010, China
2 Sichuan Province Engineering Technology Research Center of Healthy Human Settlement, Chengdu, 610065, China
3 Sichuan University Engineering Design & Research Institute Co., Ltd., Chengdu, 610065, China
4 School of Civil Engineering, Dalian University of Technology, Dalian, 116081, China
5 College of Architecture and Environment, Sichuan University, Chengdu, 610065, China
* Corresponding Author: Liu Tang. Email:
(This article belongs to the Special Issue: Fluid Mechanics & Thermodynamics in Renewable Energy and HVAC Systems)
Fluid Dynamics & Materials Processing 2025, 21(10), 2579-2612. https://doi.org/10.32604/fdmp.2025.070407
Received 15 July 2025; Accepted 28 September 2025; Issue published 30 October 2025
 View Full Text
 Download PDF
Abstract
This study compares two end-cooling systems, convective–radiant combined cooling (FR+FC) and fan coil convection (FC), through continuous experimental investigations, focusing on the impact of window-to-wall ratio (WWR) on indoor thermal comfort, temperature distribution, humidity, and energy consumption. Results show that increasing WWR amplifies indoor temperature fluctuations. While the overall predicted mean vote (PMV) remains within the Level-II comfort range (−1.0 to +1.0), the FC system exhibits pronounced local PMV gradients near west-facing windows, especially at 80% WWR, where transient PMV reaches 1.26 close to the window, 0.89 higher than at the room center. In contrast, the FR+FC system significantly reduces spatial PMV variations, maintaining local PMV within acceptable limits for most of the day. Energy analysis reveals that FC energy consumption rises with WWR, increasing by 7.11% from 40% to 80% WWR, whereas FR+FC energy use decreases by 29.26% over the same range, demonstrating its superior handling of radiant loads. Furthermore, the convective–radiant system exhibits a high average hourly cooling performance coefficient. These findings indicate that FR+FC systems provide better thermal comfort and energy efficiency in high-WWR spaces, making them particularly suitable for summer operation in window-intensive buildings.Keywords
With the improvement of architectural aesthetics, the trend of adding large glass areas in office buildings to enhance architectural appeal and provide unobstructed views has gradually emerged [1]. The overall heat transfer coefficient of windows is typically 5 times higher than of other components of the building envelope, contributing up to 60% of the total energy consumption of the building [2]. During winter months, windows enable substantial solar radiation to enter indoor spaces, effectively augmenting indoor heat levels and consequently decreasing heating energy requirements [3]. However, during the summer season, the ingress of heat from visible light into indoor spaces results in the conversion of solar radiant heat gain into building cooling load, leading to a remarkable increase in energy consumption for building refrigeration due to radiation characteristics [4,5,6], which can also result in indoor overheating and exacerbate the thermal comfort environment indoors.
The impact of solar radiation cannot be underestimated. Hou et al. [7] employed novel scanning and thermal imaging techniques in conjunction with ray-tracing simulation to establish a high-resolution spatial radiative heat flow model, which comprehensively characterized the spatial distribution of long-wave and short-wave radiative heat flow and its impact on the mean radiative temperature (MRT). Song et al. [8] employed the SMRT-Air temperature deviation method to assess the impact of solar radiation on indoor thermal comfort. The findings indicated that solar radiation has a considerable effect on thermal comfort in cold climates, and controlling the amount of solar radiation transmitted through east–west windows is more crucial than other orientations. Huang et al. [9] conducted a comprehensive review of eight existing models that consider solar incidence and proposed a novel model for comparative comfort prediction. The findings indicated that the majority of models incorporating solar radiation as a component of MRT demonstrate a relative fit. Marino et al. [10,11] computed the MRT, hourly time step, and annual solar radiation for individuals in diverse environmental settings. These values can be utilized to evaluate the percentage of dissatisfied occupants (PPD) and its spatiotemporal variations, facilitating long-term thermal comfort assessments and comparisons between irradiated and nonirradiated locations. Li et al. [12] found that the operation scheme determined by multi-objective optimization can reduce the cooling energy consumption of the building by 10.6% to 16.8%, thereby mitigating the increase in energy consumption caused by climate change to a greater extent.
Numerous studies have consistently demonstrated that the presence of windows can lead to thermal discomfort as a result of radiation asymmetry and uneven distribution of indoor thermal comfort. Zhao et al. [3] conducted a case study on a typical high-rise office building with large area windows and proposed a straightforward, practical, effective, and efficient multiobjective optimization method. The findings indicate that maintaining an indoor comfortable environment simultaneously in each area is challenging for multizone buildings with extensive window coverage. Xie et al. [13] conducted a study in Guangzhou, which is representative of an area with hot summers and warm winters, focusing on public buildings as the primary research subject and investigating indoor thermal comfort during occupancy by varying the window-to-wall ratio (WWR). The findings indicated that buildings with high WWR values possess considerable potential for achieving enhanced thermal comfort in Guangzhou. Khetib et al. [14] conducted simulations to investigate the conduction, convection, and radiative heat transfer processes in a double-glazed window (DGW). The findings demonstrated that increasing the window angle can effectively reduce heat transfer through the window, with a 60° increase resulting in a 10% decrease in heat transfer. Ahmed et al. [15] performed a simulation analysis on a typical office building within this region, evaluating four types of window glass, four orientations, and three window glass materials. The results indicated that when the WWR is 100%, using double transparent glass leads to the lowest heating energy consumption. Ma et al. [16] investigated variations in heating and cooling loads under different water treatment plant conditions across various cities. The results revealed a linear relationship between heat load/cold load and WWR. Kalaimathy et al. [17] examined how glass transmittance and windowing ratio influence first-floor lighting performance in warm and humid climates for two-story residential buildings. The findings suggested that installing glass with a 16% WWR and light transmittance of 0.62 at high positions on walls with elevated sills and lintel heights achieves optimal functionality without causing glare. Zheng et al. [18] discussed factors affecting thermal comfort in temporary buildings and proposed strategies for improving thermal comfort in such structures. The results highlighted discrepancies between predictions made by PMV-PPD models and field study outcomes regarding thermal comfort levels in temporary buildings.
Currently, indoor air conditioning mainly employs convection-based and radiant-based air conditioning systems, each with their own advantages and disadvantages [19,20]. By combining convective radiation for cooling and heating in an air source heat pump, these two methods effectively complement each other. This integration not only reduces reaction time and addresses condensation issues during cooling [21,22] but also handles potential indoor loads (such as dehumidification) to enhance indoor air quality while maintaining a controllable thermal environment within acceptable limits [23]. Therefore, the combination of a radiant system with a convective terminal is widely applied in regions characterized by hot summers, cold winters, and wet winters [10]. Through a series of dynamic simulations conducted on a typical office building using the Trnsys 17 environment, Salvalai et al. demonstrated an approximate linear correlation between the frequency distribution of ambient air temperature and simulated comfort levels [24]. Zarrella et al. [25] utilized a detailed DigiThon model to simulate and compare indoor thermal comfort and energy consumption when coupling independent radiant cooling systems with dehumidification, fan coil units, and mechanical ventilation. The results indicated that coupling a radiant cooling system with an independent dehumidified fresh air system can meet the requirements for fresh air and regulate indoor humidity levels, achieving improved comfort conditions, indoor air quality, and rational primary energy use. Liu et al. [26,27,28] established a dedicated laboratory to study the combined convection and radiation heating and cooling system of air-source heat pumps. They found showed that the overall thermal sensation of different populations was linearly correlated with average skin temperature, and the overall thermal sensation of participants was linearly related to indoor operating temperature. They then analyzed the impact of different heating terminal types’ operation strategies and supply water temperature on indoor thermal comfort, energy consumption, and energy efficiency. The results indicated that compared with continuous operation strategies, using an intermittent operation strategy reduced energy consumption by approximately 39% with minimal impact on thermal comfort.
Unlike many previous studies that either simplify solar radiation as a component of mean radiant temperature or ignore its directional characteristics [9,11], this research explicitly distinguishes between direct solar radiation (
Based on the above literature, direct solar radiation may remarkably increase the asymmetry of radiation temperature. Although many scholars at home and abroad have evaluated the effects of different orientations and window sizes on indoor thermal comfort and building energy consumption, most have not fully considered the impact of solar radiation. Research on how windows and solar radiation affect the thermal environment of convective radiation cooling and heating systems is relatively limited. This study conducted an analysis of the impact of window size on indoor comfort and system energy consumption using a convective radiation cooling and heating system established in public buildings located in hot summer and cold winter areas. This work is beneficial for the widespread application of this system in public buildings in hot summer and cold winter areas.
2.1 Laboratory and System Introduction
The experimental tests were conducted in a room on the fifth floor of an office building in Mianyang, Sichuan, a hot summer and cold winter region, located at 31.53° N, 104.69° E (Fig. 1). The test room has dimensions of 8.25 m × 7.89 m × 3.2 m (width × depth × height) and is equipped with horizontal external shading devices (1.05 m) and internal shading devices. The room’s exterior wall faces west, with a heat transfer coefficient of 0.84 W/(m2·K). The windows are constructed with double-layer hollow tempered glass (6+12A+6), with a heat transfer coefficient of 3.30 W/(m2·K), and the glass structure is divided into 24 window sections by aluminum frames. The internal wall adjacent to the east is connected to a corridor, with a heat transfer coefficient of 1.57 W/(m2·K). The room’s floor is covered with wooden flooring, with a surface reflectance of approximately 0.4.
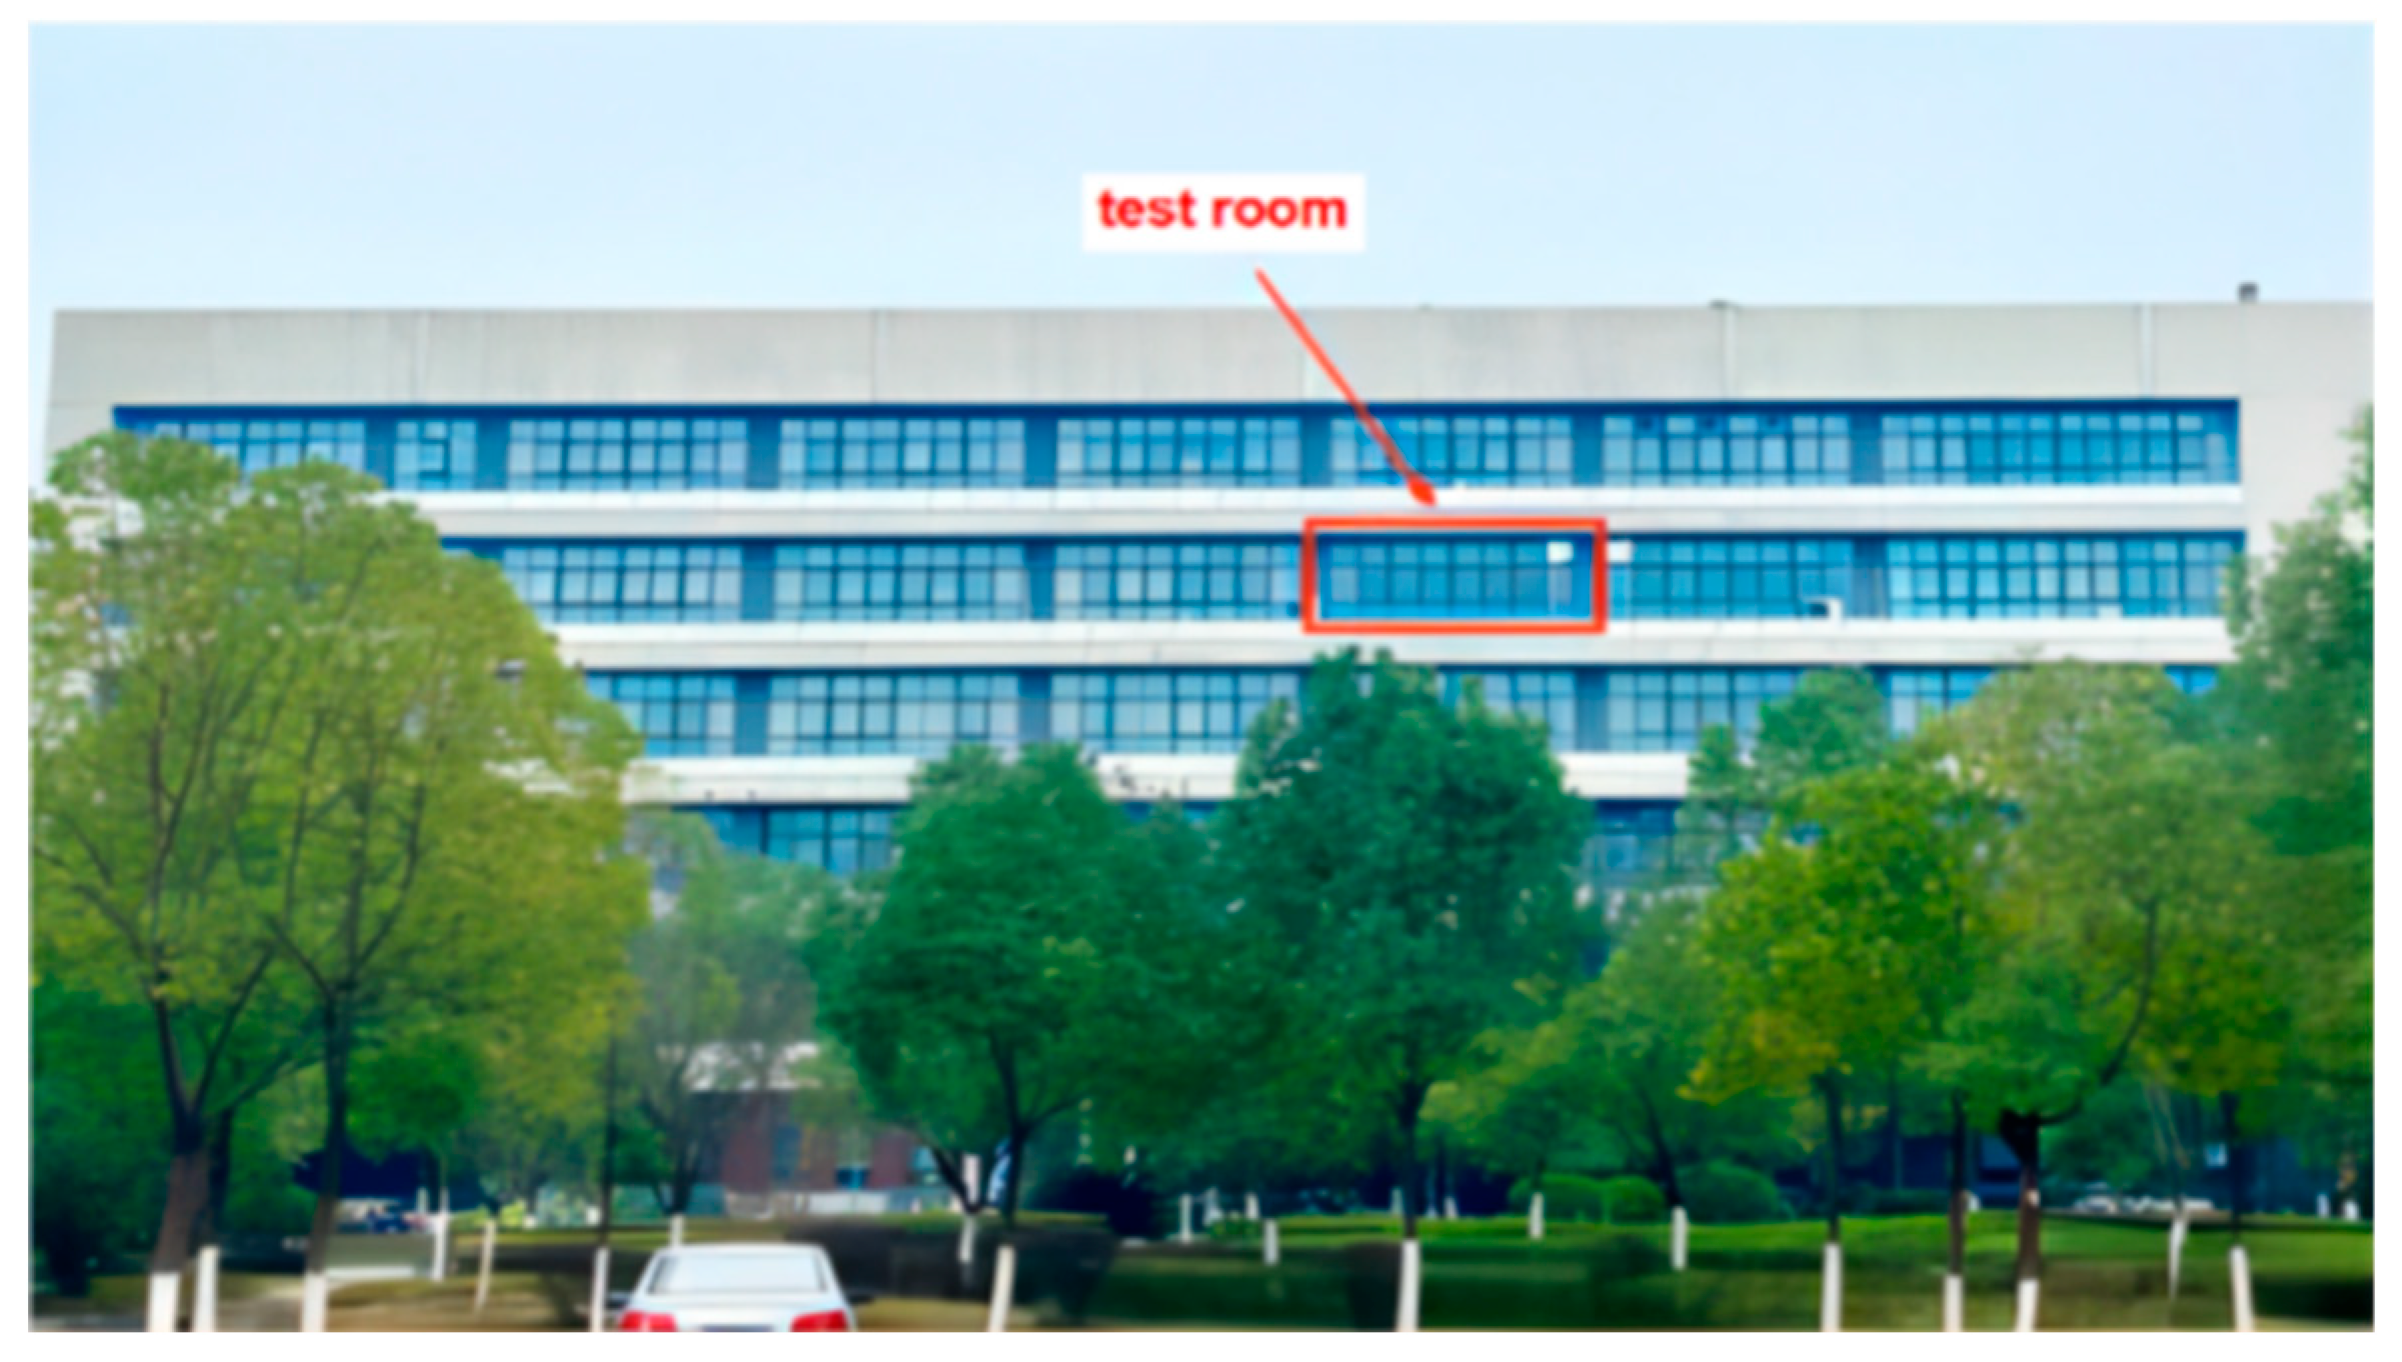
Figure 1: External view of the west facade of the test room.
The convective radiation cooling and heating system, with the air source heat pump as the main unit, is illustrated in Fig. 2a,b. The system consists of a cold and hot source, convective terminal, radiant terminal, thermal storage water tank, collector, primary water pump, and secondary water pump. The cold and hot source is a household air source heat pump unit (YVAG012RSE) with a rated heating capacity of 12.6 kW, a rated cooling capacity of 11.2 kW, and heating and cooling input power of 3.8 kW. The convective terminal comprises two fan coil units (TBFL-56) with a rated heating capacity of 8.4 kW and cooling capacity of 5.6 kW. The radiant terminal is a prefabricated dry module floor radiant system with 10 mm PE-Xb pipes arranged in a spiral pattern at 90 mm intervals. Additionally, an all-day full heat recovery fresh air unit (YRAR003F000RA) with a rated air volume of 300 m3/h and input power of 219 W is installed indoors, to ensure the minimum indoor fresh air volume. The measurement range and errors of the experimental instruments are shown in Table 1.
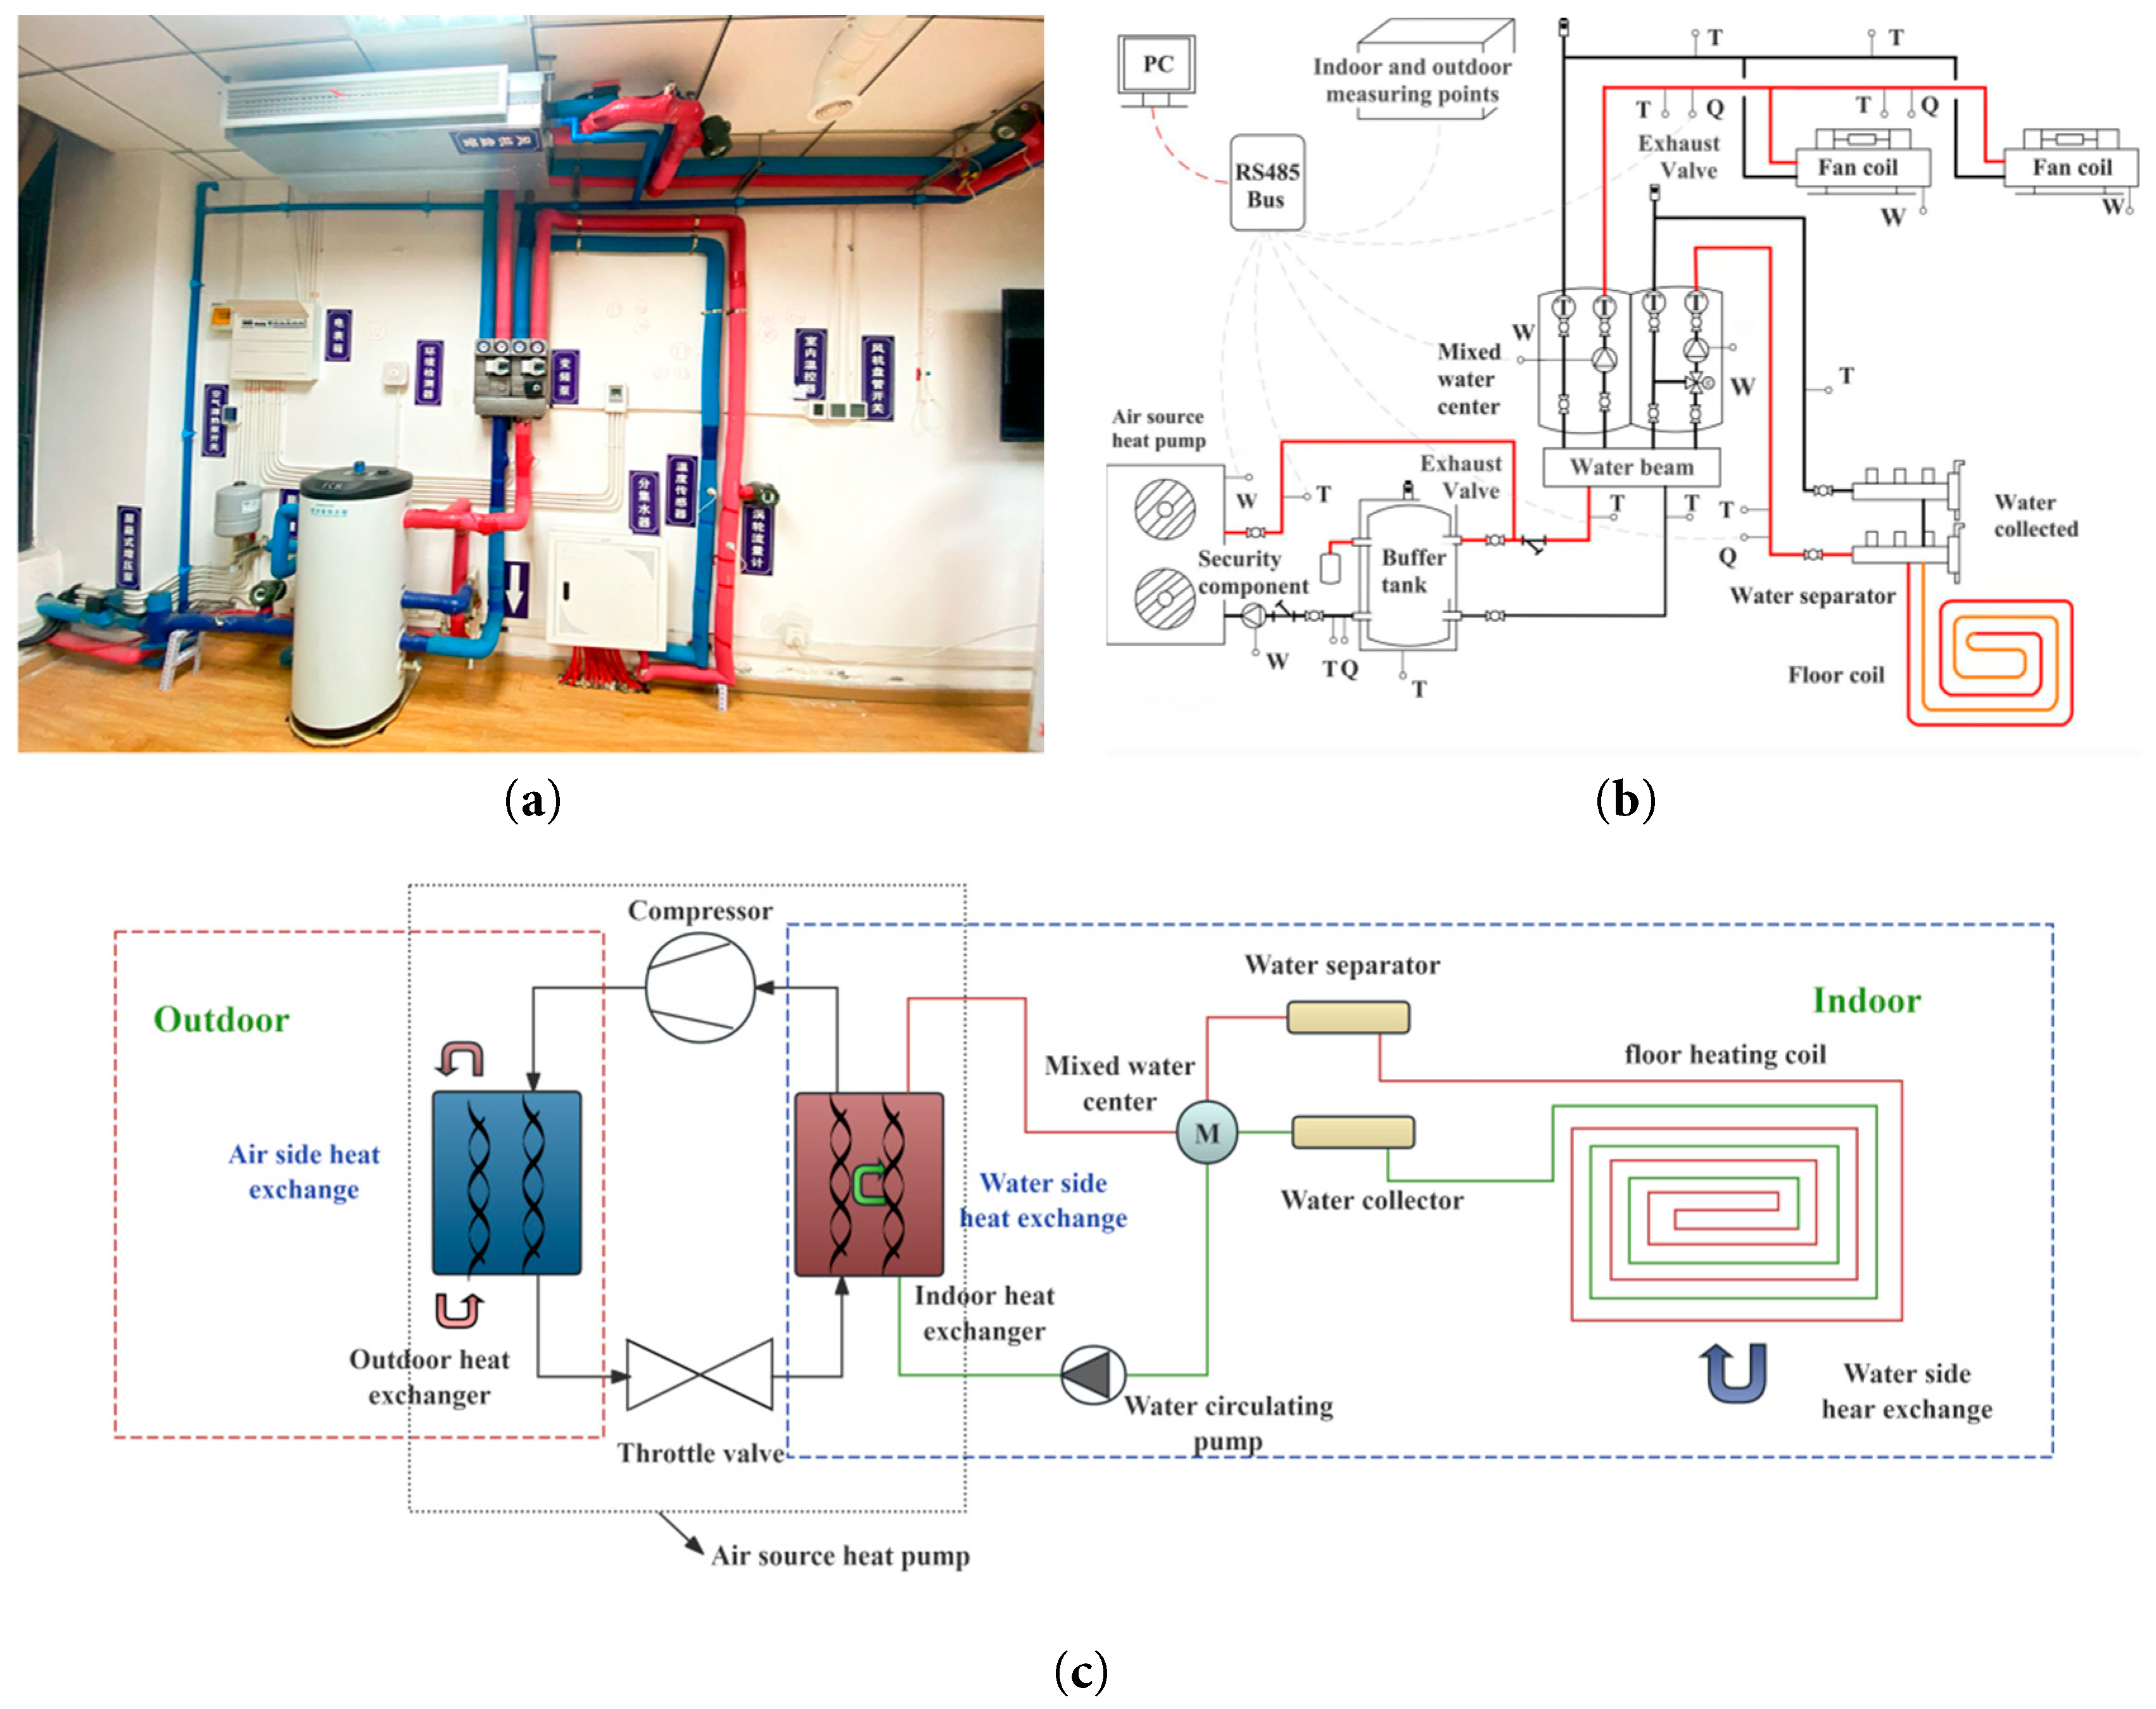
Figure 2: Experimental system: (a) Physical image of the experimental platform; (b) Experimental platform system diagram; (c) Radiant floor system diagram.
Table 1: Parameters of the utilized experimental test instrument.
| Apparatus | RS-WS-N01-2 | TH10S-B | TT-K-30-SLE | WD4122 | RS-TBQ-N01-AL |
|---|---|---|---|---|---|
| Measured parameters | Ambient temperature and humidity | Inner surface temperature of the envelope | Air temperature | Indoor wind speed | Solar radiation intensity |
| Measuring range | −40°C~+80°C 0%~100% RH | −40°C~+80°C | −200°C~26°C | 0~5 m/s | 0~2000 W/m2 |
| Measuring error | ±0.3°C ±2% RH | ±0.5°C | ±0.5°C | ±0.02 m/s | <8 W/m2 |
| Resolution ratio | 0.1°C 0.1% RH | 0.1°C | \ | 0.01 m/s | 1 W/m2 |
2.2 Experimental Scheme Design
During the experiment, which took place from June to August in Mianyang. However, based on the experimental design we testing 5 WWR conditions: 40%, 50%, 60%, 70%, and 80%, each WWR condition was tested over multiple consecutive days. Practical experimental logic suggests that at least 3–5 days of data were collected for each WWR to account for daily variations in solar radiation and outdoor temperature. Thus, the total experimental period is reasonably estimated to be 30–50 days, ensuring sufficient data for statistical stability. The outdoor windows of the laboratory were completely closed and sealed before the experiment started to reduce the infiltration of outdoor air. An indoor fresh air fan was turned on to meet the indoor ventilation requirements. Throughout the experiment, the indoor shading curtains were kept open, and the experimental system was operated continuously. The study involved a continuous experimental investigation of two different terminal cooling systems: convective-radiant combined cooling system (floor radiation + fan coil, FR+FC) and fan coil convection system (FC). Under the (FC) condition, only the convection terminal was opened, while under the (FR+FC) condition, the convection and radiation terminals were opened simultaneously. To ensure comfort, Liu et al. [29] set the composite system temperature of FC+FR to 26°C, while setting the temperature of the standalone FC system to 25°C, set the supply water temperature of the main unit during the experimental testing period was 11°C, but the real water supply temperature at the end of the radiant floor is not 11°C, because the water supply has a mixing process before entering the floor, which ensures that the water supply temperature of the radiant floor is always higher than the dew point temperature of the air. As shown in Fig. 2c, when the household air-source heat pump convective-radiant air conditioning system is in cooling mode, the core of the water mixing control for the floor radiant terminal is to dynamically adjust the mixing ratio of return water to balance the prevention of floor condensation and the guarantee of cooling performance. The system uses a floor supply water temperature sensor to monitor the inlet water temperature in real time, while calculating the dew point temperature using data from indoor temperature and humidity sensors. The controller compares the supply water temperature with a safety margin of dew point temperature +1–2°C: If the supply water temperature is lower than the safety threshold, it commands the mixing valve to increase the opening degree, increasing the mixing ratio of high-temperature return water to raise the water temperature; If the supply water temperature is higher than the safety threshold, it reduces the mixing ratio of return water and increases the proportion of low-temperature water from the main unit to lower the water temperature; When the supply water temperature is within the safe range (dew point +1–2°C), the current water mixing ratio is maintained for stable operation. This logic ensures that the floor supply water temperature always remains higher than the dew point temperature through a closed-loop control of “real-time monitoring—dew point calculation—ratio adjustment”, avoiding surface condensation while releasing cooling capacity through a reasonable temperature difference. For FR+FC: A floor supply water temperature sensor monitors the inlet water temperature in real time, while indoor temperature/humidity sensors calculate the dew point. The controller adjusts the mixing valve to maintain floor supply water temperature at “dew point +1–2°C” while ensuring the indoor air temperature approaches 26°C. This closed-loop logic ensures the system actively corrects deviations from the set temperature. For FC: An independent temperature controller modulates the fan speed and cold water flow rate of the fan coil to maintain the 25°C setpoint. The stable indoor relative humidity further confirms that the FC system operated continuously and effectively, with no interruptions to temperature control.
During convection radiation cooling, the temperature setpoint after calibrating the fan coil and floor radiation indoor temperature controllers was set to 26°C. When the fan coil operated independently for cooling, the indoor temperature controller was calibrated and set to 25°C. Throughout the experiment, two individuals wearing 0.5 clo summer clothing sat in a sedentary position during working hours (9:00–18:00). To ensure the authenticity of the testing, the experiment allowed for light activity by the occupants.
The measurement points in the experimental test room include indoor air temperature and humidity measurement points, enclosure surface temperature measurement points, and indoor vertical temperature measurement points. The indoor air temperature and humidity measurement point is located on the ceiling at the center of the room. The arrangement of enclosure surface temperature measurement points is shown in Fig. 3a, and the indoor vertical temperature measurement points are located at different distances from the window opening. Windows are the primary path for solar radiation to enter the room, and its influence attenuates with distance from the window. Since the test data in different indoor locations will vary greatly, this paper selects three conventional test sites mentioned by Möhlenkamp et al. in the study for the test sites of this experiment [30], specifically B0 (0.60 m from the window) corresponds to the typical seated position near the window, where occupants are most directly affected by solar radiation; A0 (4.27 m) and C0 (6.89 m) represent mid-range and far-from-window areas, respectively, enabling analysis of how radiation effects weaken spatially. Given the 0.05 m elevation of the floor in the test room and on the basis of the average height of the thigh in a seated position for adult men being 0.445 m, the air temperature was continuously measured at distances of 0.45, 0.90, 1.35, 1.80, and 2.25 m from the ground at each point, as shown in Fig. 3b. All measurement instruments operated continuously during the experiment, and data were recorded at 10-min intervals.
The control strategy of the convective-radiant combined cooling system (FR+FC) is designed to coordinate the operation of the fan coil unit (FC) and the radiant floor (FR) to maintain the indoor thermal environment, both of which are controlled by the indoor set temperature. Specifically, the supply water temperature of the FR system is simultaneously affected by the indoor environmental temperature and the indoor air humidity, both of which constantly change. Therefore, the supply water temperature at the FR terminal will fluctuate accordingly, leading to dynamic changes in the surface temperature of the FR terminal. Thus, the FR system does not have a fixed or predetermined surface temperature set point. Specifically, the FC and FR are activated simultaneously. After calibration, the indoor temperature controllers for both FC and FR are set to 26°C, meaning the system maintains the indoor air temperature at 26°C through the collaborative cooling of the two terminals. The system will continue to operate as long as the indoor temperature has not reached the set temperature. Meanwhile, the FR+FC system performs real-time dew point monitoring. Specifically, the FC terminal monitors the relative humidity of the indoor air and calculates the dew point temperature at the current relative humidity, which is transmitted in real time to the water mixing system of the FR to adjust the mixing ratio, ensuring that the supply water temperature at the FR terminal always remains higher than the dew point temperature. Therefore, the FR never stops working during the cooling period. The FR plays a critical role in handling radiant loads, where the FC is less efficient. Even if the FC rapidly reduces convective heat, the FR continues to operate to absorb and dissipate radiant heat, preventing local overheating caused by direct solar radiation. Additionally, the FR utilizes thermal energy storage characteristics, storing cooling energy during low-load periods and releasing it during peak-load periods to stabilize indoor temperatures and reduce the burden on the FC. Thus, the FR+FC control strategy ensures that the two terminals operate synergistically: the FC primarily handles convective loads, while the FR focuses on radiant loads and provides thermal stability through cooling storage, without stopping due to the FC’s operation.
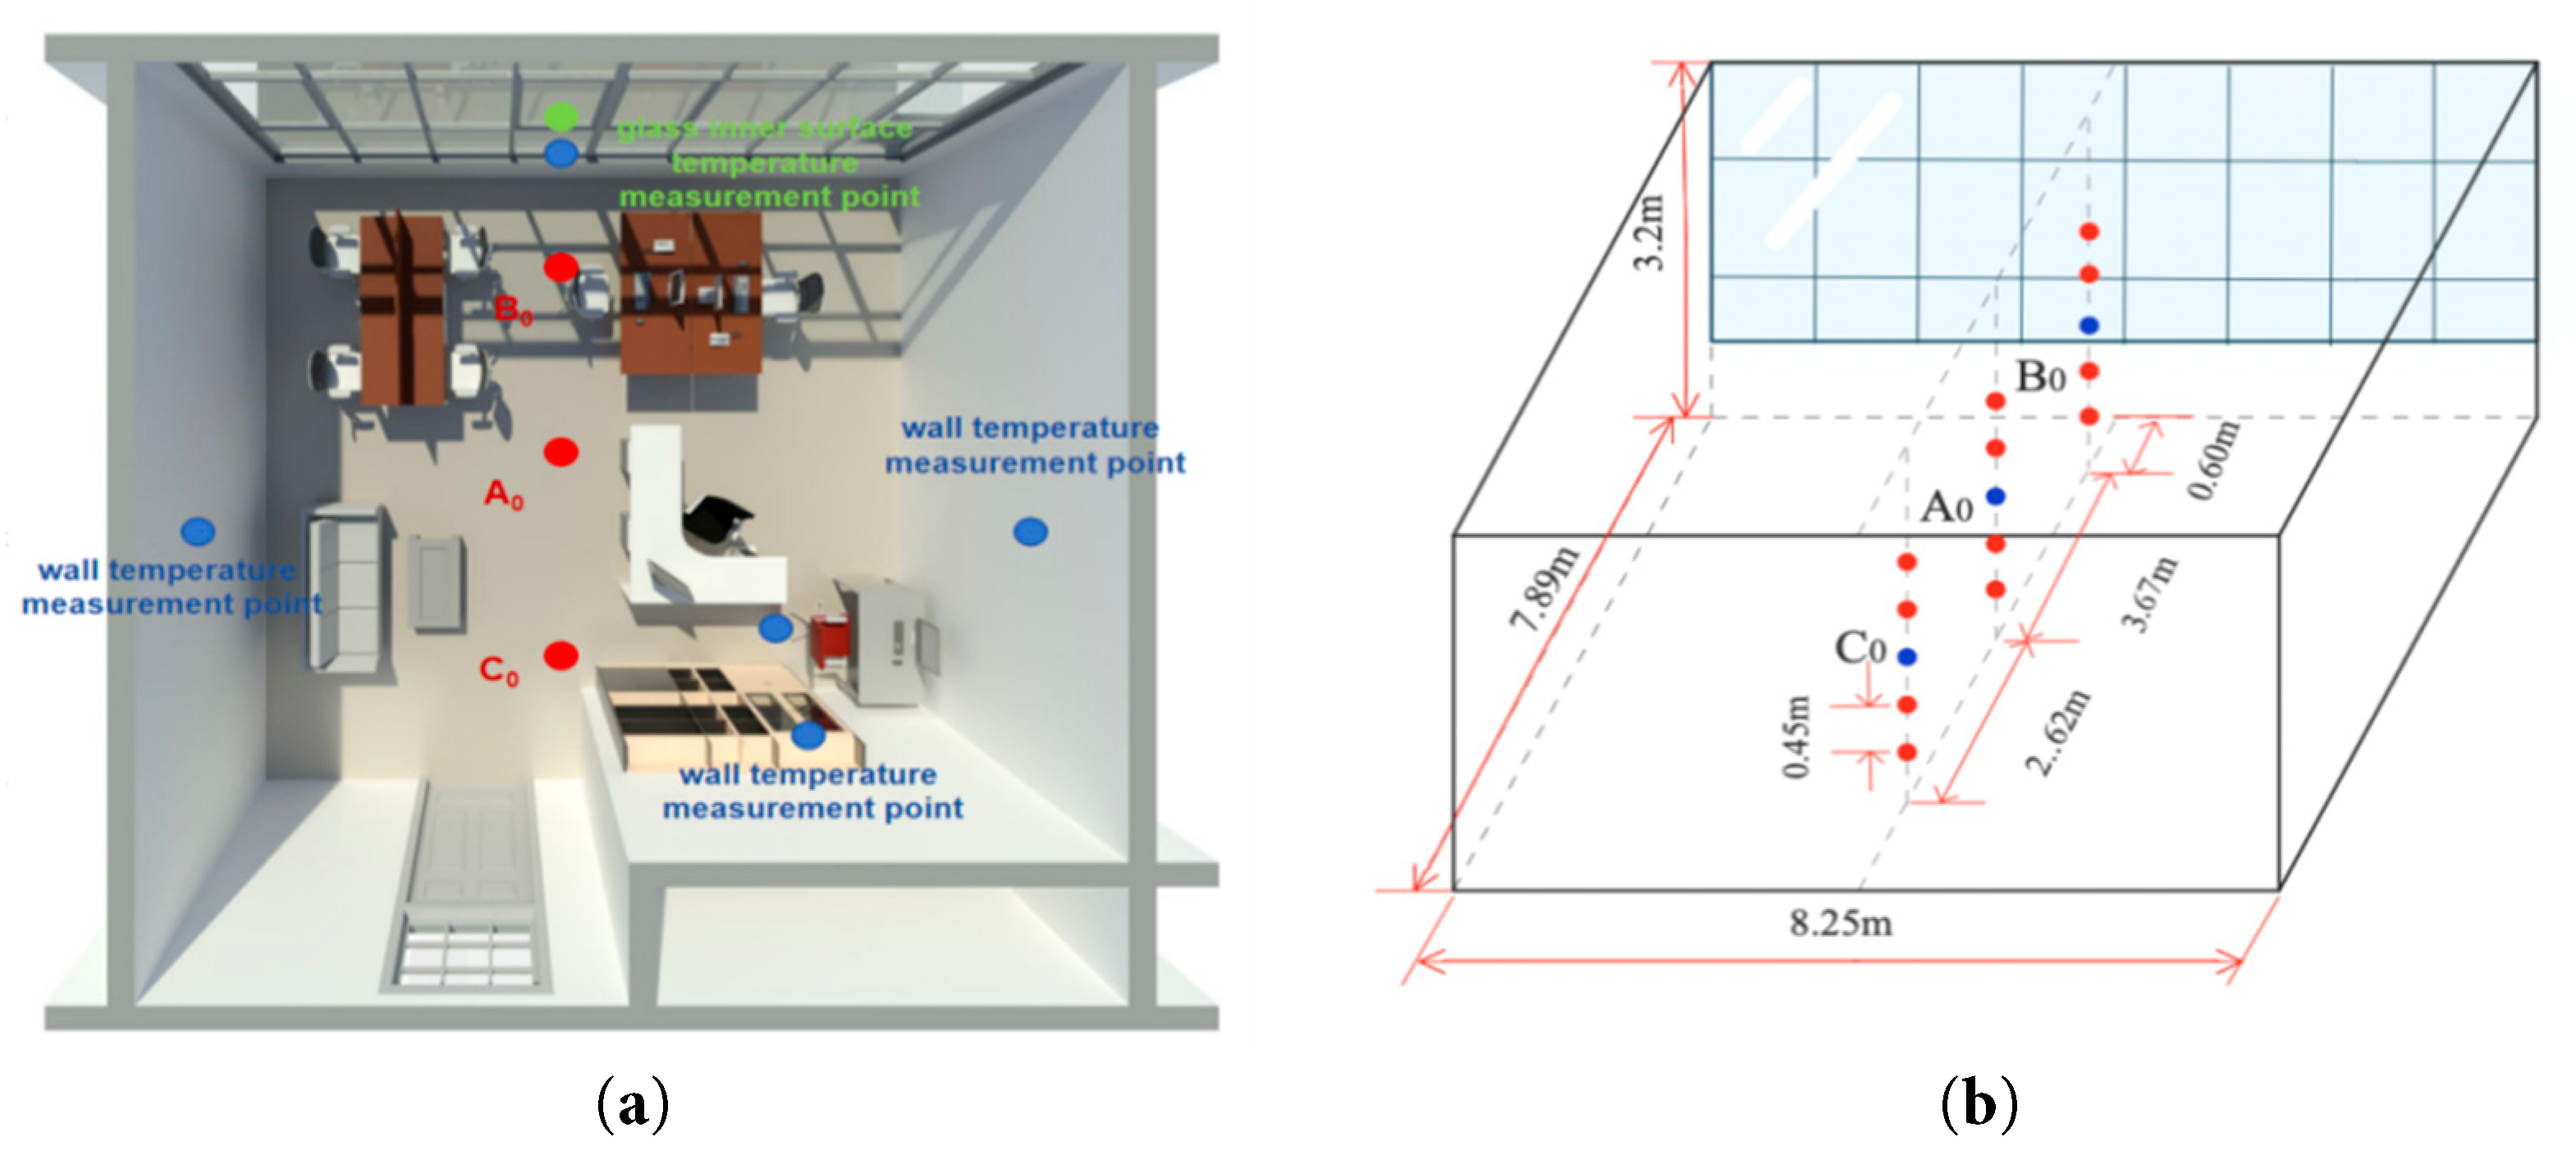
Figure 3: Layout of indoor measuring points: (a) Overall measuring points; (b) Vertical temperature measuring points.
The impact of the WWR can be assessed accurately by using an equivalent thermal resistance method to paste aluminum foil insulation (thermal conductivity 0.034 W/[m·K]) on the existing glass surface to replace the building enclosure structure effectively (the equivalent thickness of the insulation can be calculated using Eqs. (1)–(3)). Given that the daylighting requirements determine the minimum value of the WWR, on the basis of the Office Building Design Code (JGJT67-2019) and the research results of Xue et al. [6], the minimum WWR for west-facing windows was set at 40% to meet the natural lighting requirements indoors. Therefore, in consideration of the actual conditions of the laboratory, the research range of the WWR was set from 40% to 80%, decreasing by 10%. Except for the WWR of 80%, the other conditions were achieved by pasting aluminum foil insulation, as shown in Fig. 4.
Our approach of using aluminum foil insulation to simulate non-transparent envelopes aligns with established practices in building thermal environment research. Liu et al. [26] adopted the same method in their study on convective-radiant systems, verifying that aluminum foil-insulated glass areas had thermal performance equivalent to non-transparent walls, with no significant impact on experimental trends. La Gennusa et al. [31] used aluminum foil to adjust the thermal resistance of transparent envelopes in solar radiation-related experiments, noting that “matching thermal resistance is more critical than matching absorption rate for inter-group comparisons, as absorption differences can be corrected via surface temperature monitoring”.
The experiment was conducted continuously from June to August 2024 in Mianyang, a representative city in China’s hot-summer and cold-winter climate zone. During this period, the local solar altitude angle, daily solar radiation duration, and radiation intensity follow relatively stable seasonal patterns. This seasonal consistency inherently reduced large-scale inter-day fluctuations in solar radiation compared to transitional months. To eliminate the impact of random daily solar variations on WWR comparison, we adopted a “trend-matching” strategy for data selection. The screening criterion was that the daily trend of outdoor solar radiation intensity was consistent across all selected days. For example: Under the FR+FC system, the peak solar radiation intensity on west-facing windows for WWR 40%, 50%, and 80% all occurred between 14:00–16:00, with similar diurnal variation curves; Under the FC system, the peak radiation for WWR 60%, 70%, and 80% also followed the same afternoon peak trend, ensuring that radiation-induced heat gain was comparable across WWR groups. To avoid additional radiation fluctuations caused by shading adjustments, we strictly controlled the shading status throughout the experiment. The test room was equipped with a fixed external horizontal shading device, which remained in a fixed position during the entire experiment. This eliminated radiation differences caused by adjustable shading; All indoor shading curtains were kept open consistently. This ensured that the transmittance of solar radiation through the double-layer hollow tempered glass was uniform across all WWR conditions, with no artificial interference from curtain opening/closing. For WWR conditions other than 80%, we used aluminum foil insulation cotton to cover part of the glass, replacing it with an equivalent non-transparent envelope. This method not only ensured that the thermal resistance of the covered area matched the external wall but also: Prevented the covered glass from absorbing or transmitting solar radiation, ensuring that only the effective window area contributed to solar radiation heat gain; Avoided radiation scattering or reflection differences caused by using different materials, as aluminum foil insulation has a stable surface reflectance.
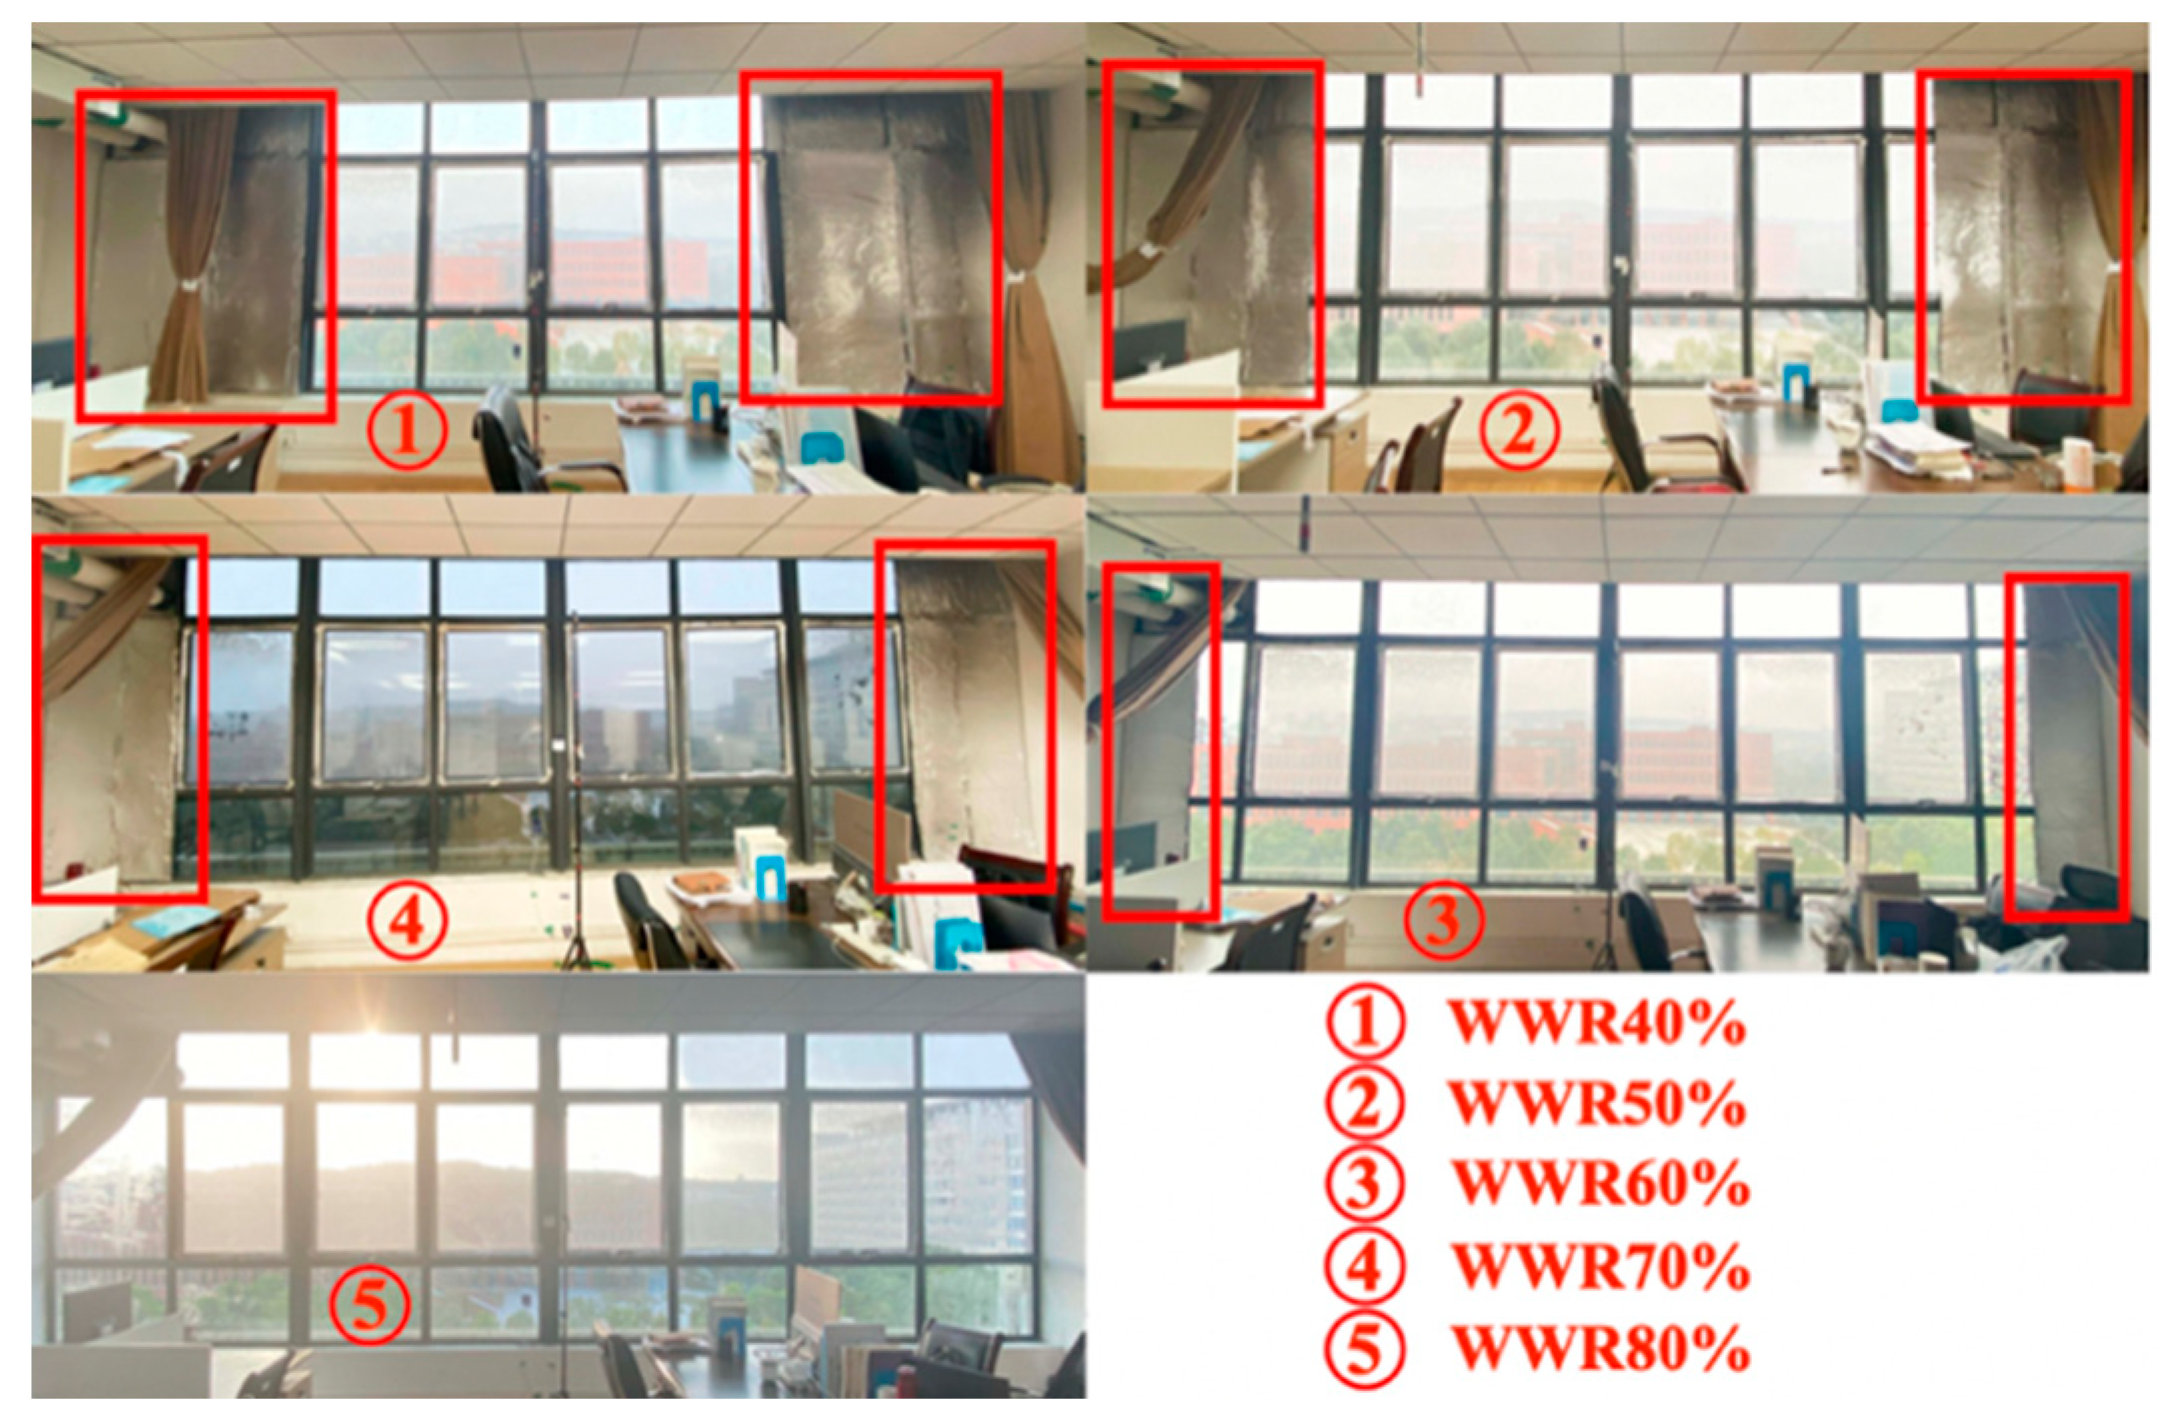
Figure 4: Experimental WWR.
2.3.1 Dimensionless Value of the Vertical Temperature
The vertical temperatures at each point were nondimensionalized to compare the temperature changes along the vertical direction at different time points and measurement locations, with the specific operation as follows:
2.3.2 Coefficient of Performance
The coefficient of performance (COP) denotes the quantity of cooling (heat) that can be obtained per unit power consumption, serving as a crucial technical and economic indicator for air conditioning systems. A high COP value signifies enhanced energy efficiency within the system. Its calculation formula is presented below:
Human thermal comfort is considerably influenced by the radiative heat exchange with surrounding surfaces, leading to different comfort sensations depending on the location of the body in the environment, which is related to the surface temperatures and the angles at which the body observes them [32]. In such cases, the calculation of angular coefficients becomes more complex and can be computed using the following algorithm for the angular coefficient between the human body and any rectangular surface [33,34]:
Table 2: Absolute values of parameters
| i | a | b |
|---|---|---|
| 1 | XK-XP′ | ZK-ZP′ |
| 2 | XK-XP′ | ZP′-ZH |
| 3 | XP′-XH | ZP′-ZH |
| 4 | XP′-XH | ZK-ZP′ |
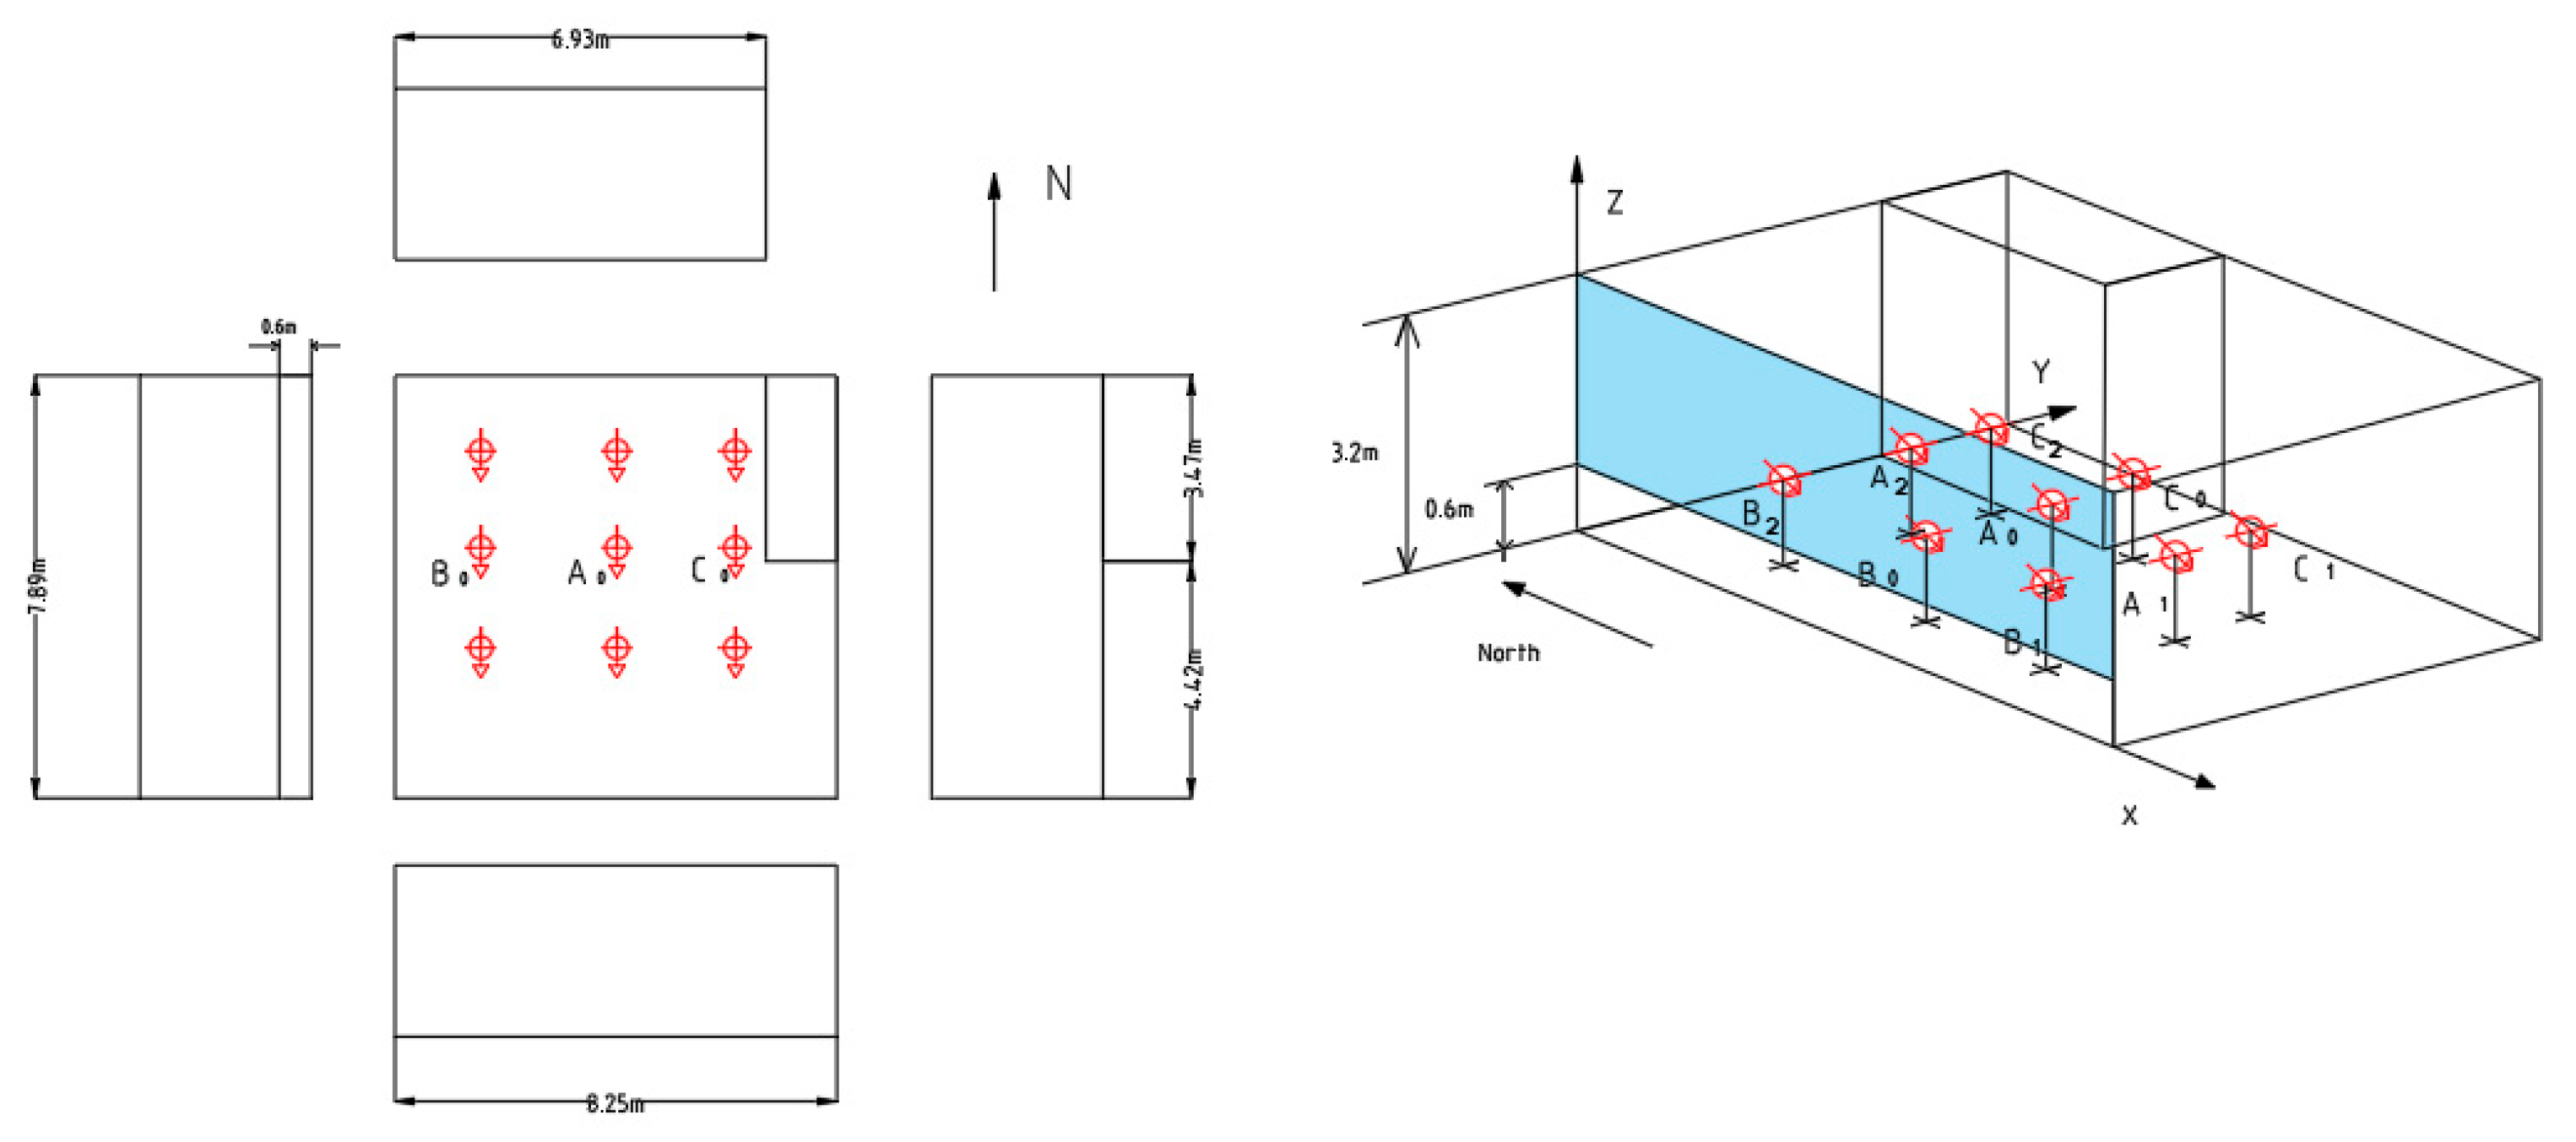
Figure 5: Expanded view of the calculated view factor.
In the thermal environment, apart from the influence of radiation heat exchange between enclosures, there is typically a high-intensity radiation source characterized by small size, high emission temperature, and strong beam direction. This study employs a polynomial algorithm developed by researchers on the basis of preliminary data to compute the projected area factor of a seated individual [7]. The coefficients of the polynomial algorithm for the human body in a seated position are presented in Table 3.
Table 3: Coefficients of the polynomial algorithms for the case of seated (
| Seated | j = 0 | j = 1 | j = 2 | j = 3 |
|---|---|---|---|---|
| i = 0 | 2.884E−01 | 2.225E−03 | −5.472E−05 | 1.802E−07 |
| i = 1 | 2.225E−03 | −7.653E−05 | 7.286E−07 | −1.457E−09 |
| i = 2 | −9.292E−05 | 4.021E−06 | −6.215E−08 | 3.152E−10 |
| i = 3 | 9.027E−07 | −4.632E−08 | 7.690E−10 | −4.015E−02 |
| i = 4 | −2.517E−09 | 1.380E−10 | −2.341E−12 | 1.231E−14 |
In addition to external shading, the building envelope can induce shadow effects, resulting in a partial reduction of solar radiation and consequent alterations in the indoor thermal environment. If this point lies within the irradiated region of the surroundings, denoted by points A, B, C, and D in Fig. 6, its coordinates can be determined using the following equation [31]:
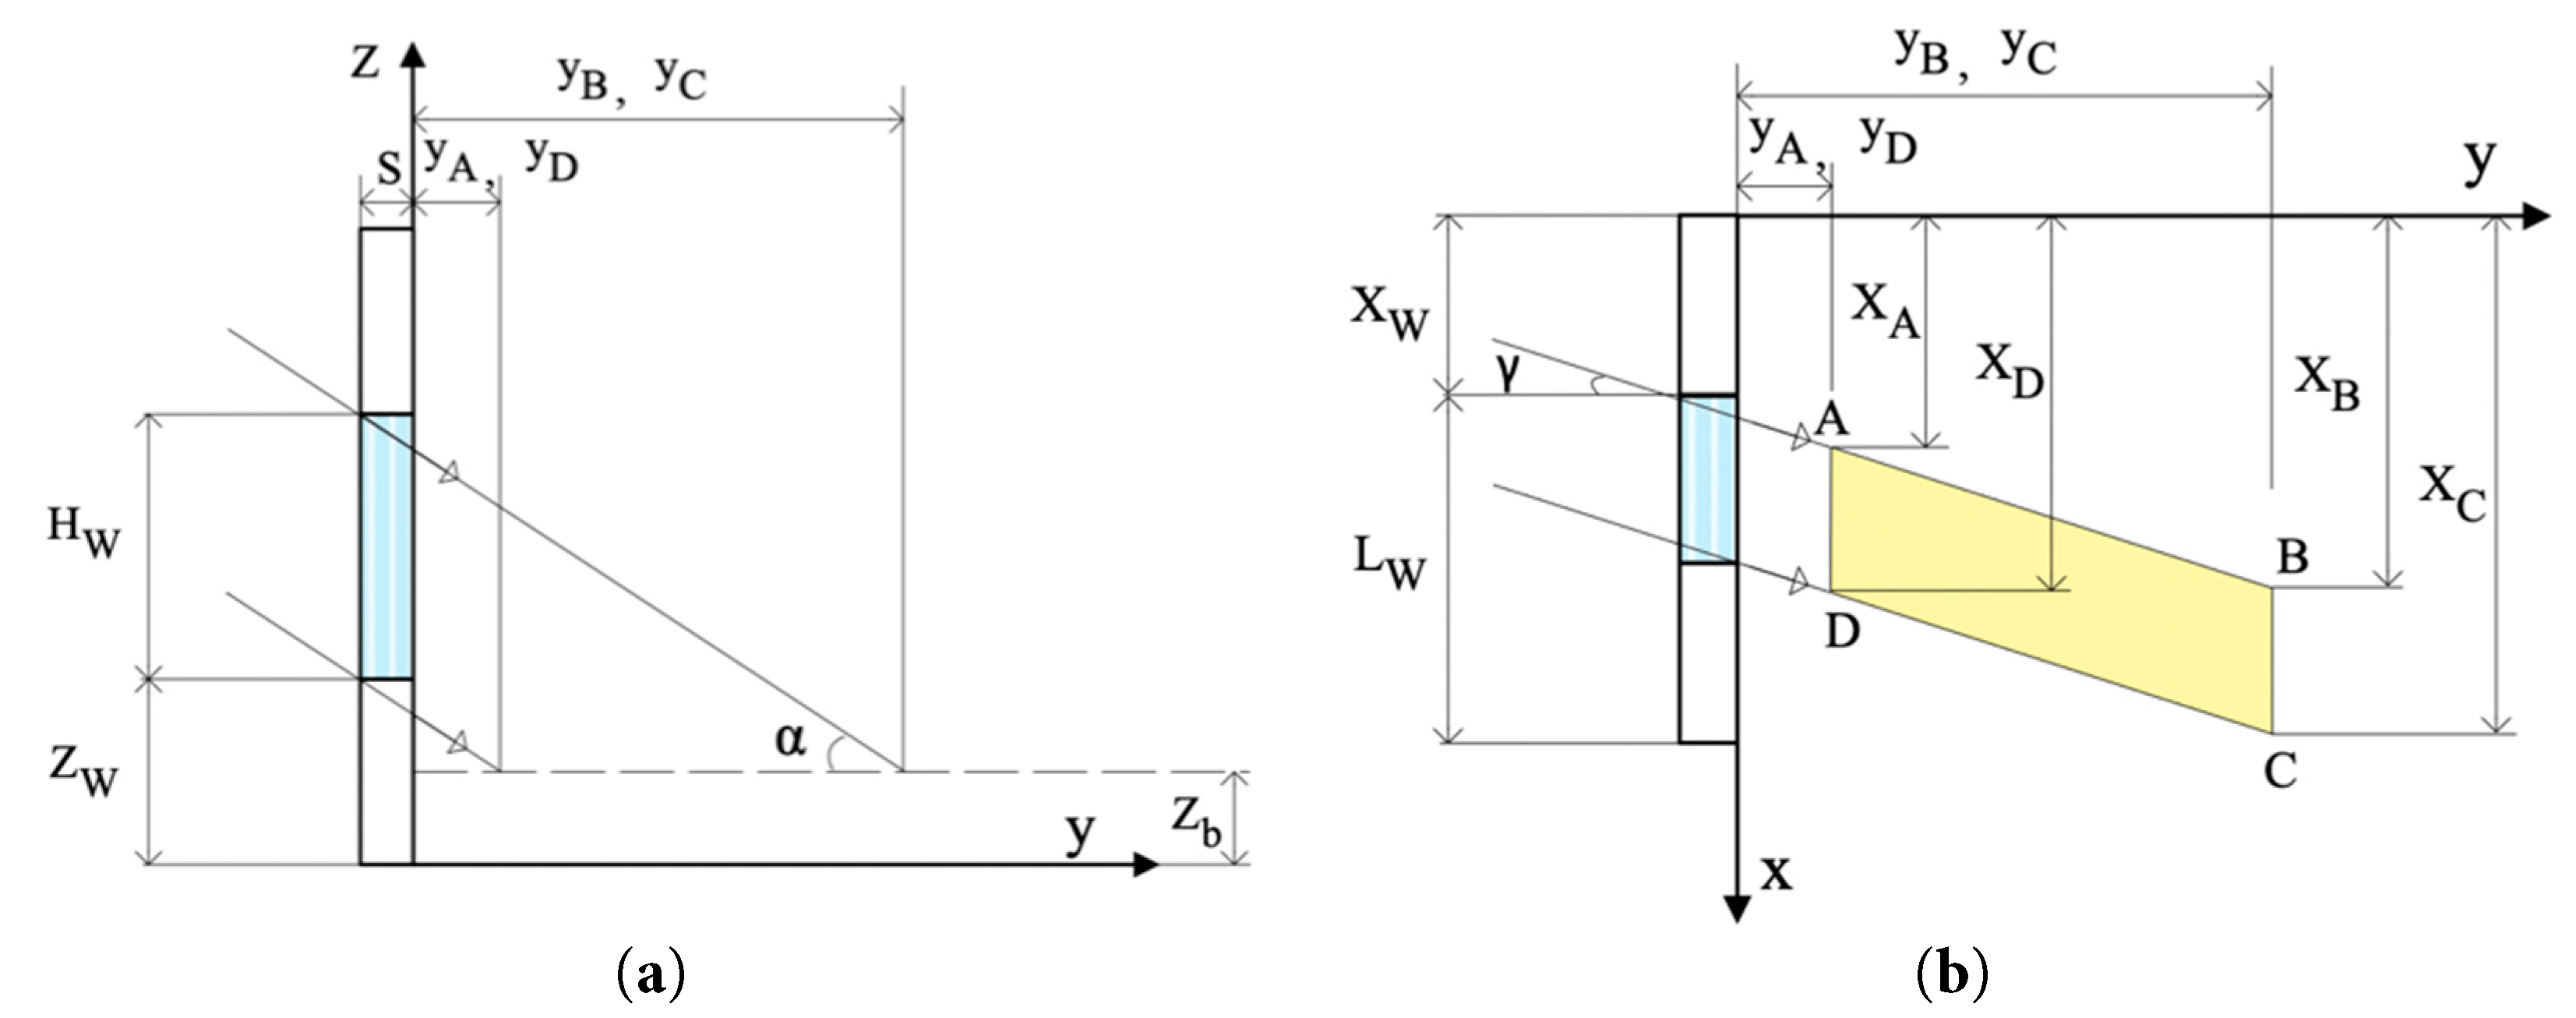
Figure 6: Definition of the geometric parameters involved in the delimitation of the irradiated zone: (a) Section view; (b) Plan view.
Fig. 6 explains the meaning of the terms contained in Eqs. (8)–(15), where Zb represents the central height of a person exposed to radiation, typically 0.60 m (sitting position) or 1.10 m (standing position) [18].
2.3.6 Mean Radiant Temperature
The mean radiant temperature (
When evaluating the overall thermal comfort indoors, the value of
Table 4: Thermal sensation scale (seven-point).
| Thermal Sensation | Hot | Warm | Slightly Warmer | Moderate | Slightly Cool | Cool |
|---|---|---|---|---|---|---|
| PMV value | +3 | +2 | +1 | 0 | −1 | −2 |
3.1 Indoor and Outdoor Environmental Parameter Analysis
To study the impact of indoor and outdoor air temperatures and the horizontal solar radiation incident on the west-facing window for different WWRs, the (FR+FC) and (FC) systems with WWRs of 40%, 50%, 60%, 70%, and 80% were selected for data processing and comparative analysis.
Fig. 7 shows the indoor and outdoor air temperatures of different WWR cooling systems. Experimental days with similar trends in outdoor temperature variation during the summer cooling period were selected for data comparison to reduce the impact of outdoor air temperature on the indoor thermal environment. Fig. 7a,b, respectively shows the indoor and outdoor air temperature variations for different WWRs of (FR+FC) and (FC) systems. Under (FR+FC), the indoor temperature fluctuates between 21.0°C and 29.0°C under various conditions, while under (FC), the indoor temperature fluctuates between 22.0°C and 30.5°C. The indoor temperature fluctuation is smaller under (FR+FC). To better reflect the central tendency of indoor temperature, the median of the data for each WWR was used. Fig. 7b shows that the median indoor temperatures for WWRs of 40%, 50%, 60%, 70%, and 80% are 24°C, 24.8°C, 23.5°C, 24°C, and 24.4°C for (FR+FC), and 24.6°C, 25.3°C, 24.2°C, 24.5°C, and 24.5°C for (FC).
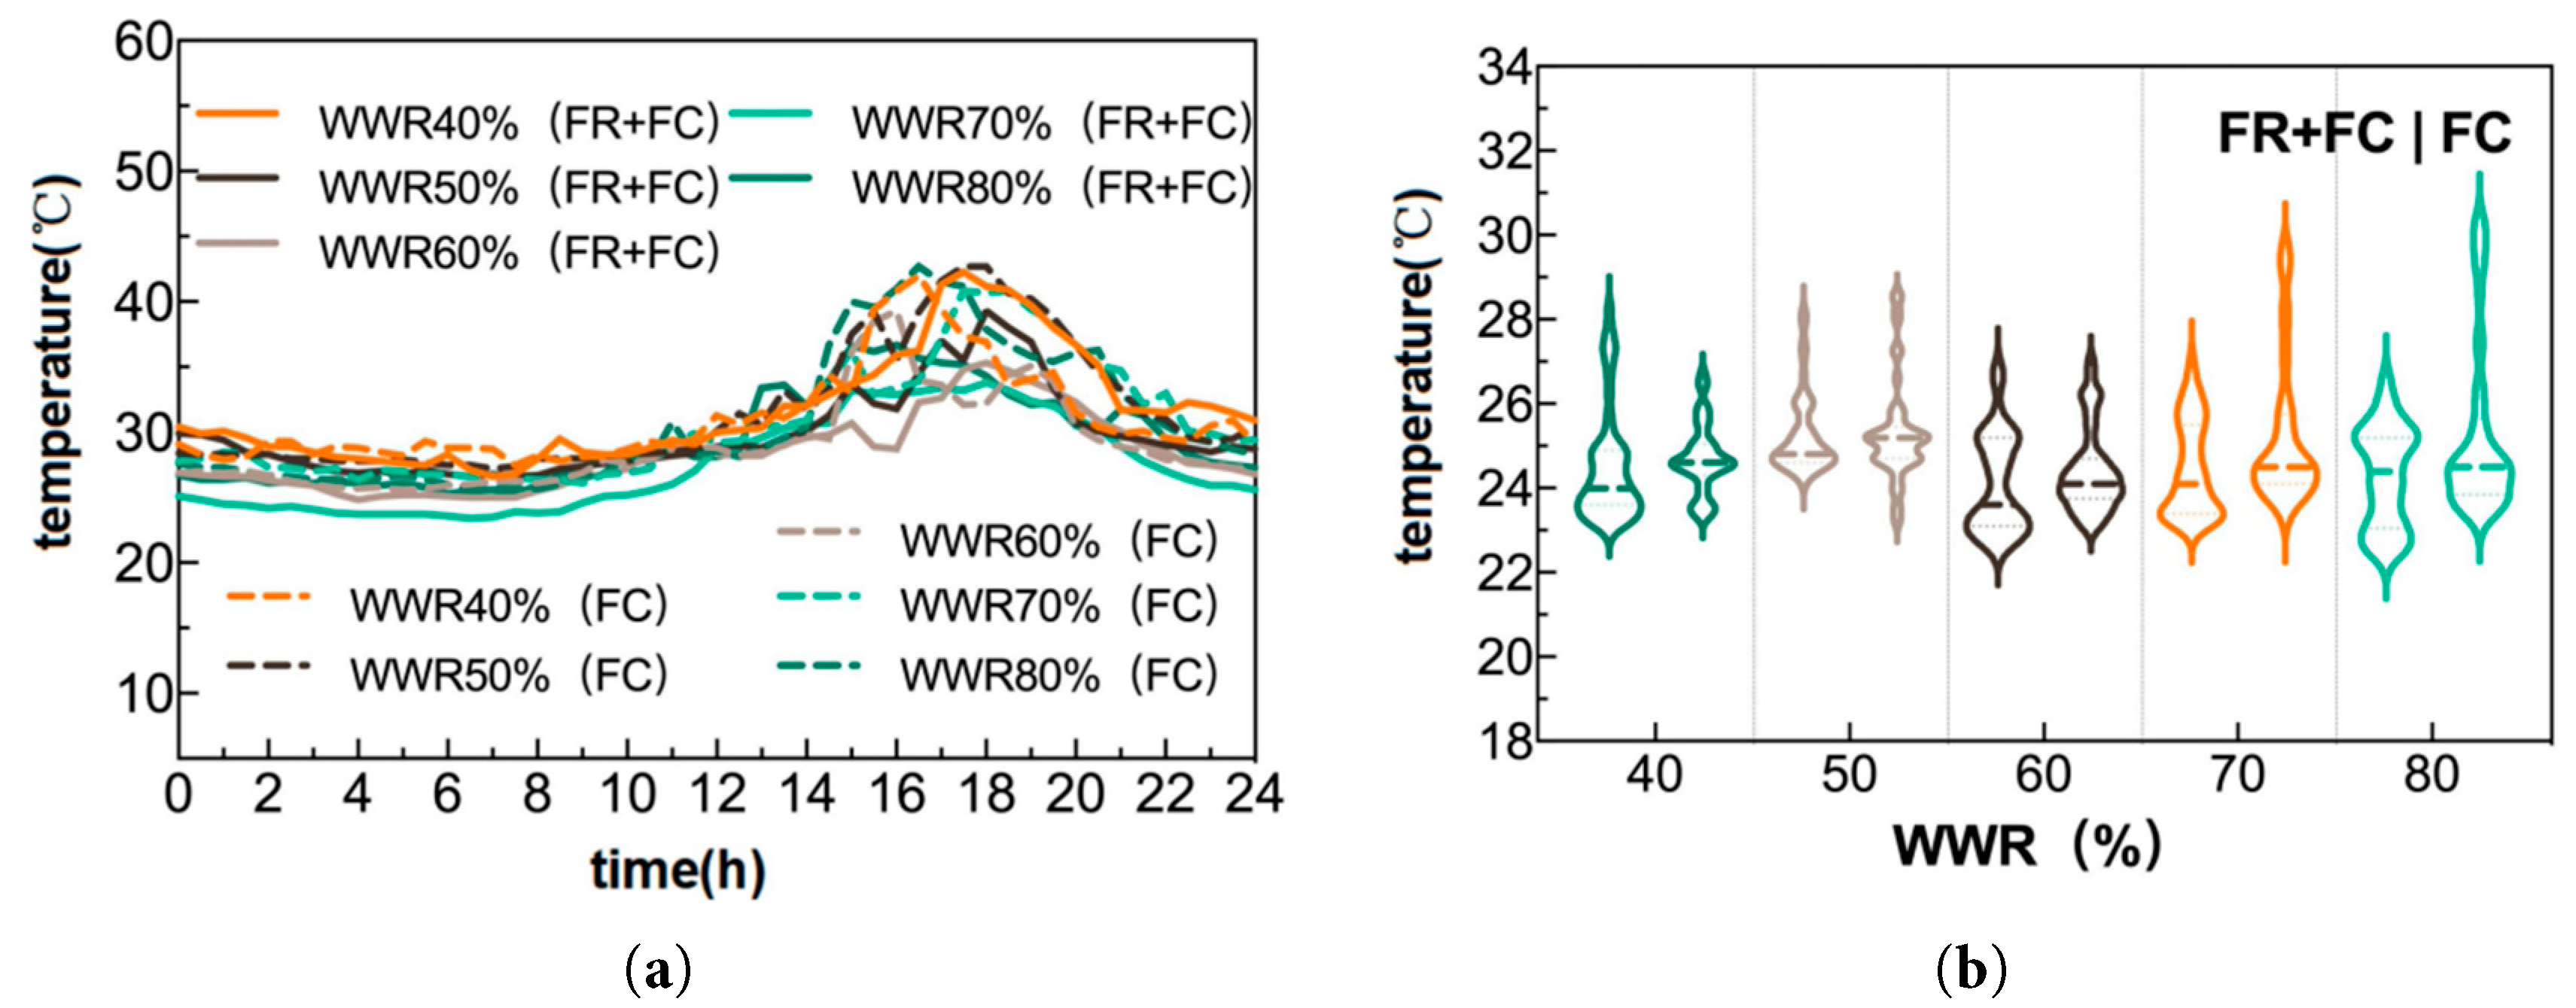
Figure 7: Indoor and outdoor air temperature of each cooling system under different WWRs: (a) Outdoor air temperature; (b) indoor air temperature.
As shown in Fig. 7a,b, the outdoor temperature variations are consistent under different conditions, showing an initial rise followed by a decline between 12:00 and 20:00. Regardless of (FC) or (FR+FC), the indoor temperature fluctuation increases with the increase in the WWR. Under a larger WWR, the indoor temperature fluctuation is greater for (FC), but the central tendency of indoor temperature is maintained when the WWR is set to 50%.
Fig. 8 shows the variation of solar radiation intensity incident on the west-facing window for each experimental condition from 6:00 to 20:00. When combined with Fig. 9, the figure shows that the solar radiation incident on the west-facing window reaches its maximum value between 14:00 and 16:00. As shown in Fig. 8a,b, the maximum solar radiation incident on the west-facing window for WWRs of 40%, 50%, 60%, 70%, and 80% are 750, 650, 420, 620, and 600 W/m2 for (FR+FC) and 650, 780, 790, 800, and 850 W/m2 for (FC).
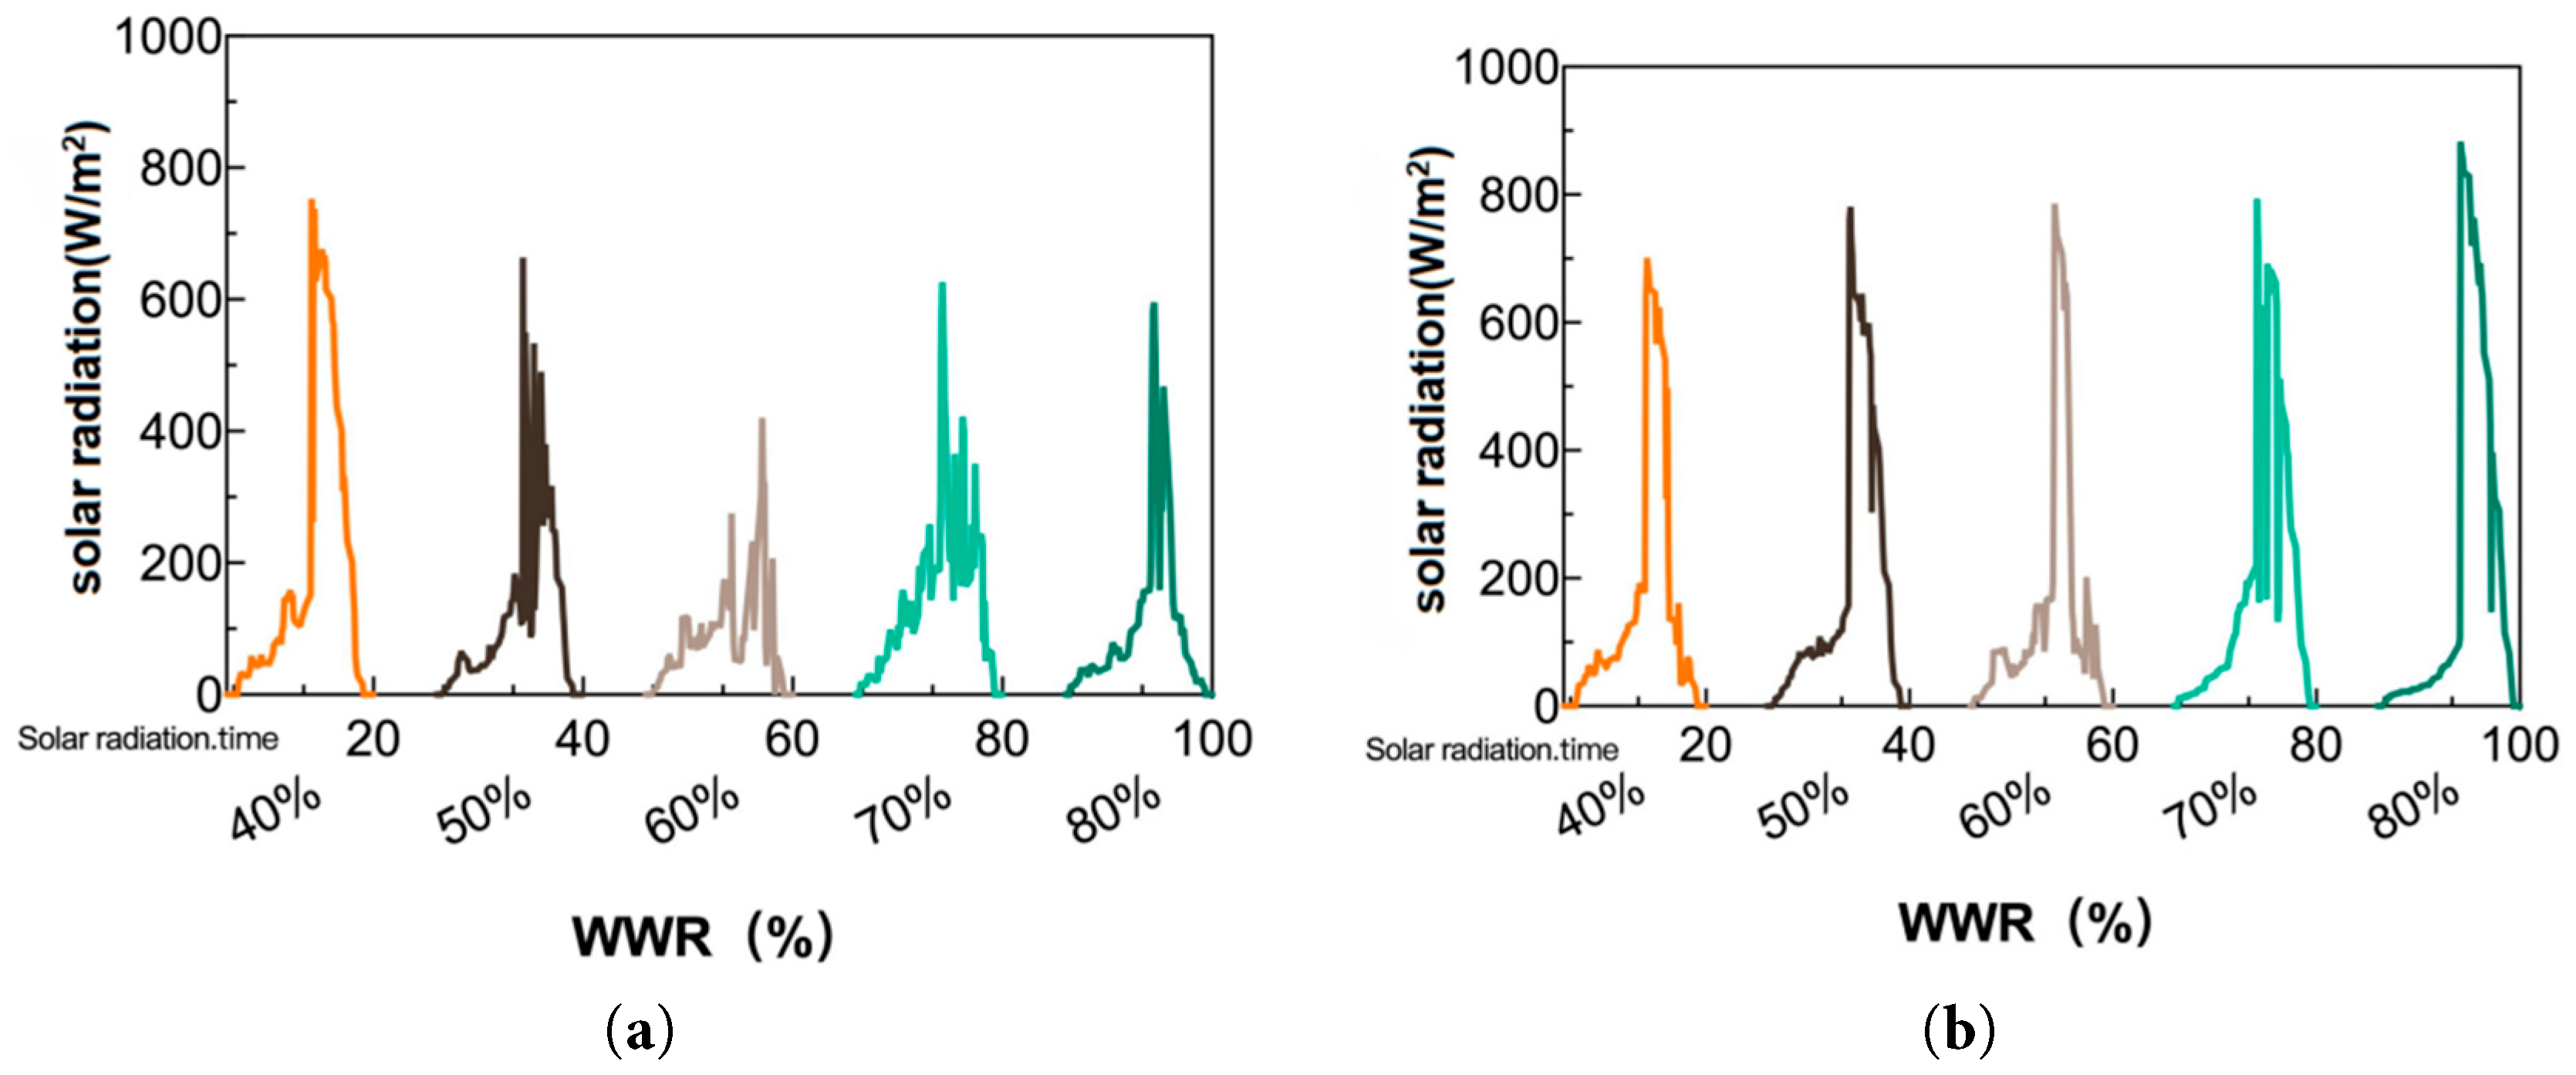
Figure 8: Horizontal solar radiation on the external west window of each cooling system under different WWRs: (a) FR+FC; (b) FC.
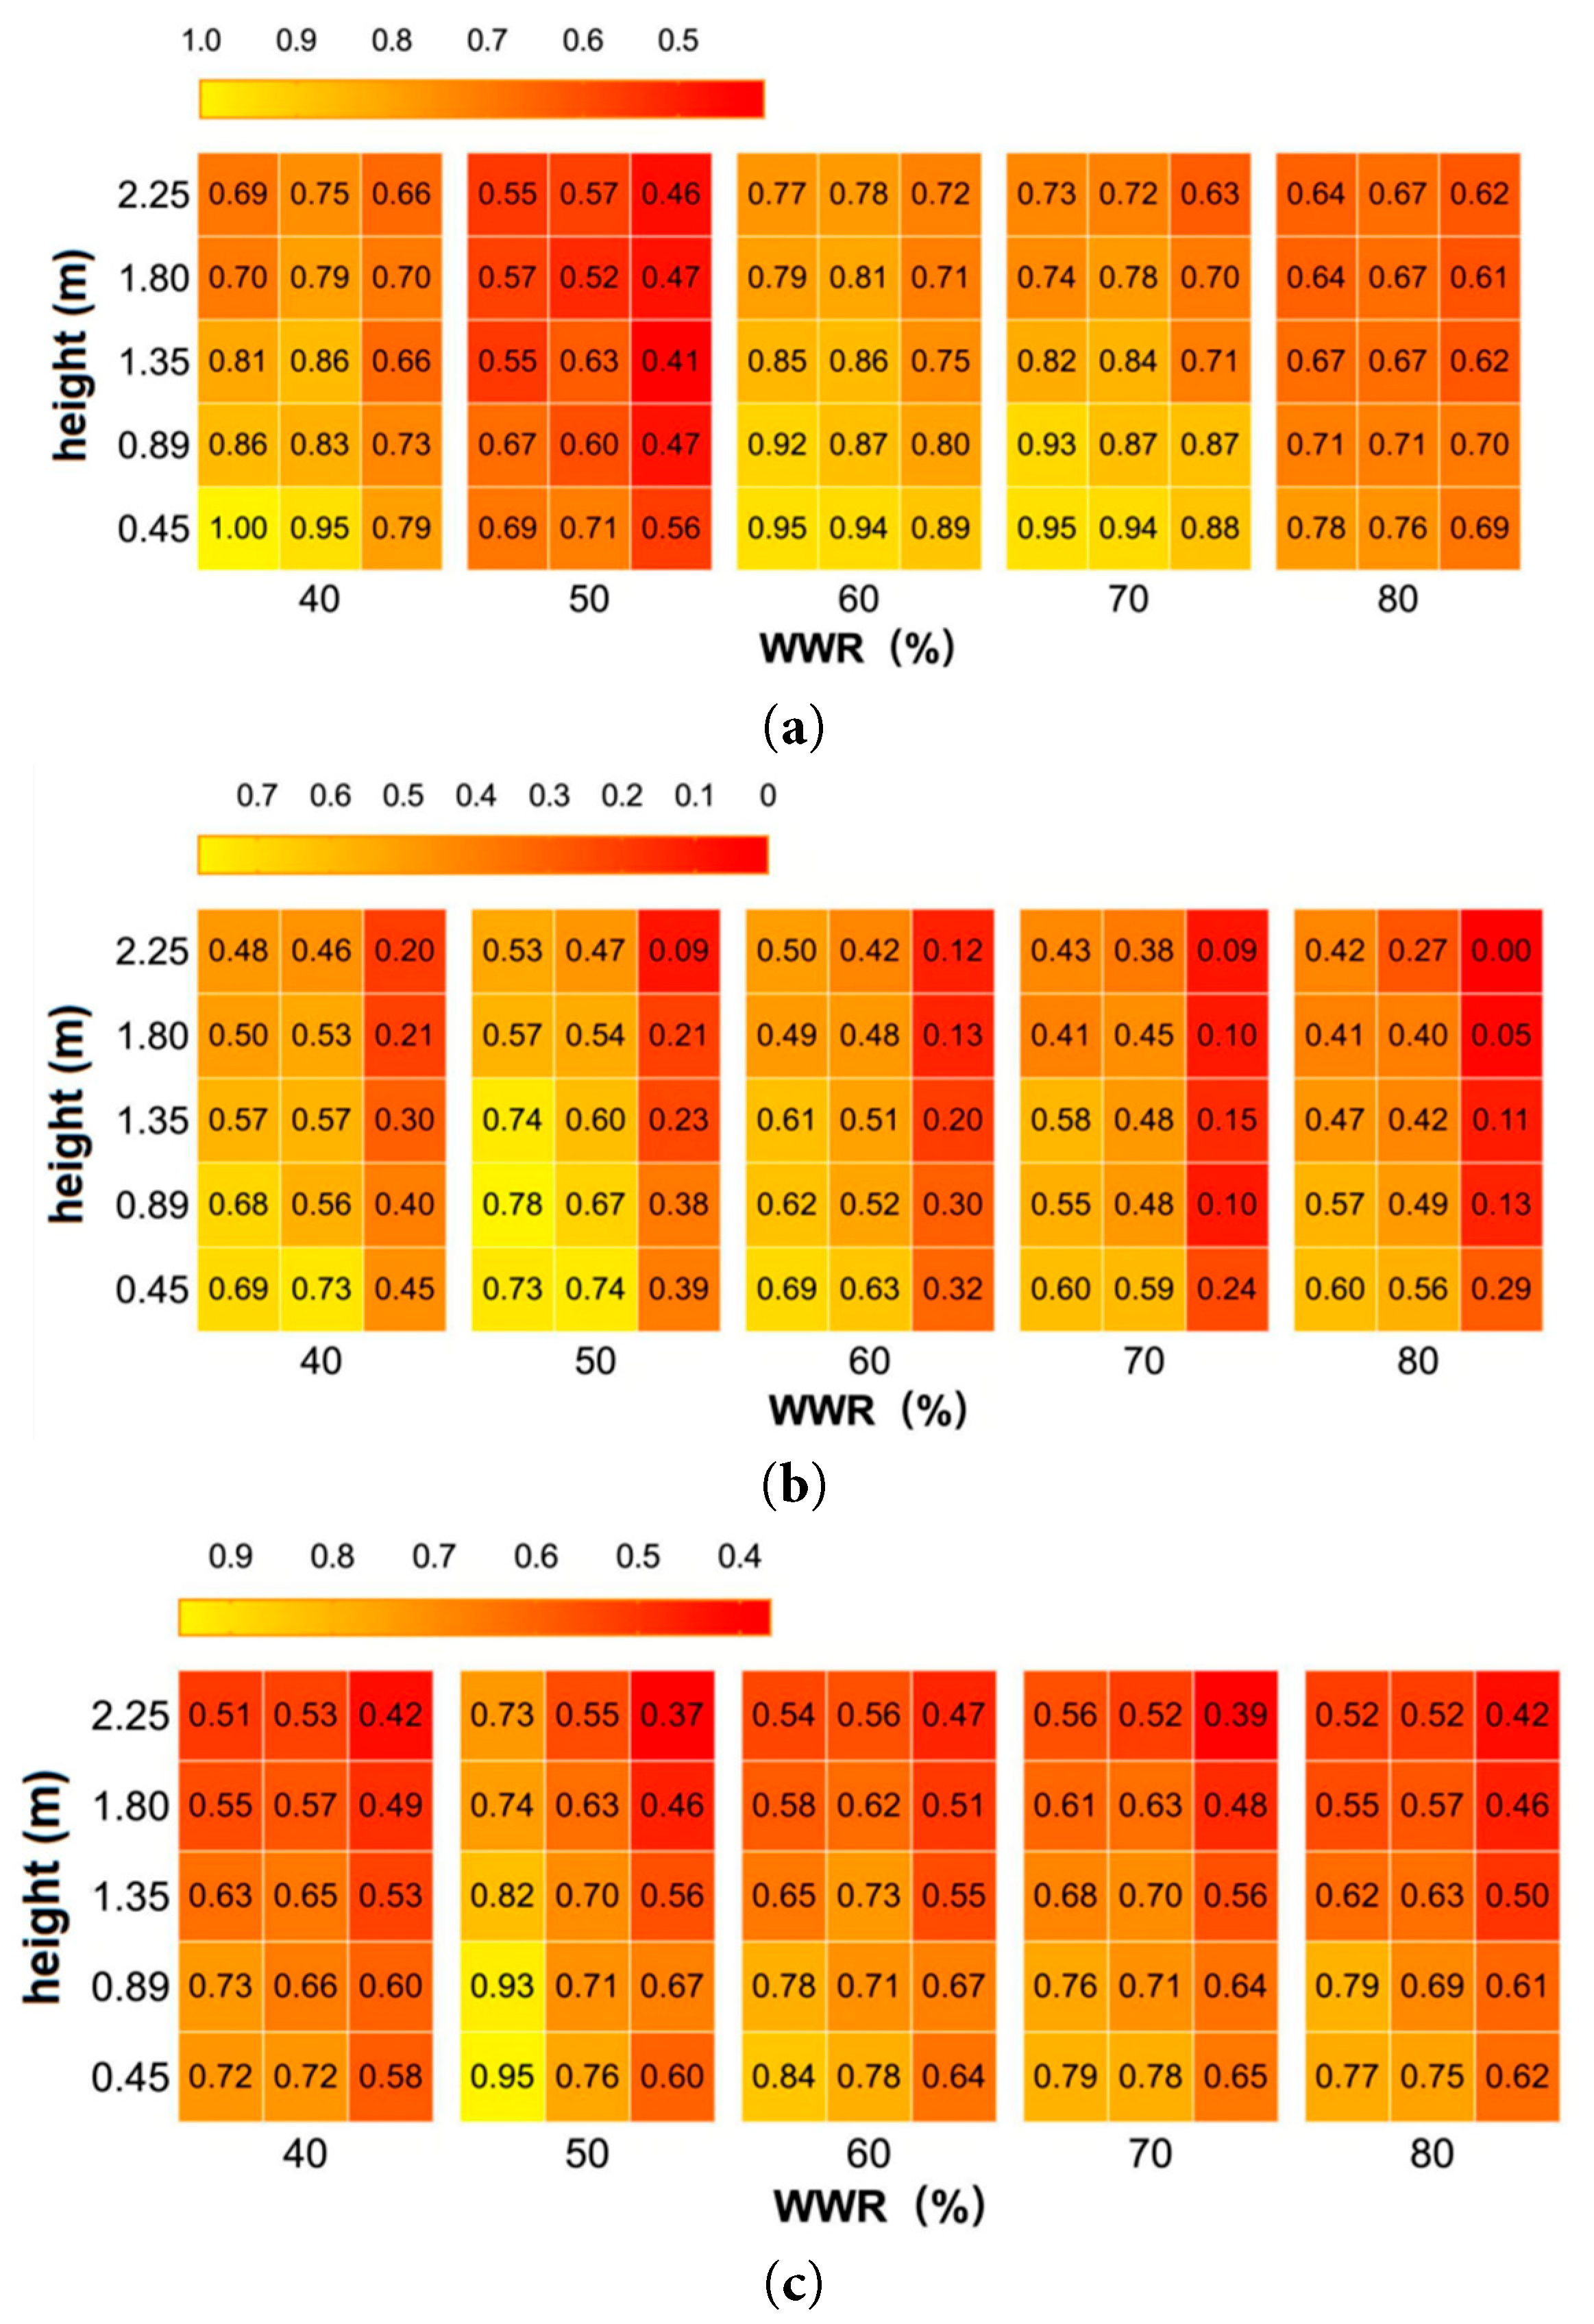
Figure 9: Indoor vertical temperature of the (FR+FC) under different WWRs: (a) 8:00; (b) 14:00; (c) 20:00.
Furthermore, in combination with Fig. 7, the figure shows that under both cooling systems, when the main chilled water temperature is maintained at a certain level and the outdoor temperature is high, the solar radiation incident on the west-facing window, the glass surface temperature, and the indoor heat gain all increase. However, due to transient cooling capacity limitation during peak solar radiation don’t to eliminate completely the sudden increase in indoor cooling load and thus cannot maintain the indoor temperature within the comfortable range. Particularly under (FC), the convective method for handling radiant loads is inefficient, with limited ability to eliminate the sudden increase in indoor cooling load. The systems were sized to meet the steady-state cooling load of the test room (8.25 m × 7.89 m × 3.2 m) under summer conditions in Mianyang. The FR+FC system’s total cooling capacity (12.6 kW heating/11.2 kW cooling for the ASHP + 8.4 kW heating/5.6 kW cooling for FC terminals) and FC system’s capacity (5.6 kW cooling) both exceed the steady-state load. However, when west-facing solar radiation peaks (14:00–16:00, Fig. 8), the transient cooling load can increase by 30%–50% (e.g., from 120 W/m2 to 180 W/m2 at 80% WWR) due to direct solar radiation absorption by walls, floors, and furniture. This sudden load spike exceeds the systems’ instantaneous response capacity, leading to temporary temperature fluctuations—but not persistent overheating. Therefore, at a high WWR, an indoor high-temperature phenomenon of 30.5°C occurs.
The above data indicate that when using (FC), the indoor temperature fluctuates considerably, and the thermal environment stability is poor, with the magnitude of temperature fluctuations increasing with the increase in WWR. However, when using (FR+FC), the indoor temperature fluctuations are small. Therefore, for buildings with relatively high requirements for thermal environment stability or requiring long-term cooling, using (FR+FC) is recommended to ensure the thermal comfort and stability of the indoor environment.
Fig. 10 shows the indoor and outdoor air relative humidity for different WWRs and various cooling systems. As shown in Fig. 10a,b, the fluctuation ranges of indoor and outdoor air relative humidity are 45% to 65% and 40% to 95%, respectively. Relative humidity refers to the percentage of the vapor pressure of water in the air to the vapor pressure of saturated air at the same temperature. Data also indicate that the outdoor air relative humidity reaches its minimum value between 14:00 and 20:00 daily, which is due to the increase in air temperature leading to a high capacity for water vapor in the air, resulting in a decrease in relative humidity. Conversely, when the air temperature decreases, the outdoor air relative humidity increases. Under (FR+FC), the indoor humidity source is stable, and the moisture content is constant, causing the relative humidity to fluctuate with the indoor temperature. However, (FC) can continuously and stably dehumidify, resulting in a relatively stable change in indoor air relative humidity.
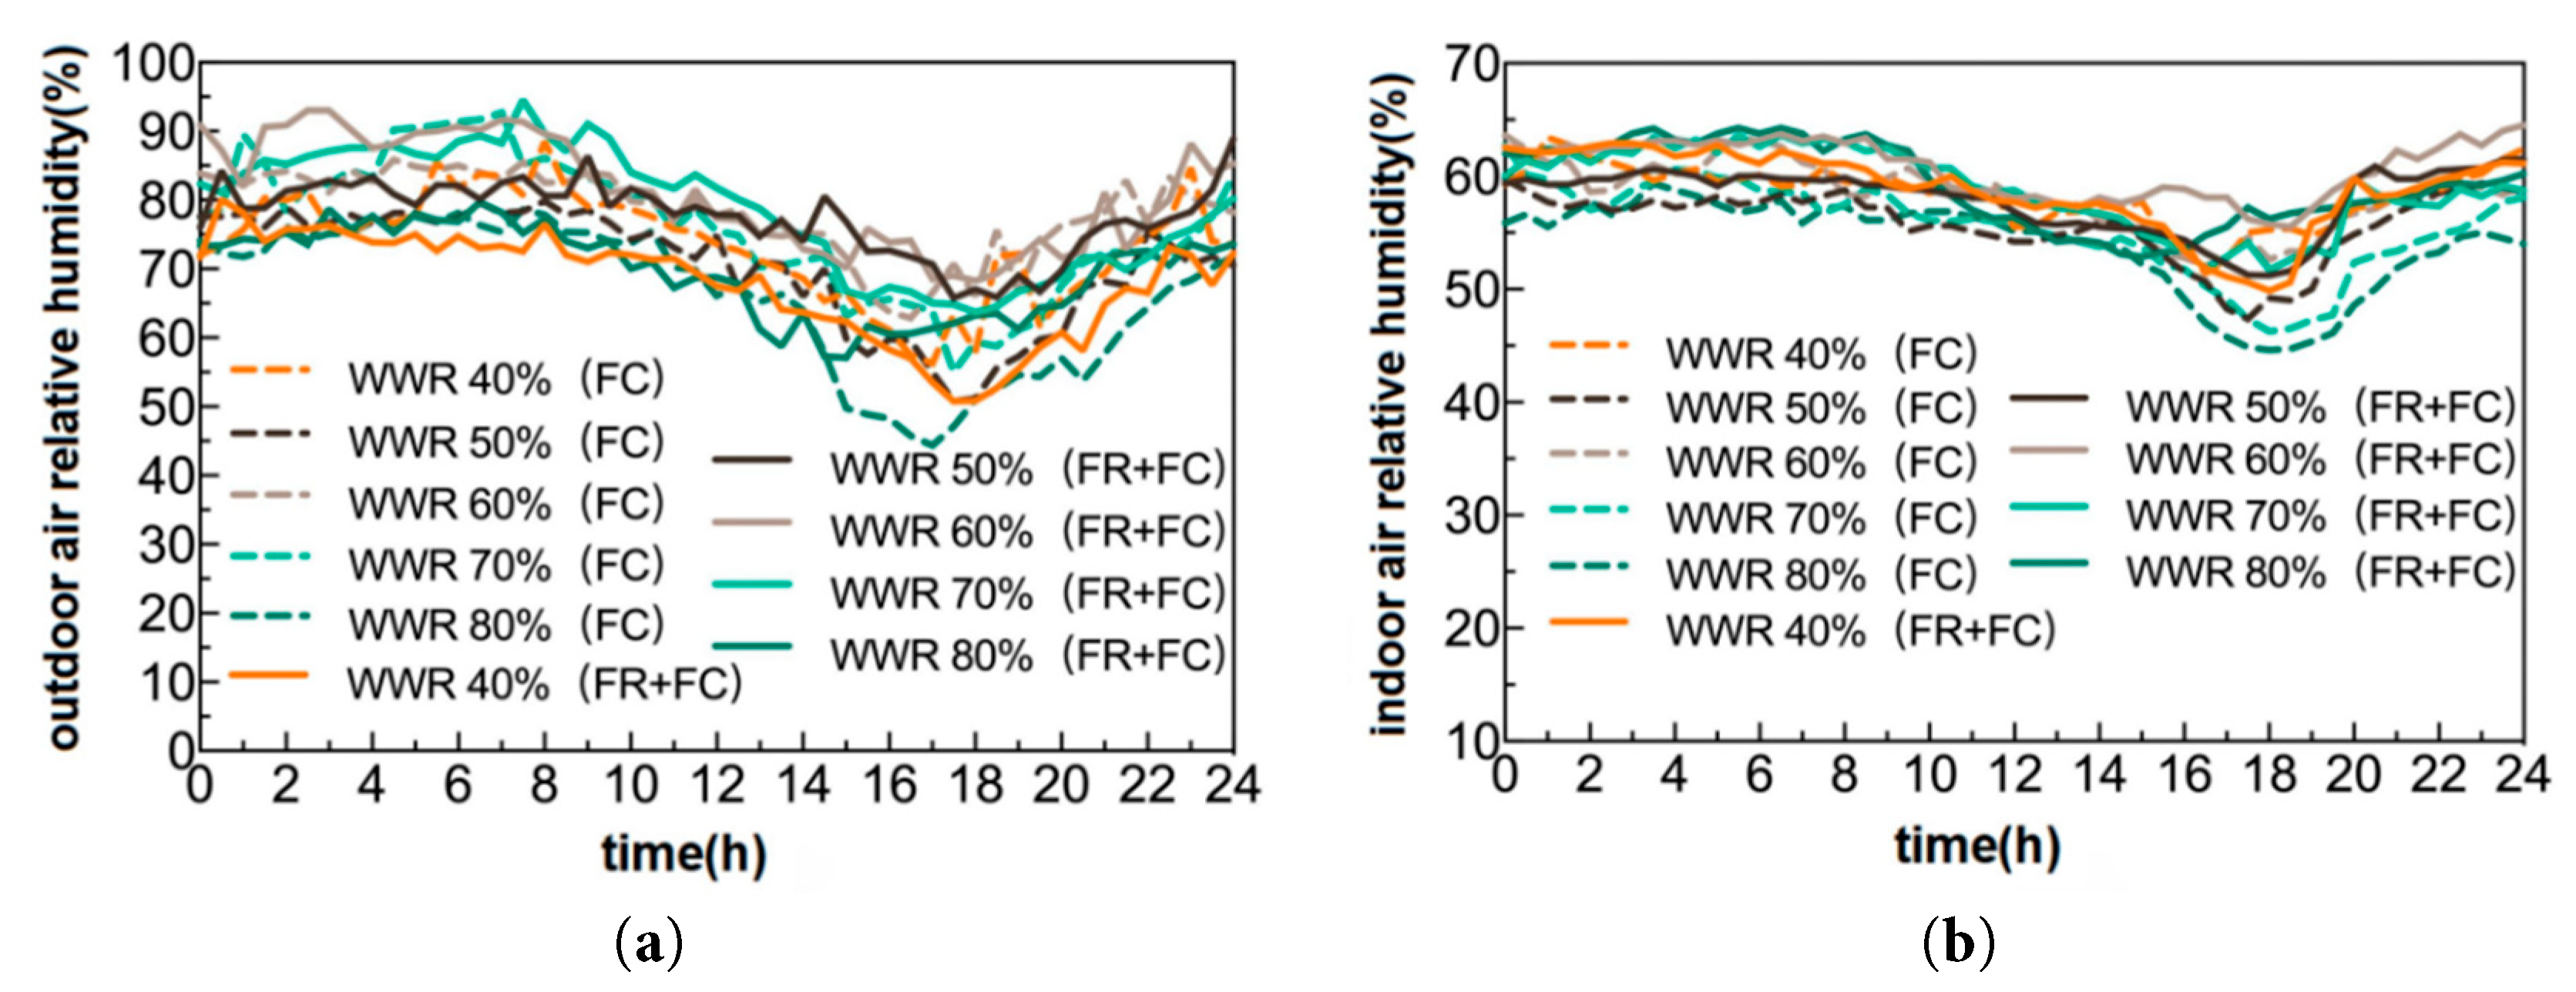
Figure 10: Indoor and outdoor air relative humidity of each cooling system under different WWRs: (a) outdoor air relative humidity; (b) indoor air relative humidity.
The difference in humidity control between FR FC and FC stems from their unique heat transfer mechanism and “temperature only” control, not a matter of capacity design. Therefore, when the temperature of FC FR is reached, its humidity will fluctuate within a certain range and is not obviously controlled. In addition, the humidity problem caused by “temperature-first” control has been widely recognized in the research field and is not a phenomenon unique to this experiment. Zarrella et al. [25] noted that “radiant-convective combined systems often exhibit RH fluctuations under temperature-priority control, as radiant terminals do not directly dehumidify air—this can be resolved by adding humidity feedback to the control loop”. Jiang et al. [23] further confirmed that “when FR+FC systems adopt ‘temperature-humidity dual-control’ (adding RH sensors to adjust FC dehumidification independently), RH fluctuations are reduced to 47%–53%, comparable to FC, while retaining FR+FC’s advantages in temperature and energy efficiency”.
Fig. 9a–c is nondimensional vertical temperature distribution heat maps at 8:00, 14:00, and 20:00, respectively, under (FR+FC). As shown in the figures, when (FR+FC) is used, the maximum temperature difference between the highest (2.25 m) and lowest (0.45 m) measurement points in the room is 1.60°C (nondimensional difference of 0.30), which is less than 2.0°C and within the limits of all categories in ISO 7730. Additionally, under (FR+FC), floor cooling is utilized, resulting in low temperatures at the ankle level and an increase in vertical temperature difference indoors. The reason is with floor cooling, heat is transferred from the ceiling to the floor through radiation rather than being convectively transferred to the air at the floor level [36].
The dimensionless vertical temperature distribution heat maps of the (FC) at 8:00, 14:00, and 20:00 are depicted in Fig. 11a–c, respectively. The figures reveal that the (FC) exhibits a considerable vertical temperature difference between the upper and lower parts of the room, with a maximum temperature difference of 3.30°C (0.43 dimensionless value). However, the vertical air temperature difference between head and ankle is within ISO7730 limits for all classes, measuring only 1.70°C (0.22 dimensionless value), which is less than 2.0°C as required by standards. This stratification phenomenon in the room occurs due to buoyancy-driven upward movement of hot air with low density while cold air sinks downward under gravity.
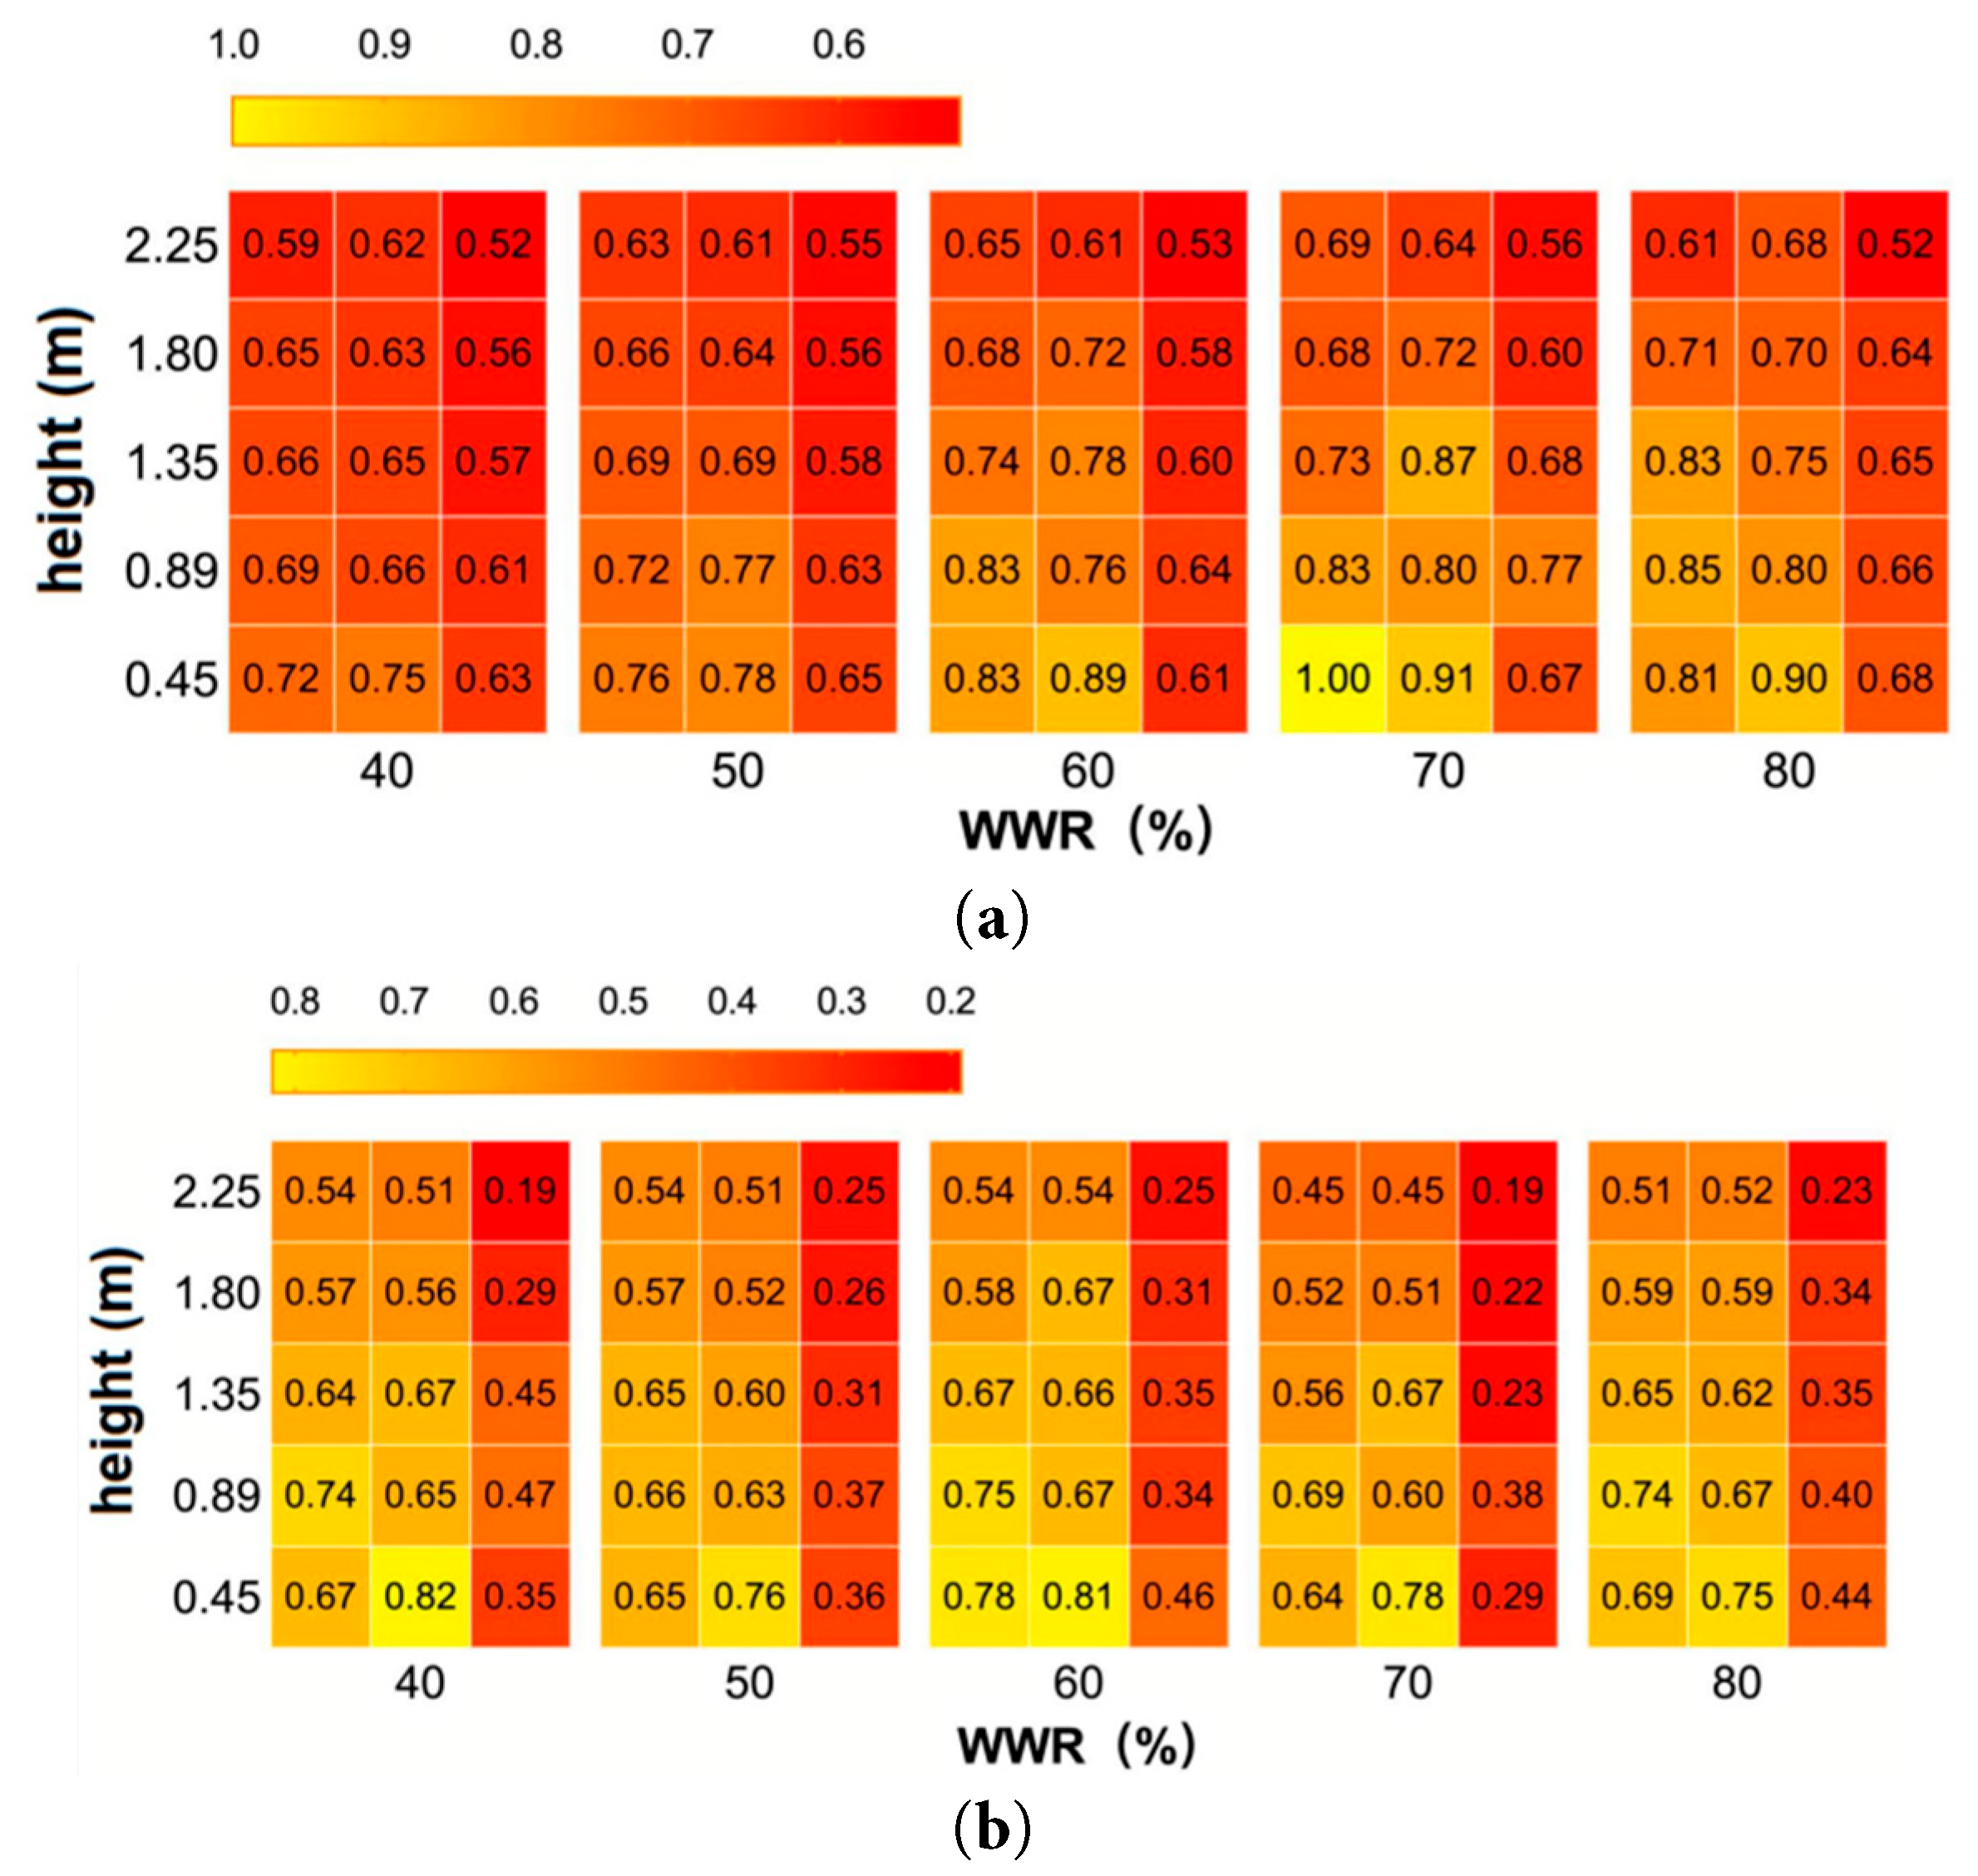
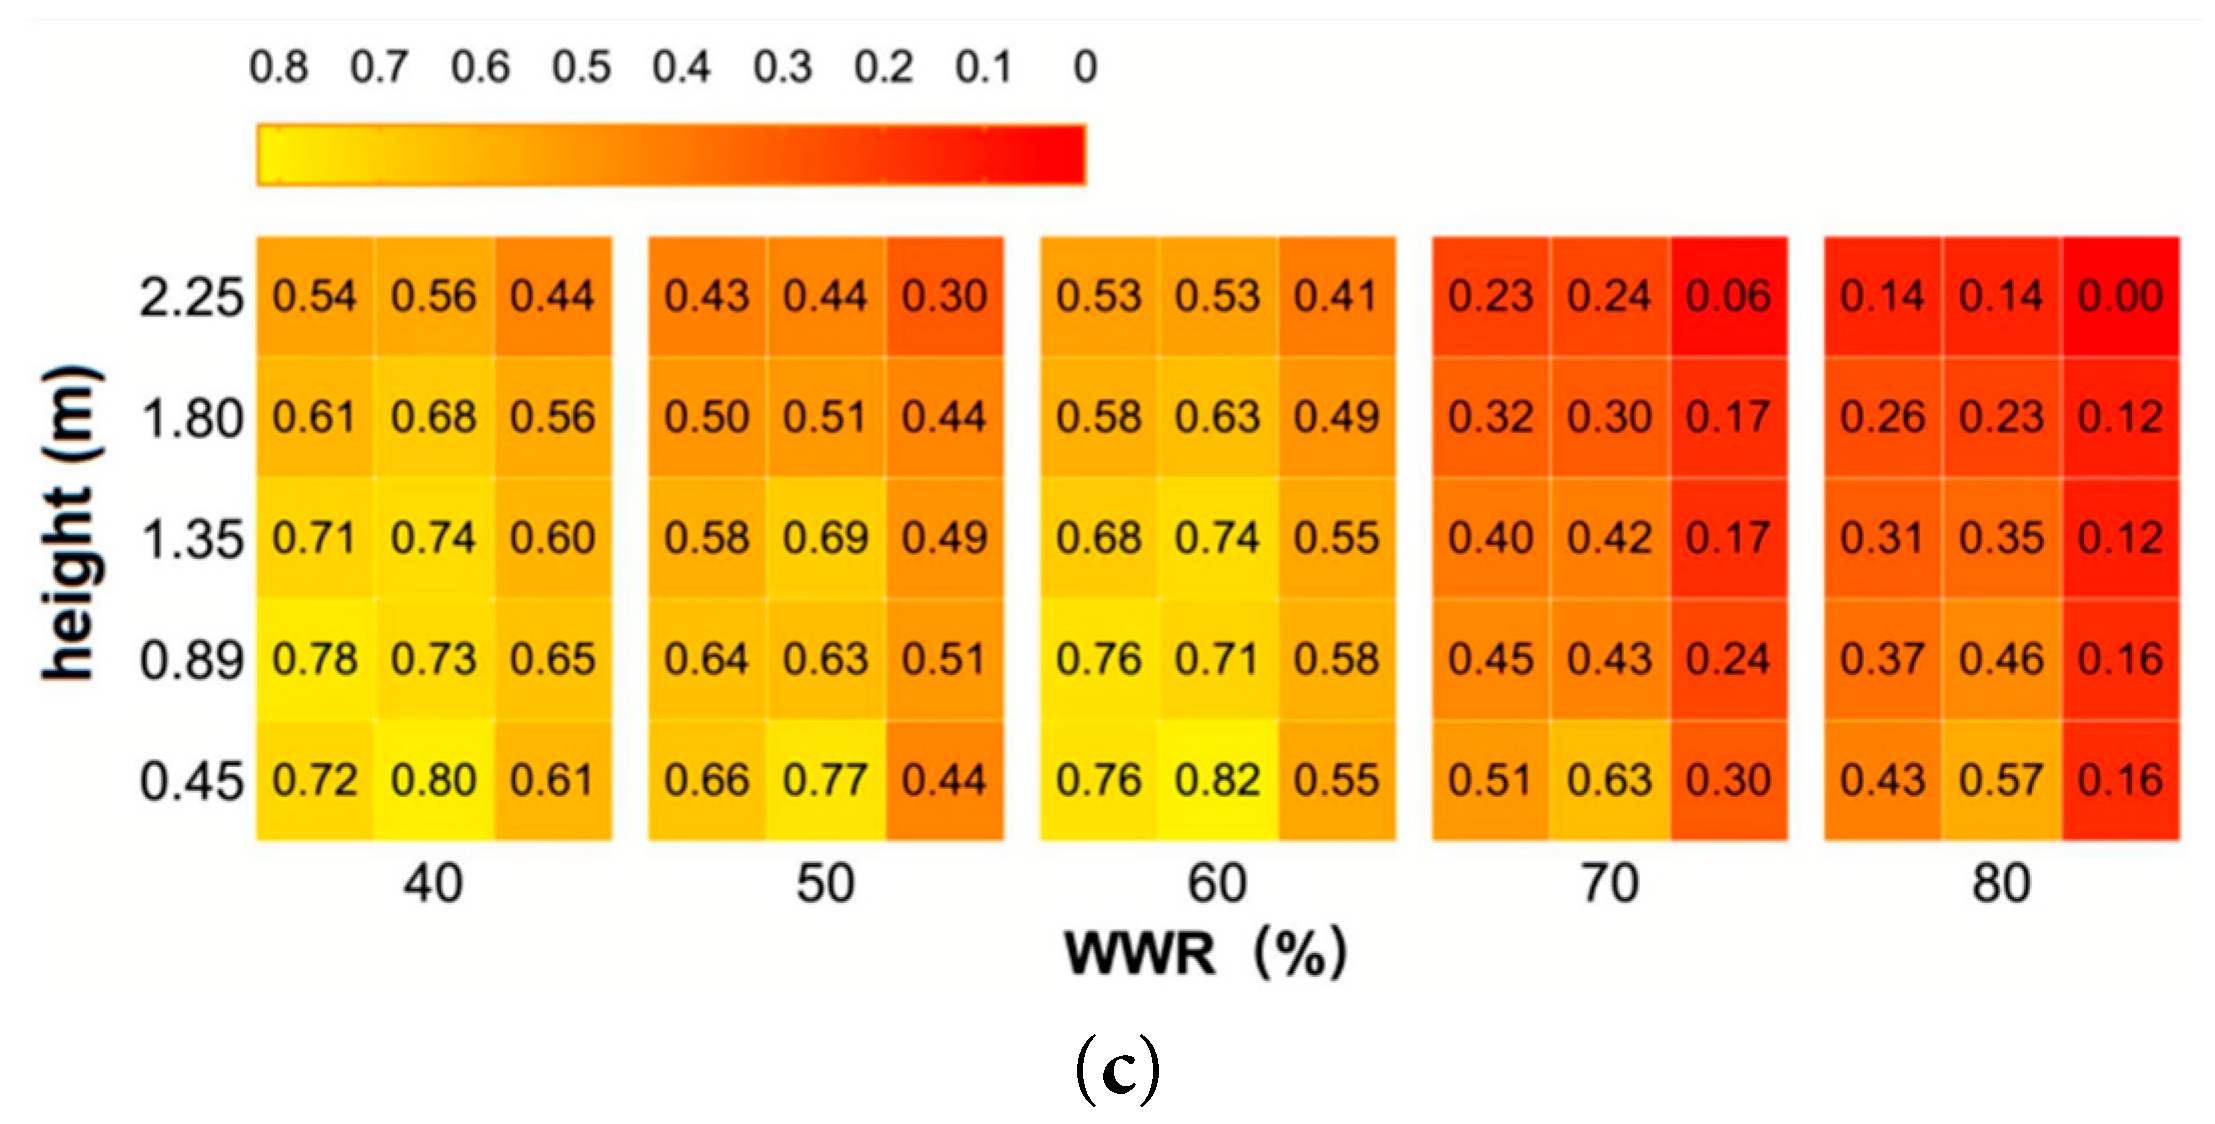
Figure 11: Indoor vertical temperature of the (FC) under different WWRs: (a) 8:00; (b) 14:00; (c) 20:00.
The above data indicate that under different cooling supply systems, the indoor vertical temperatures at the location B0, with a distance of 0.60 m from the window opening, are higher than those at other distances from the window opening. Furthermore, these temperatures increase with the increasing WWR. All indoor temperature fields exhibit a “hot upper and cold lower” thermal stratification phenomenon, with smaller distances from the window opening corresponding to higher vertical temperatures. In comparison with (FC), the temperature difference between the head and the ankle under (FR+FC) is smaller, leading to increased indoor comfort.
Fig. 12 shows the variation of the indoor surface temperatures of different envelope structures over time under various WWRs (FR+FC). Under (FR+FC), the ground temperatures for all conditions are lower than those of the other envelope structures. Between 12:00 and 20:00, with the increase in WWR, the temperature of the aluminum foil insulation cotton rises and exceeds the temperatures of the other surfaces but remains lower than the outdoor temperature and the temperature of the west window. As the outdoor temperature increases during the day, the solar radiation through the glass onto the floor also increases with the increase in WWR, causing the floor surface temperature to rise, leading to an increase in indoor temperature. Therefore, (FR+FC) must generate more cooling capacity to eliminate the sudden increase in cooling load, which also results in a decrease in the floor surface temperature by 1–2°C, to maintain the indoor temperature at the set value.
Fig. 13 illustrates the variation of the indoor surface temperatures of different envelope structures over time under various WWRs in the (FC) system. Under the (FC) system, the fluctuation amplitudes of the internal surface temperatures of the east, south, and north walls increase with the increase in WWR, especially at 18:00 when the solar radiation on the west window is at its maximum. With the increase in WWR, the temperature fluctuations of the upper wall and the west wall intensify and become higher than the surface temperatures of the other walls. Therefore, under a small WWR, areas near the west window and the middle of the room are more affected when the sun shines through the west window. Once the area of the west window increases, the affected area within the room expands in the north–south direction. As the area of the west window increases, the higher the outdoor air temperature, the stronger the negative impact on the indoor thermal environment, and the greater the influence on the indoor surface temperatures of the various envelope structures.
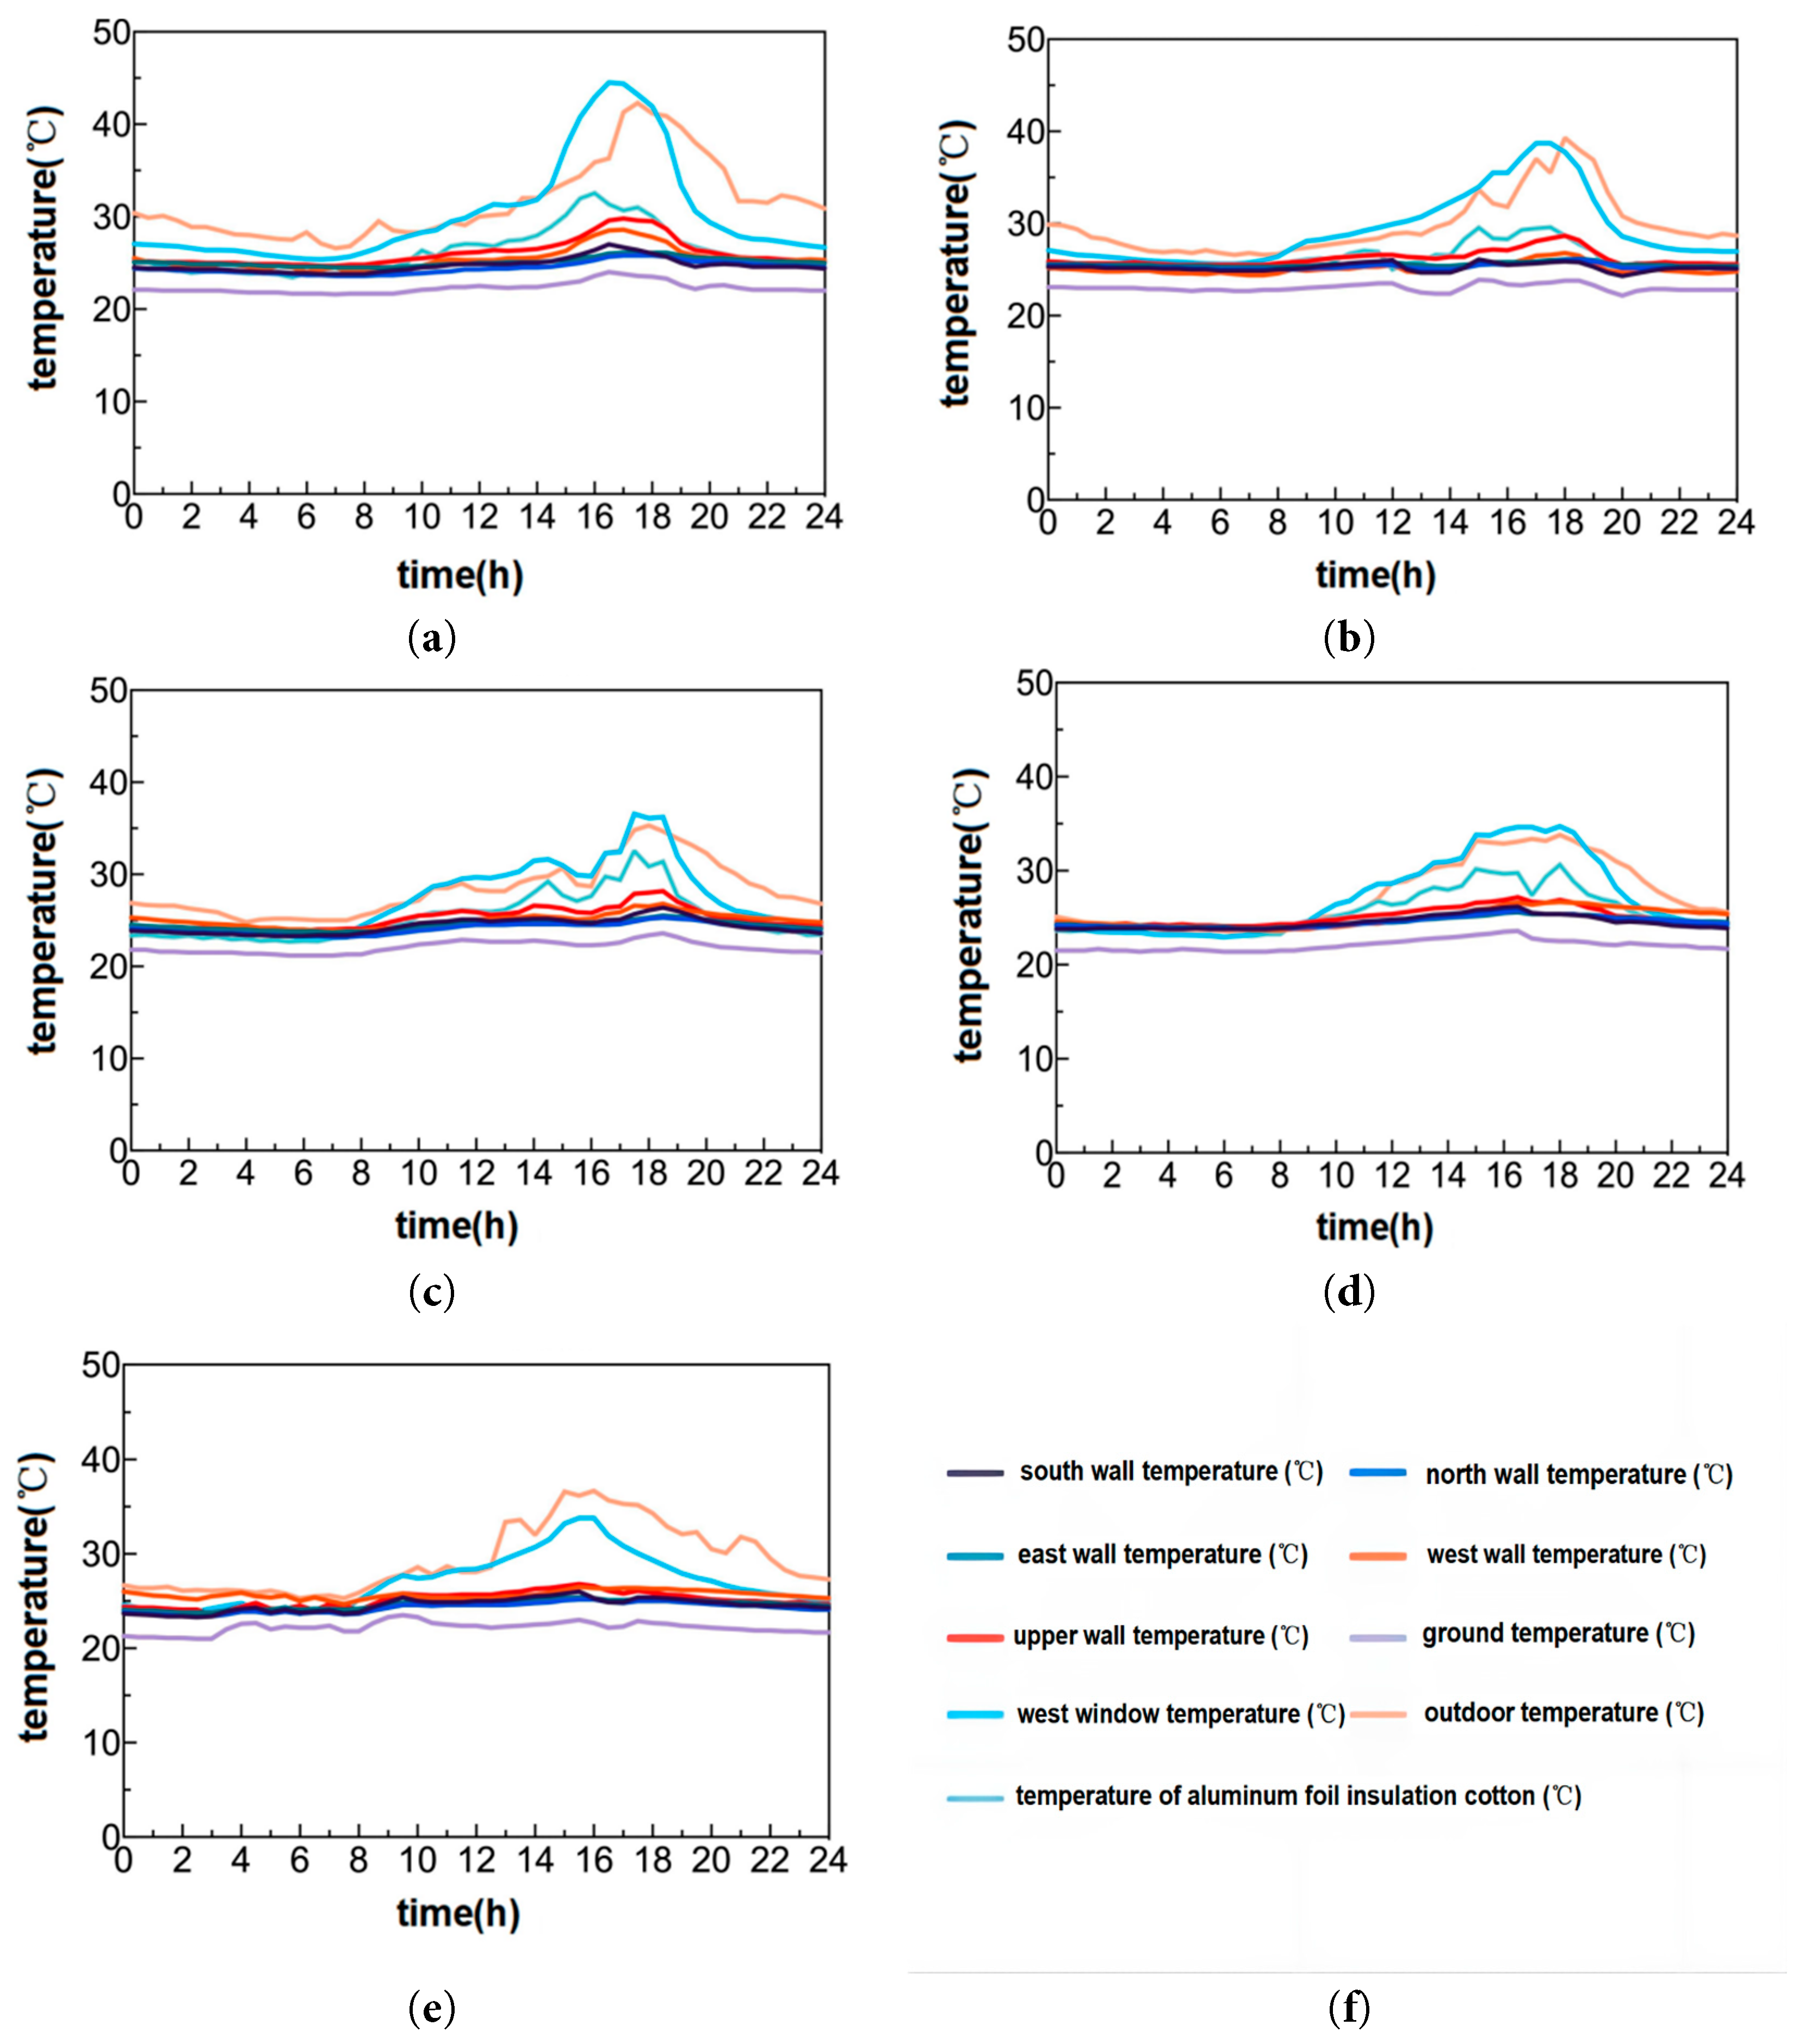
Figure 12: Inner surface temperature of each envelope in (FR+FC) under different WWRs: (a) WWR40%; (b) WWR50%; (c) WWR60%; (d) WWR70%; (e) WWR80%; (f) Color curve distinction.
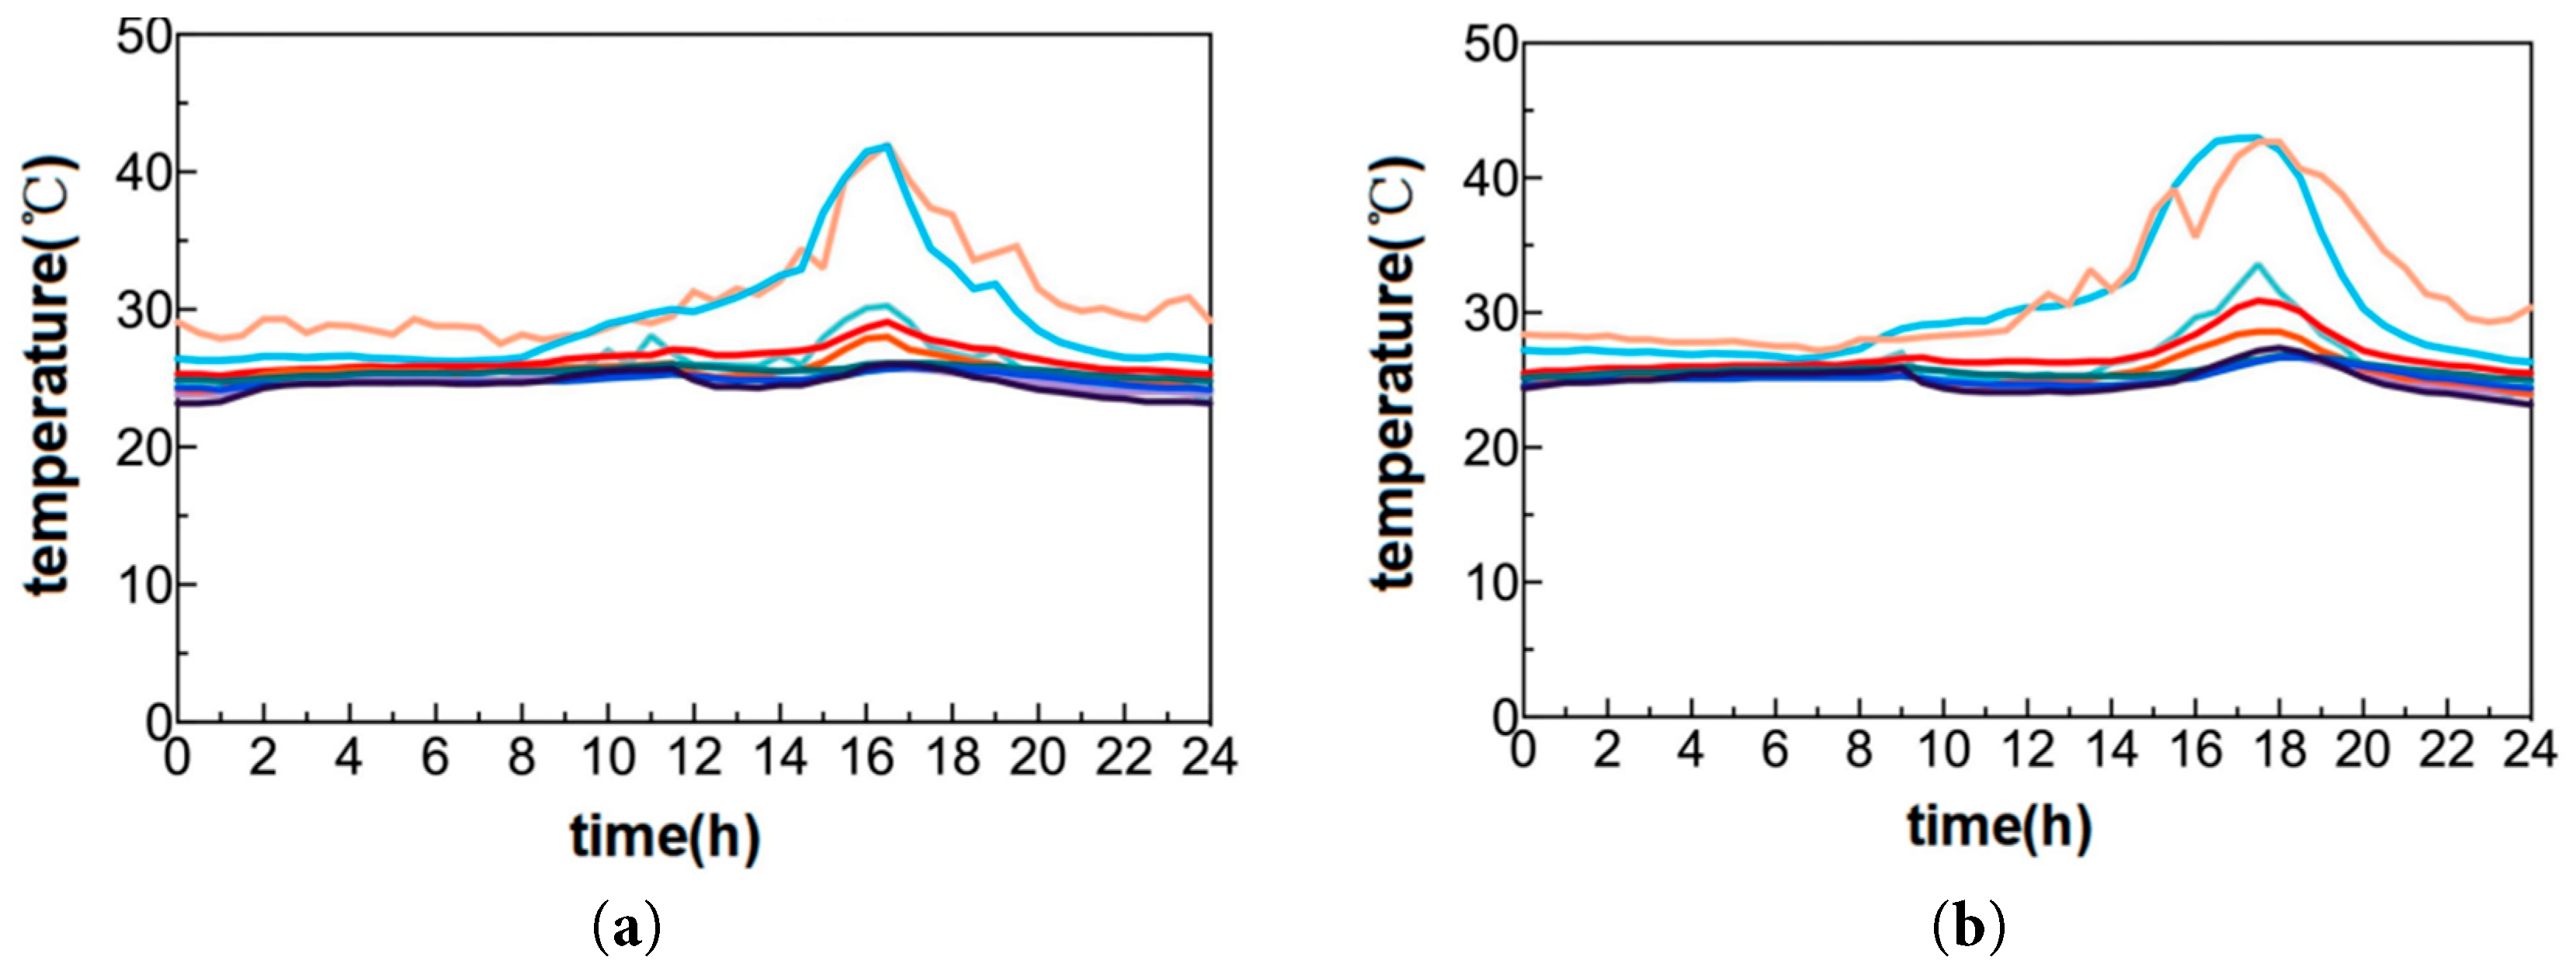
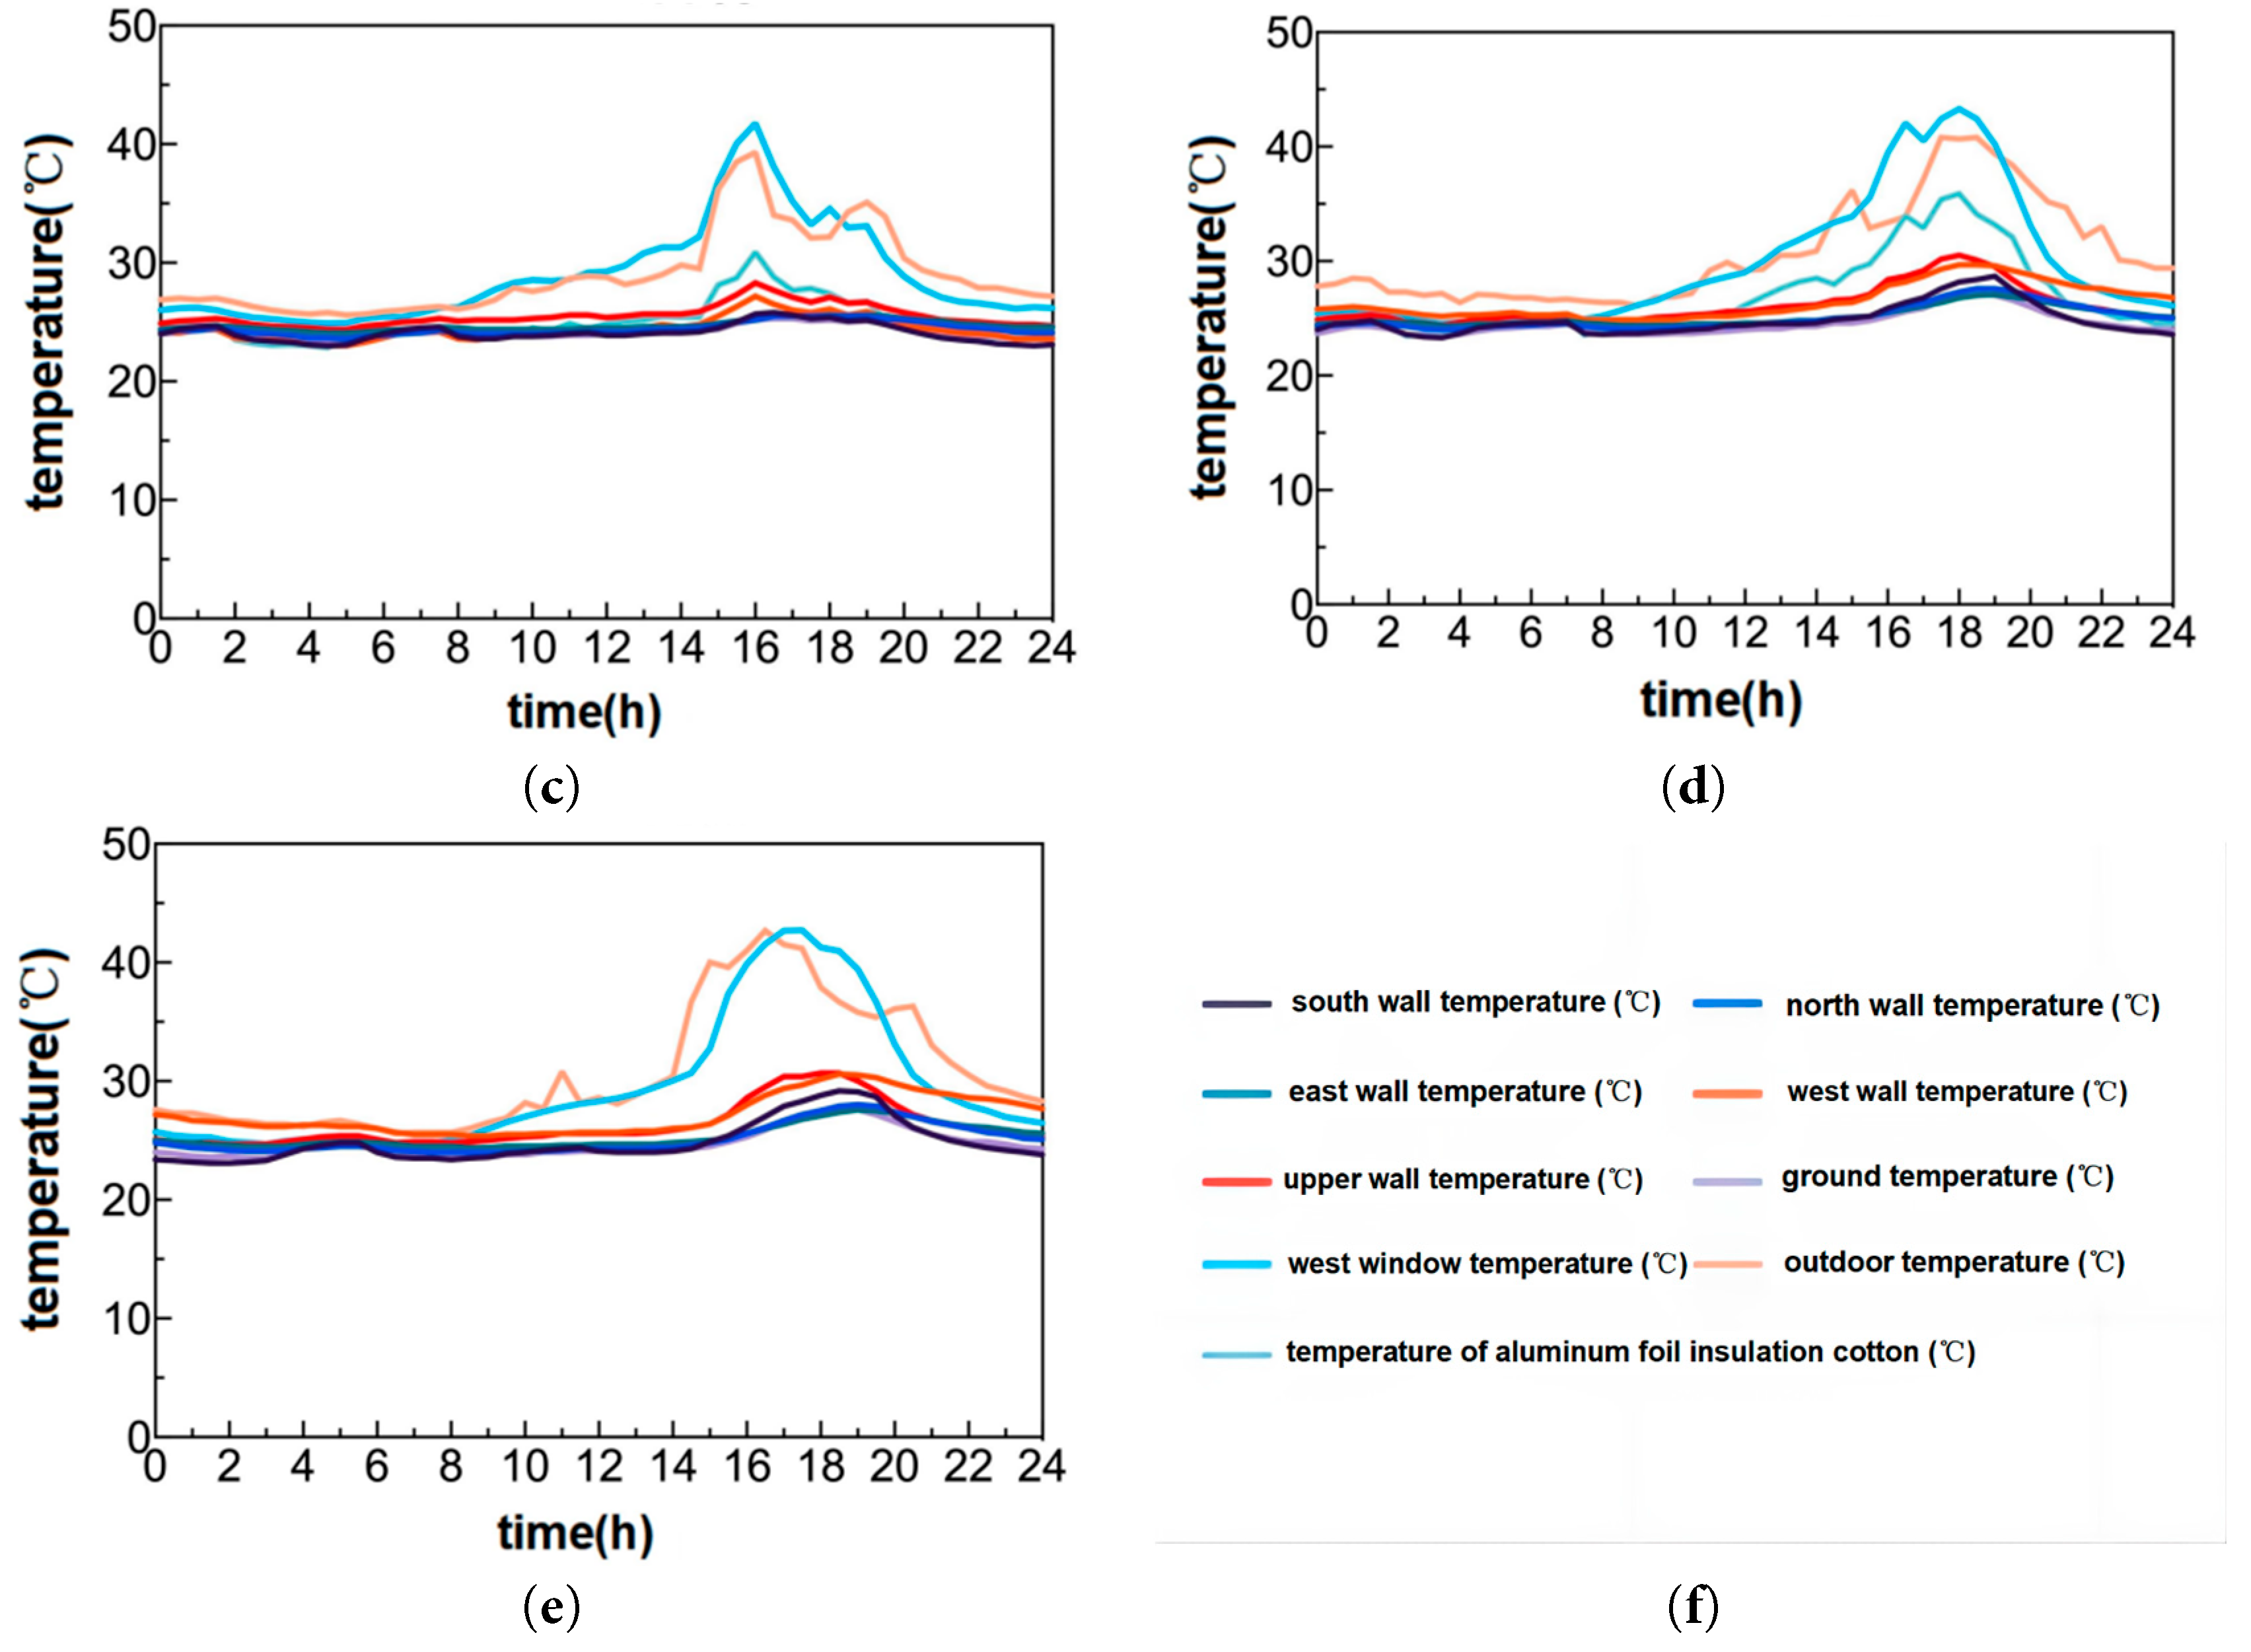
Figure 13: Inner surface temperature of each envelope in (FC) under different WWRs: (a) WWR40%; (b) WWR50%; (c) WWR60%; (d) WWR70%; (e) WWR80%; (f) Color curve distinction.
Before diving into local comfort variations, it is first confirmed that both cooling systems achieve overall baseline thermal comfort for all window-to-wall ratio (WWR) conditions—this provides a valid foundation for analyzing spatial differences in comfort. As shown in Fig. 14 (Overall indoor PMV value of each cooling system under different WWRs), the overall PMV values of the convective–radiant combined cooling system (FR+FC) range from 0.20 to 0.76, while those of the fan coil convection system (FC) range from 0.25 to 0.90. All these values fall within the Level-II thermal comfort requirement specified by ISO 7730 and GB 50736-2012 (PMV: −1.0 to +1.0), indicating that the indoor environment as a whole meets the minimum acceptable comfort standard for office buildings. The following analysis of local PMV values (at different distances from the window) does not aim to judge “whether a single location meets comfort”, but rather to compare spatial comfort gradients across WWRs and systems—quantifying how FR+FC and FC differ in mitigating localized discomfort caused by west-facing solar radiation.
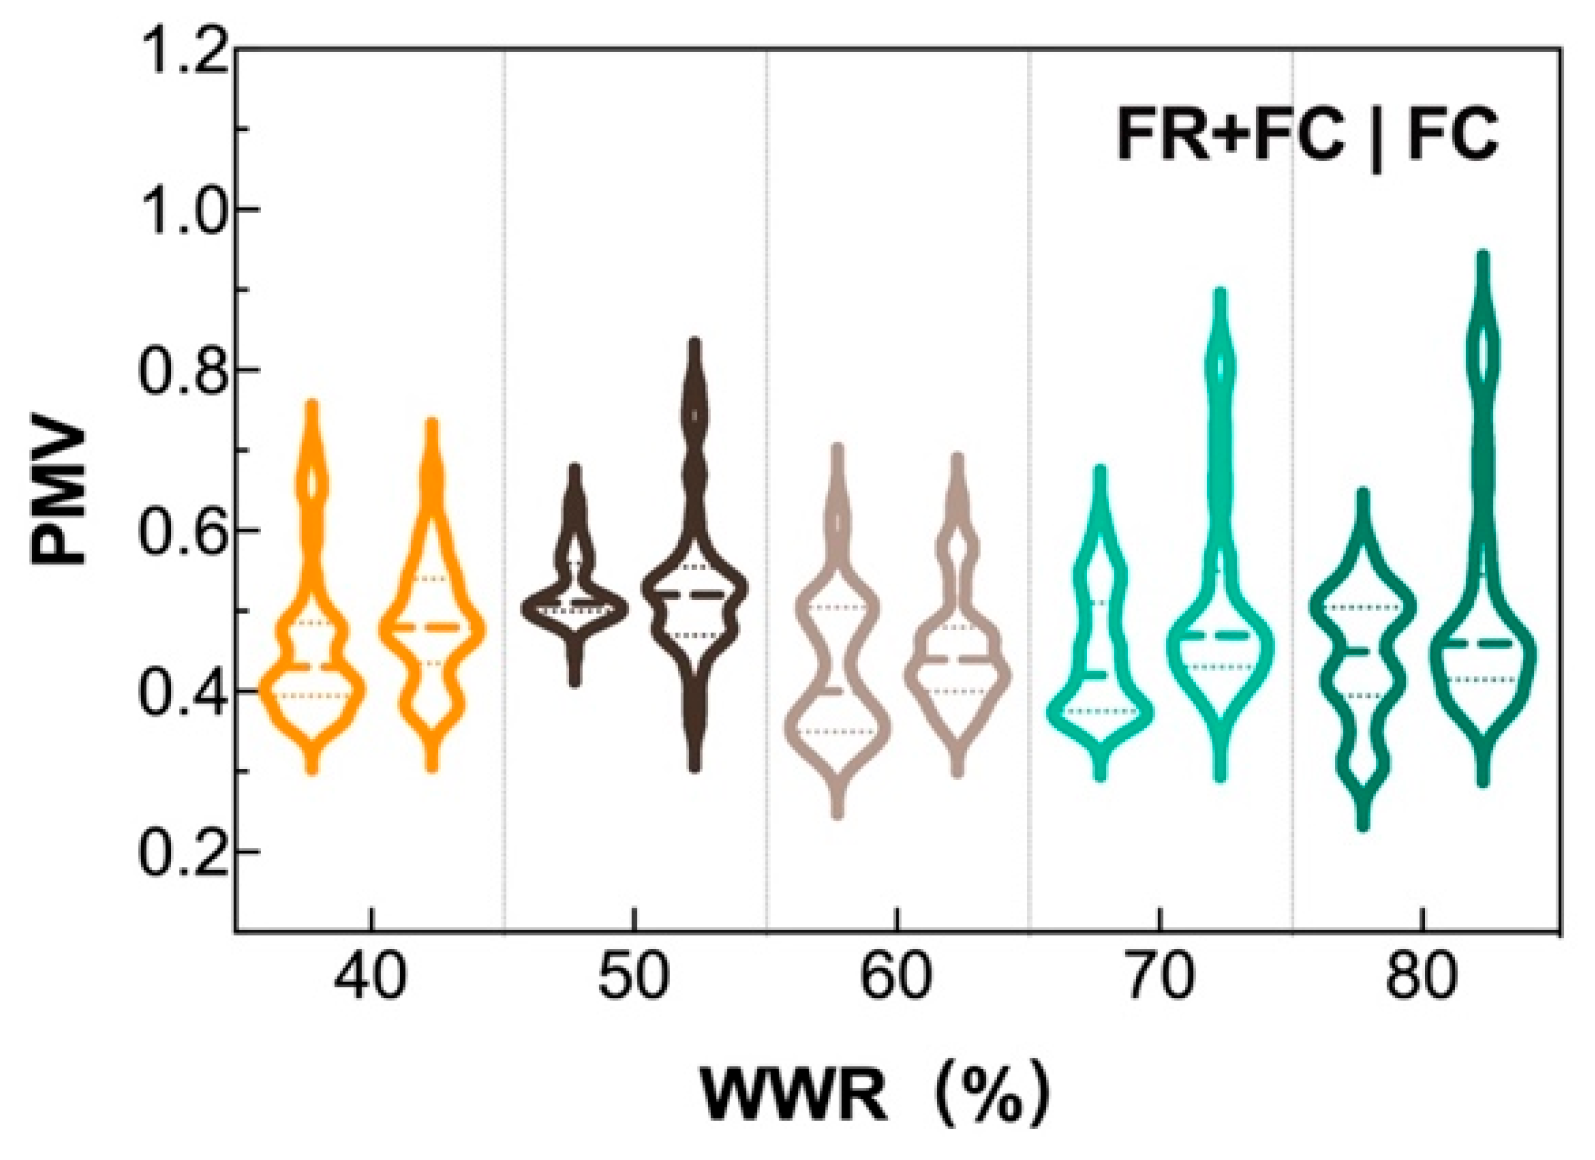
Figure 14: Overall indoor PMV value of each cooling system under different WWRs.
Fig. 14 depicts the overall PMV values of different cooling systems under various WWRs. As shown in the figure, under both cooling systems, the indoor thermal comfort is in a state between “neutral” and “slightly warm”. In the (FC) system, the overall PMV values fluctuate between 0.25 and 0.90. Except for the 60% WWR, the fluctuation amplitude of the overall PMV values increases with the increase in WWR, leading to increased discomfort. The reason is that the maximum outdoor temperature for the 60% WWR is lower than the other conditions, resulting in smaller PMV value fluctuations. The maximum PMV value for the 80% WWR is 0.20 units higher than that for the 40% WWR. In the (FR+FC) system, the overall PMV values fluctuate between 0.20 and 0.76. Except for the 40% and 50% WWRs, the median overall PMV values increase with the increase in WWR, leaning toward a “slightly warm” state. The PMV median for the 80% WWR increases by 0.09 units compared with the 60% WWR. Since the summer experiments started with a large WWR, the experiments with small WWRs were conducted during the hot summer period. For the 40% and 50% WWRs, the average daily solar radiation on the west window is greater than the other conditions, and the highest outdoor temperature during the day is higher than the other conditions. As the outdoor temperature increases, the glass surface temperature increases with the increase in solar radiation on the west window. The increase in glass area leads to increased heat loss between the indoor and outdoor environments through the transparent envelope structure, causing the overall indoor comfort to lean toward a“slightly warm”state.
In the FR+FC system, the overall PMV median for 40% WWR is slightly lower than that for 50% WWR, despite both being within the Level-II comfort range. This discrepancy arises from three key mechanisms: first, the experiments with smaller WWRs (40% and 50%) were conducted during the “hot summer period”, when outdoor temperatures and solar radiation on the west-facing windows were higher than during tests for larger WWRs. Second the FR+FC system’s performance depends on synergies between convective (FC) and radiant (FR) terminals, which respond differently to radiant vs convective loads. Third the non-transparent envelope exhibits thermal storage characteristics that influence PMV. So the divergent PMV trends between 40% and 50% WWR in FR+FC systems arise from the interplay of solar radiation intensity, load distribution, and envelope thermal storage. These mechanisms explain why 40% WWR, despite smaller window area, exhibits a lower PMV median than 50% WWR under the experimental conditions.
In Fig. 14, the overall PMV of the FR+FC system at 60% WWR shows larger fluctuations compared to other WWRs, leaning toward “slightly warm” (median PMV ~0.76). This phenomenon is closely linked to the indoor temperature dynamics shown in Fig. 7, with the following mechanistic explanations: Temperature fluctuation amplification: Fig. 7b indicates that for the FR+FC system, the indoor temperature median at 60% WWR (23.5°C) is lower than that at 50% (24.8°C) and 80% (24.4°C), but the temperature fluctuation range (21.0–29.0°C) is wider. This is because the 60% WWR experimental period coincided with intermittent strong solar radiation (Fig. 8a shows the maximum solar radiation at 60% WWR is 420 W/m2, with more frequent peaks). The radiant floor (FR) takes ~10–15 min to respond to sudden radiation load increases (due to its thermal inertia), while the FC terminal alone cannot quickly offset the transient heat gain, leading to short-term temperature spikes. These spikes directly elevate the MRT calculated by Eq. (17), causing PMV to fluctuate more intensely; Uneven vertical temperature distribution: Fig. 9b (14:00, 60% WWR) shows a larger vertical temperature difference near the window (B0), with higher temperatures at 1.35 m. This stratification, combined with solar radiation absorbed by the human body, amplifies local thermal sensation, contributing to the overall PMV fluctuation observed in Fig. 14.
Based on the comprehensive analysis of the data, as the outdoor temperature rises and the solar radiation on the west window increases, the glass surface temperature, internal heat gain, and indoor temperature all increase. However, given the inefficient handling of radiant heat load and limited capacity to eliminate sudden increases in the cooling load through convection, the indoor comfort is poorer under the (FC) system with a large WWR. By contrast, the (FR+FC) system, even under a large WWR, can create a relatively comfortable indoor thermal environment and has a better capacity to handle radiant heat.
Fig. 15 shows the PMV values at different distances from the window reveal depth positions for various cooling systems under different WWRs. When considering the additional increment caused by solar radiation, the average radiation temperature is calculated through Eq. (16) to calculate the PMV value. Table 5 shows the PMV value ranges at different distances from the window reveal depth positions for various cooling systems under different WWRs. Fig. 15 reveals that the fluctuation of PMV values at different distances from the window reveal depth position is smaller under (FR+FC) than under (FC). Under different cooling systems, the PMV values and fluctuation at the distance of 0.60 m from the window reveal depth (Bn) are greater than those at distances of 4.27 m (An) and 6.89 m (Cn). Under different WWRs, the fluctuation amplitude of PMV values at Cn is smaller than that at An because the windows absorb and transmit a large amount of solar radiation, causing the glass surface temperature to rise. Therefore, locations closer to the window reveal depth not only have to bear the vertical asymmetrical radiation but also the horizontal asymmetrical radiation caused by the warm window, while locations farther from the window reveal depth, such as Cn, are less affected by the warm window. Given the increased radiation load handling capability of (FR+FC), the comfort level at different distances from the window reveal depth is better.
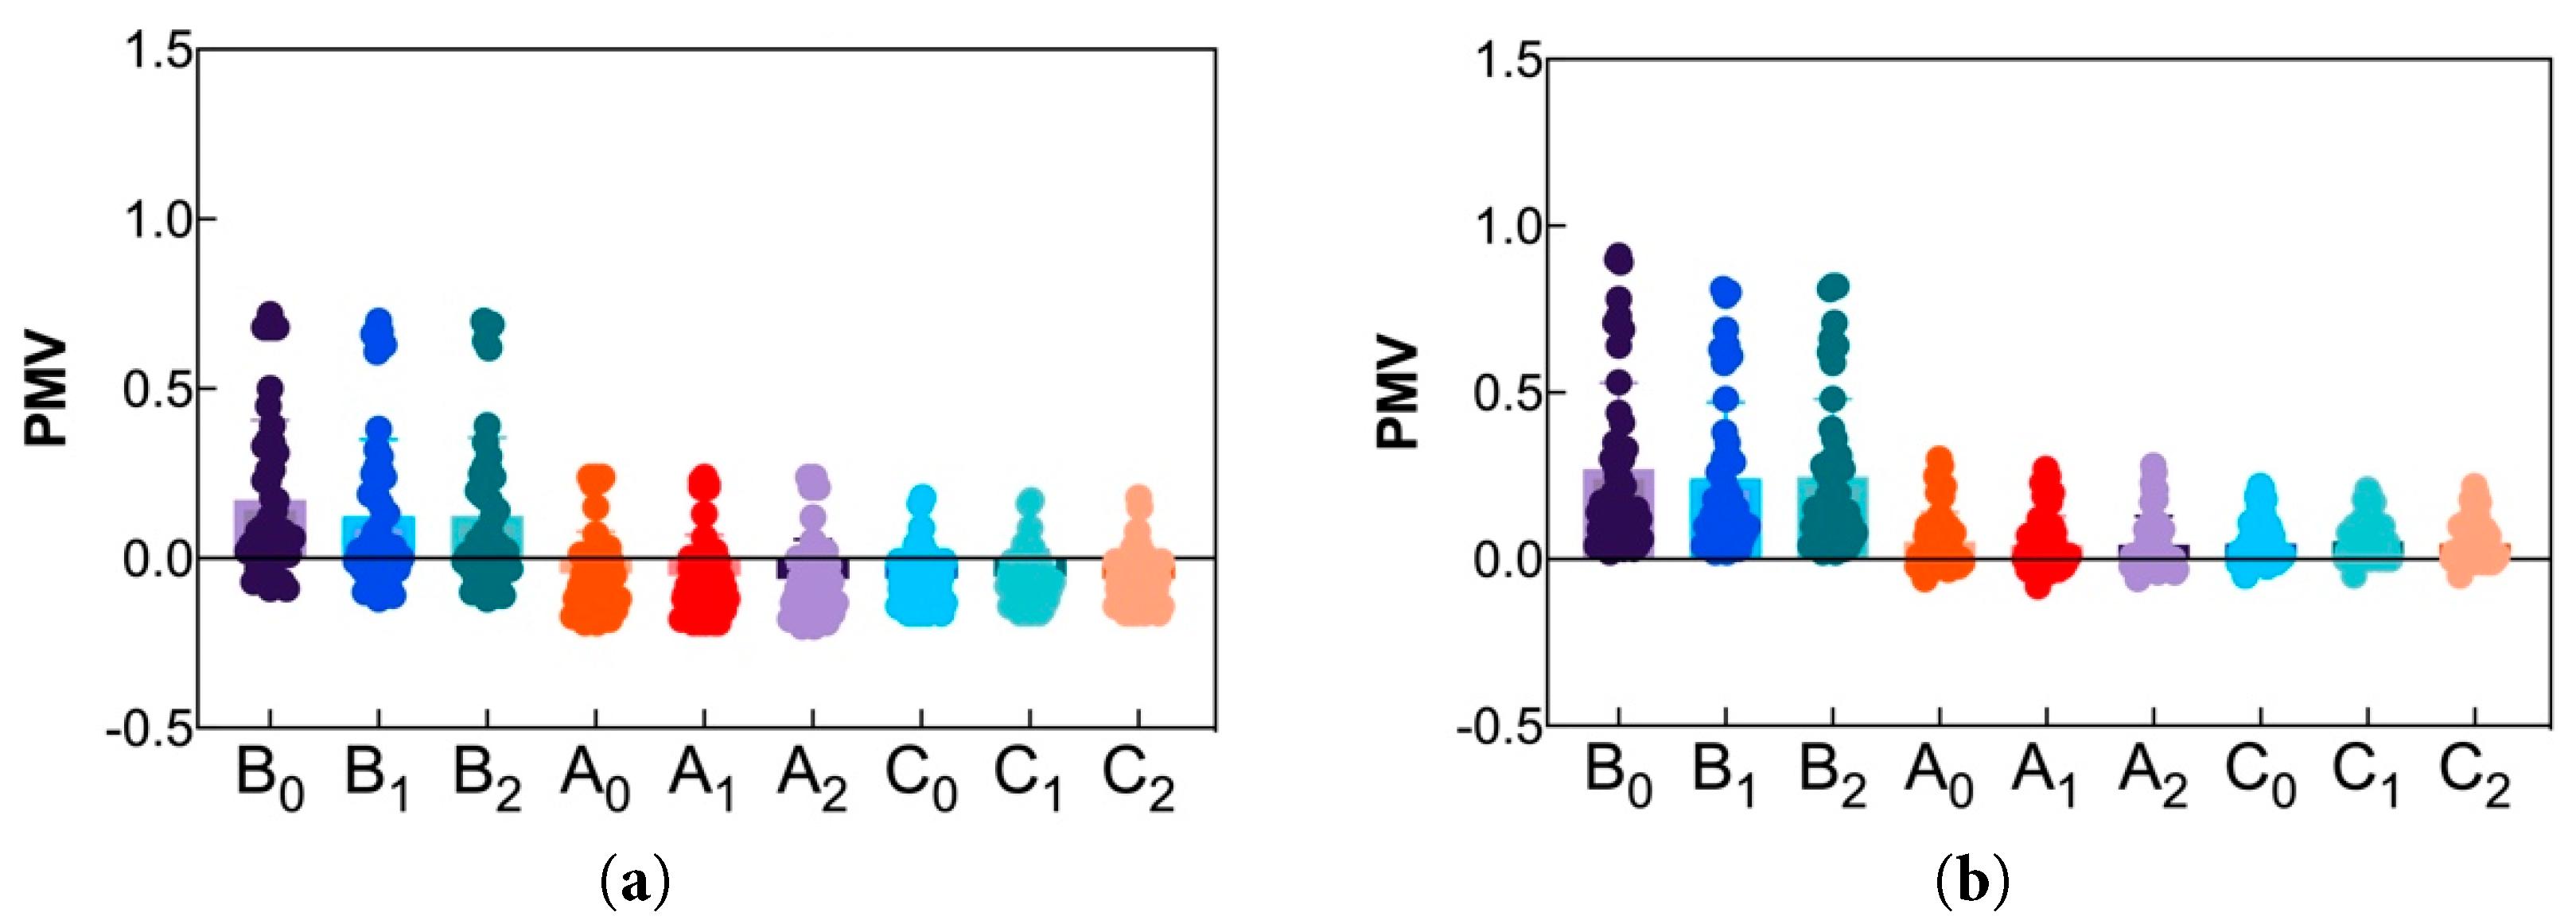
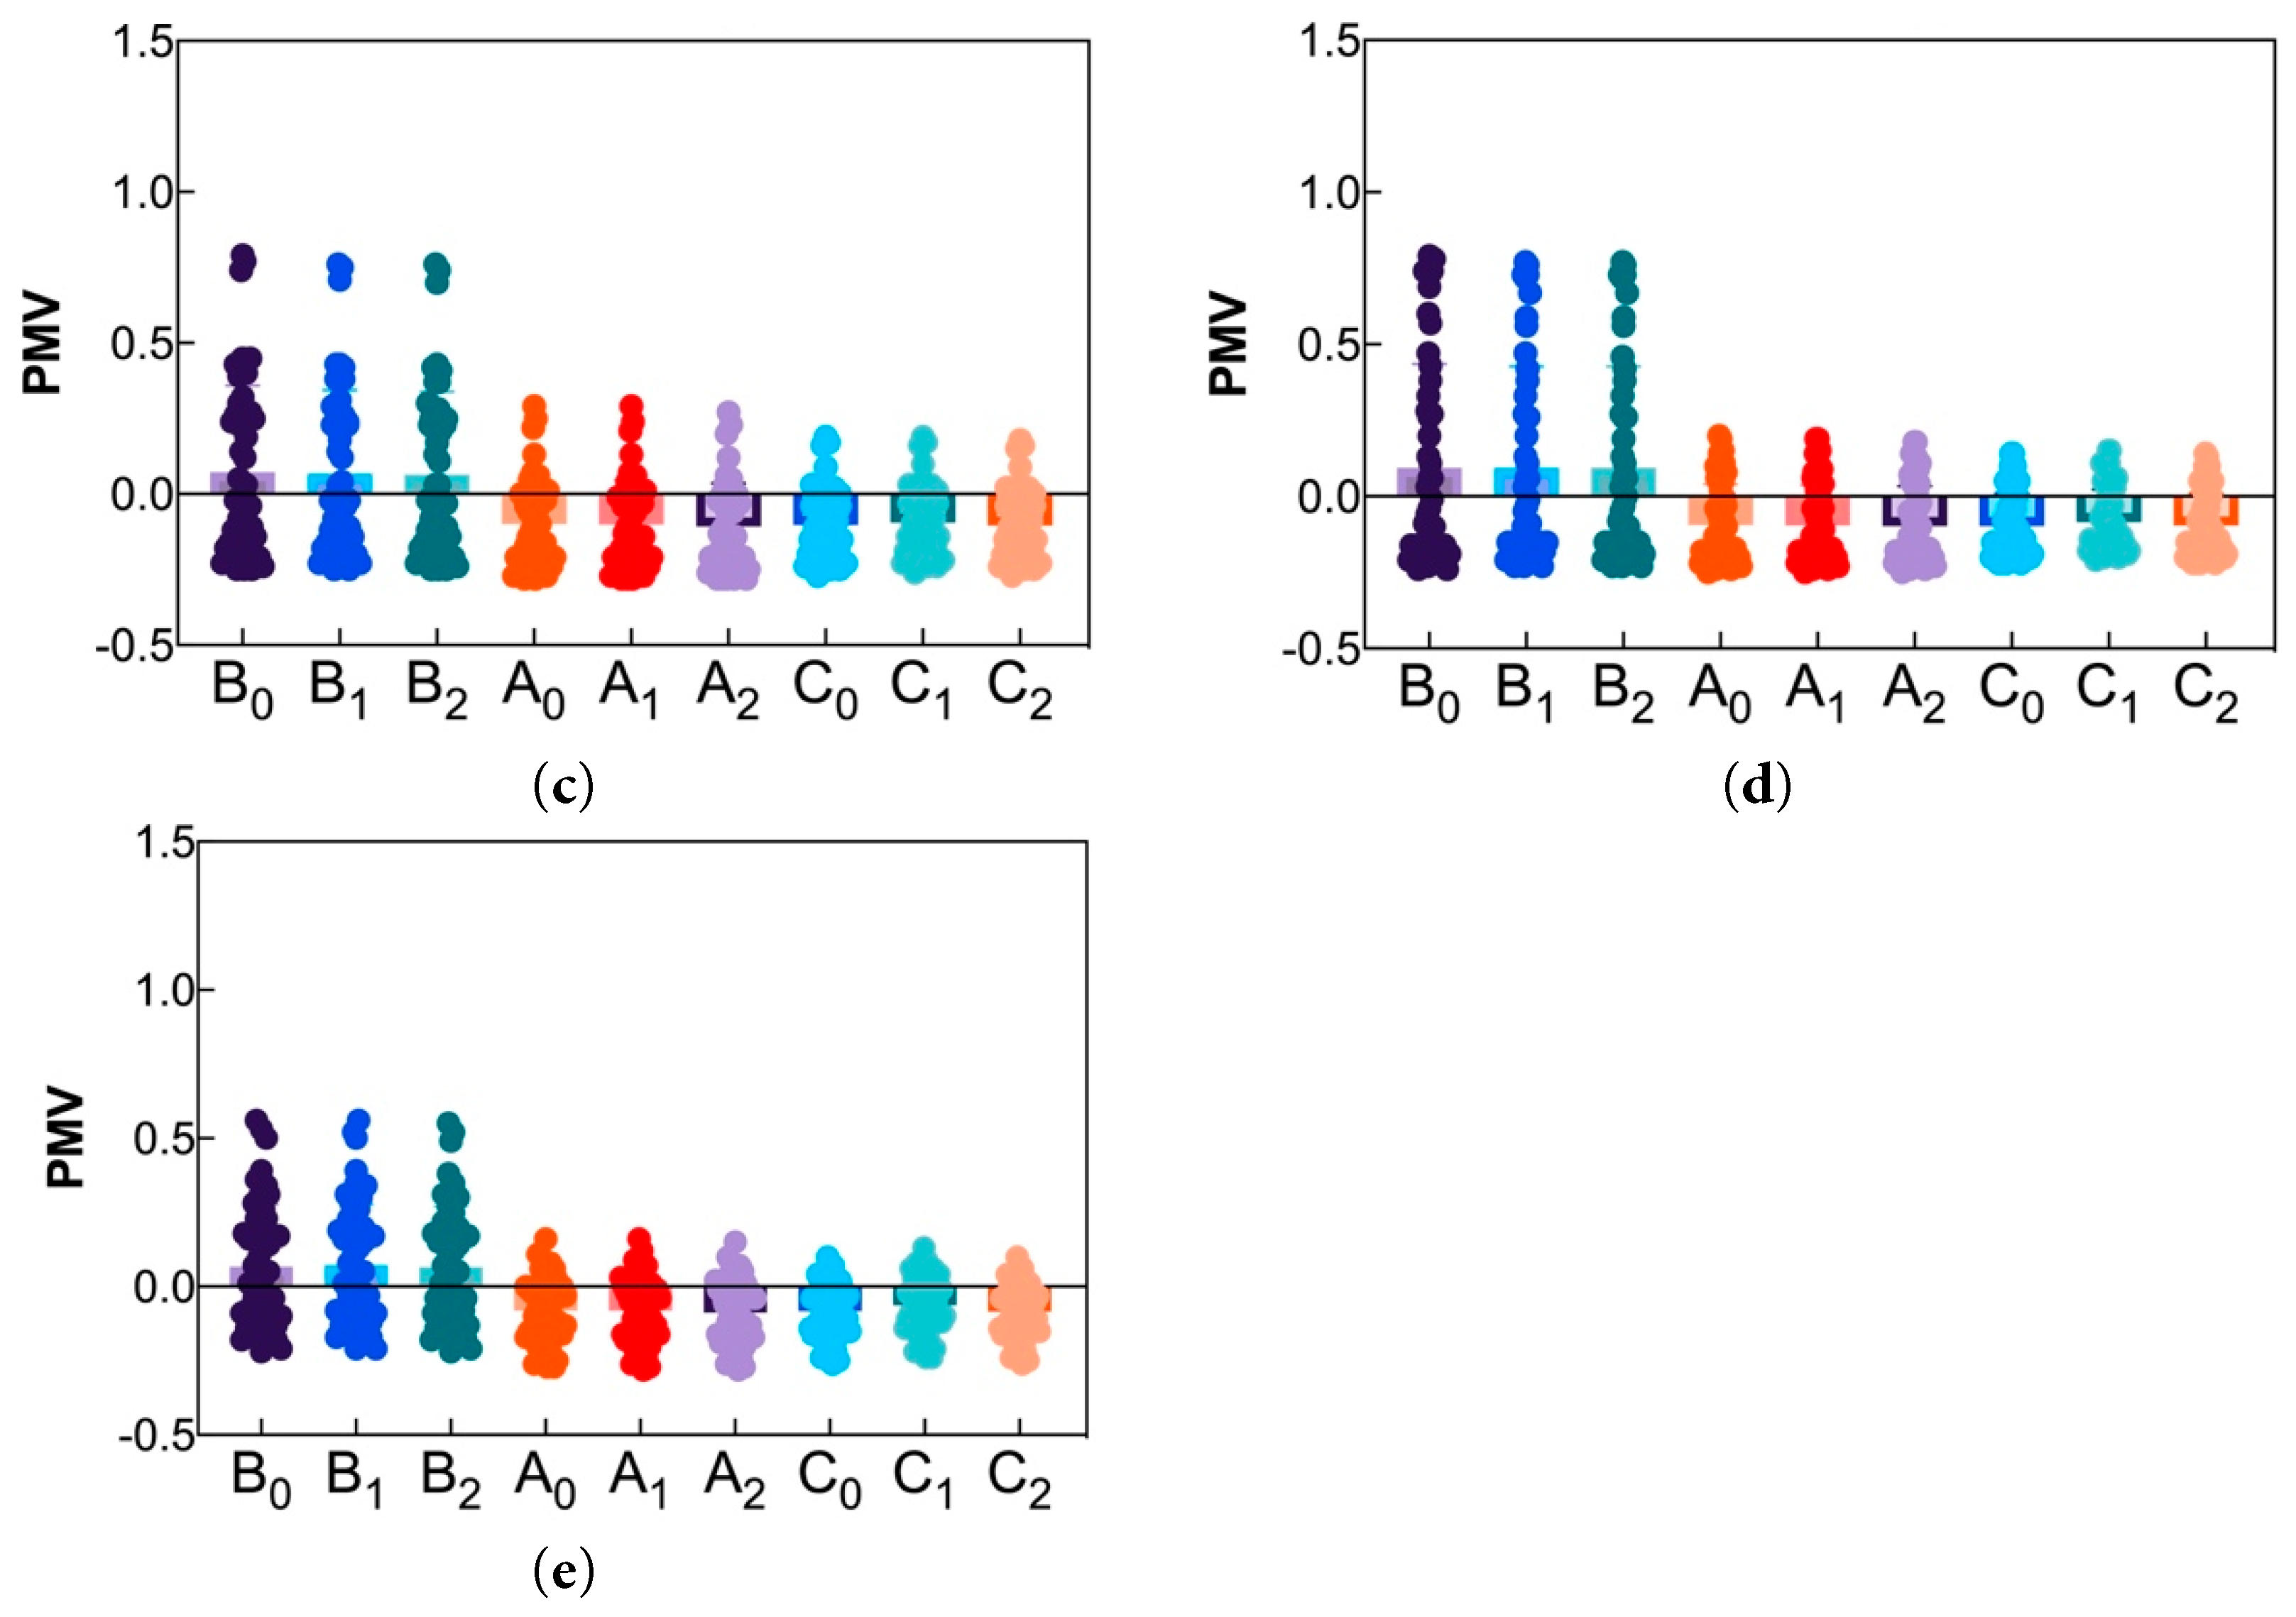
Figure 15: PMV value of local indoor locations of (FR+FC) under different WWRs: (a) WWR40%; (b) WWR50%; (c) WWR60%; (d) WWR70%; (e) WWR80%.
Table 5: PMV value range of different penetration depth under each cooling system and WWRs (including solar radiation increment).
| Cooling System | Different Penetration Depth/WWRs | 40% | 50% | 60% | 70% | 80% |
|---|---|---|---|---|---|---|
| FR+FC | Bn | −0.20~0.75 | 0.10~1 | −0.30~0.80 | −0.30~0.80 | −0.25~0.60 |
| An | −0.20~0.30 | −0.05~0.30 | −0.30~0.30 | −0.30~0.20 | −0.30~0.20 | |
| Cn | −0.20~0.20 | −0.05~0.25 | −0.30~–0.20 | −0.30~0.15 | −0.30~0.15 | |
| Bn | −0.05~1.20 | 0~1.30 | −0.15~1.20 | −0.10~1.30 | −0.10~1.30 | |
| FC | An | −0.10~0.40 | −0.10~0.60 | −0.20~0.40 | −0.20~0.70 | −0.15~0.70 |
| Cn | −0.10~0.25 | −0.10~0.50 | −0.20~0.30 | −0.15~0.60 | −0.15~0.60 |
Fig. 15 shows that under (FR+FC), except for the 80% WWR, as the WWR increases, the PMV value fluctuates at a distance of 0.60 m from the window reveal depth (Bn), ranging between −0.30 and 0.80, maintaining the comfort level at “slightly warm”. Under the conditions of 60% and 70% WWRs, the PMV value fluctuates the most at the distance of 0.60 m from the window reveal depth (Bn), indicating poor comfort. At different WWRs, the PMV values at distances of 4.27 m (An) and 6.89 m (Cn) from the window reveal depth fluctuate between −0.30 and 0.30, remaining within the comfort range. Under (FR+FC), when solar radiation shines on the floor, the radiant floor cooling system immediately responds to direct solar radiation (removing the heat before it heats the room), considerably increasing the cooling capacity of the floor cooling system. Additionally, the building envelope structure has a heat storage characteristic, storing cold energy at night to eliminate the sudden increase in indoor cooling load during the day. Therefore, the greater the distance from the window reveal depth, the better the indoor comfort.
As shown in Fig. 16, under (FC), as the WWR increases, the PMV values fluctuate at different distances from the window reveal depth positions. At different WWRs, the PMV value at the distance of 0.60 m from the window reveal depth (Bn) fluctuates between −0.10 and 1.30, with a large fluctuation range and poor comfort level. From 15:00 to 19:00, thermal discomfort occurs. The PMV values at distances of 4.27 m (An) and 6.89 m (Cn) from the window reveal depth fluctuate between −0.20 and 0.70 and between −0.20 and 0.30, respectively, remaining within the comfort range. Given the inefficient handling of radiation heat load by convection and the limited capacity to eliminate sudden increases in indoor cooling load, as outdoor temperatures rise and solar radiation on the west window increases, the indoor cooling load increases. The closer the distance from the window reveal depth, the poorer the comfort level, and it may even cause thermal discomfort. To clarify further the impact of solar radiation on indoor comfort, the area where the indoor floor is directly exposed to solar radiation at 18:00 is plotted in Fig. 17. Under different cooling systems, at 18:00 in the afternoon, as the area of the west-facing windows increases, the area directly exposed to the sun through the west windows gradually expands. Although there is horizontal external shading, the areas B1 and B0 at the distance of 0.60 m from the window reveal depth gradually enter the area directly exposed to the sun.
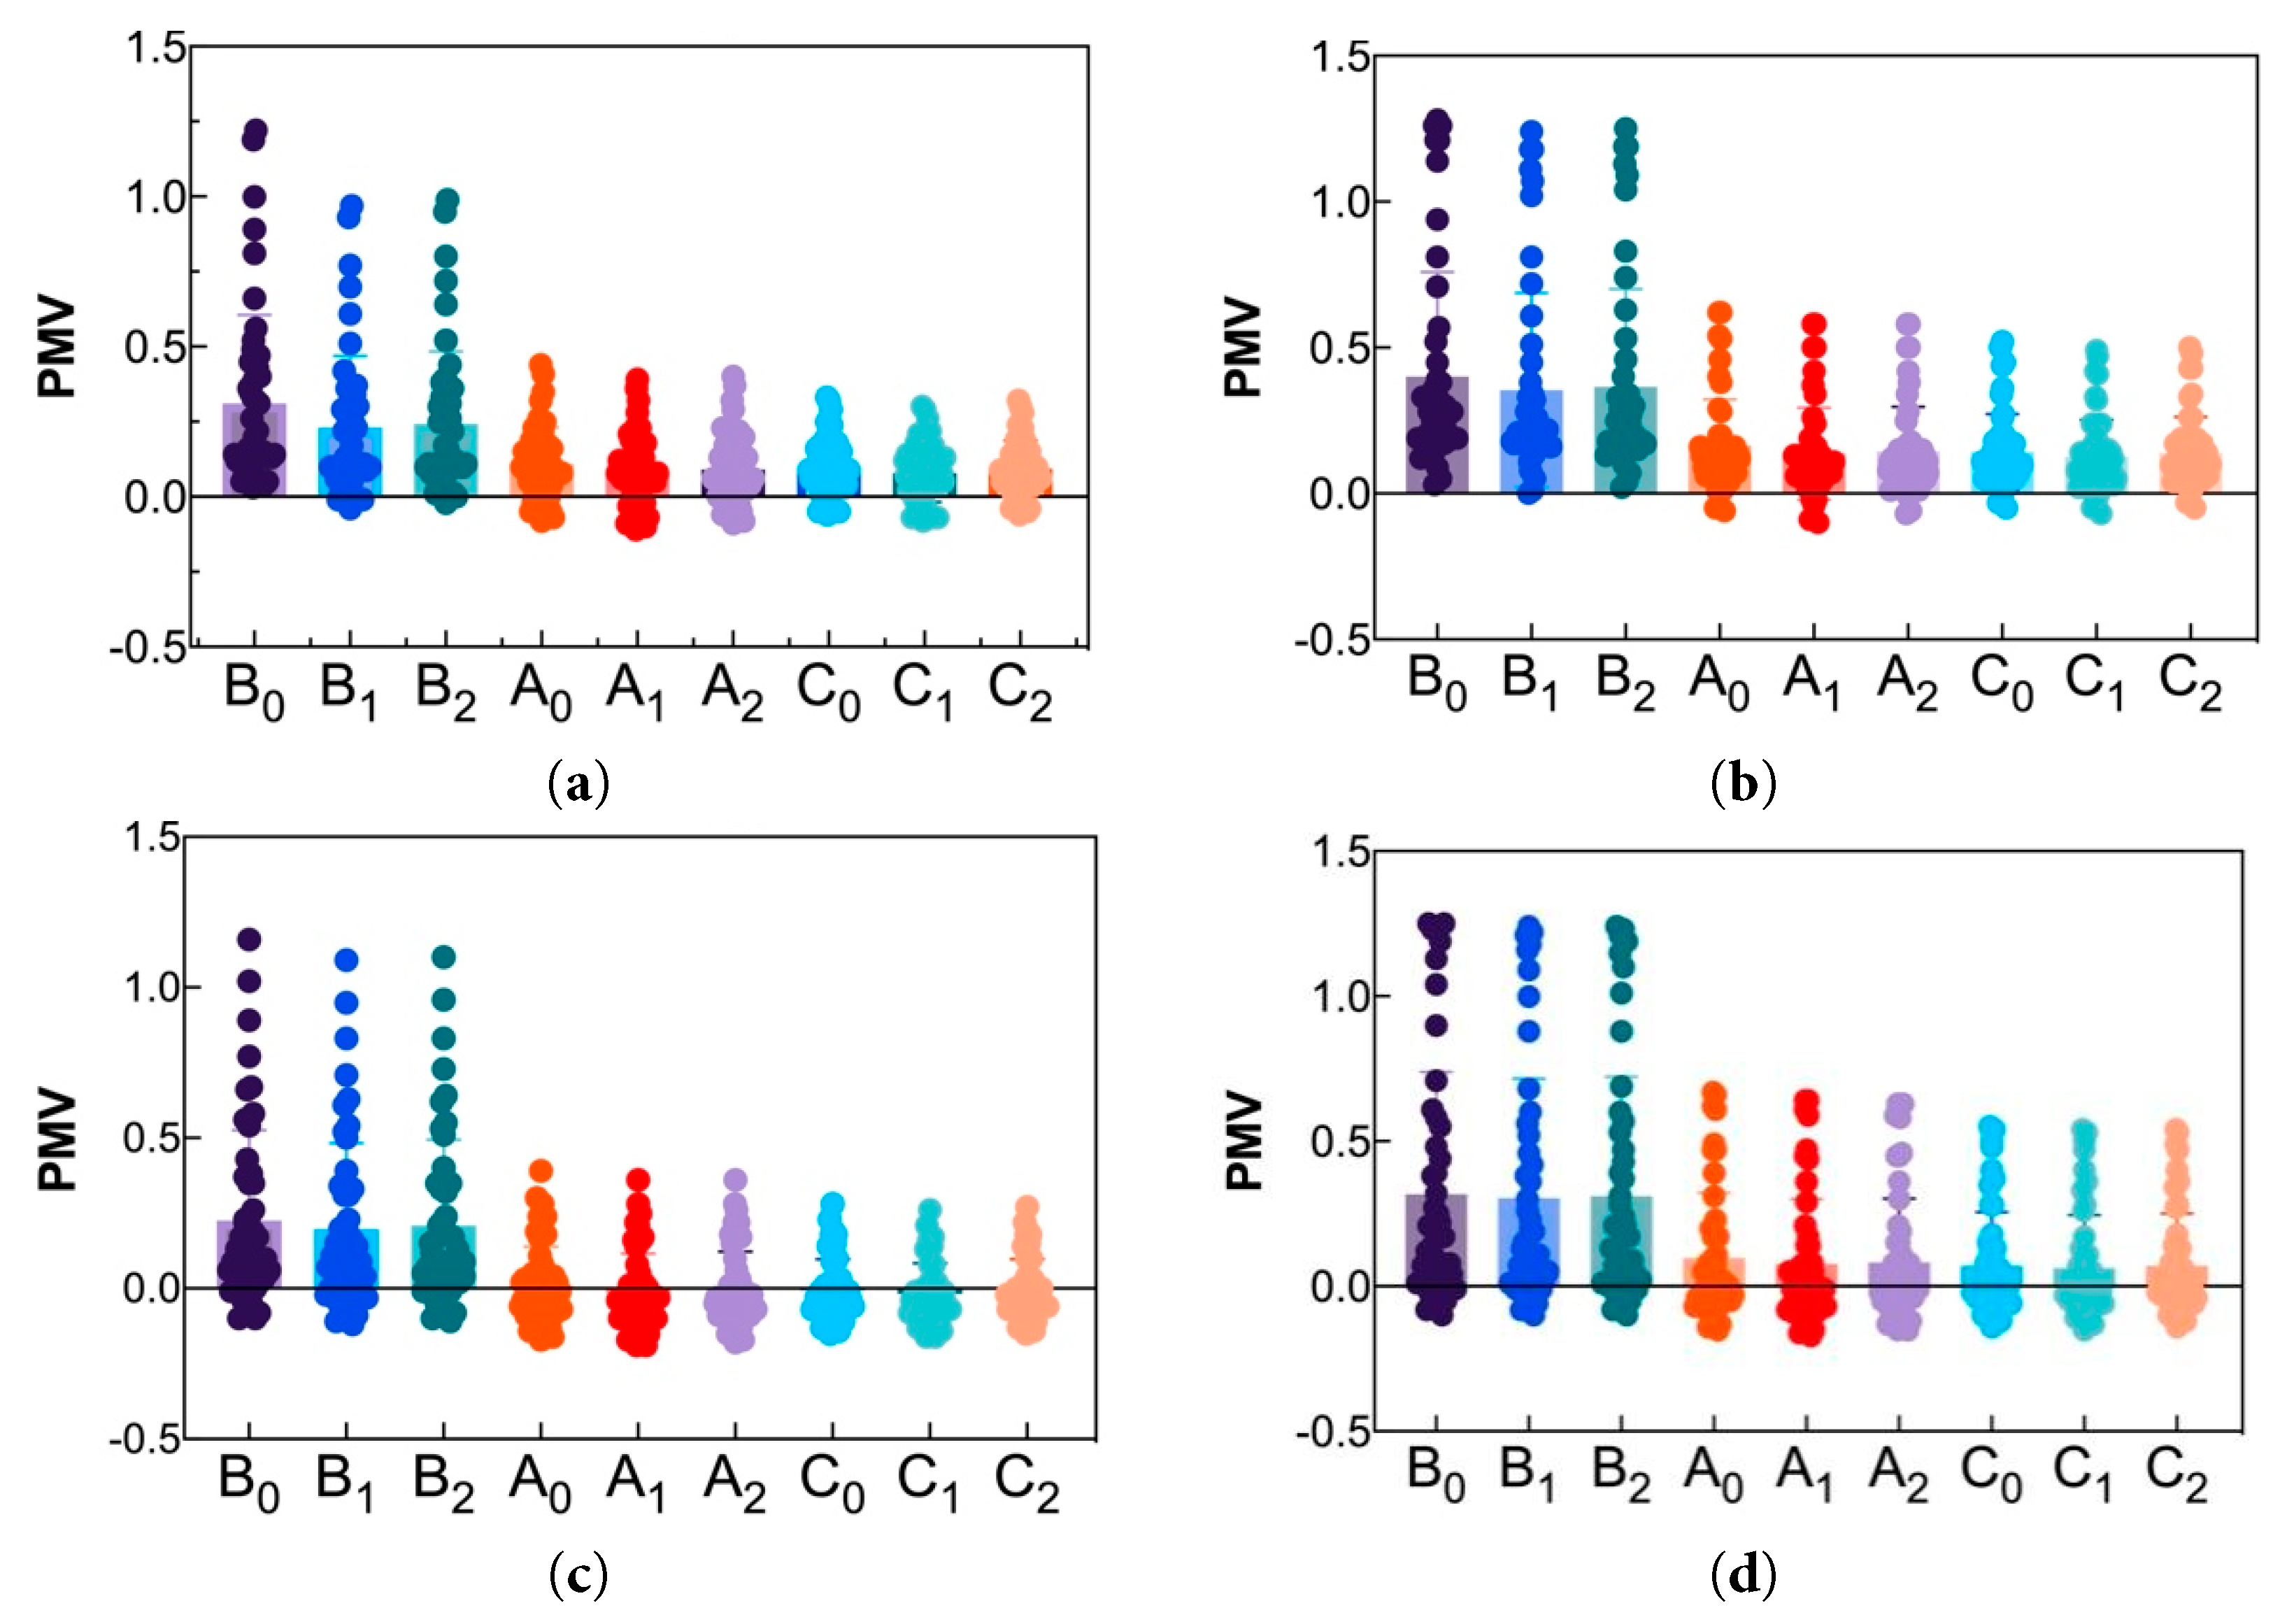
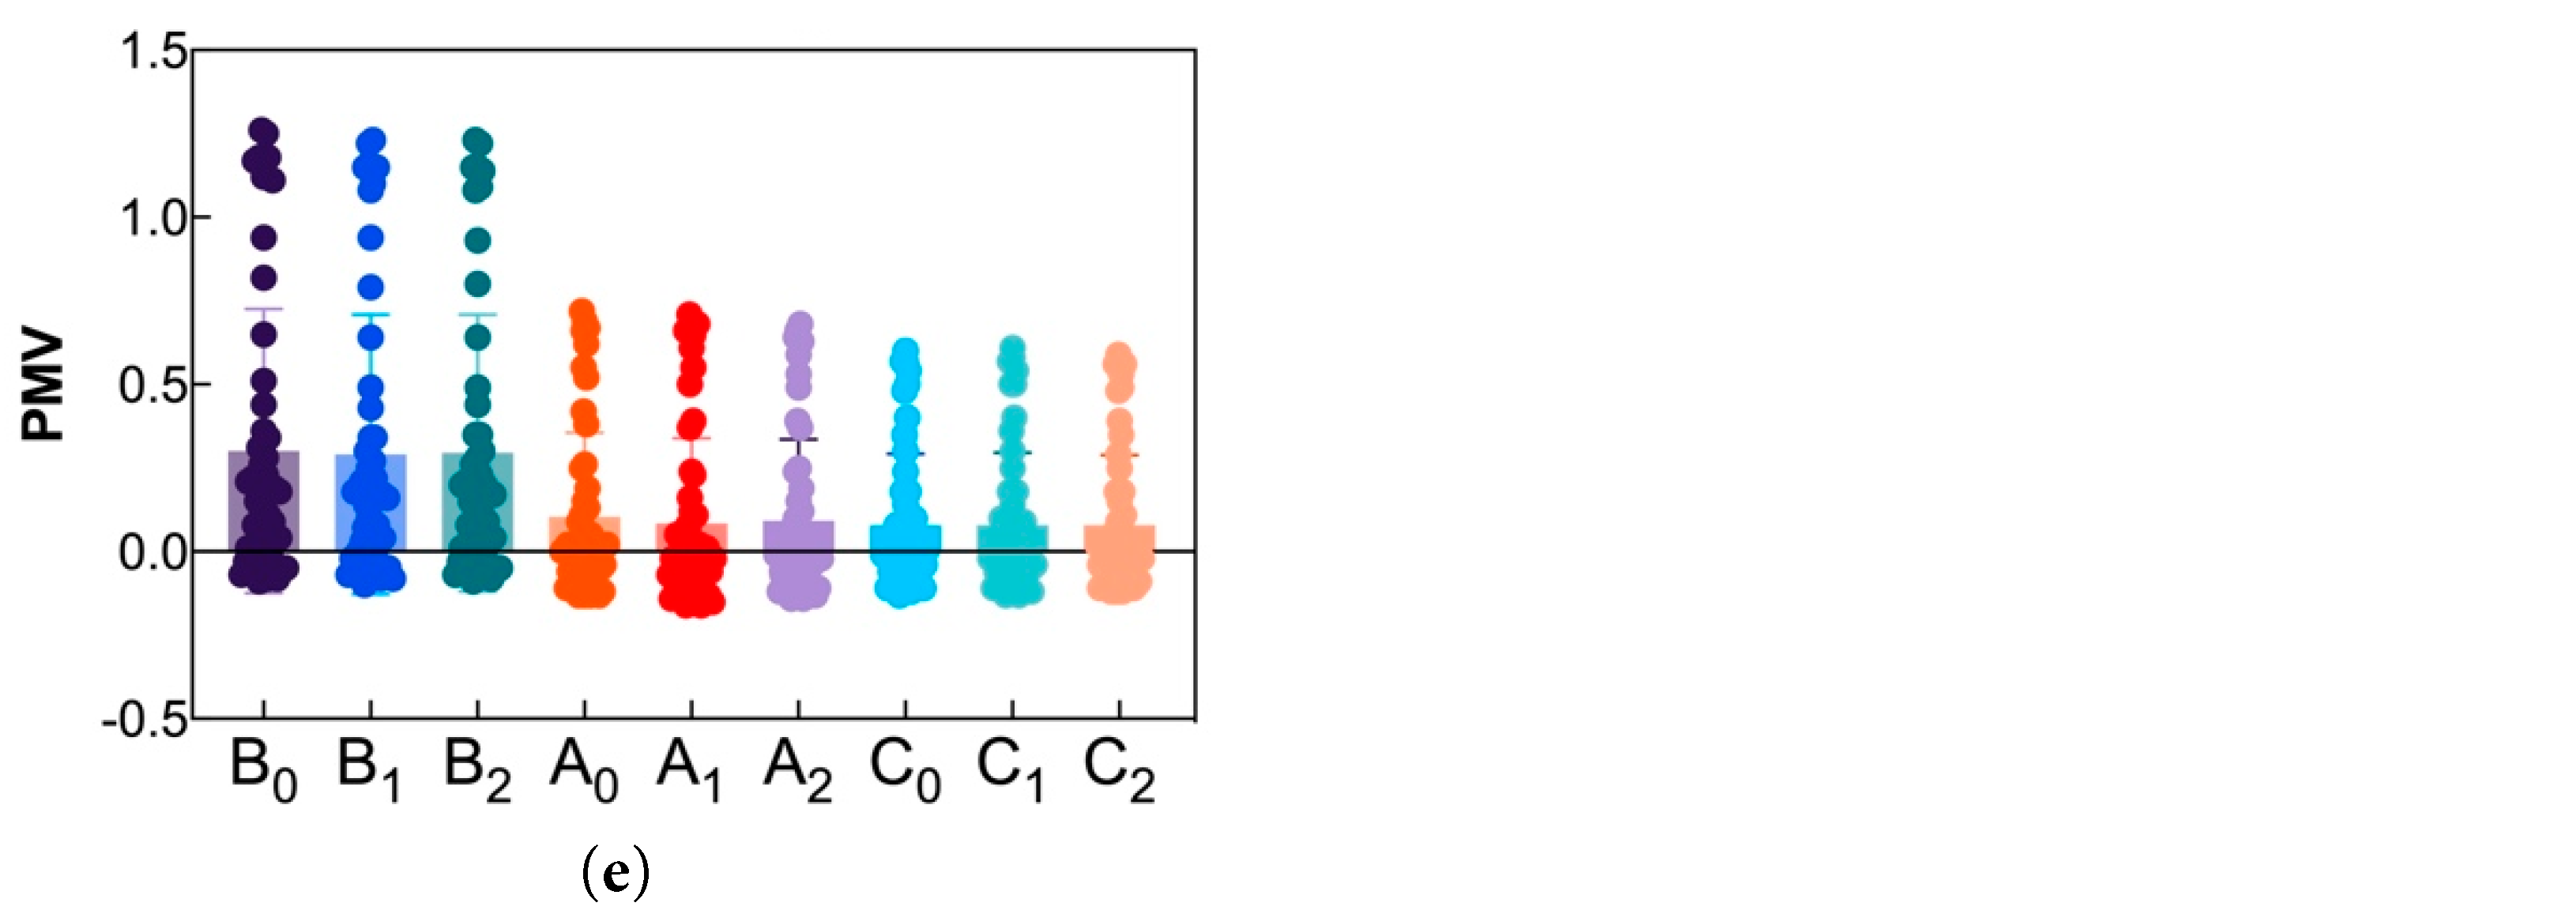
Figure 16: PMV value of local indoor locations of (FC) under different WWRs: (a) WWR40%; (b) WWR50%; (c) WWR60%; (d) WWR70%; (e) WWR80%.
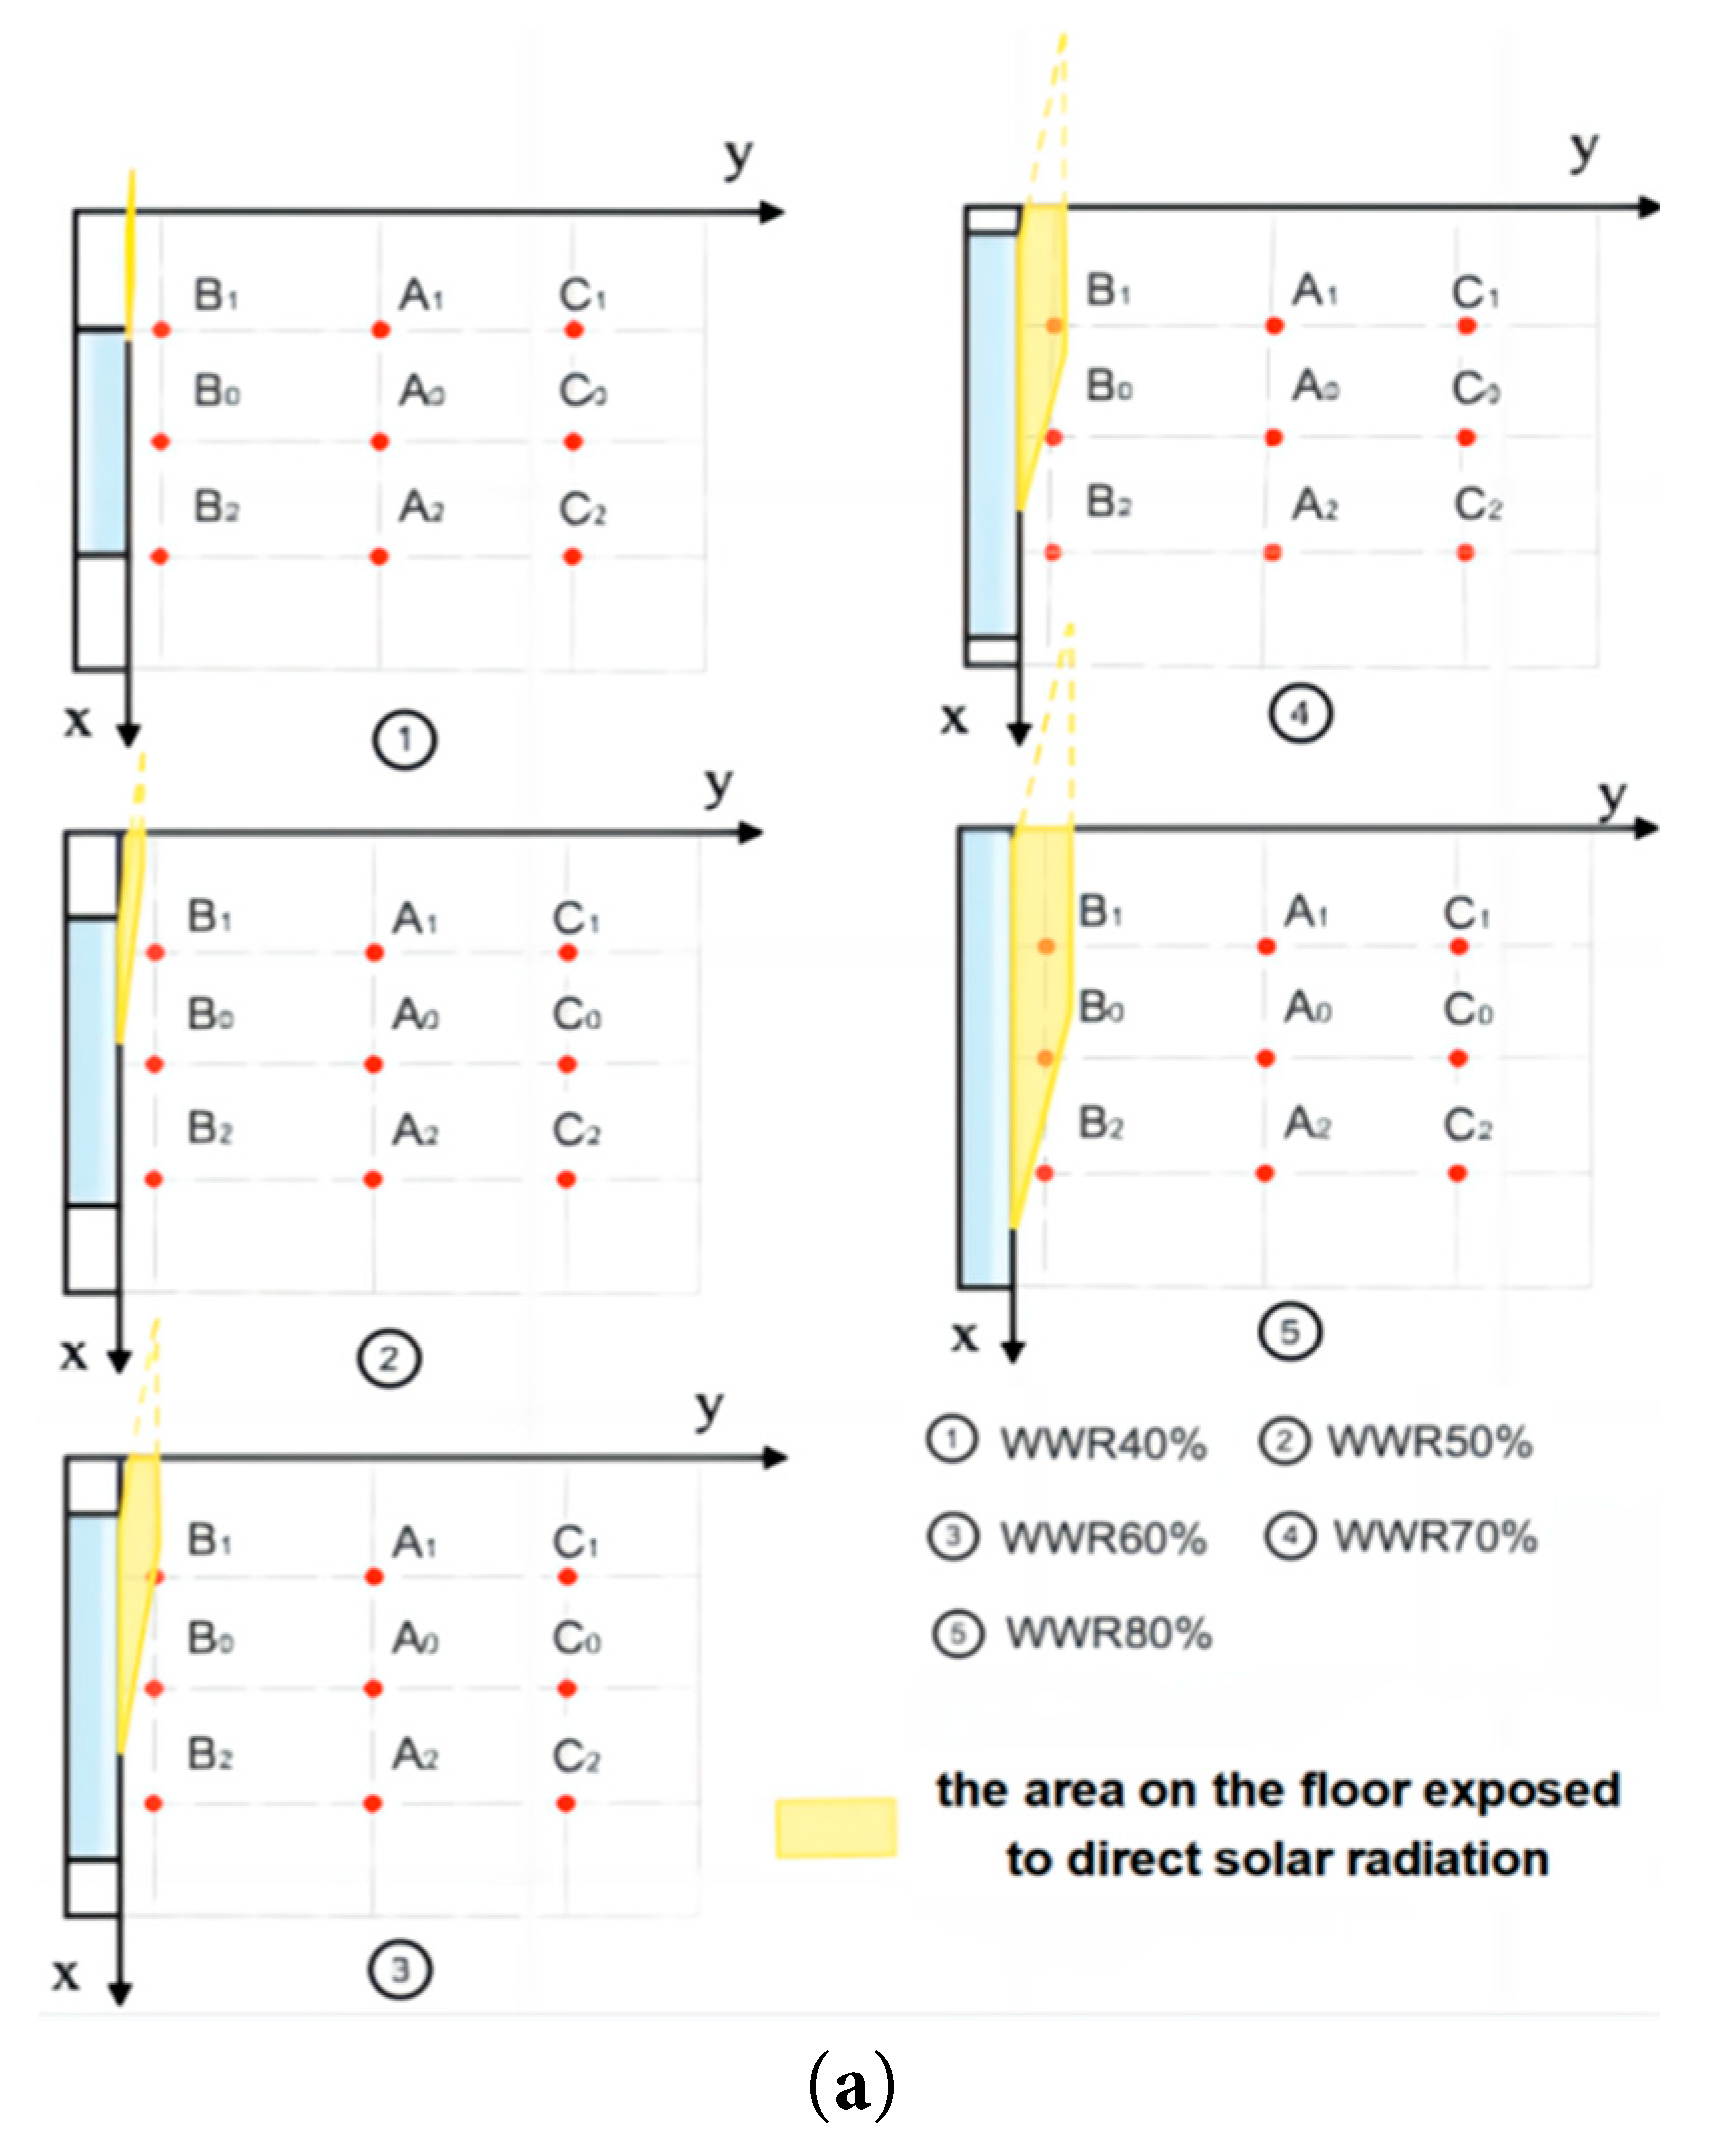
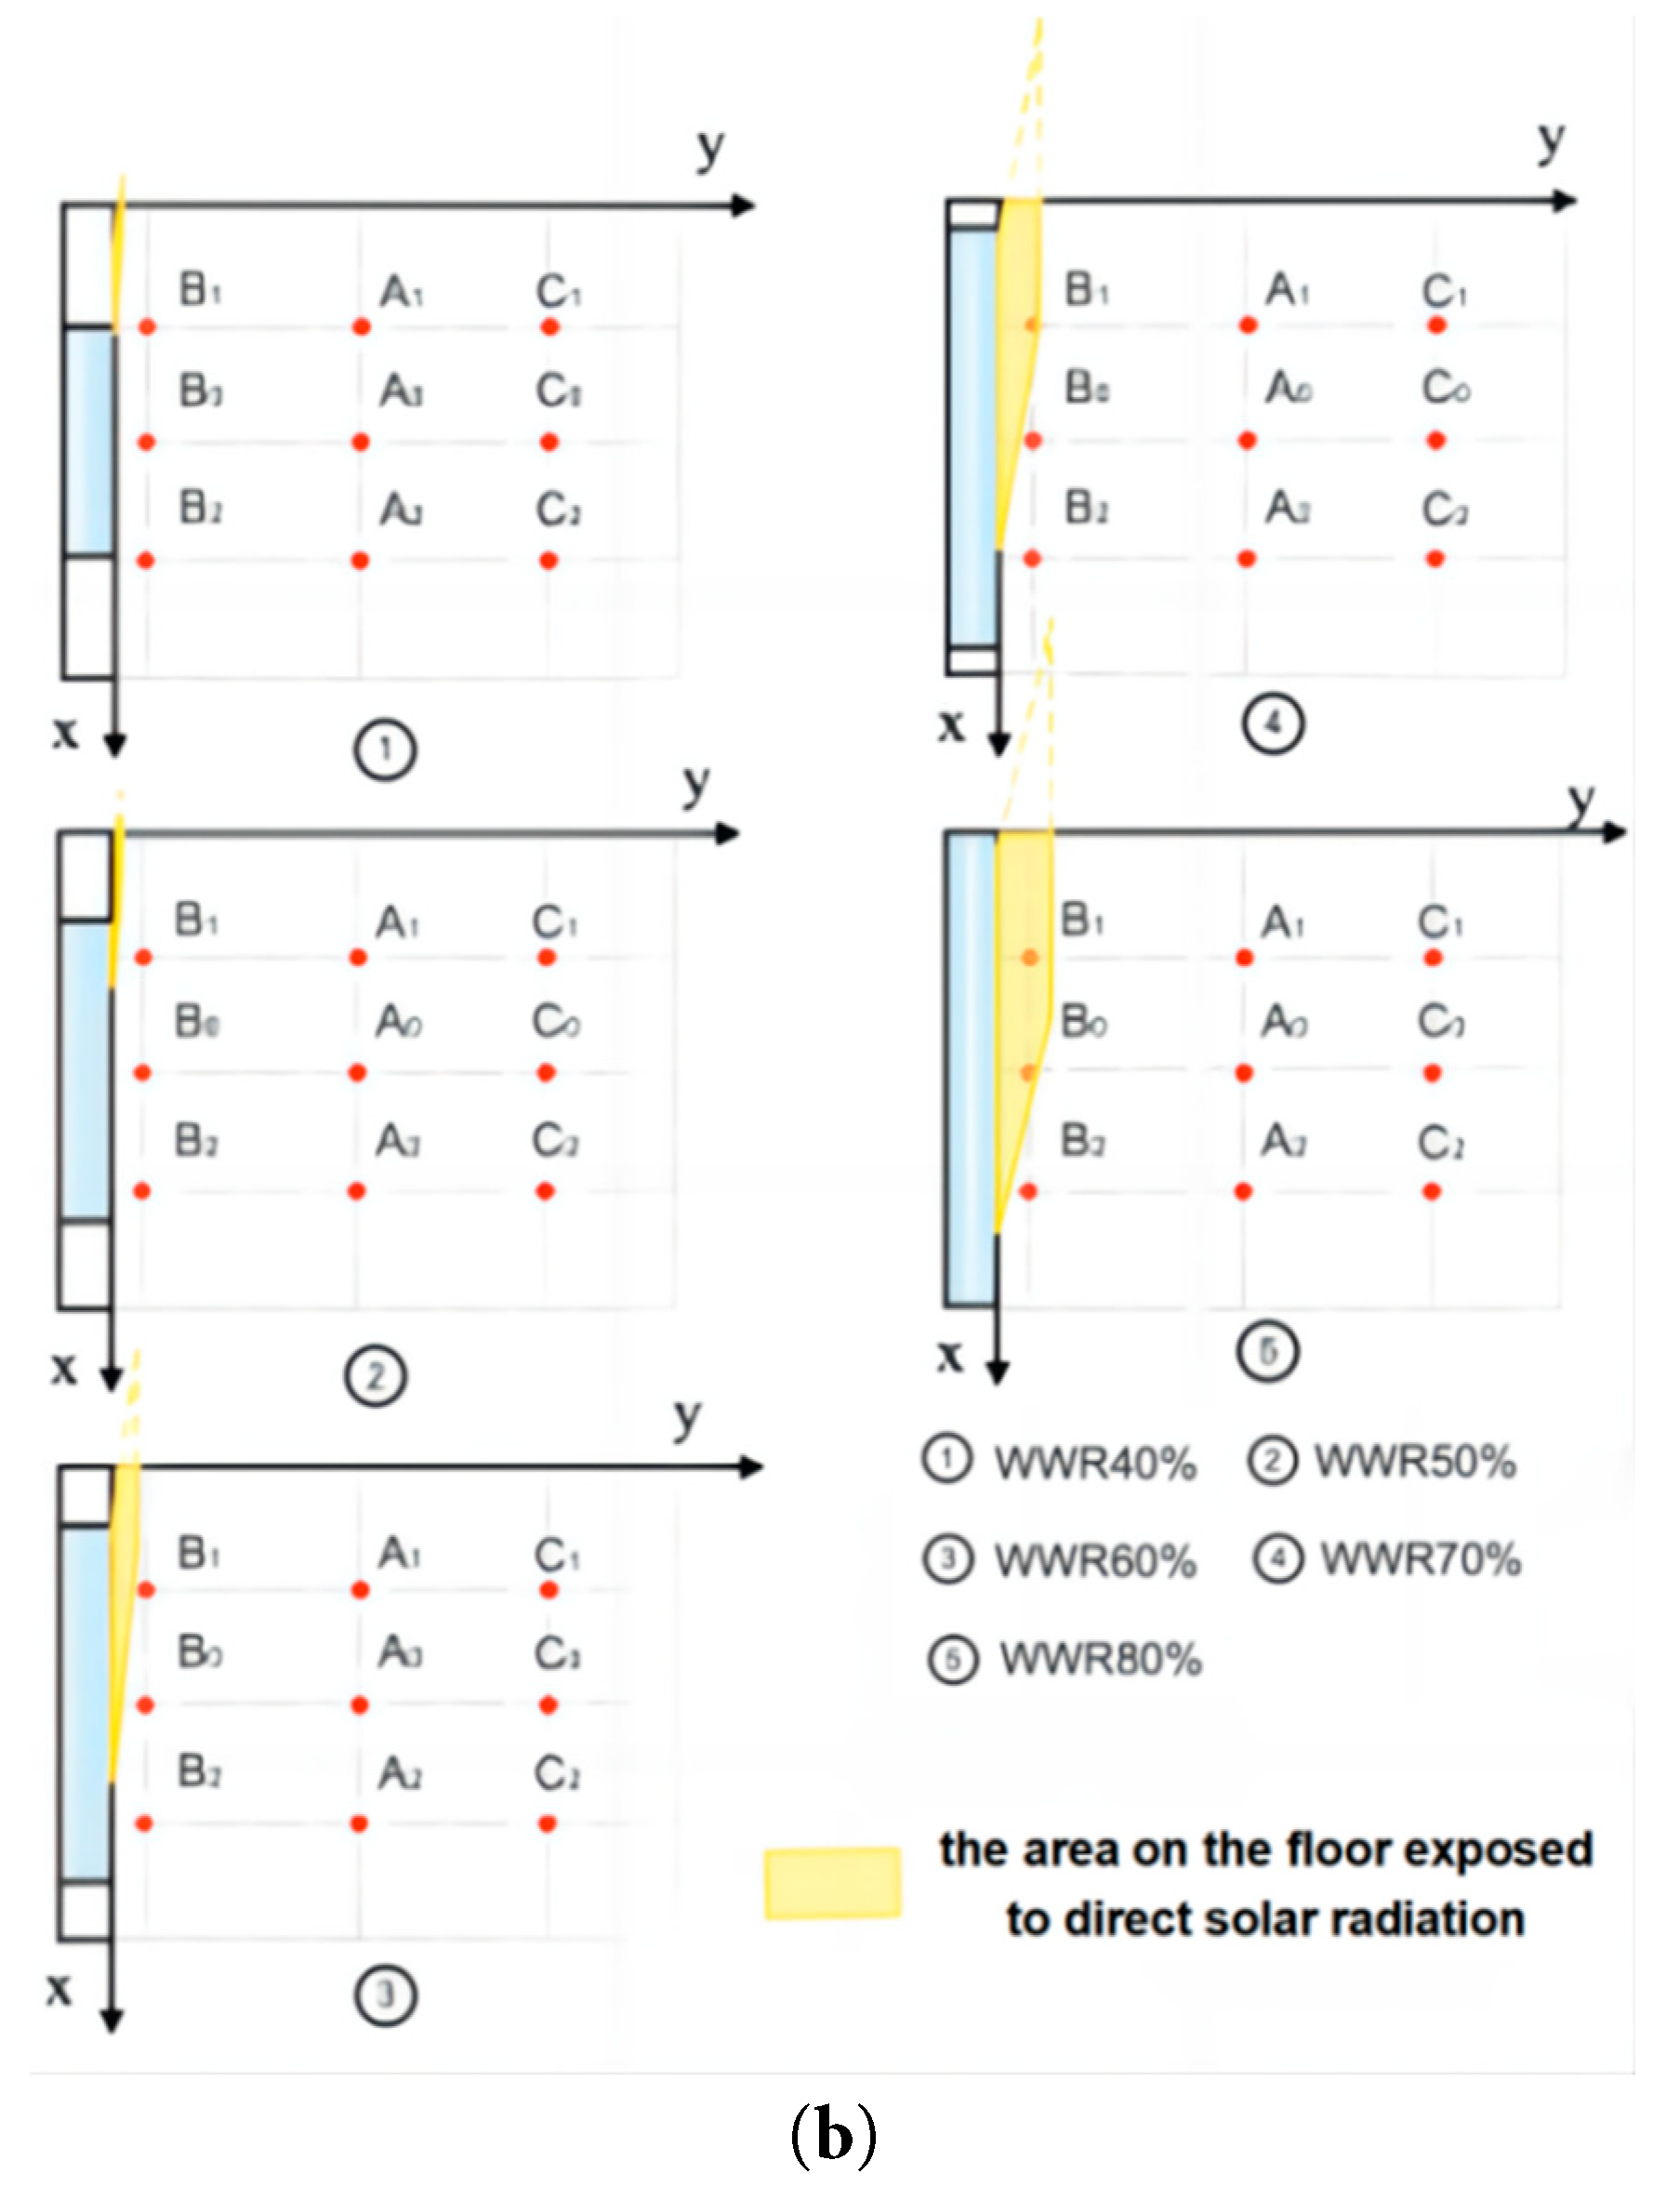
Figure 17: View of the irradiated zone from the floor under different WWRs at 18:00: (a) FR+FC; (b) FC.
Fig. 18 and Fig. 19 present the mean radiant temperature (Tr,irr) and (PMV)irr at different distances from the window reveal depth for various cooling systems at 18:00 in the afternoon, when the additional increment caused by solar radiation is included in the calculation. The calculated values Tr,ur and (PMV)ur, which do not include the additional increment caused by solar radiation, are compared, where ΔTr represents the difference between Tr,irr and Tr,ur. As the internal shading was in an open state during the experiment, Fig. 18 and Fig. 19 reveal that the mean radiant temperature and comfort in areas not directly exposed to solar radiation indoors are also affected. The mean radiant temperature and comfort between the area directly exposed to solar radiation and the area outside the radiant zone have a clear difference. When there is solar radiation, the mean radiant temperature outside the radiant zone under various conditions increases to a limited extent, while the increase in mean radiant temperature within the radiant zone is more remarkable [31].
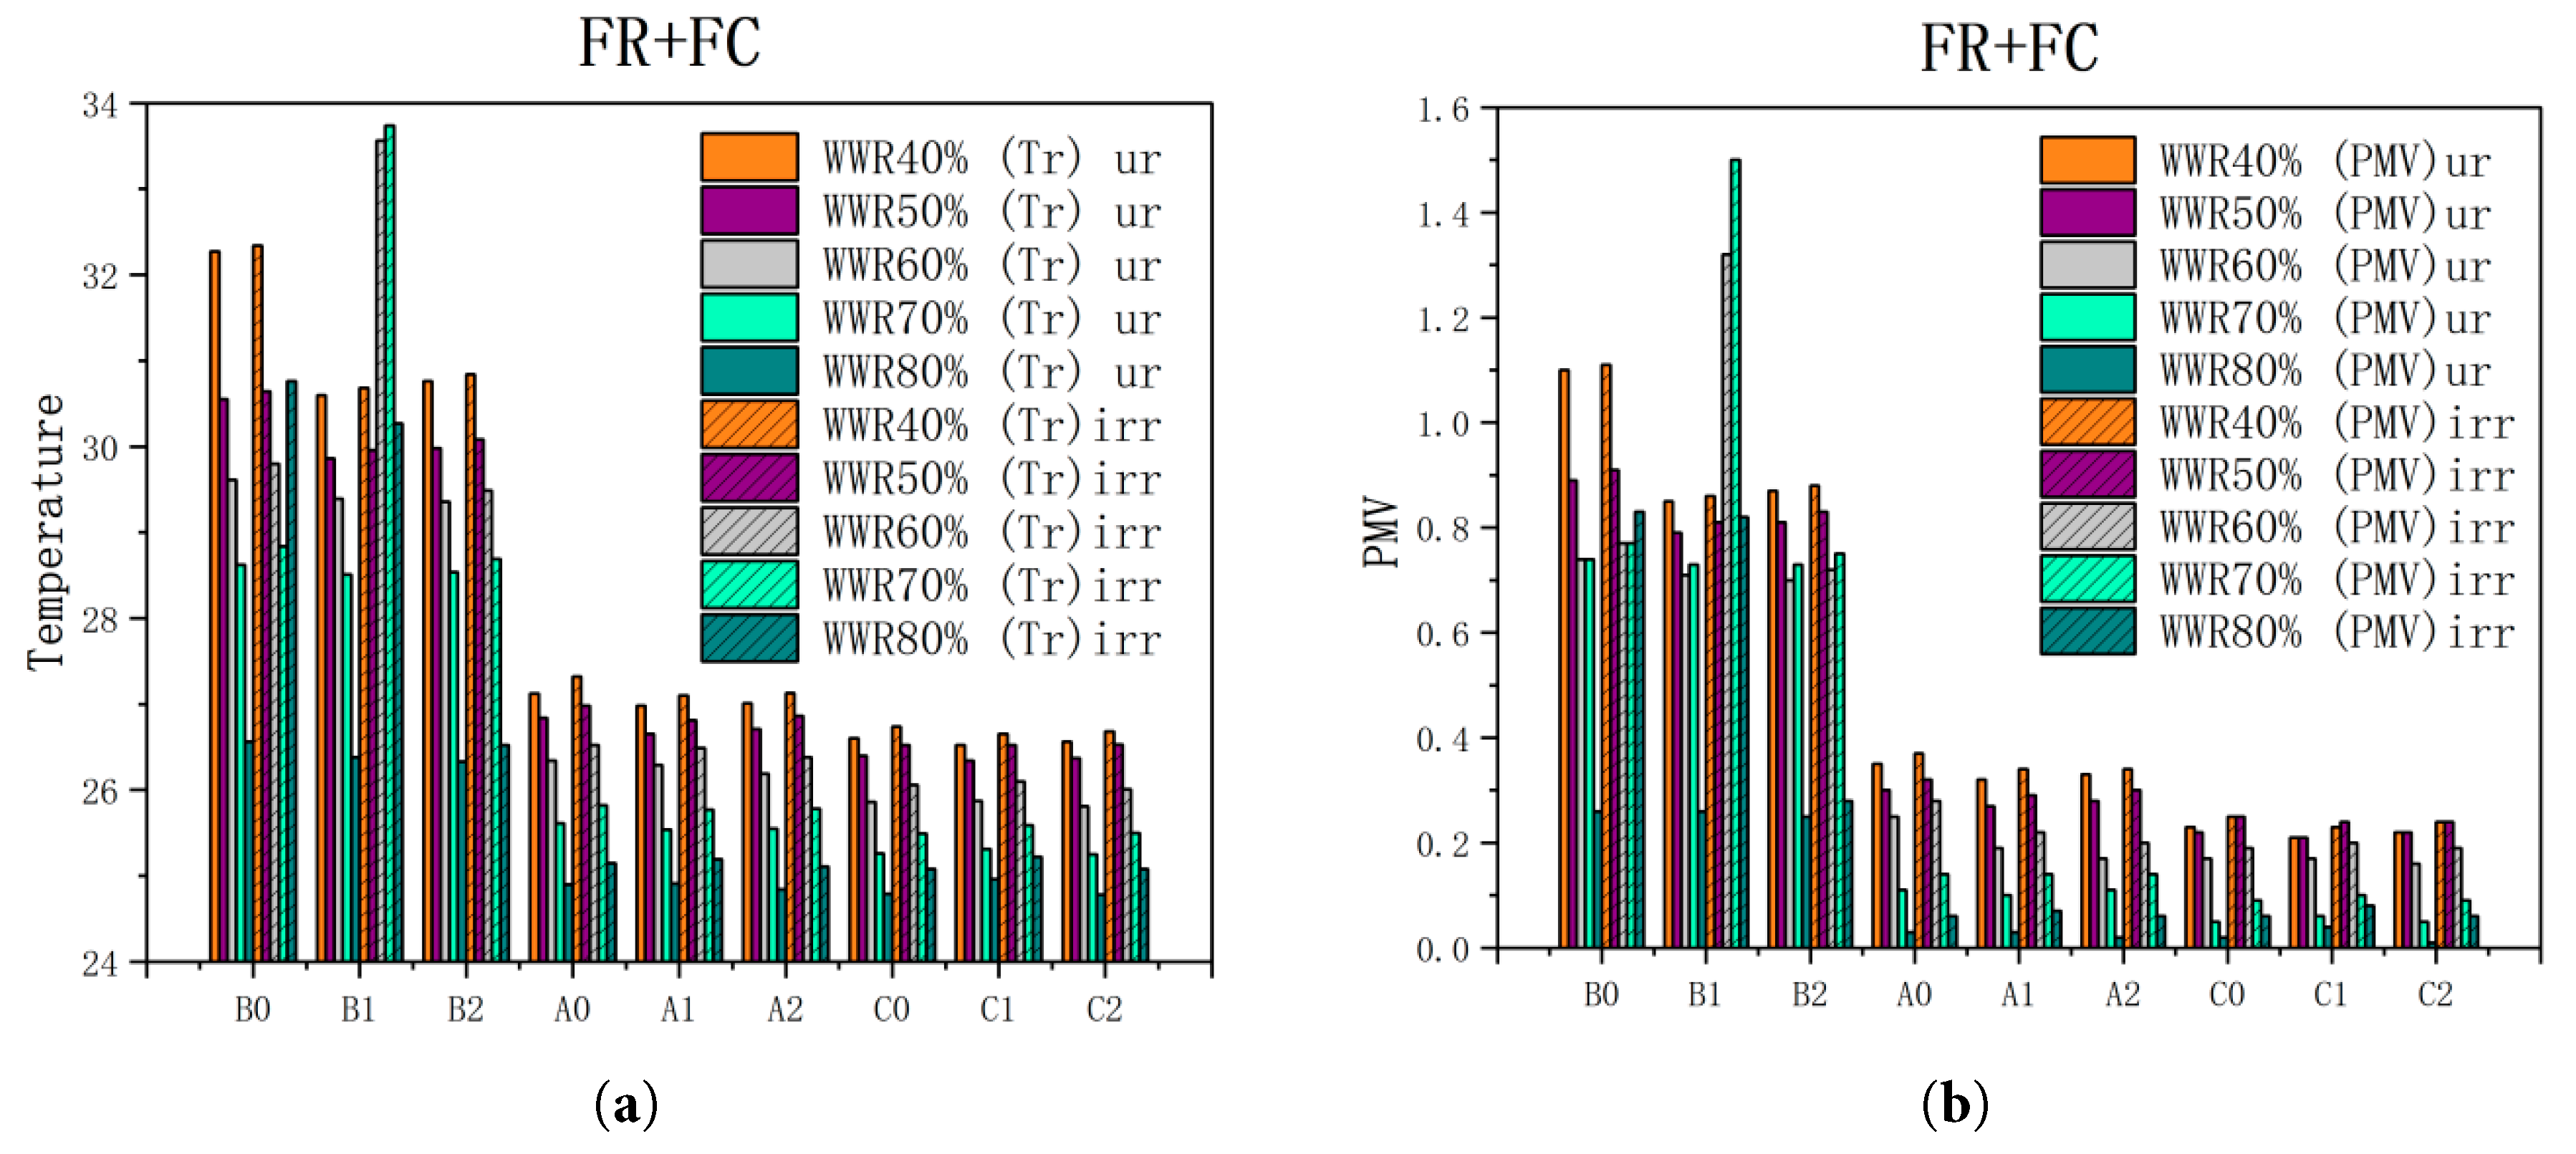
Figure 18: Comparison of data at different positions for the FC+FR system at 18:00, with and without the additional increment caused by solar radiation included in the calculation: (a) Mean Radiant Temperature; (b) PMV.
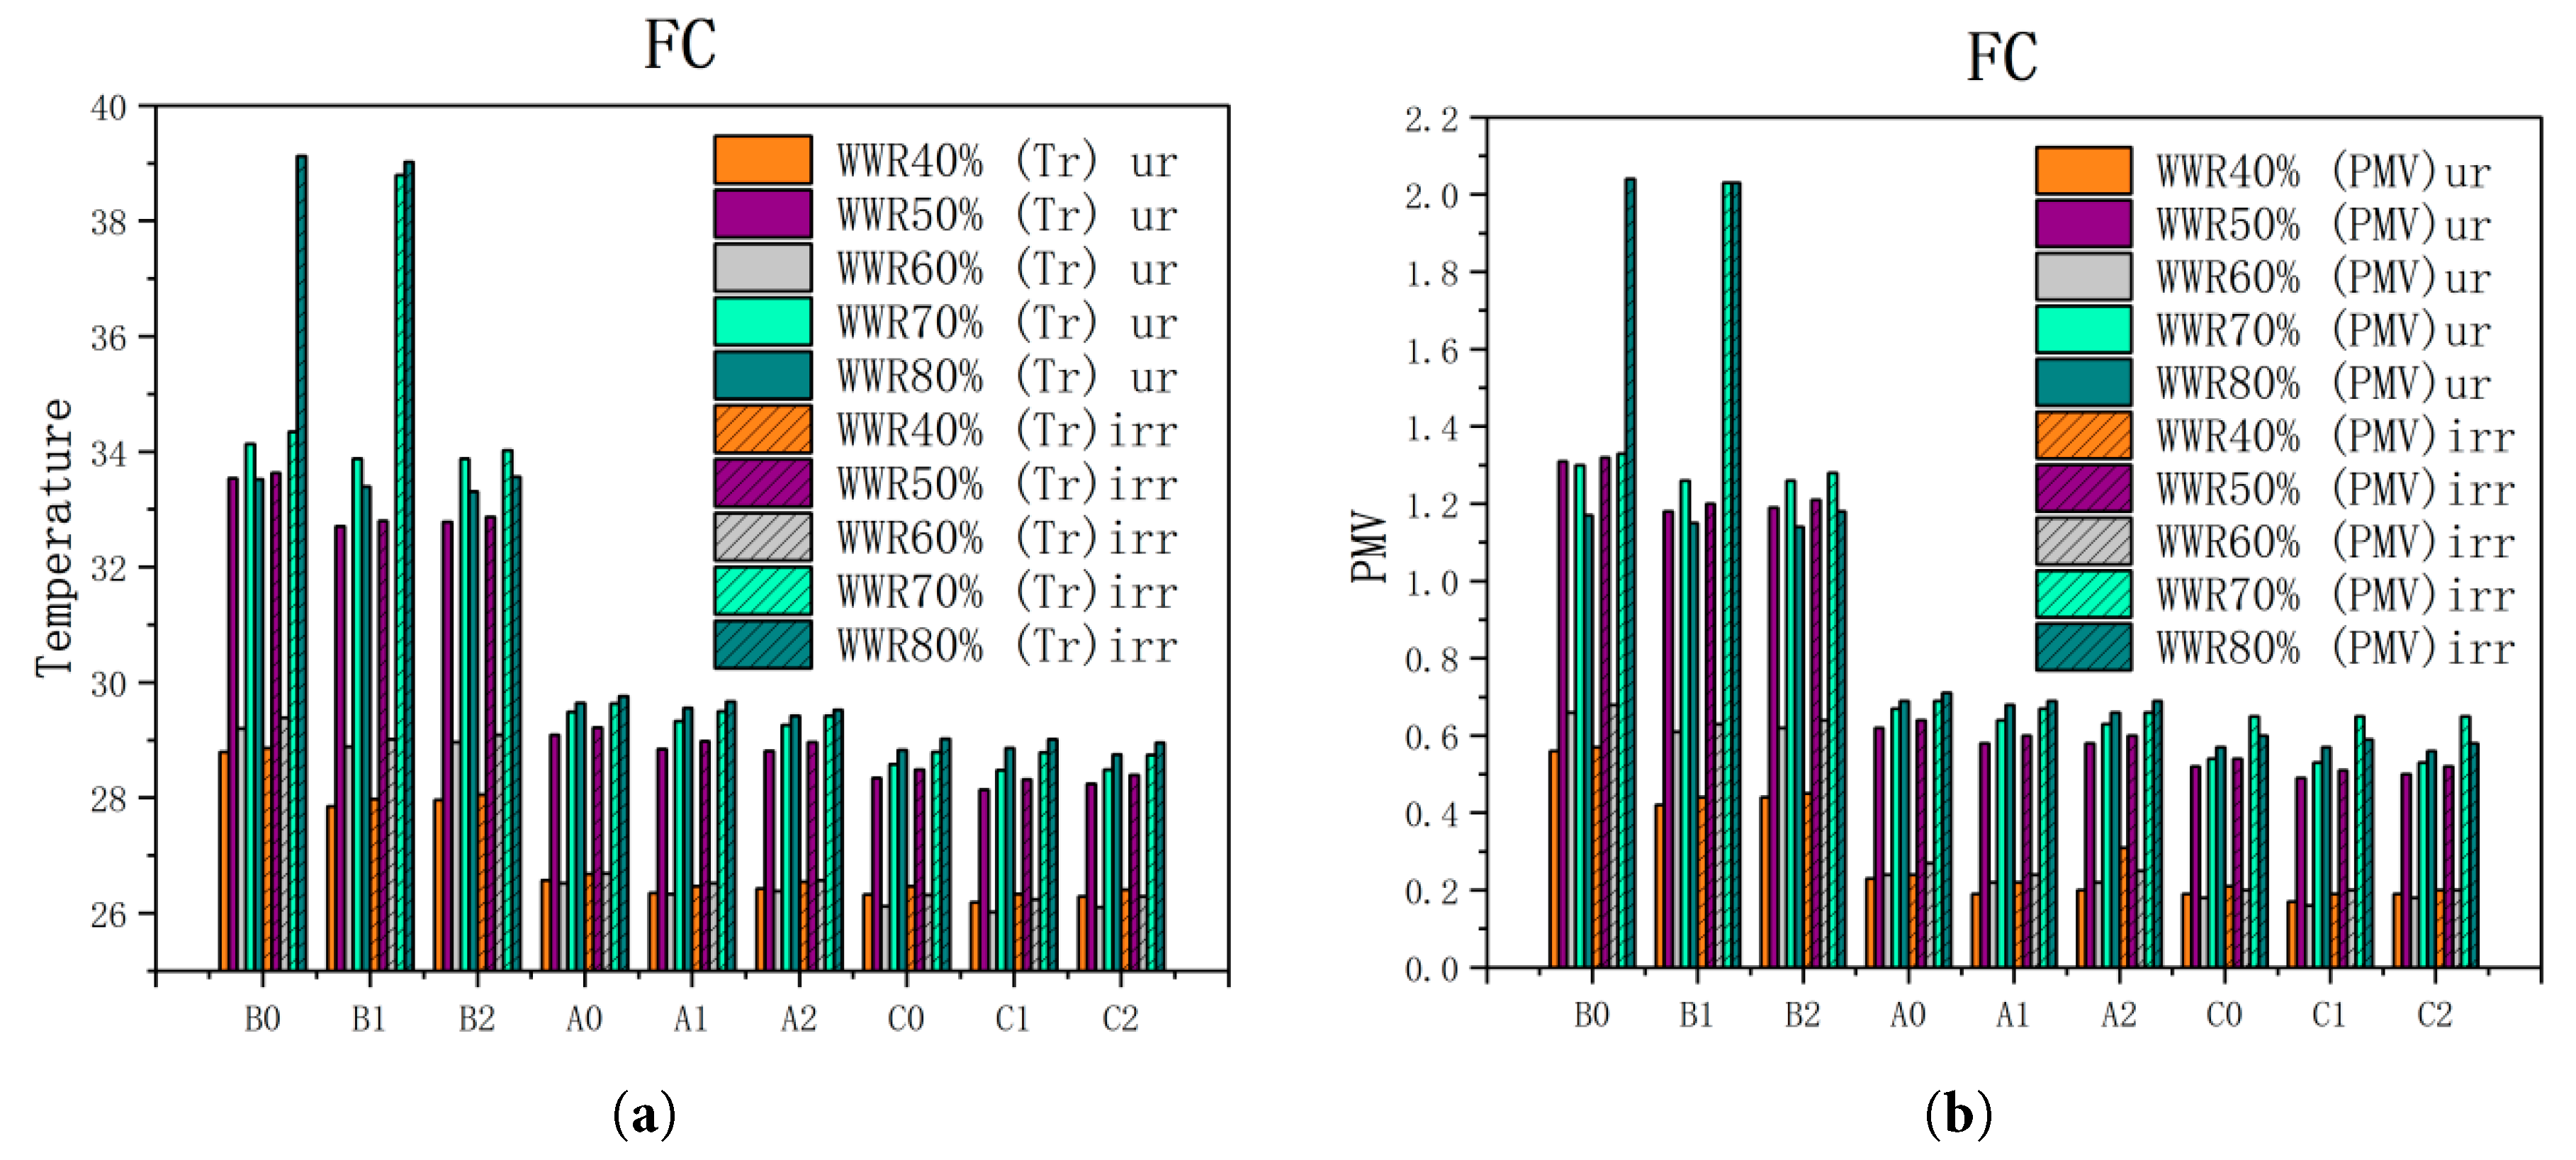
Figure 19: Comparison of data at different positions for the FC system at 18:00, with and without the additional increment caused by solar radiation included in the calculation: (a) Mean Radiant Temperature; (b) PMV.
As shown in Fig. 18, under (FR+FC), ΔTr at Bn ranges from 0.07°C to 5.23°C; at An, it ranges from 0.12°C to 0.28°C; and at Cn, it ranges from 0.12°C to 0.29°C. The (PMV)irr values increase by 0.01 to 0.77 compared with the (PMV)ur values, and the comfort level at different distances from the window reveal depth transitions from “neutral” to “slightly warm” and from “slightly warm” to “warm”. At Bn, located at a distance of 0.60 m from the window reveal depth, the (PMV)irr values range from 0.28 to 1.50, indicating thermal discomfort within the radiant zone. Meanwhile, at An (4.27 m) and Cn (6.89 m) from the window reveal depth, the (PMV)irr values range from 0.06 to 0.37, indicating a comfort level between “neutral” and “slightly warm”, within the comfort range. Under a 60% WWR condition, the mean radiant temperature at B1 increases by 4.17°C, the PMV value increases by 0.61 units, and the comfort level changes from comfortable to uncomfortable because B1 is within the radiant zone. Similarly, under a 70% WWR condition, the mean radiant temperature at B1 increases by 5.23°C, the PMV value increases by 0.77 units, and the comfort level changes from comfortable to uncomfortable because B1 is within the radiant zone.
As shown in Fig. 19, under the (FC) condition, local PMV values exhibit significant spatial gradients with WWR: at 80% WWR, ΔTr at Bn ranges from 0.07°C to 5.63°C; at An, it ranges from 0.11°C to 0.19°C; and at Cn, it ranges from 0.12°C to 0.30°C. The (PMV)irr values increase by 0.01 to 0.88 compared with the (PMV)ur values. At Bn, located at a distance of 0.60 m from the window reveal depth, the (PMV)irr values range from 0.44 to 2.04, indicating that the comfort level worsens as the WWR increases. Meanwhile, at An (4.27 m) and Cn (6.89 m) from the window reveal depth, the (PMV)irr values range from 0.19 to 0.69, indicating a comfort level between “neutral” and “slightly warm”, within the comfort range. Under a 70% WWR condition, the mean radiant temperature at B1 increases by 4.91°C, the PMV value increases by 0.77 units, indicating thermal discomfort, as B1 is within the radiant zone. Under an 80% WWR condition, the mean radiant temperature at B0 and B1 increases by 5.60°C and 5.63°C, respectively. The PMV values increase by 0.87 and 0.88 units, the PMV at B0 (0.6 m from window) reaches 1.26 (transiently exceeding Level-II), which is 0.89 higher than the PMV at C0 (6.89 m from window, 0.37). By contrast, FR+FC mitigates this gradient: even at 80% WWR, the PMV difference between B0 (0.83) and C0 (0.25) is only 0.58, confirming FR+FC’s superiority in improving comfort uniformity.
On the basis of the comprehensive analysis of the above data, the following conclusions can be drawn: The experiment confirmed that both systems maintained overall indoor comfort within the acceptable range (PMV: −1.0 to +1.0). However, spatial variations in comfort (assessed via local PMV) were significant: Under FC systems, local PMV near windows (0.6 m) exceeded the comfort range at high WWR (80%), indicating poor handling of radiant loads in irradiated zones; Under FR+FC systems, local PMV remained within the comfort range across all WWRs, demonstrating better adaptability to spatial load disparities caused by WWR. This framing clarifies that local PMV values are compared within the context of overall comfort, highlighting system-specific strengths in managing spatial comfort variations rather than absolute comfort failure. Under the two cooling supply systems, the main reason for overheating in different conditions is the increase in direct solar radiation from west-facing windows as the outdoor temperature rises, exacerbated by the presence of large glass areas and lack of shading. In the (FR+FC) system, the thermal storage characteristics of the walls lead to a smaller indoor cooling load at night, with the building envelope structure storing cold and releasing it during the day when there is a greater heat gain and larger cooling load, helping to maintain indoor temperatures. However, in the (FC) system, the convective method of handling radiant loads is inefficient, and there is a lack of sufficient cooling capacity to buffer the sudden increase in indoor cooling load. With a larger WWR, direct solar radiation from the west becomes the main issue, leading to most of the overheating occurring during a specific time period in the afternoon (14:00–18:30). Therefore, under a high WWR, the indoor thermal environment in the (FC) system is poor and may lead to thermal discomfort.
3.3 System Operation Energy Consumption Analysis
Before analyzing energy consumption trends, it is confirmed that both systems have achieved the expected overall indoor environment (median temperature close to setpoints, overall PMV within comfort range)—this ensures energy comparisons reflect system efficiency, not inadequate temperature control.
Fig. 20 shows the energy consumption of different cooling supply systems at varying WWRs. As shown in the figure, under the (FR+FC) system, the cooling energy consumption decreases as the WWR increases. When the WWR is 40%, the daily average solar radiation on the west-facing windows is 109.69 W/m2, with a daily cumulative energy consumption of 40.60 kW·h. When the WWR is 80%, the daily average solar radiation on the west-facing windows is 60.47 W/m2, with a daily cumulative energy consumption of 31.41 kW·h, resulting in a 29.26% reduction in energy consumption. By contrast, under the (FC) system, the cooling energy consumption increases as the WWR increases. When the WWR is 40%, the daily average solar radiation on the west-facing windows is 93.15 W/m2, with a daily cumulative energy consumption of 33.70 kW·h. When the WWR is 80%, the daily average solar radiation on the west-facing windows is 119.24 W/m2, with a daily cumulative energy consumption of 36.10 kW·h, resulting in a 7.11% increase in energy consumption.
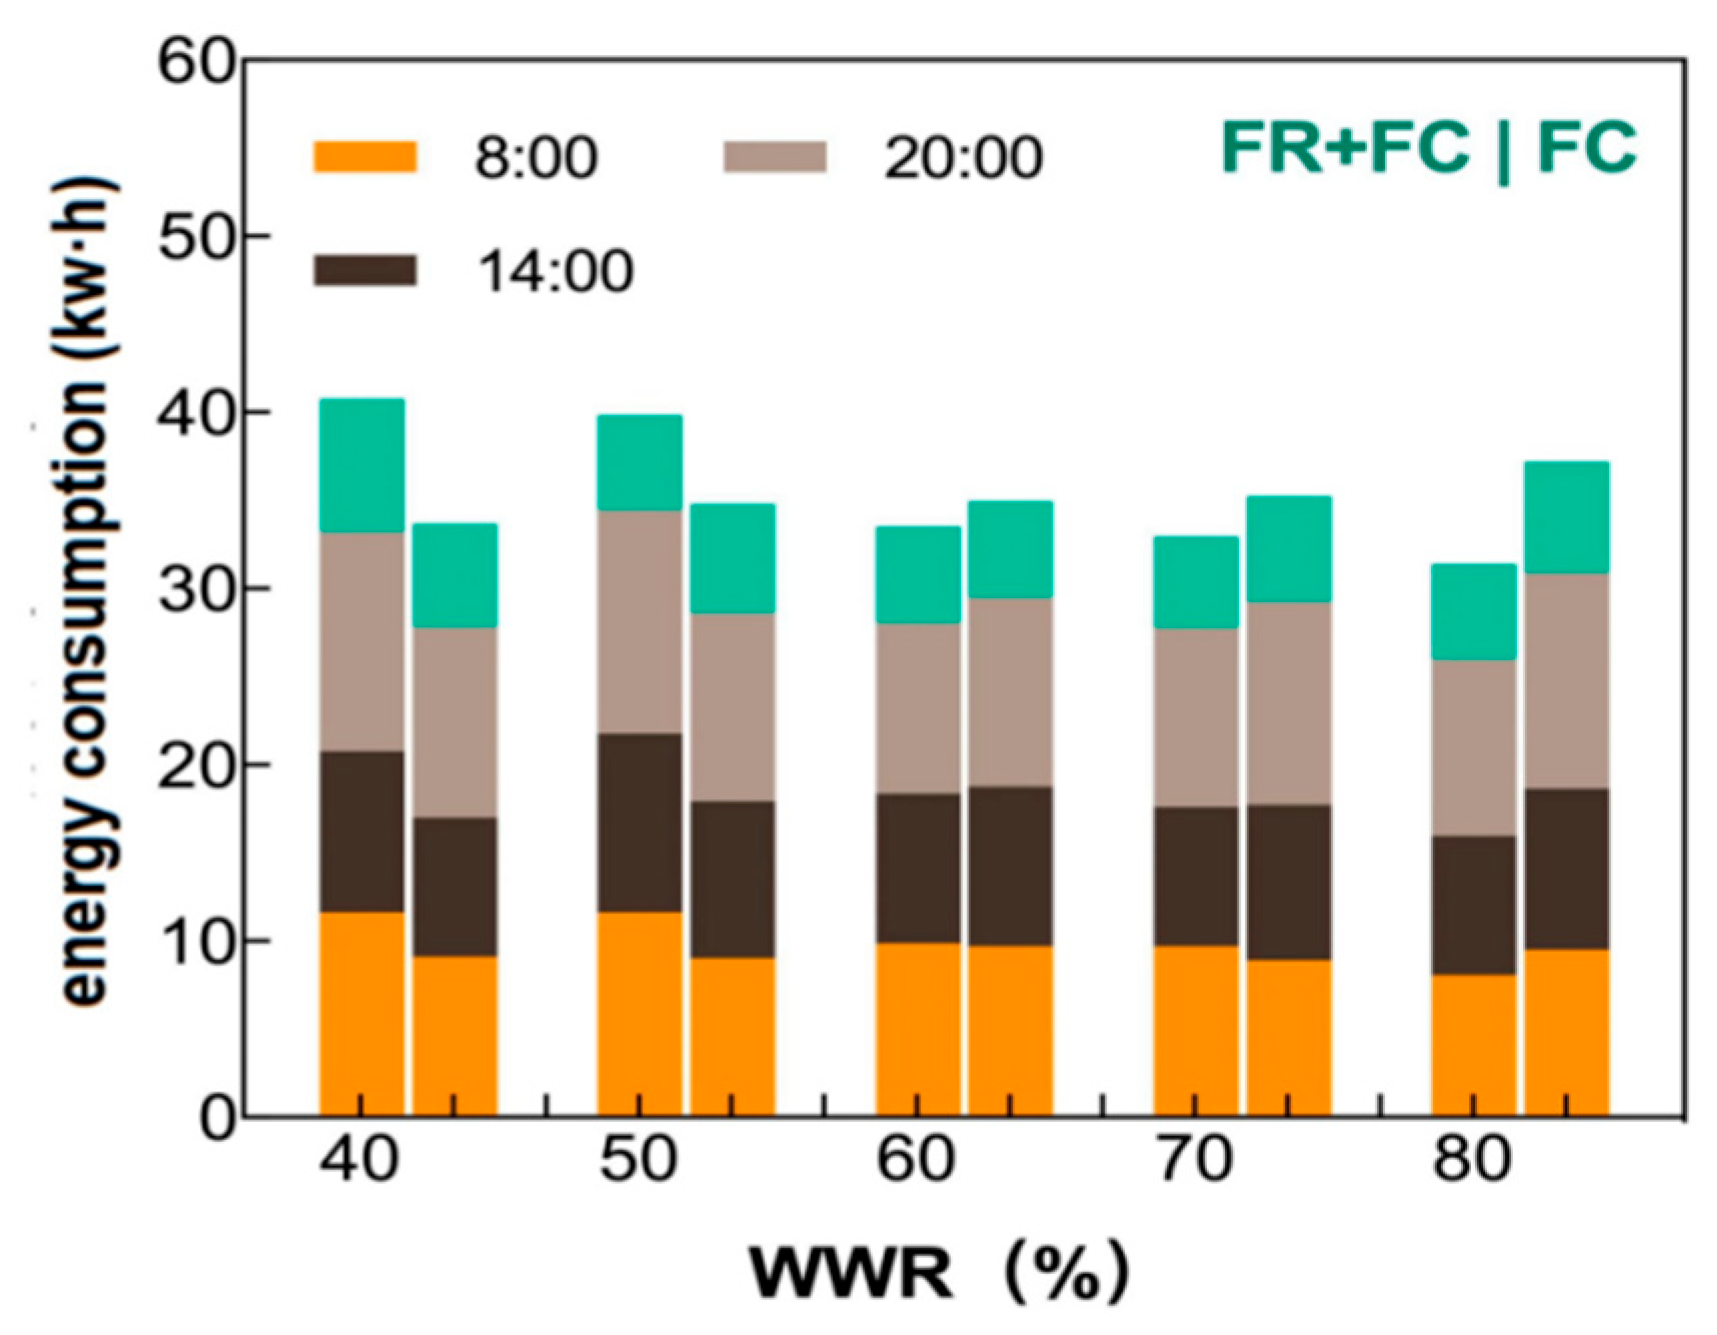
Figure 20: Daily energy consumption of each cooling system under different WWRs.
At the same time, when the WWR is 40% and 50%, the cooling energy consumption of the (FR+FC) system exceeds that of the (FC) system, while at other WWRs, the cooling energy consumption of the (FC) system is higher than that of the (FR+FC) system. This difference is due to the fact that at WWRs of 40% and 50%, the indoor temperature reaches the design temperature faster under the convective method than the floor radiant system. When the convective and radiant systems are used in combination, the response time of the system can be improved, ensuring continuous cooling from the room floor and the top fan coil unit to achieve optimal indoor comfort. However, when the outdoor weather conditions are consistent and the main chilled water supply temperature is constant, the cooling energy consumption of the (FR+FC) system exceeds that of the (FC) system. In the outdoor weather conditions that vary at different WWRs (60%, 70%, and 80%), the solar exposure on the west-facing windows leads to higher outdoor temperatures under the (FC) system compared with the (FR+FC) system, increasing its cooling energy consumption.
On the basis of the above data, the following conclusion can be drawn: when the outdoor weather conditions remain consistent, the cooling energy consumption of the (FR+FC) system is higher than that of the (FC) system. Glass does not have thermal storage characteristics, and at a small WWR, the area of opaque envelope structures is large. When the outdoor temperature decreases and the indoor cooling load decreases, the opaque envelope structures store cooling energy, resulting in high energy consumption for cooling at a small WWR. Given that the summer continuous experimental research began with a large WWR, the daily average solar radiation is high at a small WWR as the outdoor temperature and solar radiation increase during the cooling period. Even at a small WWR, the impact of solar radiation on the system’s energy consumption is substantial, making the summer indoor shading system crucial. Notably, the energy consumption comparisons in this study were conducted under conditions where overall indoor temperatures were maintained near setpoints, but localized transient overheating occurred under high WWR in FC systems. This may have slightly inflated FC energy consumption data during peak loads. FR+FC reduces cooling energy consumption with increasing WWR (29.26% reduction at 80% vs. 40% WWR) while maintaining the expected overall indoor environment—even with minor localized temperature deviations, which have a negligible impact on long-term energy trends. Future studies could enhance control precision to minimize such deviations, providing more stringent energy consumption comparisons.
The cooling performance coefficients of each cooling system under different window and wall ratios are illustrated in Fig. 21. In the (FR+FC), the operational coefficient of performance (COP) ranges from 2.30 to 3.30, 2.70 to 3.50, 2.70 to 3.70, 2.90 to 3.70, and 2.50 to 3.60 for WWRs of 40%, 50%, 60%, 70%, and 80%, respectively. The average hourly COP values are found to be approximately 2.90, 3.04, 3.25, 3.38, and 3.05 for the respective WWRs. The (FC) exhibits an operating COP range of 2.4~3.30, 2.30~3.20, 2.50~3.40, 2.50~3.50, 2.30~3.50, and 2.30~3.50, respectively for WWRs of 40%, 50%, 60%, 70%, and 80%. The average hourly COP values are recorded as follows: 2.89, 2.83, 2.98, 3.03, and 2.94.
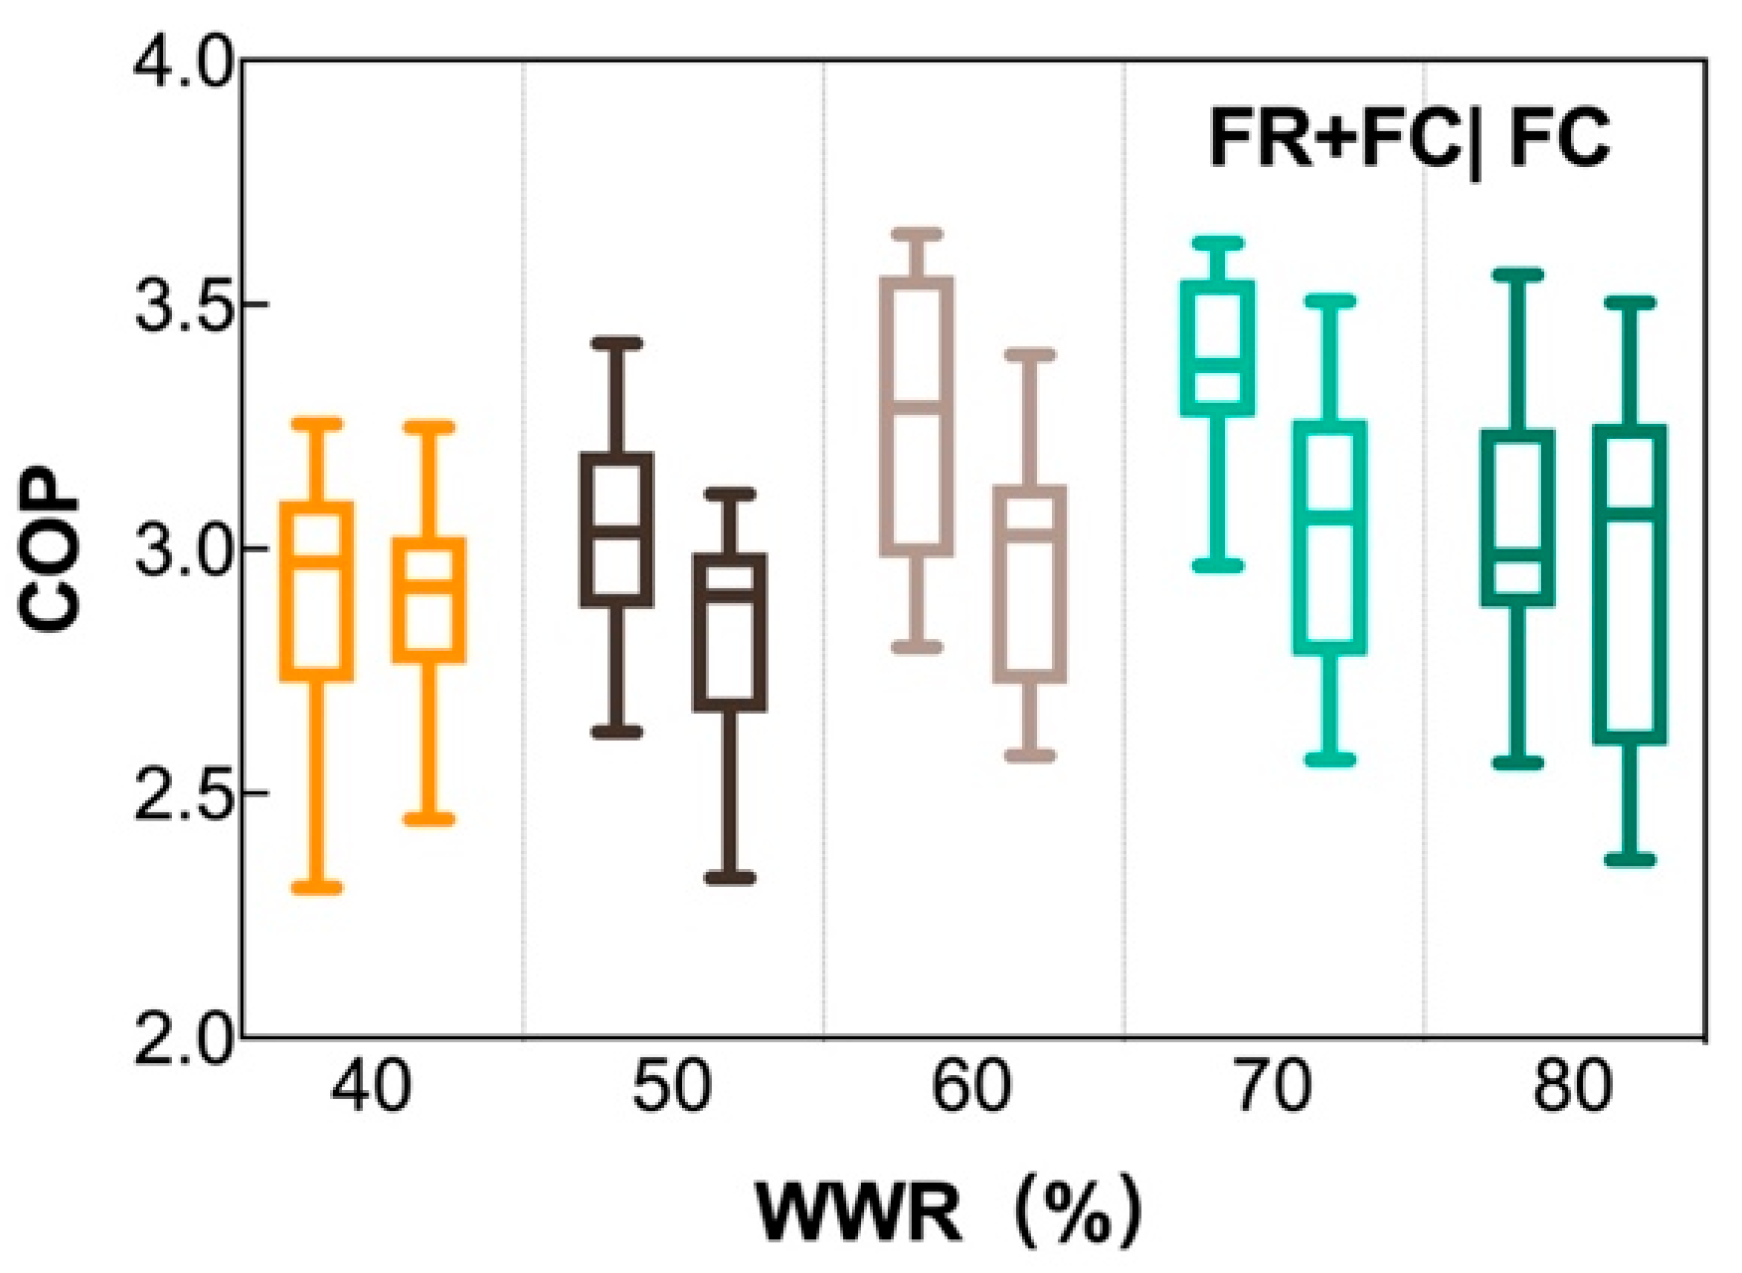
Figure 21: Heating performance coefficient of each cooling system under different WWRs.
Based on the comprehensive analysis of the above data, regardless of the operating conditions, the average hourly cooling performance coefficient of the (FR+FC) system is higher than that of the (FC) system. Therefore, the use of the (FR+FC) system can improve the energy utilization efficiency of the system.
This article selects experiments with similar outdoor air conditions in the summer to study the impact of WWR on the indoor temperature and humidity, vertical temperature distribution at different distances from the window, overall and local (at different distances from the window) thermal comfort, and the energy consumption of two cooling systems: (FC) and (FR+FC). The following conclusions are drawn:
- 1.Increasing the WWR results in a wide range of indoor temperature fluctuations. The indoor temperature fluctuations are more considerable and unstable in the (FC) system. However, under the influence of the fan coil unit, the dehumidification is sustained and stable, maintaining consistent changes in air relative humidity. Although the core mechanisms are generalizable, quantitative results are specific to the studied conditions, and conclusions regarding FC system performance may be affected by transient overloads, and that FR+FC conclusions depend on the specific control strategy employed.
- 2.Increasing the WWR leads to a decrease in floor surface temperature. For FC systems, temperature fluctuations on the upper and western walls intensify with WWR, and the affected areas expand northward. For FR+FC systems, this trend is mitigated—but the extent of mitigation depends on the system’s control logic: the closed-loop water mixing control used in this experiment ensures floor surface temperature remains above the dew point while reducing fluctuations. Alternative control strategies may result in different floor temperature trends.
- 3.As the WWR increases, the perceived thermal comfort tends to be “slightly warmer”. For (FR+FC) and (FC), the fluctuation range of overall indoor PMV values is 0.20–0.76 and 0.25–0.90, respectively, with each working condition falling within the comfortable range (−1.0–+1.0). However, FR+FC improves comfort uniformity compared to FC. Although the core mechanisms are generalizable, quantitative results are specific to the studied conditions, and conclusions regarding FC system performance may be affected by transient overloads, and that FR+FC conclusions depend on the specific control strategy employed.
- 4.Thermal stratification occurs in the room, resulting in a pronounced vertical temperature gradient as the distance from the window decreases. However, FR+FC improves comfort uniformity compared to FC. When solar radiation is not considered, both cooling systems exhibit decreased comfort with increasing WWR and decreasing distance from the window. Considering solar radiation reveals discomfort in the radiative zone, particularly for Bn with a large window wall exposed to external radiation. An and Cn remain within a comfortable range.
- 5.FR+FC reduces cooling energy consumption with increasing WWR (29.26% reduction at 80% vs. 40% WWR) while maintaining the expected overall indoor environment—even with minor localized temperature deviations, which have a negligible impact on long-term energy trends. Moreover, the cooling energy consumption of the (FR+FC) is higher than that of the (FC). Additionally, the average hourly cooling performance coefficient of the (FR+FC) surpasses that of the (FC). Consequently, implementing (FR+FC) can enhance overall energy efficiency. Although the core mechanisms are generalizable, quantitative results are specific to the studied conditions, and conclusions regarding FC system performance may be affected by transient overloads, and that FR+FC conclusions depend on the specific control strategy employed.
- 6.The findings of this study provide practical guidance for the design and operation of cooling systems in office buildings, particularly in the context of balancing architectural aesthetics and energy efficiency. For west-facing office buildings in hot-summer and cold-winter regions, the study recommends that if buildings requiring higher WWR, the convective–radiant combined cooling system is strongly suggested, as it reduces cooling energy consumption by up to 29.26% compared to FC systems at high WWR, while maintaining acceptable thermal comfort. The research clarifies that FR+FC systems are more suitable for environments with intense solar radiation due to their superior ability to handle radiant loads. This helps architects and engineers make informed decisions: FC systems may be preferred for small WWR (≤50%) where convective loads dominate, while FR+FC systems are optimal for large WWR to mitigate radiation-induced discomfort and energy waste. By demonstrating that FR+FC systems reduce energy consumption as WWR increases, the study highlights a pathway to achieve both high transparency and low energy use—aligning with global trends toward sustainable building design.
- 7.The experiment was conducted in Mianyang, a representative city in China’s hot-summer and cold-winter climate zone. Regions with comparable summer solar radiation patterns will likely benefit from the findings. These areas share key features with Mianyang: intense west-facing solar radiation during afternoons (14:00–18:00), which dominates indoor cooling loads. In such regions, FR+FC systems will similarly outperform FC systems in managing radiation-induced comfort issues and energy consumption at high WWR. Limitations in other climate zones: Tropical regions with year-round high humidity and diffused solar radiation, the priority shifts to dehumidification. FC systems may retain advantages in humidity control, and the energy-saving effect of FR+FC at high WWR may be weakened due to persistent latent loads; Cold climates winter heating is the primary concern, and large WWR can reduce heating energy by utilizing solar gain. The conclusions on summer cooling may not directly apply, as the trade-off between winter solar gain and summer radiation load differs; Mild climates with lower summer radiation intensity, the performance gap between FR+FC and FC systems at high WWR may narrow, and WWR optimization can be more flexible.
Acknowledgement:
Funding Statement: This work was supported by the Open Fund (Nos. 202303 and 202304) of the Sichuan Province Engineering Technology Research Center of Healthy Human Settlement, and Key Research and Development Program of Sichuan Province (2022YFG0138) and also supported by Postgraduate Innovation Fund Project by Southwest University of Science and Technology (25ycx1084).
Author Contributions: The authors confirm contribution to the paper as follows: Dong Liu: experimental test, writing—review & editing, supervision. Runze Zhang: writing—original draft, experimental test. Anjie Hu: editing, supervision. Na Liu: editing, supervision. Xiaozhou Wu: acquisition and analysis of data. Liu Tang: guiding, supervision. Jun Wang: guiding, supervision. All authors reviewed the results and approved the final version of the manuscript.
Availability of Data and Materials: The data that support the findings of this study are available from the corresponding author upon reasonable request.
Ethics Approval: Not applicable.
Conflicts of Interest: The authors declare no conflicts of interest to report regarding the present study.
Nomenclature
| ASHP | Air source heat pump | HVAC | Heating, ventilation and air conditioning |
| FC | Fan coil convection system | FR+FC | Convective–radiant combined cooling system |
| RF | Radiant floor system | PMV | Predicted mean vote |
| | Percentage of dissatisfaction | | Thickness of aluminum foil insulation cotton |
| | Thermal conductivity of aluminum foil thermal insulation cotton | | Heat transfer coefficient of double hollow tempered glass |
| | Heat transfer coefficient of the exterior wall | | Dimensionless value of the vertical temperature |
| | Maximum value of the vertical temperature (°C) | | Minimum value of the vertical temperature (°C) |
| | Vertical temperature value at this time point and measurement location (°C) | | Hourly electric power consumption of the ASHP ( |
| Specific heat capacity of water, 4.2 × 10³ | | Density of water ( | |
| | Water flow of the ASHP (Pa) | | ASHP water supply temperature, (°C) |
| ASHP water return temperature (°C) | | Boltzmann’s constant ( | |
| | Azimuth angle between the human body and the solar radiation beam | | Height angle between the body and the beam of solar radiation |
| Coefficients of the polynomial algorithms for the case of seated persons | Angular coefficient of the i-th surface between the human body and the surrounding environment. | ||
| Temperature of the i-th surface in the surrounding environment (°C) | | Absorptivity of the human body for shortwave radiation | |
| Emissivity of the human body | | Number of transparent envelope structures | |
| | Angular coefficient between the human body and the j-th transparent envelope structure surface | | Scattered radiation entering the indoor environment through the j-th transparent envelope structure |
| Direct solar radiation on the subject | | Projected area factor | |
| Number of envelope structure surfaces involved | Surface reflectance of the i-th envelope structure | ||
| Convective heat exchange between the human body and the surroundings | Angular coefficient between the surface of the i-th envelope structure and the surface of the j-th transparent envelope structure | ||
| Mechanical work performed by the human body | Metabolic rate | ||
| Water vapor partial pressure surrounding the human body (Pa) | ta | Air temperature surrounding the human body (°C) | |
| Radiative heat exchange between the human body and the surroundings | MRT | mean radiative temperature |
References
1. Al-Masrani SM , Al-Obaidi KM , Zalin NA , Aida Isma MI . Design optimisation of solar shading systems for tropical office buildings: challenges and future trends. Sol Energy. 2018; 170: 849– 72. doi:10.1016/j.solener.2018.04.047. [Google Scholar] [CrossRef]
2. Sun Y , Wilson R , Wu Y . A review of Transparent Insulation Material (TIM) for building energy saving and daylight comfort. Appl Energy. 2018; 226: 713– 29. doi:10.1016/j.apenergy.2018.05.094. [Google Scholar] [CrossRef]
3. Zhao J , Du Y . Multi-objective optimization design for windows and shading configuration considering energy consumption and thermal comfort: a case study for office building in different climatic regions of China. Sol Energy. 2020; 206: 997– 1017. doi:10.1016/j.solener.2020.05.090. [Google Scholar] [CrossRef]
4. Grynning S , Time B , Matusiak B . Solar shading control strategies in cold climates–Heating, cooling demand and daylight availability in office spaces. Sol Energy. 2014; 107: 182– 94. doi:10.1016/j.solener.2014.06.007. [Google Scholar] [CrossRef]
5. Lai K , Wang W , Giles H . Solar shading performance of window with constant and dynamic shading function in different climate zones. Sol Energy. 2017; 147: 113– 25. doi:10.1016/j.solener.2016.10.015. [Google Scholar] [CrossRef]
6. Xue P , Li Q , Xie J , Zhao M , Liu J . Optimization of window-to-wall ratio with sunshades in China low latitude region considering daylighting and energy saving requirements. Appl Energy. 2019; 233–234: 62– 70. doi:10.1016/j.apenergy.2018.10.027. [Google Scholar] [CrossRef]
7. Hou M , Aviv D , Chatterjee A , Teitelbaum E , Rida M , Meggers F , et al. Resolving indoor shortwave and longwave human body irradiance variations for mean radiant temperature and local thermal comfort. Energy Build. 2023; 301: 113581. doi:10.1016/j.enbuild.2023.113581. [Google Scholar] [CrossRef]
8. Song B , Bai L , Yang L . Analysis of the long-term effects of solar radiation on the indoor thermal comfort in office buildings. Energy. 2022; 247: 123499. doi:10.1016/j.energy.2022.123499. [Google Scholar] [CrossRef]
9. Huang L , Zhai ZJ . Critical review and quantitative evaluation of indoor thermal comfort indices and models incorporating solar radiation effects. Energy Build. 2020; 224: 110204. doi:10.1016/j.enbuild.2020.110204. [Google Scholar] [CrossRef]
10. Marino C , Nucara A , Pietrafesa M . Mapping of the indoor comfort conditions considering the effect of solar radiation. Sol Energy. 2015; 113: 63– 77. doi:10.1016/j.solener.2014.12.020. [Google Scholar] [CrossRef]
11. Marino C , Nucara A , Pietrafesa M , Polimeni E . The effect of the short wave radiation and its reflected components on the mean radiant temperature: modelling and preliminary experimental results. J Build Eng. 2017; 9: 42– 51. doi:10.1016/j.jobe.2016.11.008. [Google Scholar] [CrossRef]
12. Li J , Zhai Z , Li H , Ding Y , Chen S . Climate change’s effects on the amount of energy used for cooling in hot, humid office buildings and the solutions. J Clean Prod. 2024; 442: 140967. doi:10.1016/j.jclepro.2024.140967. [Google Scholar] [CrossRef]
13. Xie X , Chen XN , Xu B , Pei G . Investigation of occupied/unoccupied period on thermal comfort in Guangzhou: challenges and opportunities of public buildings with high window-wall ratio. Energy. 2022; 244: 123186. doi:10.1016/j.energy.2022.123186. [Google Scholar] [CrossRef]
14. Khetib Y , Alotaibi AA , Alshahri AH , Rawa M , Cheraghian G , Sharifpur M . Impact of phase change material on the amount of emission in the double-glazed window frame for different window angles. J Energy Storage. 2021; 44: 103320. doi:10.1016/j.est.2021.103320. [Google Scholar] [CrossRef]
15. Ahmed AE , Suwaed MS , Shakir AM , Ghareeb A . The impact of window orientation, glazing, and window-to-wall ratio on the heating and cooling energy of an office building: the case of hot and semi-arid climate. J Eng Res. 2025; 13( 1): 409– 22. doi:10.1016/j.jer.2023.10.034. [Google Scholar] [CrossRef]
16. Ma R , Ma R , Long E . Analysis of the rule of window-to-wall ratio on energy demand of residential buildings in different locations in China. Heliyon. 2023; 9( 1): e12803. doi:10.1016/j.heliyon.2023.e12803. [Google Scholar] [CrossRef]
17. Kalaimathy K , Shanthi Priya R , Rajagopal P , Pradeepa C , Senthil R . Daylight performance analysis of a residential building in a tropical climate. Energy Nexus. 2023; 11: 100226. doi:10.1016/j.nexus.2023.100226. [Google Scholar] [CrossRef]
18. Zheng P , Wu H , Liu Y , Ding Y , Yang L . Thermal comfort in temporary buildings: a review. Build Environ. 2022; 221: 109262. doi:10.1016/j.buildenv.2022.109262. [Google Scholar] [CrossRef]
19. Atienza Márquez A , Cejudo López JM , Fernández Hernández F , Domínguez Muñoz F , Carrillo Andrés A . A comparison of heating terminal units: fan-coil versus radiant floor, and the combination of both. Energy Build. 2017; 138: 621– 9. doi:10.1016/j.enbuild.2016.12.092. [Google Scholar] [CrossRef]
20. Boyano A , Hernandez P , Wolf O . Energy demands and potential savings in European office buildings: case studies based on EnergyPlus simulations. Energy Build. 2013; 65: 19– 28. doi:10.1016/j.enbuild.2013.05.039. [Google Scholar] [CrossRef]
21. Kim MK , Leibundgut H . A case study on feasible performance of a system combining an airbox convector with a radiant panel for tropical climates. Build Environ. 2014; 82: 687– 92. doi:10.1016/j.buildenv.2014.10.012. [Google Scholar] [CrossRef]
22. Song D , Kim T , Song S , Hwang S , Leigh SB . Performance evaluation of a radiant floor cooling system integrated with dehumidified ventilation. Appl Therm Eng. 2008; 28 (11–12): 1299– 311. doi:10.1016/j.applthermaleng.2007.10.020. [Google Scholar] [CrossRef]
23. Jiang T , You S , Zhang H , Wei S , Liu H , Wang Y . Experimental study and thermo-economic analysis of a novel radiant-convective cooling system. Int J Refrig. 2021; 131: 505– 14. doi:10.1016/j.ijrefrig.2021.06.013. [Google Scholar] [CrossRef]
24. Salvalai G , Pfafferott J , Sesana MM . Assessing energy and thermal comfort of different low-energy cooling concepts for non-residential buildings. Energy Convers Manag. 2013; 76: 332– 41. doi:10.1016/j.enconman.2013.07.064. [Google Scholar] [CrossRef]
25. Zarrella A , De Carli M , Peretti C . Radiant floor cooling coupled with dehumidification systems in residential buildings: a simulation-based analysis. Energy Convers Manag. 2014; 85: 254– 63. doi:10.1016/j.enconman.2014.05.097. [Google Scholar] [CrossRef]
26. Liu D , Li G , Wu X , Wang J , Hu A , Yan Q , et al. Comparative analysis of heating characteristics of convective-radiant systems using various terminal air source heat pumps. Energy Build. 2023; 301: 113701. doi:10.1016/j.enbuild.2023.113701. [Google Scholar] [CrossRef]
27. Liu D , Zhou H , Hu A , Zhang Q , Liu N , Wen J . Study on the intermittent operation mode characteristic of a convection-radiation combined cooling system in office buildings. Energy Build. 2022; 255: 111669. doi:10.1016/j.enbuild.2021.111669. [Google Scholar] [CrossRef]
28. Liu D , Liu N , Ren D , Wu X , Wang J , Tian Y , et al. The thermal responses between young adults and preschool children in a radiant floor heating environment. Buildings. 2022; 12( 12): 2234. doi:10.3390/buildings12122234. [Google Scholar] [CrossRef]
29. Liu D , Liu N , Li G , Wu X , Wang J , Tian Y , et al. Energy efficiency and thermal comfort characteristics of convection–radiation combined cooling system in office buildings. J Mech Sci Technol. 2024; 38( 5): 2649– 60. doi:10.1007/s12206-024-0441-1. [Google Scholar] [CrossRef]
30. Möhlenkamp M , Schmidt M , Wesseling M , Wick A , Gores I , Müller D . Thermal comfort in environments with different vertical air temperature gradients. Indoor Air. 2019; 29( 1): 101– 11. doi:10.1111/ina.12512. [Google Scholar] [CrossRef]
31. La Gennusa M , Nucara A , Pietrafesa M , Rizzo G . A model for managing and evaluating solar radiation for indoor thermal comfort. Sol Energy. 2007; 81( 5): 594– 606. doi:10.1016/j.solener.2006.09.005. [Google Scholar] [CrossRef]
32. Liu Q , Li N , He Y , Pan J , Chen Y . Quantifying the effects of indoor non-uniform solar radiation on human thermal comfort and work performance in warm season. Energy Build. 2024; 306: 113962. doi:10.1016/j.enbuild.2024.113962. [Google Scholar] [CrossRef]
33. La Gennusa M , Nucara A , Pietrafesa M , Rizzo G , Scaccianoce G . Angle factors and projected area factors for comfort analysis of subjects in complex confined enclosures: analytical relations and experimental results. Indoor Built Environ. 2008; 17( 4): 346– 60. doi:10.1177/1420326x08094621. [Google Scholar] [CrossRef]
34. Özbey MF , Turhan C . The importance of the calculation of angle factors to determine the mean radiant temperature in temperate climate zone: a university office building case. Indoor Built Environ. 2022; 31( 4): 1004– 17. doi:10.1177/1420326x211046371. [Google Scholar] [CrossRef]
35. Li Z , Zhang D , Li C . Experimental evaluation of indoor thermal environment with modularity radiant heating in low energy buildings. Int J Refrig. 2021; 123: 159– 68. doi:10.1016/j.ijrefrig.2020.11.018. [Google Scholar] [CrossRef]
36. Causone F , Baldin F , Olesen BW , Corgnati SP . Floor heating and cooling combined with displacement ventilation: possibilities and limitations. Energy Build. 2010; 42( 12): 2338– 52. doi:10.1016/j.enbuild.2010.08.001. [Google Scholar] [CrossRef]
Cite This Article
 Copyright © 2025 The Author(s). Published by Tech Science Press.
This work is licensed under a Creative Commons Attribution 4.0 International License , which permits unrestricted use, distribution, and reproduction in any medium, provided the original work is properly cited.
 Downloads
 Citation Tools