
 Submit a Paper
 Propose a Special lssue
 Open Access
ARTICLE

Large-Volume Hydraulic Fracturing in Tight Gas Reservoirs: High-Efficiency Stimulation and Geological Adaptability Assessment
1 Changqing Oilfield Sulige South Operation Branch Company, Ordos, Inner Mongolia, 016200, China
2 School of Petroleum Engineering, Yangtze University, Wuhan, 430100, China
3 Changqing Training Center, Qingyang, 745217, China
* Corresponding Author: Zongfa Li. Email:
(This article belongs to the Special Issue: Multiphase Fluid Flow Behaviors in Oil, Gas, Water, and Solid Systems during CCUS Processes in Hydrocarbon Reservoirs)
Fluid Dynamics & Materials Processing 2025, 21(11), 2701-2719. https://doi.org/10.32604/fdmp.2025.067298
Received 29 April 2025; Accepted 06 August 2025; Issue published 01 December 2025
 View Full Text
 Download PDF
Abstract
Tight gas reservoirs are often characterized by pronounced heterogeneity and poor continuity, resulting in wide variability in production enhancement and net present value (NPV) for different geological parameter combinations (see e.g., the Ordos Basin). The conditions governing geological adaptability remain insufficiently defined. To address these challenges, this study integrates large-volume hydraulic fracturing, numerical production simulation, and economic evaluation to elucidate the mechanisms by which large-scale fracturing enhances fracture parameters in tight gas formations. The analysis reveals that, for identical proppant and fluid volumes, increasing the fracturing injection rate leads to longer and taller fractures. Over the same production period, this results in a more rapid decline in average reservoir pressure and a higher cumulative gas output. Through simulations conducted at varying injection rates across 11 production wells in the target block, the study demonstrates that large-volume fracturing can effectively connect otherwise isolated tight gas pockets, enlarge the drainage area, and substantially boost individual well production. A comparative assessment of simulation outcomes and economic performance shows that large-volume fracturing significantly improves gas recovery and NPV compared to conventional smaller-scale treatments. The study identifies the key geological indicators that influence differences in production enhancement and economic returns between small-and large-volume fracturing strategies. Based on these findings, a decision matrix is developed (utilizing a trapezoidal membership function) to evaluate the geological suitability of large-volume fracturing in tight gas reservoirs. This matrix is applied to the 11 target wells, with the evaluation results aligning well with those obtained from numerical simulations.Keywords
In the context of global energy transition and the push for low-carbon development, tight gas—an important type of unconventional natural gas—has attracted growing interest [1,2]. Due to its wide distribution and vast reserves, tight gas has become a vital part of the global energy supply. In areas experiencing rising energy demand, the exploitation of tight gas has made considerable strides, contributing significantly to energy security and economic development [3,4,5]. China is endowed with rich tight gas resources, representing about one-tenth of the global total, with considerable potential for future development. However, these resources are not evenly spread, mainly located in the Ordos Basin, Tarim Basin, and Sichuan Basin in the country’s northwest and southwest regions. The Ge gas field within the Ordos Basin is the largest natural gas field discovered in China so far and serves as a representative example of a heterogeneous, low-permeability reservoir [6,7,8,9]. Given its low permeability and porosity, hydraulic fracturing is frequently used to stimulate the reservoir and improve output. However, the intricate nature of tight sandstone formations means that the success of conventional stimulation methods is heavily dependent on geological factors, resulting in ccnconsistent performance across different settings [10,11,12,13].
Against this background, large-volume fracturing technology has emerged as a critical approach for enhancing the efficiency and productivity of tight gas extraction. This method involves injecting fluids at high pressure into rock layers to generate and extend fractures, thereby improving gas recovery. Compared to traditional fracturing approaches, large-volume fracturing offers notable benefits in terms of increasing well output and lowering operational costs [14,15]. Zou et al. introduced a strategy centered on large-scale hydraulic fracturing designed to create extended fractures in tight gas reservoirs, achieving considerable improvements in production [16]. Zhang et al., focusing on the low-porosity and low-permeability features of the Sulige gas field, conducted stimulation treatments. Their analysis led to the conclusion that large-scale hydraulic fracturing of vertical wells combined with staged fracturing of horizontal wells could effectively enhance reservoir performance [17]. Building on recent successes in tight oil development, Lei et al. proposed the concepts of fracture-controlled reserves and volume fracturing, adjusting stimulation strategies to ensure that fracturing replenishes formation energy through large-volume volumetric fracturing [18].
The Analytic Hierarchy Process (AHP) provides a systematic framework for evaluating post-fracturing productivity by constructing a multi-level evaluation system and quantifying the corresponding weights [19,20]. For instance, Li et al. integrated the radar area model with fuzzy AHP to assess shale gas wells, identifying eight key influencing factors, assigning appropriate weights, and establishing a comprehensive productivity evaluation model [21]. In the context of tight sandstone reservoirs, Zhang et al. applied AHP to integrate both geological and engineering “dual sweet spot” parameters, thereby guiding the selection of wells and layers for fracturing operations [22]. Compared to conventional approaches, AHP enables a more scientific allocation of weights across multiple indicators, facilitating the optimization of fracturing design. The fuzzy evaluation method complements AHP by building a comprehensive evaluation model that quantifies uncertain factors such as fracturing effectiveness and geological heterogeneity. When combined, these two methodologies enhance the objectivity and robustness of the evaluation by integrating subjective and objective elements.
In this study, a single-well numerical model is constructed using simulation software, based on the mechanical properties of the target block’s rock and the spatial distribution of natural fractures. The model is calibrated using dynamic data, such as fracturing pressure curves. A comparative analysis is then conducted to evaluate fracturing parameters—including fracture geometry, half-length, and conductivity—as well as production performance under varying fracturing fluid displacements. Furthermore, given the geological complexity of the tight gas reservoir in the study area, a numerical simulation model for vertical well fracturing and production forecasting is developed. Different fracturing fluid displacement scenarios are designed, using fracture characteristics and gas production dynamics as key evaluation indicators, to assess the suitability of large-volume fracturing under specific reservoir conditions. The ultimate objective is to improve the recovery rate and ensure long-term stable production in the Sulige South Gas Field.
The rock mechanical parameters and earth stress distribution of the target block in the Sulige South Gas Field are shown in Table 1. Based on the fracturing curves (Fig. 1), a numerical fracturing model was established using Petrel-Re software, with simulation results presented in Fig. 2. The fracturing fluid is a natural guar gum system with a friction gradient of 5.5–6.5 MPa/1000 m, a density of 1.01 g/cm3, and a static filtration coefficient of 5.742 × 10⁻⁴ m/min1/2. The filtration loss is governed by Carter’s equation:
The proppant comprises 20/40-mesh and 30/50-mesh ceramic particles. Settling velocity is modeled by Stokes’ law:
The simulated pressure curve fitting accuracy exceeds 85% (Fig. 3), which confirms the reliability of the model. The model has a top depth of 3800 m and spans a burial depth range from 3800 m to 4000 m, with an effective reservoir thickness of 82 m. Fracture height is constrained by stress contrast:
The reservoir exhibits low permeability, averaging 0.3 mD, with a gas saturation of 0.7 and porosity of approximately 0.1. The initial reservoir pressure is 38 MPa, and a constant bottom-hole flowing pressure of 25 MPa is maintained during production. Fluid flow in fractures follows continuity:
To reflect the confined nature of the tight gas reservoir and prevent boundary effects, closed (no-flow) boundary conditions were applied at all outer boundaries of the model domain. This is mathematically expressed as:
Table 1: Rock mechanics and earth stress parameters.
| Parameters | Numerical Value | Units |
|---|---|---|
| vertical stress gradient | 20.5 | KPa/m |
| horizontal maximum principal stress gradient | 16.0–17.7 | KPa/m |
| horizontal minimum principal stress gradient | 13.7–15.1 | KPa/m |
| young’s modulus | 29–37 | GPa |
| poisson’s ratio | 0.19–0.25 | v/v |
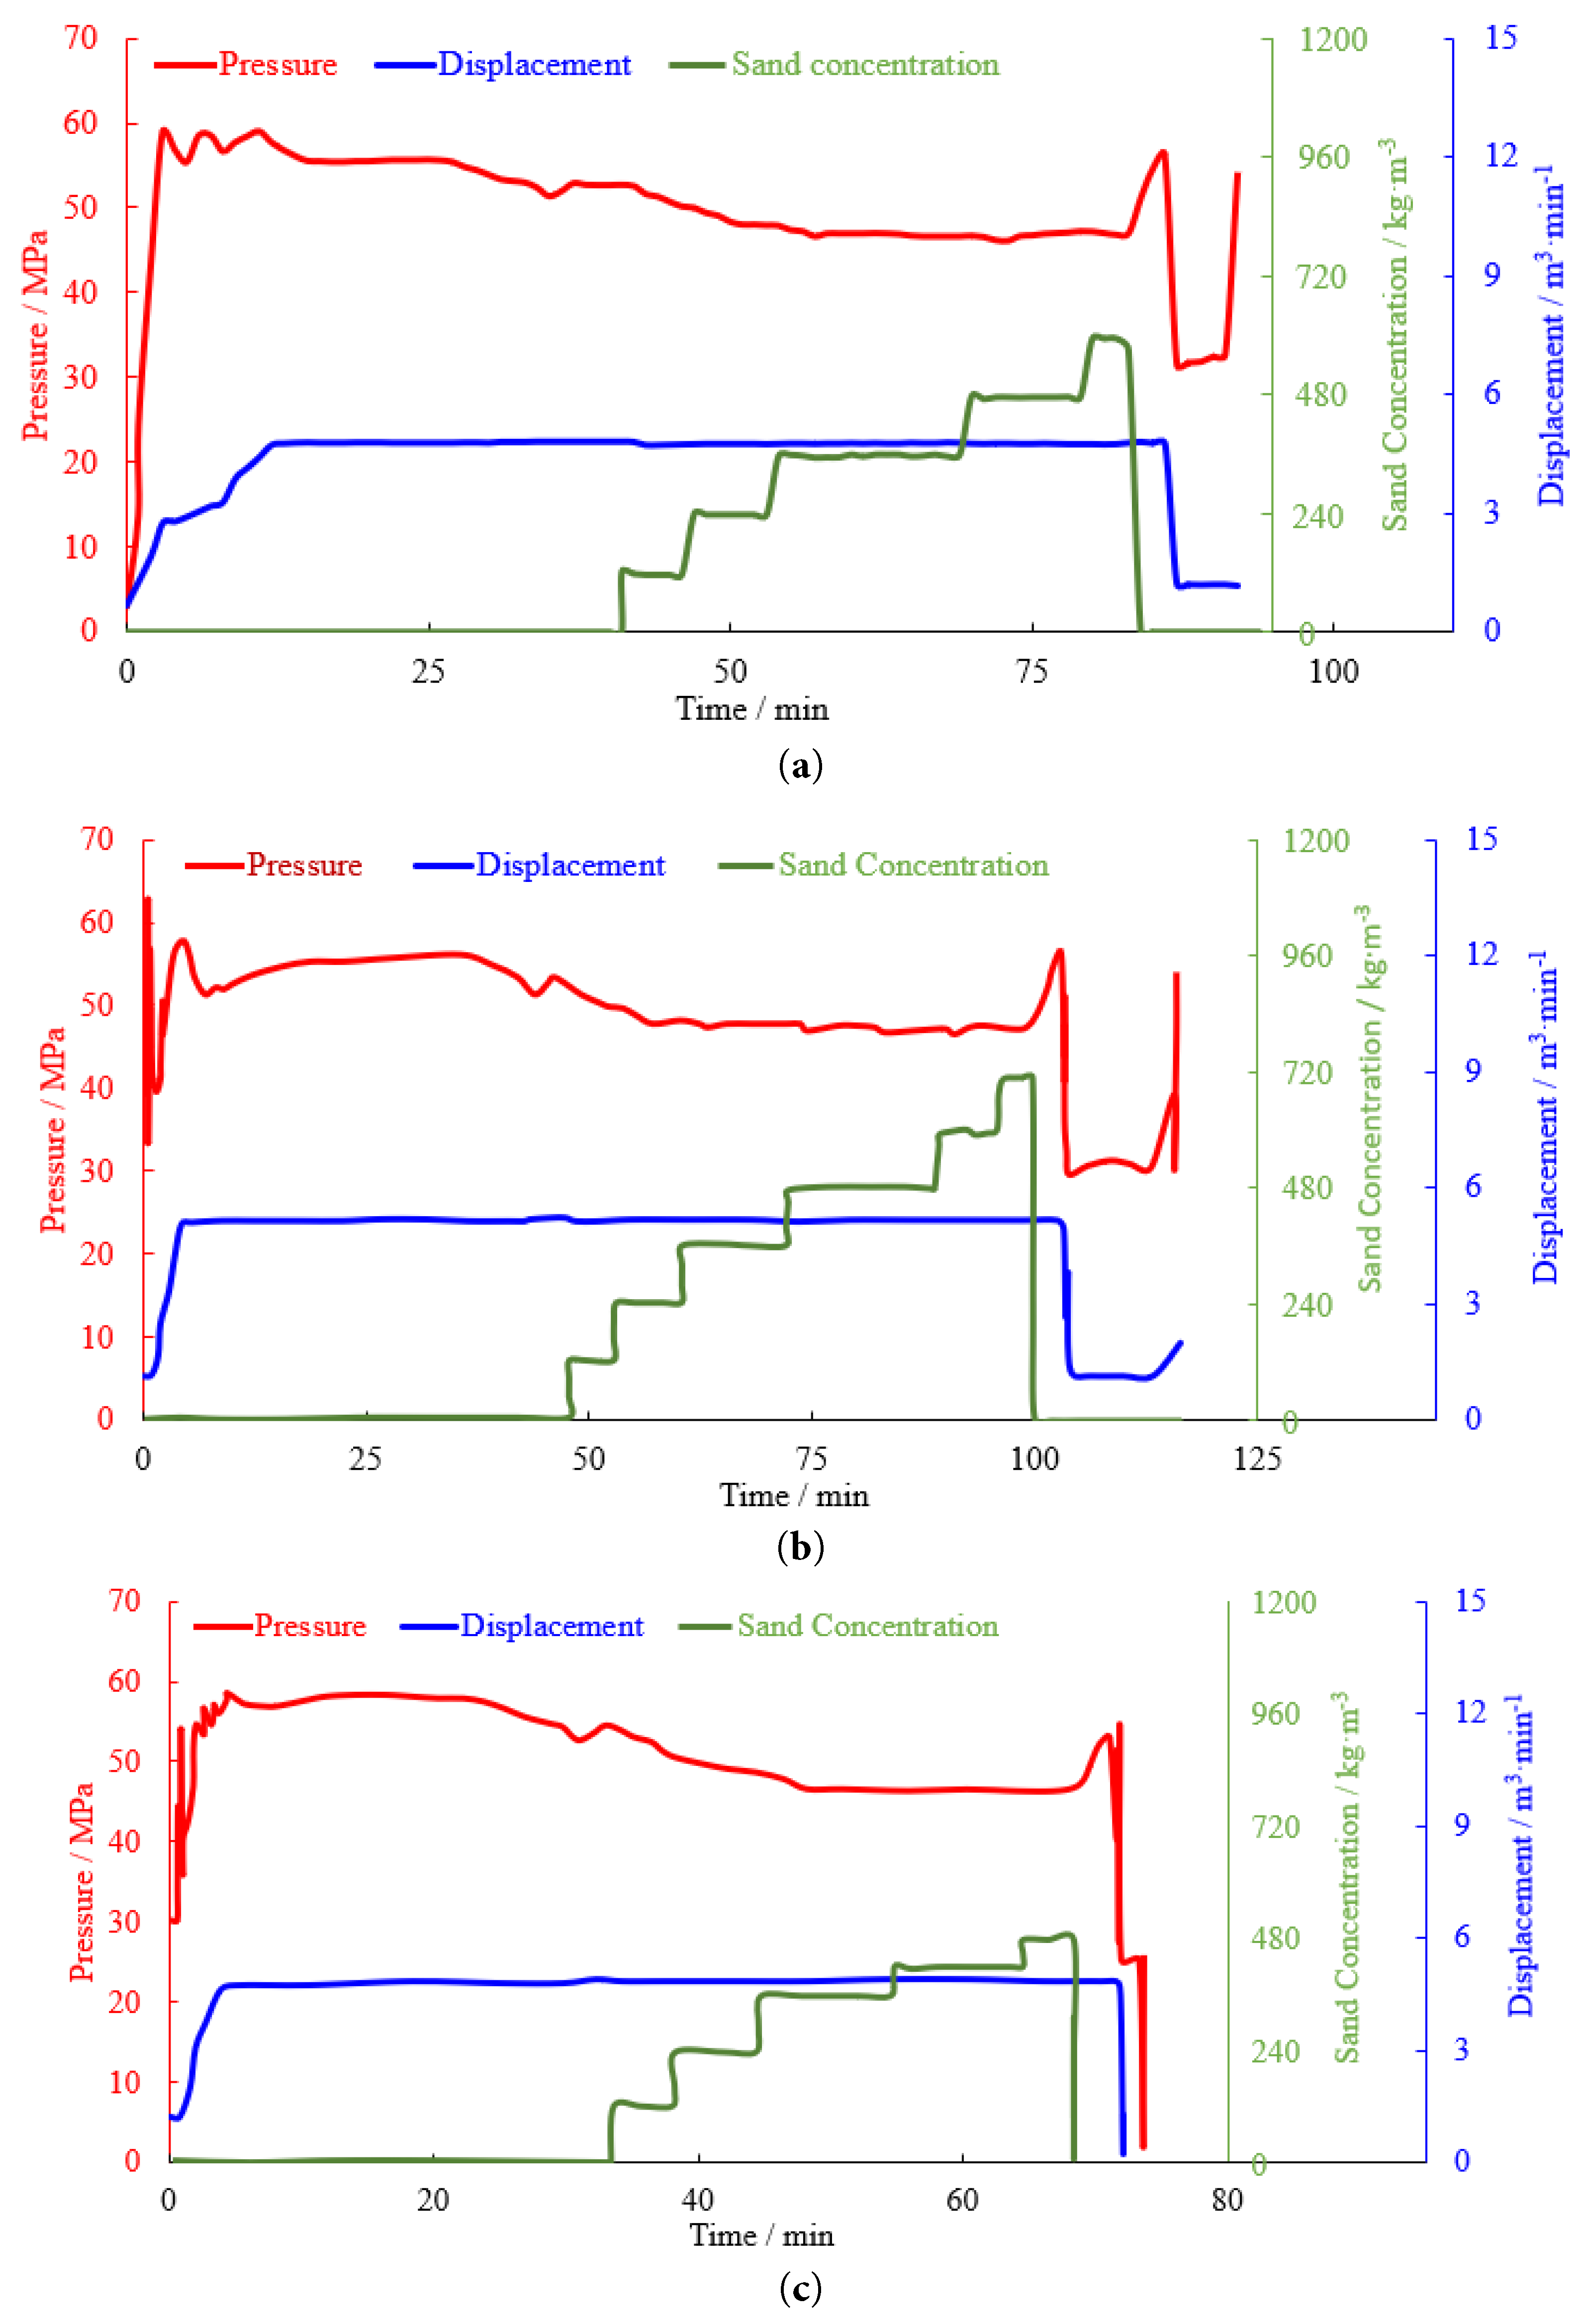
Figure 1: Fracturing construction curve. (a): Shan 1 Upper. (b): He 8 Lower. (c): He 8 Upper.
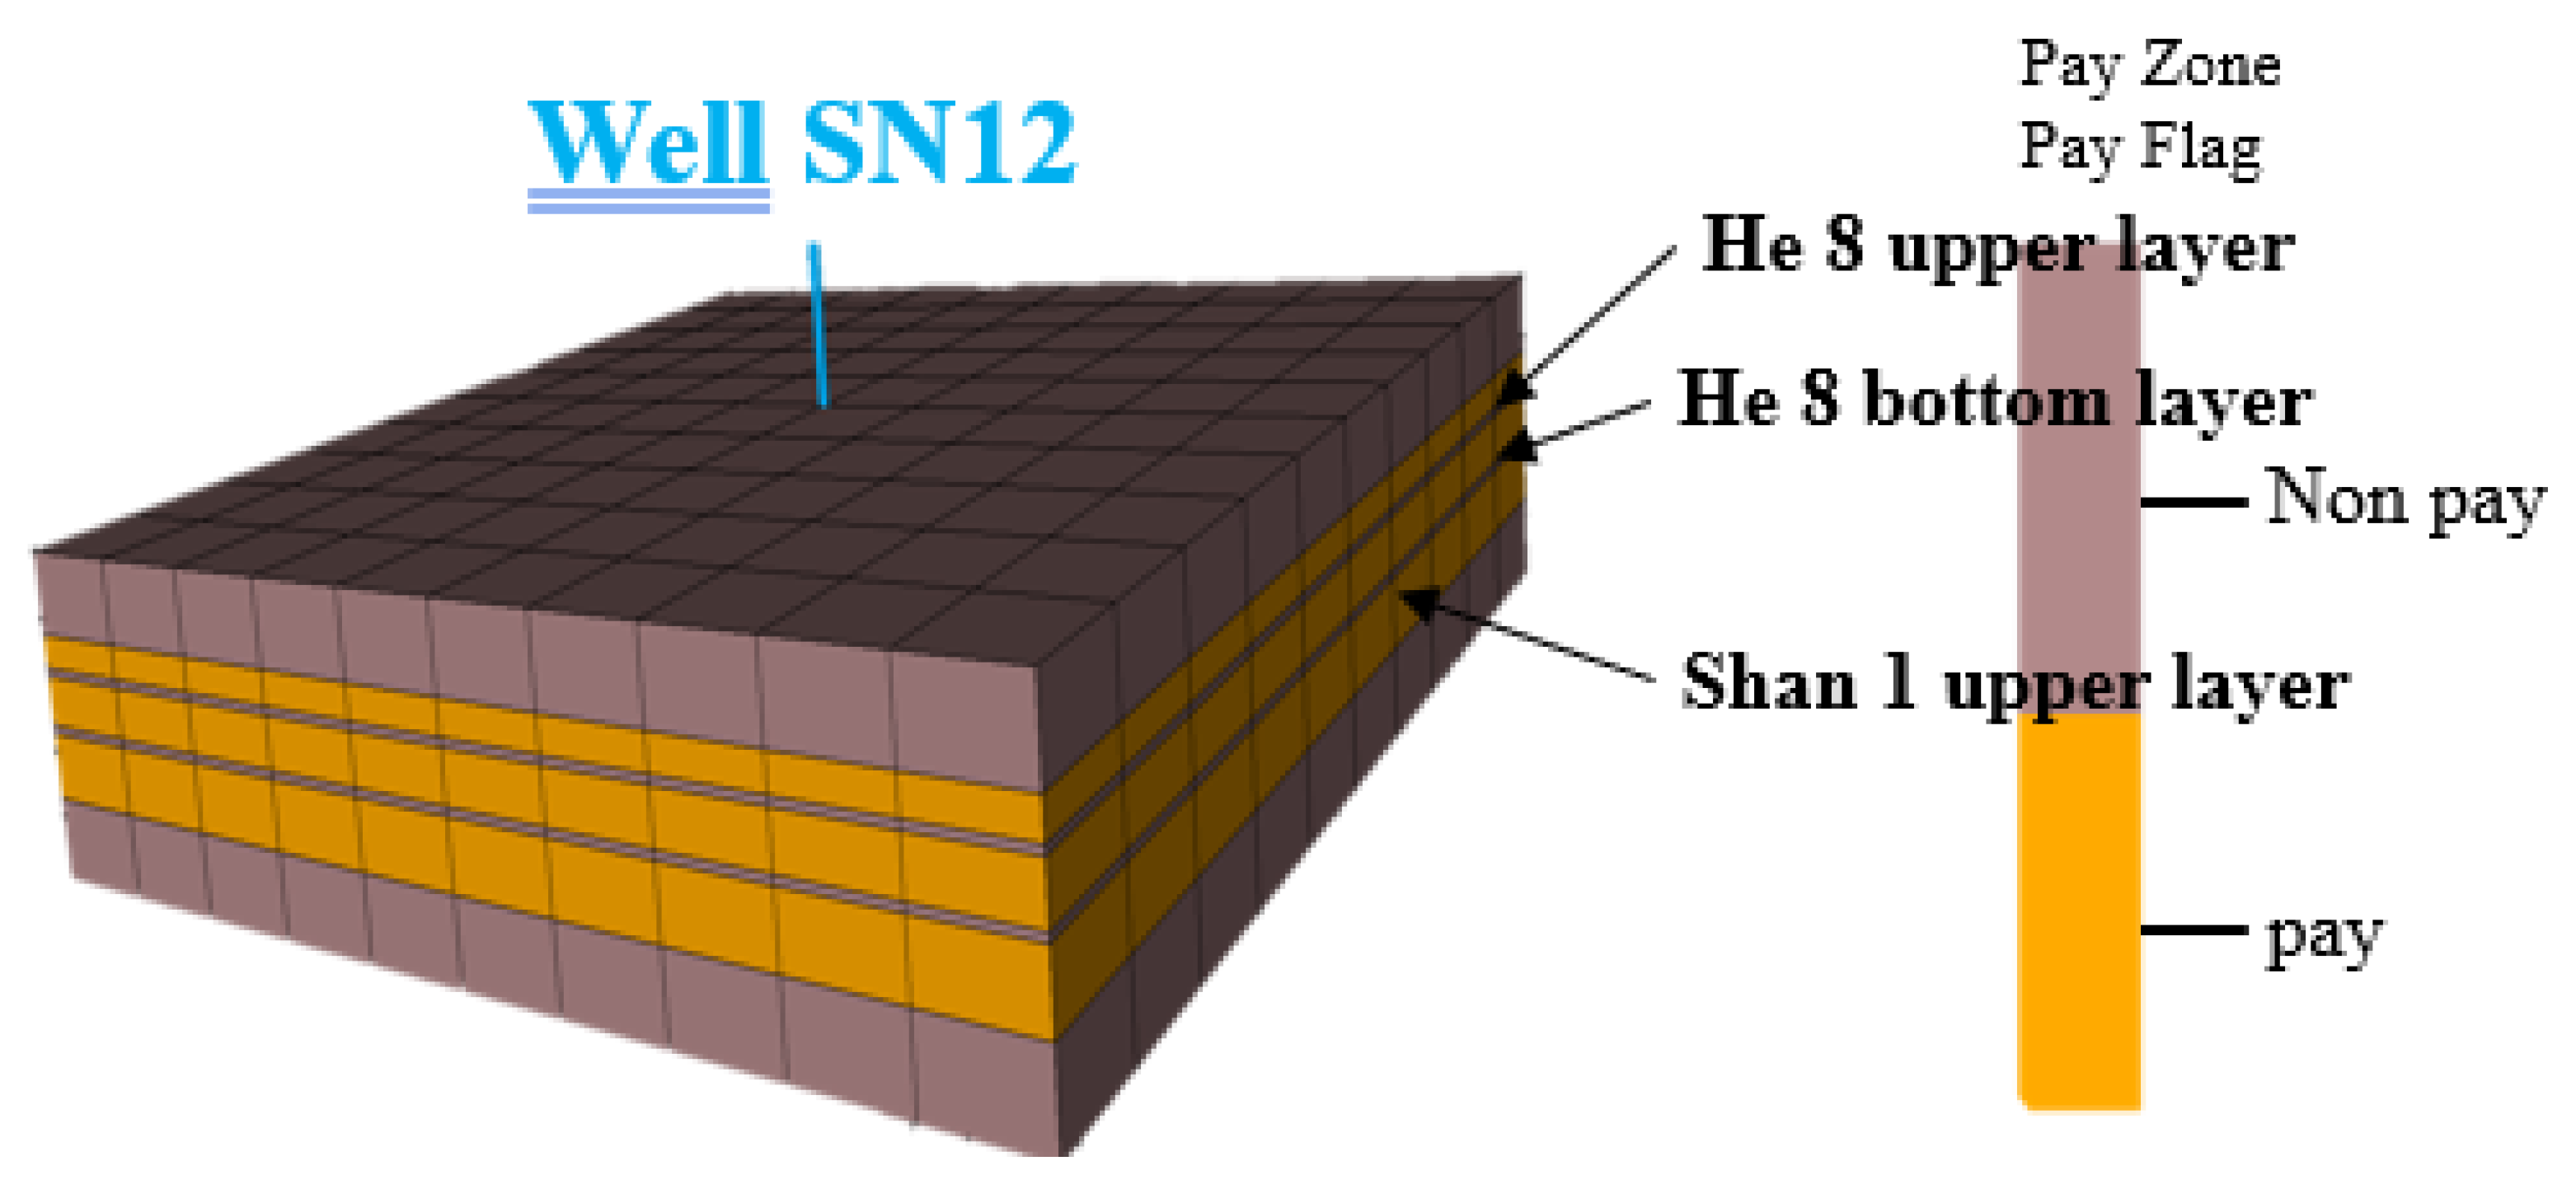
Figure 2: Fracturing simulation model (Well SN12).
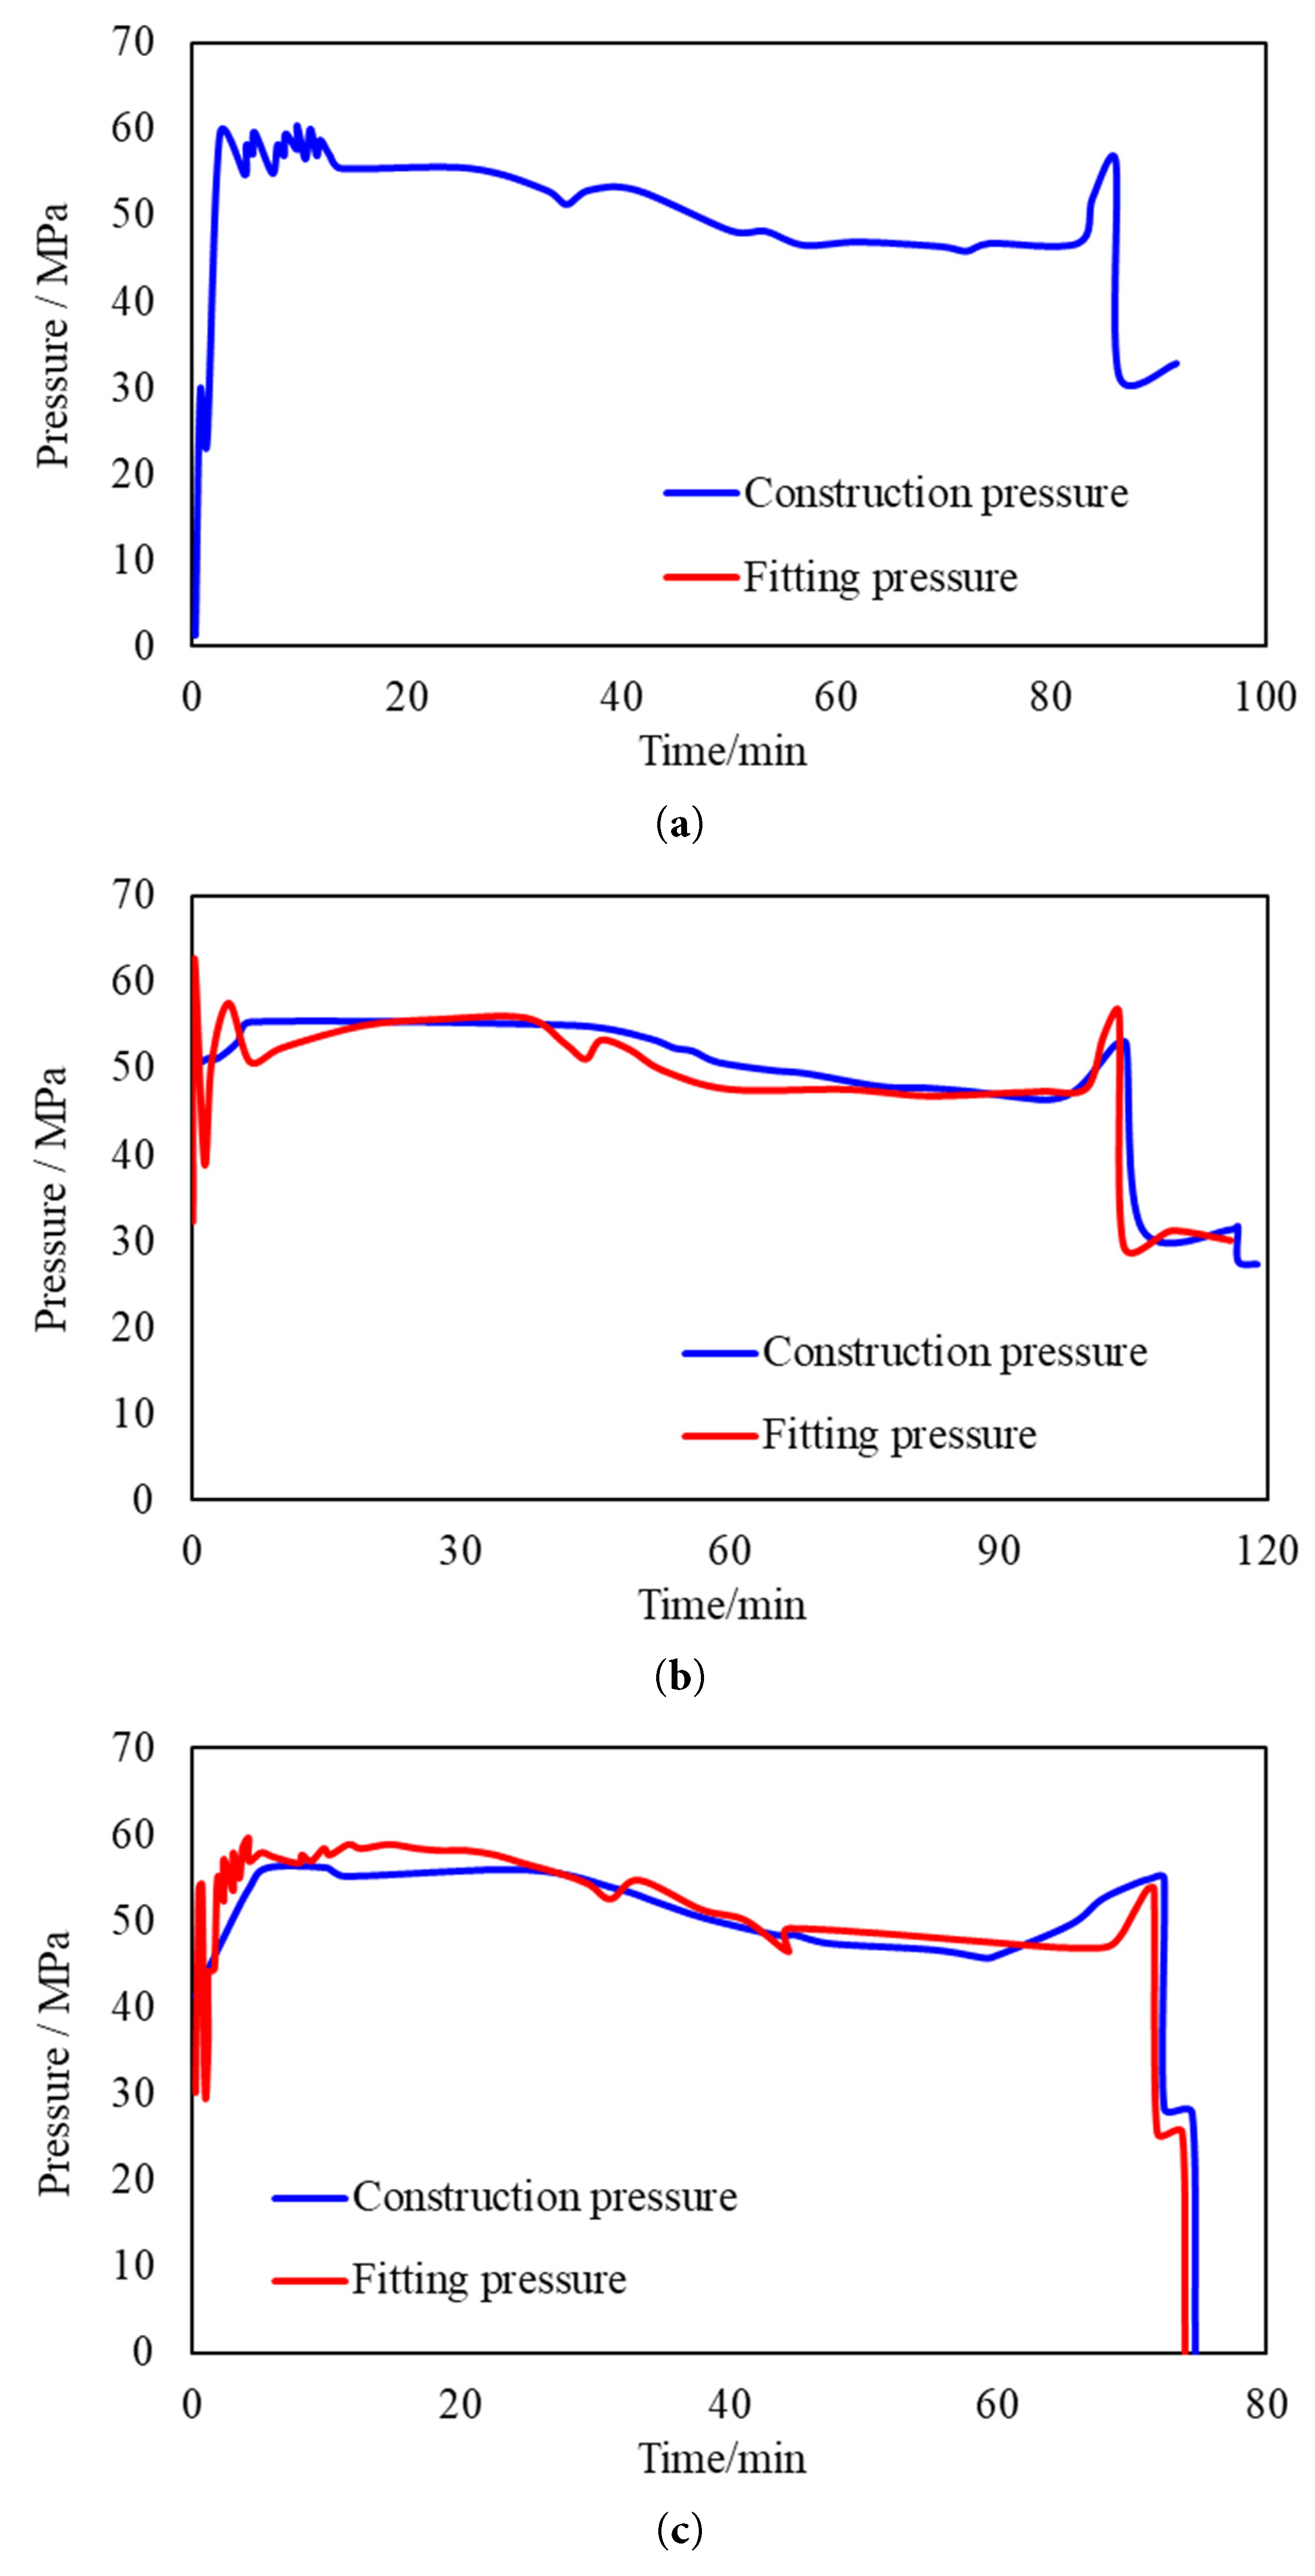
Figure 3: Construction pressure fitting curve. (a): Shan 1 Upper. (b): He 8 Lower. (c): He 8 Upper.
The assessment of geological condition adaptability for large-volume fracturing begins with numerical simulations that model the fracturing process under varying geological settings, enabling the identification of key parameters that influence fracturing performance. Subsequently, economic benefit evaluation models are applied to analyze the financial feasibility across different geological scenarios. By integrating the outcomes from numerical simulations and economic analyses, a comprehensive determination of the adaptability of large-volume fracturing to specific geological conditions is achieved. Finally, the reliability of this evaluation approach is verified through numerical simulation results from 11 wells, leading to the establishment of a systematic method for assessing the geological adaptability of large-volume fracturing.
3.1 Mechanism of High-Efficiency Stimulation
- (1)Effect on fracture half-length
Fracturing simulations were conducted for Well SN12 in the Sulige South Gas Field under fracturing displacements of 4 m3/min, 6 m3/min, and 8 m3/min, with injected fracturing fluid and proppant volumes maintained at 532.84 m3 and 55.68 m3, respectively. Fracture half-length is a key indicator affecting reservoir stimulation performance. The results indicate that increasing the fracturing displacement from 4 m3/min to 8 m3/min leads to a reduction in both total fracturing time and fluid loss when the injection volume remains constant. As depicted in Fig. 4, the fracture half-length increases moderately with higher displacement, suggesting that lower displacement rates result in slower fracture propagation. When displacement reaches a critical threshold, the fracture half-length stabilizes at its maximum value. According to the data presented in Table 2, the most significant increase in fracture half-length is observed in the He 8 lower formation, with an increment of 24 m.
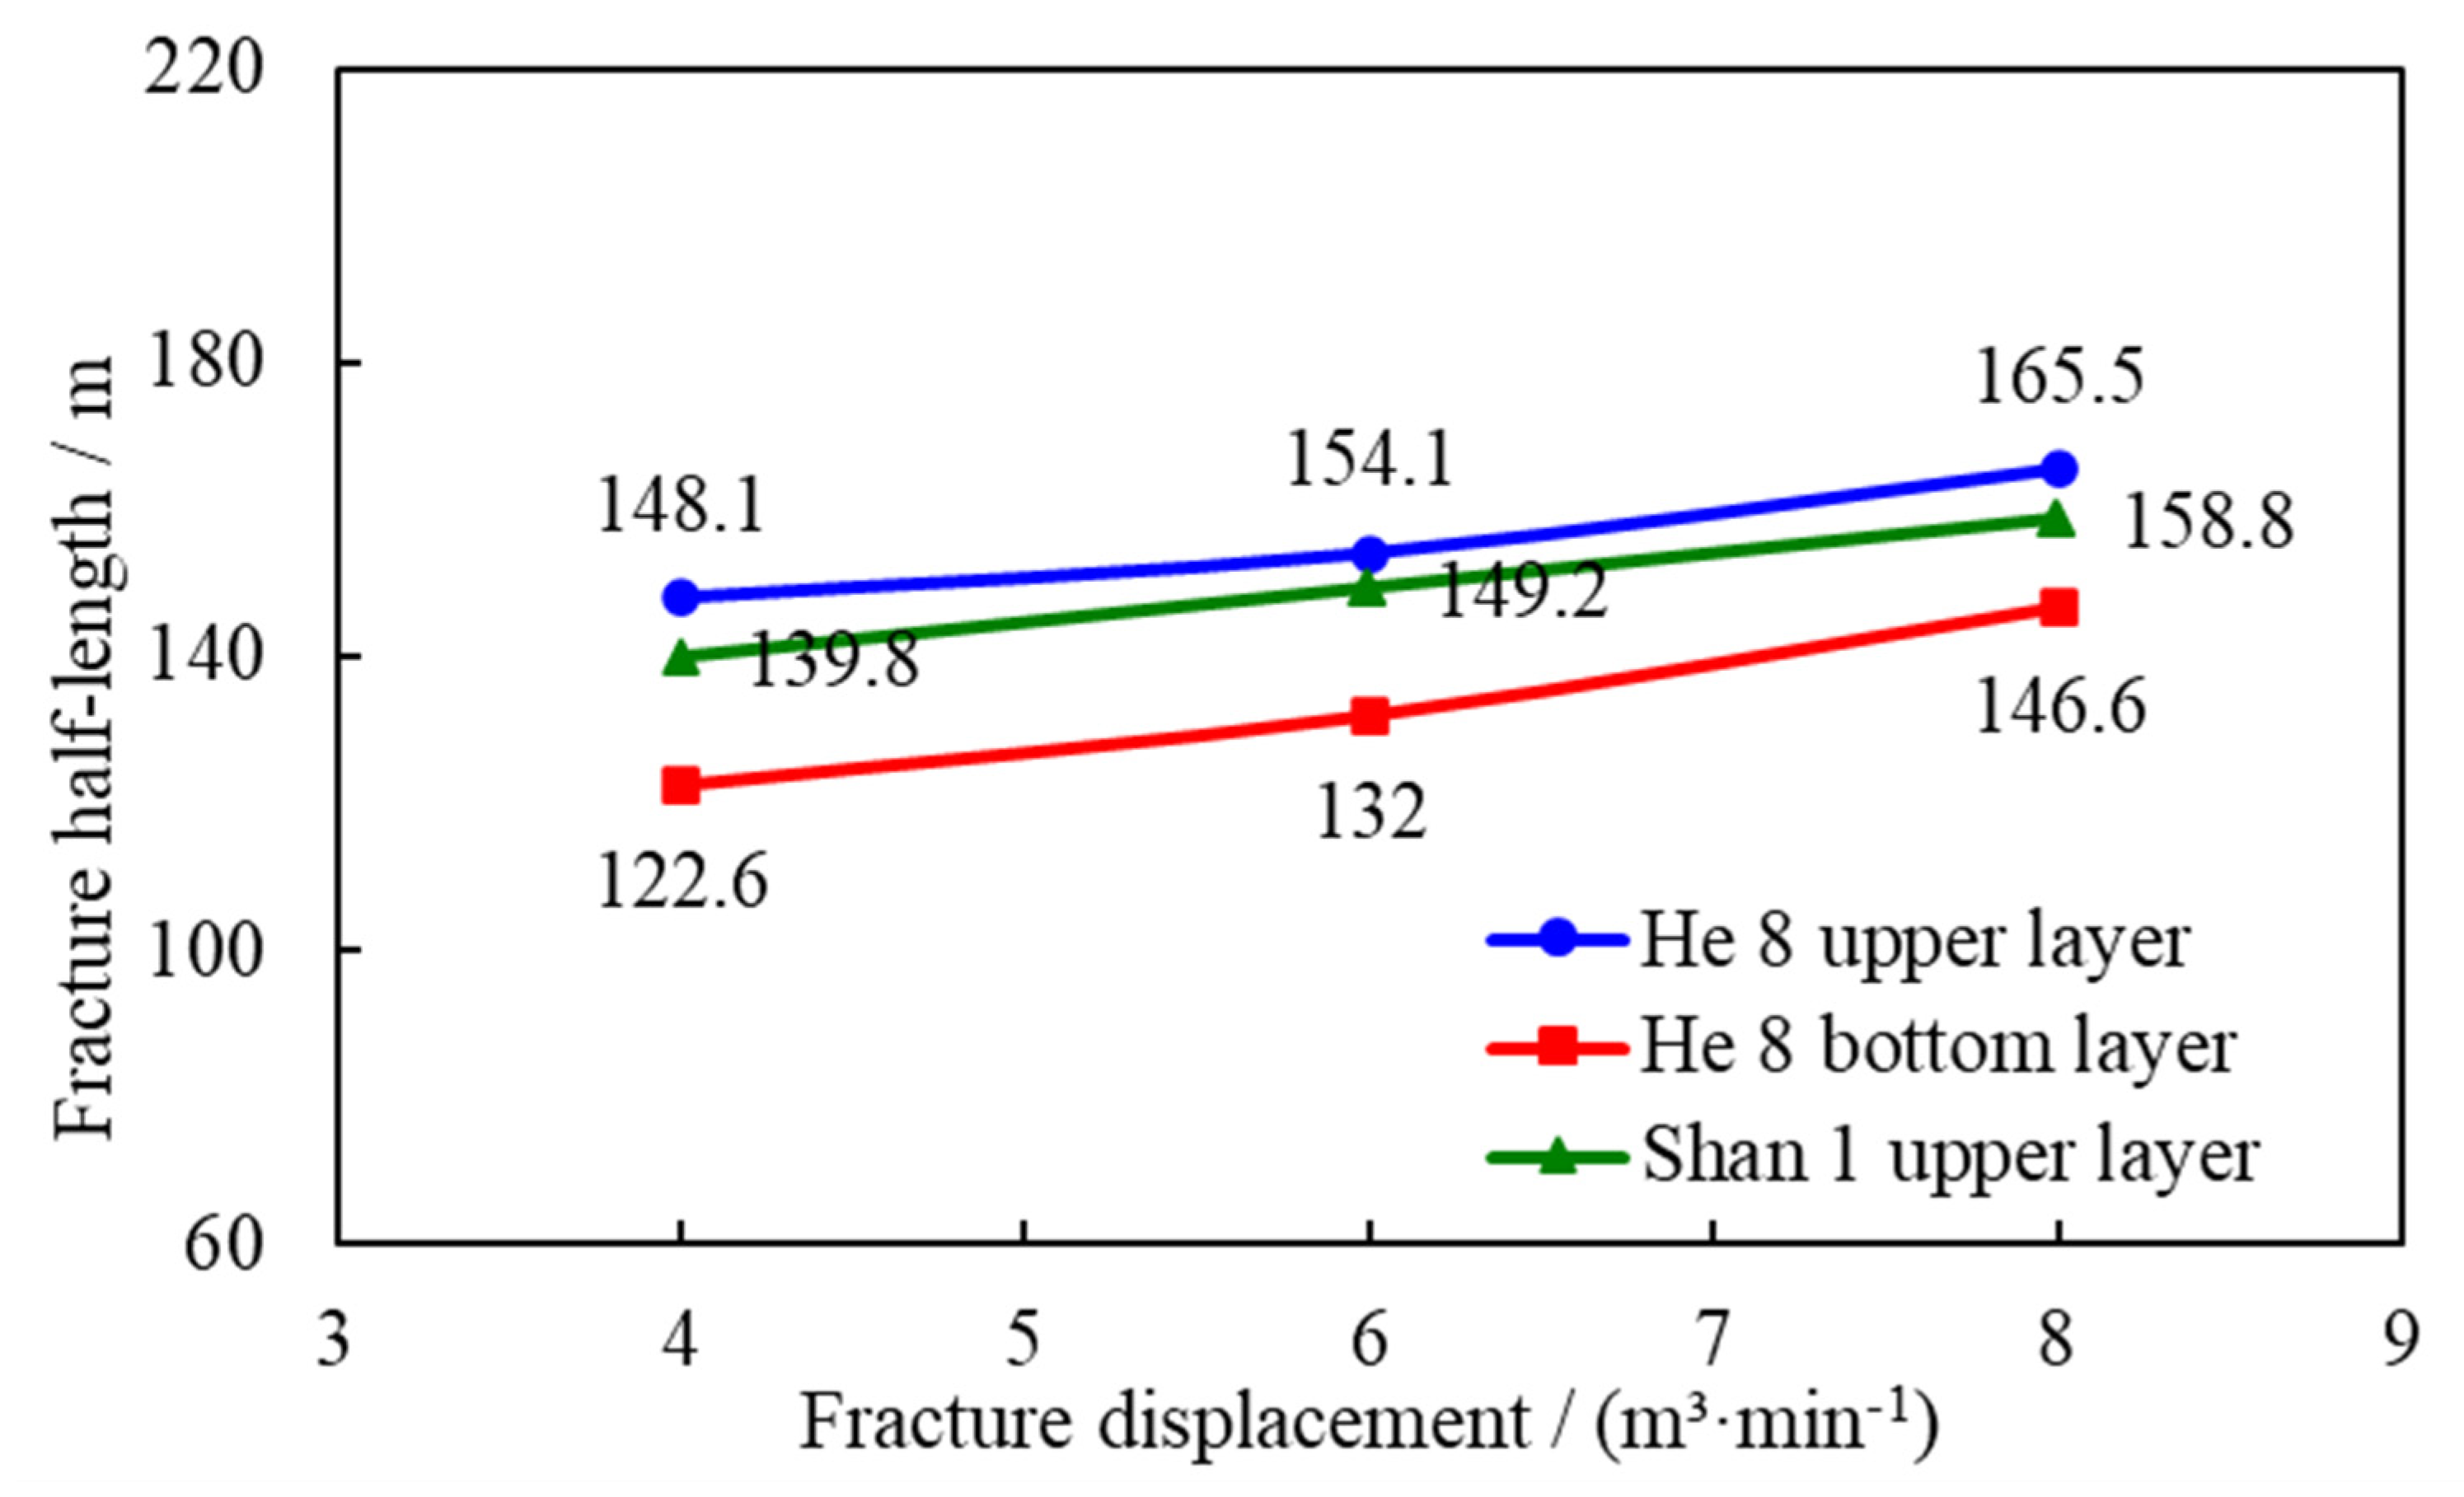
Figure 4: Variation curve of fracture half-length with fracture displacement.
Table 2: Fracture half-length at different displacements.
| Fractured Layer | Fracture Half-Length/m | Increment of Fracture Half-Length/m | ||
|---|---|---|---|---|
| Fracturing Displacement: 4 m3/min | Fracturing Displacement: 6 m3/min | Fracturing Displacement: 8 m3/min | ||
| He 8 upper layer | 148.1 | 154.1 | 165.5 | 17.4 |
| He 8 bottom layer | 122.6 | 132 | 146.6 | 24 |
| Shan 1 upper layer | 139.8 | 149.2 | 158.8 | 19 |
- (2)Effect on fracture height
Large-volume fracturing leads to increased pumping pressure, which helps overcome the stress contrasts within the reservoir and facilitates vertical fracture extension. As illustrated in Fig. 5, when the fracturing displacement increases from 4 m3/min to 8 m3/min, the fracture height shows a rapid increase. This phenomenon can be attributed to the fact that higher displacement generates a stronger driving force for fracture propagation. However, beyond a certain threshold, the rate of fracture height growth diminishes as the critical pressure limit is reached. At this stage, the reservoir’s low permeability hinders fluid infiltration and pressure propagation, thereby weakening the efficiency of further vertical fracture extension. Additionally, mechanical properties and stress barriers within the reservoir also restrict vertical fracture growth. Table 3 summarizes the fracture height variations in the target well, indicating increases ranging from 9.8 to 33 m.
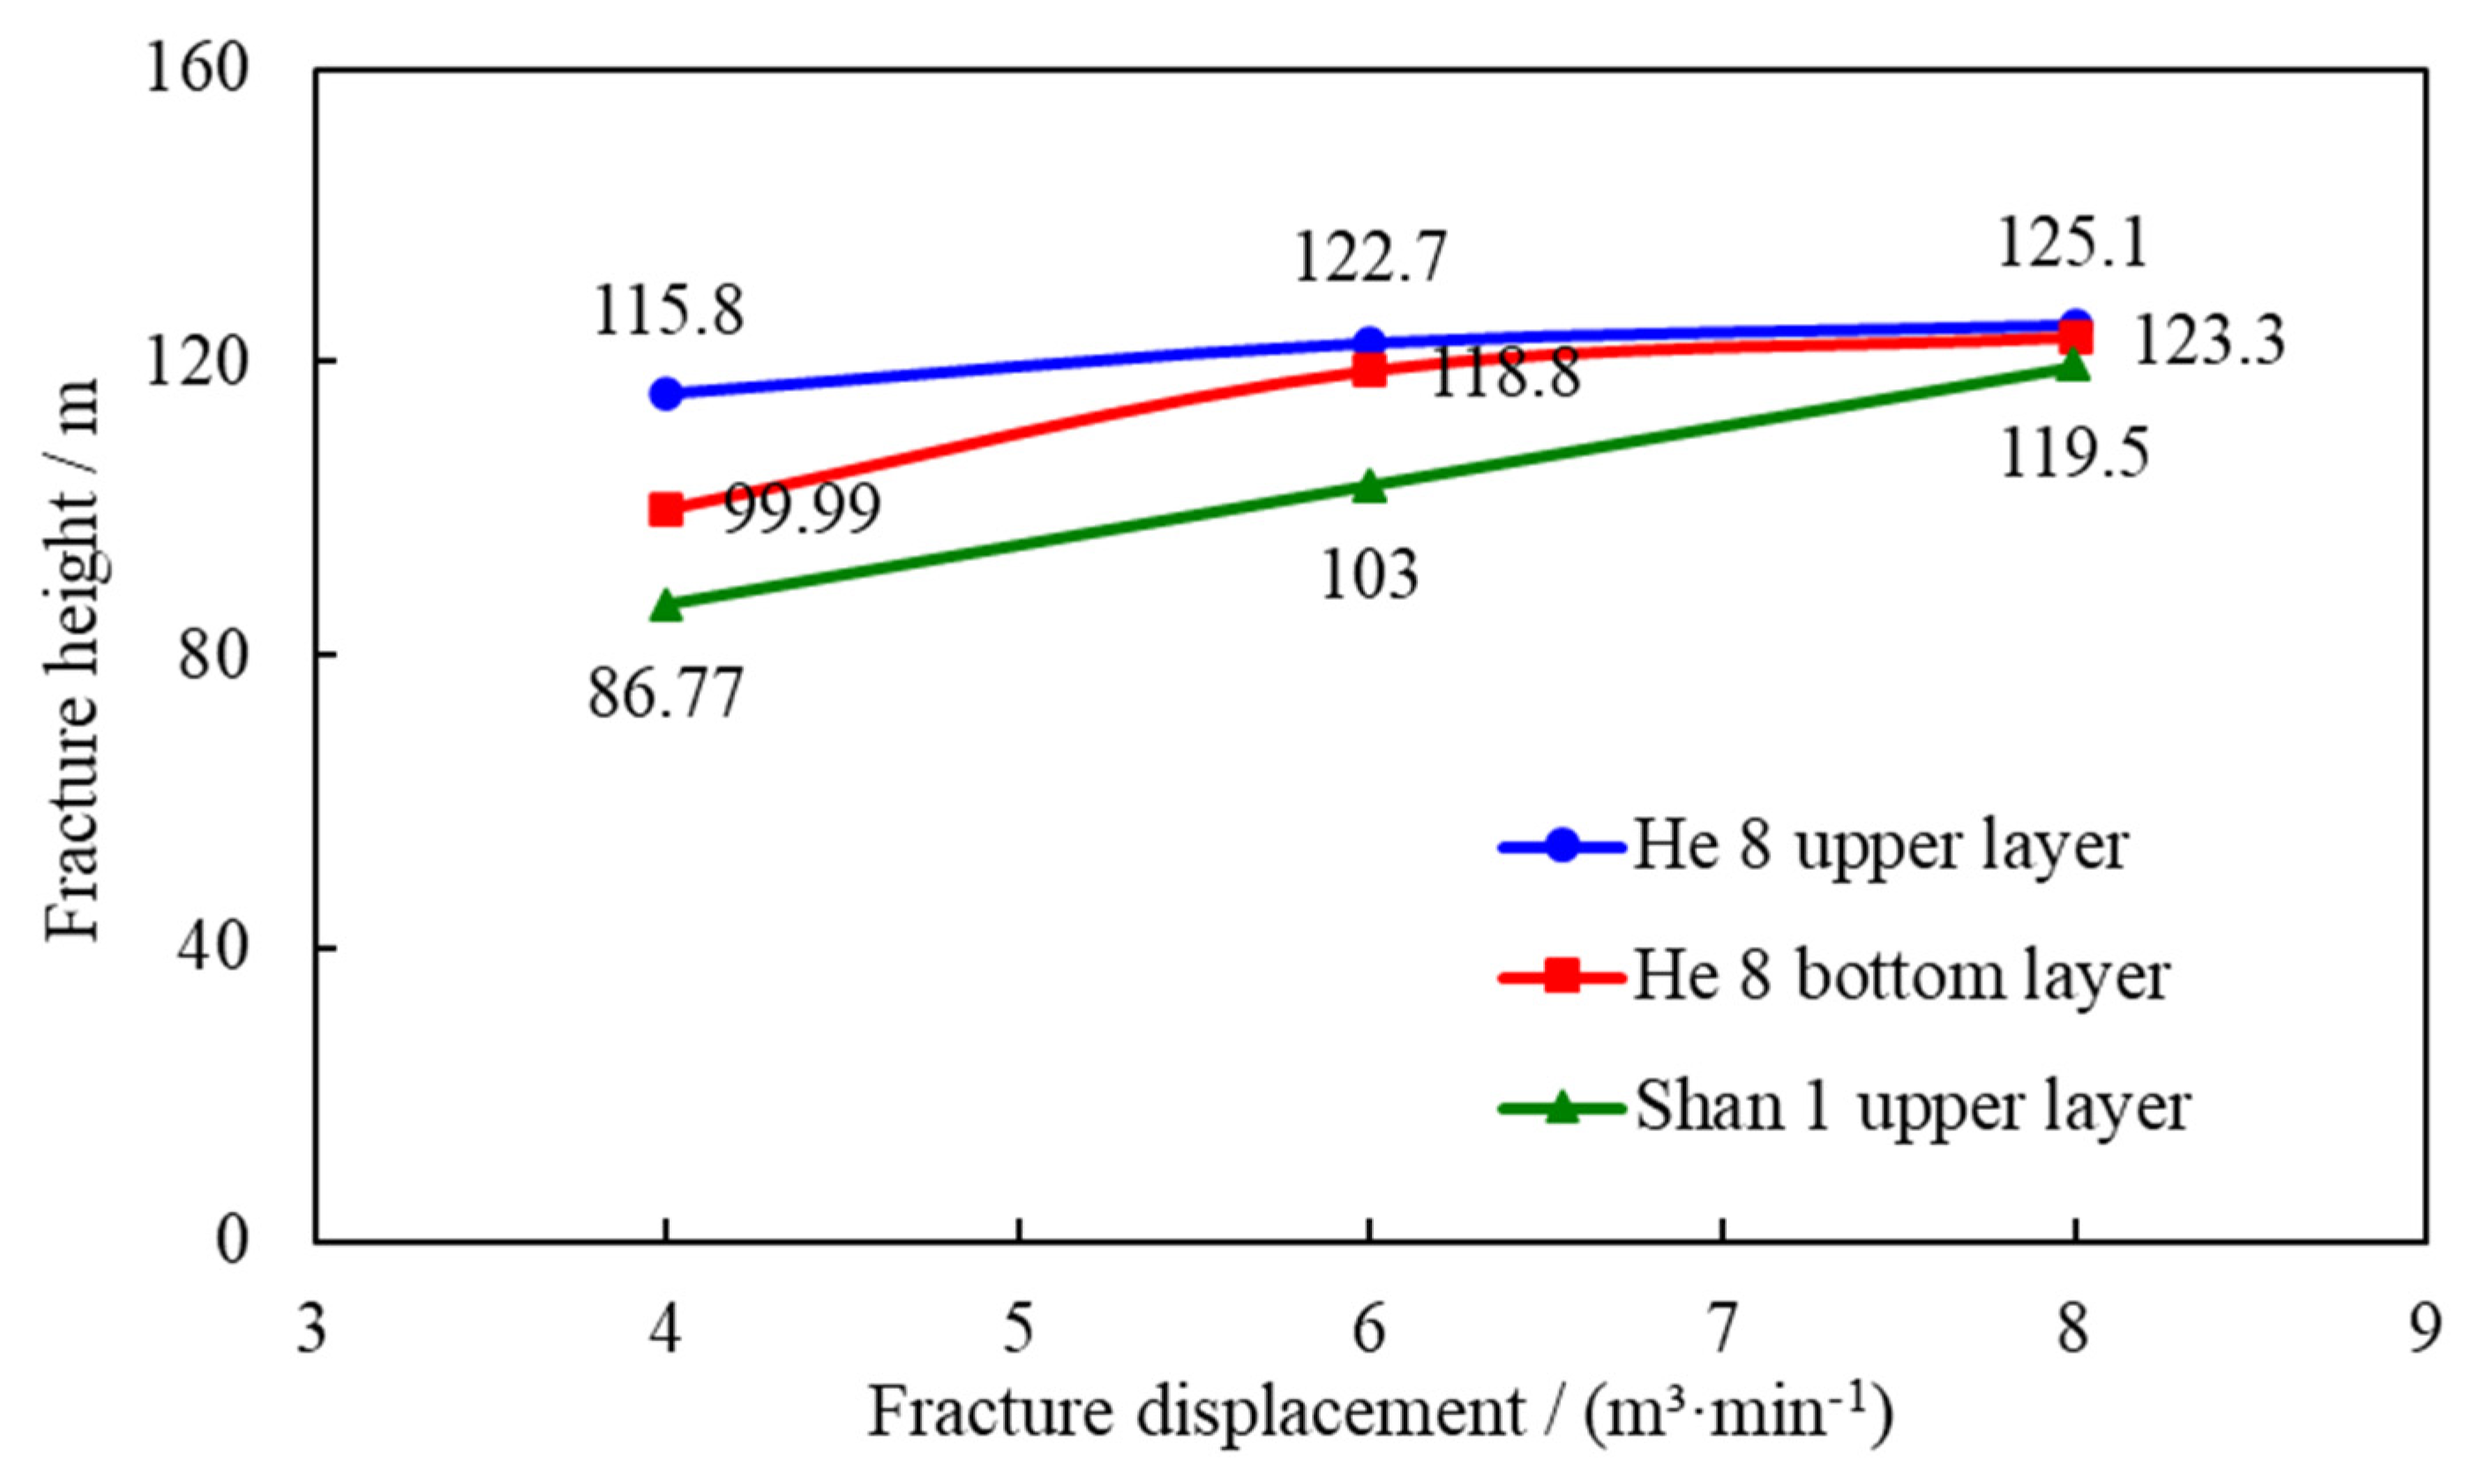
Figure 5: Variation curve of fracture height with fracture displacement.
Table 3: Fracture height at different displacements.
| Fractured Layer | Fracture Height/m | Increment of Fracture Height/m | ||
|---|---|---|---|---|
| Fracturing Displacement: 4 m3/min | Fracturing Displacement: 6 m3/min | Fracturing Displacement: 8 m3/min | ||
| He 8 upper layer | 115.8 | 122.7 | 125.1 | 9.8 |
| He 8 bottom layer | 99.99 | 118.8 | 123.3 | 23 |
| Shan 1 upper layer | 86.77 | 103 | 119.5 | 33 |
- (3)Effect on fracture width
As fracturing fluid displacement increases, fractures in the formation undergo an expansion process. However, this expansion is not unlimited. When the fracturing fluid displacement reaches a critical point, the fracture width growth rate gradually stabilizes. As shown in Fig. 6 and Table 4, when Well SN12 was fractured at displacements of 4 m3/min, 6 m3/min, and 8 m3/min, the fracture width exhibited a decreasing trend with increasing displacement. As the fracturing displacement increases, the rate of decline in fracture width decreases, ultimately stabilizing at a minimum threshold. Simulation results show that the average reduction in fracture width varied between 0.3 mm and 0.87 mm across the three distinct reservoir layers.
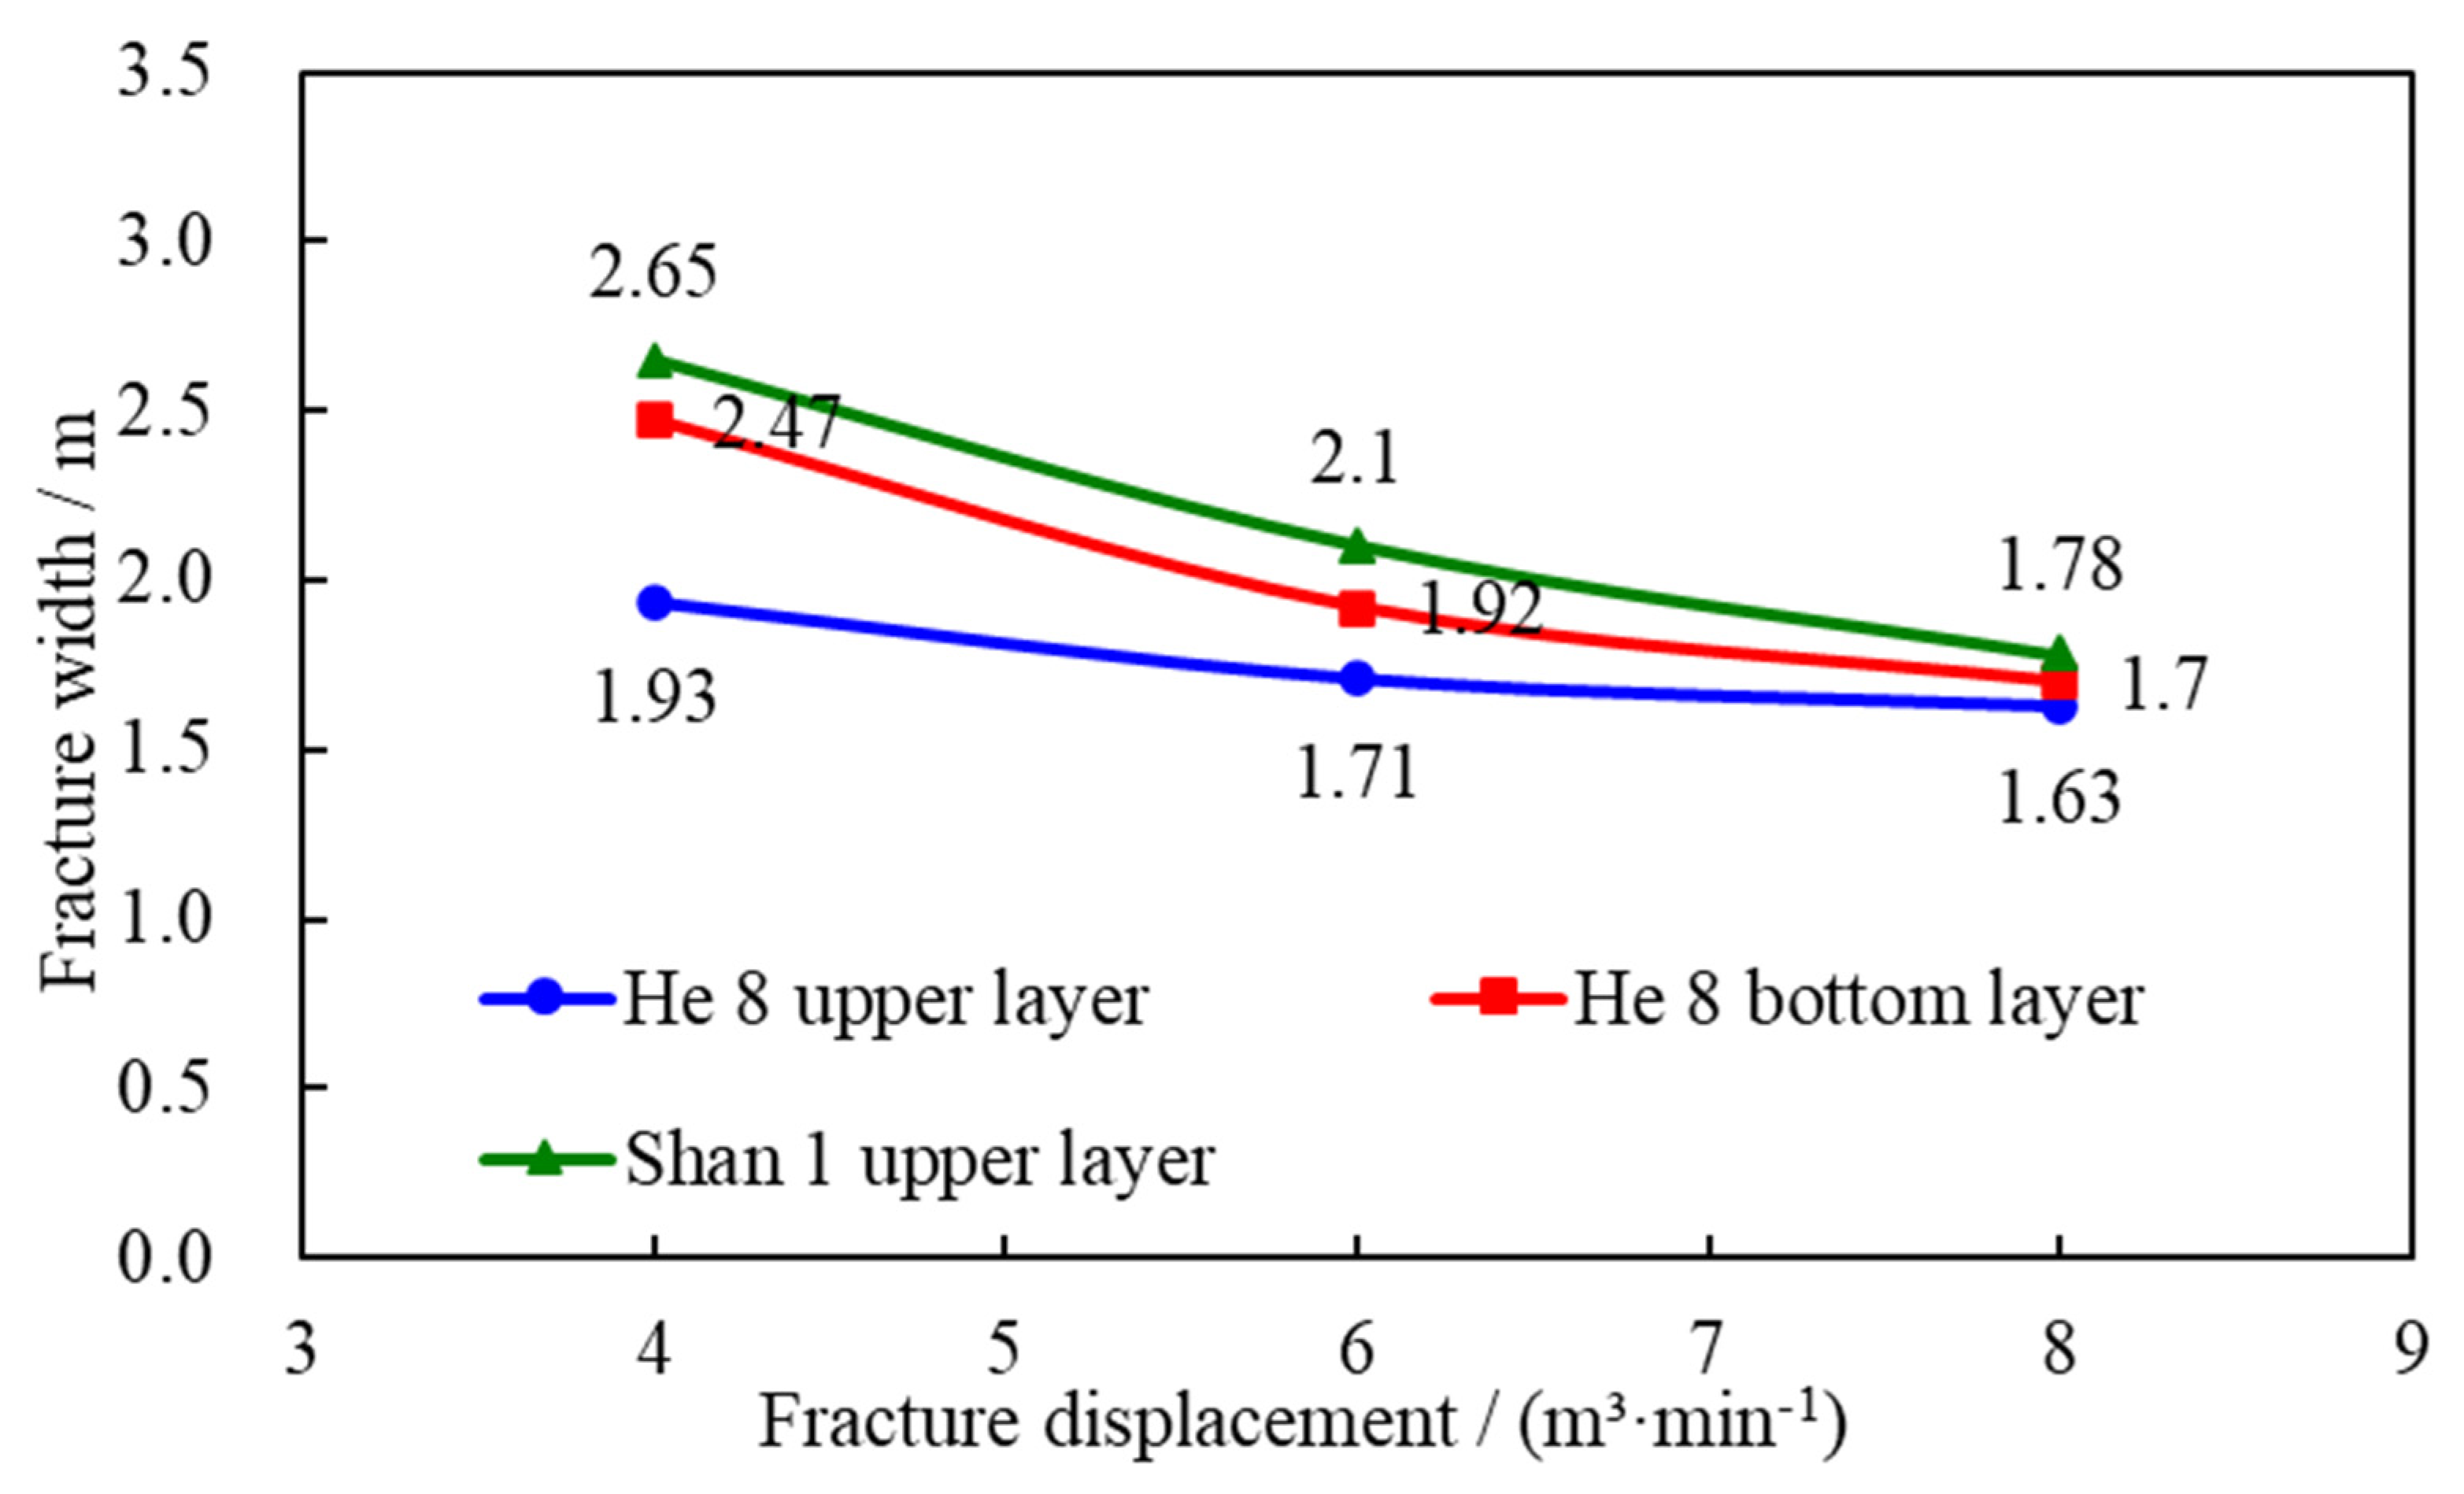
Figure 6: Variation curve of fracture width with fracturing displacement.
Table 4: Fracture width at different displacements.
| Fractured Layer | Fracture Width/m | Reduction of Fracture Width/m | ||
|---|---|---|---|---|
| Fracturing Displacement: 4 m3/min | Fracturing Displacement: 6 m3/min | Fracturing Displacement: 8 m3/min | ||
| He 8 upper layer | 1.93 | 1.71 | 1.63 | 0.3 |
| He 8 bottom layer | 2.47 | 1.92 | 1.7 | 0.77 |
| Shan 1 upper layer | 2.65 | 2.1 | 1.78 | 0.87 |
- (4)Effect on fracture conductivity
Proppant distribution plays a critical role in determining fracture conductivity. Under low fracturing fluid displacement, a greater proportion of proppant accumulates in the near-wellbore zone, enhancing the local proppant packing efficiency. In contrast, higher displacement rates result in reduced proppant deposition in this region, leading to lower proppant concentration and consequently diminished fracture conductivity. As shown in Table 5 and Fig. 7, when the fracturing displacement increased from 4 m3/min to 8 m3/min, the fracture conductivity of all three reservoir layers exhibited a decreasing trend. The fracture conductivity in the Shan 1 layer decreased from 899.2 mD·m to 610.9 mD·m, a reduction of 288.3 mD·m.
Table 5: Fracture conductivity at different displacements.
| Fractured Layer | Fracture Conductivity/mD·m | Reduction of Fracture Conductivity/mD·m | ||
|---|---|---|---|---|
| Fracturing Displacement: 4 m3/min | Fracturing Displacement: 6 m3/min | Fracturing Displacement: 8 m3/min | ||
| He 8 upper layer | 970.2 | 874.5 | 793.3 | 176.9 |
| He 8 bottom layer | 573.7 | 446.3 | 400.2 | 173.5 |
| Shan 1 upper layer | 899.2 | 774.9 | 610.9 | 288.3 |
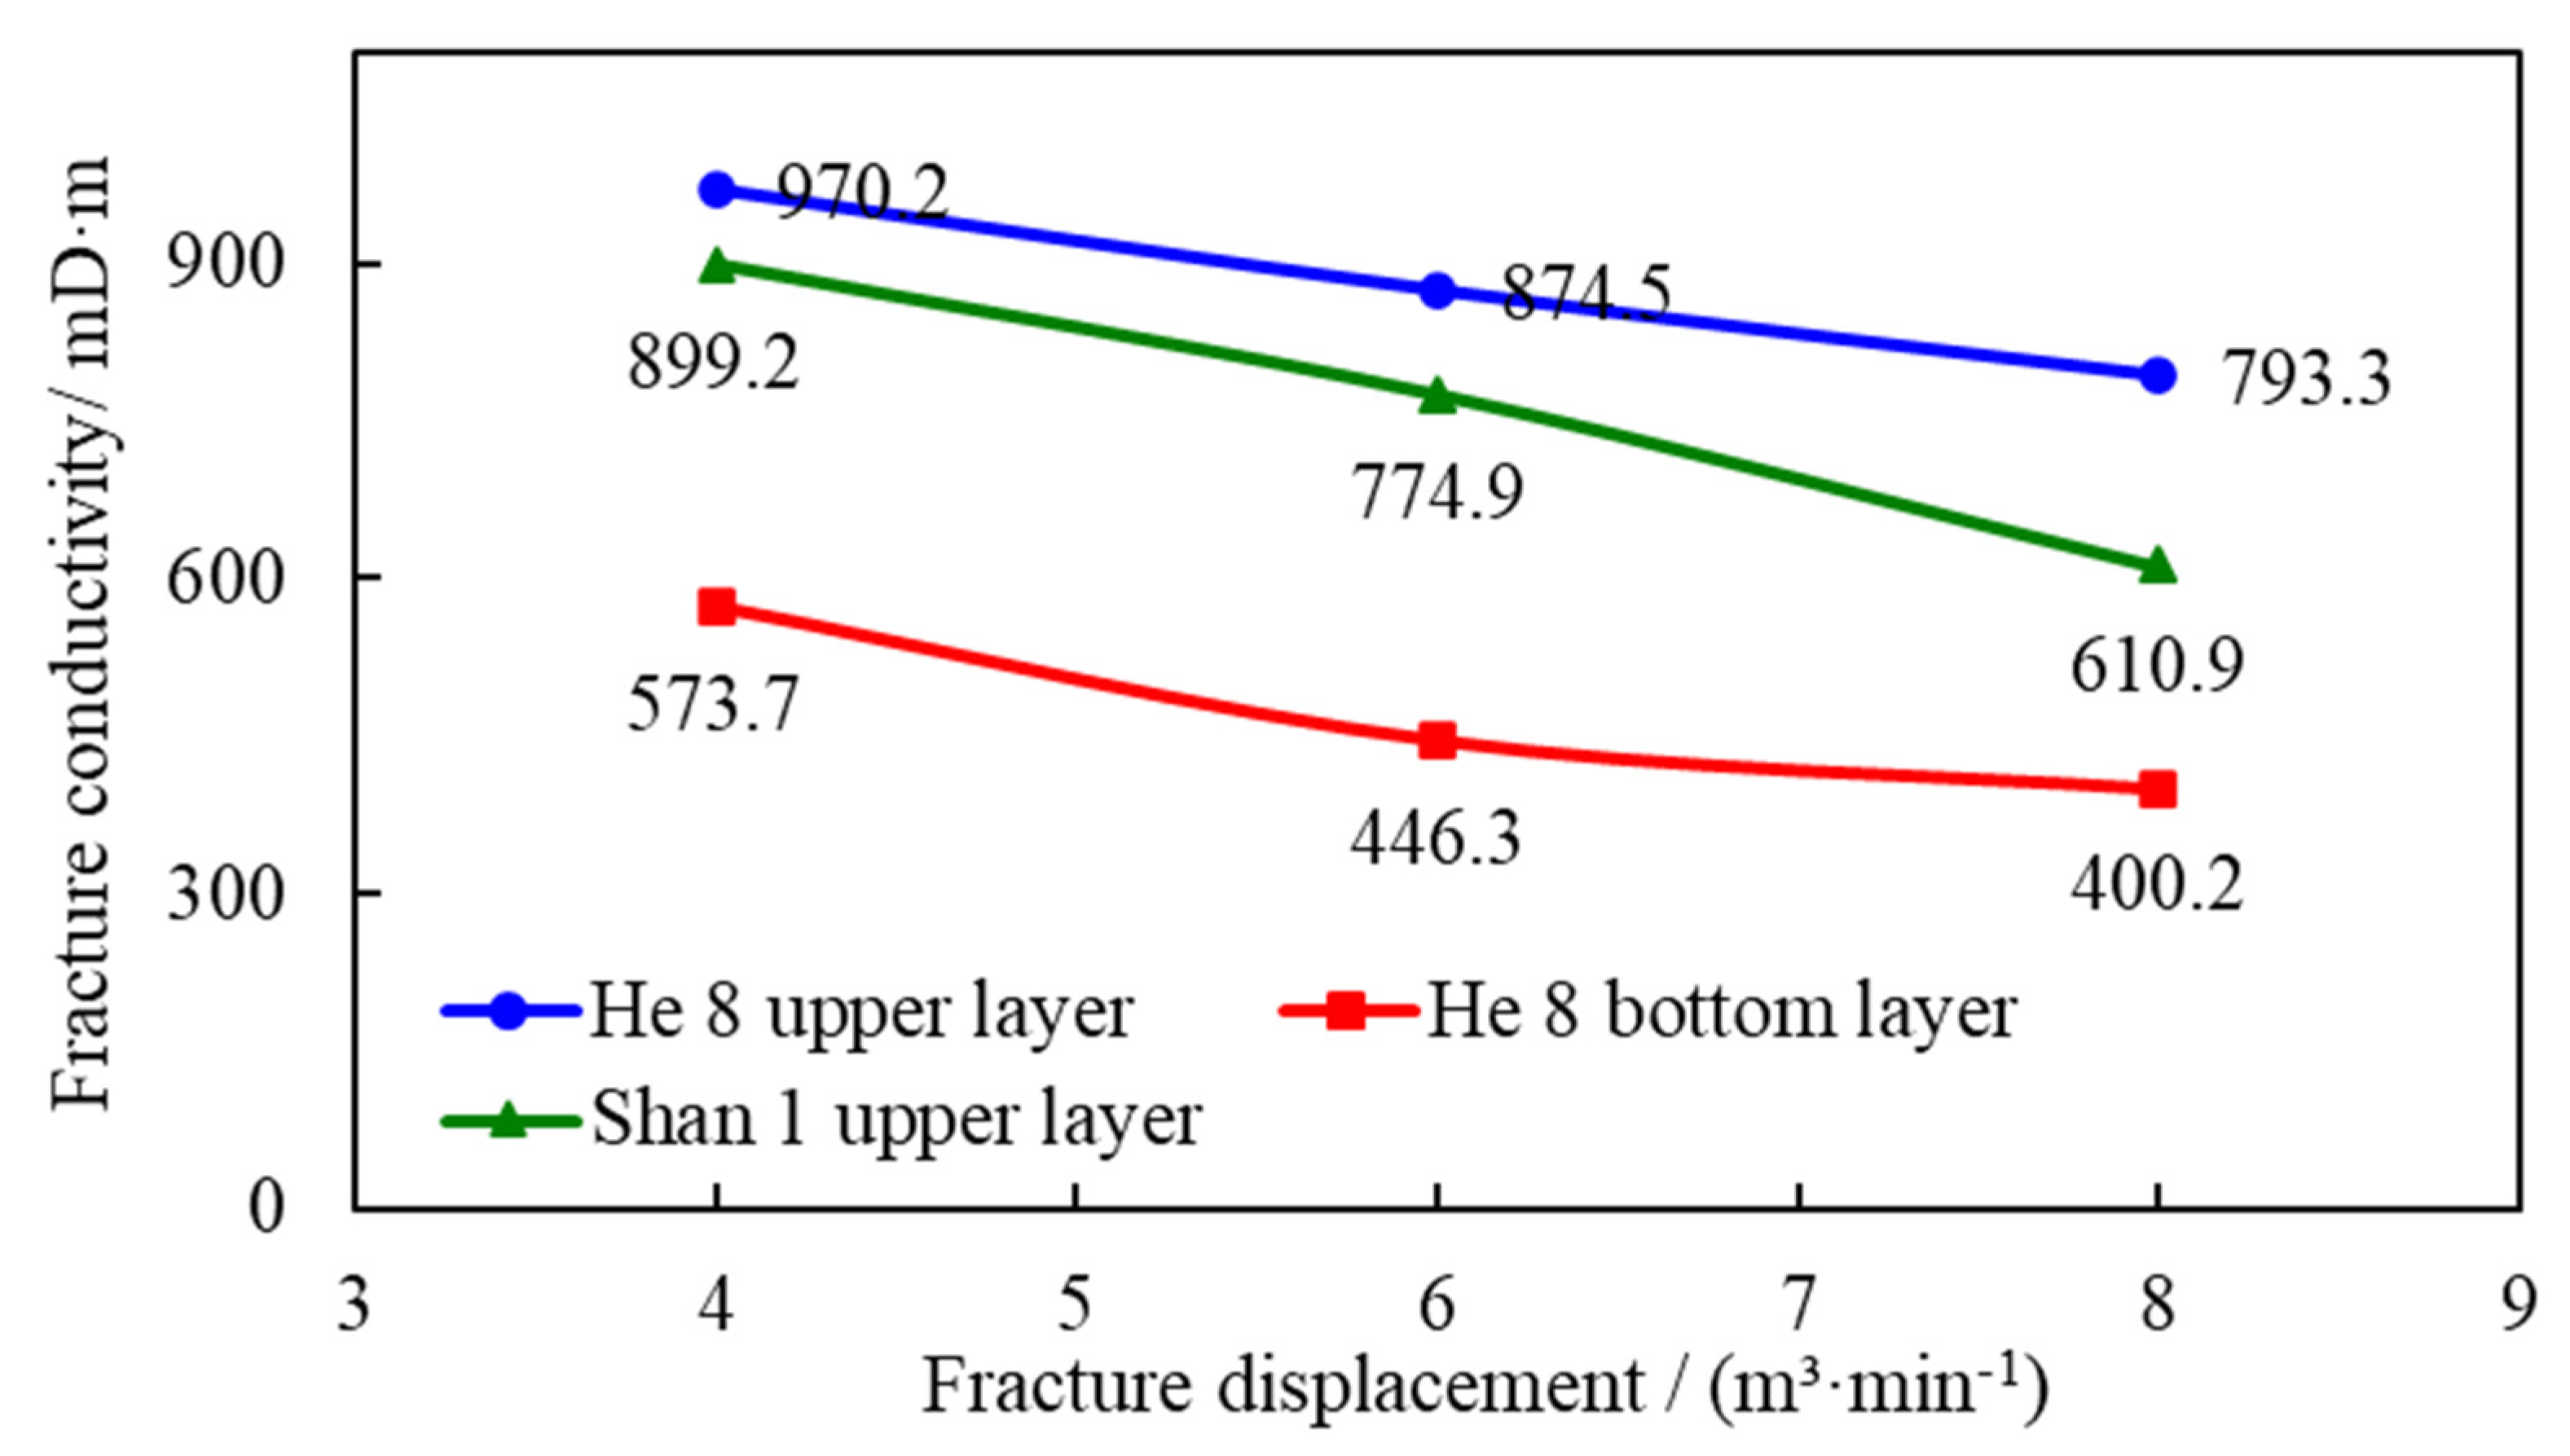
Figure 7: Variation curve of fracture conductivity with fracture discharge volume.
- (5)Effect on reservoir pressure and gas production
An integrated fracturing and production model was developed to simulate one year of gas production under varying fracturing displacement conditions. As illustrated in Fig. 8, the pressure at multiple points within the production layer decreased under different displacement scenarios. Comparative analysis demonstrates that as fracturing displacement increases, the rate of reservoir pressure decline accelerates by 0.3–0.4 MPa. Higher displacement enhances gas reservoir utilization efficiency by generating greater fracturing fluid injection volumes, which improve permeability and gas mobility. As shown in Fig. 9, increasing the displacement from 4 m3/min to 8 m3/min resulted in a rise in cumulative gas production from 7.15 × 10⁷ m3 to 7.56 × 10⁷ m3—an increase of 6%. Therefore, large-volume fracturing proves to be an effective strategy for enhancing tight gas recovery in the Sulige South Gas Field.
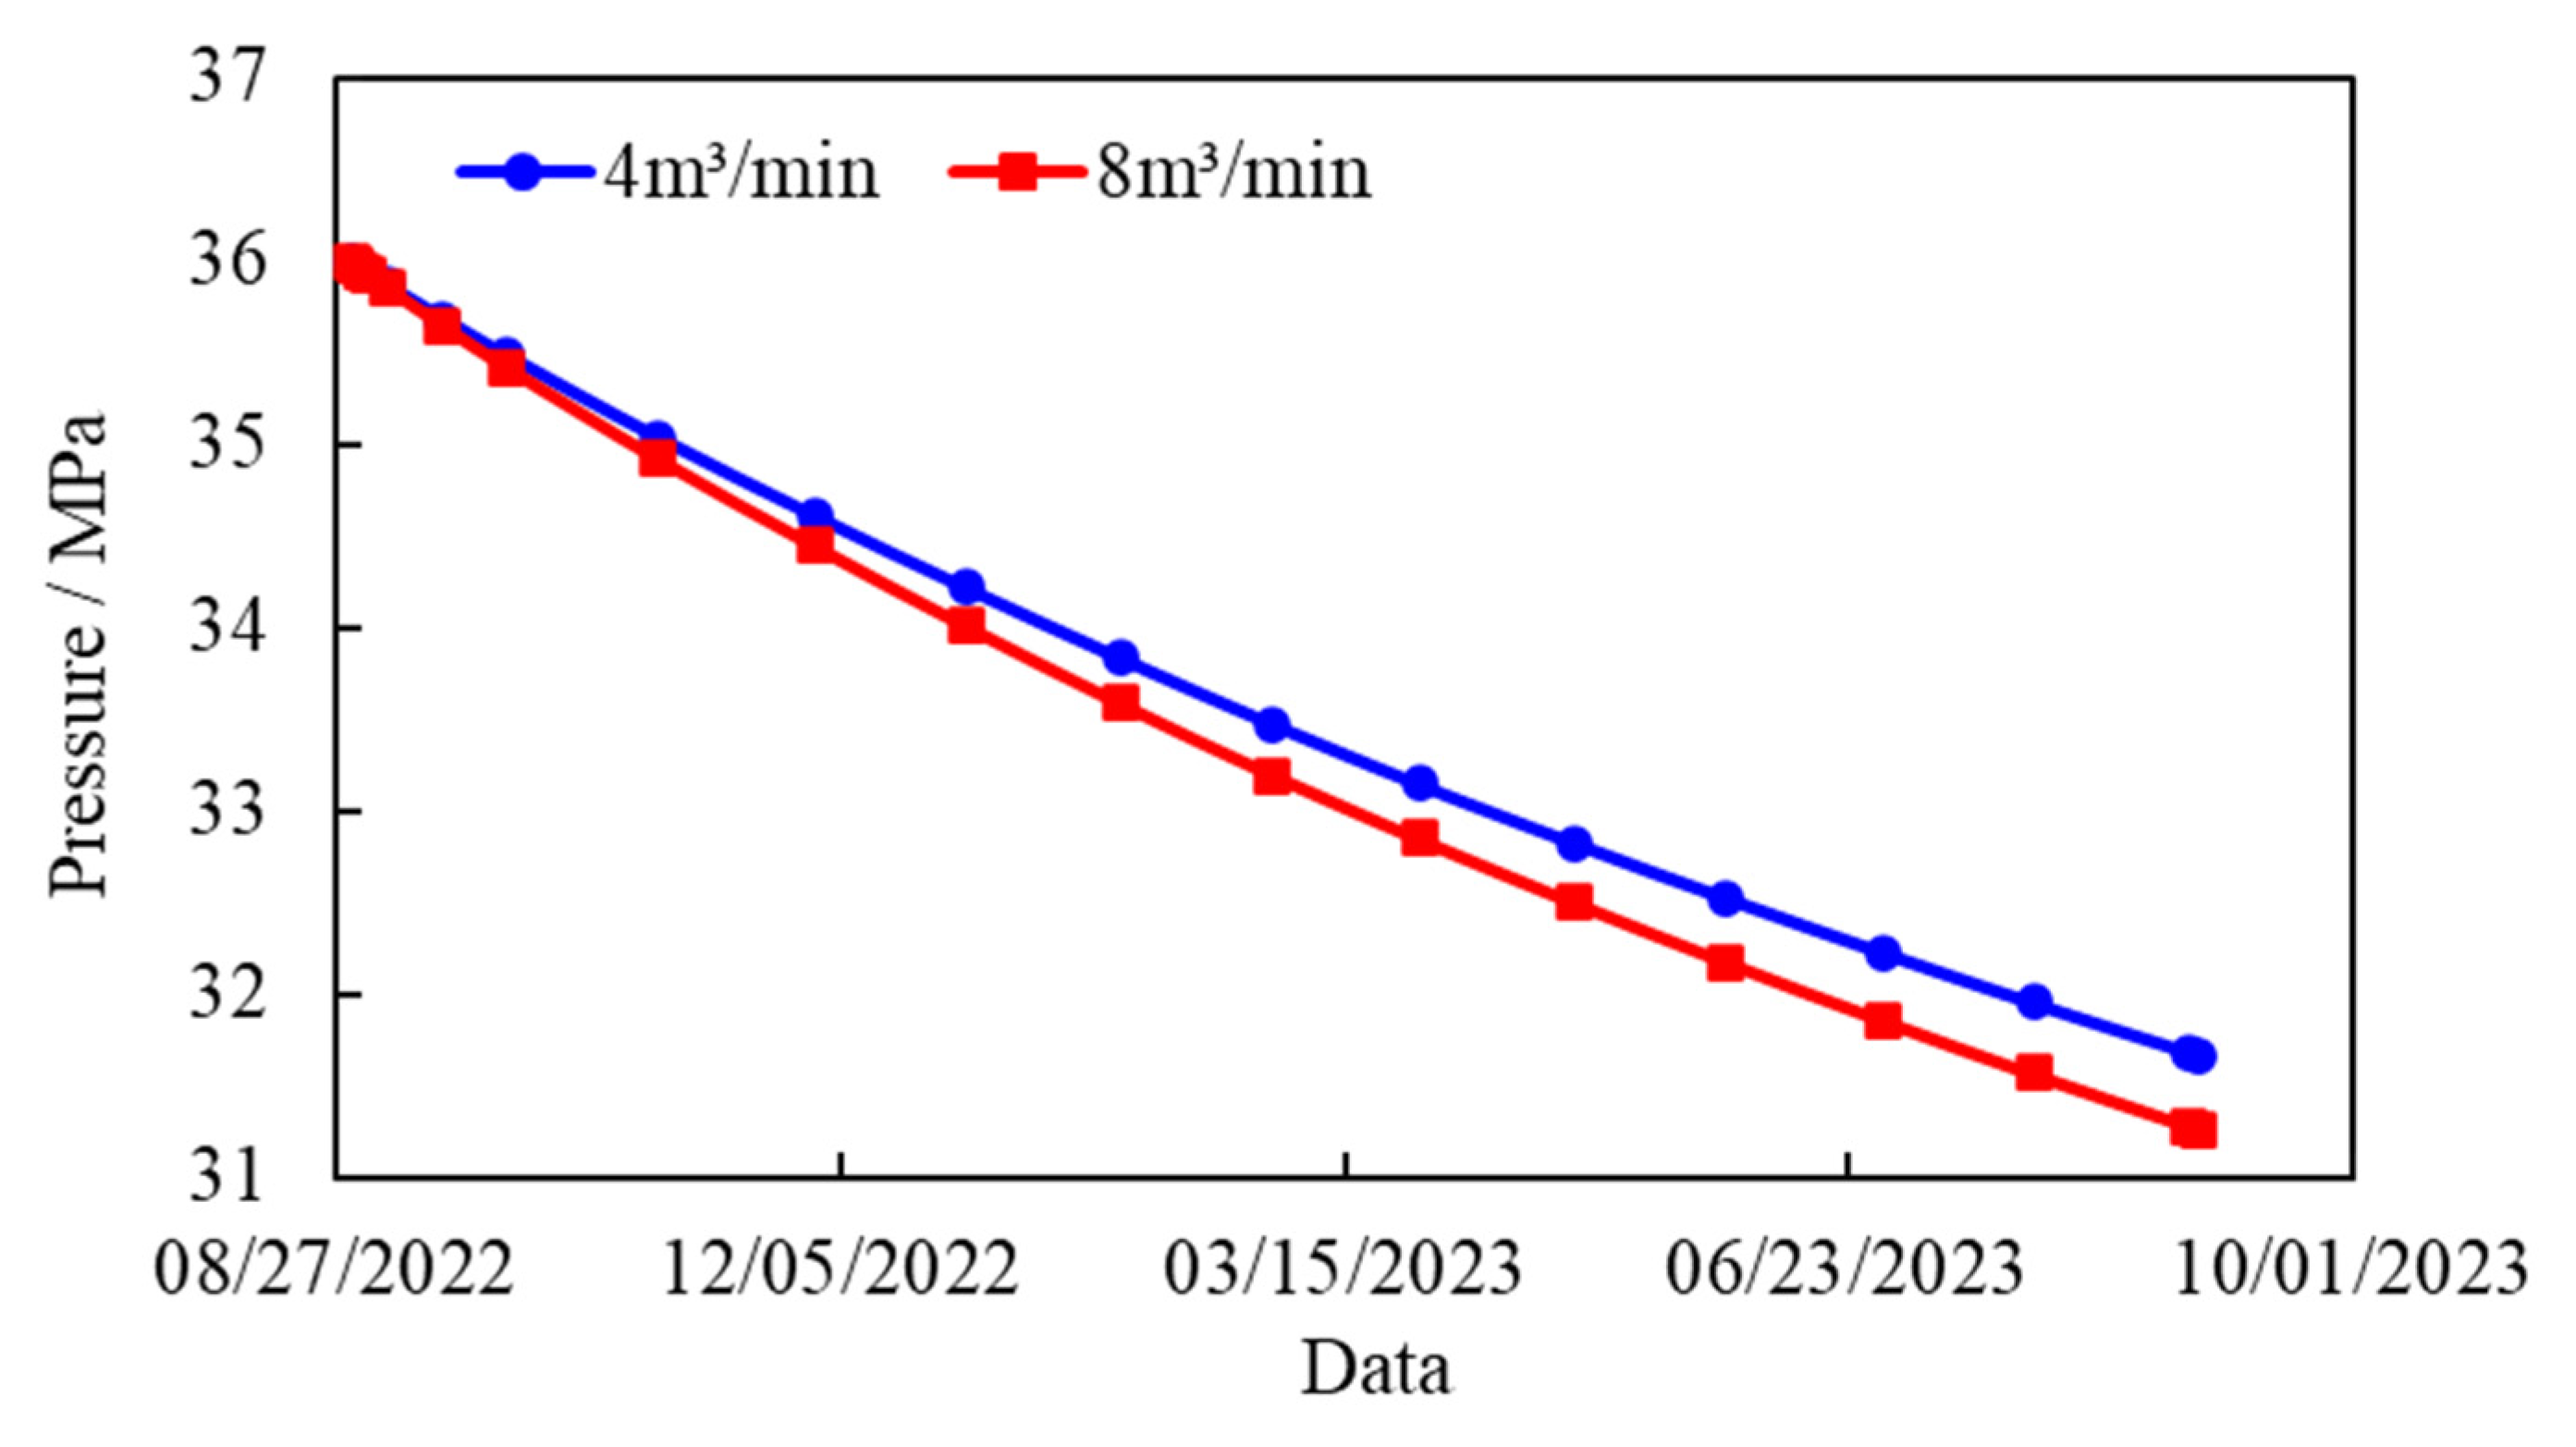
Figure 8: Variation curves of average pressure change of Well SN12 with different fracturing displacements.
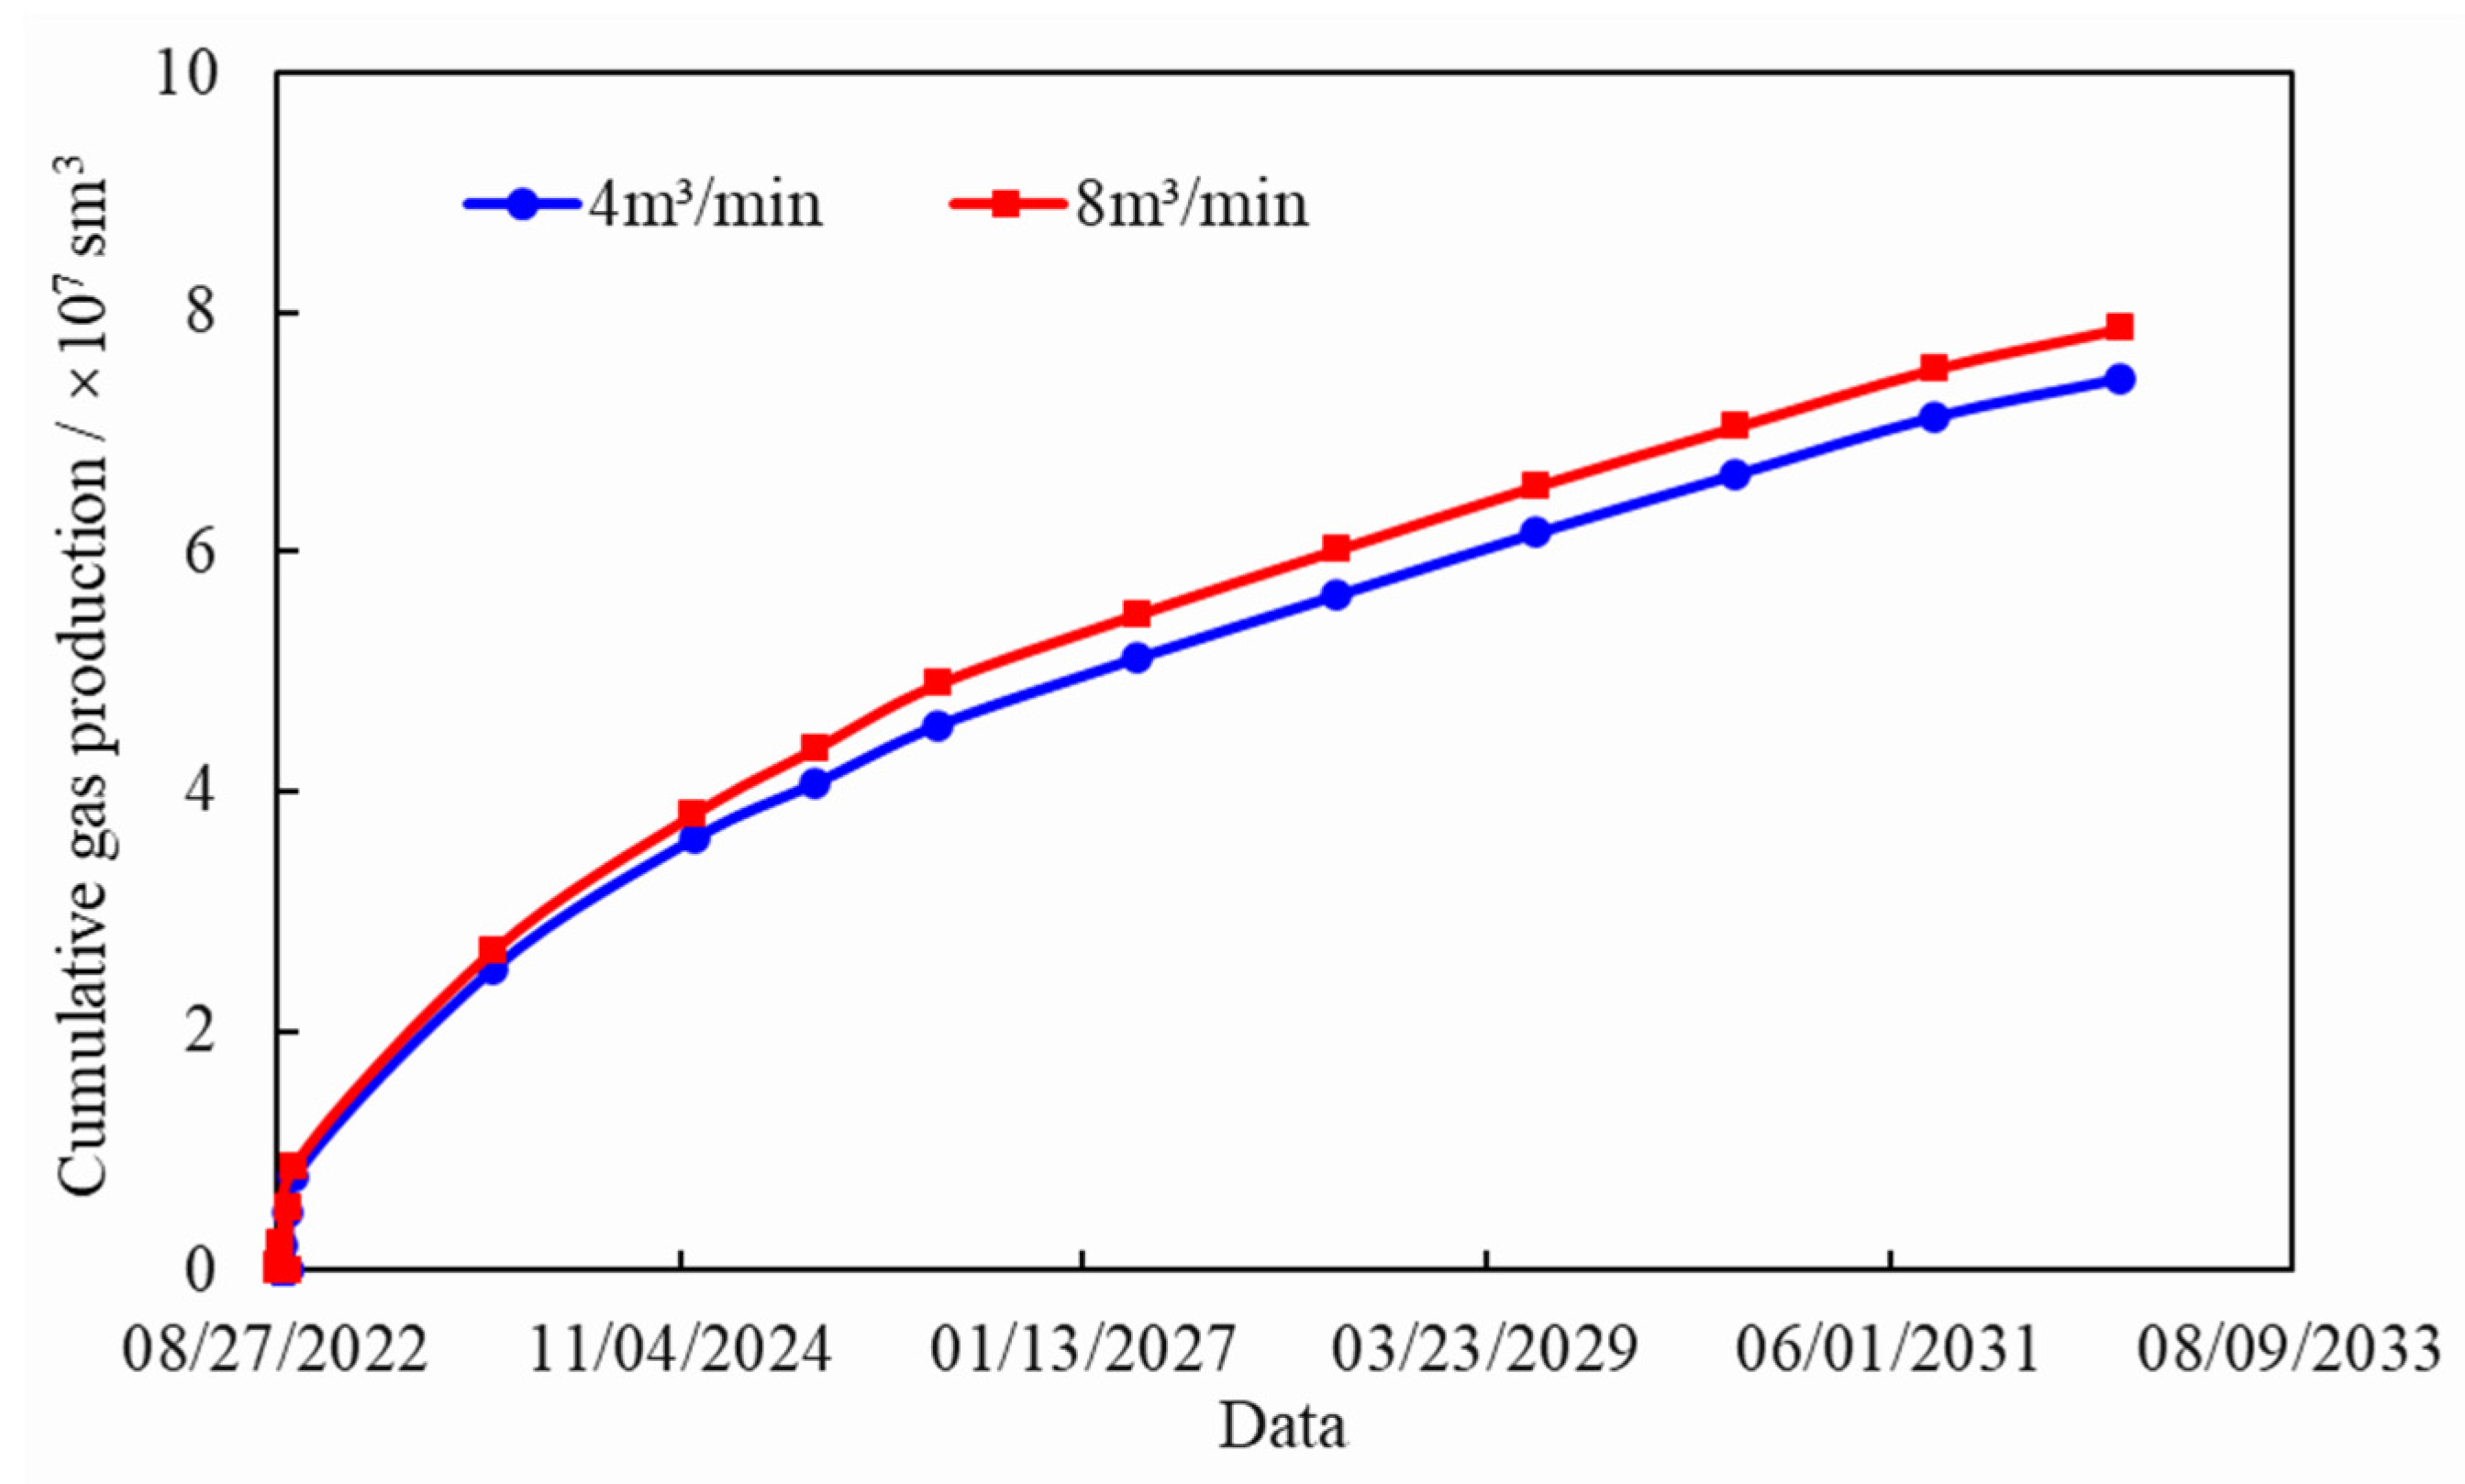
Figure 9: Variation curves of cumulative gas production of Well SN12 at different fracturing displacements.
3.2 Fracturing Production Simulation
An integrated fracturing and production simulation methodology was employed to conduct fracturing simulations across 11 wells, followed by the modeling of post-fracturing production dynamics. To accurately represent production behavior, bottomhole pressure control was implemented, integrating a range of geological and fluid parameters. Well SN08 was selected as a representative case, with its post-fracturing production dynamics model illustrated in Fig. 10 and the corresponding cumulative gas production matching curve displayed in Fig. 11. Through systematic parameter calibration, the model achieved a 90% alignment with historical field data, thereby validating its accuracy and reliability.
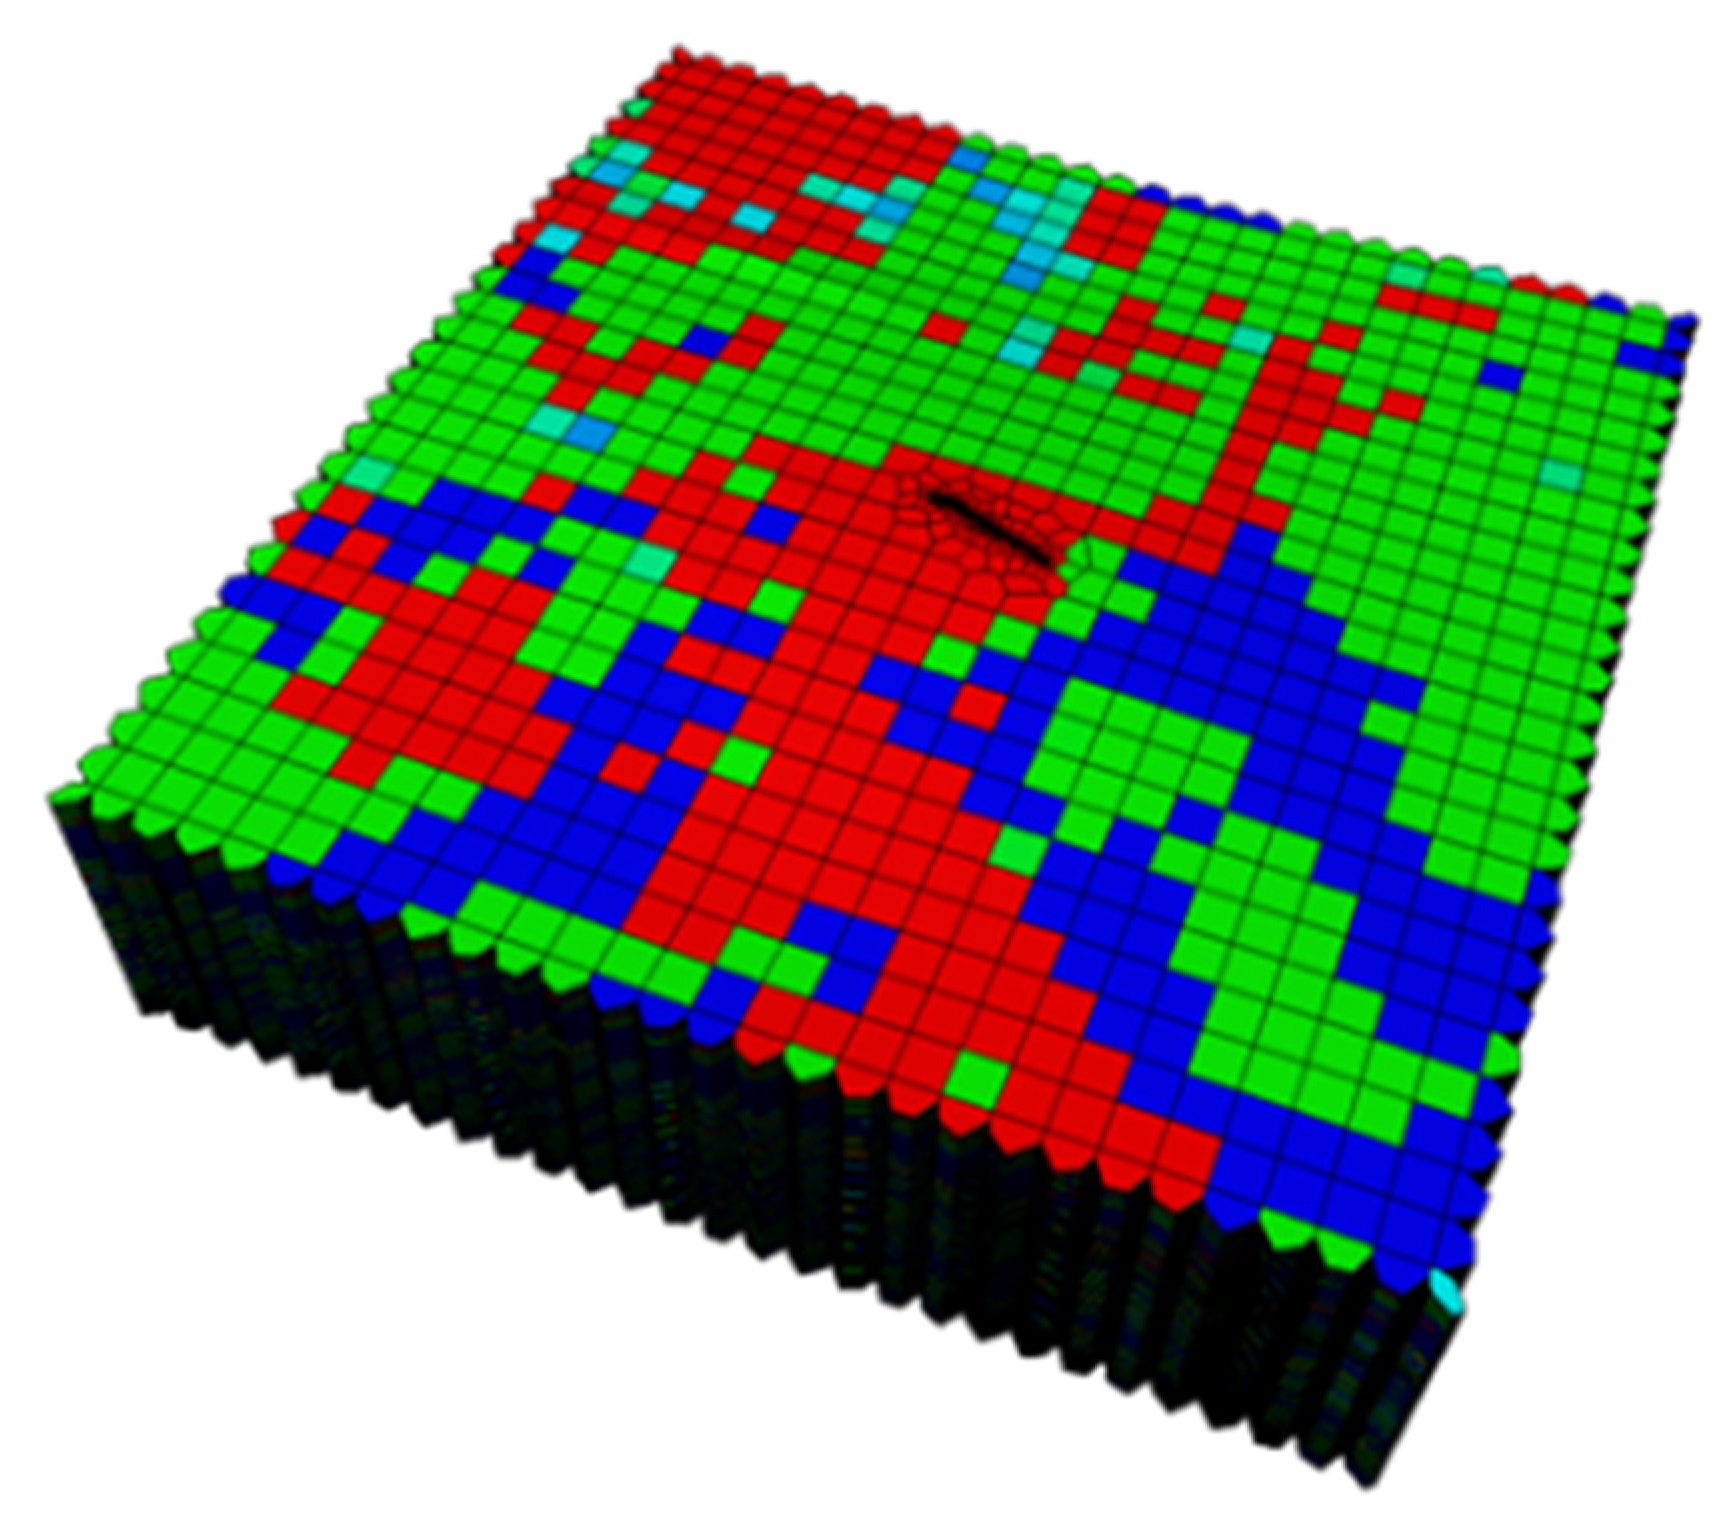
Figure 10: Post-fracturing production dynamics simulation model of Well SN08.
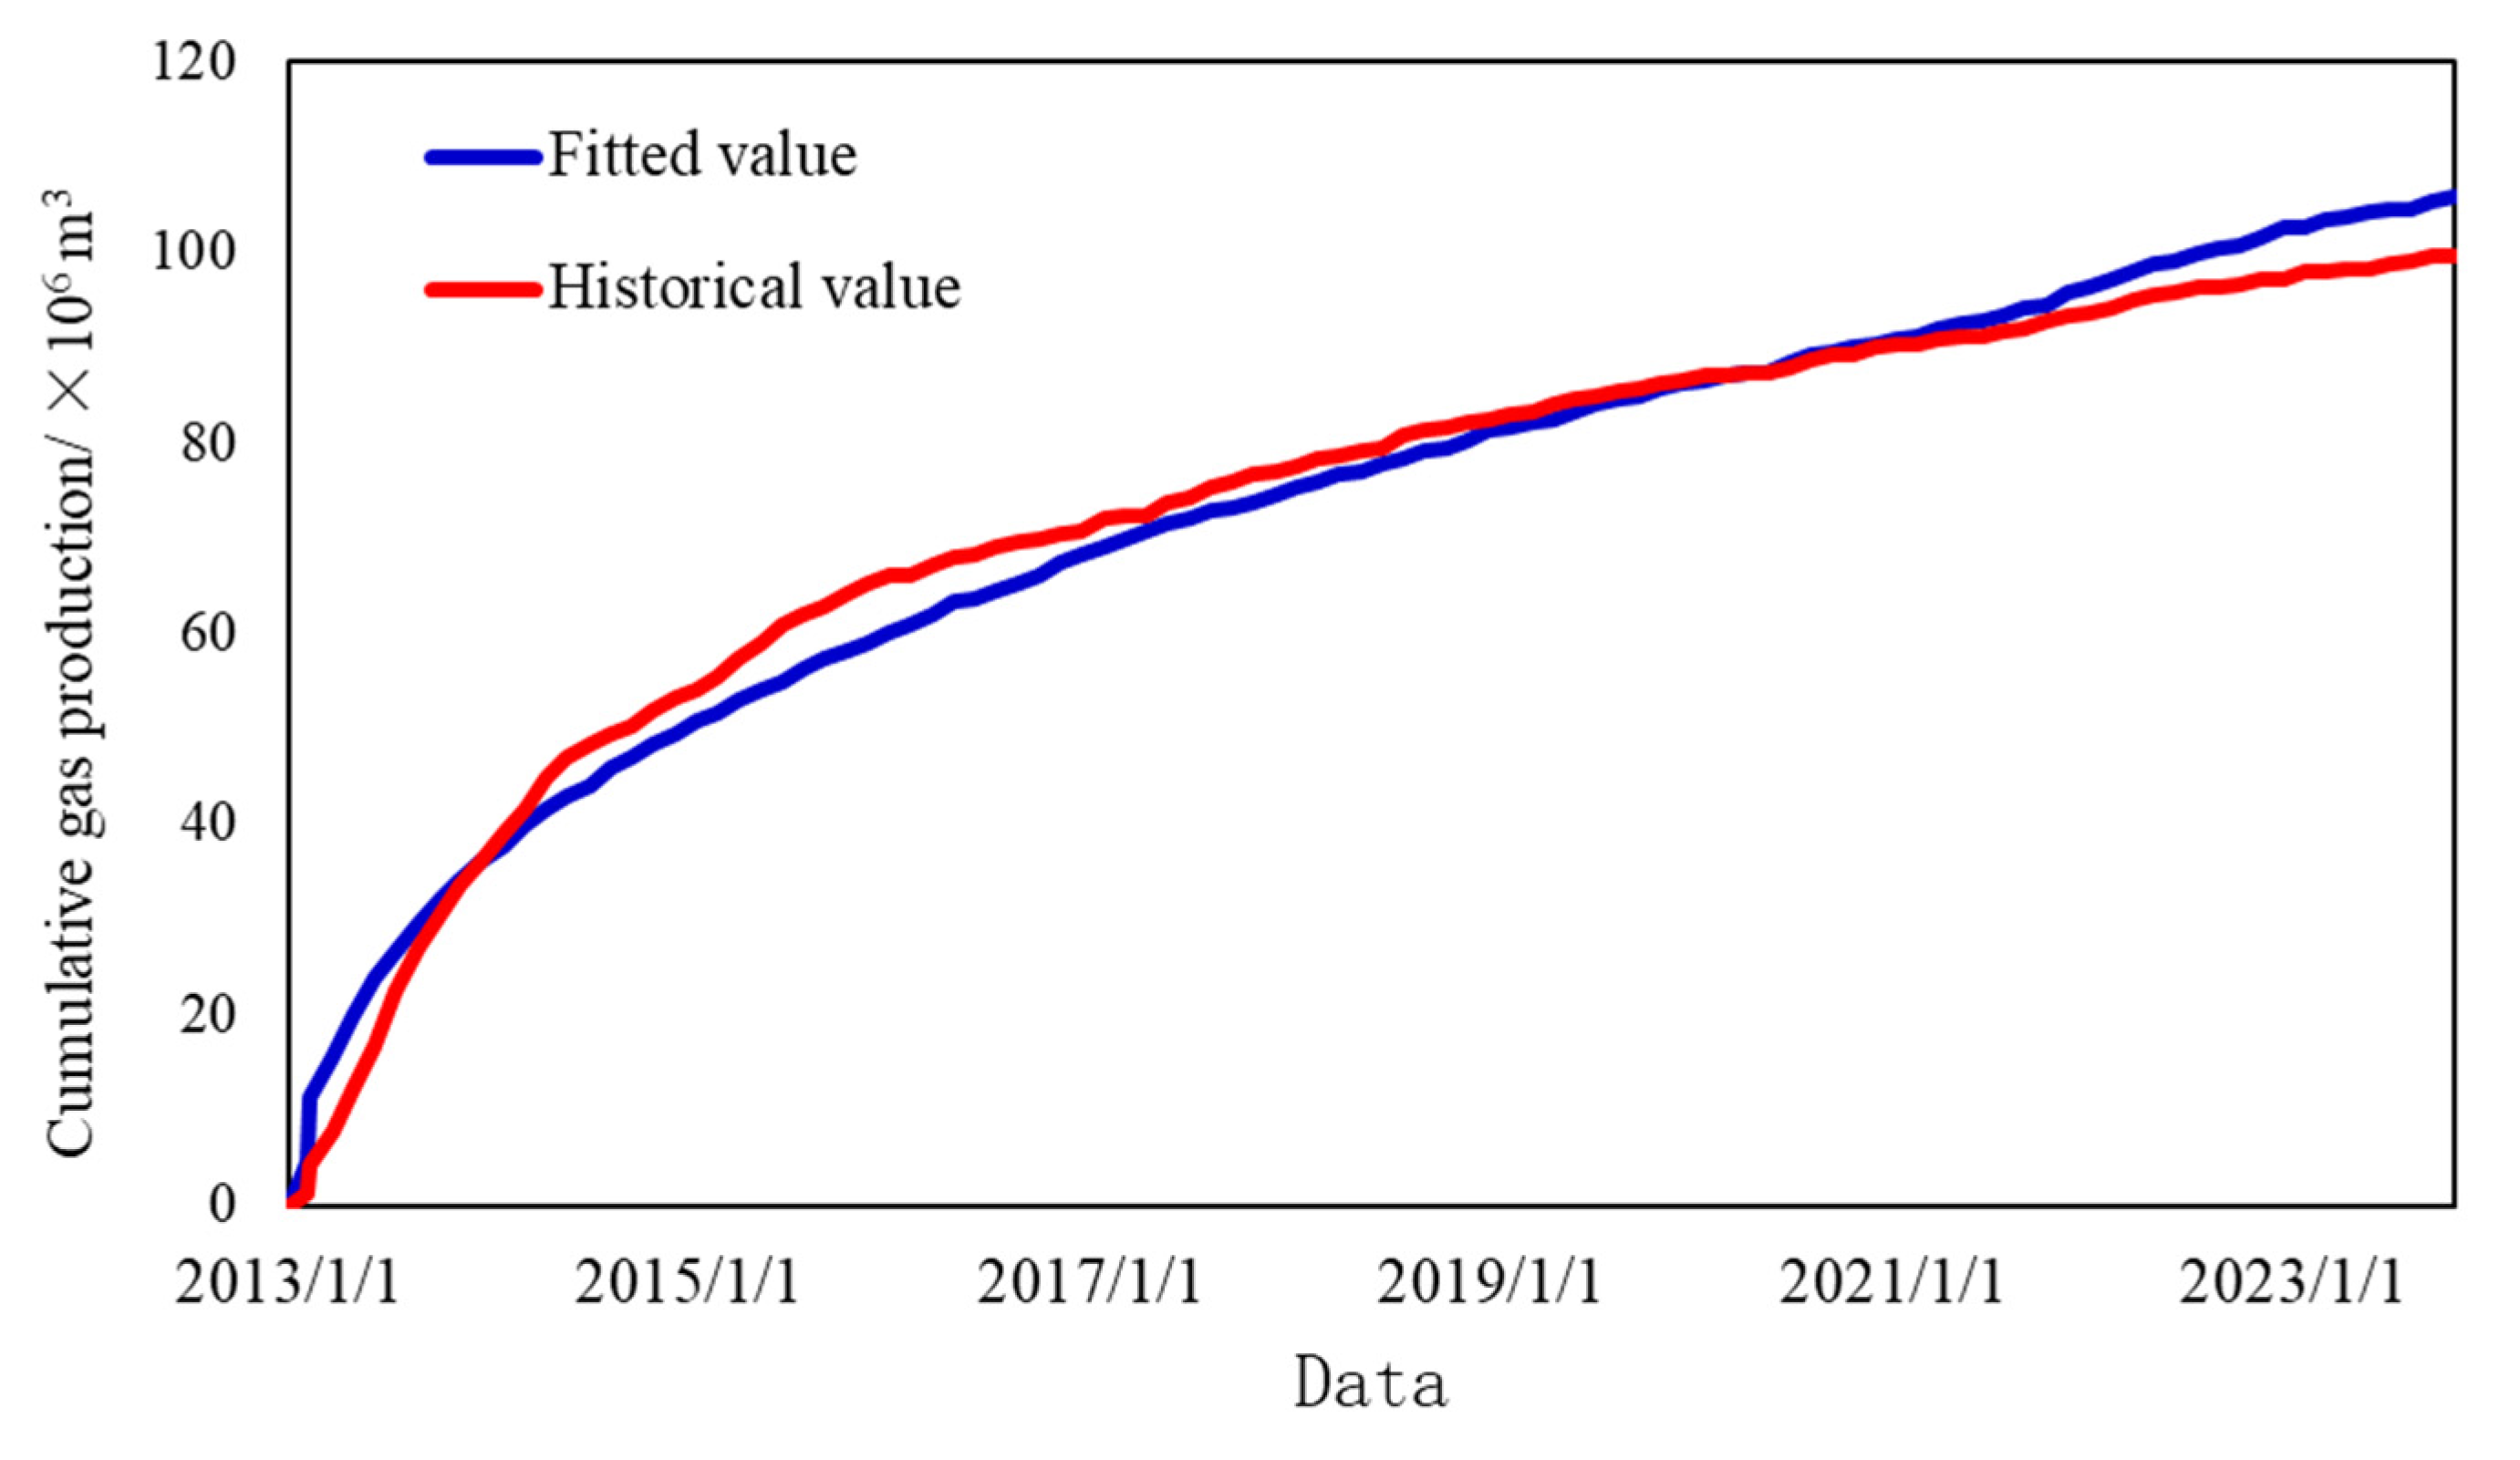
Figure 11: Cumulative gas production matching curve for Well SN08.
A comparative analysis of various fracturing displacement scenarios was carried out across all wells, supported by sensitivity analysis to interpret the observed variations in production dynamics. As presented in Table 6, under large-volume fracturing conditions, both fracture half-length and height exhibited increases, whereas fracture width and conductivity showed a decreasing trend. Specifically, fracture half-length extended by 18 to 56 m, and fracture height increased by 4 to 18 m. Production simulations incorporating bottomhole pressure control were conducted for the 11 wells, with the cumulative gas production under different displacement levels and the corresponding incremental production gains summarized in Table 6.
Table 6: Comparison of fracturing parameters at different fracturing flow rates.
| Well | Fracturing Displacement: 4 m3/min | Fracturing Displacement: 8 m3/min | Incremental Cumulative Gas Production/104 m3 | ||||||||
|---|---|---|---|---|---|---|---|---|---|---|---|
| Fracture Half-Length/m | Fracture Width/mm | Fracture Height/m | Fracture Conductivity/mD·m | Cumulative Gas Production/104 m3 | Fracture Half-Length/m | Fracture Width/mm | Fracture Height/m | Fracture Conductivity/mD·m | Cumulative Gas Production/104 m3 | ||
| SN01 | 89.61 | 3.04 | 57.82 | 1007.88 | 10,579.83 | 121.07 | 2.49 | 69.09 | 825.36 | 11,161.72 | 581.89 |
| SN02 | 53.57 | 3.35 | 57.95 | 1165.39 | 929.37 | 82.08 | 3.24 | 62.04 | 1119.81 | 957.25 | 27.88 |
| SN03 | 91.91 | 3.63 | 64.14 | 1201.63 | 3057.28 | 110.17 | 2.94 | 72.85 | 974.23 | 3155.12 | 97.83 |
| SN04 | 83.93 | 3.45 | 62.21 | 1132.29 | 2082.75 | 139.98 | 2.83 | 78.44 | 930.18 | 2213.08 | 130.33 |
| SN05 | 76.32 | 3.63 | 63.02 | 1183.62 | 5431.99 | 118.79 | 2.62 | 72.21 | 845.71 | 5746.81 | 314.82 |
| SN06 | 67.38 | 2.76 | 62.68 | 916.98 | 502.22 | 104.75 | 2.21 | 70.31 | 727.69 | 507.75 | 2.53 |
| SN07 | 56.83 | 2.28 | 59.94 | 755.33 | 952.56 | 83.67 | 2.25 | 69.54 | 745.83 | 988.75 | 36.19 |
| SN08 | 60.33 | 3.42 | 56.16 | 1097.60 | 188.26 | 111.65 | 2.32 | 66.37 | 800.13 | 225.91 | 37.65 |
| SN09 | 55.31 | 4.64 | 64.33 | 1551.26 | 4084.79 | 106.67 | 2.59 | 73.14 | 865.63 | 4252.27 | 167.48 |
| SN10 | 80.75 | 2.91 | 59.94 | 963.87 | 1053.02 | 114.86 | 2.33 | 73.00 | 770.31 | 1138.32 | 85.30 |
| SN11 | 72.6 | 3.65 | 55.01 | 1211.59 | 600.19 | 118.79 | 2.65 | 73.22 | 878.44 | 615.20 | 15.01 |
By comparing the gas saturation models of Wells SN01, SN04, SN03, and SN06 under different fracturing displacements within the same formation (Table 7), the post-production grid models were selected. Due to the longer fracture length generated at a displacement rate of 8 m3/min, dispersed tight gas caused by reservoir discontinuities can be more effectively connected, resulting in a larger swept volume compared to 4 m3/min. The gas saturation changes in Wells SN01, SN04, and SN03 demonstrate the impact of fracture propagation on production performance under large-volume fracturing, with incremental cumulative gas production exceeding 90 × 104 m3. In contrast, the effect of displacement on Well SN06 is minimal, as its swept area remains relatively unchanged, and there is little variation in production under different displacement conditions.
Table 7: Gas saturation models at different fracturing displacement in the same formation.
| Fracturing Displacement m3/min | Well SN01 | Well SN03 | Well SN04 | Well SN06 |
|---|---|---|---|---|
| 4 |  |  |  |  |
| 8 |  | 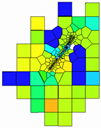 |  | 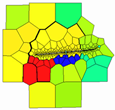 |
By conducting pressure screening on each production model, it is believed that when the pressure drop of the grid exceeds 1%, the grid is affected. Its gas production area expands, and the cumulative gas production of the production well increases. Meanwhile, due to the longer fracture length and larger affected area under high flow rates, the reservoir pressure drops faster during the production process compared to the 4 m3/min condition. The comparison of reservoir pressure for each well under different flow rates is shown in Table 8.
Table 8: Comparison of reservoir pressures under different fracturing displacement in each well.
| Well | Reservoir Pressure/MPa | Reservoir Pressure Drop/MPa | |
|---|---|---|---|
| Fracturing Displacement: 4 m3/min | Fracturing Displacement: 8 m3/min | ||
| SN01 | 7.37 | 7.02 | 0.35 |
| SN02 | 11.56 | 11.43 | 0.13 |
| SN03 | 7.21 | 7.08 | 0.13 |
| SN04 | 9.06 | 8.77 | 0.29 |
| SN05 | 10.83 | 10.47 | 0.36 |
| SN06 | 11.19 | 11.05 | 0.14 |
| SN07 | 7.86 | 7.71 | 0.15 |
| SN08 | 8.15 | 8.07 | 0.08 |
| SN09 | 9.85 | 9.52 | 0.33 |
| SN10 | 11.63 | 11.49 | 0.14 |
| SN11 | 8.83 | 8.72 | 0.11 |
An economic benefit evaluation model was employed to quantify the profitability of large-volume fracturing by integrating key factors such as gas prices, production rates, and operational costs, thereby facilitating the identification of the optimal fracturing strategy. Based on integrated fracturing and production numerical simulations combined with economic evaluation models (Eq. (1)), the suitability of 11 wells for large-volume fracturing was systematically assessed (Table 9). The evaluation results categorized 2 wells as highly suitable (production increase greater than 180 × 104 m3), 3 wells as moderately suitable (increase between 90–180 × 104 m3), 3 wells as unsuitable (increase between 30–90 × 104 m3), and 3 wells as highly unsuitable (stimulation less than 30 × 104 m3).
Table 9: Adaptability assessment of numerical simulation.
| Well | Increment of Gas Production after Fracturing with Large-Volume/104 m3 | Result Evaluation |
|---|---|---|
| SN01 | 581.89 | highly suitable |
| SN05 | 314.82 | |
| SN03 | 97.83 | moderately suitable |
| SN04 | 130.33 | |
| SN09 | 167.48 | |
| SN07 | 36.19 | unsuitable |
| SN08 | 37.65 | |
| SN10 | 85.30 | |
| SN02 | 27.88 | highly unsuitable |
| SN06 | 2.53 | |
| SN11 | 15.01 |
3.3 Adaptability Evaluation Method
Through a comparative analysis of nine key parameters—including effective reserves, average permeability, total permeability, average saturation, total saturation, average porosity, total porosity, average net-to-gross ratio, and total net-to-gross ratio-within a 1500-m radius around the 11 production wells in the target block, the relationship between geological parameters and cumulative gas production was clearly established (Table 10). Since average permeability, average saturation, average porosity, and average net-to-gross ratio exhibit minimal variation across the wells, they are not considered as primary evaluation indicators. Ultimately, five parameters-effective reserves, total net-to-gross ratio, total porosity, total permeability, and total saturation-were selected as the key indicators for evaluating the adaptability of large-volume fracturing to geological conditions.
Table 10: Geological parameter data.
| Well | Reserves/×104 m3 | Net-to-Gross | Porosity | Permeability/mD | Saturation | ||||
|---|---|---|---|---|---|---|---|---|---|
| Average | Total | Average | Total | Average | Total | Average | Total | ||
| SN01 | 227.28 | 0.54 | 2237.43 | 0.07 | 287.45 | 0.03 | 143.91 | 0.66 | 2727.1 |
| SN02 | 162.25 | 0.45 | 1430.64 | 0.07 | 212.44 | 0.05 | 156.63 | 0.62 | 1980.72 |
| SN03 | 186.17 | 0.54 | 1763.29 | 0.08 | 264.20 | 0.04 | 144.20 | 0.75 | 2429.95 |
| SN04 | 195.06 | 0.55 | 1902.98 | 0.07 | 243.56 | 0.04 | 148.48 | 0.67 | 2321.6 |
| SN05 | 210.97 | 0.56 | 2095.55 | 0.07 | 273.46 | 0.03 | 124.91 | 0.70 | 2631.51 |
| SN06 | 159.48 | 0.47 | 1608.35 | 0.06 | 209.57 | 0.03 | 105.54 | 0.6 | 2025.57 |
| SN07 | 149.41 | 0.46 | 1498.73 | 0.07 | 228.17 | 0.04 | 117.65 | 0.66 | 2145 |
| SN08 | 139.88 | 0.46 | 1459.25 | 0.09 | 215.15 | 0.04 | 116.88 | 0.65 | 2047.3 |
| SN09 | 186.99 | 0.51 | 1811.02 | 0.07 | 252.23 | 0.04 | 151.33 | 0.64 | 2268.49 |
| SN10 | 134.08 | 0.46 | 1363.84 | 0.07 | 204.12 | 0.03 | 85.72 | 0.64 | 1882.7 |
| SN11 | 153.22 | 0.46 | 1521.14 | 0.07 | 218.48 | 0.03 | 111.88 | 0.61 | 2020.56 |
In the Analytic Hierarchy Process (AHP), the relative importance of each evaluation indicator in relation to the overall objective is not necessarily equal. To accurately determine the weight of each indicator within the comprehensive evaluation framework, a pairwise comparison judgment matrix must be constructed. This matrix does not involve simultaneous comparison of all indicators, but rather evaluates them in pairs. This approach effectively reduces the complexity of comparing indicators with different attributes and improves the overall accuracy of the weighting process. The 9-point scale method is employed to perform these pairwise comparisons, allowing for the assignment of relative importance levels on a standardized scale ranging from 1 to 9. The weights assigned to each indicator in the evaluation system for the geological condition adaptability of large-volume fracturing are summarized in Table 11. The adaptability classification is divided into four grades: highly suitable, moderately suitable, unsuitable, and highly unsuitable.
Table 11: Weight and adaptability grade classification of evaluation indicators.
| Evaluation Indicators | Weight | Adaptability Grade | Range |
|---|---|---|---|
| effective reserves | 0.132 | highly suitable | >203 |
| moderately suitable | 203–180 | ||
| unsuitable | 180–157 | ||
| highly unsuitable | <157 | ||
| net-to-gross | 0.354 | highly suitable | >2017 |
| moderately suitable | 2017–1799 | ||
| unsuitable | 1799–1581 | ||
| highly unsuitable | <1581 | ||
| porosity | 0.032 | highly suitable | >264 |
| moderately suitable | 264–244 | ||
| unsuitable | 244–224 | ||
| highly unsuitable | <224 | ||
| permeability | 0.112 | highly suitable | >166 |
| moderately suitable | 166–139 | ||
| unsuitable | 139–112 | ||
| highly unsuitable | <112 | ||
| saturation | 0.369 | highly suitable | >2515 |
| moderately suitable | 2515–2304 | ||
| unsuitable | 2304–2093 | ||
| highly unsuitable | <2093 |
As shown in Fig. 12, which illustrates three trapezoidal membership functions essential for translating quantitative reservoir parameters into qualitative suitability grades: (1) The decreasing function models parameters where lower values enhance fracturing suitability, with A(x) = 1 when x < a and linear decay to 0 at x > b; (2) The triangular function captures optimal parameter ranges, peaking at A(x) = 1 over [b, c] while tapering to 0 at bounds a, d; (3) The increasing function requires thresholds exceeded, rising from A(x) = 0 at x < c to unity at x > d. Combined with the ladder function and evaluation grade division in the fuzzy evaluation method, the membership matrix of different grades of each indicator for 11 production Wells was finally calculated by using Matlab software. The adaptability evaluation decision matrix for Large-volume fracturing geological conditions of each production well was calculated by multiplying the membership matrix of the 11 wells with the weights of the corresponding evaluation indicators. As presented in Table 12, a comprehensive analysis of the decision matrix evaluation results indicates that Well SN08 and Well SN04 are highly suitable for large-volume fracturing. Wells SN03, SN02, and SN09 exhibit moderate suitability, Well SN06 is unsuitable, and Wells SN10, SN07, SN01, SN11, and SN05 are highly unsuitable for large-volume fracturing.
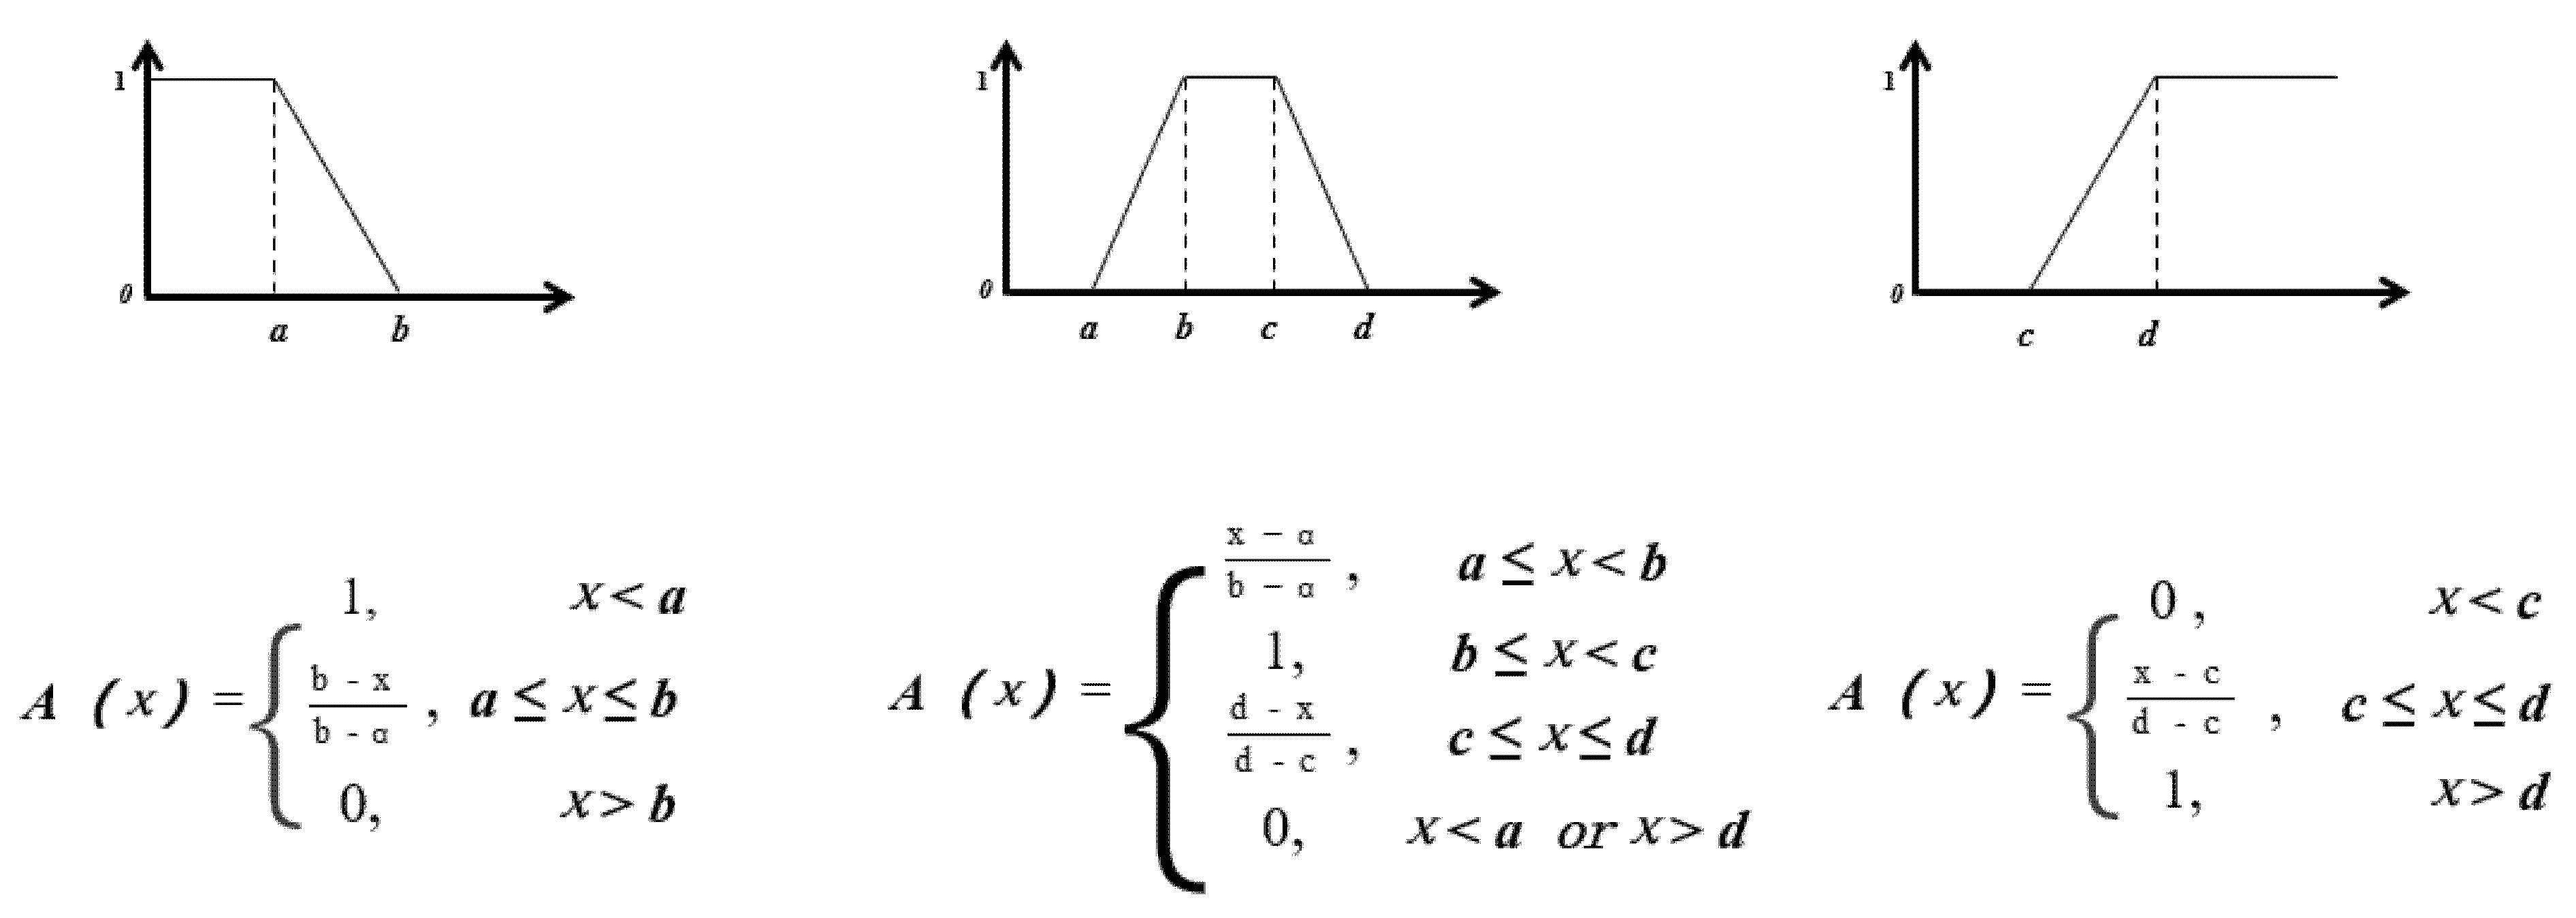
Figure 12: Ladder function.
Table 12: Evaluation results of decision matrix.
| Number | Well | Highly Suitable | Moderately Suitable | Unsuitable | Highly Unsuitable |
|---|---|---|---|---|---|
| 1 | SN01 | 0.91 | 0.11 | 0.09 | 0 |
| 2 | SN05 | 0.89 | 0.55 | 0.11 | 0.06 |
| 3 | SN04 | 0.33 | 1.00 | 0.67 | 0 |
| 4 | SN03 | 0.31 | 0.94 | 0.69 | 0.06 |
| 5 | SN09 | 0.12 | 0.94 | 0.87 | 0.06 |
| 6 | SN10 | 0 | 0 | 0.01 | 1.00 |
| 7 | SN08 | 0 | 0.02 | 0.61 | 0.98 |
| 8 | SN07 | 0 | 0.12 | 0.88 | 0.82 |
| 9 | SN02 | 0.07 | 0.14 | 0.47 | 0.86 |
| 10 | SN11 | 0 | 0 | 0.66 | 1.00 |
| 11 | SN06 | 0 | 0.06 | 0.83 | 0.94 |
In Table 13, the evaluation results of the numerical simulation method are compared with those of the decision matrix, and the evaluation results are basically consistent.
Table 13: Comparison of evaluation results.
| Well | Numerical Simulation Evaluation Results | Decision Matrix Evaluation Results |
|---|---|---|
| SN01 | suitable | suitable |
| SN05 | suitable | suitable |
| SN04 | moderately suitable | moderately suitable |
| SN03 | moderately suitable | moderately suitable |
| SN09 | moderately suitable | moderately suitable |
| SN10 | unsuitable | highly unsuitable |
| SN08 | unsuitable | highly unsuitable |
| SN07 | unsuitable | unsuitable |
| SN02 | highly unsuitable | highly unsuitable |
| SN11 | highly unsuitable | highly unsuitable |
| SN06 | highly unsuitable | highly unsuitable |
- (1)Large-volume fracturing was conducted and its fracture parameters were compared. The results show that increasing fracturing displacement leads to an increase in fracture length and height, while fracture width and conductivity decrease. Based on these fracturing outcomes, an integrated fracturing and production simulation was carried out. The simulation results indicate that higher fracturing displacement accelerates the decline in average reservoir pressure and enhances gas recovery efficiency. Long fractures formed under high displacement effectively connect dispersed tight gas zones, expand the swept volume, and improve production well output. When displacement was increased from 4 m3/min to 8 m3/min, cumulative gas production over ten years increased by 6%.
- (2)Through the analysis of reservoir geological parameters, key indicators for evaluating the geological condition adaptability of large-volume fracturing were identified. A ladder function and evaluation grade division were applied to construct a decision matrix for assessing the geological adaptability of large-volume fracturing for each production well. The evaluation results reveal that two wells are highly suitable, three wells are moderately suitable, one well is unsuitable, and five wells are highly unsuitable for large-volume fracturing. A comparison between the numerical simulation results and the decision matrix method demonstrates consistency between the two approaches, thereby validating the feasibility and reliability of the proposed evaluation methodology.
Acknowledgement:
Funding Statement: The research is supported by open fund of Hubei Key Laboratory of Oil and Gas Drilling and Production Engineering (Yangtze University) YQZC202404.
Author Contributions: The authors confirm contribution to the paper as follows: investigation, Fuyang Wu; data curation, Libin Dai; software, Bo Wang; formal analysis, Yifan Dong; writing—original draft preparation, Zifeng Chen; writing—review and editing, Zongfa Li; supervision, Xiaotao Gao. All authors reviewed the results and approved the final version of the manuscript.
Availability of Data and Materials: The data that support the findings of this study are available from the corresponding author upon reasonable request.
Ethics Approval: Not applicable.
Conflicts of Interest: The authors declare no conflicts of interest to report regarding the present study.
References
1. Dai JX , Dong DZ , Ni YY , Gong DY , Huang SP , Hong F , et al. Distribution patterns of tight sandstone gas and shale gas. Petrol Explor Dev. 2024; 51( 4): 767– 79. (In Chinese). doi:10.11698/PED.20240377. [Google Scholar] [CrossRef]
2. Zeng JH , Zhang YX , Zhang ZZ , Qiao JC , Wang MY , Chen DX , et al. Complex gas-water contacts in tight sandstone gas reservoirs: distribution pattern and dominant factors controlling their formation and distribution. Oil Gas Geol. 2023; 44( 5): 1067– 83. (In Chinese). [Google Scholar]
3. Wang YL , Hao CC , Shao GC . Fracturing technology for enhancing fracture-controlled volume in tight gas horizontal wells. Oil Gas Well Test. 2022; 31( 6): 40– 4. (In Chinese). [Google Scholar]
4. Mahesar AA , Abbasi GR , Shar AM , Shaikh M . Morphological and petrophysical evaluation of tight gas resources and energy production in Pakistan. Mehran Univ Res J Eng Technol. 2022; 41( 3): 168– 74. doi:10.22581/muet1982.2203.17. [Google Scholar] [CrossRef]
5. Gao H , Li HA . Pore structure characterization, permeability evaluation and enhanced gas recovery techniques of tight gas sandstones. J Nat Gas Sci Eng. 2016; 28: 536– 47. doi:10.1016/j.jngse.2015.12.018. [Google Scholar] [CrossRef]
6. Jia A , Wei Y , Guo Z , Wang G , Meng D , Huang S . Development status and prospect of tight sandstone gas in China. Nat Gas Ind B. 2022; 9( 5): 467– 76. doi:10.1016/j.ngib.2022.10.001. [Google Scholar] [CrossRef]
7. Zeng L , Gong L , Guan C , Zhang B , Wang Q , Zeng Q , et al. Natural fractures and their contribution to tight gas conglomerate reservoirs: a case study in the northwestern Sichuan Basin, China. J Petrol Sci Eng. 2022; 210: 110028. doi:10.1016/j.petrol.2021.110028. [Google Scholar] [CrossRef]
8. An Q , Yang F , Yang RY , Huang ZW , Li GS , Gong YJ , et al. Practice and understanding of deep coalbed methane massive hydraulic fracturing in Shenfu Block, Ordos Basin. J China Coal Soc. 2024; 49( 5): 2376– 93. (In Chinese). [Google Scholar]
9. Li J , Zhao JZ , Wei XS , Shang XQ , Wu WT , Wu HY , et al. Gas expansion caused by formation uplifting and its effects on tight gas accumulation: a case study of Sulige gas field in Ordos Basin, NW China. Petrol Explor Dev. 2022; 49( 6): 1266– 81. (In Chinese). doi:10.11698/PED.20220324. [Google Scholar] [CrossRef]
10. Liang X , Zhou F , Han G , Zhu Z , Xiang H , Liang T . Experimental study on fracture conductivity in high temperature and high pressure tight gas formation: a case of Tarim basin in China. Gondwana Res. 2022; 107: 49– 58. doi:10.1016/j.gr.2022.03.003. [Google Scholar] [CrossRef]
11. Li X , Su JB , Xie XD , Han JH , Guo XM . Analysis of the factors of affecting the result of hydraulic fracturing—taking S3 reservoir of F11-111 block as an example. J Xi’an Petrol Inst. 2002; 17( 5): 28– 31. (In Chinese). [Google Scholar]
12. Zhou L , Hou MZ , Gou Y , Li M . Numerical investigation of a low-efficient hydraulic fracturing operation in a tight gas reservoir in the North German Basin. J Petrol Sci Eng. 2014; 120: 119– 29. doi:10.1016/j.petrol.2014.06.001. [Google Scholar] [CrossRef]
13. Ren L , Wang J , Zhao C , Jing C , Sun J , Zhou D , et al. Optimization of fine-fracture distribution patterns for multi-stage and multi-cluster fractured horizontal wells in tight gas reservoirs. Processes. 2024; 12( 7): 1392. doi:10.3390/pr12071392. [Google Scholar] [CrossRef]
14. Cao X , Zhang HZ , Sun MW . Research supporting and scale application of large displacement re-fracturing technology for horizontal well in Yuan284 well area. In: Proceedings of the International Field Exploration and Development Conference 2021; 2021 Sep 16–18; Qingdao, China. Singapore: Springer Nature; 2022. p. 3153– 8. doi:10.1007/978-981-19-2149-0_294. [Google Scholar] [CrossRef]
15. Xia K , Wang W , Cui Y . Identifying perforation locations for hydraulic fracturing treatment in deep and tight sandstone gas reservoirs. Rock Mech Bull. 2024; 3( 3): 100131. doi:10.1016/j.rockmb.2024.100131. [Google Scholar] [CrossRef]
16. Zou YS , Yang C , Zhang SC , Ma XF , Li YC , Zou LQ . Multi-fracture growth behavior during TPDF in a horizontal well of multi-clustered perforations: an experimental research. Petrol Sci. 2024; 21( 6): 4230– 47. doi:10.1016/j.petsci.2024.08.003. [Google Scholar] [CrossRef]
17. Zhang B , Guo T , Chen M , Xue L , Zhang Y , Hu Z , et al. Experimental research on hydraulic fracture evolution characteristics of multi-well pad fracturing in a tight conglomerate reservoir. Eng Fract Mech. 2024; 312: 110609. doi:10.1016/j.engfracmech.2024.110609. [Google Scholar] [CrossRef]
18. Lei Q , Yang L , Duan Y , Weng D , Wang X , Guan B , et al. The “fracture-controlled reserves” based stimulation technology for unconventional oil and gas reservoirs. Petrol Explor Dev. 2018; 45( 4): 770– 8. doi:10.1016/S1876-3804(18)30080-6. [Google Scholar] [CrossRef]
19. Xie S , Kumagai S , Kim YM , Saito Y , Yoshioka T . Combining hierarchical clustering analysis with a simplex lattice mixture design in rapidly identifying the pyrolytic interactions and predicting the product yields during the co-pyrolysis of cellulose, xylan, and milled wood lignin. Chem Eng J. 2024; 493: 152434. doi:10.1016/j.cej.2024.152434. [Google Scholar] [CrossRef]
20. Koucheki R , Wolfstadt JI , Chang JS , Backstein DJ , Lex JR . Total knee arthroplasty with robotic and augmented reality guidance: a hierarchical task analysis. Arthroplast Today. 2024; 27: 101389. doi:10.1016/j.artd.2024.101389. [Google Scholar] [CrossRef]
21. Li DH , Tian LY , Nie HK , Peng ZY . Factor analysis and comprehensive evaluation model of shale gas well productivity based on fuzzy analytic hierarchy process: taking Jiao Shiba shale gas field in Sichuan Basin as an example. Pet Reser Evalu Dev. 2022; 12( 3): 417– 28. (In Chinese). [Google Scholar]
22. Zhang C , Xia FG , Xia YQ , Zhou XL . Comprehensive evaluation of fracability of tight sandstone reservoirs based on analytic hierarchy process. Drill Prod Technol. 2021; 44( 1): 61– 4. (In Chinese). [Google Scholar]
Cite This Article
 Copyright © 2025 The Author(s). Published by Tech Science Press.
This work is licensed under a Creative Commons Attribution 4.0 International License , which permits unrestricted use, distribution, and reproduction in any medium, provided the original work is properly cited.
 Downloads
 Citation Tools