
 Submit a Paper
 Propose a Special lssue
 Open Access
ARTICLE

Jet Pump Structural Optimization through CFD Analysis and Experimental Validation
1 China Oilfield Services Limited, Tianjin, 300459, China
2 State Key Laboratory of Oil & Gas Reservoir Geology and Exploitation, Southwest Petroleum University, Chengdu, 610500, China
* Corresponding Author: Zhengqiang Peng. Email:
(This article belongs to the Special Issue: Model-Based Approaches in Fluid Mechanics: From Theory to industrial Applications)
Fluid Dynamics & Materials Processing 2025, 21(12), 2945-2961. https://doi.org/10.32604/fdmp.2025.073281
Received 15 September 2025; Accepted 26 November 2025; Issue published 31 December 2025
 View Full Text
 Download PDF
Abstract
Jet pumps often suffer from efficiency losses due to the intense mixing of power and suction fluids, which leads to significant kinetic energy dissipation. Enhancing the efficiency of such pumps requires careful optimization of their structural parameters. In this study, a computational fluid dynamics (CFD) model of a hydraulic jet sand-flushing pump is developed to investigate the effects of throat-to-nozzle distance, area ratio, and throat length on the pump’s sand-carrying performance. An orthogonal experimental design is employed to optimize the structural parameters, while the influence of sand characteristics on pumping performance is systematically evaluated. Complementary indoor experiments are used to validate the numerical results, yielding an optimized configuration with a throat-to-nozzle cross-sectional area ratio of 4, a throat length five times the throat diameter, and a throat-to-nozzle distance equal to the nozzle diameter. Under a power fluid flow rate of 1.7 m3/h with this area ratio, the sand-carrying efficiency reaches its peak, achieving a sand transport rate of 290 g/min (6.7 L/h). Comparison of CFD predictions with experimental data across different area ratios demonstrates excellent agreement, with an average relative error of 2.44% and an average absolute error of 3.56%, confirming the reliability of the simulation approach.Keywords
As a type of fluid machinery, jet pumps have been widely used in downhole oil production and sand-carrying operations due to their advantages, including a lack of moving parts, simple operation, and stable performance. However, the kinetic energy loss caused by the intense mixing of the power fluid and suction fluid inside the pump can also lead to inefficiency.
Numerous theoretical studies on jet pumps have been conducted by scholars worldwide. For example, Sadia et al. investigated the effects of hybrid models [1] and structures [2,3,4] on annular jet pumps [5,6,7] using the computational fluid dynamics (CFD) method [8]. Other studies have employed 2D models to investigate jet pumps [9,10,11]. In comparison, there has been limited research on their sand-flushing applications. Jet pump technology for crude oil production is well established; its sand-transport applications constitute a liquid-solid two-phase jet for conveying solid particles. This mean that the characteristics and governing principles of jet pumps differ significantly from those of single-phase jets.
At present, research into the properties of liquid-solid two-phase jet pumps remains scarce. Thus far, studies primarily have employed CFD methods [12,13,14,15], which offer advantages such as reduced computational time and convenient parameter adjustments. The current paper employs a physics-based CFD model, which is more advantageous because of its inherent interpretability. This stands in stark contrast to data-driven models, such as coupled CFD-machine learning optimization of inlet water-jet orifices in jet impact negative pressure reactors [16], and represents an alternative approach to complex system modelling.
Despite their formidable capabilities, data-driven models are often regarded as “black boxes” due to their insufficient physical interpretability. This precisely highlights the advantages of employing physics-based CFD methods, which offer direct physical interpretability to achieve research design optimization objectives. While alternative data-driven approaches, this limitation reinforces the value of using the physics-based approach adopted in the present study to achieve a mechanistic understanding and design optimization of a jet pump’s structural parameters.
Therefore, the current study established a CFD numerical model of hydraulic jet sand-flushing pumps to analyze the effects of nozzle-to-throat distance (NTD), area ratio, and throat length on the sand-carrying efficiency of jet pump. In particular, the structural parameters of the jet pump were optimized based on an orthogonal experimental design. Furthermore, the influence of sand parameters on jet pumps’ sand transport performance was investigated, and laboratory experiments on jet-driven sand transport were conducted to validate the reliability of the CFD simulation results.
The jet pump structure consists of four main components: the suction section, nozzle, throat, and diffuser section. A standard jet pump configuration with the following dimensions was adopted (Fig. 1).
Figure 1: Schematic diagrams of a Jet Pump: (a) cross-sectional dimensions; (b) diagram of jit pump gird; (c) jet pump mesh and boundary layer refinement.
A computational model of the jet pump was developed based on its structural parameters, and mesh generation was performed using Workbench software. Next, a 3D model was established, and the boundary layer was refined. The Eulerian multiphase model was also selected for the multiphase flow simulation. This approach is consistent with established methods for modeling jet-based systems, in which the interaction between fluid flow and mass transfer is critical. The RNG k-ε model was adopted for turbulence modeling. As this model is relatively sensitive to the influence of streamline curvature, it is considered well suited for jet pump applications. The power fluid inlet and suction fluid, inlet were set as velocity inlets, water was used as the power fluid and a sand–water mixture (10% sand concentration) served as the suction fluid. The mixture outlet was set as a pressure outlet. The pressure-velocity coupling was resolved using the SIMPLEC algorithm, with all residual convergence criteria set to 10−6. Furthermore, transient simulation was conducted using a time step of 0.001 s.
Next, to ensure computational accuracy, a grid independence verification was conducted. Simulation results for five models with different grid densities are shown in Fig. 2, In which the error bars represent deviations from the preceding data. The result indicates that increasing the mesh size from 500,000 to 600,000 elements caused only a marginal efficiency variation of 0.144%. Thus, considering computational precision and time efficiency, a grid size of 500,000 elements was selected for the present study.
Figure 2: Grid independence verification.
Jet pump efficiency is defined as: the ratio of the energy gained by the suction fluid to the energy supplied by the motive fluid. It is expressed as follows:
Three turbulence models were selected for validating the jet pump simulations. While keeping the other parameters constant, the nozzle diameter varied from 3 to 5 mm in increments of 0.5 mm (specifically: 3, 3.5, 4, 4.5, and 5 mm). Fig. 3 presents a comparison of jet pump efficiencies under the three turbulence models at varying nozzle diameters.
Figure 3: Jet pumps efficiencies under three turbulence models at varying nozzle diameters.
2.2 Laboratory Sand-Carrying Experiment
To verify the reliability of the CFD simulations, a jet pump sand-carrying experimental setup was designed (Fig. 4). The experimental system consisted of a test pipe section and a measurement/control system. The test pipe section had a total length of 4 m and featured a jet pump connected to 2 m pipe segments at both the inlet and outlet. A side pipe section was linked to a centrifugal pump, and the bottom pipe included a casing pipe with a diameter of 120 mm and a wall thickness of 10 mm. The power fluid was continuously supplied by the centrifugal pump drawing from a water tank, which the jet pump generated suction at the bottom to extract the sand-fluid mixture. The sand particles used in the experiment were spherical, with a particle size of 0.3 mm and a density of 1.6 g/cm3. Once the liquid flow stabilized, the mixture was collected at fixed intervals, and sand discharge was measured under steady-state conditions. Furthermore, the measurement/control system included a liquid flow meter to monitor the inflow rate. All data were recorded by a paperless recorder and transmitted to a computer for subsequent analysis.
Figure 4: Jet Pump Experimental Diagram: (a) experimental flowchart; (b) experimental setup diagram.
Physical diagrams of the diffuser and throat sections of the jet pump are shown in Fig. 5.
Figure 5: Jet pump partial structure diagram: (a) physical diagram of the diffuser section; (b) physical dia-gram of the throat section.
3.1 Optimization of the Jet Pump Structural Parameters
3.1.1 Influence of Nozzle-to-Throat Distance on Efficiency
The NTD(d) is defined as the length from the nozzle exit to the throat inlet, typically expressed in multiples of the nozzle diameter. In the present study, simulations were conducted for NTD of 0.5, 1, 1.5, and 2d (where d represents the nozzle diameter). The contour maps of the jet pump cross-section at different NTD are presented in Fig. 6. At the NTD of 0.5, the close proximity of the nozzle to the throat prevents uniform fluid mixing and leads to inefficient kinetic energy transfer, thus resulting in low pump efficiency. At the NTD of 1, the fluid velocity at the throat outlet stabilizes with minimal fluctuation, indicating that the motive and suction fluids have been thoroughly mixed, along with minimal sand accumulation and optimal pump performance. However, when the NTD exceeds 1, the increased distance leads to premature mixing of the high-speed motive fluid, causing early kinetic energy dissipation and a consequent drop in pump efficiency.
Figure 6: Contour maps of the jet pump cross-section at NTD: (a) liquid phase velocity; (b) sand particle trajectories; (c) sand phase distribution.
A comparison of jet pumps efficiencies at different NTD is shown in Fig. 7. The figure shows that, as the NTDincreases, the efficiency first increases and then decreases, reaching its maximum value of 13.89% at a NTD of 1d.
Figure 7: Jet pumps efficiencies at different NTD.
3.1.2 Influence of Area Ratio on Efficiency
The area ratio (m) is defined as the ratio of the throat cross-sectional area to the nozzle outlet cross-sectional area. With the nozzle diameter fixed, the throat diameter was varied to 6, 8, 10, and 12 mm, corresponding to simulated area ratios of 2.25, 4, 6.25, and 9, respectively. The pressure characteristics of the jet pump under these area ratios were analyzed. Furthermore, pump efficiency during sand-carrying operation was calculated based on the flow ratio and pressure ratio, facilitating an assessment of the area ratio’s influence on jet pump performance. Fig. 8 shows the contour maps of the jet pump cross-section at different area ratios. As can be seen, when the area ratio is 2.25, the liquid flow velocity is relatively high, and the power and suction fluid are not fully mixed, resulting in poor pump performance. A smaller area ratio (m = 2.25) creates a high-velocity core but fails to entrain the suction fluid effectively, while a very large ratio (m = 9) slows the mixture and increases frictional losses. In comparison, the optimal ratio (m = 4) appears to balance these effects, maximizing momentum transfer from the power fluid to the sand–water mixture. This principle of tuning jet geometry to control process outcomes is a central theme in related jet-based technologies. Similarly, the CFD model in the present study simulates the distribution of velocity and sand concentration to predict the overall pump efficiency. The results indicate that jet pump efficiency initially increases and then decreases. In all these cases, the fluid dynamics established immediately downstream of the nozzle determine system performance, demonstrating a shared underlying physical principle despite the different engineering goals.
Figure 8: Contour maps of the jet pump cross-section at different area ratios: (a) liquid phase velocity; (b) sand particle trajectories; (c) sand phase distribution.
Fig. 9 illustrates the jet pump efficiencies at different area ratios. Within the range of area ratios from 2.25 to 9, efficiency first increases and then decreases as the area ratio increases, reaching its maximum value of 13.89% at an area ratio of 4.
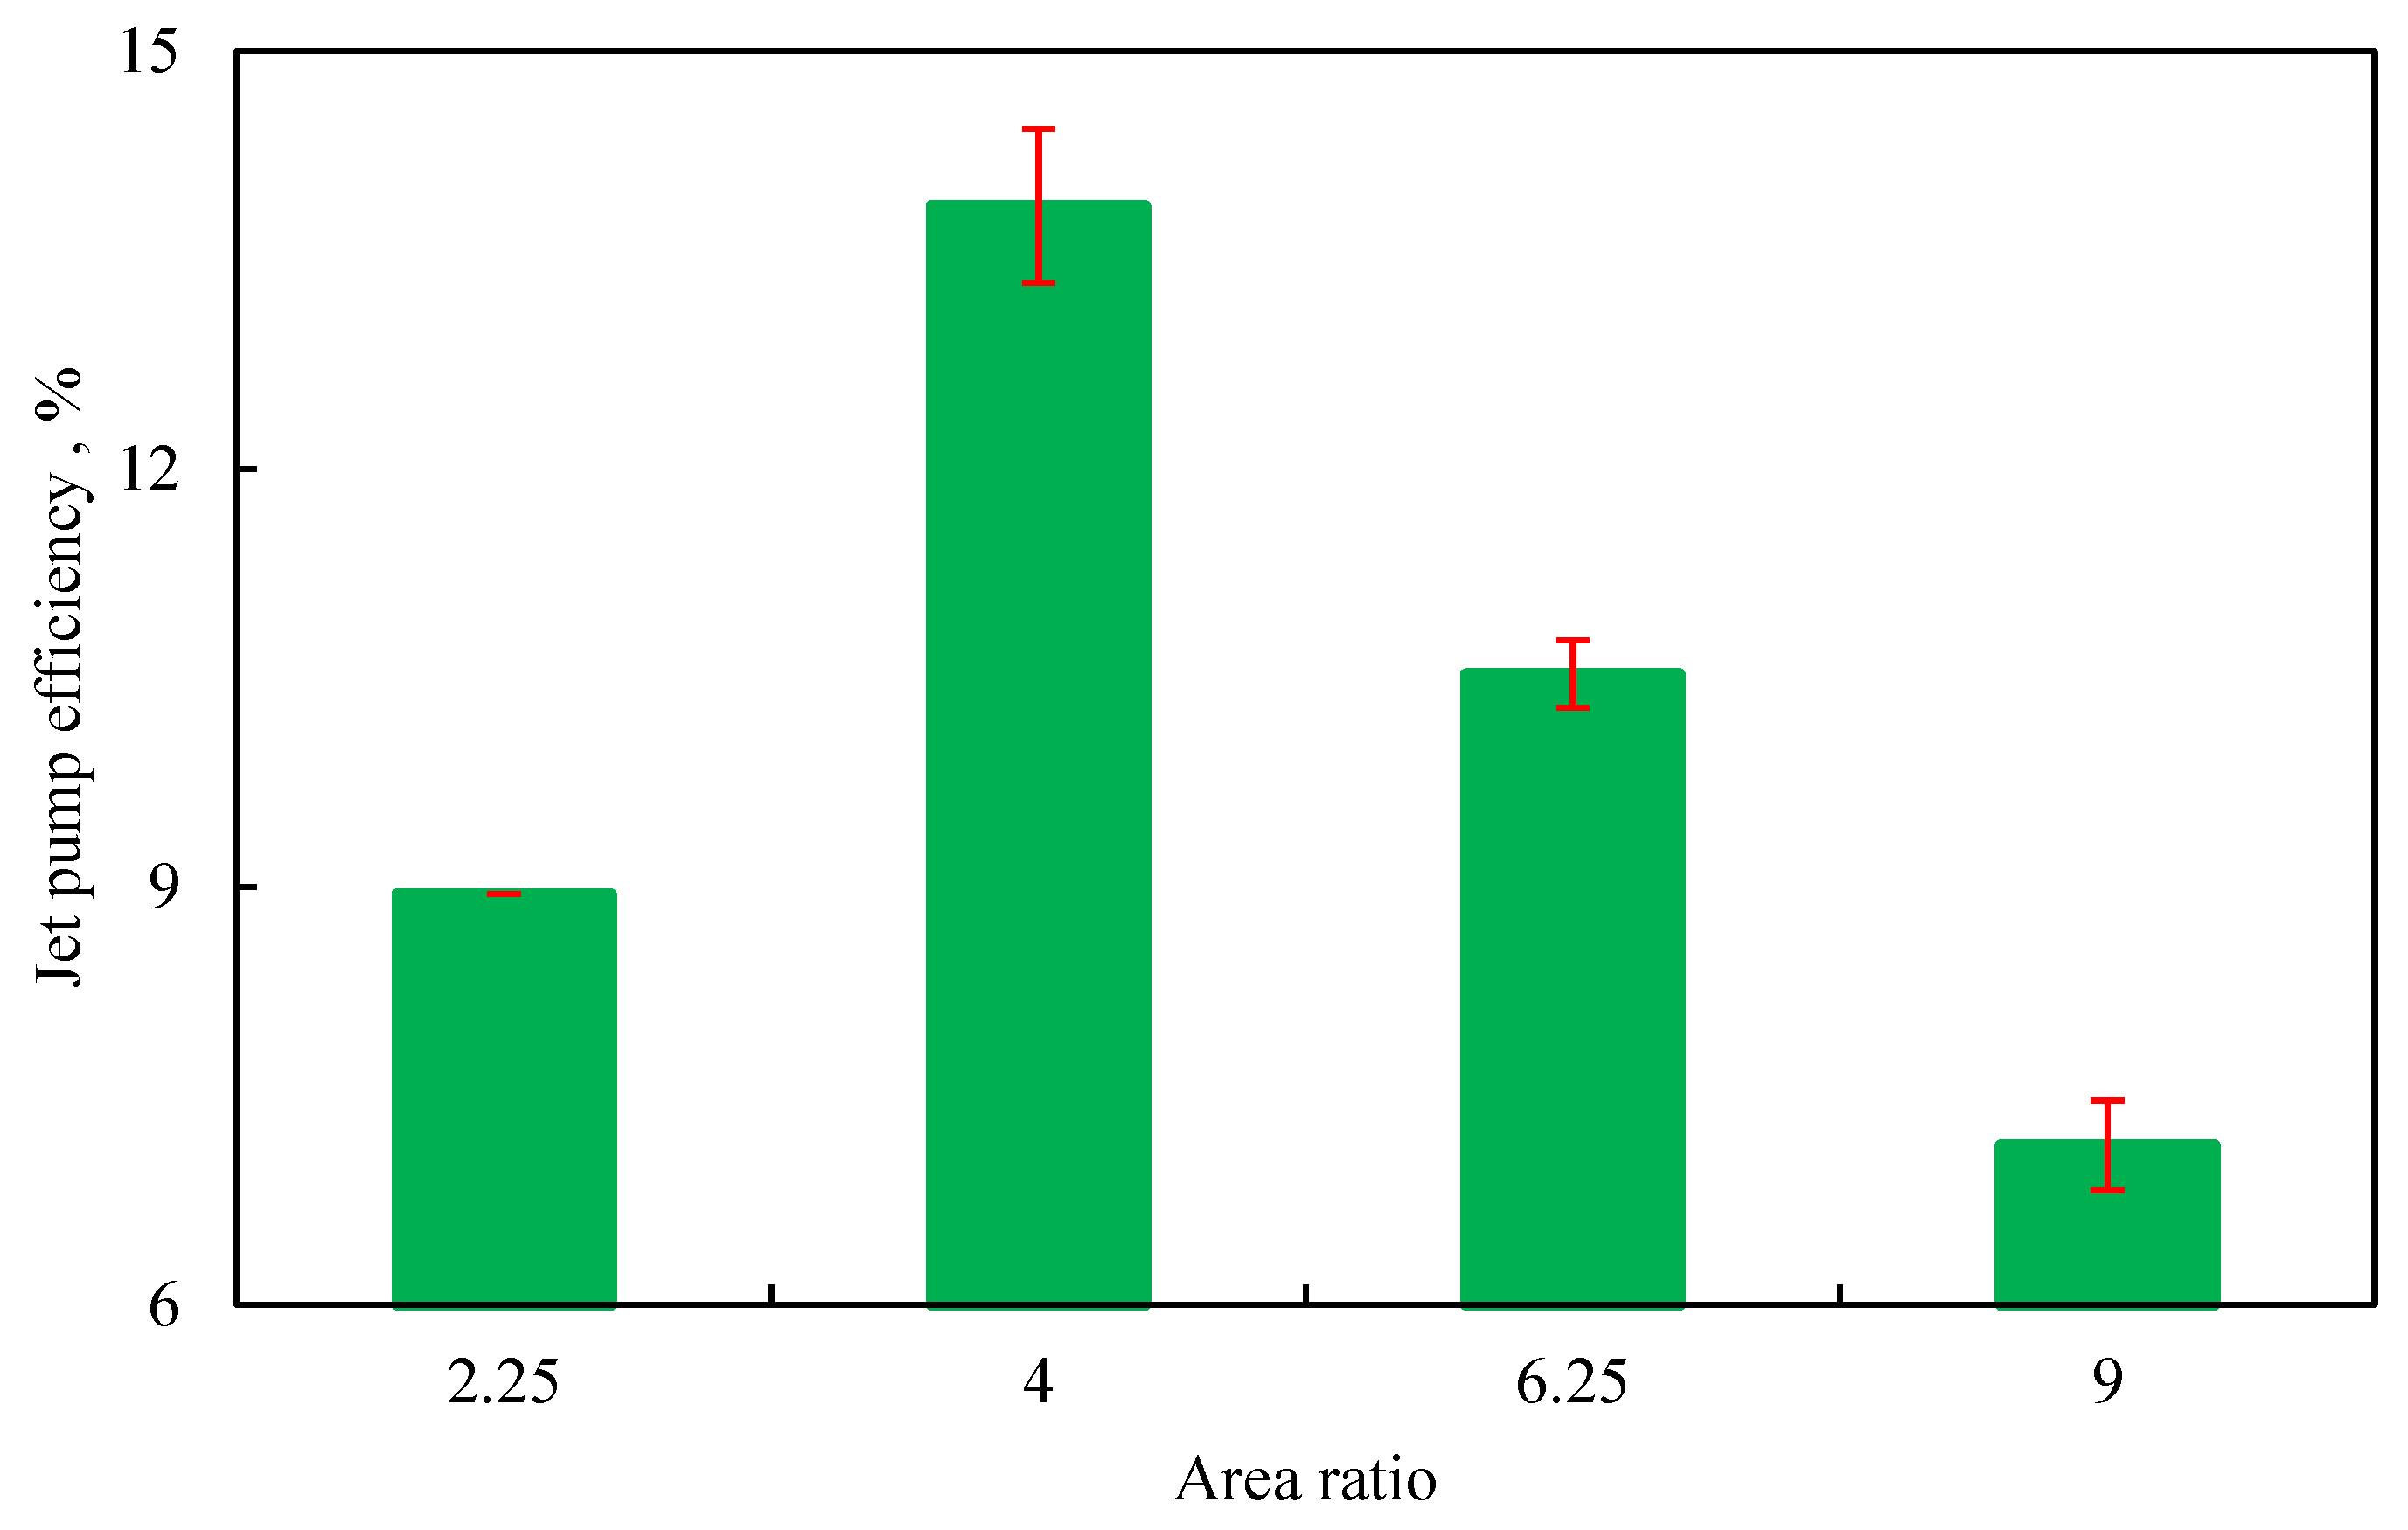
Figure 9: The efficiency of jet pumps at different area ratios.
3.1.3 Influence of Throat Length on Efficiency
Here throat length is represented by L. Based on the area ratio simulation results, the area ratio was set to 4, while keeping other parameters unchanged. Following the literature, simulations were conducted with throat lengths ranging from 5 to 8 times the throat diameter. The simulated throat lengths were 40, 48, 56, and 64 mm. The contour maps of the jet pump cross-sections at different throat lengths are shown in Fig. 10. At L = 40 mm, the fluid velocity at the throat outlet stabilizes with minimal fluctuation, indicating efficient energy transfer, thorough mixing, and consequently, excellent pump performance. As the throat lengthens, the already mixed fluid continues to flow through it unnecessarily, delaying its entry into the diffuser. An excessively long throat increases frictional losses, which escalate with its length, as a result, jet pump efficiency decreases.
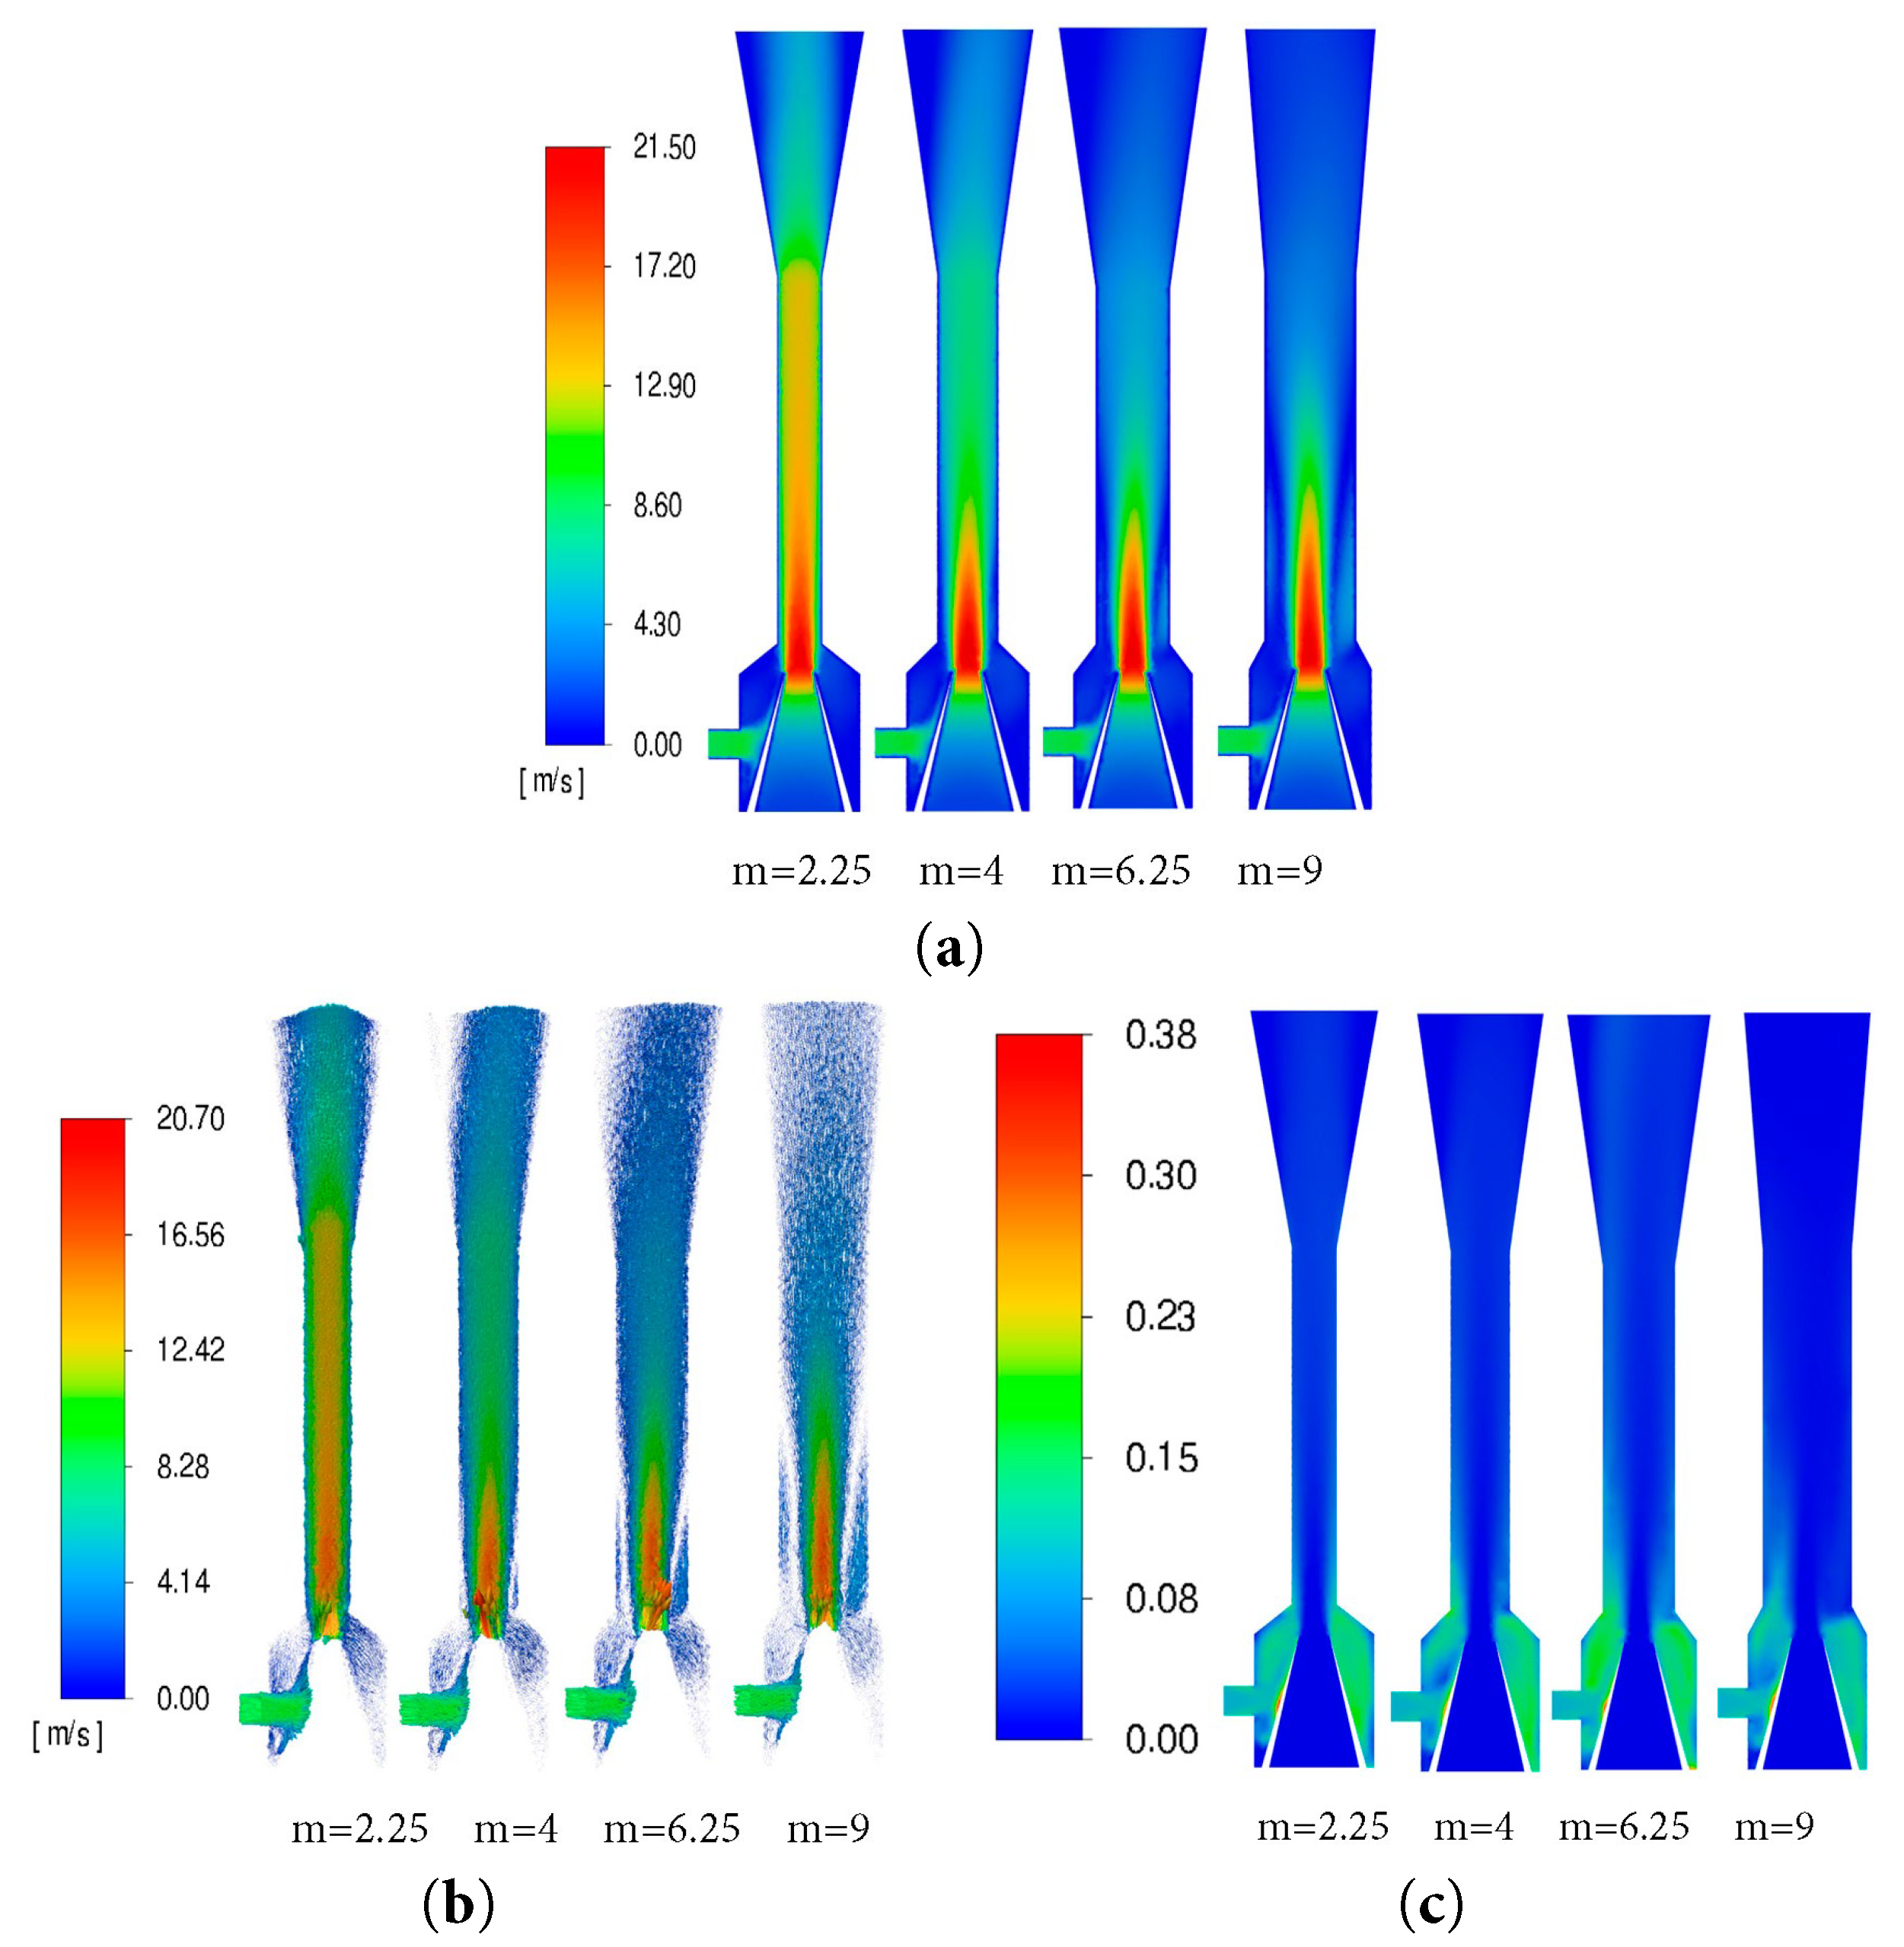
Figure 10: Contour maps of the jet pump cross-section at different throat lengths: (a) liquid phase velocity; (b) sand particle trajectories; (c) sand phase distribution.
Fig. 11 shows jet pumps efficiency at different throat lengths. As shown in figure, as throat length increases, pump efficiency gradually decreases, reaching its maximum value of 14.41% at a throat length of 40 mm. Furthermore, the optimal throat length corresponds to 5 times the throat diameter.

Figure 11: The efficiency of jet pumps at different throat lengths.
Simulations were conducted for three jet pump parameters, yielding 16 sets of orthogonal simulation results, as presented in Table 1. An orthogonal experimental design was employed to systematically and efficiently analyze the combined influence of the area ratio (A), throat length (B), and NTD (C), on jet pump efficiency.
Table 1: Orthogonal experiment simulation results.
| Numbering | Area Ratio A | Throat Length B (mm) | NTDC (d) | Jet Pump Efficiency (%) |
|---|---|---|---|---|
| A1B1C1 | 2.25 | 40 | 0.5 | 12.2 |
| A1B2C2 | 2.25 | 48 | 1 | 11.35 |
| A1B3C3 | 2.25 | 56 | 1.5 | 7.7 |
| A1B4C4 | 2.25 | 64 | 2 | 4.72 |
| A2B1C2 | 4 | 40 | 1 | 14.76 |
| A2B2C3 | 4 | 48 | 1.5 | 13.41 |
| A2B3C4 | 4 | 56 | 2 | 12.27 |
| A2B4C1 | 4 | 64 | 0.5 | 13.04 |
| A3B1C2 | 6.25 | 40 | 1 | 10.07 |
| A3B2C3 | 6.25 | 48 | 1.5 | 9.53 |
| A3B3C4 | 6.25 | 56 | 2 | 9.61 |
| A3B4C1 | 6.25 | 64 | 0.5 | 9.37 |
| A4B1C2 | 9 | 40 | 1 | 6.08 |
| A4B2C3 | 9 | 48 | 1.5 | 5.84 |
| A4B3C4 | 9 | 56 | 2 | 6.06 |
| A4B4C1 | 9 | 64 | 0.5 | 6.17 |
Based on Table 1, we calculated the sum of the experimental data Kjm and the average kjm. The orthogonal experiment results are analyzed using the range method, in which Rj represents the difference between the maximum and minimum values of the factors in column j. The formula for calculating the range is as follows:
The sum Kij and the corresponding average kij of the experimental indicator (jet pump efficiency) under different levels of each factor were obtained, as shown in Table 2.
Table 2: Range analysis of orthogonal experiment results.
| Factor | A | B | C |
|---|---|---|---|
| K1 | 35.97 | 43.11 | 40.79 |
| K2 | 53.48 | 40.12 | 42.25 |
| K3 | 38.58 | 35.64 | 36.48 |
| K4 | 24.15 | 33.3 | 32.66 |
| k1 | 8.99 | 10.78 | 10.20 |
| k2 | 13.37 | 10.03 | 10.56 |
| k3 | 9.65 | 8.91 | 9.12 |
| k4 | 6.04 | 8.33 | 8.17 |
| R | 7.33 | 2.45 | 2.40 |
| Order of factor significance | A > B > C | ||
| Optimal level | A2 | B1 | C2 |
| Optimal combination | A2B1C2 | ||
Based on the aforementioned research, the optimal structural parameters of the jet pump studied in this work were determined as follows:
(a) the ratio of the throat cross-sectional area to the nozzle outlet cross-sectional area is 4, (b) the throat length is 5 times the throat diameter, and (c) the NTD is 1 times the nozzle diameter.
3.2 Influence of Sand Parameters on Efficiency
Apart from the structural parameters of the jet pump, sand particles in the suction fluid can also lead to a decline in the pump’s basic performance and efficiency. Therefore, the influence of different sand parameters on the jet pump should also be investigated.
3.2.1 Sand Particle Size Sensitivity
The simulation conditions were set with a fixed sand density of 1.6 g/cm3 and a concentration of 10%, while testing sand particle sizes of 0.3, 0.5, 0.8, and 1.2 mm. The contour maps of the jet pump cross-section with different sand particle sizes are shown in Fig. 12. As shown in the figure, as the sand particle size increases, the jet distance from the nozzle decreases Then, as the velocity obtained by larger particles significantly decreases, sand accumulation at the throat inlet increases, thus resulting in decreased jet pump efficiency.
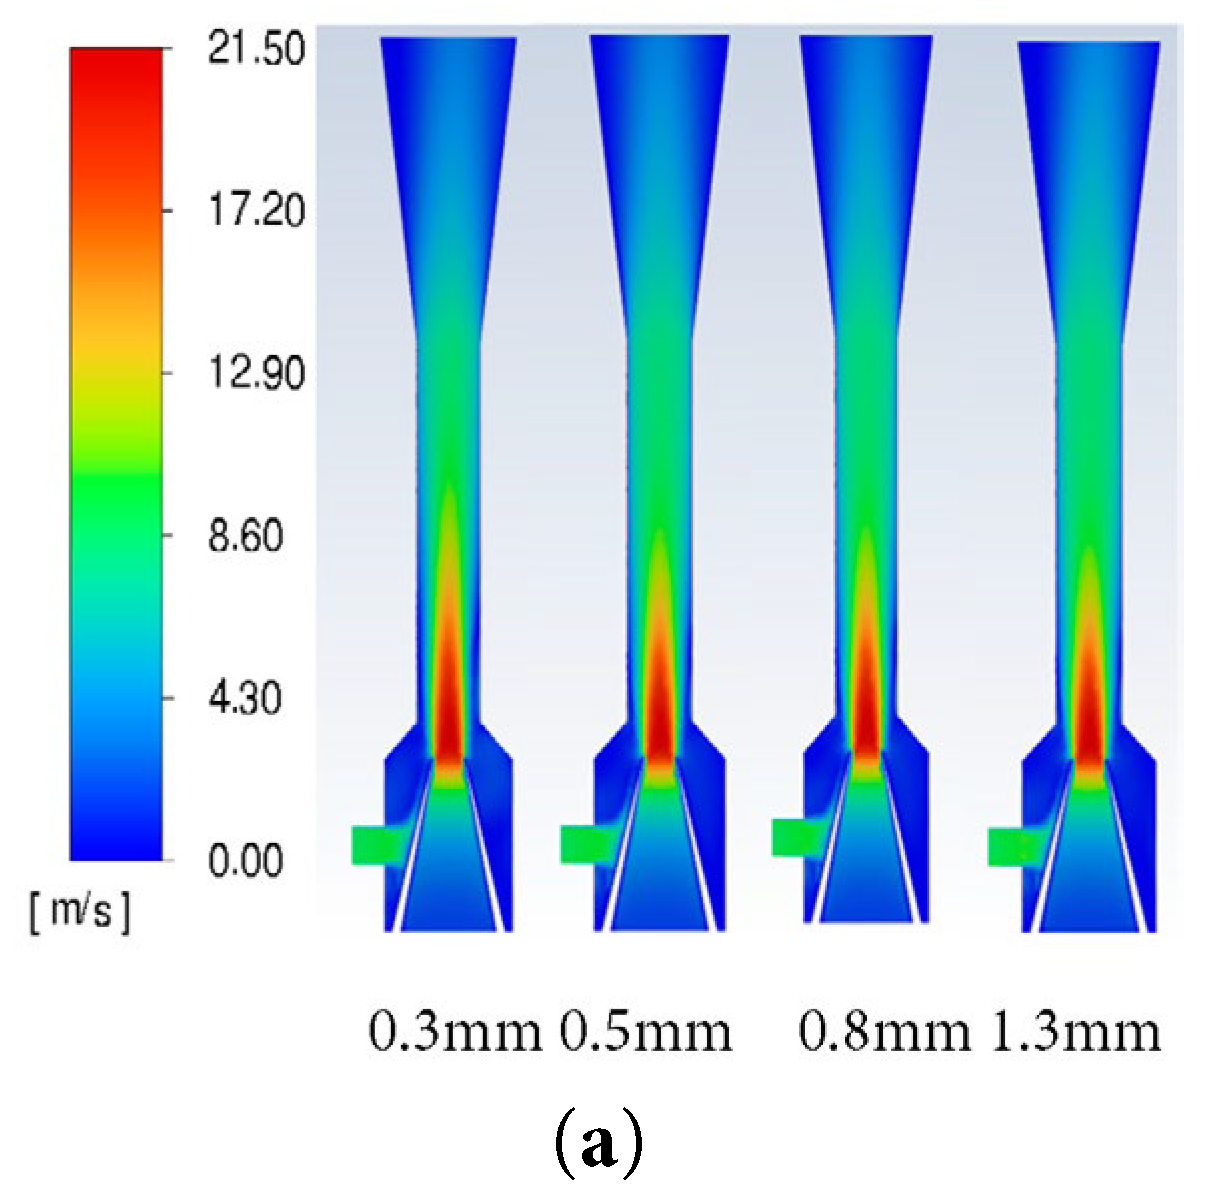
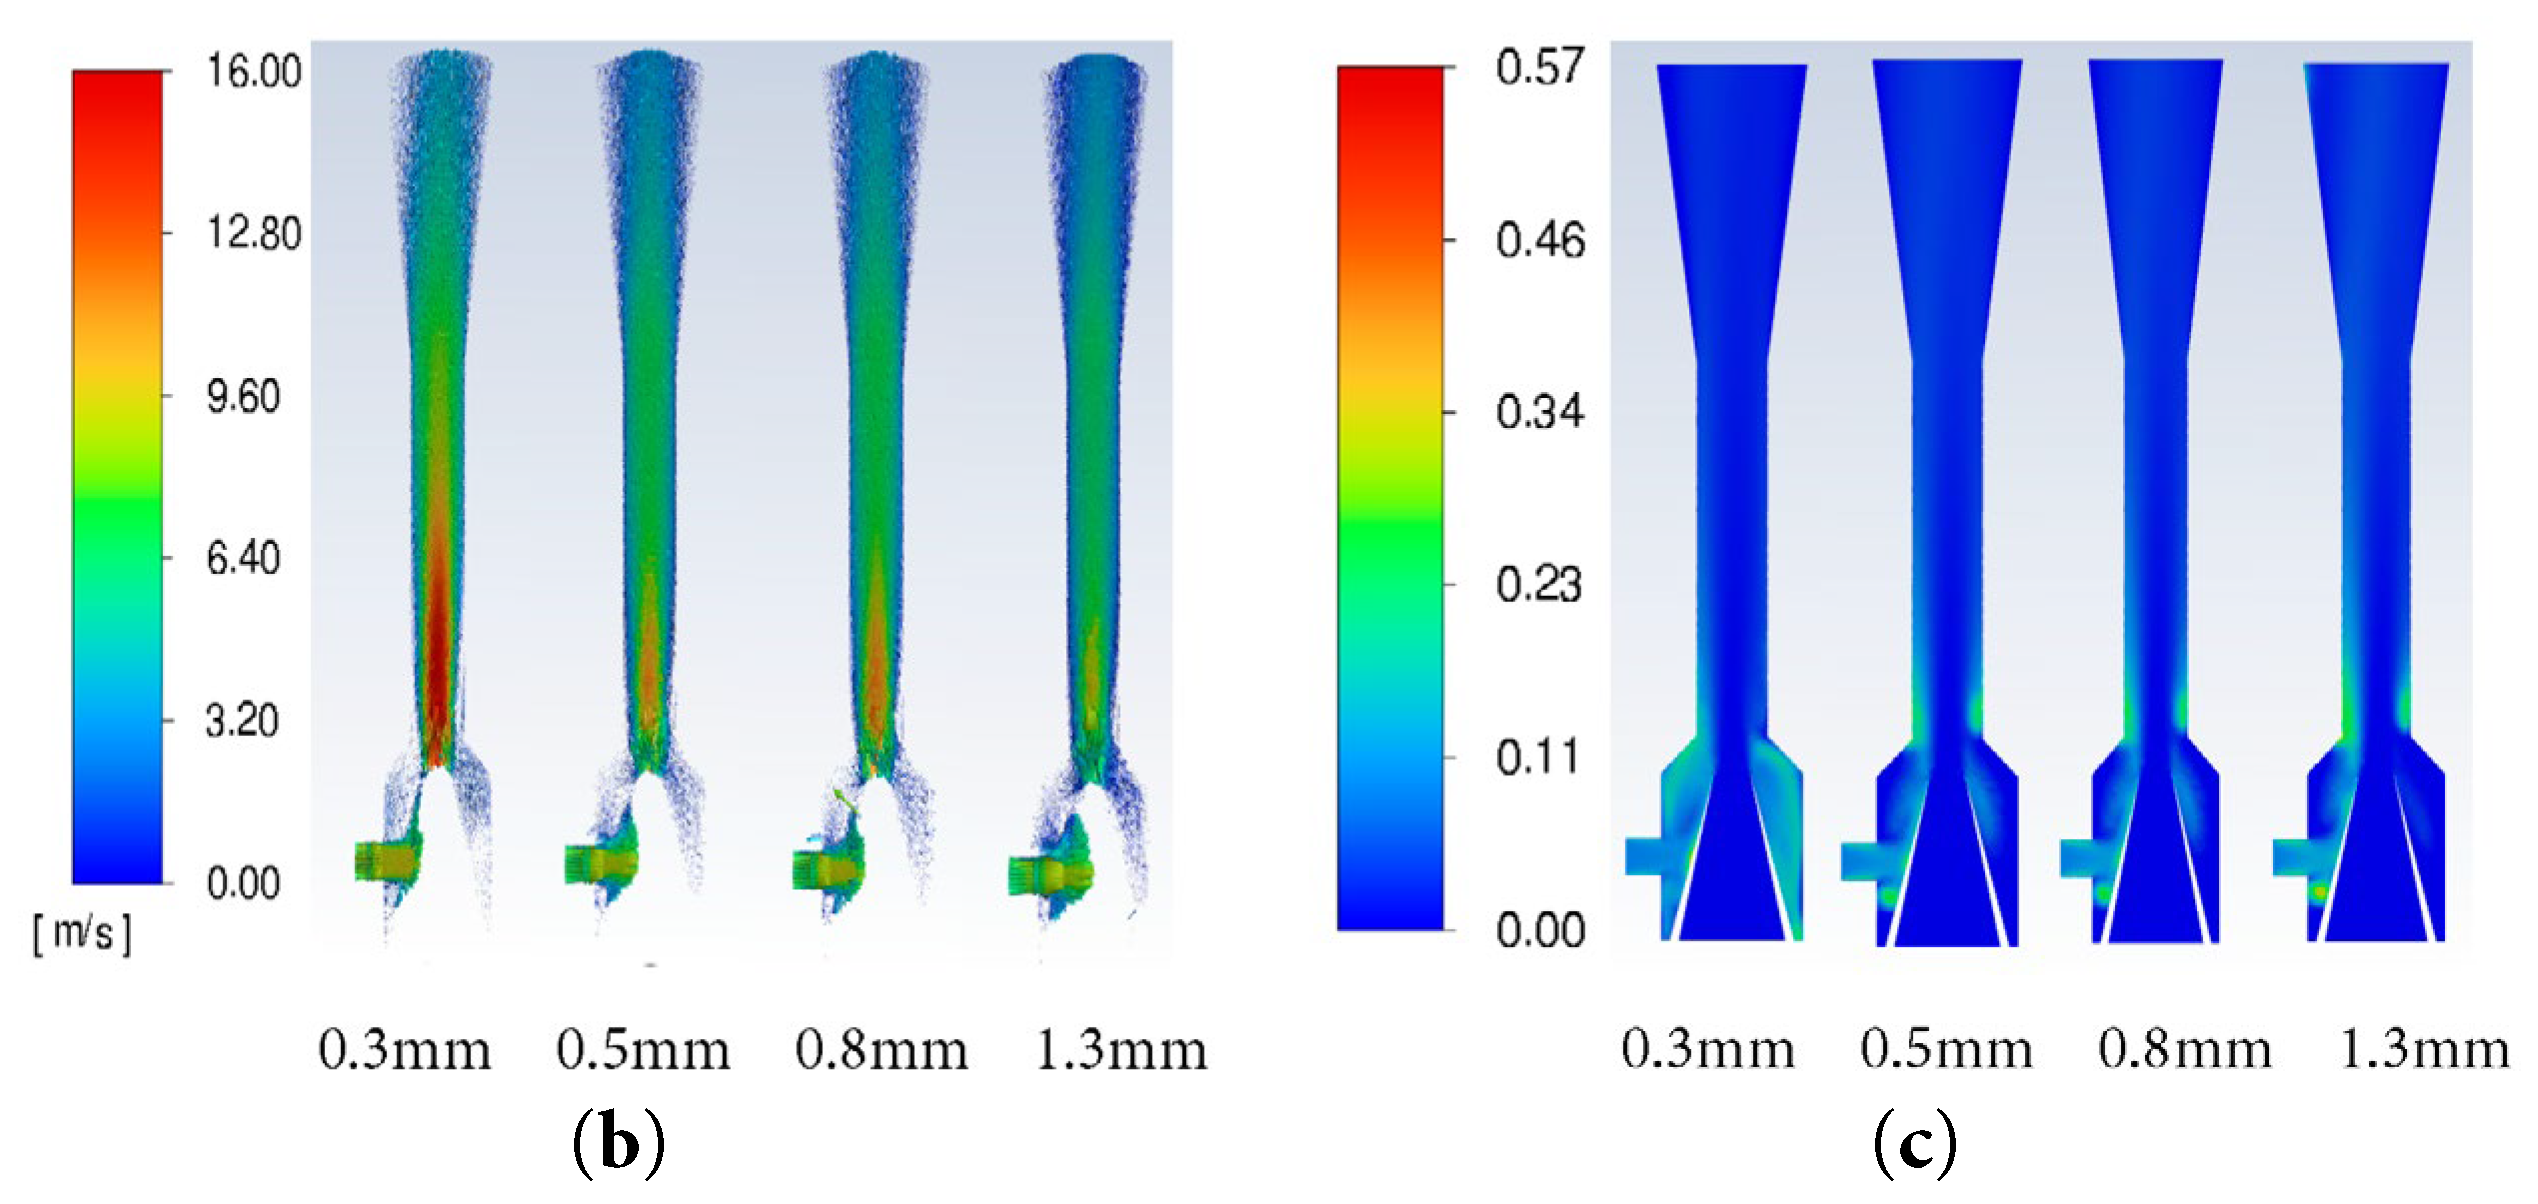
Figure 12: Contour maps of the jet pump cross-section with different sand particle sizes: (a) liquid phase velocity; (b) sand particle trajectories; (c) sand phase distribution.
Jet pump efficiencies at different sand particle sizes are illustrated in Fig. 13. As shown in the figure, as the sand particle size increases, the efficiency gradually decreases. Specifically, when the sand particle size increases from 0.3 to 1.2 mm, the efficiency drops by 6.43%. This finding thus indicates that sand particle size has a significant impact on jet pump performance.
Figure 13: The efficiency of jet pump with different sand particle sizes.
3.2.2 Sand Density Sensitivity
The simulation conditions were configured with a fixed sand particle size of 0.3 mm and a concentration of 10%, while testing sand densities of 1.6, 2.2, 2.6, and 3 g/cm3. The contour maps of the jet pump cross-section with different sand densities are presented in Fig. 14. The figure shown that, as the sand density increases, the jet distance from the nozzle decreases, and the velocity obtained by high-density sand significantly decreases. In turn, as sand accumulation at the throat inlet increases, this leads to decreased jet pump efficiency.

Figure 14: Contour maps of the jet pump cross-section with different sand densities: (a) liquid phase velocity; (b) sand particle trajectories; (c) sand phase distribution.
Jet pump efficiencies at different sand densities are illustrated in Fig. 15. The figure shown that, as the sand density increases, the jet pump efficiency gradually decreases. In particular, when the sand density rises from 1.6 g/cm3 to 3 g/cm3, the efficiency drops by 2.53%.

Figure 15: The efficiency of jet pump with different sand densities.
3.2.3 Sand Concentration Sensitivity
The simulation conditions were set with a fixed sand density of 1.6 g/cm3 and a sand particle size of 0.3 mm, The sensitive sand concentrations were set at 1%, 4%, 7%, and 10%. The contour maps of jet pump cross-sections at different sand concentrations are shown in Fig. 16. As the sand concentration increases, the jet distance from the nozzle shown minimal changes, while sand accumulation at the throat inlet increases, thus leading to decreased efficiency.
Figure 16: Contour maps of the jet pump cross-sections at different sand concentrations: (a) liquid phase velocity; (b) sand particle trajectories; (c) sand phase distribution.
The efficiencies at different sand concentrations are shown in Fig. 17. As the sand concentration increases, the efficiency gradually decreases. In particular, when the sand concentration increases from 1% to 10%, the efficiency is reduced by 1.81%.
Figure 17: The efficiency of jet pump under different sand concentrations.
3.3 Experimental Verification Results
3.3.1 The Influence of Liquid Flow Rate on Sand-Carrying Capacity in Jet Flow
The experimental conditions were set with a casing inner diameter of 120 mm, a throat diameter of 8 mm, and a nozzle diameter of 4 mm. The sand-carrying diagrams of the jet pump under different liquid flow rates are shown in Fig. 18. The figure shown that, at a flow rate of 1.2 m3/h, the sand–liquid mixture in the casing fluctuated at a certain height, with partially agitated sand being drawn into the inner pipe. As the liquid flow rate increased, more sand–liquid mixture was suctioned into the pipeline. Additionally, the higher flow rate enhanced the velocity within the inner pipe, facilitating the transport of the sand-liquid mixture into the jet pump.
Figure 18: Sand-carrying diagrams of jet pump under different liquid flow rates: (a) liquid flow rate is 1.2 m3/h; (b) liquid flow rate is 1.5 m3/h; (c) liquid flow rate is 1.7 m3/h; (d) liquid flow rate is 2 m3/h.
The sand production rate of the jet pump under different liquid flow rates are shown in Fig. 19. At a flow rate of 1.2 m3/h, although the jet pump’s mixing inlet could draw in the sand–liquid mixture, the combined flow of the power fluid and the suction fluid was insufficient to carry the sand out. At this point, the power fluid supply was stopped, causing the mixture in the jet pump to settle back. As the liquid flow rate increased, the amount of sand carried out by the jet pump significantly increased, thus leading to inefficiency.
Figure 19: Sand production rate of jet pump under different liquid flow rates.
3.3.2 The Influence of Area Ratio on Sand-Carrying Capacity in Jet Flow
The experimental conditions were set with a liquid flow rate of 1.7 m3/h and a nozzle diameter of 4 mm. The throat diameters varied at 6, 8, and 10 mm, resulting in area ratios of 2.25, 4, and 6.25, respectively. The sand-carrying diagrams of the jet pump under different area ratios are shown in Fig. 20. At a flow rate of 1.7 m3/h, all three area ratios enabled the jet pump to effectively draw in the sand-liquid mixture. The primary factor affecting efficiency was the magnitude of energy loss resulting from the mixing of the power fluid and the suction fluid.
Figure 20: S and-carrying diagrams of jet pump under different area ratios: (a) m = 2.25; (b) m = 4; (c) m = 6.25.
The sand production rates of the jet pump under different area ratios are shown in Fig. 21. The figure shown that, as the area ratio increases, the sand-carrying capacity first increases and then decreases. Among the area ratios, the jet pump with an area ratio of 4 exhibits the highest sand-carrying efficiency, reaching 290 g/min (6.7 L/h).
Figure 21: Sand production rate of the jet pump under different area ratios.
The detailed sand production rates of jet pumps with different area ratios under various liquid flow rates are listed in Table 3.
Table 3: Orthogonal experiment simulation results.
| Area Ratio | Liquid Flow Rate (m3/h) | Sand Production Rate (g) |
|---|---|---|
| 2.25 | 1 | 0 |
| 2.25 | 1.2 | 0 |
| 2.25 | 1.5 | 70 |
| 2.25 | 1.6 | 130 |
| 2.25 | 1.7 | 200 |
| 2.25 | 1.8 | 240 |
| 2.25 | 1.9 | 260 |
| 2.25 | 2 | 290 |
| 4 | 1 | 0 |
| 4 | 1.2 | 0 |
| 4 | 1.3 | 0 |
| 4 | 1.5 | 160 |
| 4 | 1.7 | 290 |
| 4 | 2 | 370 |
| 4 | 2.2 | 460 |
| 6.25 | 1 | 0 |
| 6.25 | 1.2 | 0 |
| 6.25 | 1.6 | 170 |
| 6.25 | 1.7 | 250 |
| 6.25 | 1.8 | 280 |
| 6.25 | 2 | 320 |
Jet pump efficiencies under different area ratios were analyzed based on CFD simulations. Specifically, experimental tests were conducted for area ratios of 2.25, 4, and 6.25. The comparison between the experimental results and numerical simulations is shown in Fig. 22. As can be seen, the average relative error between the experimental values and the CFD simulated values for jet pump efficiencies across different area ratios was 2.44%, with an average absolute error of 3.56%, thereby demonstrating the reliability of the CFD simulations.
Figure 22: Comparison between experimental and simulated values of jet pump efficiency at different area ratios.
- (1)Based on jet pump efficiency as the evaluation parameter, the ranking of structural parameter influence is as follows: area ratio > throat length = NTD. The optimal structural parameters for the sand-flushing jet pump designed in this article were as follows: area ratio of 4, throat length that is 5 times the throat diameter, and NTD that is equal to the nozzle diameter.
- (2)Our CFD simulations revealed that (a) as the sand particle size increased from 0.3 to 1.2 mm, efficiency decreased by 6.43%, indicating that sand particle size has a significant impact on jet pump efficiency; (b) when sand density increased from 1.6 to 3 g/cm3, jet pump efficiency decreased by 2.53%, indicating that sand density has a relatively minor impact on pump performance; And (c) as sand concentration increased from 1% to 10%, jet pump efficiency decreased by 1.81%, indicating that sand concentration has a minor impact on pump performance.
- (3)Furthermore, our laboratory sand-carrying experiments demonstrated that sand-carrying capacity initially increased and then decreased as area ratio increased. Furthermore, at a power fluid flow rate of 1.7 m3/h, an area ratio of 4 yielded the highest sand-carrying rate among the tested area ratios, achieving maximum sand-carrying rate of 290 g/min (6.7 L/h). Finally, comparative analysis revealead excellent agreement between CFD and experimental results, with an average relative error of 2.44% and an average absolute error of 3.56%, thus confirming the reliability of our proposed CFD simulation method.
Acknowledgement:
Funding Statement: This research was funded by China Oilfield Services Limited, grant number YXB24YF003.
Author Contributions: The authors confirm contribution to the paper as follows: Conceptualization, Zhengqiang Peng and Rendong Feng; methodology, Rendong Feng; validation, Fang Han, Jing Guo and Wenao Huang; formal analysis, Shen Chi and Jie Luo; investigation, Zhengqiang Peng; writing—original draft preparation, Zhengqiang Peng; writing—review and editing, Rendong Feng. All authors reviewed the results and approved the final version of the manuscript.
Availability of Data and Materials: The datasets generated during and/or analyzed during the current study are available from the corresponding author on reasonable request.
Ethics Approval: Not applicable.
Conflicts of Interest: The authors declare no conflicts of interest to report regarding the present study.
References
1. Riaz S , Aaltonen J , Pinkse T , Koskinen K . Numerical investigation and validation of multiphase flow in annular jet pump—a mixture model approach. Eng Sci Technol Int J. 2025; 69: 102100. doi:10.1016/j.jestch.2025.102100. [Google Scholar] [CrossRef]
2. Mallela R , Chatterjee D . Numerical investigation of the effect of geometry on the performance of a jet pump. Proc Inst Mech Eng Part C J Mech Eng Sci. 2011; 225( 7): 1614– 25. doi:10.1177/0954406211401163. [Google Scholar] [CrossRef]
3. Yamazaki Y , Yamazaki A , Narabayashi T , Suzuki J , Shakouchi T . Studies on mixing process and performance improvement of jet pumps (effect of nozzle and throat shapes). J Fluid Sci Technol. 2007; 2( 1): 238– 47. doi:10.1299/jfst.2.238. [Google Scholar] [CrossRef]
4. Nasr M , Hosien MA , Wahba EM , Sheha AAA . Computational and experimental study on the water-jet pump performance under different geometrical and operational parameters. Eng Res J. 2017; 40( 2): 107– 17. doi:10.21608/erjm.2017.66340. [Google Scholar] [CrossRef]
5. Xu K , Wang G , Wang L , Yun F , Sun W , Wang X , et al. Parameter analysis and optimization of annular jet pump based on Kriging model. Appl Sci. 2020; 10( 21): 7860. doi:10.3390/app10217860. [Google Scholar] [CrossRef]
6. Kwon OB , Kim MK , Kwon HC , Bae DS . Two-dimensional numerical simulations on the performance of an annular jet pump. J Vis. 2002; 5( 1): 21– 8. doi:10.1007/BF03182599. [Google Scholar] [CrossRef]
7. Xu MS , Yang XL , Long XP , Lü Q . Large eddy simulation of turbulent flow structure and characteristics in an annular jet pump. J Hydrodyn. 2017; 29( 4): 702– 15. doi:10.1016/S1001-6058(16)60782-5. [Google Scholar] [CrossRef]
8. Riaz S , Aaltonen J , Pinkse T , Koskinen K . Parametric study of structural influences on suction performance in an Annular Jet Pump—CFD and experimental validation. J Water Process Eng. 2025; 70: 107066. doi:10.1016/j.jwpe.2025.107066. [Google Scholar] [CrossRef]
9. Dandani M , Lepiller V , Ghezal A , Desevaux P . Numerical visualizations of mixing enhancement in a 2D supersonic ejector. Fluid Dyn Mater Process. 2018; 14( 1): 23– 37. doi:10.3970/fdmp.2018.014.023. [Google Scholar] [CrossRef]
10. Reis LB , Gioria RDS . Optimization of liquid jet ejector geometry and its impact on flow fields. Appl Therm Eng. 2021; 194: 117132. doi:10.1016/j.applthermaleng.2021.117132. [Google Scholar] [CrossRef]
11. Hassani M , Kouhikamali R . Investigation of two phase liquid jet ejector with simultaneous air and water suction in fresh water distillation system. Energy. 2024; 301: 131662. doi:10.1016/j.energy.2024.131662. [Google Scholar] [CrossRef]
12. Fan J , Eves J , Thompson HM , Toropov VV , Kapur N , Copley D , et al. Computational fluid dynamic analysis and design optimization of jet pumps. Comput Fluids. 2011; 46( 1): 212– 7. doi:10.1016/j.compfluid.2010.10.024. [Google Scholar] [CrossRef]
13. Song XG , Park JH , Kim SG , Park YC . Performance comparison and erosion prediction of jet pumps by using a numerical method. Math Comput Model. 2013; 57( 1–2): 245– 53. doi:10.1016/j.mcm.2011.06.040. [Google Scholar] [CrossRef]
14. Aldaş K , Yapıcı R . Investigation of effects of scale and surface roughness on efficiency of water jet pumps using CFD. Eng Appl Comput Fluid Mech. 2014; 8( 1): 14– 25. doi:10.1080/19942060.2014.11015494. [Google Scholar] [CrossRef]
15. Bhatkar VW , Sur A . An experimental analysis of liquid air jet pump. Front Heat Mass Transf. 2021; 17: 1– 5. doi:10.5098/hmt.17.12. [Google Scholar] [CrossRef]
16. Hu L , Pan C , Hu D , Yan H , Qiu F , Cheng Z . Coupled CFD-machine learning optimization of inlet water-jet orifices in jet impact negative pressure reactors. J Taiwan Inst Chem Eng. 2025; 175: 106248. doi:10.1016/j.jtice.2025.106248. [Google Scholar] [CrossRef]
Cite This Article
 Copyright © 2025 The Author(s). Published by Tech Science Press.
This work is licensed under a Creative Commons Attribution 4.0 International License , which permits unrestricted use, distribution, and reproduction in any medium, provided the original work is properly cited.
 Downloads
 Citation Tools