
 Submit a Paper
 Propose a Special lssue
 Open Access
ARTICLE

The Water Flooding Seepage Mechanism in the Inter-Fractures of Horizontal Wells in Tight Oil Reservoirs
1 School of Petroleum and Natural Gas Engineering, Changzhou University, Changzhou, 213164, China
2 School of Oil and Gas Engineering, Chongqing University of Science & Technology, Chongqing, 401331, China
3 Research Institute of Petroleum Exploration & Development, PetroChina Company Limited, Beijing, 100083, China
4 College of Petroleum Engineering, Xi’an Shiyou University, Xi’an, 710065, China
* Corresponding Author: Xinli Zhao. Email:
Fluid Dynamics & Materials Processing 2025, 21(2), 427-444. https://doi.org/10.32604/fdmp.2024.052646
Received 10 April 2024; Accepted 24 July 2024; Issue published 06 March 2025
 View Full Text
 Download PDF
Abstract
Tight oil reservoirs face significant challenges, including rapid production decline, low recovery rates, and a lack of effective energy replenishment methods. In this study, a novel development model is proposed, based on inter-fracture injection following volumetric fracturing and relying on a high-temperature and high-pressure large-scale physical simulation system. Additionally, the CMG (Computer Modelling Group Ltd., Calgary City, Canada) software is also used to elucidate the impact of various single factors on the production of horizontal wells while filtering out the interference of others. The effects of fracture spacing, fracture half-length, and the injection-production ratio are studied. Results indicate that under rejection pressures of 6.89, 3.45, and 1.88 MPa, the times to establish stable flow are 50, 193, and 395 min, respectively. Higher injection pressures lead to an increased oil recovery efficiency, with the highest observed efficiency at 16.93%. This indicates that, compared with conventional medium and high permeability reservoirs, tight oil reservoirs exhibit similar pore throats and larger capillary forces when oil and water flow in both phases. Higher pressures reduce capillary forces, displacing more oil droplets, thus enhancing oil recovery efficiency. Moreover, under inter-fracture displacement conditions, the pressure gradient at both the injection and production ends remain consistent, with minimal pressure loss near the wellbore. This feature ensures that the crude oil in the middle of the reservoir also possesses displacement energy, thereby enhancing overall crude oil displacement efficiency.Keywords
The exploration and development of unconventional oil and gas resources, including tight oil and gas, shale oil and gas, and more, have significantly impacted the global energy landscape [1–3]. Tight oil, as defined by the National Energy Administration, is stored in reservoirs such as dense sandstone and carbonate rock, with an overlying matrix permeability of ≤0.1 × 10⁻³ μm2 [4]. In China, tight oil reserves are abundant, primarily located in the Ordos Basin, Songliao Basin, Junggar Basin, Sichuan Basin, and others [5–8].
Currently, the development of tight oil reservoirs primarily relies on volumetric fracturing horizontal well technology. This method, which operates primarily on depletion (quasi-natural energy), faces significant challenges, including rapidly decreasing production capacity and the lack of an effective energy replenishment method [9–12]. There are many techniques for supplementing energy with tight oil reservoirs [13,14]. Moreover, researchers have investigated various energy replenishment techniques, such as water injection, gas injection, huff-n-puff, and surfactant injection, enhancing the efficient development of tight oil reservoirs [15–18]. However, due to the extremely small throat sizes of <1 μm, the development process is characterized by significant capillary forces, inhibiting oil extraction [19]. Additionally, the presence of microfractures in tight oil reservoirs poses a risk of water channeling during water injection development [20]. Furthermore, for huff and puff development, water injection requires high rock wettability, typically necessitating hydrophilic reservoir rocks. Moreover, the effectiveness of water and gas injection in enhancing recovery diminishes after three rounds [21,22]. Therefore, new development approaches must be explored to enhance the recovery of tight reservoirs.
In North America, the development of tight reservoirs is managed by increasing the horizontal section length of horizontal wells and employing small well spacing to achieve efficient scale development [23]. Conversely, the Changqing field in the Ordos Basin of China is less suited to small well spacing development due to reservoir abundance, rock brittleness, and other factors [24]. Therefore, after volumetric fracturing of tight reservoirs, if fractures are detected by downhole intelligent devices, inter-fracture injection is utilized to address the energy replenishment issue, thus achieving a corresponding effect to reducing well spacing [25]. Various inter-fracture displacement methods have been defined, including horizontal well co-injection and recovery, line injection and recovery, heterogeneous well injection and recovery, as well as fracture-to-fracture injection and recovery [26–28]. The primary objective is to perform inter-fracture injection and recovery using fracture-to-fracture techniques to minimize the injection and recovery distance, effectively overcoming the tight reservoir initiation pressure gradient, and replenishing formation energy to enhance recovery. To address these challenges, this study proposed a novel development model utilizing inter-fracture injection. It established a physical simulation method for inter-fracture injection and production employing high-temperature and high-pressure large-scale physical simulation systems. Furthermore, upon selecting outcrop rock samples from the Ordos Basin, a target research block was created, corresponding to flat plate models (size 50 cm × 40 cm × 3 cm). The process involved cutting the injection and extraction fractures, arranging pressure measurement points, and studying the seepage mechanism of the saturated oil model under bound water conditions at various injection pressures during inter-fracture injection and production. Additionally, using the reservoir numerical simulation technology, the study elucidated the influence of fracture length, injection-production ratio, and fracture spacing on inter-fracture injection and production. The study offered a basis for the development of tight reservoirs and proposed a new approach for inter-fracture displacement in tight oil reservoirs.
Generally, since oil and water coexist in geological formations during the development of inter-fracture injection and production in volumetric fractured horizontal wells in tight reservoirs, it is necessary to consider the influence of bound water in the physical simulation study. This ensured that the indoor physical simulation more accurately reflects field development practices.
Given the field site data from two horizontal wells spaced 200 m apart, and considering factors such as injection and production fracture spacing, number of fractures, and geometric similarity, the experimental model was designed (Fig. 1a). The model includes three fractures: two for water injection and one central fracture for oil recovery (Fig. 1b), representing the horizontal well inter-fracture injection and production unit method. The artificial fracture width was 0.5 mm, filled with 120–140 mesh quartz sand to simulate uniform fracture distribution in the reservoir.
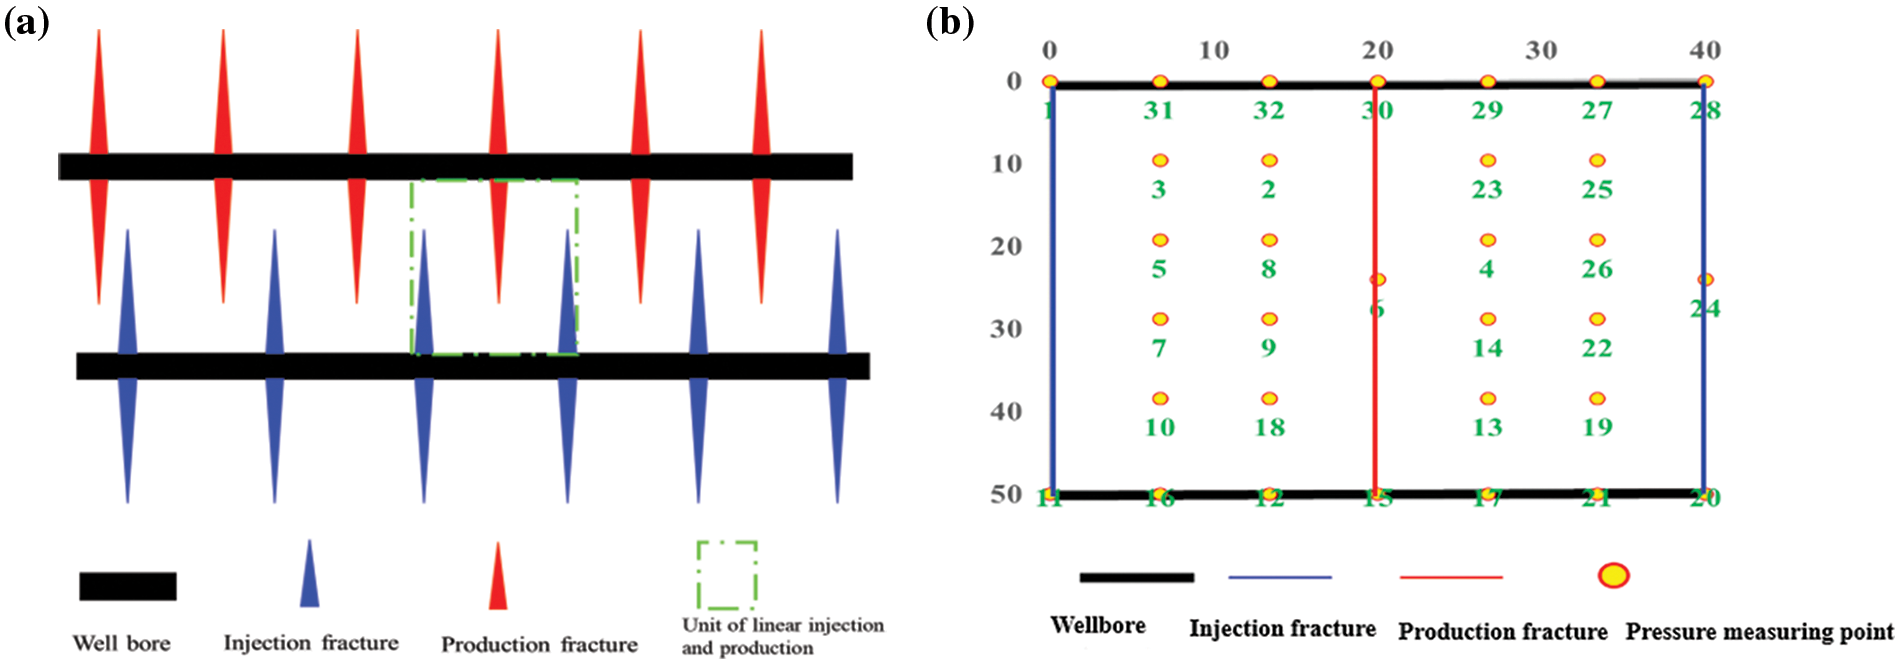
Figure 1: Experimental model diagram of inter-fracture injection and production under bound water at different pressures from reference [29]. (a) Model diagram of inter-fracture injection and production. (b) Unit of inter-fracture injection and production. Copyright © 2023, AIP Publishing
The schematic diagram of the simulation model is shown in Fig. 1. The thick black line indicates the horizontal wellbore, the blue line indicates the injection fracture, the middle red fracture indicates the oil recovery fracture, and the yellow dots indicate pressure monitoring points. To compare the effects of different repulsion pressures on the development process of injection between fractures in volumetric fractured horizontal wells containing bound water, production characteristic curves were analyzed. Pressure field changes at different moments for repulsion pressures were 6.89, 3.45, and 1.88 MPa. The experiment employed outcrop flat cores of dense sandstone with dimensions of 50 cm in length, 40 cm in width, and 3 cm in height, with an oil saturation of 43.94% under bound water conditions (Table 1).

This study employed a high-temperature and high-pressure large-scale physical simulation experimental system, designed and developed internally (Fig. 2). The experimental procedure for simulating volumetric fracturing of horizontal wells in tight reservoirs under bound water conditions with different injection pressures is as follows: Initially, prepare the experimental model using an outcrop plate according to the relevant process. This was achieved by cutting three fractures with a length of 48 cm using a wireline cutter. Subsequently, the fracture was dried and filled with sand, encapsulating the molded outcrop plate model [30]. Next, the bound water saturation was established. Finally, waterflooding experiments at different pressures using the large-scale physical simulation experiment system were conducted.
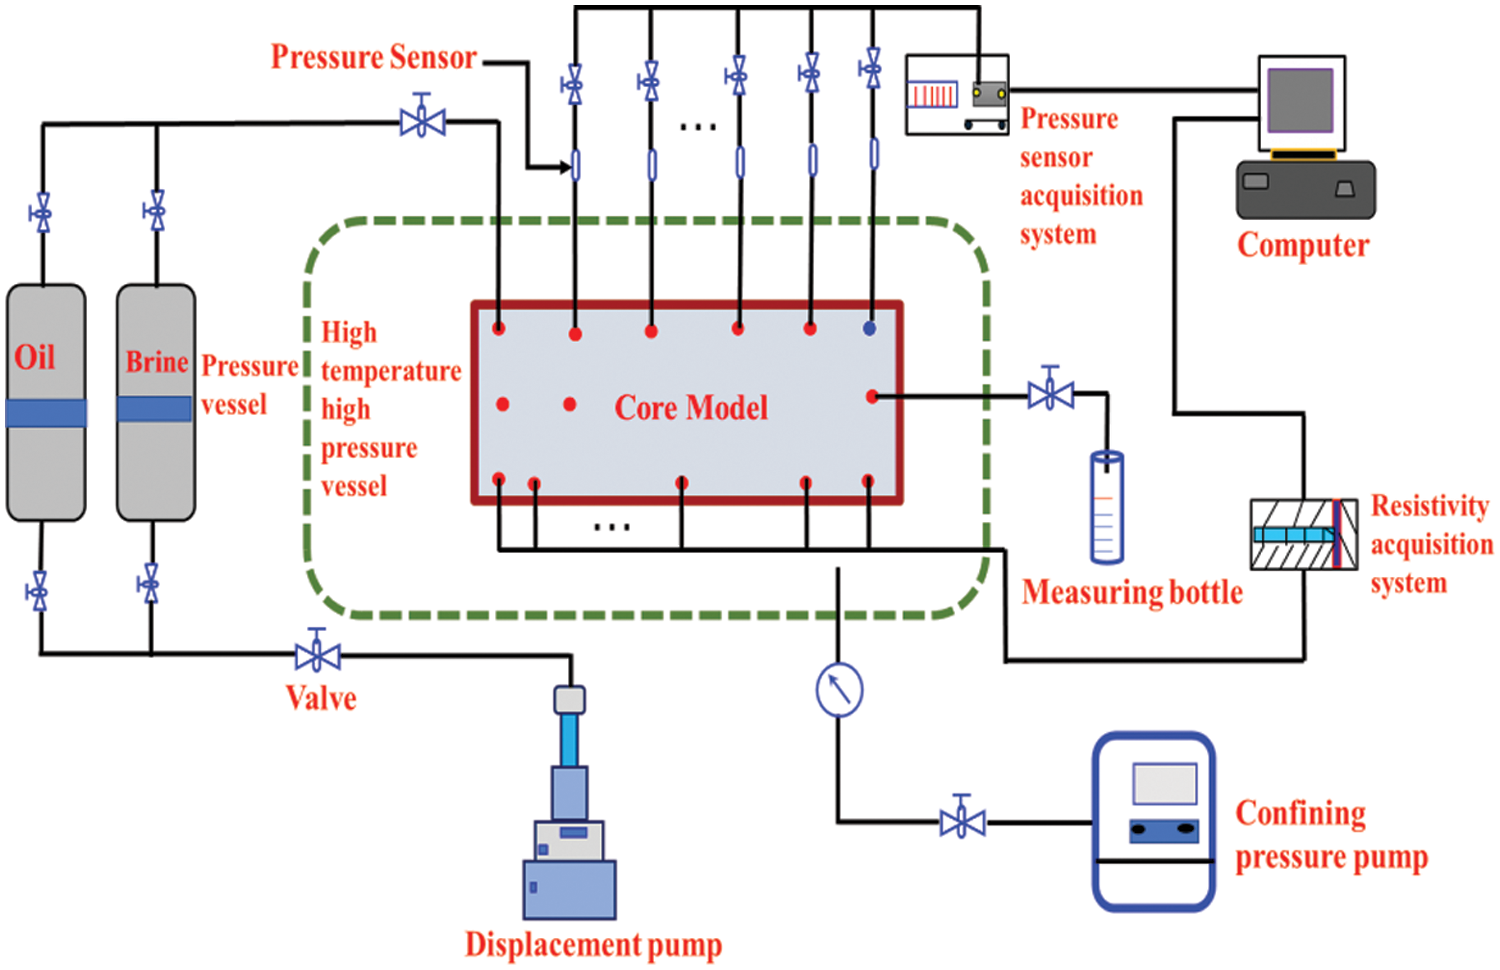
Figure 2: Schematic diagram of large-scale physical experiment system from reference [30], Copyright © 2021, AIP Publishing
3.1 Production Characteristics
The variation of displacement pressure significantly impacts inter-fracture injection and production. To analyze this, other factors remain unchanged, excluding the displacement pressure, examining its impact on inter-fracture injection and production. Furthermore, employing a high-temperature and high-pressure large-scale physical simulation system, physical simulations on tight oil volumetric fractured horizontal wells with different injection pressures were conducted. These simulations provided insights into production characteristics such as oil production, fluid production, injection volume, production rate, water content, and drive efficiency. In this study, physical simulations of intersegmental displacement were conducted at different injection pressures (6.89, 3.45, and 1.88 MPa), resulting in three sets of intersegmental displacement production profiles.
Figs. 3–5 show the production characteristic curves under injection pressures of 6.89, 3.45, and 1.88 MPa, respectively. The cumulative oil production stopped increasing after 124 min (Fig. 3a), 306 min (Fig. 4a), and 596 min (Fig. 5a), respectively. Higher repulsion pressure corresponded to a shorter oil production period during inter-fracture repulsion injection development. Similarly, the cumulative oil production at 6.89, 3.45, and 1.88 MPa increased with increasing injection multiplier (PV), which stopped after 0.264 PV (Fig. 3b), 0.199 PV (Fig. 4b), and 0.185 PV (Fig. 5b), respectively. Additionally, the water-free oil recovery period was 48, 192, and 396 min for the three displacement pressures, indicating a slower flow process and longer water-free recovery period with decreasing displacement pressure.
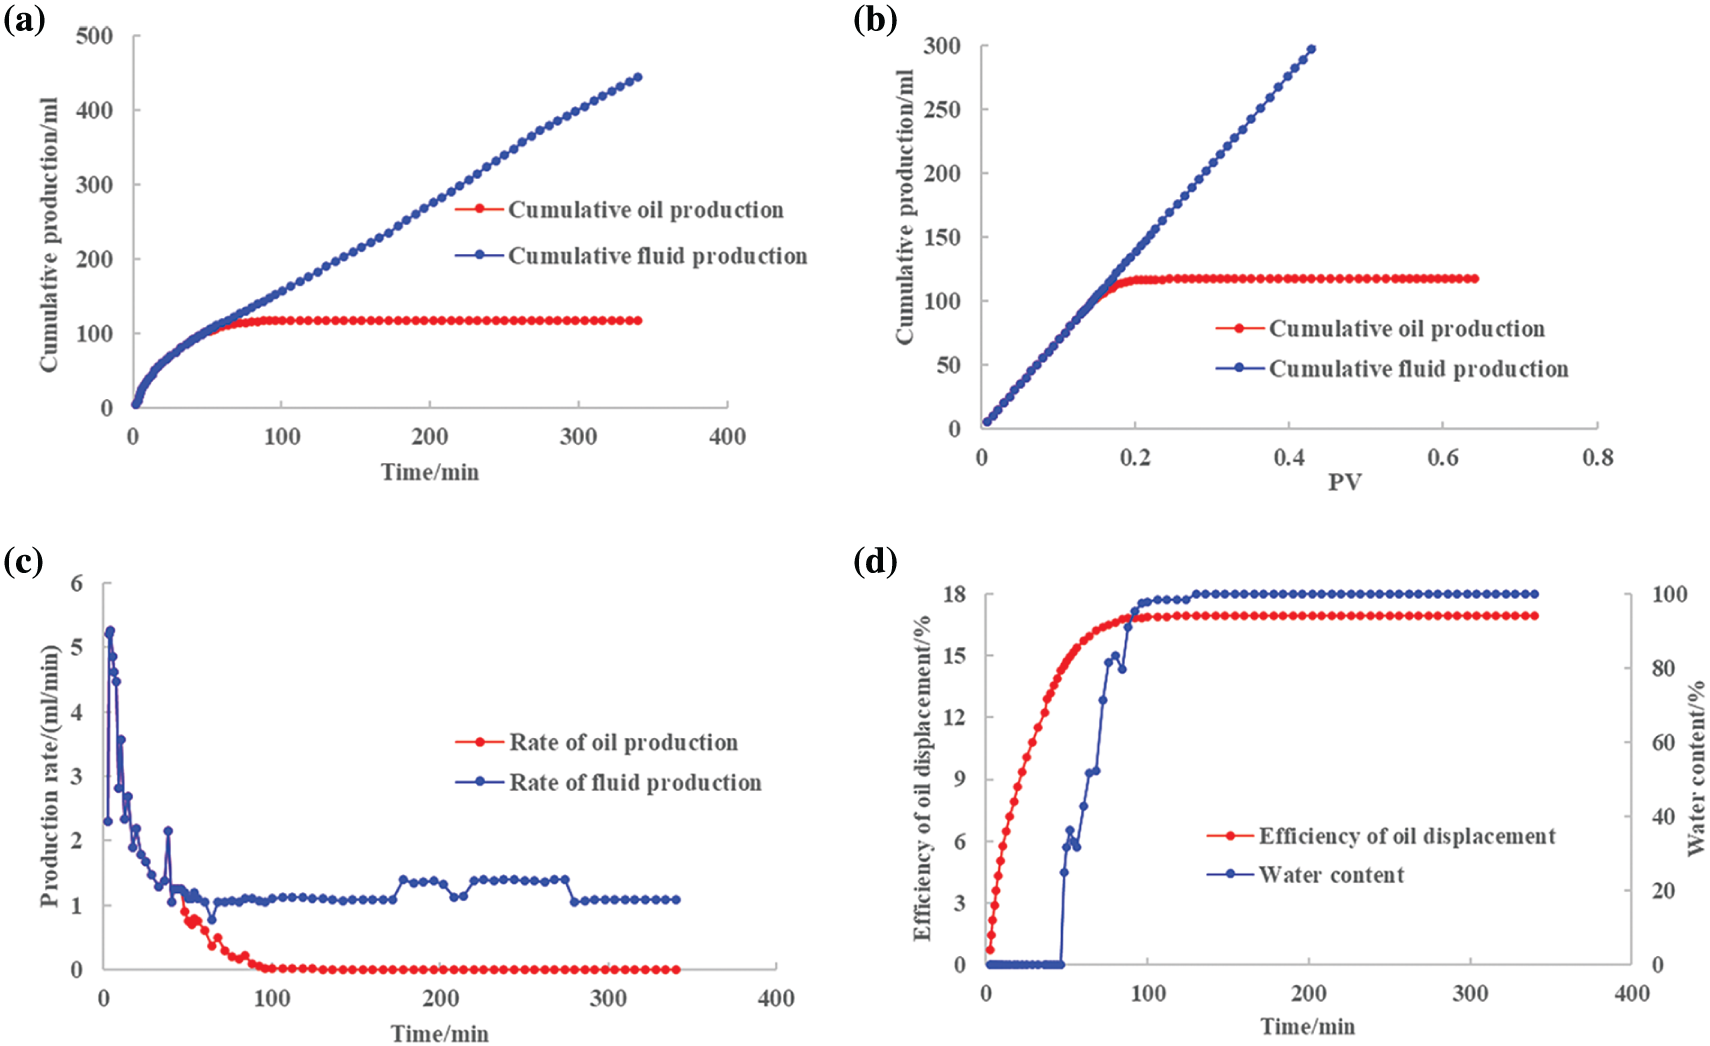
Figure 3: Waterflooding development characteristics at 6.89 MPa through inter-fracture injection and production. (a) The relationship between cumulative production and time. (b) The relationship between cumulative production and PV. (c) The relationship between production rate and time. (d) Displacement efficiency, water content and time relationship

Figure 4: Waterflooding development characteristics at 3.45 MPa through inter-fracture injection and production. (a) The relationship between cumulative production and time. (b) The relationship between cumulative production and PV. (c) The relationship between production rate and time. (d) Displacement efficiency, water content and time relationship

Figure 5: Waterflooding development characteristics at 1.88 MPa through inter-fracture injection and production. (a) The relationship between cumulative production and time. (b) The relationship between cumulative production and PV. (c) The relationship between production rate and time. (d) Displacement efficiency, water content and time relationship
It was observed that the fluid production and oil production curves during inter-fracture injection and production in volumetric fractured horizontal wells of tight reservoirs decreased rapidly, corresponding to a power function decay (Figs. 3c, 4c, 5c). Furthermore, at a displacement pressure of 6.89 MPa, the oil production curve decreased from the initial 5.26 to 0.90 mL/min at 48 min, with an 82.29% decline. The oil recovery curve decreased from 2.00 to 0.10 mL/min at 396 min, and the displacement pressure was 1.88 MPa with a 95.00% decline. Additionally, the water content in the model exhibited a rapidly increasing trend upon commencement of water production, with the final water content exceeding 90% (Figs. 3d, 4d, 5d).
Given the development of inter-fracture injection and production in horizontal wells of tight reservoirs, reducing injection pressure inhibited the flow process and prolonged the water-free recovery period. The oil repelling efficiency was 16.93%, 16.09%, and 15.98% for repulsion pressures of 6.89, 3.45, and 1.88 MPa, respectively, with an average of 16.33%. The slight decrease in oil repelling efficiency with lower injection pressure was primarily attributable to the small pore throat of tight reservoirs and relatively large capillary force during oil and water flow phases (Fig. 6). In higher permeability reservoirs, higher pressure reduced capillary forces, thereby enhancing oil repelling efficiency. However, in practical tight reservoir development, the repelling pressure should not exceed the rupture pressure of reservoir rocks to prevent the formation of a dominant water injection channel, which can reduce efficiency.

Figure 6: Comparison of oil displacement efficiency at different pressures during waterflooding through inter-fracture injection and production
3.2 Pressure Variation Analysis
In the high-temperature and high-pressure large-scale physical simulation experimental system, pressure monitoring during the inter-fracture injection and production in volumetric fractured horizontal wells of tight reservoirs were achieved through strategically placed pressure measurement points and sensors on the encapsulated model. This setup allowed for the observation of pressure variations at different repulsion times, and the pressure dynamics were plotted using the Surfer software based on the coordinates of the deployment points (Fig. 1b).
In Figs. 7–9, it was observed that injecting simulated formation water at different pressures established an effective repulsion system and formed a linear injection and extraction pattern. As injection time increased, the pressure at both ends of the injected fracture uniformly propagated toward the extraction fracture end, evenly forming a stable flow. Conversely, as injection pressure decreased, the time required to form this stable flow increased. The formation times for stable flow at three different pressures of 6.89, 3.45, and 1.88 MPa, were 50, 193, and 395 min, respectively. Inter-fracture displacement water repellency process in tight reservoir volume fractured horizontal wells effectively established a repulsion system. Furthermore, with the progression of inter-fracture displacement water injection, the pressure at both ends of the injection fracture uniformly advanced toward the extraction fracture end, forming a linear recovery mode. This mode transitions from the traditional dotted injection approach in walls to an efficient linear injection system.

Figure 7: Pressure cloud diagram of the water flooding process in inter-fracture injection and production at 6.89 MPa


Figure 8: Pressure cloud diagram of the water flooding process in inter-fracture injection and production at 3.45 MPa

Figure 9: Pressure cloud diagram of the water flooding process in inter-fracture injection and production at 1.88 MPa
The pressure measurement points numbered 1, 3, 2, 6, 23, 25, and 28 in the model shown in Fig. 1b are referred to as the first row of pressure points. The pressure distribution characteristics at different rows were plotted based on these points. Figs. 10–12 illustrate the pressure distribution at both ends of the injected fracture from various positions along the extracted fracture. At the onset of repulsion (0 min), the pressure throughout the model was in equilibrium, indicating consistent distribution. As inter-fracture repulsion injection progressed in volumetric fractured horizontal wells of tight reservoirs, the pressure decreased over time.

Figure 10: Pressure changes at different positions under 6.89 MPa of inter-fracture injection and production

Figure 11: Pressure changes at different positions under 3.45 MPa of inter-fracture injection and production

Figure 12: Pressure changes at different positions under 1.88 MPa of inter-fracture injection and production
In the initial stage of line injection and production water flooding in tight reservoirs, flow resistance was primarily encountered at the oil–waterfront and the water-swept area, owing to the high-pressure difference and flow rate at the injection end. The friction and other factors at the far end of the horizontal resulted in a lower water injection flow rate, facilitating lateral imbibition and resistance formation. Line injection and production in tight reservoirs shortened the percolation distance of oil and water to less than injection-production well row spacing by narrowing the injection-production unit distance. This effectively reduced the starting pressure gradient. Additionally, oil and water exhibited linear flow between injection and production fractures, which significantly reduced percolation resistance, increased the displacement range, formed an effective displacement system, and ultimately enhanced oil recovery. Simultaneously, during the water flooding process, both a displacement-dominant swept area and an imbibition-dominant swept area were formed. In tight oil reservoirs, the high displacement front velocity and strong scouring effect resulted in less dispersed phase distribution. On both sides, the slower displacement rate and weaker scour effect led to the formation of extensive dispersed phases due to imbibition. The dispersed phase at the front increased displacement pressure gradually, while the dispersed phase on the sides limited lateral expansion of water injection. This phenomenon limited the effectiveness of the water flooding process, eventually reaching a steady percolation state. To enhance oil recovery in later stages, interfacial resistance was eliminated through approaches such as refracturing or the use of appropriate chemicals.
Specifically, when the displacement pressure was 6.89 MPa, the pressure at 6.7 cm from the injection fracture was 2.62 MPa at 2 min, with a decrease of 61.9%. At 13.4 cm from the injection fracture, the pressure was 1.25 MPa, with a decrease of 81.9% (Fig. 10). Furthermore, when the repulsion pressure was 3.45 MPa at 2 min, the pressure at 6.7 cm from the injection fracture was 1.68 MPa, with a decrease of 51.3%. At 13.4 cm from the injection fracture, the pressure was 0.89 MPa, with a decrease of 74.2% (Fig. 11). When the repulsion pressure was 1.88 MPa, the pressure at 6.7 cm from the injection fracture was 0.97 MPa, with a decrease of 48.4%. At 13.4 cm from the injection fracture, the pressure was 0.58 MPa, with a decrease of 69.1% after 2 min (Fig. 12). The resistance to the development of inter-fracture injection and production in volume fractured horizontal wells in tight reservoirs was primarily concentrated at the leading edge of the water drive. Higher repulsion pressure enhanced the ability to overcome the resistance at the leading edge of the water drive.
Reservoir numerical simulation technology is widely employed in the development of tight oil reservoirs due to its strong comparability and controllable conditions. CMG reservoir numerical simulation software has a wide range of applications. To elucidate the impact of various single factors on the production of horizontal wells and eliminate the interference of other factors, the CMG reservoir numerical simulation software was employed. Initially, the research was conducted using a homogeneous numerical model. The model consists of one production well and one waterflooding well, featuring five fracturing segments with staggered fractures evenly spaced (Fig. 13).

Figure 13: Numerical simulation model for inter-fracture injection and production
The model includes 40, 21, and 5 grids in the I, J, and K directions, respectively, totaling 4200 grids. The basic parameters of the homogeneous model are presented in Table 2.

Before the analysis of relevant influencing factors, a basic model was established as a reference. The model utilized the geological parameters in Table 2 as the basic calculation parameters without incorporating various influencing factors. The reference model was then compared with models that include various influencing factors. Subsequently, it assessed the impact of factors such as fracturing scale, fracture diversion capacity, injection-production ratio on the effectiveness of inter-fracture displacement development. The average permeability of the reservoir was 0.1 mD, the half-length of the fracture was 150 m, the fracture conductivity was 300 mD˙cm, and the injection-production ratio was 1:1.
The water injection rate for the basic model was 100 m3/day, and the production well was constrained to a liquid production rate of 100 m3/day. The model predicts a production time of 20 years. The basic model simulation results are shown in Fig. 14.

Figure 14: Basic model simulation results
To study the comprehensive effects of the injection-production ratio, fracture spacing, and fracture half-length on the displacement results between horizontal wells, multiple new simulation schemes were designed based on a basic scheme. The injection-production ratios tested were 0.8:1, 1.2:1, and 1.4:1. The fracture spacing were 100, 150, and 200 m, and the fracture half-lengths were 50, 100, 150, and 175 m.
In Fig. 15, it was observed that when the injection-production ratio was 0.8:1, the fractures half-length significantly impacted cumulative oil production. Specifically, cumulative oil production increased with the fracture half-length. As the fracture spacing increased, cumulative oil production also increased, peaking at a fracture half-length of 175 m, and a fracture spacing of 100 m. At an injection-production ratio of 1:1 and a half-length of <100 m, cumulative oil production increased with fracture spacing. However, for a fracture half-length of 175 m, cumulative oil production decreased with increasing fracture spacing. The optimal fracture spacing was 150 m when the fracture half-length was constant. The highest cumulative oil production occurred with a fracture half-length of 175 m and a fracture spacing of 100–150 m. Furthermore, when the injection-production ratio was 1.2:1 and fracture spacing was constant, cumulative oil production increased with fracture half-length. At a fracture half-length of <100 m, both fracture spacing and cumulative oil production increased. The recovery degree increased at a fracture spacing of 150 m. At an injection-production ratio of 1.4:1, the trends correlated with those of 1.2:1. Additionally, when the fracture half-length was ≥150 m and the fracture spacing was 150 m, the cumulative oil production increased.

Figure 15: Accumulated oil production under different injection-production ratios. (a) Fracture half-length of 50 m. (b) Fracture half-length of 100 m. (c) Fracture half-length of 150 m. (d) Fracture half-length of 175 m
In Fig. 16, it was observed that the pressure distribution at the injection and production ends was linear, differing significantly from the pressure drop funnel distribution seen in conventional vertical wells. Near the production end, the pressure distribution was similar to that of a pressure drop funnel. This phenomenon indicated that under inter-fracture displacement conditions, the pressure gradient at both the injection and production ends was consistent, with minimal pressure loss near the wellbore. This feature ensured that crude oil in the middle of the reservoir maintained similar displacement energy to the injected/produced crude oil, enhancing crude oil displacement efficiency.
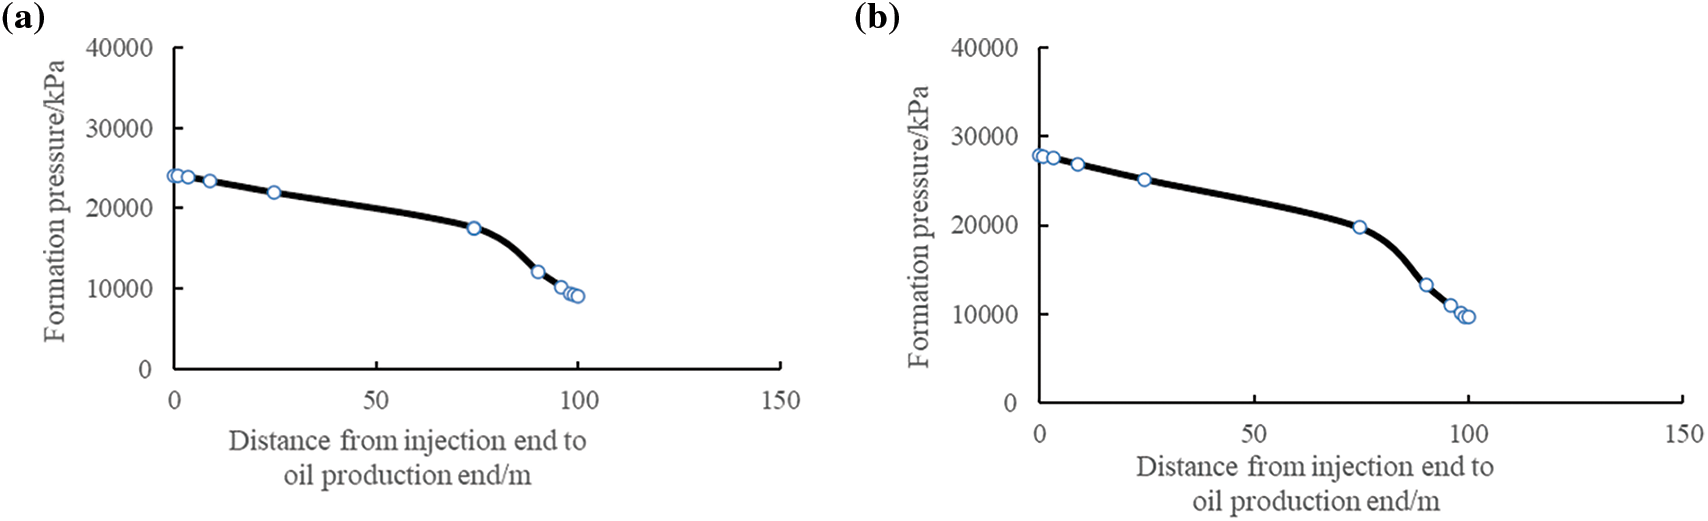
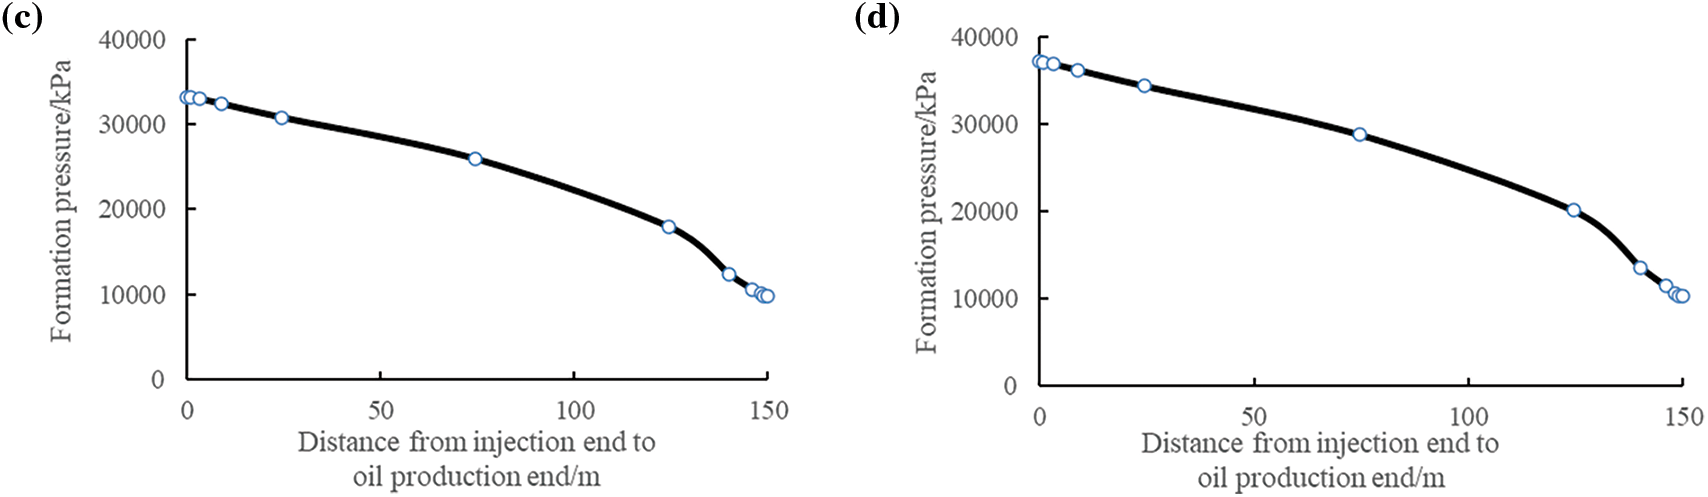
Figure 16: Prediction of formation pressure distribution at the injection and production ends of the middle section of the fracture at the end of the prediction period (fracture half-length of 150 m). (a) Injection-production ratio of 0.8:1. (b) Injection-production ratio of 1:1. (c) Injection-production ratio of 1.2:1. (d) Injection-production ratio of 1.4:1
In Fig. 17, it was observed that the oil saturation distribution at the injection and production ends formed an arch. Closer to the injection end, the oil saturation distribution was lower. However, within the reservoir (>10 m away from the injection/production end), oil saturation remained relatively consistent, indicating that displacement efficiency was not significantly affected by distance. This consistency correlated with the aforementioned pressure distribution trends at the injection/production ends. Hence, the pressure gradient inside the reservoir remained unchanged, and oil displacement efficiency was maintained. In comparison with conventional vertical well injection and production, inter-fracture displacement exhibited excellent oil displacement efficiency. Additionally, the low oil saturation (10%) at the injection/production ends was attributable to the low residual oil saturation in the fractures and adjacent areas.
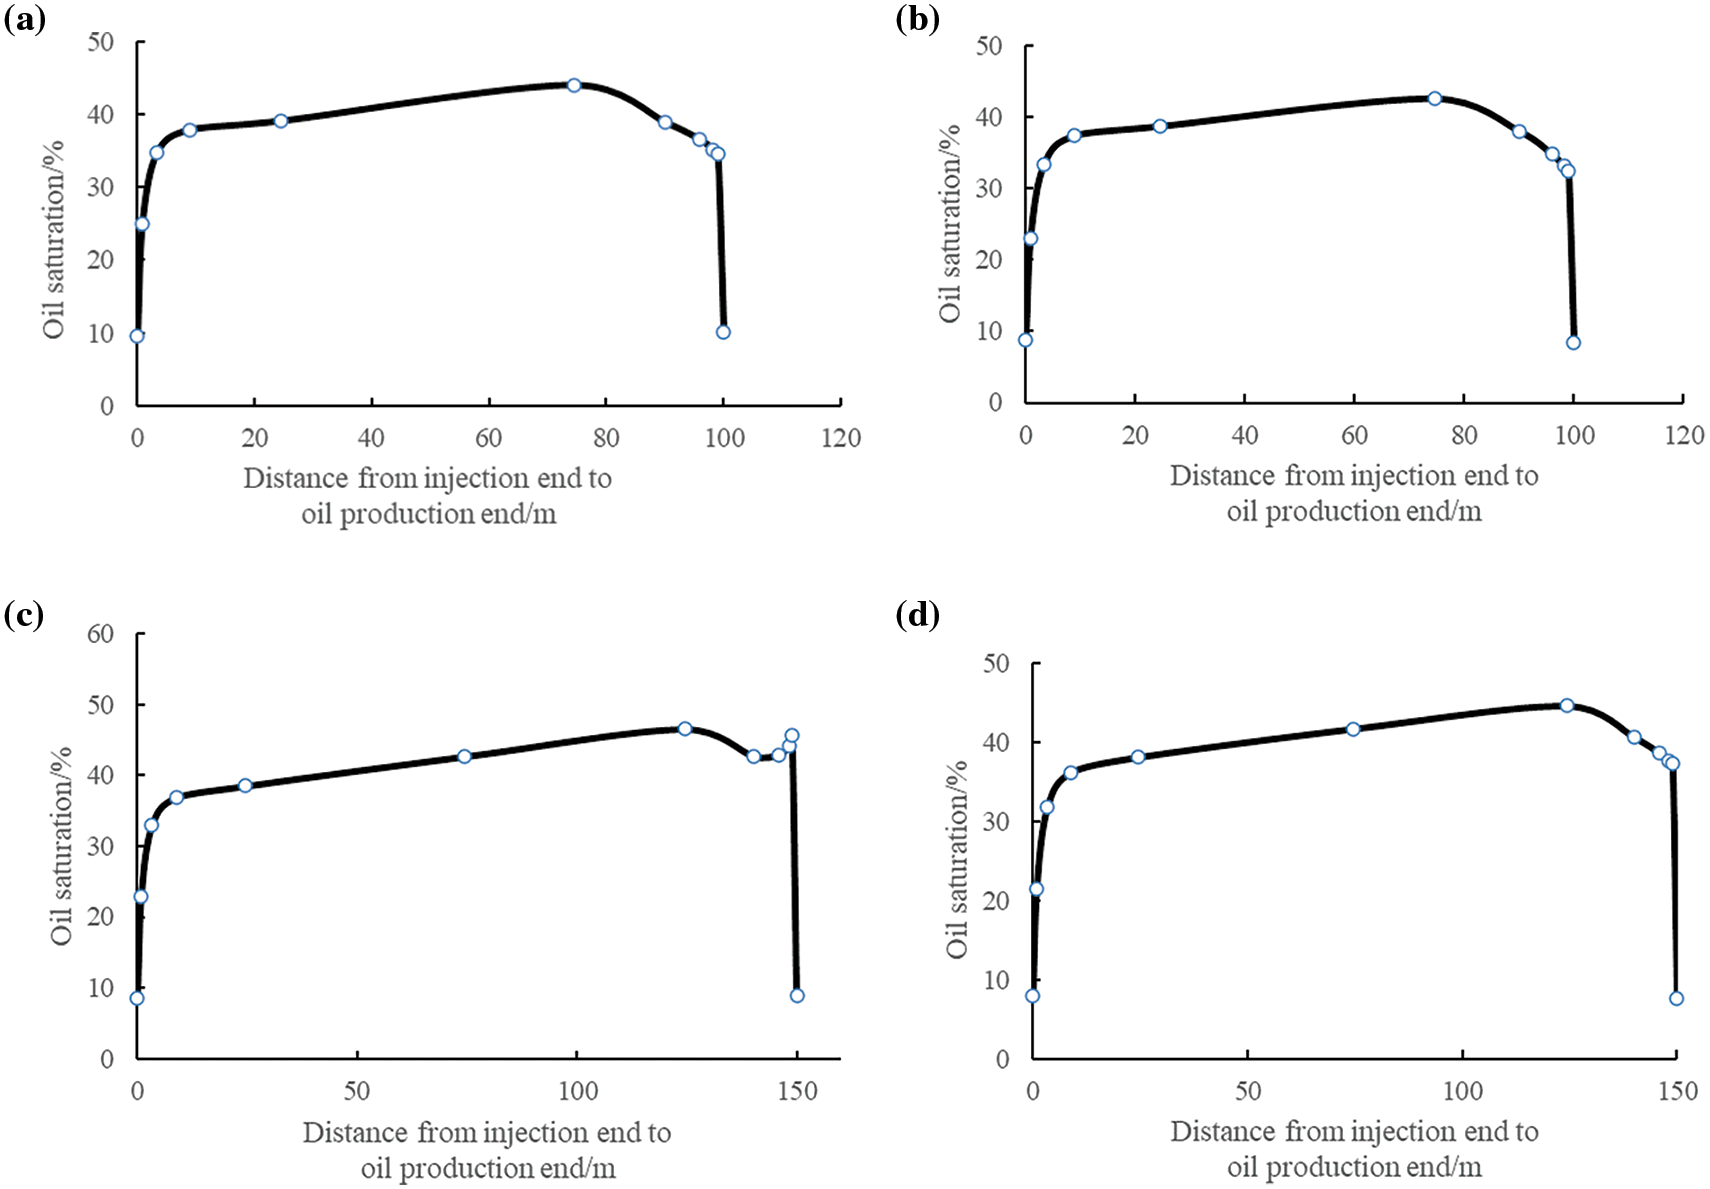
Figure 17: Oil saturation distribution curve at the injection and production ends of the middle section of the predicted fracture at the end of the period (fracture-half length of 150 m). (a) Injection-production ratio of 0.8:1. (b) Injection-production ratio of 1:1. (c) Injection-production ratio of 1.2:1. (d) Injection-production ratio of 1.4:1
3.4 Seepage Mechanism and Field Application Analysis in Oilfield
Under the development mode of inter-fracture injection and production for volumetric fractured horizontal wells in tight reservoirs, water injection, and oil recovery through fractures established an effective displacement system and replenished energy, thereby increasing the recovery rate. Furthermore, during the process of oil–water seepage, before the effective displacement system was established, the flow resistance was primarily concentrated at the oil–water leading edge and water wave area, owing to the high-pressure difference and flow velocity at the injection end. The lower flow velocity at the distal horizontal end, owing to friction and other factors, facilitated lateral seepage and increased resistance. After establishing the effective displacement system, the oil–water seepage channel was formed, and resistance gradually extended toward the extraction fracture area. The higher the pressure of inter-fracture displacement water injection process, the more reduced the capillary resistance, replacing more oil droplets, and enhancing the recovery rate of tight oil reservoirs without resulting in water fracture Additionally, the pressure conductivity at 6.7 cm from the injected fracture was 61.9%, 51.3%, and 48.4% for three different repellant pressures at 2 min of repellant. The differences of 10.6 and 13.5 percentage points in the pressure transfer range indicated that higher repellency pressure achieved larger pressure transfer for inter-fracture injection and production development.
From the field side, Liu and other scholars selected the southern part of Z288 well as the test area for horizontal well line injection and extraction (inter-fracture displacement) replenishment development for the Heshui oilfield in the Ordos Basin. They formulated development technology policies such as well spacing, section spacing, horizontal section length, and water injection volume according to the fracture morphology and reservoir characteristics [31]. The initial daily oil production of the GP78-77 test well was 8.0 t with a water content of 42.0%. The daily oil production in the 12th month was 5.4 t, and the water content was 33.2%, leading to a 32.5% decrease in the first year. Two comparable horizontal wells in the area produced 8.2 t of oil per day initially with a water content rate of 39.3%. Subsequently, 5.0 t of oil per day in the 12th month, with a water content rate of 25.6%, resulted in a 39.0% decrease in the first year. Therefore, compared with the conventional five-point well network, the first-year decline of the inter-fracture drive test well was 6.5%, indicating that inter-fracture drive technology enhanced water drive effects, achieving effective energy supplementation, and controlling reservoir decline in ultra-low permeability reservoirs. Wang et al. studied and analyzed synchronous injection and production of horizontal wells in the ultra-low permeability sandstone reservoir of the Changqing Oilfield in the Ordos Basin. They selected well CP14-01 in Block Y284, where microfractures were relatively undeveloped, determining the reasonable injection pressure to be 10 MPa [32]. After inter-fracture displacement became effective, the daily oil production per well was 2.55 t. Furthermore, following the field test, the average daily fluid production increased from 3.1 to 5.3 m3 before the test, and daily oil production increased from 2.1 to 4.0 t. The water cut decreased significantly, and the production was relatively stable. This method can be applied for developing low permeability tight reservoirs.
Finally, field test results indicated that the inter-fracture injection and production method for volumetric fractured horizontal wells effectively increased single-well productions and reduced decline rates. This method also yielded ideal economic benefits, making it valuable for replenishing low permeability tight reservoirs.
(1) A physical simulation experiment was established to study the development of inter-fracture injection and production in horizontal wells of tight oil reservoirs under different injection pressures.
(2) Volume fracturing of tight reservoirs with inter-fracture injection and production between horizontal wells reduced the distance between injection and extraction units, reducing seepage resistance, and establishing an effective displacement system. In comparison with conventional medium and high permeability reservoirs, higher pressure resulted in reduced capillary force without resulting in water fracture. Additionally, higher displacement pressure increased pressure transfer for inter-fracture displacement water injection development, thus expanding the wave and enhancing oil recovery efficiency.
(3) A numerical simulation model for inter-fracture displacement was established. The effects of fracture spacing, half-length, and the injection-production ratio on inter-fracture injection production were analyzed. Under inter-fracture displacement conditions, the pressure gradient at the injection and production ends remained consistent, and there was no significant pressure loss near the wellbore. This ensured that the crude oil in the middle of the reservoir exhibited displacement energy, which corresponded to the injected/produced crude oil, thereby enhancing the efficiency of crude oil displacement.
Acknowledgement: None.
Funding Statement: This work is supported by the Study on the Seepage Law of Typical Low-Grade Oil Reservoirs, New Methods for Enhancing Oil Recovery (2021DJ1102), the National Science and Technology Major Special Support Program (Grant No. 2017ZX05064), the CNPC Innovation Foundation (Grant No. 2022DQ02-0604).
Author Contributions: The authors confirm contribution to the paper as follows: study conception and design: Xinli Zhao; analysis and interpretation of results: Qianhua Xiao, Xuewei Liu, Xiangji Dou; numerical simulation: Xinli Zhao, Yu Shi, Guoqiang Xing. All authors reviewed the results and approved the final version of the manuscript.
Availability of Data and Materials: All data are included in this published article.
Ethics Approval: Not applicable.
Conflicts of Interest: The authors declare no conflicts of interest to report regarding the present study.
References
1. Syed FI, Dahaghi AK, Muther T. Laboratory to field scale assessment for EOR applicability in tight oil reservoirs. Pet Sci. 2022;19(5):2131–49. [Google Scholar]
2. Energy Information Administration (EIA). Low permeabitlity oil and gas plays, Maps; 2022. Available from: https://www.eia.gov/special/shaleplays/. [Accessed 2022]. [Google Scholar]
3. Sohail GM, Ahmed E, Radwan MM. A review of Pakistani shales for shale gas exploration and comparison to North American shale plays. Energy Rep. 2022;8:6423–42. doi:10.1016/j.egyr.2022.04.074. [Google Scholar] [CrossRef]
4. Zhao XL, Yang ZM, Liu XW, Wang ZY, Luo YC. Analysis of pore throat characteristics of tight sandstone reservoirs based on high-pressure mercury intrusion and thin section. Open Geosci. 2020;55(8):6911–22. [Google Scholar]
5. Li XB, Yang ZL, Wang J, Liu H, Chen QL, Rong WY. Mud-coated intraclasts: a criterion for recognizing sandy masstransport deposits deep-lacustrine massive sandstone of the upper triassic yanchang formation, ordos basin, central China. J Asian Earth Sci. 2016;129:98–116. doi:10.1016/j.jseaes.2016.06.007. [Google Scholar] [CrossRef]
6. Wu ST, Zhu RK, Yan Z, Mao Z, Cui J, Zhang X. Distribution and characteristics of lacustrine tight oil reservoirs in china. J Asian Earth Sci. 2018;178:20–36. [Google Scholar]
7. Liu CH, Liu KY, Wang XQ, Wu L, Fan Y. Chemostratigraphy and sedimentary facies analysis of the Permian Lucaogou formation in the Jimusaer Sag, Junggar Basin, NW China: implications for tight oil exploration. J Asian Earth Sci. 2019;178:96–111. doi:10.1016/j.jseaes.2018.04.013. [Google Scholar] [CrossRef]
8. Zhao XL, Yang ZM, Lin W, Xiong SC, Wei YY. Characteristics of microscopic pore-throat structure of tight oil reservoirs in Sichuan Basin measured by rate-controlled mercury injection. Open Phys. 2018;16:675–84. doi:10.1515/phys-2018-0086. [Google Scholar] [CrossRef]
9. Chen H, Liu XL, Zhang C, Tan XH, Yang R, Yang SL, et al. Effects of miscible degree and pore scale on seepage characteristics of unconventional reservoirs fluids due to supercritical CO2 injection. Energy. 2022;239:122287. doi:10.1016/j.energy.2021.122287. [Google Scholar] [CrossRef]
10. Liu XL, Chen H, Chen ZH, Yang R, Song LY, Bai MM, et al. Study on characterization and distribution of four regions of tight sandstone condensate gas reservoirs in the depletion development process. Fuel. 2024;358:130267. doi:10.1016/j.fuel.2023.130267. [Google Scholar] [CrossRef]
11. Wei B, Song T, Gao Y, Xiang H, Xu X, Kadet V, et al. Effectiveness and sensitivity analysis of solution gas re-injection in Baikouquan tight formation, Mahu sag for enhanced oil recovery. Petroleum. 2020;6(3):253–63. doi:10.1016/j.petlm.2019.10.001. [Google Scholar] [CrossRef]
12. Yang G, Huang D, Huang P, Yan W, Yang T, Dai H, et al. Control factors of high and stable production of Jurassic Da’anzhai Member tight oil in central Sichuan Basin, SW China. Pet Explor Dev. 2017;44(5):866–75. doi:10.1016/S1876-3804(17)30098-8. [Google Scholar] [CrossRef]
13. Sheng JJ, Chen K. Evaluation of the EOR potential of gas and water injection in shale oil reservoirs. J Unconventional Oil Gas Resour. 2014;5:1–9. doi:10.1016/j.juogr.2013.12. [Google Scholar] [CrossRef]
14. Zheng TY, Yang ZM, Liu XG, Luo YT, Xiao QH, Zhang YP, et al. Understanding immiscible natural gas Huff-N-Puff Seepage mechanism in porous media—a case study of CH4 HNP laboratorial and numerical simulations in Chang-7 tight core. Nat Resour Res. 2021;30(3):2397–411. doi:10.1007/s11053-021-09836-2. [Google Scholar] [CrossRef]
15. Chen T, Yang ZM, Luo YT, Lin W, Xu J, Ding YH, et al. Evaluation of displacement effects of different injection media in tight oil sandstone by online nuclear magnetic resonance. Energies. 2018;11(10):2836. doi:10.3390/en11102836. [Google Scholar] [CrossRef]
16. Syed FI, Muther T, Dahaghi AK, Neghabhan S. CO2 EOR performance evaluation in an unconventional reservoir through mechanistic constrained proxy modeling. Fuel. 2022;310:122390. doi:10.1016/j.fuel.2021.122390. [Google Scholar] [CrossRef]
17. Qin G, Dai X, Wu M, Zheng Y, Li W. Study of massive water huff-n-puff technique in tight oil field and its field application. J Pet Sci Eng. 2021;196:107514. doi:10.1016/j.petrol.2020.107514. [Google Scholar] [CrossRef]
18. Akbar I, Zhou H, Liu W, Qureshi AS, Memon A, Muther T. Nano-suspension combined effect with polymer gels for enhanced oil recovery in low permeability reservoir. Arabian J Geosci. 2021;4(15):1–16. [Google Scholar]
19. Zhao XL, Yang ZM, Lin W, Xiong SC, Luo YT, Wang ZY, et al. Study on pore structures of tight sandstone reservoirs based on nitrogen adsorption, high-pressure mercury intrusion and rate-controlled mercury intrusion. J Energy Resour Technol. 2019;141(11):112903. doi:10.1115/1.4043695. [Google Scholar] [CrossRef]
20. Li ZX, Qu XF, Liu WT, Lei QH, Sun HL, He YA. Development modes of Triassic Yanchang formation Chang 7 member tight oil in Ordos Basin, NW China. Pet Explor Developme. 2015;42(2):217–21. [Google Scholar]
21. Sun RX, Pu H, Yu W, Miao J, Zhao JX. Simulation-based enhanced oil recovery predictions from wettability alteration in the Middle Bakken tight reservoir with hydraulic fractures. Fuel. 2019;253:229–37. doi:10.1016/j.fuel.2019.05.016. [Google Scholar] [CrossRef]
22. Wang XY. Research on oil recovery mechanism of huff and puff in ultra-low permeability tight reservoir. Beijing, China: University of Chinese Academy of Sciences; 2018. [Google Scholar]
23. Michael R. Drilling down the bakken learning curve; 2015. Available from: http://www.usaee.org/usaee2015/best/Redlinger.pdf. [Accessed 2024]. [Google Scholar]
24. Wang ZY, Zhao XL, Xiong SC, He Y. Semi-analytical model-based research on influencing factors of the spacing of volume fracturing horizontal well in tight oil reservoirs via consideration of imbibition. J Pet Sci Eng. 2021;198:108167. doi:10.1016/j.petrol.2020.108167. [Google Scholar] [CrossRef]
25. Cheng SQ, Wang Y, Lang HH, Yu HY, Sun Z. Feasibility of injection and production between multi-stage fracturing horizontal wells in tight oil reservoirs. Acta Petrolei Sinica. 2017;38(12):1411–9. [Google Scholar]
26. Fu X, Bonifas P, Finley A, Lemaster J, He Z, Venepalli K. Tight oil EOR through inter-fracture gas flooding within a single horizontal well. In: SPE annual technical conference and exhibition; Calgary, AB, Canada; 2019. doi:10.2118/196078-MSSPE-196078-MS. [Google Scholar] [CrossRef]
27. Yu HY, Yang ZL, Ma T, Lei Z, Cheng SQ, Chen H. The feasibility of asynchronous injection alternating production for multistage fractured horizontal wells in a tight oil reservoir. Pet Sci Bull. 2018;1:32–44. [Google Scholar]
28. Mydland S, Yusra I, Whitson CH, Dahouk MM, Carlsen ML. Gas EOR processes in tight unconventionals. In: SPE Improved Oil Recovery Conference, 2020; SPE-200396-MS. doi:10.2118/200396-MS. [Google Scholar] [CrossRef]
29. Zhao XL, Yang ZHM, Liu XW, Zhang YP, Shen WJ. Study on the flow characteristics of tight oil reservoirs with linear injection and production for volume-fractured horizontal wells. Phys Fluids. 2023;35:63112. doi:10.1063/5.0153895. [Google Scholar] [CrossRef]
30. Zhao XL, Liu XW, Yang ZHM, Wang F, Zhang YP, Liu GZ, et al. Experimental study on physical modeling of flow mechanism in volumetric fracturing of tight oil reservoir. Phys Fluids. 2021;33:107118. doi:10.1063/5.0068594. [Google Scholar] [CrossRef]
31. Liu J, Xie QC, Fan JM, Wang JW, Sun D, Wang D. Exploration of energy supplementation method for horizontal well line injection production in ultra-low permeability reservoirs. Pet Sci Technol Forum. 2022;41(2):39–44. [Google Scholar]
32. Wang J, Liu JG, Li ZG, Li HC, Zhang J, Li WQ, et al. Synchronous injection-production energy replenishment for a horizontal well in an ultra-low permeability sandstone reservoir: a case study of Changqing oilfield in Ordos Basin, NW China. Pet Explor Dev. 2020;47(4):772–9. [Google Scholar]
Cite This Article
 Copyright © 2025 The Author(s). Published by Tech Science Press.
This work is licensed under a Creative Commons Attribution 4.0 International License , which permits unrestricted use, distribution, and reproduction in any medium, provided the original work is properly cited.
 Downloads
 Citation Tools