
 Submit a Paper
 Propose a Special lssue
 Open Access
ARTICLE

Numerical Study on the Influence of Rectifier Grid on the Performances of a Cement Kiln’s SCR (Selective Catalytic Reduction) Denitrification Reactor
1 School of Energy and Environment, Anhui University of Technology, Ma’anshan, 243002, China
2 School of Civil Engineering and Architecture, Anhui University of Technology, Ma’anshan, 243002, China
3 Anhui Weida Environment Protection Science &Technology Co., Ltd., Hefei, 230041, China
* Corresponding Author: Fuping Qian. Email:
Fluid Dynamics & Materials Processing 2025, 21(5), 1171-1190. https://doi.org/10.32604/fdmp.2025.055985
Received 11 July 2024; Accepted 13 December 2024; Issue published 30 May 2025
 View Full Text
 Download PDF
Abstract
In this study, Computational Fluid Dynamics (CFD) together with a component transport model are exploited to investigate the influence of dimensionless parameters, involving the height of the rectifier grid and the installation height of the first catalyst layer, on the flow field and the overall denitration efficiency of a cement kiln’s SCR (Selective catalytic reduction) denitrification reactor. It is shown that accurate numerical results can be obtained by fitting the particle size distribution function to the actual cement kiln fly ash and implementing a non-uniform particle inlet boundary condition. The relative error between denitration efficiency derived from experimental data, numerical simulation, and real-time system pressure drop ranges from 4% to 9%. Optimization of the SCR reactor is achieved when the rectifier grid thickness ratio k/H ≥ 0.030, the rectifier grid height ratio h/H = 0.04, and the spacing between the rectifier grid and the first catalyst layer l/H = 0.10. Under these conditions, airflow distribution and particle dispersion upstream of the catalyst result in increased denitration efficiencies of 3.21%, 3.43%, and 3.27%, respectively, compared to the least favorable operating conditions.Keywords
The cement industry is the main source of greenhouse gas, particulate matter, nitrogen oxides, and sulfide emissions [1,2]. Compared to other industrial process emissions, cement kiln flue gas has the characteristics of high dust content and small particle size. Selective catalytic reduction (SCR) technology is the key technology for denitrification of cement kiln flue gas, and the existing SCR denitrification technology faces the problems of ultra-low emission retrofit and catalyst wear [3,4]. The “14th Five Year Plan for Industrial Green Development” pointed out that it is necessary to implement the ultra-low emission transformation of the cement industry steadily and to implement the ultra-low emission of desulphurization, denitrification, and dust removal in the cement industry [5]. Therefore, research into advanced NOx removal technologies and optimization of existing denitrification processes has become a pressing issue in today’s environmental and ecological fields. Scientists have done a lot of research on SCR denitrification systems, and a large number of studies focused on the study of SCR reactors in coal-fired power plants, and there is relatively little research on the cement industry [6,7]. An et al. [8] used the numerical simulation method to optimize the design of the guide plate of an SCR system. The research results show that the gas flow can be uniformly distributed by the reasonable design of the guide structure, and the local wear problem of the catalyst can be improved. Gao et al. [9] used CFD to simulate SCR denitrification systems and industrial-scale SCR experiments. By adding a deflector in the flue gas channel, the velocity distribution and concentration distribution of the gas-solid two-phase flow field were more uniform, thus reducing catalyst wear. Sohn et al. [10] made a numerical analysis of the SCR system of an industrial-scale thermal power plant and suggested that the mixer should be placed far away from the catalyst layer to improve the uniformity of mixing and the flow rate of the working fluids. Ma [11] found that the particle size of fly ash mainly affected the distribution of wear rate in the guide device. Si et al. [12] installed a dust collector in front of the SCR denitrification reactor to reduce the negative effect of high-concentration fly ash on the catalyst.
In the context of optimizing the structure of an SCR reactor, the researchers primarily have focused on optimizing and enhancing the flue gas deflector, ammonia spraying grid, and hot air device. Cheng et al. [13] demonstrated that optimizing ammonia injection can markedly enhance the uniformity of NOx mass concentration distribution at the reactor outlet and reduce the ammonia escape rate. Zhou et al. [14] employed the CFD method to ascertain that the rectifier grid can enhance the uniformity of the flow field and component concentration field. Shakya et al. [15] conducted CFD simulation research on the ammonia injection grid in the SCR reactor, and the results indicated that the concentration distribution of reductant at the catalyst inlet could be adjusted by setting the ammonia injection speed to align with the design specifications. In a numerical simulation study conducted by Li et al. [16], the layout of a static mixer and the optimization of ammonia injection in the SCR system of a boiler under conditions of uneven inflow were investigated, and their study revealed that the optimization of the zonal flow field in conjunction with the optimization of zonal ammonia injection can enhance the internal flow field of the SCR system and reduce the ammonia escape rate. Liu et al. [17] employed the weight method to optimize ammonia injection and discovered that optimizing ammonia injection based on the weight of the ammonia branch valve can markedly enhance the uniformity of ammonia concentration distribution. Furthermore, they found that optimizing the layout of the guide plate can effectively improve the uniformity of the flow field distribution. Ye et al. [18] conducted an optimization of the structure of the hot air pipe and deflector based on the characteristics of an uneven inlet temperature. Xu et al. [19] employed the Fluent software to simulate the flow field within the SCR denitrification reactor of a cement kiln, utilizing a single gas phase flue gas for analysis and study. The study indicated that the structural characteristics of the rectifier grid and the presence of particulate matter have an impact on the distribution of the flow field within the reactor. Nevertheless, the chemical reaction of denitrification was not considered in this work, and the denitrification effect was evaluated solely based on the relative standard deviation of single-phase flue gas.
In conclusion, the majority of scholars have focused their structural optimization of the SCR denitrification reactor on the optimization of the ammonia injection grid and the improvement of the diversion structure [20]. However, the optimization effect of these modifications was largely determined by the inherent structure of the SCR reactor itself, which had limited relevance for other researchers [21]. However, the configuration of the rectifier grid and the catalyst layer was largely fixed across all SCR reactors. There was a paucity of literature that considered the influence of various factors, such as the height of the grid and the installation height of the first catalyst, on the uniformity of the gas flow field and the coupling of solid particles in the first catalyst. In light of the above, this study takes the SCR denitrification reaction system of a cement kiln as its research object and employs CFD method to investigate the impact of the dimensionless parameters of the rectifier grid height and the installation height of the first layer catalyst on the flow field of the first layer catalyst and the denitrification efficiency of the entire catalyst. On this basis, the optimal optimization measures are proposed for the installation height, the thickness of the rectifier grid and the distance between the rectifier grid and the first layer catalyst.
To facilitate the numerical simulation of the SCR denitrification reaction system in a cement kiln, this study makes simplified assumptions regarding the flow pattern of flue gas in the catalyst:
(1) The model is an adiabatic system.
(2) The gas phase in the model is assumed to be an ideal gas.
(3) Regardless of NO2, CO2, and SO2 components, the SCR denitrification reaction is only related to NO, NH3, O2, H2O, and N2.
(4) The internal fixing parts of the SCR denitrification reaction system are not considered.
2.1 Model Establishment and Boundary Conditions
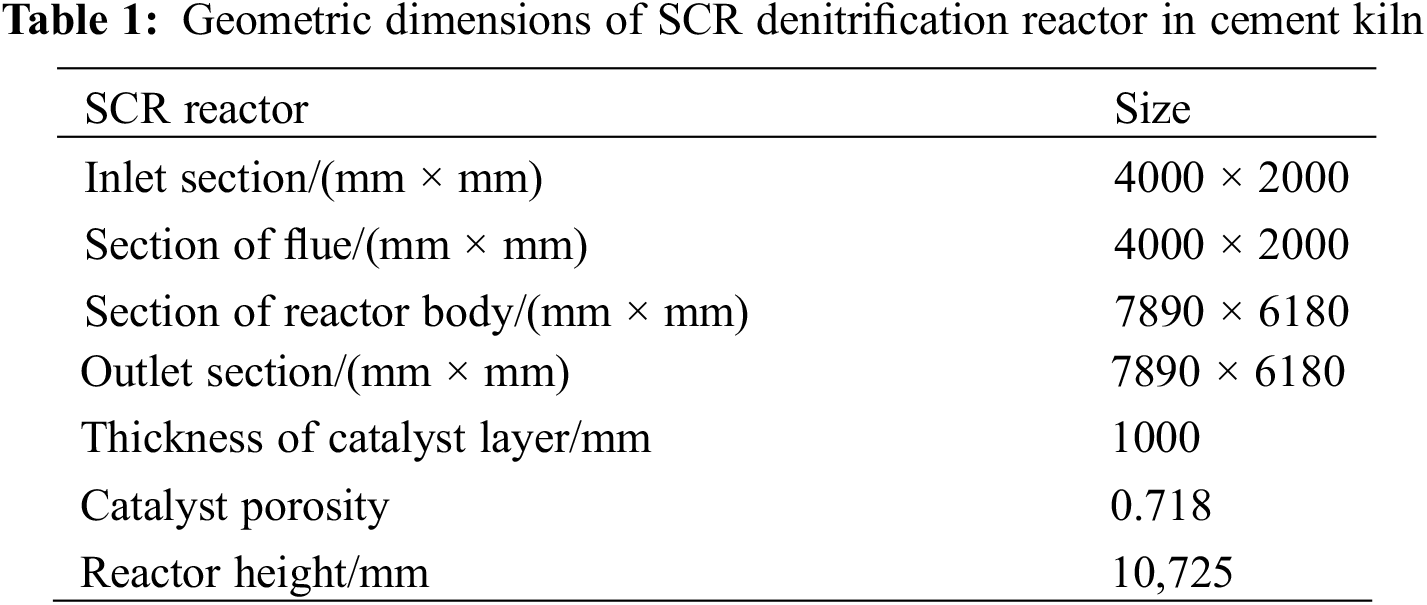
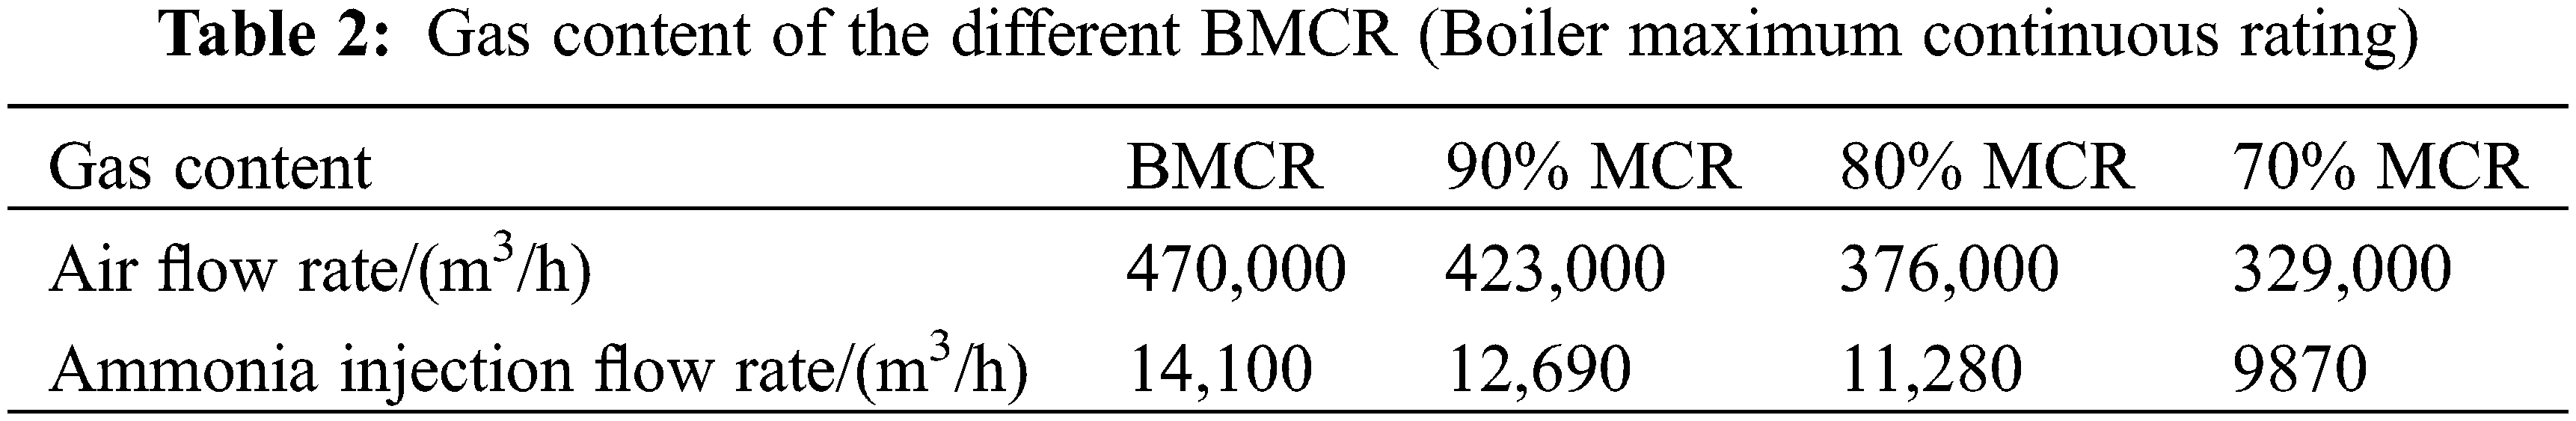
The SCR denitrification reactor is situated at the outlet of the primary preheater in the cement rotary kiln. The system comprises the following principal components: flue gas inlet, flue gas pipeline, ammonia spraying grid, guide plate, rectifying grid, catalyst, and flue gas outlet. The geometric model is illustrated in Fig. 1. The flue gas enters the SCR denitrification reactor from the inlet and flows through the reactor, which sprays reducing ammonia. The mixed gas of ammonia and air is injected into the reactor from the ammonia spraying pipe through 48 small nozzles. The mixed flue gas flows into the reactor’s main body, where the denitrification reaction occurs in the catalyst layer. The overall structural parameters of the reactor are presented in Table 1, and the air and ammonia injection flow rates are shown in Table 2.
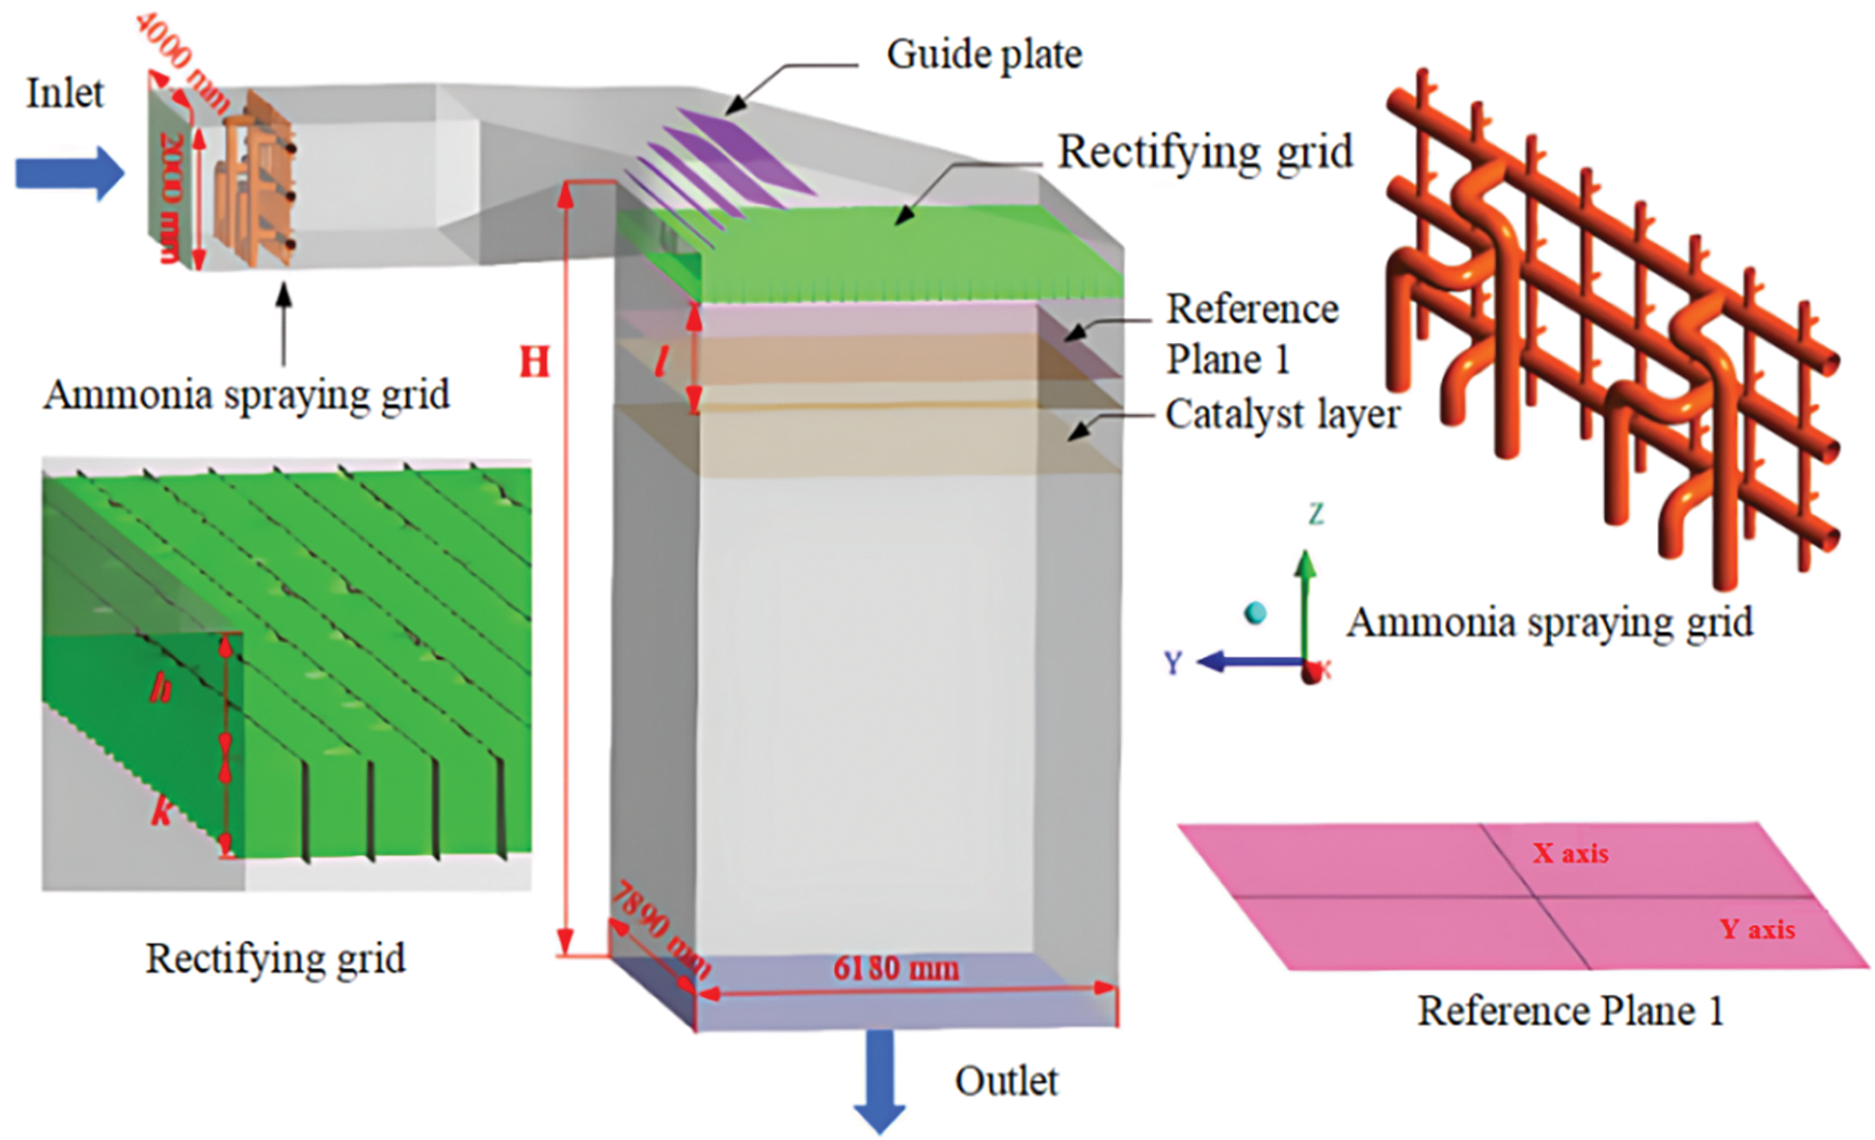
Figure 1: Schematic diagram of the cement kiln SCR reactor structure
In this work, the velocity-inlet and outflow are used as inlet and outlet boundary conditions, the component transport model is used to simulate the component diffusion in flue gas, the volume reaction and laminar flow finite rate model are used to simulate the chemical reaction. In addition, the porous media model is used to simulate the pressure drop of catalyst layer. The finite volume method is used to construct the discrete equation, and SIMPLE pressure-velocity coupling algorithm is used. In order to accelerate the convergence and ensure the accuracy, the first-order upwind scheme is used to obtain the stable solution, and then the second-order upwind scheme is used to continue the iteration until convergence. Additionally, the residual convergence condition is set to be less than 10−3.
The flue gas flow in the SCR reactor of a cement kiln is a three-dimensional turbulent flow with a high Reynolds number, which can readily give rise to rotational flow, flow separation, and secondary reflux in the elbow, ammonia injection grid, rectifier grid and catalyst layer of the reaction system.
This study employs the realizable k-ε turbulence model in the comprehensive optimization simulation of the SCR reactor, as detailed in references [14,18,22–24]. As the simulation of the SCR reactor involves numerous gases, including NO, H2O, NH3, O2, and N2, a component transport model is employed to simulate the flow and distribution of each component, as illustrated in Formula (1):
where, ρ, fluid density, kg/m3; u, fluid velocity, m/s; Yi, the mass fraction of component i; Ji, diffusion flux of component i; Ri, the net rate of component i produced by chemical reaction; Si, the rate produced by adding any user-defined source term to the dispersed phase.
In the simulation, the chemical reaction was considered. Under the action of the V2O5-WO3/TiO2 catalyst, ammonia and nitrogen oxides had a redox reaction. Nitrogen oxides mainly contain NO and NO2, of which NO accounts for about 95% [25,26], so only the following chemical reactions are considered:
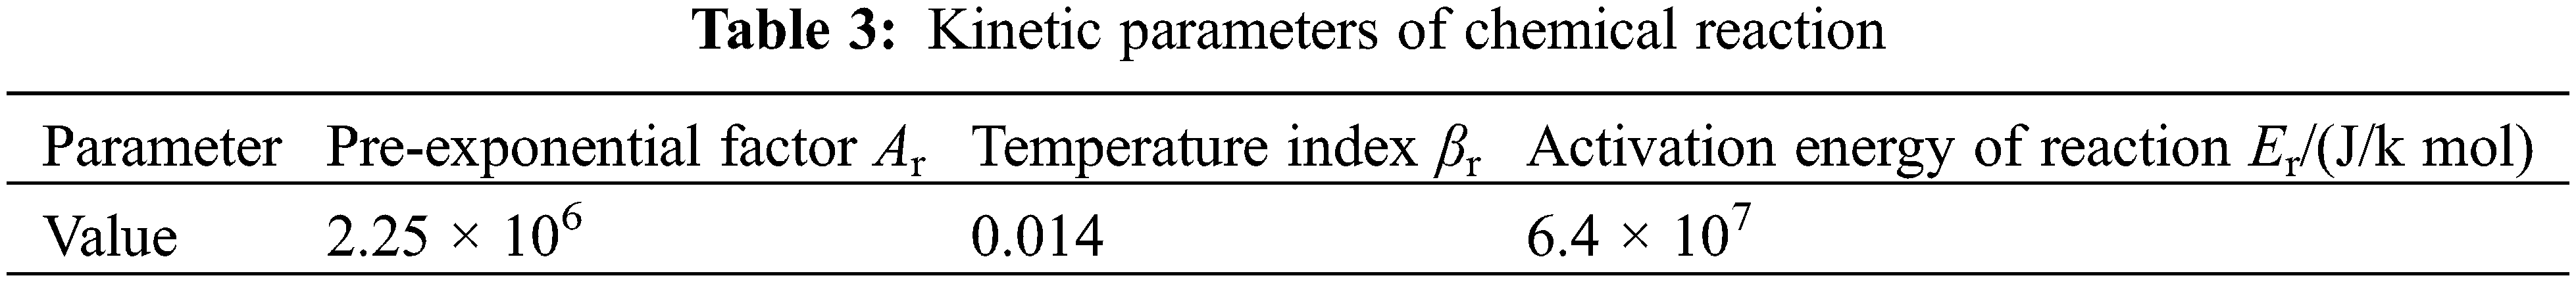
ANSYS Fluent software provides four methods to simulate chemical reactions, i.e., general finite rate chemical reaction, non-premixed combustion, premixed combustion, and partially premixed combustion. Considering the actual situation of the SCR chemical reaction, this study uses a general finite-rate chemical model. The chemical reaction process is calculated by volume reaction and laminar finite rate model [27,28]. Additionally, the reaction is assumed to be irreversible, and the reaction rate constant is calculated by Arrhenius formula:
where, Kf,r is the reaction rate constant, Ar is the pre-exponential factor, R is the universal gas constant of the Arrhenius equation, Er is the reaction activation energy, and J/k mol. The kinetic parameters of the chemical reaction obtained according to reference [29] are shown in Table 3.
In the existing optimization research, the in-homogeneity of the reactor inlet is rarely considered in combination with the actual situation, which is different from the actual situation [14,15,24], so the non-uniform particle distribution is used in this study. The most commonly used particle size distribution equation is the Rosin-Rammler distribution function [30,31], and the expression is Formula (4):
where, F(d) is a distribution function; d, particle size, μm; d50, median diameter, μm.
Additionally, m and d50 in the distribution function are 1.1358 and 5.107 μm, respectively.
2.3 Grid Independence Verification
The grid of the SCR denitrification reaction system is divided by ICEM software. The unstructured grid is employed in the model, with a total of 7.63 million, 5.39 million, and 3.24 million grids, respectively, comprising the fine grid M1, medium grid M2, and coarse grid M3. The accuracy of the calculations is compared, and grid-independent results are obtained. The schematic grid structure of the medium grid M2 is illustrated in Fig. 2.
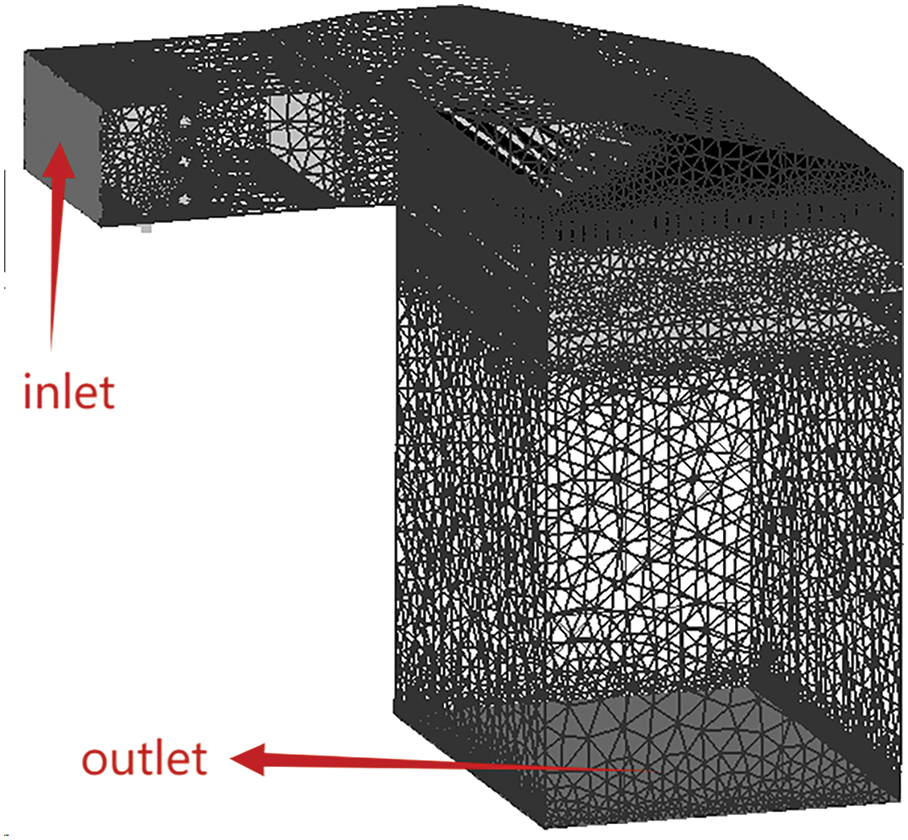
Figure 2: A schematic representation of the grid structure of M2
Fig. 3 illustrates the variation in velocities along the central axis in plane 1 (Fig. 1) under BMCR condition. The results demonstrate that the mean velocity distributions of the M1 and M2 grids are similar, whereas the velocity distribution obtained by the M3 grid is markedly disparate from those of the other grids. Consequently, as the number of grids increases, the impact of grid number on the simulation results diminishes. In particular, when the number of grids exceeds 7.63 million, the simulation results tend to become stable. In light of the aforementioned considerations of the accuracy of the simulation and the associated computational costs, the medium grid (M2) was employed in the CFD simulation.
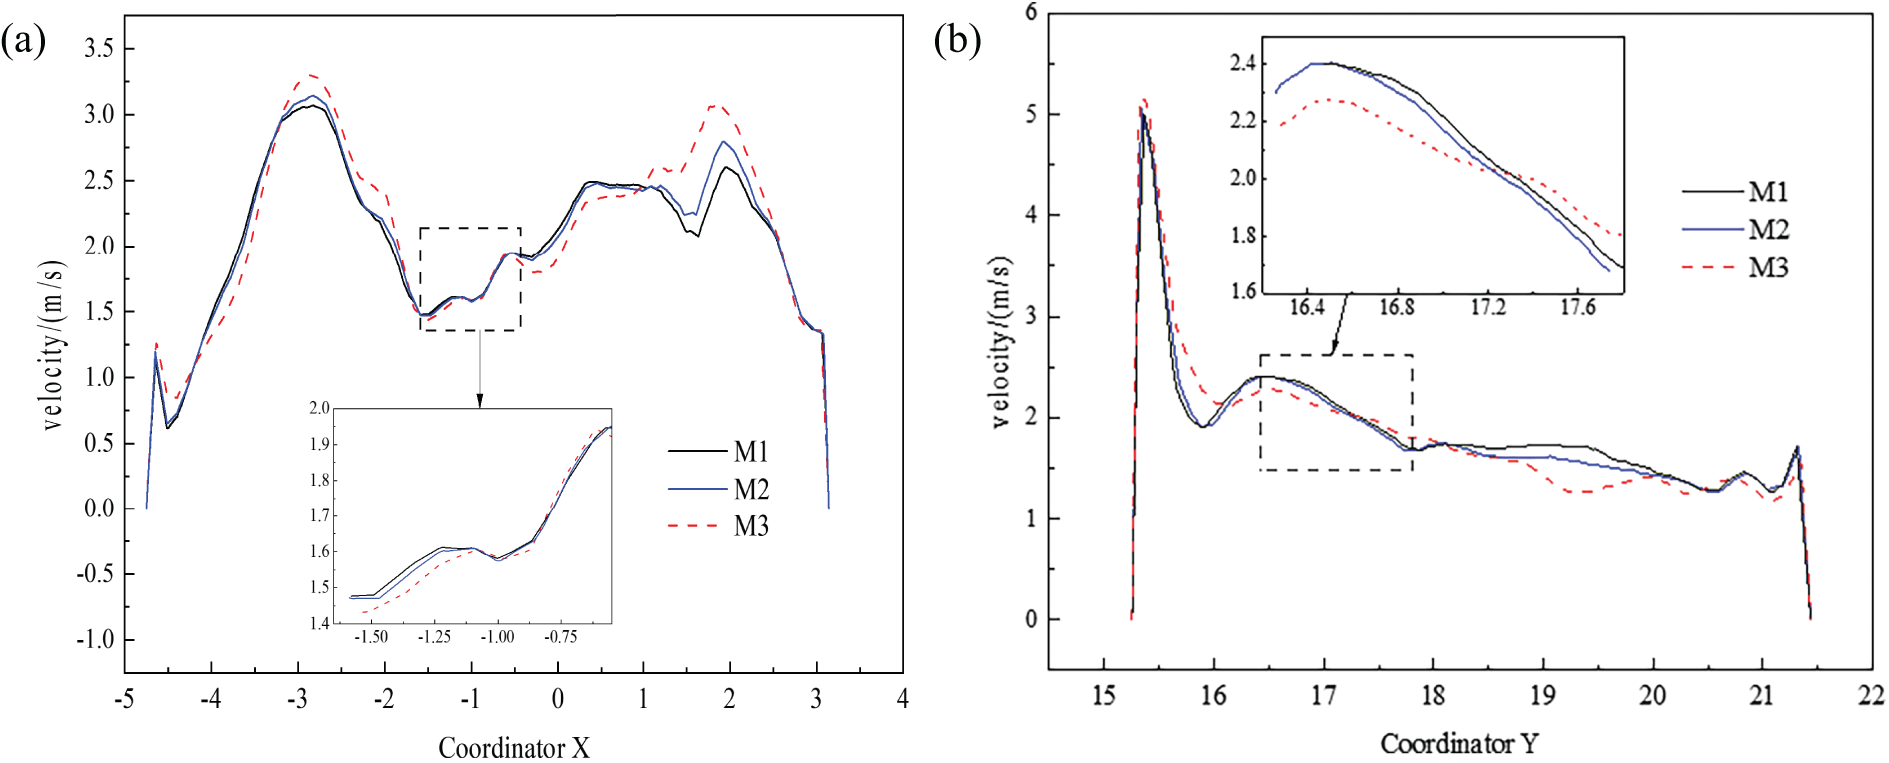
Figure 3: Velocity distributions along the central axis of B MCR under different grid number (a) X axis; (b) Y axis
To achieve reasonable optimization, three geometric parameters are selected as design variables, i.e., the ratio of rectifier grid thickness to the total height of the reactor outlet section (k/H), the ratio of rectifier grid installation height to the total height of the reactor outlet section (h/H) and the ratio of the distance between rectifier grid and the first layer of catalyst to the total height of the reactor outlet section (l/H).
The uniformity of the catalyst inlet gas velocity can be quantified by the relative standard deviation (Cv) of velocity, while the uniformity of the catalyst inlet fly ash can be expressed by the relative standard deviation (CP) of a mass fraction. The following equations represent this relationship:
where, vi, measuring point gas velocity, m/s; n, the number of measuring points (sections) of cross section and measuring section;
To verify the accuracy of the numerical calculation model, Fig. 4 shows the transient, time-average, and actual pressure drop distributions of the SCR denitrification reactor under four different unit loads. It is observed that the transient pressure drop exhibits random fluctuations, indicating that the mixed gas flow within the SCR system of a cement kiln is subject to significant fluctuations. Furthermore, the time-averaged pressure drop is observed to be lower than the experimental value. It is postulated that the discrepancy is attributable to the lack of consideration the impact of internal support structures, catalyst layer sealing elements, and other auxiliary components on the flow field in the numerical simulation. Fig. 5 illustrates the predicted denitrification efficiency and average pressure drop of the system based on numerical simulation and the site data of a SCR denitrification project. It was found that the predicted pressure drop and denitrification efficiency by numerical simulation are in close agreement with the industrial data, with a relative error of 4% to 9%, which is indicative of high accuracy. It is possible to simulate the flow field of an SCR denitrification reactor in a cement kiln using the turbulence model and chemical reaction model mentioned above.
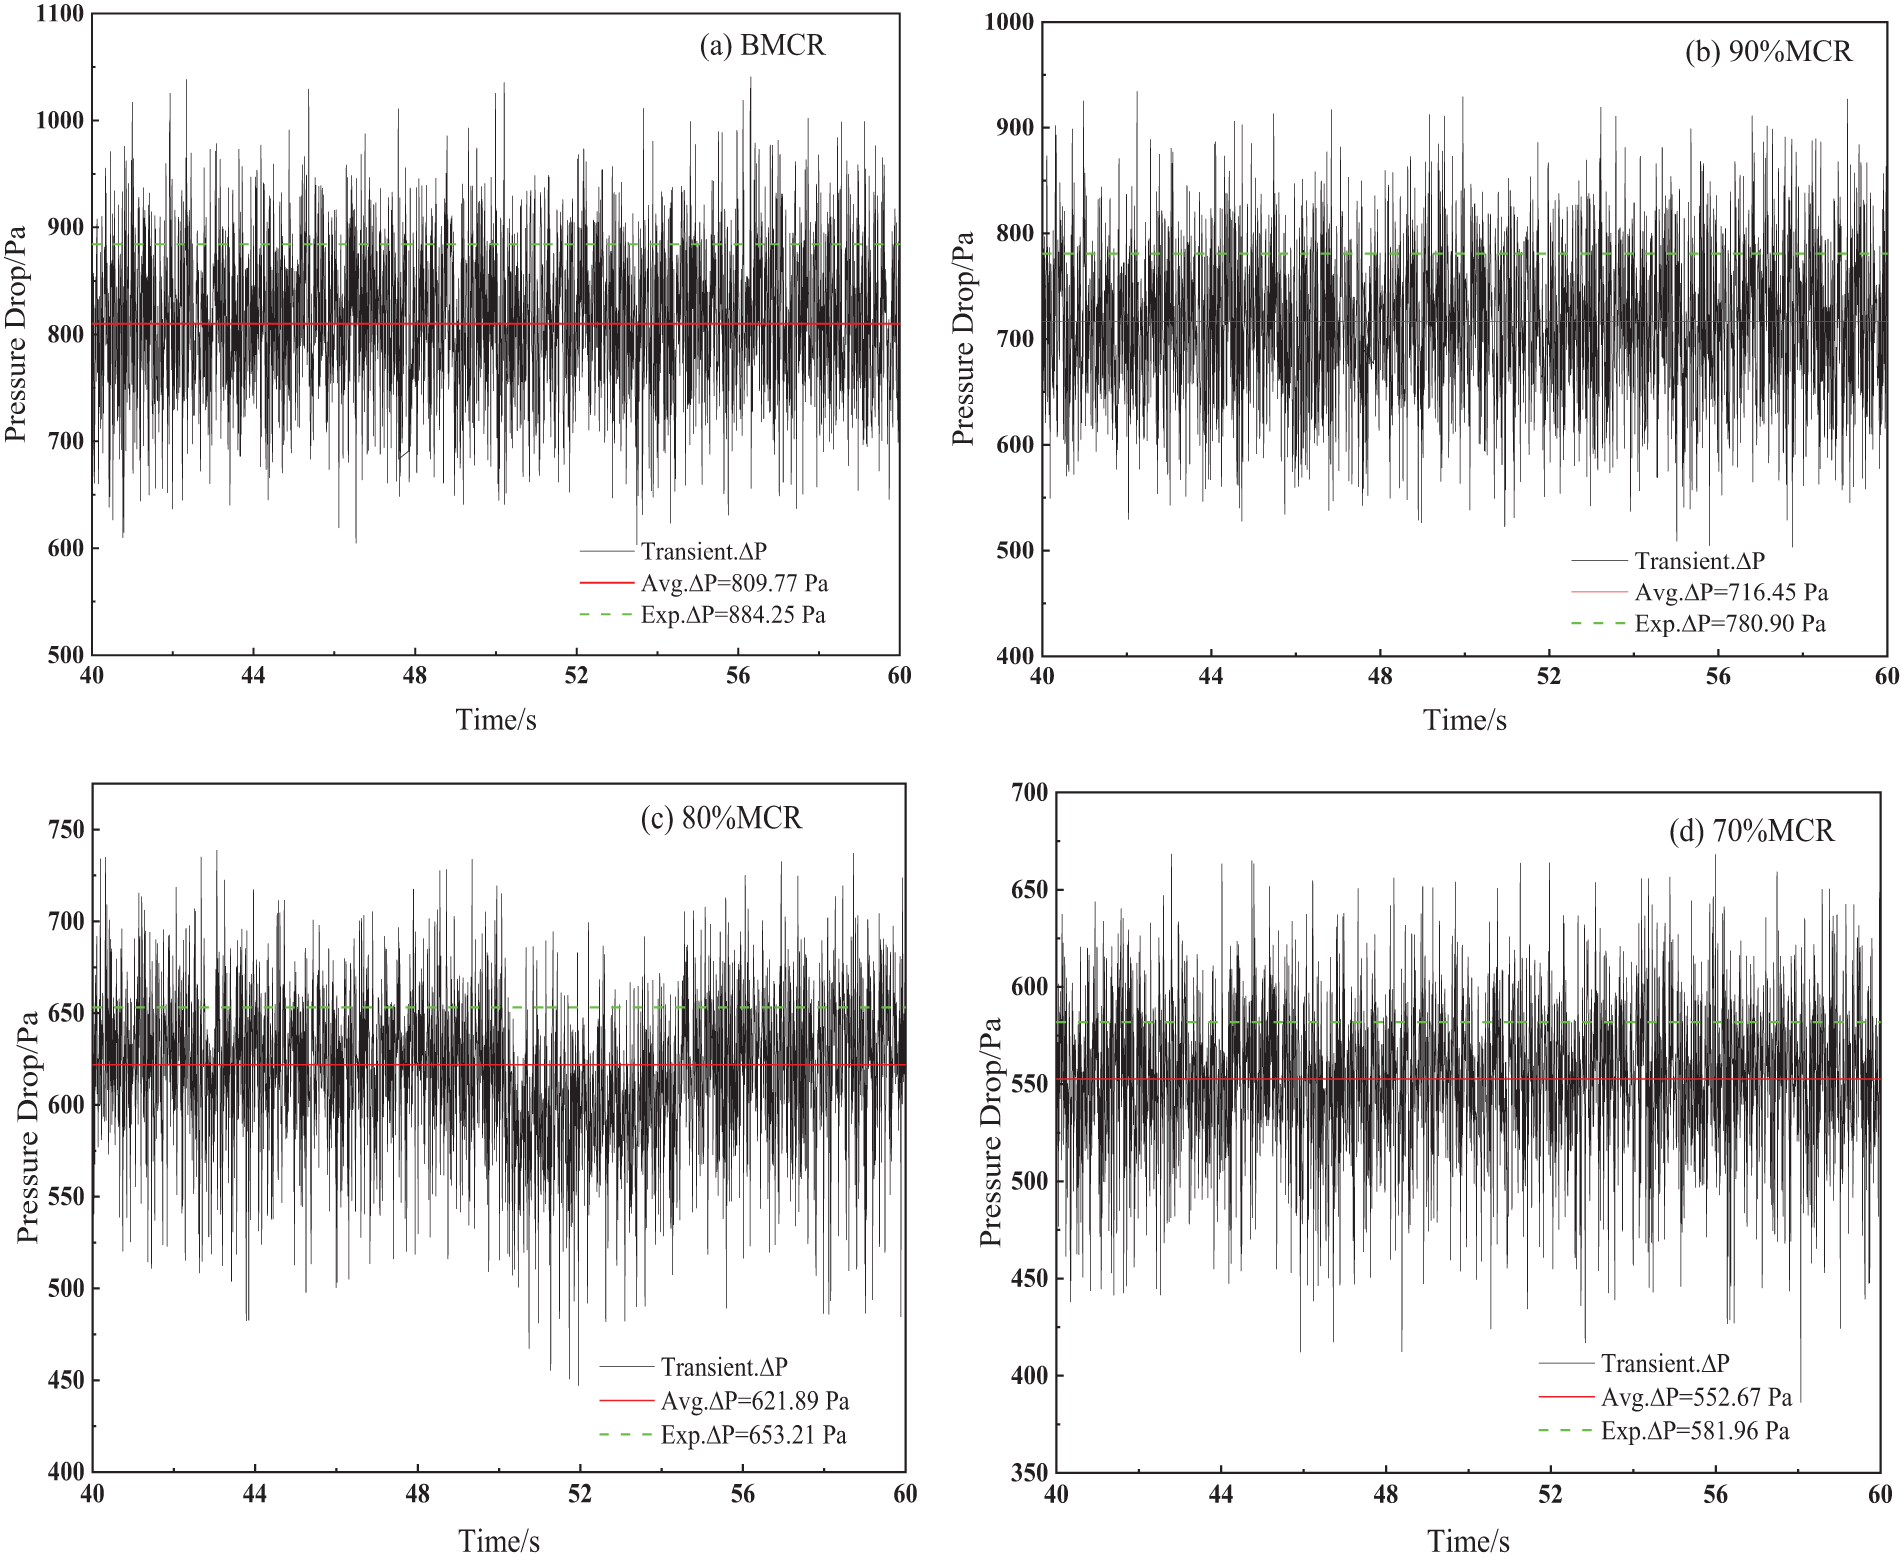
Figure 4: Pressure drop monitoring between inlet and outlet under different loads
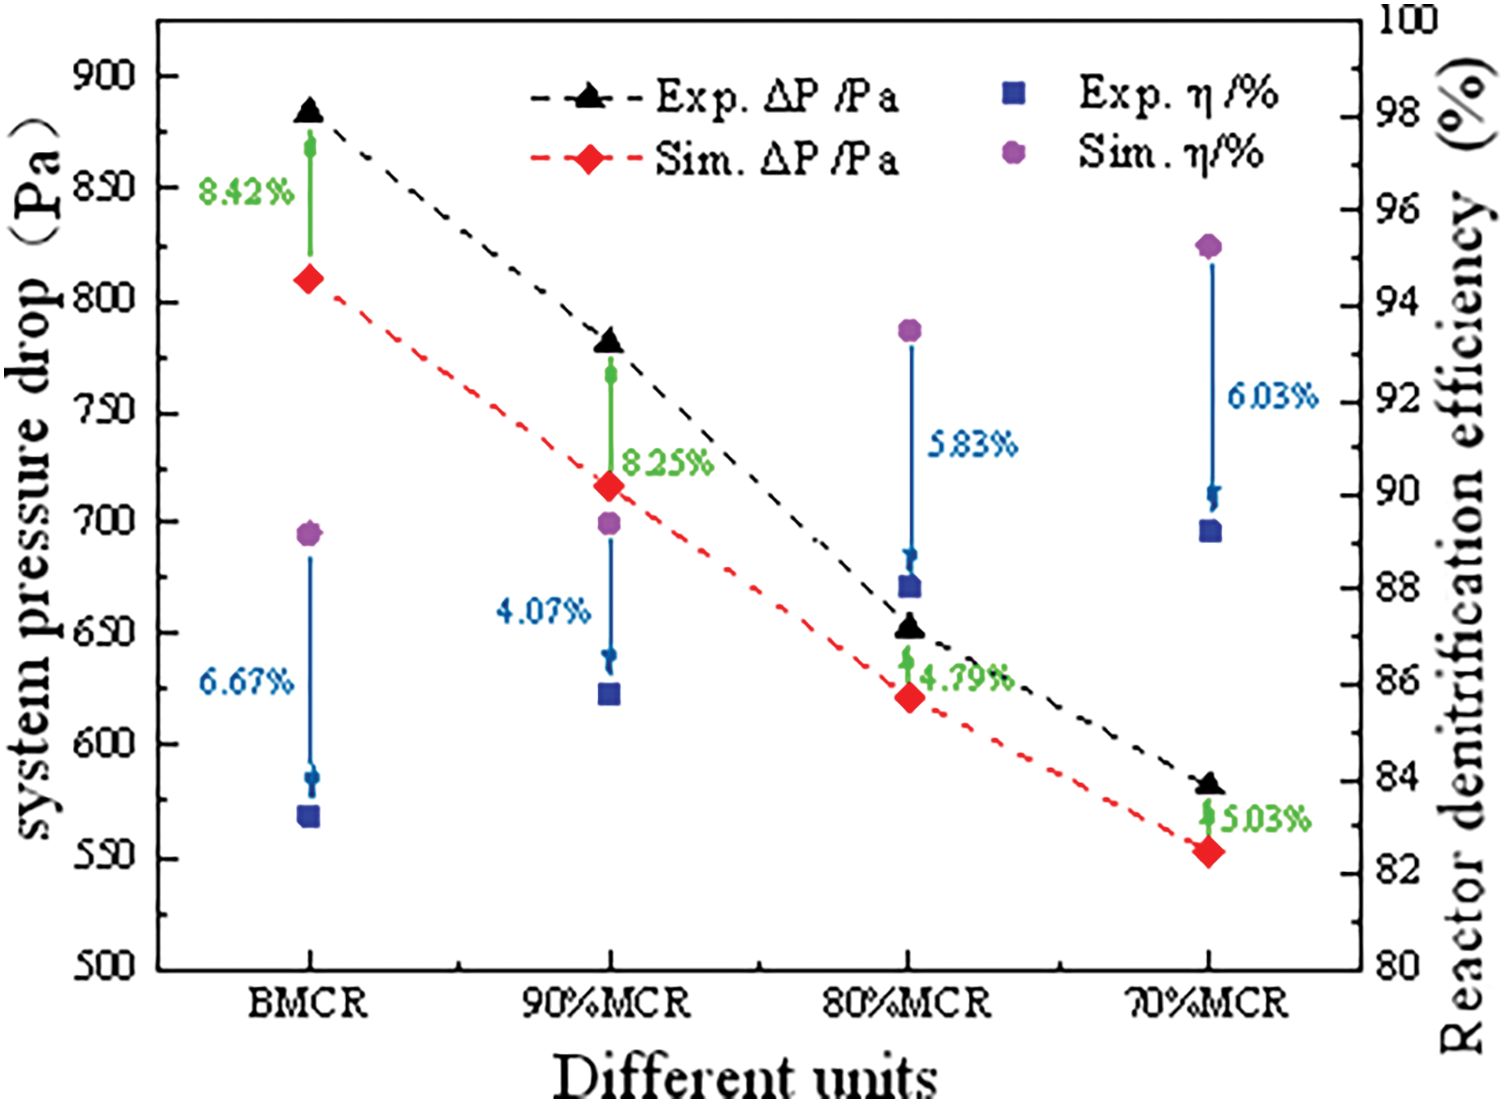
Figure 5: Pressure drop and denitrification efficiency predicted by experimental test and numerical simulation
3.1 Effect of Rectifier Grid Thickness on Denitrification Performance of the Catalyst
To investigate the impact of rectifier grid thickness on the flow field, the distribution of the flow field and the process of denitrification under different unit loads were calculated for six rectifier grid thickness ratios (k/H), i. e., 0.015, 0.020, 0.025, 0.030, 0.035, and 0.040. It is observed that all working conditions meet the pressure drop requirements of the system. Firstly, to eliminate the discrepancy in the simulation results caused by the different monitoring surface positions, this simulation selects four planes 1, 2, 3, and 4 located behind the rectifier grid, which are 1.3, 1.2, 1.1, and 1.0 m away from the catalyst inlet, respectively, for result difference analysis.
Fig. 6 illustrates the correlation between the average velocity incident angle, velocity relative standard deviation, and rectifier grid thickness ratio at the entrance of the first layer catalyst on different monitoring surfaces. Similar trends are observed in the four planes. When k/H is less than 0.030, an increase in thickness leads to a decrease in the average velocity incident angle and the relative standard deviation of velocity. Conversely, when k/H is greater and equal to 0.030, the average velocity incidence angle and relative standard deviation of velocity increase. The reason behind this phenomenon can be attributed to the insufficient thickness of the rectifier grid, which is unable to effectively rectify the flow direction of the mixed airflow and fly ash. As the thickness increases, the gas flow traversing the rectifier grid will keep its original trajectory due to the influence of inertia. This results in a notable rise in the centrifugal inertia force, which consequently generates greater pressure gradient and vortex intensity. However, the influence of the rear catalyst layer results in a change in pressure gradient when k/H is greater than 0.030, which in turn causes fluctuations in the uniformity of the flow field.
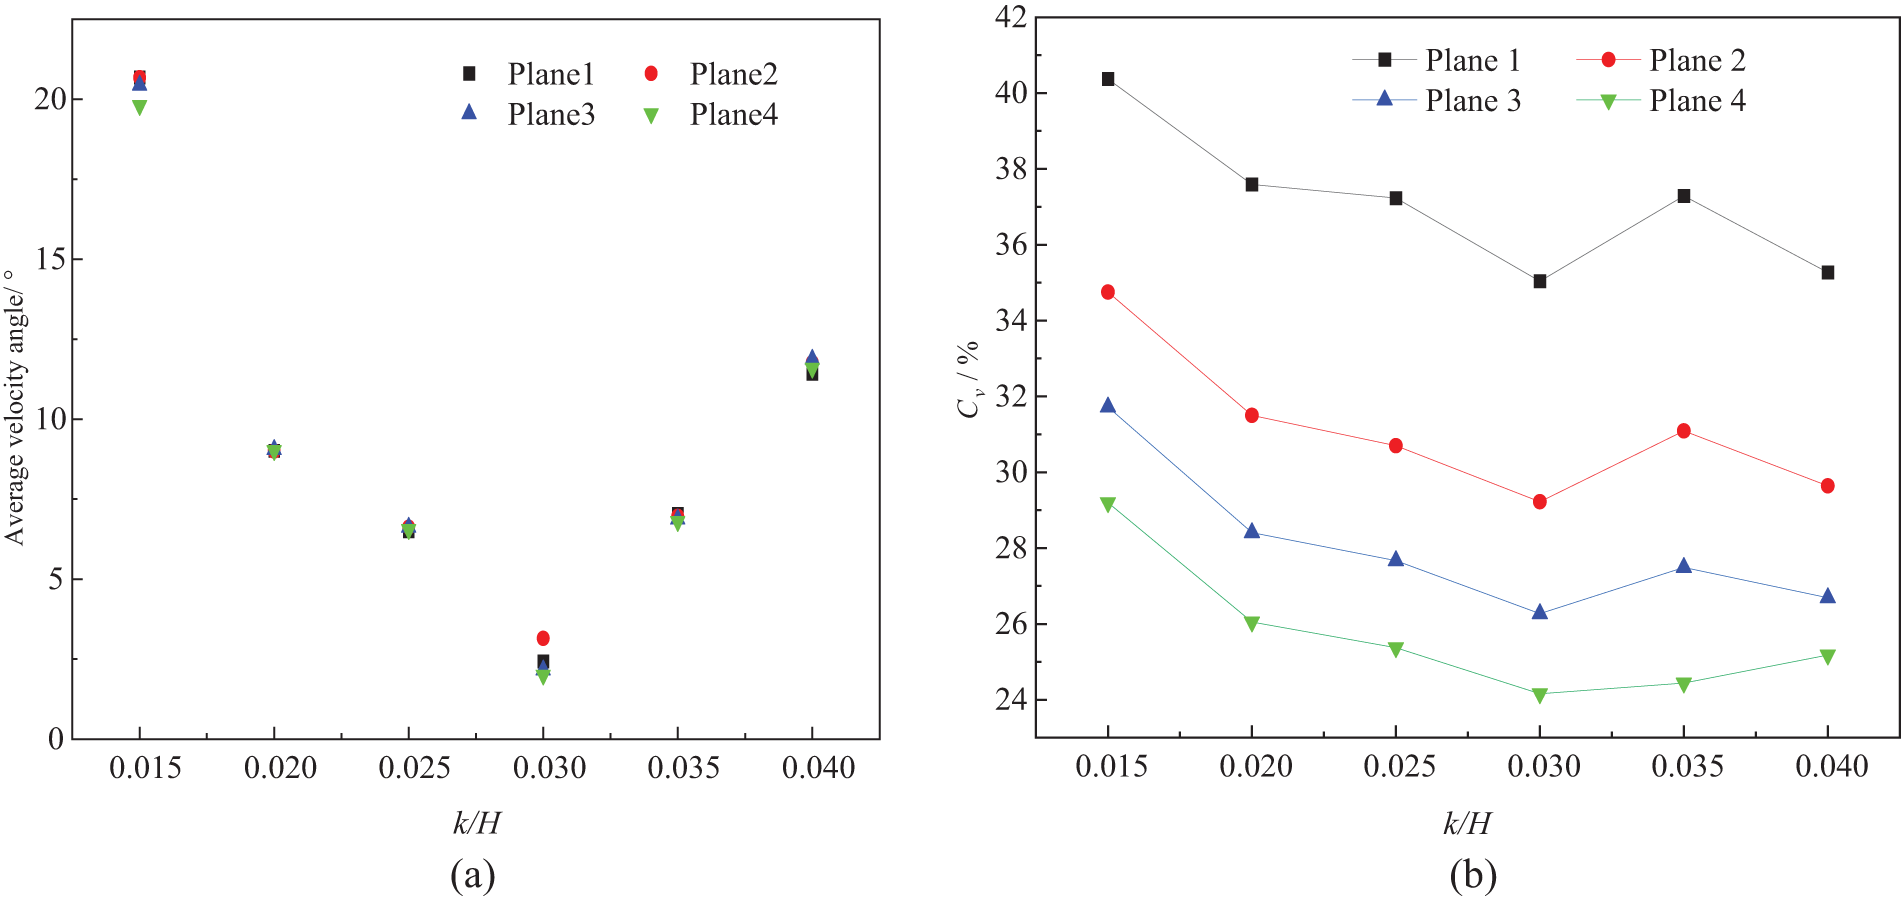
Figure 6: Variation of average velocity incident angle (a) and velocity relative standard deviation (b) with k/H for different monitoring surfaces
The data from the four monitoring surfaces indicates that as the monitoring surfaces move downwards, the average velocity incident angle and the relative standard deviation of velocity decrease slightly at any thickness of the rectifier grid. This suggests that the incident angle from the rectifier grid to the catalyst layer tends to decrease, and the velocity distribution tends to become more uniform. This may be attributed to the non-uniformity of pressure distribution, which will impact the velocity field between the rectifier grid and the catalyst layer.
Fig. 7 illustrates the relative standard deviation of the first layer catalyst inlet velocity under different loads. As k/H increases from 0.015 to 0.040, the relative standard deviation of the inlet velocity under different loads initially decreases and then increases. The minimum value is reached when k/H is equal to 0.030, indicating that the velocity uniformity of the catalyst layer is optimal at this point.
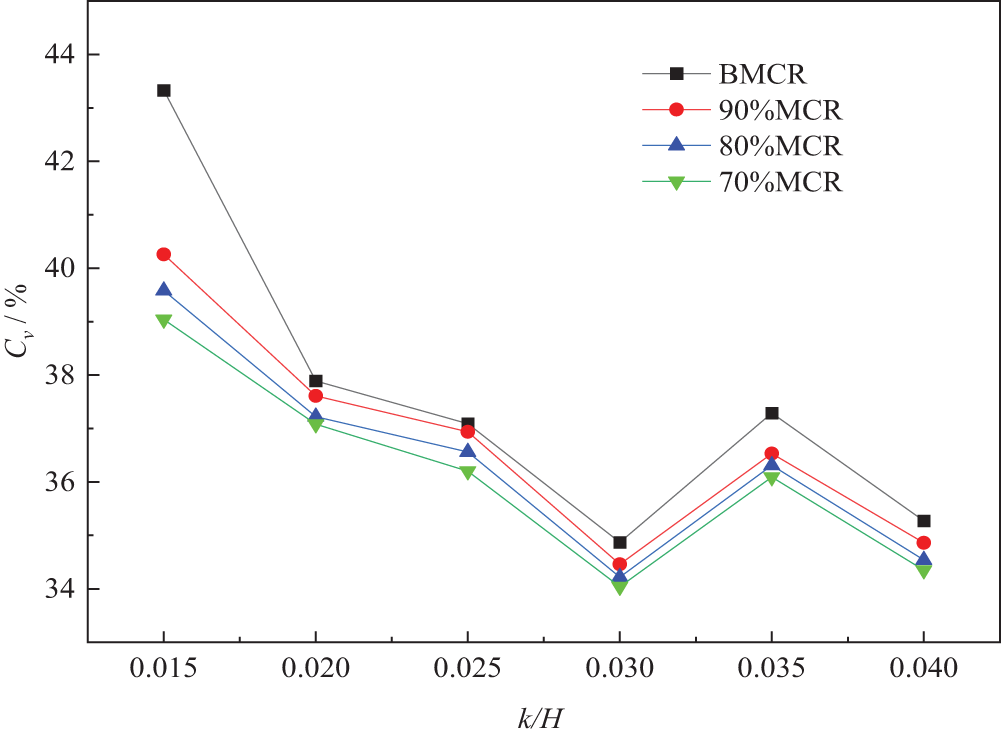
Figure 7: Relative standard deviation of inlet velocity of the first layer catalyst under different loads
Fig. 8 illustrates the streamline diagram at the mid-section of X = 0 m under B MCR. It can be observed that the streamline of the rectifier grid with k/H = 0.030 is more perpendicular to the catalyst layer than that with k/H = 0.015. In the right area, affected by the triangular inclined top wall, the flue gas enters the grid at a small angle. The mixed air flow with fly ash particles generate a clockwise vortex in the limited space continuously, which then merges and dissipates in the rear space of the rectifier grid. This process effectively enhances the mixing of NOx and NH3. Meanwhile, the vortex also consumes a considerable amount of kinetic energy, slowing down the flue gas velocity and playing a protective role for the catalyst layer. The velocity in the left area is relatively low, and the vortex intensity is also lower than that observed in the right area. This is due to the significant influence of the upper deflector on the smoke in the left area. Upon entering the grid at an almost parallel angle, the mixed airflow may initially collide with the grid wall, resulting in the formation of a secondary reflux on the left side. Only when the thickness of the rectifier grid increases, the mixed gas flow has sufficient development distance, and consequently, the flue gas circulation is reduced, the residence time is shortened, and the vortex intensity is reduced.

Figure 8: Streamline diagram of the thickness of each rectifier grid under B MCR (X = 0)
Fig. 9 illustrates the variation in the average incident angle at the inlet of the first layer catalyst under different loads. Furthermore, the results demonstrate that the velocity incident angle tends to be stable when the rectifier grid reaches a specific thickness. However, as the distance between the rectifier grid and the catalyst decreases, the high porosity of the catalyst layer prevents the mixed gas flow from maintaining its original motion trajectory, at this time, the incident angle of the flue gas above the catalyst layer increases, and the flow field uniformity exhibits slight fluctuations. As illustrated in Fig. 10, as the thickness of the rectifier grid increases, the denitrification efficiency of the system shows a gradually increasing trend, and the denitrification efficiency is at its maximum when k/H is equal to 0.030. When k/H is greater and equal to 0.030, and the denitrification efficiency remains stable. At this point, the denitrification efficiency is 90.14%, which is 3.21% higher than the lowest observed efficiency. The aforementioned results demonstrate that the objective of rectifying airflow direction and mixing airflow has been fully achieved when the thickness ratio of the rectifier grid is greater and equal to 0.030. It can thus be concluded that the optimal design parameters for the rectifier grid thickness can be obtained, i e., the thickness ratio of the rectifier grid, k/H should be at least 0.030 in practical engineering to improve the system performance of the cement kiln SCR denitrification reactor.
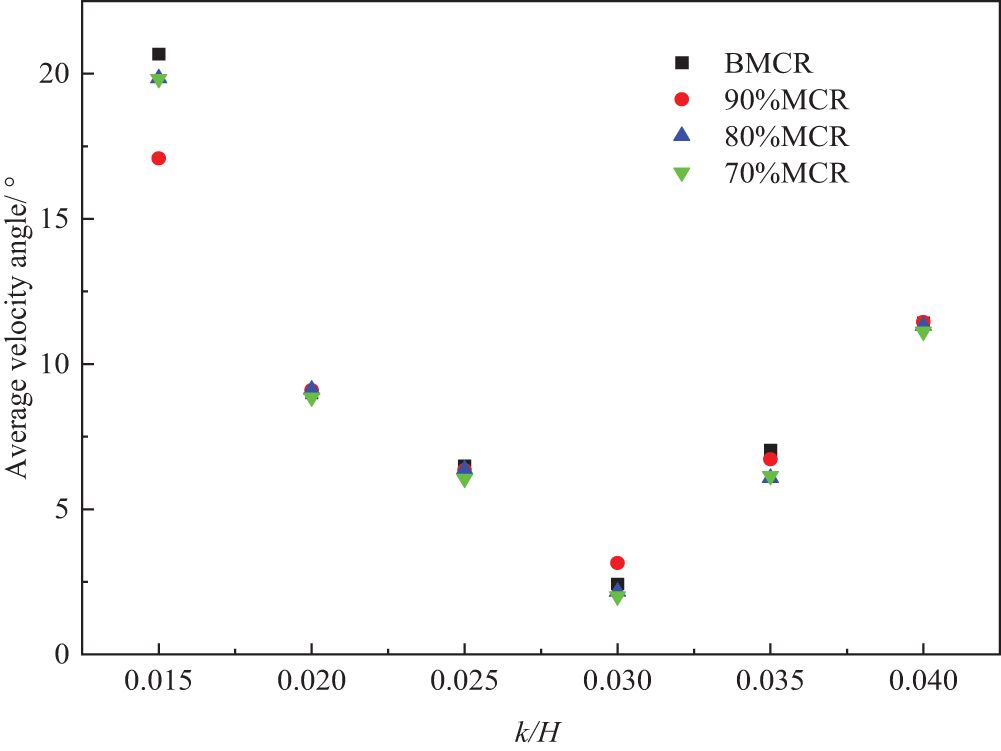
Figure 9: Average incident angle at the entrance of the first layer catalyst under different loads
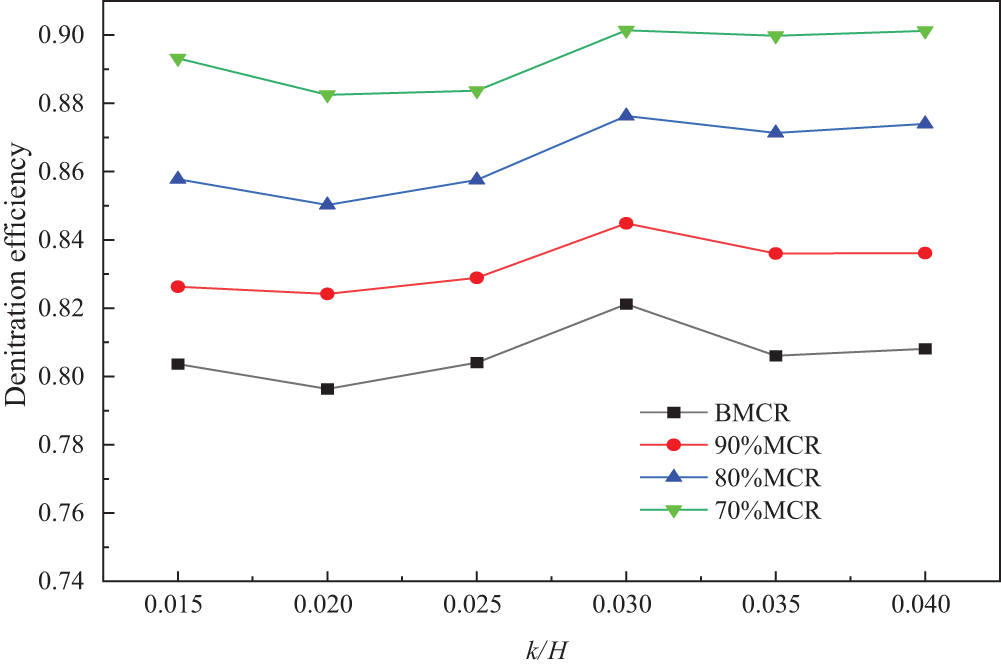
Figure 10: Distribution of denitrification efficiency of reactor under different loads
Fig. 11 shows the relative standard deviation distribution of the fly ash mass fraction at the catalyst inlet of the first layer at different rectifier grid thickness ratios (k/H). As illustrated in this figure, when k/H is equal to 0.030, the lowest relative standard deviations of the fly ash mass fraction at the catalyst inlet of the first layer along the X and Y axes are observed, and their values are 33.91% and 10.47%, respectively, which declines 10% and 0.15%, respectively, compared to the least favorable structure. The results demonstrate that optimizing the thickness of the rectifier grid can reasonably enhance the uniformity of the distribution of fly ash at the catalyst inlet of the first layer. The dispersion effect of fly ash is optimal when k/H is equal to 0.03.
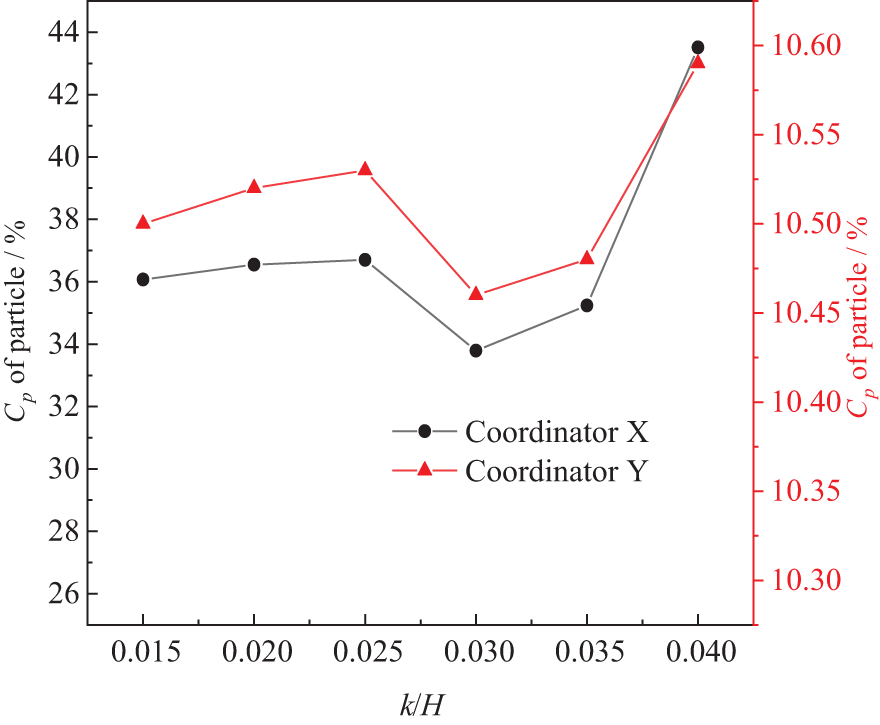
Figure 11: Relative standard deviation of fly ash mass fraction at the inlet of the first layer catalyst at different k/H
3.2 Influence of Installation Position of Rectifier Grid on Denitrification Performance of the Catalyst
Take the position of the rectifier grid that is flush with the lower edge of the catalyst inlet as the reference plane position, and when the position of the rectifier grid moves downwards, h increases, which can be referred to Fig. 1. Meanwhile, the value of h/H is set at 0.02, 0.03, 0.04, 0.05, 0.06, and 0.07, respectively, and the distribution of the flow field and the process of denitrification are studied under different unit loads. The simulation results are presented in Fig. 12.
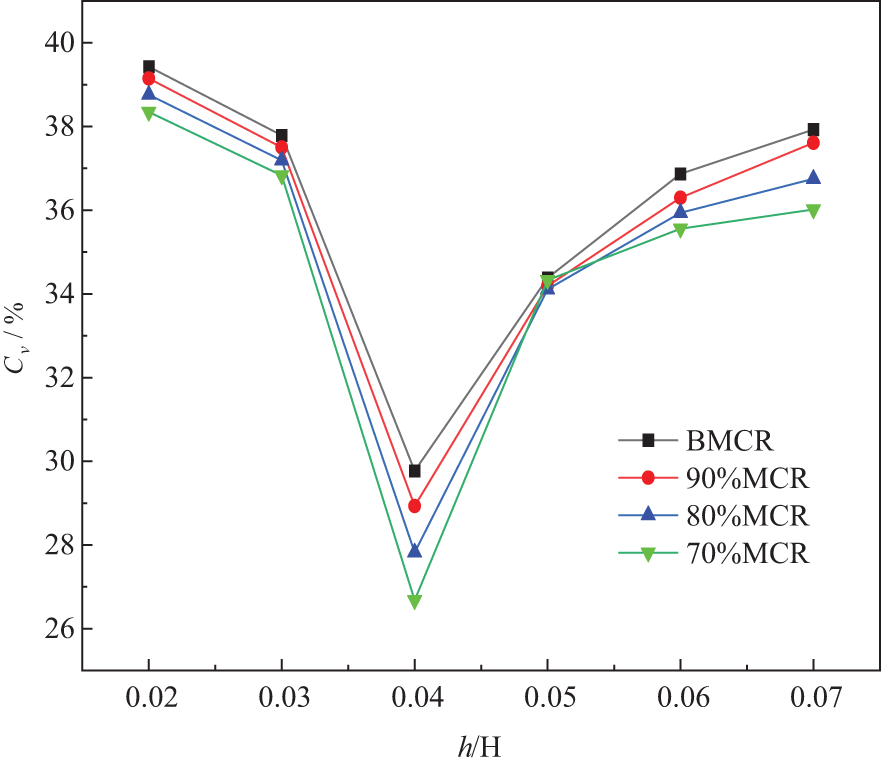
Figure 12: Relative standard deviation of inlet velocity of the first layer catalyst under different loads
Fig. 12 shows that an increase in the installation position h/H of the rectifier grid from 0.02 to 0.07 results in a decrease and subsequent increase in the relative standard deviation of the velocity at the inlet of the first layer catalyst under different loads. The minimum value is observed at h/H = 0.04, indicating that the velocity uniformity is optimal at this installation position. Combined with Fig. 13, the flow field distribution cloud diagrams of the installation height of each rectifier grid under full load conditions of the unit, the reason can be attributed to the fact that when the flue gas flows into the catalyst layer from the inlet, it will pass through a 90° pipeline transition, and when the position of the rectifier grid is close to the bend, the inner gas velocity of the pipeline is relatively low, while the outer gas velocity is considerably higher. Additionally, the incident angle of the incoming flow direction is large. The rectifier grid is unable to facilitate the uniform distribution of the flue gas, which leads to a decrease in velocity uniformity and the formation of a more pronounced reflux phenomenon. Under the influence of high-speed airflow, all secondary reflux rotate in the opposite direction, as shown in Fig. 13a,b, and the flow field at this location is not conducive to the mixing of flue gas and ammonia. As the distance between the rectifier grid and the mixed airflow increases, the rectifying grid enhances the guiding effect of the mixed airflow, which is equivalent to a certain “buffering effect” on the mixed airflow, thus, the secondary reflux is avoided. Nevertheless, with the continued descent of the rectifying grid, a minor vortex is gradually established within the pipeline, as illustrated in Fig. 13c–f. The rectifying grid is positioned too low, which prevents the airflow from being modified promptly. Due to the effects of inertia, the low-speed airflow within the grid experiences a reversal in direction, resulting in the formation of a vortex. This shows that the velocity distribution is most uniform when the optimal grid height ratio (h/H) is equal to 0.04.
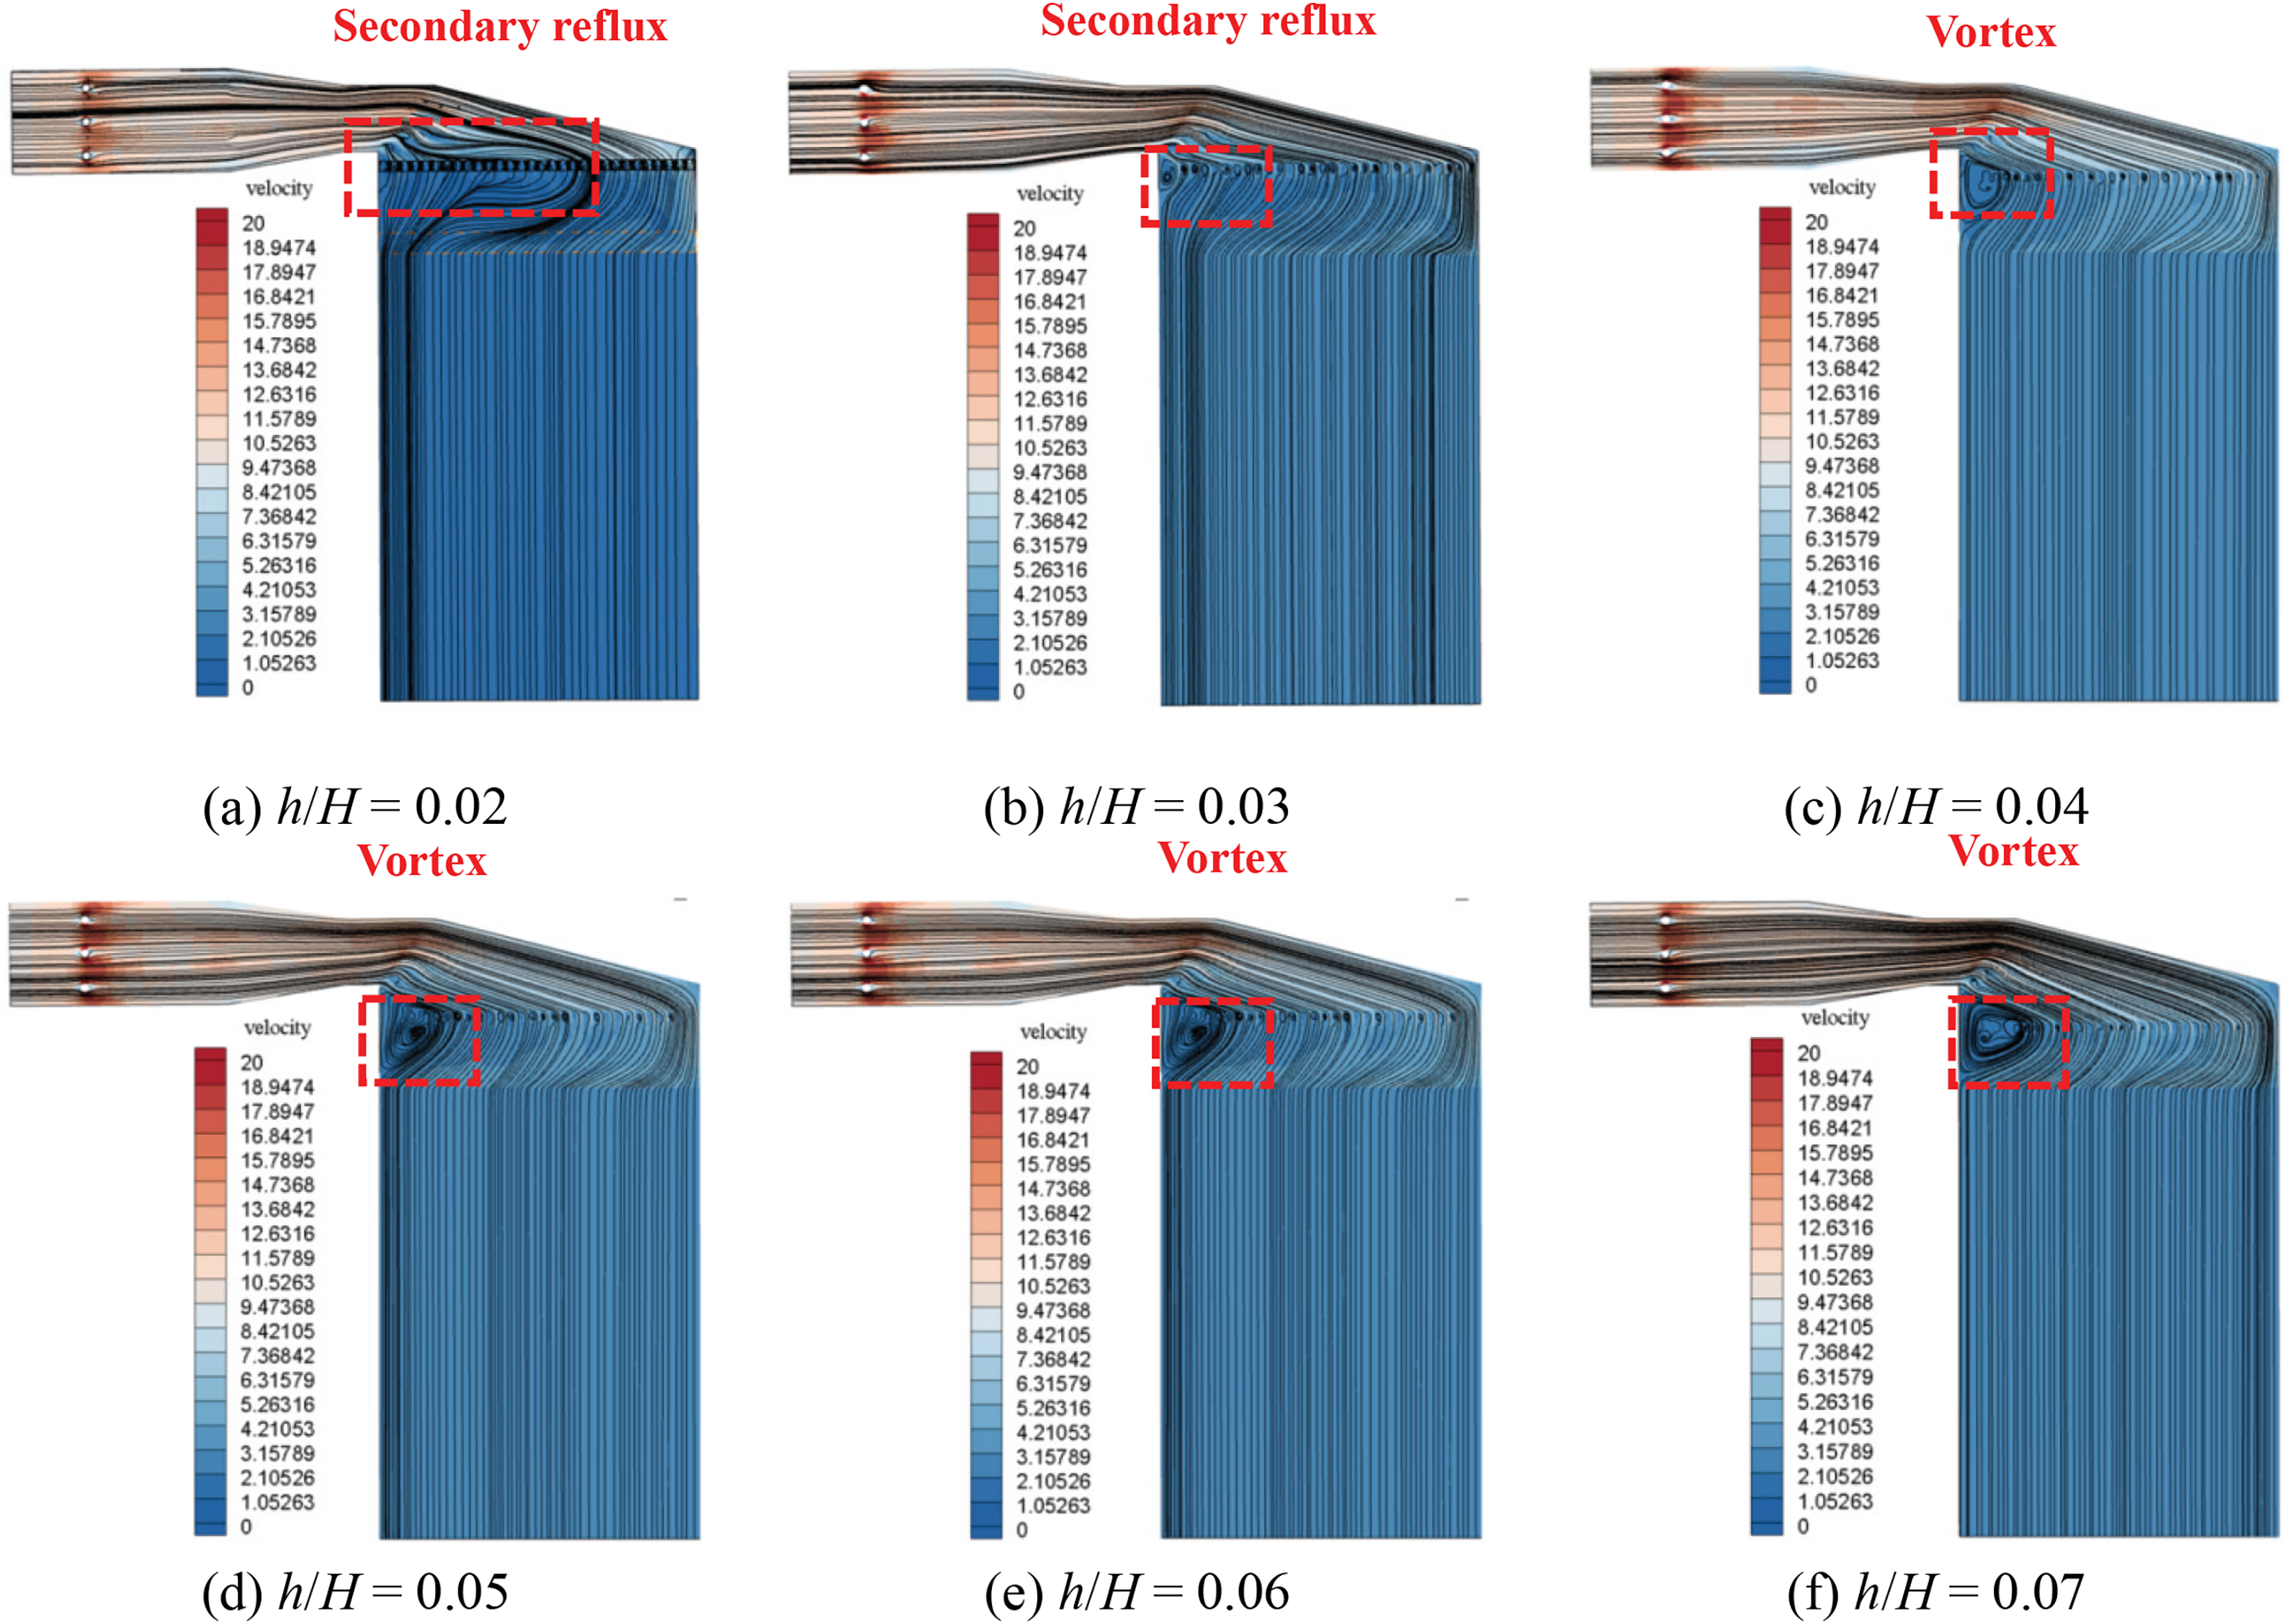
Figure 13: Streamline diagram of installation height of each rectifier grid under BMCR (X = 0)
The simulation results of the average incident angle of fly ash particles at the inlet of the first layer catalyst under different unit loads are shown in Fig. 14. It can be observed that the fluctuations in unit load have a negligible impact on the movement direction of fly ash particles, which can be disregarded. As the installation height of the rectifier grid is decreased (h/H increases), the average incident angle of fly ash particles at the inlet of the first layer catalyst first sharply decreases and then slowly increases. The minimum value is approximately 2° when h/H is equal to 0.04. At this time, the angle has the least impact on the erosion and wear of the catalyst.
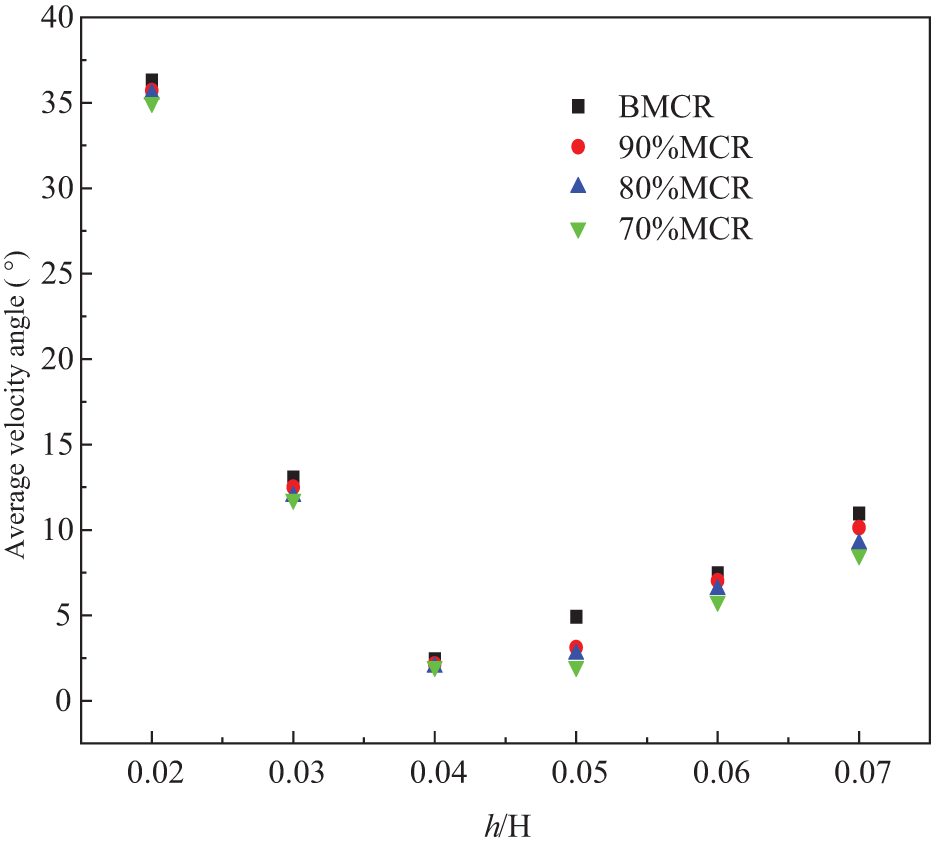
Figure 14: Average incident angle of fly ash particles at the inlet of the first layer catalyst under different loads
Fig. 15 illustrates the distribution of denitrification efficiency at different loads. When the unit load is reduced to 70%, the velocity and kinetic energy of the mixed gas will decrease, its residence time in the reactor and denitrification efficiency increases. A reduction in the installation height of the rectifier grid (an increase in the h/H ratio) initially results in an enhancement in denitrification efficiency, followed by a subsequent decline. Similarly, the denitrification efficiency is observed to reach its maximum value when h/H is equal to 0.04. Therefore, the SCR denitrification reactor in a cement kiln can achieve the optimal denitrification effect when the installation height ratio of the rectifier grid, h/H is equal to 0.04.
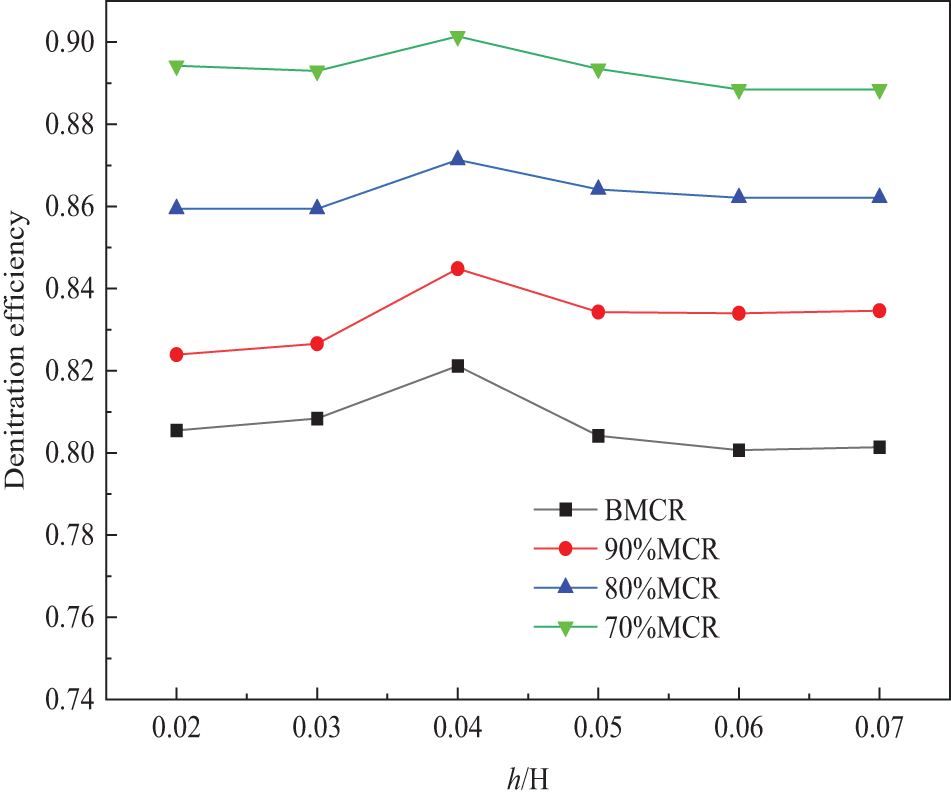
Figure 15: Distribution of denitrification efficiency of reactor under different loads
Fig. 16 illustrates the distribution of the relative standard deviation of the fly ash mass fraction with different installation height ratios of rectifier grids at the catalyst inlet of the first layer. As illustrated in Fig. 16, when h/H is equal to 0.04, the lowest relative standard deviations of the fly ash mass fraction at the catalyst inlet of the first layer along the X and Y axes are observed, and their values are 26.82% and 10.49%, respectively. And compared with the least favorable structure, the relative standard deviations are reduced by 12% and 0.2%, respectively. The results demonstrate that by optimizing the installation position of the rectifier grid, the fly ash distribution uniformity at the first layer catalyst inlet can be effectively improved. The optimal dispersion effect of fly ash can be achieved when the installation height ratio of the rectifier grid, h/H is equal to 0.04.
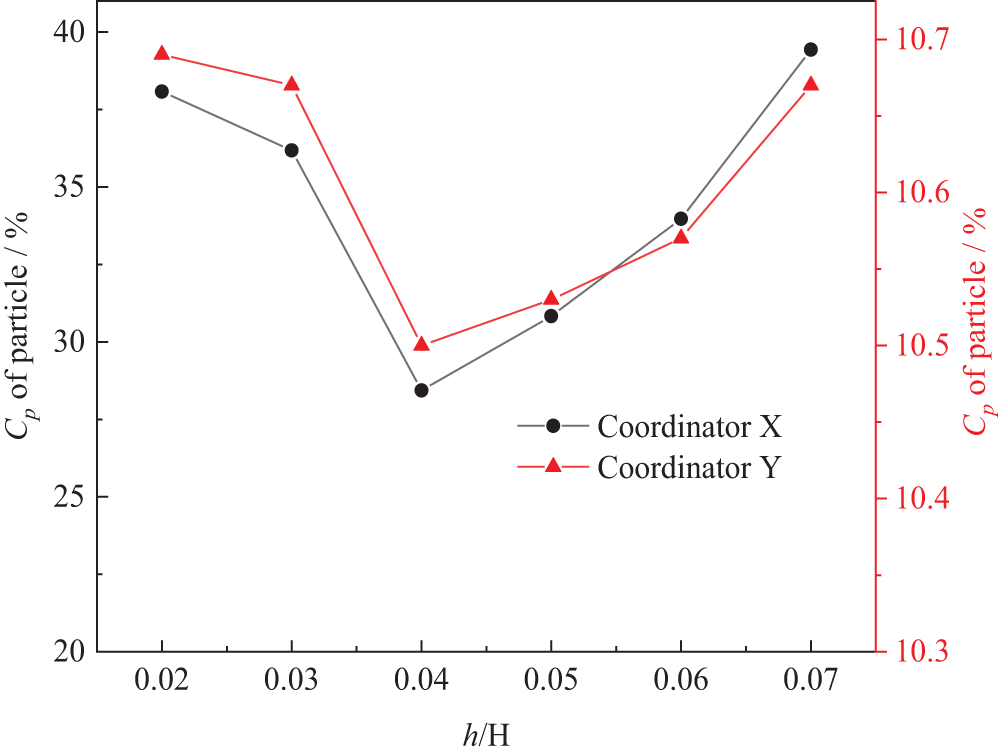
Figure 16: Relative standard deviation of fly ash mass fraction at inlet of the first layer catalyst with different h/H
3.3 Effect of the Distance between the Rectifier Grid and the First Layer of Catalyst on the Denitrification Performance of the Catalyst
To study the effect of the distance between the rectifier grid and the first layer of the catalyst (l) on the catalyst denitrification efficiency, the distribution of the flow field and the process of denitrification are examined under different unit loads for six structural parameters, namely, l/H is 0.09, 0.10, 0.11, 0.12, 0.13, and 0.14, respectively. It is found that all working conditions complied with the pressure drop requirements of the system.
As illustrated in Fig. 17, when l/H expands from 0.09 to 0.14, which shows that the distance between the rectifier grid and the first layer of catalyst gradually increases. Under different loads, the velocity at the inlet of the first layer catalyst decreases first and then increases relative to the standard deviation.The minimum velocity non-uniformity coefficient values are obtained at l/H = 0.10. As the unit load is reduced, the velocity non-uniformity coefficient decreases, but the degree of reduction is not significant.The results demonstrate that the velocity uniformity at the catalyst inlet is optimal when l/H is equal to 0.10. Furthermore, the load fluctuation of the unit has a negligible impact on the velocity distribution. The mixed flue gas entertains fly ash particles to generate a vortex in the confined space of the rectifier grid, and after merging and dissipating in its rear space, it flows into the catalyst layer. The distribution of the flow field in the rear space and the upper space above the rectifier grid is markedly different, as illustrated in Fig. 18. Consequently, the substantial porosity of the rear catalyst layer exerts a “blocking” effect on the airflow. Therefore, there is a certain range of fluctuation in the average incident angle of particles in this space.

Figure 17: Relative standard deviation of inlet velocity of the first layer catalyst under different loads
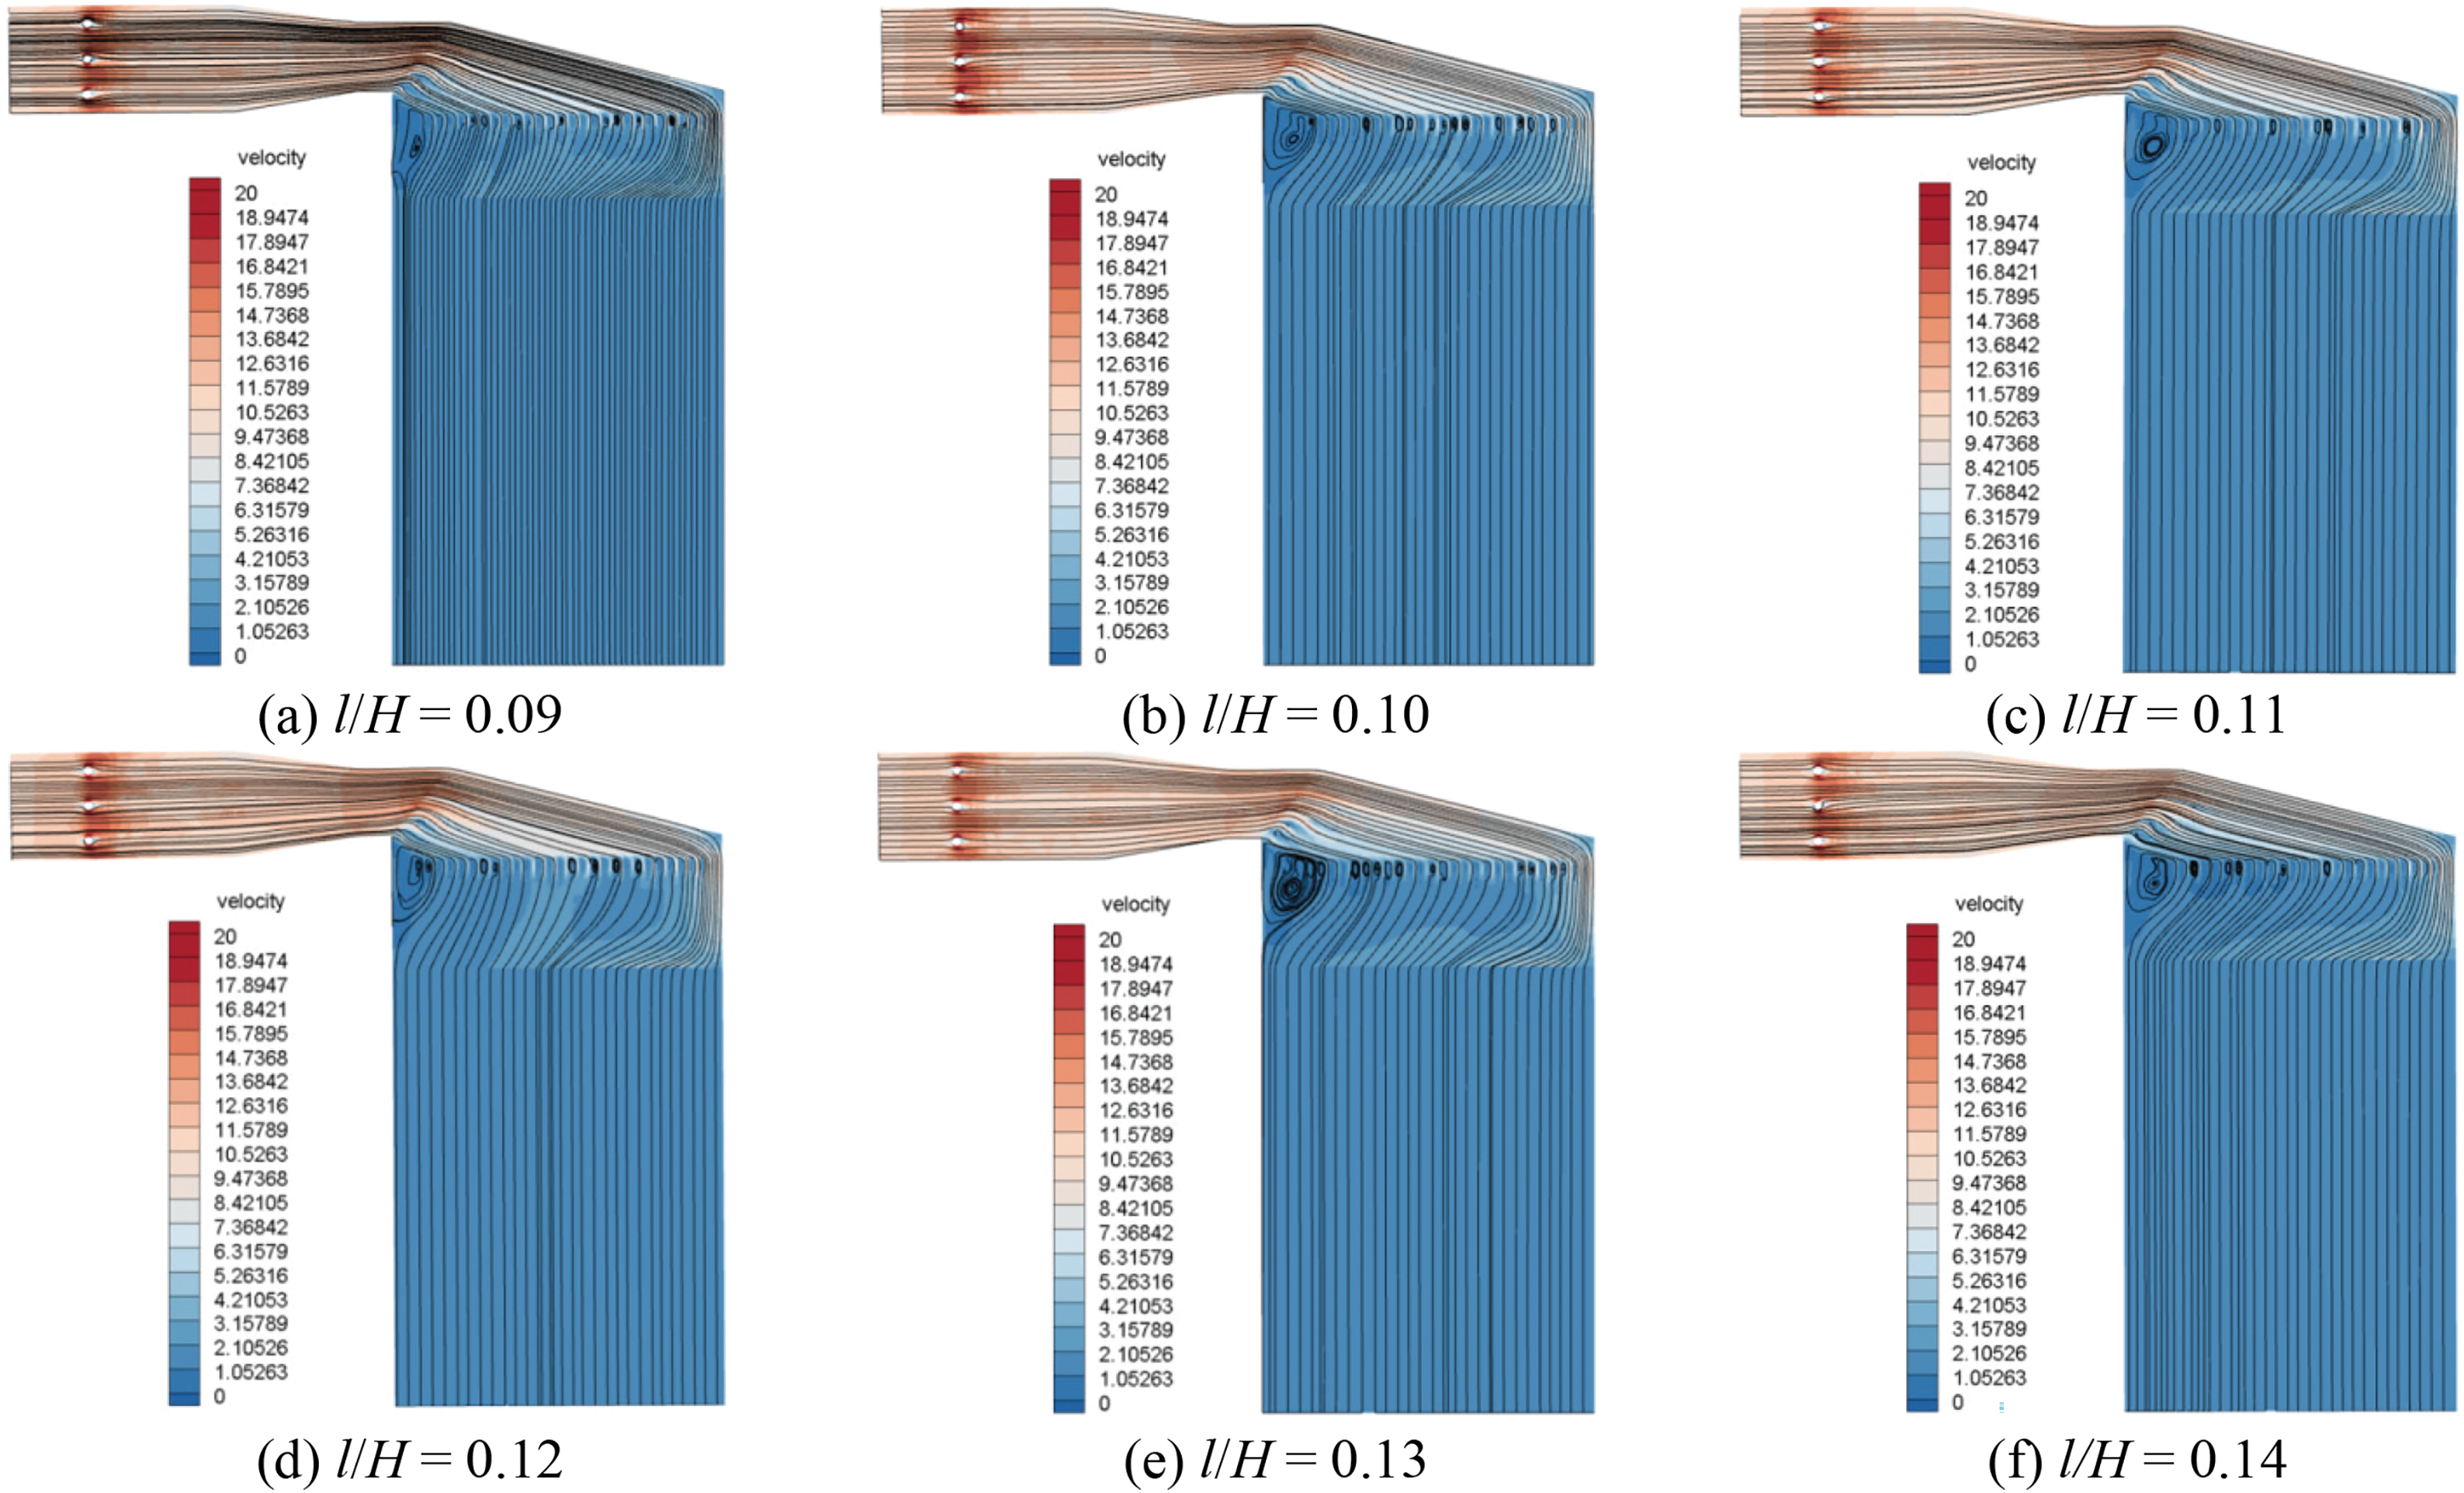
Figure 18: Streamline diagram (X = 0) at different l/H under B MCR
As illustrated in Fig. 19, as the l/H increases, the average incident angle of the particles demonstrates a tendency to decrease and then increase. The smallest average incident angle of the particles is observed when l/H is equal to 0.010. As the unit load is decreased, the kinetic energy of particles is observed to decrease, resulting in a corresponding decrease in the average incident angle of particles. However, the degree of reduction can be considered to be insignificant.

Figure 19: Average incident angle of particles at the inlet of the first layer catalyst under different loads
Fig. 20 shows the variation in denitrification efficiency under different loads. Due to changes in the flow field uniformity and average incident angle, as l/H increases, denitrification efficiency initially increases. The results demonstrate that l/H exerts a certain impact on the flow field distribution within the central region. The optimal system performance of the SCR denitrification reactor in a cement kiln is observed when the optimal spacing ratio, l/H is equal to 0.010.
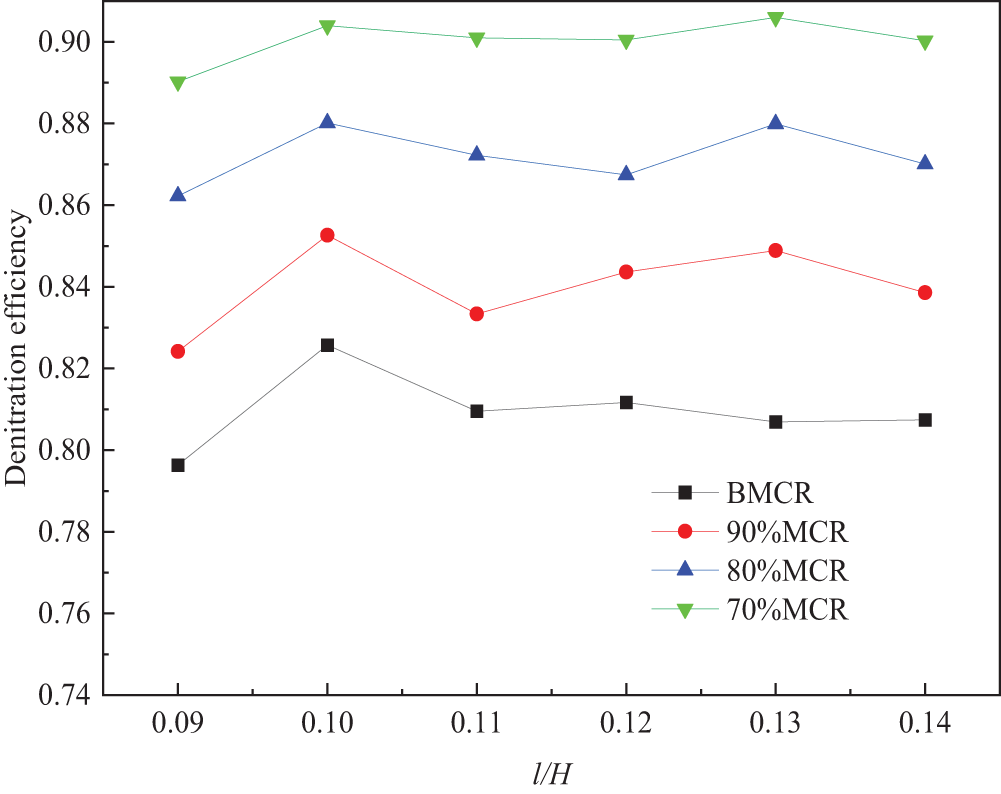
Figure 20: Distribution of denitrification efficiency of reactor under different loads
Fig. 21 shows the distribution of the relative standard deviation of the fly ash mass fraction with different l/H at the catalyst inlet of the first layer. As illustrated in Fig. 21, when l/H is equal to 0.1, the lowest relative standard deviations of the fly ash mass fraction at the catalyst inlet of the first layer along the X and Y axes are observed, and their values are 34.5% and 10.34%, respectively, which reduced by approximately 8% and 0.4%, compared to the least favorable structure. The results demonstrate that optimizing l/H can reasonably enhance the uniformity of fly ash distribution on the inlet surface of the first layer of the catalyst. The dispersion effect of fly ash is optimal when the spacing ratio, l/H is equal to 0.1.

Figure 21: Relative standard deviation of fly ash mass fraction at the inlet of the first layer catalyst at different l/H
This study simulates the overall SCR denitrification reaction system of cement kilns and investigates the effect of the ratio of rectifier grid thickness to the total height of the reactor outlet section (k/H), the ratio of rectifier grid installation height to the total height of the reactor outlet section (h/H), and the ratio of the distance between rectifier grid and the first layer of catalyst to the total height of the reactor outlet section (l/H) on the denitration efficiency. The specific conclusion is as follows:
(1) When the thickness ratio of the rectifier grid, k/H is greater and equal to 0.030, which can completely achieve the purposes of rectifying the airflow direction and mixing airflow, and the optimal value of the gas velocity relative standard deviation under different unit loads is 34.32%, which is 19.52% lower than that of the least favorable structure; The highest denitrification efficiency is 90.14%, which is 3.21% higher than the least favorable condition. The relative standard deviation of fly ash distribution at the inlet of the first layer catalyst is 33.91%, which is 10% lower than the least favorable condition.
(2) When the grid height ratio, h/H is equal to 0.04, and the optimal value of the gas velocity relative standard deviation of under different unit loads is 26.59%, which is 30.43% lower than that of the least favorable structure; The highest denitrification efficiency is 90.15%, which is 3.43% higher than the least favorable condition. The relative standard deviation of fly ash distribution at the inlet of the first layer catalyst is 26.82%, which is 12% lower than the least favorable condition.
(3) When the distance between the rectifier grid and the first layer of the catalyst, l/H is equal to 0.10, the optimal value of the gas velocity uniformity of the catalyst inlet can be achieved, and the gas velocity relative standard deviation under different unit loads is 29.85%, which is 12.86% lower than that of the least favorable structure; The highest denitrification efficiency is 90.60%, which is 3.27% higher than the least favorable condition. The relative standard deviation of fly ash distribution at the inlet of the first layer catalyst is 34.5%, which is 8% lower than the least favorable condition.
Acknowledgement: None.
Funding Statement: Anhui Province Key Research and Development Plan of the Ecological Environment Project (No. 202104i07020016).
Author Contributions: The authors confirm contribution to the paper as follows: Study conception and design: Liang Ai; software: Mingyue Li, Lumin Chen; data collection: Yihua Gao; analysis and interpretation of results: Yi Sun; draft manuscript preparation: Yue Wu, Fuping Qian, Jinli Lu, Naijin Huang. All authors reviewed the results and approved the final version of the manuscript.
Availability of Data and Materials: The data that support the findings of this study are available from the corresponding author, Fuping Qian, upon reasonable request.
Ethics Approval: Not applicable.
Conflicts of Interest: The authors declare no conflicts of interest to report regarding the present study.
References
1. Barbhuiya S, Kanavaris F, Das BB, Idrees M. Decarbonizing cement and concrete production: strategies, challenges and pathways for sustainable development. J Build Eng. 2024;86:108861. doi:10.1016/J.JOBE.2024.108861. [Google Scholar] [CrossRef]
2. Pablo B, Alissa K, Murphy CW, Miller SA. Literature review on policies to mitigate GHG emissions for cement and concrete. Resour Conserv Recycl. 2022;182:106278. doi:10.1016/j.resconrec.2022.106278. [Google Scholar] [CrossRef]
3. Kim H-S, Kasipandi S, Kim J, Kang S-H, Kim J-H. Current catalyst technology of selective catalytic reduction (SCR) for NOx removal in South Korea. Catalyst. 2020;10(1):52. doi:10.3390/catal10010052. [Google Scholar] [CrossRef]
4. Nam CM, Gibbs BM. Application of the thermal DeNOx process to diesel engine DeNOx: an experimental and kinetic modeling study. Fuel. 2002;81:1359–67. doi:10.1016/S0016-2361(02)00025-X. [Google Scholar] [CrossRef]
5. The Central People’s Government of the People’s Republic of China. The ministry of industry and information technology issued the 14th Five-Year plan for industrial green development; 2021 Nov 15 (In Chinese). Available from: http://www.gov.cn/zhengce/zhengceku/2021-12/03/content5655701.htm. [Accessed 2024]. [Google Scholar]
6. Gholamia F, Tomasa M, Gholamib Z, Vakilic M. Technologies for the nitrogen oxides reduction from flue gas: a review. Sci Total Environ. 2020;714:136712. doi:10.1016/j.scitotenv.2020.136712. [Google Scholar] [PubMed] [CrossRef]
7. Elkaee S, Phule AD, Yang JH. Advancements in (SCR) technologies for NOx reduction: a comprehensive review of reducing agents. Process Saf Environ Prot. 2024;184:854–80. doi:10.1016/j.psep.2024.02.046. [Google Scholar] [CrossRef]
8. An JX, Wang L, Qin Q, Cheng JW, Li YX. Analysis and treatment of catalyst wear mechanism of SCR denitrification system. Thermal Power Generation. 2015;44(12):119–25 (In Chinese). doi:10.3969/i.issn.1002-3364.2015.12.119. [Google Scholar] [CrossRef]
9. Gao X, Wang B, Yuan XD, Lei SY, Qu QG, Ma C, et al. Optimal design of selective catalyst reduction denitrification system using numerical simulation. J Environ Manage. 2019;231(6):909–18. doi:10.1016/j.jenvman.2018.10.060. [Google Scholar] [PubMed] [CrossRef]
10. Sohn J, Hwang IS, Hwang J. Improvement of ammonia mixing in an industrial scale selective catalytic reduction DeNOx system of a coal-fired power plant: a numerical analysis. Process Saf Environ Prot. 2021;147:334–45. doi:10.1016/j.psep.2020.09.043. [Google Scholar] [CrossRef]
11. Ma L. Research on visualization technology for abrasion of flow guide device in denitrification system based on Tabak off model. IOP Conf Series: Earth Environ Sci. 2020;467(1):012048. doi:10.1088/1755-1315/467/1/012048. [Google Scholar] [CrossRef]
12. Si T, Wang C, Liu R, Guo YS, Yue S, Ren YJ. Multi-criteria comprehensive energy efficiency assessment based on fuzzy-AHP method: a case study of post-treatment technologies for coal-fired units. Energy. 2020;200:117533. doi:10.1016/j.energy.2020.117533. [Google Scholar] [CrossRef]
13. Cheng MT, Zhong J, Liao YJ, Fan JH, Gao ZY. Ammonia injection optimization and adjustment test of SCR denitration system based on variable flow field. Therm Power Gen. 2016;45(12):130–6. doi:10.3969/j.issn.1002-3364.2016.12.130. [Google Scholar] [CrossRef]
14. Zhou Z, Chang J, Wang X. Large eddy simulation of hydrodynamics and de NOx process in a coal-fired power plant SCR system. J Environ Manage. 2022;320(15):115800. doi:10.1016/j.jenvman.2022.115800. [Google Scholar] [PubMed] [CrossRef]
15. Shakya BM, Harold MP, Balakotaiah V. Modeling and analysis of dual-layer NOx storage and reduction and selective catalytic reduction monolithic catalyst. Chem Eng J. 2014;237:109–22. doi:10.1016/j.cej.2013.10.008. [Google Scholar] [CrossRef]
16. Li Y, Mao R, Ren LM, Cen KF. Study on static mixer arrangement and numerical simulation of SCR system under non-uniform flow conditions. Therm Power Eng. 2021;36(6):78–85 (In Chinese). [Google Scholar]
17. Liu GF, Shen DK, Xiao R. Ammonia injection optimization and test verification of SCR system of coal-fired power station based on flow field diagnosis. J Southeast Univ (Nat Sci Ed). 2017;47(1):98–106 (In Chinese). doi:10.3969/j.issn.1001-0505.2017.01.018. [Google Scholar] [CrossRef]
18. Ye MM, Qian FP, Gao YH, Lu JL, Han YL, Huang N, et al. CFD analysis of influencing factors on SCR denitrification efficiency of sintering flue gas based on response surface methodology. Atmos Pollut Res. 2021;12(7):101107. doi:10.1016/j.apr.2021.101107. [Google Scholar] [CrossRef]
19. Xu XF, Guo YY, Gao H, Wang X, Zhu TY. Study on the internal flow field uniformity of SCR flue gas denitrification reactor in cement kiln. J Process Eng. 2021;21(12):1440–50 (In Chinese). doi:10.12034/j.issn.1009-606X.220370. [Google Scholar] [CrossRef]
20. Liu TT. Summary of simulation studies on SCR flow field optimization. Power Syst Control. 2020;9(3):161–6. doi:10.12677/DSC.2020.93015. [Google Scholar] [CrossRef]
21. Tafete GA, Habtu NG. Reactor configuration, operations and structural catalyst design in process intensification of catalytic reactors: a review. Chem Eng Process-Process Intensif. 2023;184:109290. doi:10.1016/j.cep.2023.109290. [Google Scholar] [CrossRef]
22. Schwämmle T, Bertsche F, Hartung A, Brandenstein J, Heidel B, Scheffknecht G. Influence of geometrical parameters of honeycomb commercial SCR-DeNOx catalysts on DeNOx activity, mercury oxidation and SO2/SO3 conversion. Chem Eng J. 2013;222:274–81. doi:10.1016/j.cej.2013.02.057. [Google Scholar] [CrossRef]
23. Jung WJ, Han JH, Park HJ, Hwang W. Development of a mathematical model for the porous media approach in simulating flow through a selective catalytic reduction (SCR) facility. Chem Eng Res Des. 2023;197:592–602. doi:10.1016/J.CHERD.2023.07.046. [Google Scholar] [CrossRef]
24. Wen RY, Tan XL, Liu KJ, Liu KJ, Hu WJ. Numerical simulation study of the flow field of SCR denitrification system of sintering flue gas. Sintered Pellet. 2021;46(5):73–8 (In Chinese). [Google Scholar]
25. Roduit B, Baiker A, Bettoni F, Baldyga J, Wokaun A. 3D modeling of SCR of NOx by NH3 on vanadia honeycomb catalysts. AIChE Journal. 1998;44(12):27312744. doi:10.1002/aic.690441214. [Google Scholar] [CrossRef]
26. Shin SB, Skau KI, Menon M, Maroor S, Spatenka S. A modeling approach to kinetics study and novel monolith channel design for selective catalytic reduction (SCR) applications. Chem Eng Res Des. 2019;142:412–28. doi:10.1016/j.cherd.2018.12.029. [Google Scholar] [CrossRef]
27. Fluent Inc. Fluent User’s Guide; 2018. Available from: https://ansyshelp.ansys.com/public/account/secured?returnurl=/Views/Secured/corp/v242/en/flu_ug/flu_ug.html. [Accessed 2024]. [Google Scholar]
28. Quissek M, Budziankou U, Pollak S, Lauer T. CFD simulation of SCR systems using a mass-fraction-based impingement model. Fluids. 2023;8(8):216. doi:10.3390/fluids8080216. [Google Scholar] [CrossRef]
29. Forzatti P. Present status and perspectives in DeNOx SCR catalysis. Appl Catal A: Genera. 2001;222(1–2):221–36. doi:10.1016/S0926-860X(01)00832-8. [Google Scholar] [CrossRef]
30. González-Tello P, Camacho F, Vicaria JM, González PA. A modified Nukiyama-Tanasawa distribution function and a Rosin-Rammler model for the particle-size-distribution analysis. Powder Technol. 2008;186(3):278–81. doi:10.1016/j.powtec.2007.12.011. [Google Scholar] [CrossRef]
31. Gao YH, Qian FP, Sun Y, Wu Y, Wu SH, Lu JL, et al. A model for predicting the erosion rate induced by the use of a selective catalytic reduction denitrification technology in cement kilns flue gas. Fluid Dyn Mat Process. 2023;19(8):1997–2011. doi:10.32604/fdmp.2023.026373. [Google Scholar] [CrossRef]
Cite This Article
 Copyright © 2025 The Author(s). Published by Tech Science Press.
This work is licensed under a Creative Commons Attribution 4.0 International License , which permits unrestricted use, distribution, and reproduction in any medium, provided the original work is properly cited.
 Downloads
 Citation Tools