
 Submit a Paper
 Propose a Special lssue
 Open Access
ARTICLE

Effects of Soil Properties on the Diffusion of Hydrogen-Blended Natural Gas from an Underground Pipe
1 General Research Institute of China Pipeline Network Group, Tianjin, 065099, China
2 Institute of Refrigeration and Cryogenics of Zhejiang University, Hangzhou, 310027, China
* Corresponding Author: Xiaobin Zhang. Email:
Fluid Dynamics & Materials Processing 2025, 21(5), 1099-1112. https://doi.org/10.32604/fdmp.2025.060452
Received 01 November 2024; Accepted 03 January 2025; Issue published 30 May 2025
 View Full Text
 Download PDF
Abstract
The diffusion of hydrogen-blended natural gas (HBNG) from buried pipelines in the event of a leak is typically influenced by soil properties, including porosity, particle size, temperature distribution, relative humidity, and the depth of the pipeline. This study models the soil as an isotropic porous medium and employs a CFD-based numerical framework to simulate gas propagation, accounting for the coupled effects of soil temperature and humidity. The model is rigorously validated against experimental data on natural gas diffusion in soil. It is then used to explore the impact of relevant parameters on the diffusion behavior of HBNG under conditions of low leakage flux. The results reveal distinct diffusion dynamics across different soil types: hydrogen (H2) diffuses most rapidly in clay, more slowly in sandy soil, and slowest in loam. At the ground surface directly above the leakage point, H2 concentrations rise rapidly initially before stabilizing, while at more distant surface locations, the increase is gradual, with delays that grow with distance. In particular, in a micro-leak scenario, characterized by a pipeline buried 0.8 m deep and a leakage velocity of 3.492 m/s, the time required for the H2 concentration to reach 1% at the surface, 2 m horizontally from the leak source, is approximately 4.8 h for clay, 5 h for sandy soil, and 7 h for loam. The time taken for gas to reach the surface is highly sensitive to the burial depth of the pipeline. After 18 h of diffusion, the surface H2 molar fraction directly above the leak reaches 3.75%, 3.2%, and 2.75% for burial depths of 0.8, 1.1, and 1.5 m, respectively, with the concentration inversely proportional to the depth. Soil temperature exerts minimal influence on the overall diffusion rate but slows the rise in H2 concentration directly above the leak as temperature increases. Meanwhile, the effect of soil humidity on H₂ diffusion is negligible.Keywords
The utilization of low-carbon and clean energy is crucial to alleviate the effects of global warming and the greenhouse effect, and achieve the goals of “carbon peak” and “carbon neutrality”. Among them, hydrogen gas (H2) is regarded as one of the key ways to promote clean energy levels due to its high calorific value per unit mass and zero carbon emissions. There are numerous ways of H2 transportation, among which pipeline transportation stands out as the most efficient and mature option for long-distance transportation [1]. However, the construction of H2 pipelines requires consideration of time costs, economic benefits, and safety factors. Therefore, it is proposed to transport H2 by incorporating it into existing natural gas pipelines [2−4]. Nonetheless, natural gas pipelines are typically buried underground and are often susceptible to various types of damage, including third-party activities, corrosion, mechanical material failures, and natural hazards. Furthermore, due to the concealed nature of underground pipelines, timely leak detection is challenging and may lead to hazardous situations such as jet fires. Consequently, the leakage issue of underground pipelines should be taken seriously. Research should be conducted to understand, predict, and take preventive measures against leaks, which will also aid in determining the fundamental factors that need to be considered in the design of these pipelines.
The studies on the diffusion characteristics of natural gas leakage from underground pipelines are numerous. Zhang et al. [5] established a three-dimensional steady-state diffusion model for underground natural gas pipeline leakage based on Fick’s law and employed dimensional analysis to solve the problem. The variation of natural gas fraction distribution with pipeline underground depth, soil type, and aperture size was analyzed through examples, and the time required for natural gas to reach the explosion limit on the ground was obtained. Cheng [6] discovered that an increase in moisture decreases soil permeability, narrows the gas diffusion range, and enhances the accumulation effect, thereby shortening the time to reach the explosion limit. Iwata et al. [7] constructed a 10 × 10 × 3 m experimental platform to verify the impact of impermeable interfaces on gas diffusion in soil. Subsequently, Okamoto et al. [8] replaced the soil in the same experimental platform with a layered structure of asphalt, gravel, pit sand, and native soil to simulate the varying of soil structure in urban and suburban areas. In their experiment, methane and propane gas were used to verify the applicability of Fick’s law and Darcy’s law in underground pipeline gas leakages. And in 2014, leak experiments for hydrogen [9] were conducted using the same system. Esposito et al.’s [10] comparative experiments on single-layer and stratified soils revealed that soil stratification affects the diffusion rate of natural gas. Xie et al. [11] built a 4 × 4 × 2 m natural gas pipeline experimental system, where a 2 mm diameter vertically upward small hole was used to simulate a leakage port due to corrosion. The results indicated that the concentration is symmetrically distributed around the leakage port in the horizontal direction and elliptically distributed in the vertical direction due to the influence of the initial kinetic energy. Yan et al. [12] constructed a 5 × 5 × 3 m underground full-scale natural gas pipeline leakage test platform. The working medium was a mixture of 97.5 vol% air and 2.5 vol% methane at low pressure, with adjustable leakage volume and direction. In the experiments conducted by Bettis et al. [13] and Atkinson et al. [14], the ground surface was paved with asphalt or other coverings. The results indicated that, compared to an open surface, the accumulation of natural gas was more pronounced when there was a covering. Jiang et al. [15] also experimentally and numerically investigated the effects of leakage hole diameter and pipeline pressure, with a maximum of 4 MPa in small hole leakage experiments in high-pressure pipelines.
Due to the danger of methane (CH4) and hydrogen (H2) leakage experiments, many scholars have resorted to numerical simulation to study and analyze the issue. Li et al. [16] compared the impact of CH4 leakage in air and soil in consideration of continuous leakage and instantaneous leakage. Parvini et al. [17] revised the numerical model based on the hydrogen leak experimental data from Okamoto et al.’s [9] buried pipeline study, and conducted risk assessments for hydrogen in near-ground and far-ground areas. They provided the minimum leakage rates and durations required for fire or explosion scenarios in both indoor and outdoor settings. Ebrahimi et al. [18,19] derived expressions for pipeline natural gas leakage in both the atmosphere and soil through two-dimensional and three-dimensional numerical simulations, taking into account factors such as leak orifice diameter, pipeline diameter, pipeline pressure, and soil particle diameter. Bezaatpour et al. [20] used a nonlinear multivariate regression method to establish the relationship between leak orifice diameter, pipeline pressure, and natural gas leakage rate. Zhou [21] studied the impact of obstacles in soil on CH4 diffusion and accumulation. The results showed that the presence of obstacles hindered the diffusion of gas, resulting in a more pronounced gas accumulation effect and an increase in hazardous areas. Furthermore, Jayarathne et al.’s [22] research indicated that the determination of the natural gas diffusion coefficient is closely related to soil saturation.
The diffusion characteristics of hydrogen-blended natural gas (HBNG) in soil have also commenced being investigated. Zhu et al. [23] experimented to replicate the situation of the leakage and diffusion process of the mixed gas in high-pressure buried pipelines. They analyzed the effects of pipeline pressure, leakage direction, and H2 blending ratio on the diffusion. Additionally, the applicability of the mass flow model for small-hole leakage was verified. The results demonstrated that H2 exhibits a carrying capacity for CH4 as the incorporation of H2 reduces the time required for CH4 to reach saturation. Furthermore, the authors established a quantitative relationship between the distance and diffusion range based on the analysis of experimental data. Hu et al. [24] established a three-dimensional leakage model for buried pipelines carrying pure H2 or HBNG, exploring the effects of various factors such as depth, leakage port parameter, soil condition, pipeline pressure, and H2 blending ratio on the diffusion behavior of leaked gas. The findings revealed that, for the same point, the time to reach the explosion limit decreases as the H2 blending ratio increases. Su et al.’s model [25] also numerically investigated the time required to reach the explosion limit under different conditions, including pipeline pressures, H2 blending ratios, and leakage hole diameters and directions. Lu et al. [26] further examined these factors, focusing on the alert time when the diffusion of HBNG reaches the lower flammability limit at the surface. Liu et al. [27] integrated the transient flow model within the pipeline, the underground seepage model, and the over-ground diffusion model. Compared to natural gas, the pressure and flow fluctuations after an HBNG leak are more significant, but the mass flow rate is lower. An increase in soil permeability can significantly reduce the hazard area. Xia et al. [28] proposed multi-parameter leakage rate calculation models that were optimized using a genetic algorithm for various soil types, and use the grey relation analysis method to investigate the degree of correlation between various parameters and the leakage hazard evolution of buried HBNG pipelines.
However, the influence mechanism of soil properties, such as the soil type with different porosity, temperature, and humidity has not been fully understood at present. This paper establishes a multi-component transport CFD numerical model considering the energy equation to study the effects of soil characteristics on the diffusion process of HBNG, especially on the H2 fraction in the process of reaching the ground over time. The CFD model was evaluated first by comparing it with the experimental data for CH4 diffusion in soil. The involved soil characteristics include porosity, temperature, and relative humidity. The effects of pipeline underground depth are also a concern. The results help to quantitatively determine the gas impact domain in soil due to diffusion and develop corresponding emergency response measures.
The CFD calculations proceed based on the assumption that the soil is an isotropic medium and there is a local thermodynamic equilibrium between the fluid and solid. The convective diffusion process of HBNG in soil can be obtained by jointly solving the mass, momentum, energy conservation equations, and component transport equations, which are as follows:
Mass conservation equation
Momentum conservation equation
Energy conservation equation
Species transport equations
Ideal gas equation
where, subscripts g and s denote gas and solid, respectively; subscript t represents turbulence; and subscript i represents component i in the gas mixture; εg stands for soil porosity; ρ represents density, with units of kg/m3; k denotes the thermal conductivity, with units of W/(m·K); Cp,g and Cv,s represent the specific heat of the mixture gas at constant pressure and the specific heat of the solid, respectively, with units of J/(kg·K); Yg,i represents the mass fraction of component i in the gas mixture; Di,g represents the laminar diffusion coefficient of component i, with units of m2/s; Sct represents the turbulent Schmidt number, which is dimensionless; and Dt is the turbulent diffusion coefficient, with units of m2/s. The first term on the right side of Eq. (4) represents mass diffusion caused by concentration gradient, while the second term represents molecular thermal diffusion caused by temperature gradient. Sct measures the relative diffusion capacity of momentum and mass caused by turbulence. As Sct is an empirical constant that is relatively insensitive to molecular fluid properties, we used the default value Sct = 0.7 in our simulation. The Di,g and the binary diffusion coefficient Dij are calculated using Kinetic theory, and the expressions are as follows:
where Xi represents the mole fraction of component i; Dij represents the binary diffusion coefficient, with units of cm2/s; Mw represents the molar mass, with units of g/mol; Pabs stands for the absolute pressure, measured in atmospheres (atm); ΩD is the dimensionless diffusion collision integral, which is a function of temperature and can be obtained in Ref. [29]; DT,i represent the thermal diffusion coefficient, which is also calculated based on kinetic theory:
The momentum source term Fi in momentum Eq. (2) represents the flow resistance of porous media, consisting of two parts: viscosity loss term and inertial loss term. The expression is as follows:
where α and C2 represent the penetration rate and inertial resistance coefficient, respectively.
Considering that the gas ejection velocity near the leakage hole is relatively large, which is in the high Reynolds number (Re) region, while the gas flow velocity in the soil far away from the leakage hole is small, which is in the low Re region, thus, the SST k-ω model is adopted for the turbulence closure. For it, the standard k-ε model is used for the high Re region, while the turbulence effect is corrected by modifying the turbulence viscosity μt in the low Re region, and the transport effect of the main turbulent shear stress is considered.
In the calculation, the density of the mixture is calculated according to Eq. (5), and the specific heat, thermal conductivity, and dynamic viscosity of the gas mixture are calculated according to the mixing law of mass fraction weight:
The software Ansys Fluent 2021 is used to solve the aforementioned conservation equations. In this paper, the Pressure-Based Solver, in conjunction with the PISO algorithm, is employed. Specifically, second-order upwind format is adopted for the discretization of pressure, density, momentum, and species, while first-order upwind format is utilized for the discretization of turbulent kinetic energy, specific dissipation rate, and the energy equation. The implicit first-order upwind approach is used for the unsteady term. To expedite calculations, the Non-Iterative Time Advancement Scheme (NITA) is chosen.
Currently, there are limited experiments conducted on hydrogen-blended natural gas leaks in buried pipelines. Zhu et al.’s [23] experiment focused on leaks under high-pressure conditions, which differ significantly from the micro-leak scenarios considered in this paper. Therefore, similar to several scholars [24,25,27], methane leak experiment data were selected for model validation. Ref. [12] reported the variation of CH4 at different measurement points in soil over time for small hole leakage in underground low-pressure pipelines. In the experiment, the pipeline diameter was 0.02 m, the leakage hole diameter was 5 mm, and the vertical distance from the leakage hole to the ground was 0.8 m. The leakage gas is a mixture of CH4 and air. The numerical model built based on the experimental scenario is shown in Fig. 1, in which the soil is also assumed to be isotropic. Additionally, the model is simplified as axisymmetric, with the z-axis as the axis of symmetry, the positive direction vertically downward, and the horizontal direction as the x-axis. The boundary conditions are consistent with the experiment. The leakage flow rate is 6 L/min under standard conditions, and the leakage direction is vertically upward. The CH4 mole fraction is 2.5% (mass fraction is 1.395%), and the inlet temperature is 298 K. The top edge (z = 0) of the computational domain is the surface and the pressure outlet condition is applied with the relative pressure of 0. Meanwhile, the operating pressure is set to 101,325 Pa and the gravitational acceleration to 9.8 m/s2. The right (x = 2.4 m) and bottom (z = 2.4 m) edges of the computational domain are both set as wall boundary conditions. The black points P2, P4, and P13 are selected as data reference points. Their coordinates are as follows: Point 2: x = 0.1 m, z = 2 m; Point 4: x = 1.5 m, z = 0.8 m; Point 13: x = 0.8 m, z = 0.3 m. The red points P1, P2, and P3 are the three monitoring points selected in this paper, all located at z = 0.01 m, with x(P1) = 0.01 m, x(P2) = 1 m, and x(P3) = 2 m.
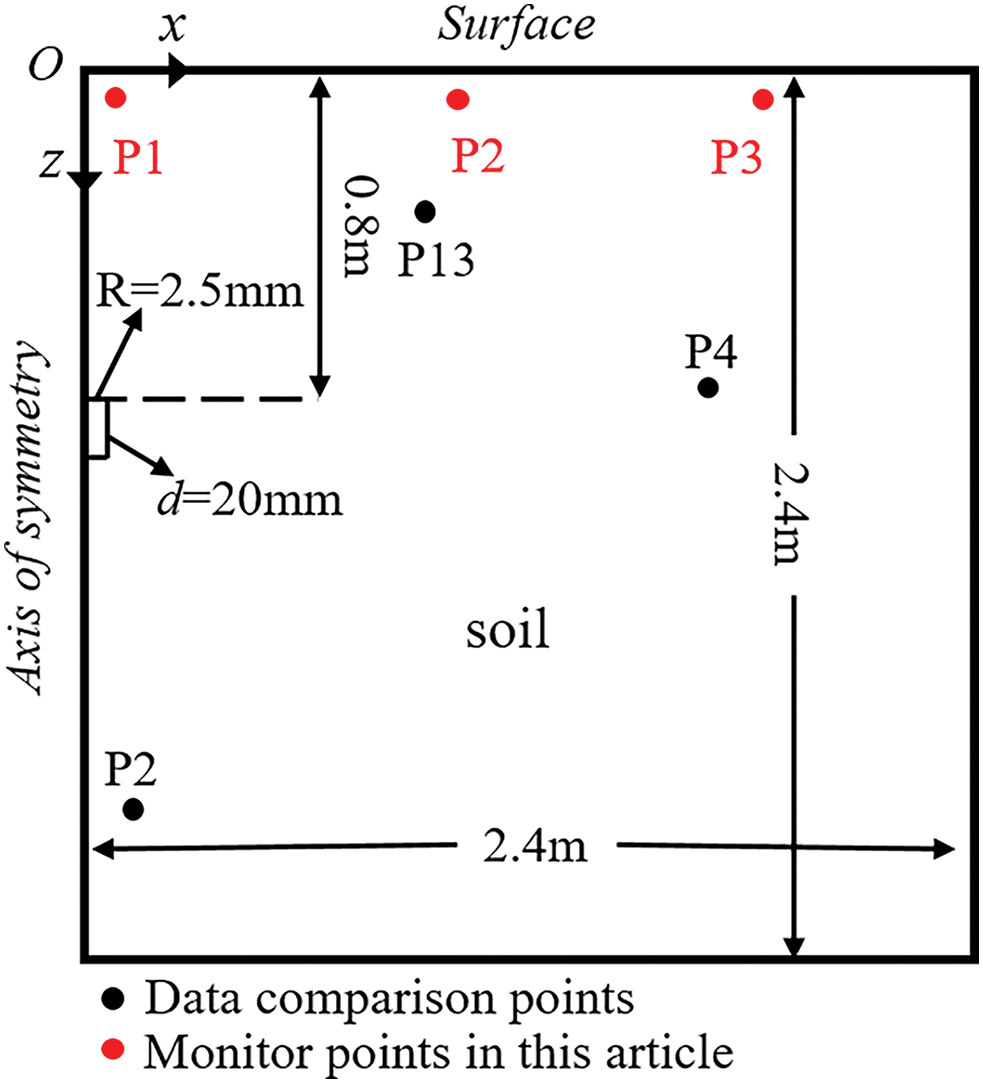
Figure 1: Numerical model based on experimental conditions, Reprinted/adapted with permission from [12]. 2015, Elsevier
In the experiment, the average porosity of soil was 0.133, and the viscosity and inertial resistance coefficients in Eq. (8) are calculated by the Ergun formula:
where dp represents the average particle diameter of the soil. In the experiment, the soil was screened to remove large stones and clay, ensuring the uniformity of particles. For loam, Ref. [30] reported dp = 0.05 mm, which is substituted into the above equation to obtain:
The measurement indicates that soil temperature decreased linearly with depth, and the fitting expression is T = 289.79 − 2.514z (K), which serves as the initial condition for the calculations. The original gas components in the soil are only air and water vapor. Given that the saturation temperature of water vapor is 14°C, the corresponding saturation pressure is 1583.5 Pa, and the volume fraction of water vapor is approximately 1.56%, which is also used as an initial condition. Three typical sensor positions at varying depths in the experiment have been selected for data comparison, as indicated by the black points P2, P4, and P13 in Fig. 1. Firstly, a grid independence test was conducted using different grid schemes. Structured grids were consistently employed for mesh generation. Scheme 1 features 3 grid cells in the leakage hole, totaling 84,810 grid cells; Scheme 2 has 5 grid cells in the leakage hole, totaling 101,160 grid cells; and Scheme 32 boasts 8 grid cells in the leakage hole, totaling 125,680 grid cells. Fig. 2 illustrates the curves of methane mole concentration over time at point P2 in [12] for three different mesh configurations. As observed from the graph, when the mesh counts are 101,160 and 125,680, the concentration change curves for these two larger configurations almost coincide. Therefore, the following calculations are based on Scheme 2 to save the computational time. The mesh division is shown in Fig. 3, where Fig. 3a depicts the overall mesh, and Fig. 3b provides a detailed view of the local area around the leak hole.
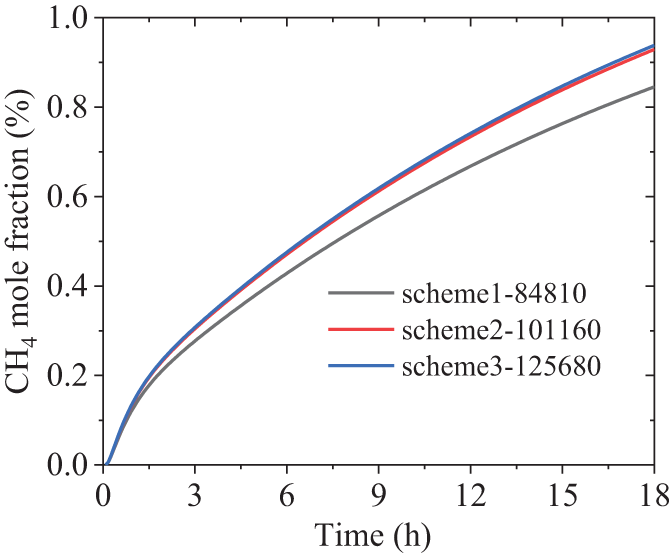
Figure 2: Comparison diagram for mesh independence verification under three different schemes
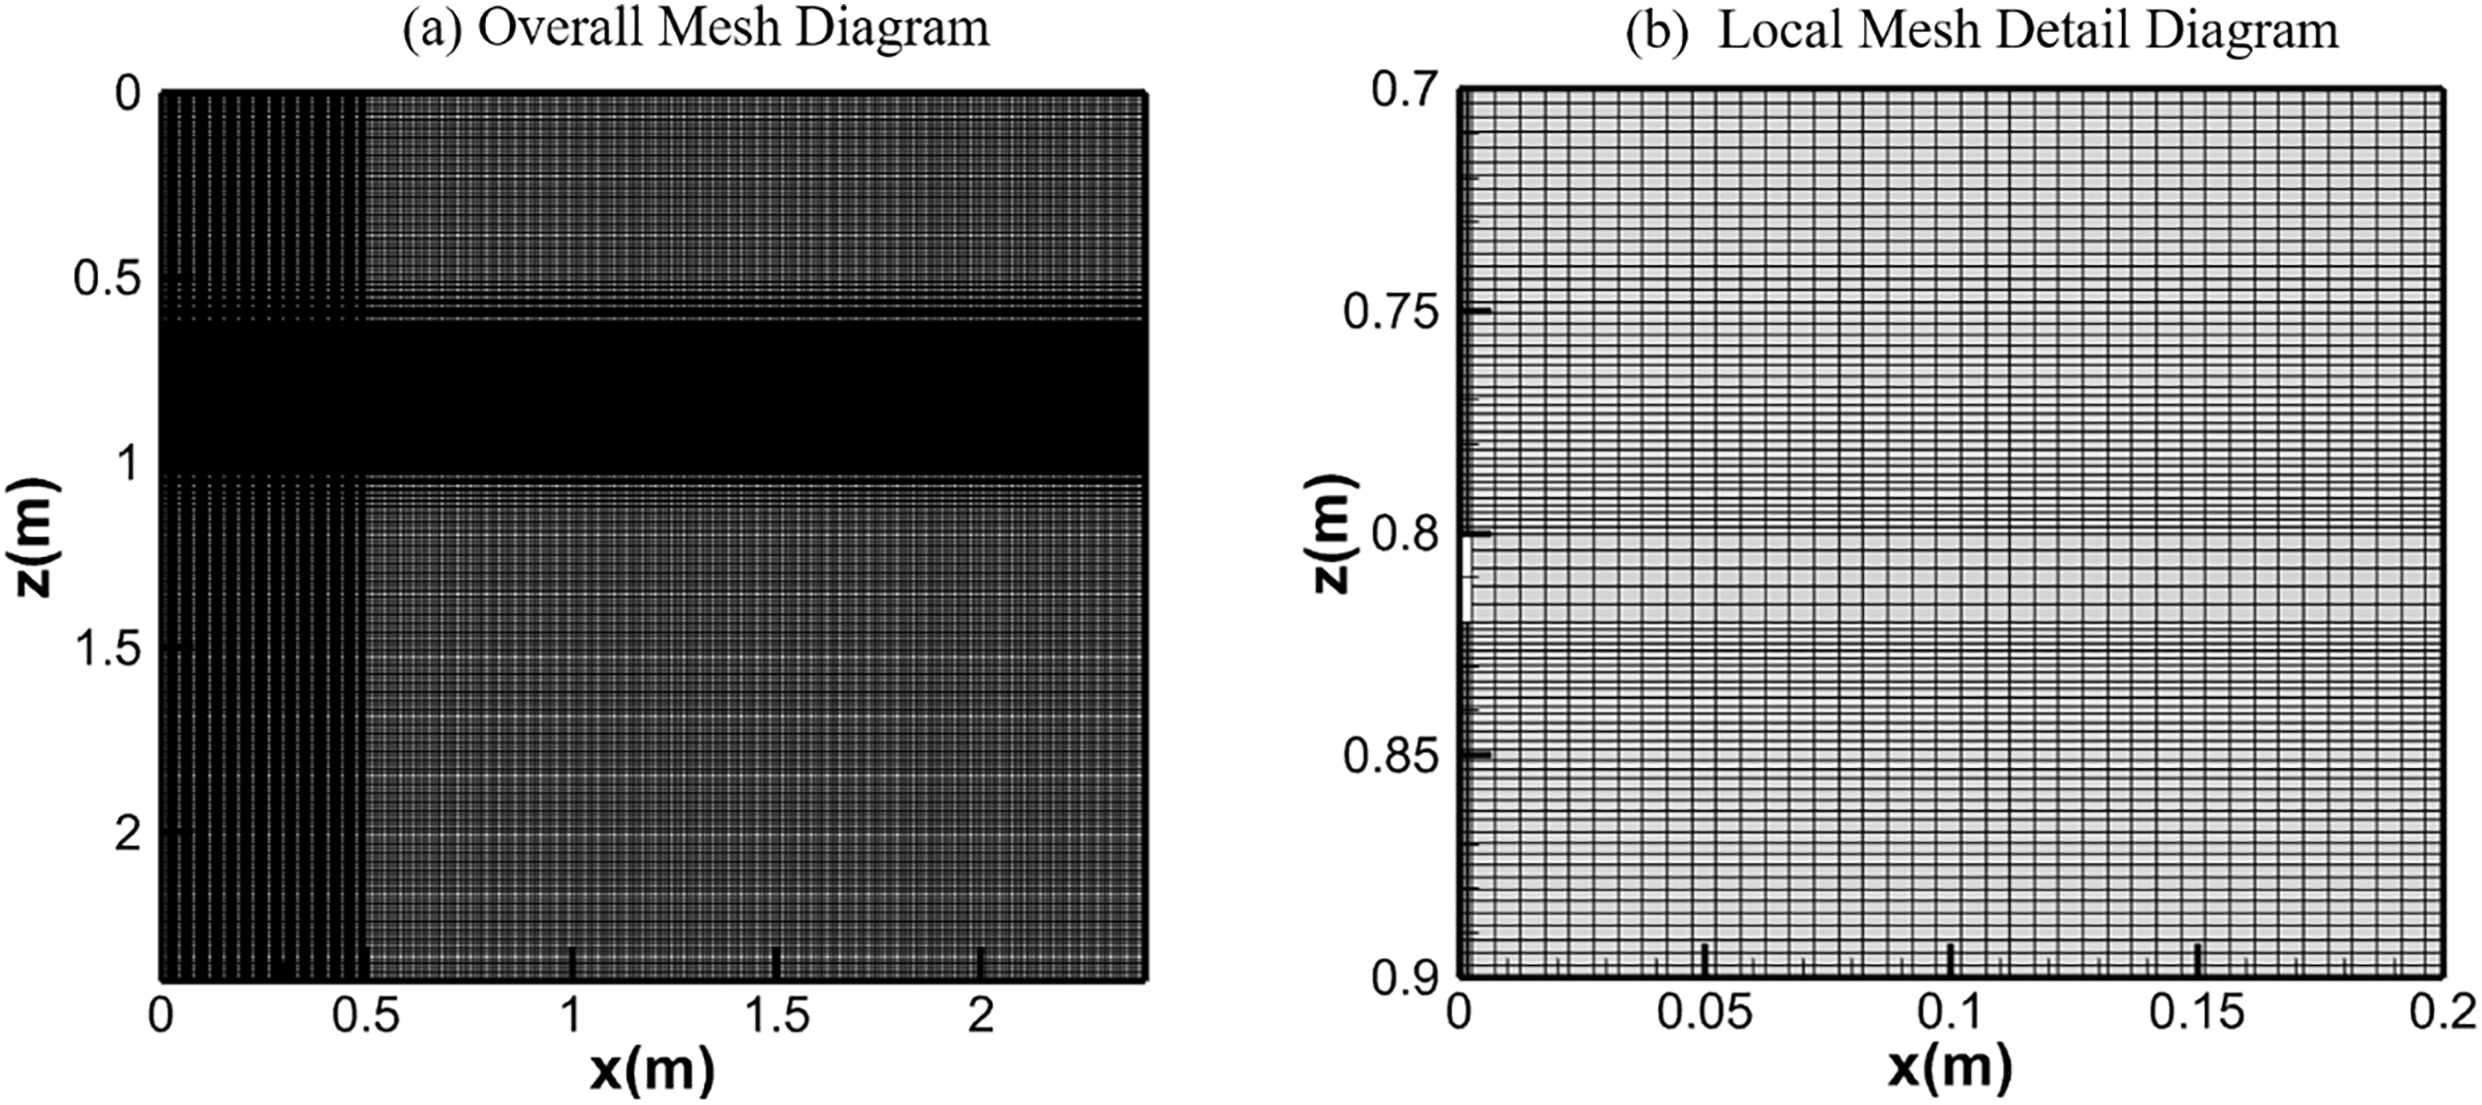
Figure 3: Overall mesh diagram and local mesh detail
Fig. 4 shows the variation of the calculated CH4 fraction over time at three points, compared with experimental results. It is observed that the trends of the two results are consistent, while the errors mainly come from three aspects: firstly, the porosity of the real soil may not be constant. Secondly, the CH4 sensor has a lower threshold for measuring concentration, below which the sensor does not respond. Especially in the initial stage, it is found that the calculated value is much larger than the measured data. Thirdly, the viscosity and inertia resistance coefficients used in the numerical model may not be completely consistent with reality. Therefore, based on the above evaluation, it is still believed that the CFD numerical model can obtain an acceptable prediction of species diffusion behaviors in the soil. Consequently, the time taken for HBNG to spread to the surface after a leak was analyzed based on the model.
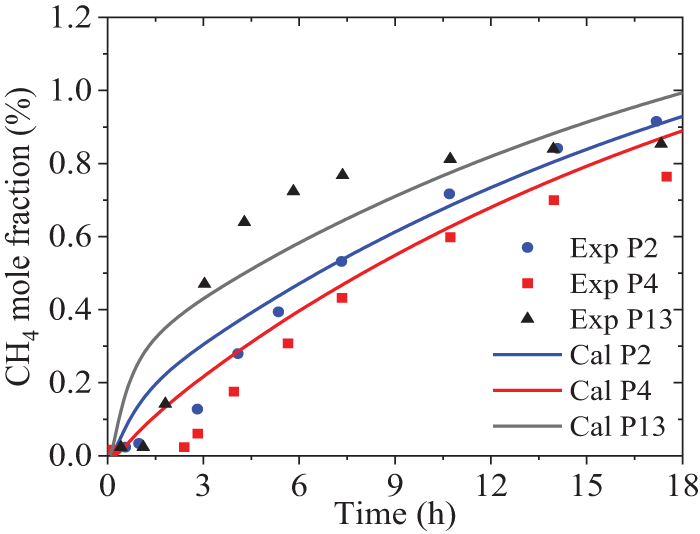
Figure 4: Comparison of CH4 fraction over time between the calculations and experiments, Reprinted/adapted with permission from [12]. 2015, Elsevier
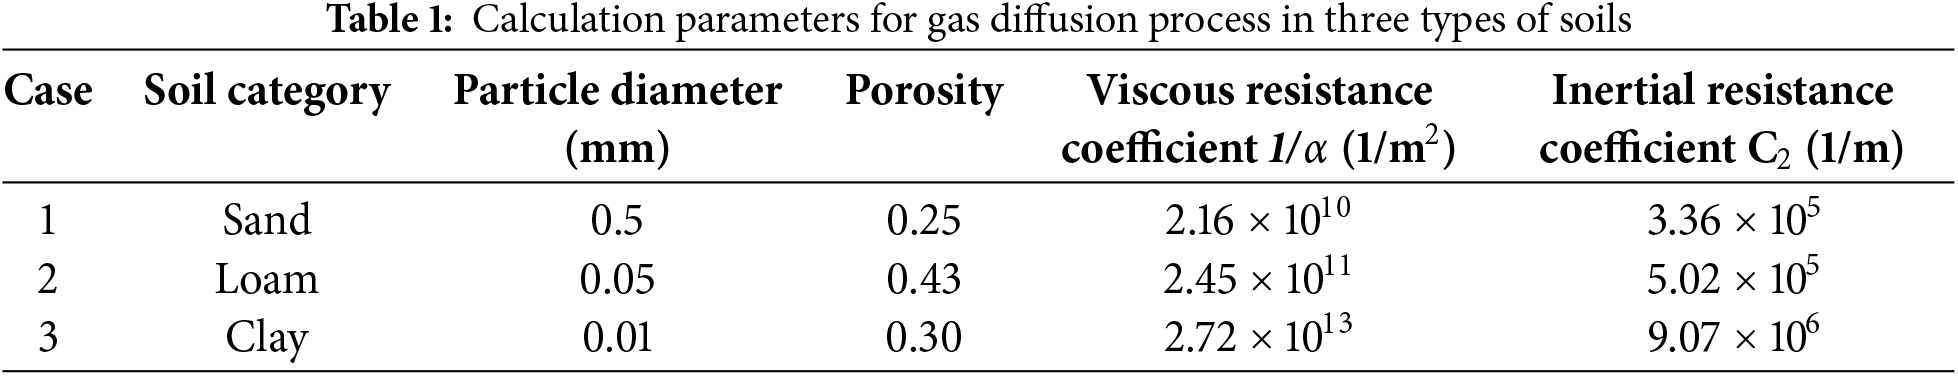
Analyses were conducted on the diffusion behaviors of HBNG in three typical soil types: sandy soil, loam soil, and clay soil, based on the aforementioned numerical models. The calculation parameters for the three soils are presented in Table 1 [27], where 1/α and C2 are derived from Eq. (9). The boundary conditions and physical property settings employed in this analysis are identical to those used in the previously mentioned model. Specifically, the leakage gas velocity is set at 3.492 m/s, the temperature is 289 K, and the H2 volume fraction is 10%, with the remainder being CH4...The initial soil conditions are as follows: a linear distribution of soil temperature is applied, given by T = 16.79 − 2.514z (°C), meaning that the temperature at the surface (z = 0) is 16.79°C, the temperature at a depth of 2.4 m is 10.76°C. Additionally, assuming a water vapor mass fraction of 0.974% in the soil, the corresponding air mass fraction is 99.026%. The locations of the three monitoring points are indicated by the red dots in Fig. 1. The leakage hole has a diameter of 5 mm and is situated at a depth of 0.8 m.
The contour plots of hydrogen concentration in sand over time are presented in Fig. 5, with snapshots taken at 10,000 and 20,000 s for clarity. To facilitate a more intuitive understanding, the contour plots have been mirrored along the z-axis. From the plots, it is evident that the primary direction of hydrogen diffusion is vertically upwards, while it also spreads outwards in a teardrop shape. Consequently, hydrogen is first detected at locations vertically above the leak point. Fig. 6 shows the H2 volume fraction variation at each monitoring point within a 12-h period. Firstly, for the points with the same depth, the horizontal distance from the leakage hole has a significant impact. When comparing the results of points P1 to P3 across all three soil types, the H2 fraction increases fastest at point P1, which is located directly above the leakage hole, while it increases slowest at the more distant P3 point. The time difference to reach the same H2 fraction value of 1% between the two points is about 7 h. It is found that the rate of increase at each point can be roughly divided into two segments. Initially, the rate of increase is the fastest (with the highest linearization slope), and after a certain time point, the increase rate slows down (with a smaller slope). However, as the horizontal distance from the leakage hole increases, the slope difference between these two segments for the same case gradually diminishes, regardless of the soil type. At point P3, the two segments can even be considered as one continuous linear increase throughout the entire time range.
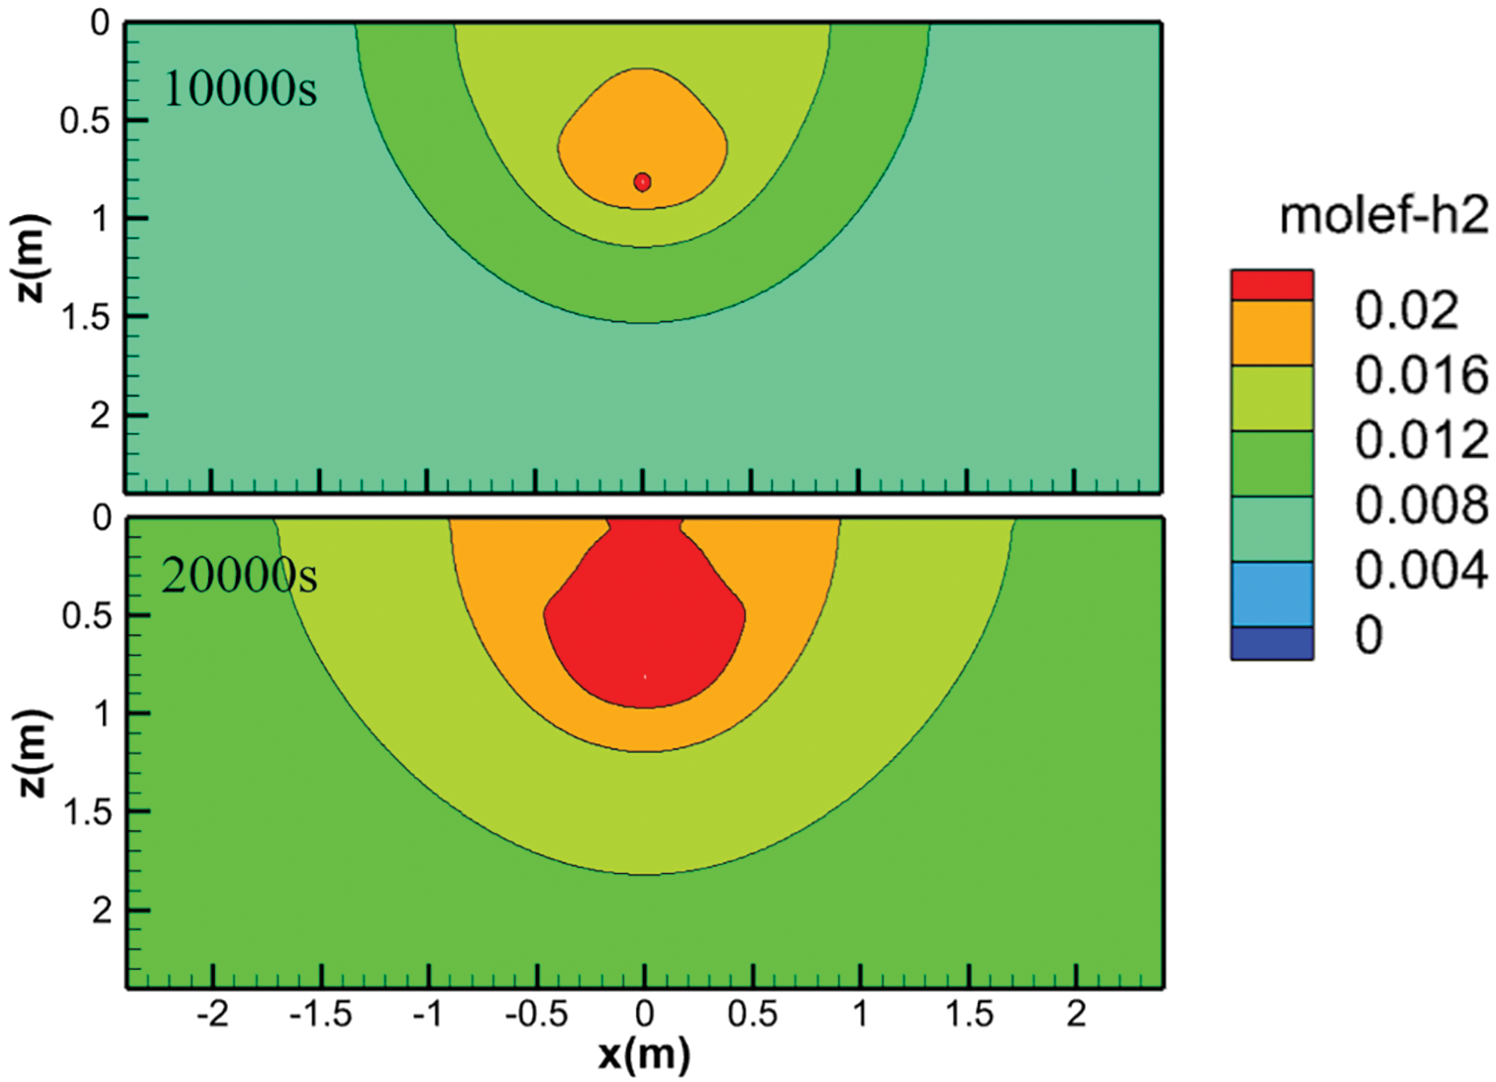
Figure 5: Contour plot of hydrogen concentration in sand over time
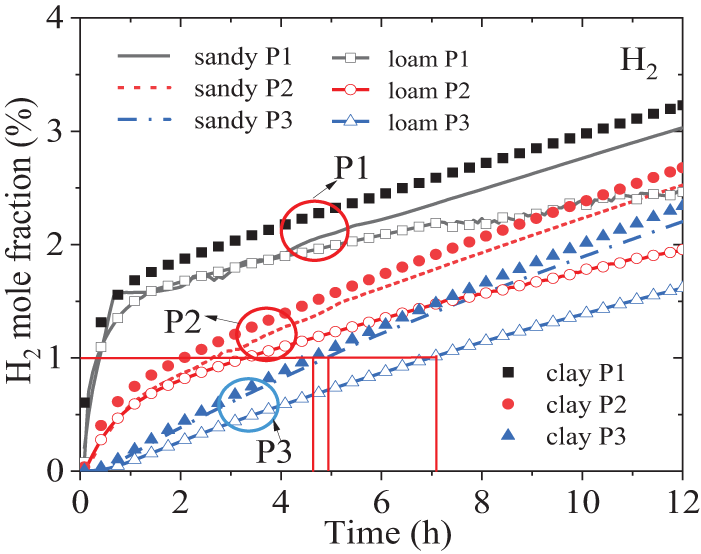
Figure 6: Variances of H2 mole fraction over time in different soil conditions
Secondly, when comparing the three soil types, the time required for H2 to reach the same volume fraction for the same point also differs significantly. Taking the instance where H2 reaches 1% in the figure as an example, for all soil types, point P1 takes less than 0.5 h, whereas point P3 takes approximately 4.8 h in clay, 5 h in sand, and 7 h in loam. This is primarily due to the fact that the porosity of loam (0.43) is significantly higher than that of sandy (0.25) and clay (0.3). Furthermore, at the same duration, the H2 volume fraction, in descending order of magnitude, is clay, sandy, and loam. In other words, the propagation velocity of H2 in clay is fastest, followed by sand, and slowest in loam. Moreover, the relative difference in the H2 volume fraction between monitoring points in sandy and clay remains almost unchanged over time, whereas in loam, this difference becomes increasingly smaller compared to the other two soil types. The total amount of leaked gas remains constant. As porosity increases, the degree of gas diffusion to the surrounding area intensifies, causing a relative decrease in the amount of hydrogen migrating towards the surface. Consequently, the concentration of hydrogen detected on the surface decreases. In cases where porosity is similar, a larger resistance coefficient faster increase in the relative content of H2 near the leakage point. It can be observed that the porosity is the primary factor affecting the H2 diffusion rate. However, at the same time, when comparing sand to loam, the viscosity resistance coefficient and inertia resistance coefficient, which are influenced by soil particle diameter, also exert an undeniable impact. In cases where porosity is similar, a larger the resistance coefficient results in a faster increase in the relative content of H2 near the leakage point.
Fig. 7 demonstrates the variation of the calculated CH4 mole fraction over time at three monitoring points under three different soil conditions. It is observed that, even after 12 h, the CH4 fraction at each point had not returned to its initial value of 90%. This is due to the fact that, under small leakage conditions, molecular diffusion of CH4 is the dominant process compared to convective transport. Jiang et al. [15] experimentally measured the concentration changes over time at different depths of a 100% CH4 underground pipeline with leakage holes of 0.5, 1, and 1.5 mm in diameter, and a maximum leakage pressure of 4 MPa, while varying the leakage rates. The porosity of the soil is approximately 34.7%. The results revealed that there are four stages of CH4 concentration changes depending on the distance from the leakage point: incubation period, sharp increase, slow increase, and stability. In contrast, Fig. 7 only shows the latent and slow growth stages, which are primarily influenced by factors such as leakage hole size, test point location, leakage velocity, etc. The velocity at the leakage hole in Jiang’s experiment reached sonic speed, much higher than the present value in this paper (6 L/min). Therefore, in Jiang’s experiment, stability was reached at about 200 s, while in this study, the measuring point above the leakage hole gradually reached stability after 12 h due to the focus on micro-leakage. In addition, comparing Figs. 6 and 7, it is found that soil conditions have a consistent effect on the diffusion characteristics of CH4 and H2. Clay has the lowest resistance, followed by sandy soil, and loam has the highest resistance.
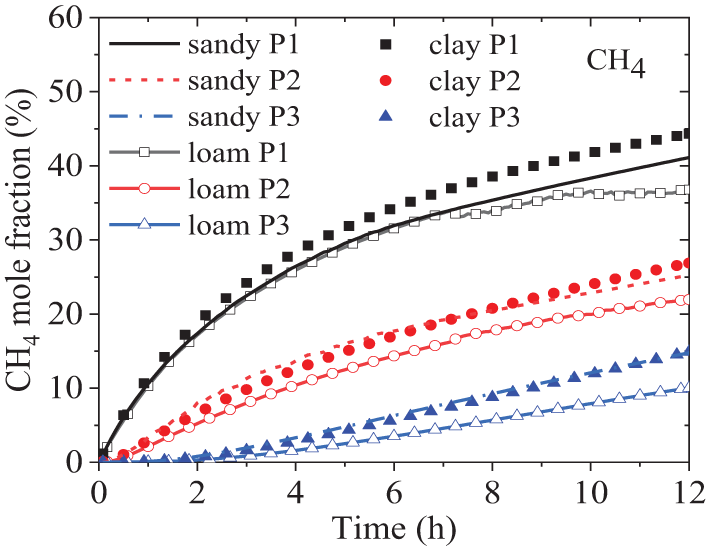
Figure 7: Variances of CH4 mole fraction over time in different soil conditions
4.2 Effects of Underground Depth
The diffusion characteristics of H2 in the soil at leakage hole depths of z = 0.8 m, z = 1.1 m, and z = 1.5 m from the surface are investigated. Other conditions remain the same as those described in Section 4.1. The clay listed in Table 1 is selected as the research object here. Fig. 8 shows the variation of the H2 mole fraction at the three monitoring points over time. The effects of depth on point P1 are very significant, as shown in the figure, the H2 fraction for depths of z = 0.8, 1.1, and 1.5 m reaches 3.75%, 3.2%, and 2.75%, respectively, after 18 h. The fraction is approximately linearly inversely proportional to the depth of the leakage hole. From another perspective, at the moment of 18-h mark, it is found that as the distance from the detection point to the leakage hole increases, the fraction difference between points P1, P2, and P3 at different leakage hole depths decreases. The fraction difference at point P2 for the three depths is smaller than that at point P1, at point P3 is smaller than that at point P2. The fraction difference at point P2 for the three depths is smaller than that at point P1, and the difference at point P3 is smaller than that at point P2. However, the decreasing trend slows down as the distance from the leakage hole increases.
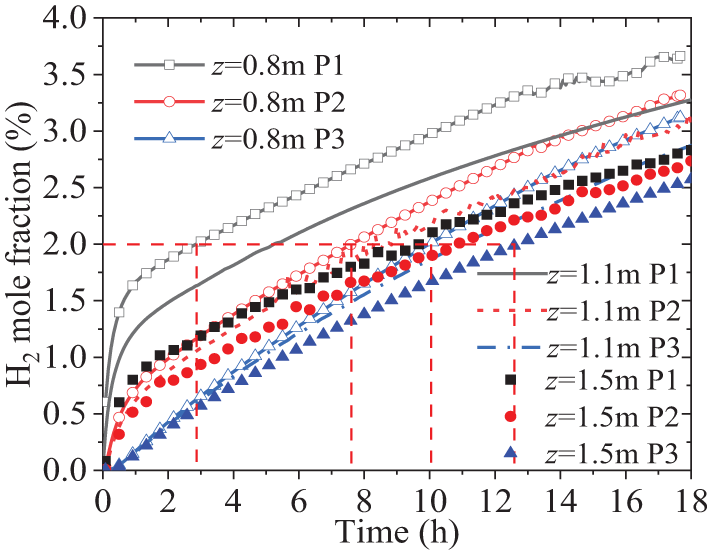
Figure 8: Variances of H2 mole fraction over time at different depths of leakage holes in the soil
From Figs. 6 and 8, it can be observed that the H2 fraction at detection point P1, which is directly above the leakage hole, is more sensitive to parameter changes of the leakage hole compared to P2 and P3. For sensors at the same depth, even when the horizontal distance differs by 1 m, the time difference for detecting the same H2 fraction is significant. Taking the calculation results in Fig. 5 as an example, when the leakage hole has a depth of 0.8 m t, the time it takes for the H2 volume fraction to reach 2% (half of the value of lower flammability limit) at the surface is approximately 3, 7, and 12 h for points P1, P2, and P3, respectively. As the depth of the leakage hole increases, the time difference to reach the same fraction decreases. For example, when the leakage hole has a depth of 1.5 m, the time it takes for the H2 volume fraction to reach 2% at the surface is approximately 9.5, 11, and 12.5 h for points P1, P2, and P3, respectively. It can be seen that the time for H2 leakage diffusion to reach the surface is highly sensitive to the underground depth of the leakage hole. Therefore, it is necessary to predict the diffusion time in advance and accurately arrange the position of the H2 sensors to detect leakage hazards in a timely manner.
4.3 Effects of Soil Temperature
Due to the influence of heat exchange between the soil and the gas, the gas temperature gradually converges with the soil temperature during the diffusion process. And, according to Eq. (7), the soil temperature affects the diffusion coefficient of the components. Selecting the clay from Table 1 as the research object, three initial temperature distributions in the depth direction of soil are designed, namely: T1: T = 289.79 − 2.514z, T2: T = 299.79 − 2.514z, and T3: T = 309.79 − 2.514z. Among them, the temperatures increase by 10°C in sequence, but the slope of the linear distribution remains constant, and the initial temperature of the leakage gas also remains unchanged at 298 K. Fig. 9 shows the diffusion behaviors of H2 at different soil temperatures, indicating that the soil temperature has a relatively significant impact on the nearest point P1. An interesting phenomenon is that the higher the soil temperature, the greater the diffusion coefficient, as indicated by Eq. (7). Consequently, one might expect that the time it takes to reach the same H2 fraction would be shorter. However, at point P1 just above the leakage port, an opposite trend is observed: the higher the soil temperature, the longer the time it takes. Taking the H2 fraction of 2% as an example, the T3 distribution, which has the highest temperature, takes about 4 h to reach this fraction, while the T1 distribution with the lowest temperature only takes about 3 h. Upon analysis, the reason for this anomaly is attributed to the fact that at the same H2 leakage rate, as the diffusion coefficient increases, the diffusion rate in all directions increases, resulting in a relative decrease in the amount of the vertical direction. The fraction at points P2 and P3 further away from the leakage point is almost hardly affected by the temperature, which is also the result of the increased diffusion coefficient.
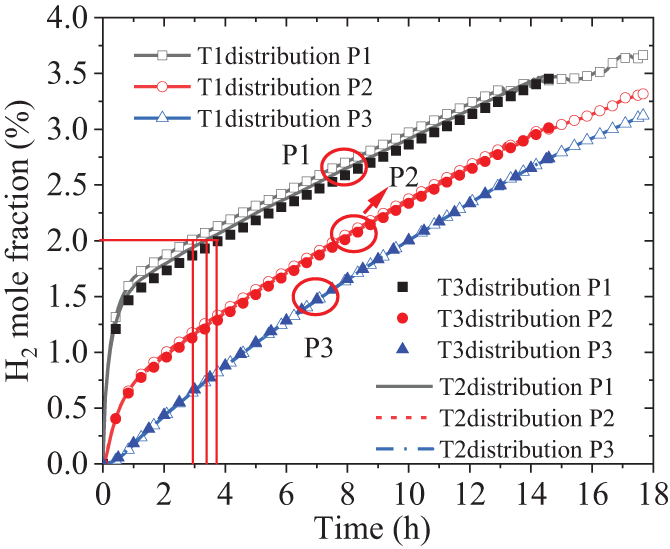
Figure 9: Effect of soil temperature on H2 diffusion characteristics
As shown in Eq. (6), the influence of soil moisture on gas diffusion is mainly reflected in the diffusion coefficient of a single component in the mixture. An increase in the water vapor fraction in the gas will result in a decrease in the diffusion coefficient of H2 in the mixture. Therefore, three initial soil humilities are designed, namely: Hu1 with a water vapor mass fraction of 0.974%, Hu2 with 1.4%, and Hu3 with 0.735%. The soil type remains the same as case 3 in Table 1 and the temperature distribution is set as T1 in Section 4.3. None of the three humidity values reached the saturation state, therefore, the occurrence of liquid water is not considered in the calculation. Fig. 10 shows the variation of the H2 volume fraction over time at three test points under different soil moisture levels. It is found that the water vapor fraction had almost no effect on the H2 diffusion, possibly because the water vapor fraction is very small and therefore had a negligible impact on the diffusion coefficients of components.
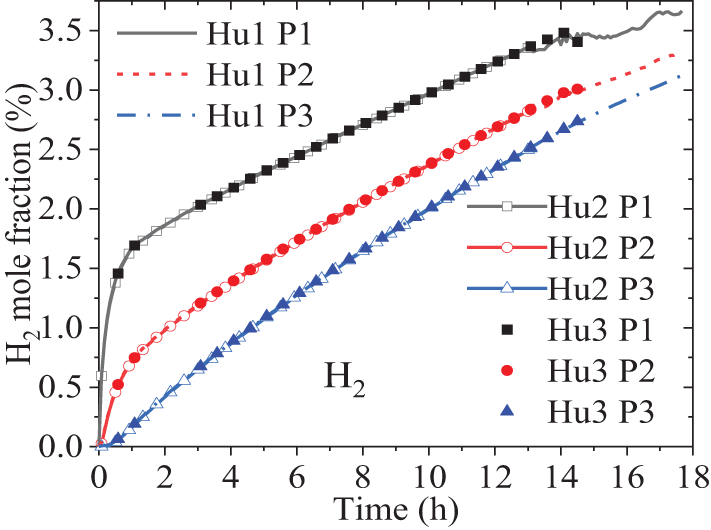
Figure 10: Effect of soil moisture on H2 diffusion behavior
This paper used CFD methods to study the diffusion characteristics of hydrogen-blended natural gas with small leakage flow rates in soil, revealing the influence of the soil types of sand, loam, and clay with different particle diameters and porosities, soil temperature, humidity, and pipeline underground depth on the H2 diffusion time to the surface. Based on the research, the following conclusions were drawn:
(1) Despite not achieving a high degree of agreement with experiments at initially low concentrations, the simulation demonstrates a reasonable consistency with experiments at high concentrations and in terms of trends. Therefore, for hydrogen-blended natural gas with micro-leaks, it can be deemed that the constructed CFD numerical model is capable of modeling the diffusion characteristics of H2 and CH4 with small flow leakage in soil with acceptable accuracy;
(2) Under the same leakage conditions, H2 spreads the fastest in clay, followed by sandy, and the slowest in loam. Porosity is the main factor affecting the diffusion rate;
(3) The viscosity resistance coefficient and inertia resistance coefficient caused by soil particle diameter have an undeniable impact. In the case of similar porosity, the larger the resistance coefficient, the faster the relative fraction of H2 nearby rises. Among different soil types, clay soil exhibits relatively low resistance, sandy soil has intermediate resistance, and fertile soil has the highest resistance;
(4) The underground depth of the leakage hole is very sensitive to the time it takes for the leakage to spread to the surface, and the time for H2 to reach the surface is approximately proportional to the depth;
(5) The influence of soil temperature and humidity on diffusion rate can be almost negligible.
And, it should be noted that the diffusion rate of H2 is not only affected by soil conditions, but also closely related to pipeline pressure, leakage hole diameter and direction, hydrogen blending ratio, and other conditions. The next step will be to study the impact characteristics of these factors.
Acknowledgement: None.
Funding Statement: This work was supported by the National Key Research and Development Program of China (No. 2022YFB4002900).
Author Contributions: The authors confirm contribution to the paper as follows: study conception and design: Shiyao Peng; data collection: Hanwen Zhang, Chong Chai; analysis and interpretation of results: Shiyao Peng, Shilong Xue; draft manuscript preparation: Hanwen Zhang, Xiaobin Zhang. All authors reviewed the results and approved the final version of the manuscript.
Availability of Data and Materials: The data that support the findings of this study are available from the corresponding author upon reasonable request.
Ethics Approval: Not applicable.
Conflicts of Interest: The authors declare no conflicts of interest to report regarding the present study.
References
1. Zhao B, Li S, Gao D, Xu L, Zhang Y. Research on intelligent prediction of hydrogen pipeline leakage fire based on Finite Ridgelet neural network. Int J Hydrogen Energy. 2022;47(55):23316–23. doi:10.1016/j.ijhydene.2022.05.124. [Google Scholar] [CrossRef]
2. Hafsi Z, Elaoud S, Mishra M. A computational modeling of natural gas flow in looped network: effect of upstream hydrogen injection on the structural integrity of gas pipelines. J Nat Gas Sci Eng. 2019;64:107–17. doi:10.1016/j.jngse.2019.01.021. [Google Scholar] [CrossRef]
3. Cristello JB, Yang JM, Hugo R, Lee Y, Park SS. Feasibility analysis of blending hydrogen into natural gas networks. Int J Hydrogen Energy. 2023;48(46):17605–29. doi:10.1016/j.ijhydene.2023.01.156. [Google Scholar] [CrossRef]
4. Froeling HAJ, Dröge MT, Nane GF, Van Wijk AJM. Quantitative risk analysis of a hazardous jet fire event for hydrogen transport in natural gas transmission pipelines. Int J Hydrogen Energy. 2021;46(17):10411–22. doi:10.1016/j.ijhydene.2020.11.248. [Google Scholar] [CrossRef]
5. Zhang P, Cheng S. Study on small micropore leakage in buried gas pipeline. China Saf Sci J. 2014;24(2):52–8. [Google Scholar]
6. Cheng SJ. Studies of the small leakage in buried gas pipeline under the condition of soil properties. Appl Mech Mater. 2014;501-504:2266–70. doi:10.4028/www.scientific.net/AMM.501-504.2266. [Google Scholar] [CrossRef]
7. Iwata T, Hamaide G, Fuchimoto K. Development of analytical s for the behavior of underground leakage gas from low-pressure mains. In: Proceedings of the International Gas Research Conference; 1992; Orlando, FL, USA. p. 1302–11. [Google Scholar]
8. Okamoto H, Gomi Y. Empirical research on diffusion behavior of leaked gas in the ground. J Loss Prev Process Ind. 2011;24(5):531–40. doi:10.1016/j.jlp.2011.01.007. [Google Scholar] [CrossRef]
9. Okamoto H, Gomi Y, Akagi H. Movement characteristics of hydrogen gas within the ground and its detection at ground surface. J Civ Eng Sci. 2014;3(1):49–66. [Google Scholar]
10. Esposito A, Illangasekare T, Smits K. Migration of natural gas through heterogeneous sandy soils affected by atmospheric boundary conditions. In: Unconventional Resources Technology Conference; 2014 Aug 25–27; Denver, CO, USA. p. 2378–88. [Google Scholar]
11. Xie YS, Wang T, Lyu LH, Bai YQ, Song BX, Zhang XF. Full-scale experiment of diffusion behaviors of city pipe line gas in soils. Nat Gas Indus. 2015;35(8):106–13. [Google Scholar]
12. Yan Y, Dong X, Li J. Experimental study of methane diffusion in soil for an underground gas pipe leak. J Nat Gas Sci Eng. 2015;27:82–9. doi:10.1016/j.jngse.2015.08.039. [Google Scholar] [CrossRef]
13. Bettis R, Fletcher J. Comparing subsurface migration of LPG with natural gas Derbyshire. UK: Health and Safety Laboratory; 2009. [Google Scholar]
14. Atkinson G, Hooker P, Hall JE, Hawksworth SJ. Flow of hydrogen from buried leaks. In: International Conference on Hydrogen Safety; 2019; Adelaide, South Australia. p. 1–13. [Google Scholar]
15. Jiang H, Xie Z, Li Y, Chi M. Leakage and diffusion of high-pressure gas pipeline in soil and atmosphere experimental and numerical stud. Energy Sour Part A: Recov, Utiliz Environ Eff. 2023;45(4):10827–42. doi:10.1080/15567036.2023.2251429. [Google Scholar] [CrossRef]
16. Li Z, Ma G. A comparative study of numerical simulation on underground and aerial pipeline leakage at instantaneous and continuous states. Nat Gas Indus. 2011;31(7):90–3. doi:10.3787/j.issn.1000-0976.2011.07.022. [Google Scholar] [CrossRef]
17. Parvini M, Gharagouzlou E. Gas leakage consequence modeling for buried gas pipelines. J Loss Prev Process Ind. 2015;37:110–8. doi:10.1016/j.jlp.2015.07.002. [Google Scholar] [CrossRef]
18. Ebrahimi-Moghadam A, Farzaneh-Gord M, Deymi-Dashtebayaz M. Correlations for estimating natural gas leakage from above-ground and buried urban distribution pipelines. J Nat Gas Sci Eng. 2016;34:185–96. doi:10.1016/j.jngse.2016.06.062. [Google Scholar] [CrossRef]
19. Ebrahimi-Moghadam A, Farzaneh-Gord M, Arabkoohsar A, Moghadam AJ. CFD analysis of natural gas emission from damaged pipelines: correlation development for leakage estimation. J Clean Prod. 2018;199:257–71. doi:10.1016/j.jclepro.2018.07.127. [Google Scholar] [CrossRef]
20. Bezaatpour J, Fatehifar E, Rasoulzadeh A. CFD investigation of natural gas leakage and propagation from buried pipeline for anisotropic and partially saturated multilayer soil. J Clean Prod. 2020;277:123940. doi:10.1016/j.jclepro.2020.123940. [Google Scholar] [CrossRef]
21. Zhou L. Numerical simulation on explosion area of buried pipeline natural gas leak. Contemp Chem Indus. 2013;42(6):874–6. [Google Scholar]
22. Jayarathne JRRN, Kolodziej RS, Riddick SN, Zimmerle DJ, Smits KM. Influence of soil-gas diffusivity on expansion of leaked underground natural gas plumes and application on simulation efforts. J Hydrol. 2023;625(1):130049. doi:10.1016/j.jhydrol.2023.130049. [Google Scholar] [CrossRef]
23. Zhu J, Pan J, Zhang Y, Li Y, Li H, Feng H, et al. Leakage and diffusion behavior of a buried pipeline of hydrogen-blended natural gas. Int J Hydrogen Energy. 2023;48(30):11592–610. doi:10.1016/j.ijhydene.2022.10.185. [Google Scholar] [CrossRef]
24. Hu WP, Chen G, Qi BJ, Zhang YH. Numerical simulation of leakage and diffusion of buried pure hydrogen/hydrogen-doped natural gas pipeline. Low Carbon New Energy. 2023;42(10):1118–1127,1136. doi:10.6047/j.issn.1000-8241.2023.10.005. [Google Scholar] [CrossRef]
25. Su Y, Li J, Yu B, Zhao Y, Han D, Sun D. Modeling of hydrogen blending on the leakage and diffusion of urban buried hydrogen-enriched natural gas pipeline.pdf. Comput Model Eng Sci. 2023;136(2):1315–37. doi:10.32604/cmes.2023.026035. [Google Scholar] [CrossRef]
26. Lu H, Guo B, Chen X, Yao J, Liu B. Numerical investigation on leakage and diffusion characteristics of buried hydrogen-blended natural gas pipelines. Int J Hydrogen Energy. 2024;59:1491–506. doi:10.1016/j.ijhydene.2024.02.075. [Google Scholar] [CrossRef]
27. Liu X, Wang Y, Liang Y, Li J. CFD analysis of leakage and diffusion characteristics in the buried hydrogen-blended natural gas pipeline. Int J Hydrogen Energy. 2024;60:354–68. doi:10.1016/j.ijhydene.2024.02.092. [Google Scholar] [CrossRef]
28. Xia Z, Xu ZD, Lu H, Peng H, Zang X, Liu X, et al. Modeling and assessment of hydrogen-blended natural gas releases from buried pipeline. Int J Hydrogen Energy. 2024;90:230–45. doi:10.1016/j.ijhydene.2024.09.371. [Google Scholar] [CrossRef]
29. Reid RC, Prausnitz JM, Poling BE. The properties of gases & liquids. 4th ed. New York: McGraw-Hill, Inc.; 1987. p. 577–617. [Google Scholar]
30. Bu F, Liu Y, Liu Y, Xu Z, Chen S, Jiang M, et al. Leakage diffusion characteristics and harmful boundary analysis of buried natural gas pipeline under multiple working conditions. J Nat Gas Sci Eng. 2021;94:104047. doi:10.1016/j.jngse.2021.104047. [Google Scholar] [CrossRef]
Cite This Article
 Copyright © 2025 The Author(s). Published by Tech Science Press.
This work is licensed under a Creative Commons Attribution 4.0 International License , which permits unrestricted use, distribution, and reproduction in any medium, provided the original work is properly cited.
 Downloads
 Citation Tools