
 Submit a Paper
 Propose a Special lssue
 Open Access
ARTICLE

Optimization of Guide Vane Geometry in a Pump-as-Turbine through an Orthogonal Test Approach
1 School of Energy and Power Engineering, Lanzhou University of Technology, Lanzhou, 730050, China
2 Key Laboratory of Fluid Machinery and Systems of Gansu, Lanzhou, 730050, China
* Corresponding Author: Pengcheng Wang. Email:
Fluid Dynamics & Materials Processing 2025, 21(5), 1221-1238. https://doi.org/10.32604/fdmp.2025.062244
Received 13 December 2024; Accepted 20 February 2025; Issue published 30 May 2025
 View Full Text
 Download PDF
Abstract
To investigate the impact of guide vane geometry—specifically, outlet angle, blade count, and radial height—on the performance of a Pump as Turbine (PAT), radial guide vanes were introduced upstream of the impeller in an IS80-50-315 low-specific-speed centrifugal PAT. Using an orthogonal test design, numerical simulations were conducted on 16 different PAT configurations, and the influence of vane geometry on performance was analyzed through a range analysis to determine the optimal parameter combinations. The results indicate that the number of guide vane blades significantly affects both the hydraulic efficiency and water head of the PAT under optimal operating conditions. Notably, the hydraulic efficiency of Configuration No. 1 (featuring five guide vane blades, a 6° outlet angle, and a 46 mm radial height) is 4.31% higher than that of Configuration No. 13 (with the same blade count but a 9° outlet angle and a 52 mm radial height). Additionally, Configuration No. 1 exhibits lower turbulence kinetic energy dissipation and reduced blade loading. Furthermore, the study reveals that a smaller guide vane outlet angle and reduced radial height contribute to improved operational stability.Keywords
There is substantial liquid residual pressure energy in process industries, such as the petroleum processing and coal chemical industry. A centrifugal pump as turbine (PAT) is an effective device for recovering this residual pressure energy because of its low cost, convenient maintenance and reliable operation [1,2]. A PAT is designed according to the hydraulic design method of the pump, and the design conditions of the pump are inconsistent with the optimal working conditions of the PAT. In addition, when the centrifugal pump is the turbine, the inlet of the pump is the outlet of the PAT, and the outlet of the pump is the inlet of the PAT. Therefore, prerotation occurs when the fluid enters the impeller, and the structure of the flow area is asymmetric. This results in the low recovery efficiency and unstable operation of PAT in actual operation. When the guide vanes deviate from the design conditions during operation, the turbulent flow in each flow part of the guide vane centrifugal pump intensifies, and the hydraulic performance of the pump is greatly affected [3–5]. In recent years, worldwide studies on PATs have focused on optimization design. The addition of guide vanes to a PAT can change the inlet ring volume of the impeller and improve the hydraulic characteristics and operation stability of the turbine. Therefore, adding guide vanes on the basis of the original PAT is an effective way to improve the performance of the PAT. Currently, domestic and foreign scholars use numerical simulations and experimental methods to change guide vane parameters to improve the performance of PATs [6–8]. For example, Yang et al. [9] reported that adding guide vanes to PATs can improve the flow field distribution inside their impellers. Taking a two-stage PAT as the research object, Wang et al. [10] designed a research program to study the changing geometric parameters of a positive guide vane. These researchers revealed that the output power curve can be flattened by appropriately increasing the positive guide vane throat area, outlet angle, and blade number. Miao et al. [11] used the principle of the velocity moment to inversely calculate the inlet angle of a positive guide vane and reported that the proper inlet angle of the positive guide vane can improve the performance of multistage PAT under optimal working conditions. By adding a fixed guide vane in front of the original PAT, Ventrone et al. [12] showed that the drainage effect of the PAT after adding the guide vane was stronger than that of the original model and that the efficiency and water head were both enhanced. Chai et al. [13] analyzed the influence of a guide vane and volute on the performance of a multistage PAT by changing their relative positions. These researchers found that when the middle position of two adjacent blades in the guide vanes is opposite to the circumferential center plane of the volute inlet, the amplitude of the internal pulsation of the multistage turbine can be reduced. Li et al. [14] designed a new guide vane by applying the hydraulic principle and mechanism and improved the performance of hydraulic turbines by changing the parameters of the guide vane. These coworkers determined that the outer diameter of the guide vane had a great influence on the performance of the new guide vane and that there was an optimal value to achieve the best performance of hydraulic turbines. Furthermore, Schennach et al. [15,16], Ren et al. [17] and Sun [18] investigated the unsteady flow inside a guide vane centrifugal pump by using numerical analysis and experimental methods, which focused on the interference mechanism of the guide vane-type impeller-guide vane rotor-stator in the centrifugal pump. Al-Obaidi et al. [19] studied the flow characteristics of axial flow pumps with different numbers of blades. Bhukya et al. [20] reported that the efficiency of turbine mode with a 120° wrap angle design was improved by 5.15% compared with the existing empirical relationship. Kim et al. [21] studied the internal flow and unsteady pressure phenomena of laboratory-scale pump-turbine models operating in turbine modes with different Thoma numbers. Wang et al. [22] concluded that periodic variations in the wake region of the guide vane cause the transient performance to fluctuate over 1/6 of a cycle. Under low flow conditions, the primary and secondary frequencies of the impeller losses are five times greater than the blade and vane frequencies, respectively. Stefan et al. [23] reported that the flow rate and optimal efficiency point head in turbine mode were 27% and 41% higher than those in pump mode, respectively. The mechanical efficiency was reduced by 4%.
According to the above literature, the research on guide vanes used in PATs focuses only on changing a certain geometric parameter variable of the guide vane but rarely analyzes different parameter combinations. Therefore, new guide vane models are designed by changing the outlet angle, number of guide vanes, radial height and other parameters via the orthogonal experimental method. Numerical simulation is carried out with ANSYS-CFX software to analyze the influence of different guide vane parameters on the performance of a PAT. The results of this study can provide some theoretical references for the optimized design of pumps as hydraulic turbines with guide vanes.
This work is based on research of the IS80-50-315 low-speed centrifugal PAT, as shown in Fig. 1. The design parameters of the centrifugal pump are as follows: flow rate Q = 25 m3/h, the head H = 32 m, rotation speed n = 1450 r/min; and specific speed, ns = 33. The main geometric parameters of the centrifugal PAT are shown in Table 1 [24].
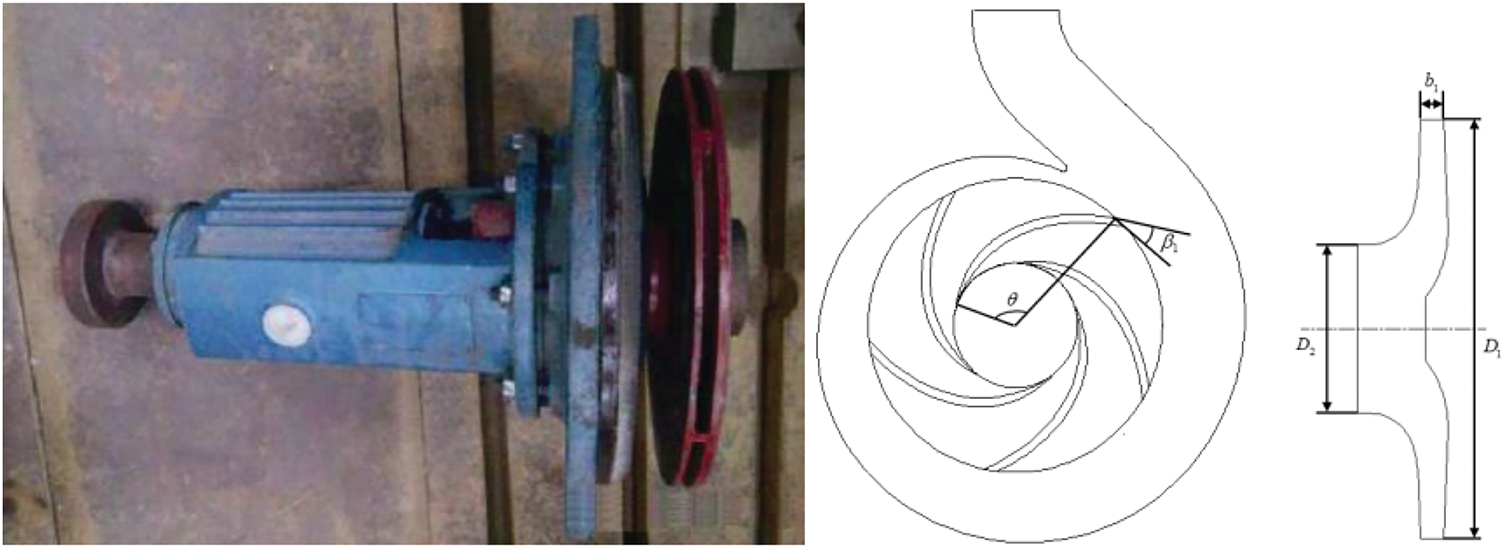
Figure 1: IS 80-50-315 centrifugal pump
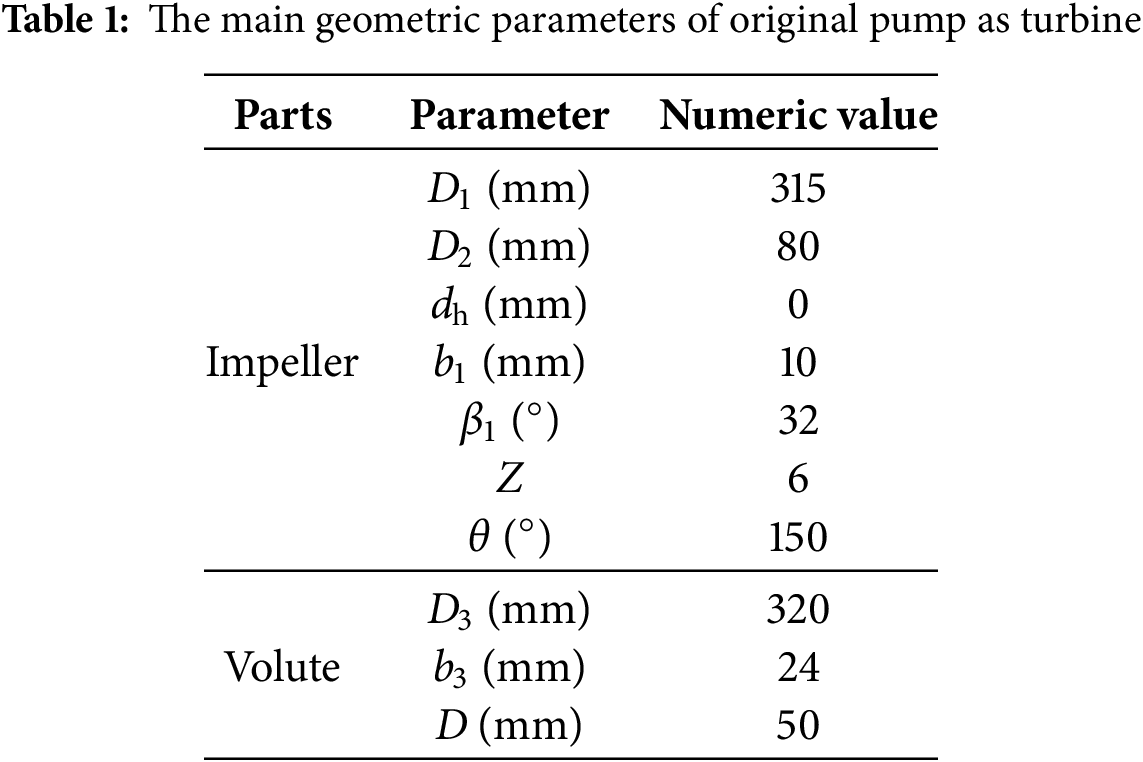
When the centrifugal pump is used as a turbine, to avoid the whole machine resonance phenomenon during the operation of the PAT, the number of radial guide vane blades added in front of the inlet of the PAT impeller should prime each other with respect to the number of impeller blades. In addition, considering that too many radial guide vane blades reduce the flow area and lead to lower hydraulic efficiency, the number of radial guide vane blades is selected as 5, 7, 9 and 11. On the basis of reference [25], the hydraulic design of the radial guide vane was carried out, and the outlet flow angle of the radial guide vane was calculated; that is, the outlet angles of the guide vane were selected as 6°, 7°, 8° and 9°. The inlet diameter of the guide vane can be obtained via an empirical formula according to the base circle diameter of the guide vane, so the radial height values were selected as 46, 48, 50 and 52 mm. After the guide vane design was completed, the base circle of the volute was enlarged appropriately according to the inlet diameter of the guide vane. The base circles of the volute were 379, 381, 383 and 385 mm, and 4 groups of new volute models were obtained. The orthogonal test design table of guide vane geometric parameters shown in Table 2 was obtained by using the orthogonal test design method, and the original PAT structure optimization was completed.
2.3 Calculation Domain Selection and Meshing
According to the main geometric parameters of the PAT with guide vanes in the orthogonal table of guide vane geometric parameters in Table 2, 3D modeling of the PAT model with guide vanes was carried out by using Pro/E software. The whole PAT model consists of five parts, namely, the inlet extension section, the volute, the radial guide vanes, the impeller and the outlet extension section, as shown in Fig. 2. After the assembly of the calculation domain, the ICEM architecture was used to divide the model into mixed meshes, structured hexahedral meshes were used for the inlet and outlet extensions, the volute and impeller, and the meshes at the volute tongue were locally encrypted. Owing to the complex shape of the flow channel of the guide vane, unstructured tetrahedral meshes and adaptive body-fitting meshes were used. The grid division of the flow parts of the PAT with a guide vane is shown in Fig. 3. The grid independence check was carried out prior to the numerical calculations, and it was found that when the total number of grids is greater than 3.9 million, as shown in Fig. 4, the efficiency variation range of the turbine is less than 0.3%. This indicates that the influence of the number of grids on the numerical calculation is negligible at this time, satisfying the grid independence hypothesis.
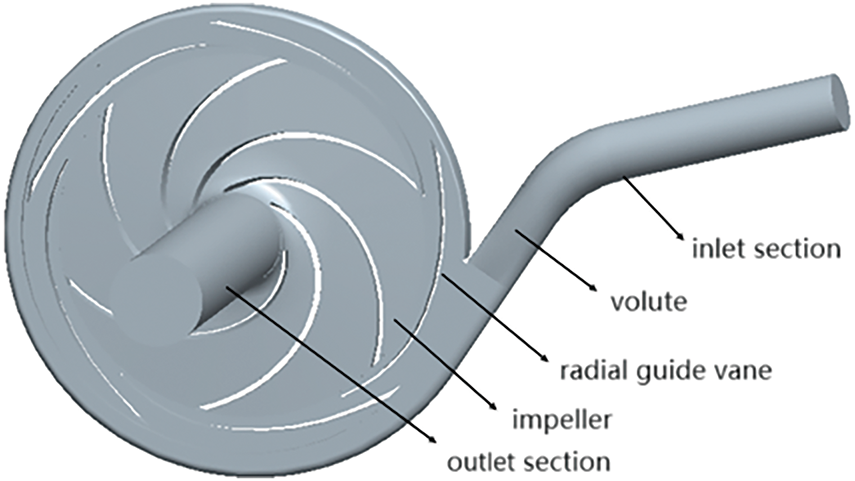
Figure 2: Fluid domain of PAT with guide vanes
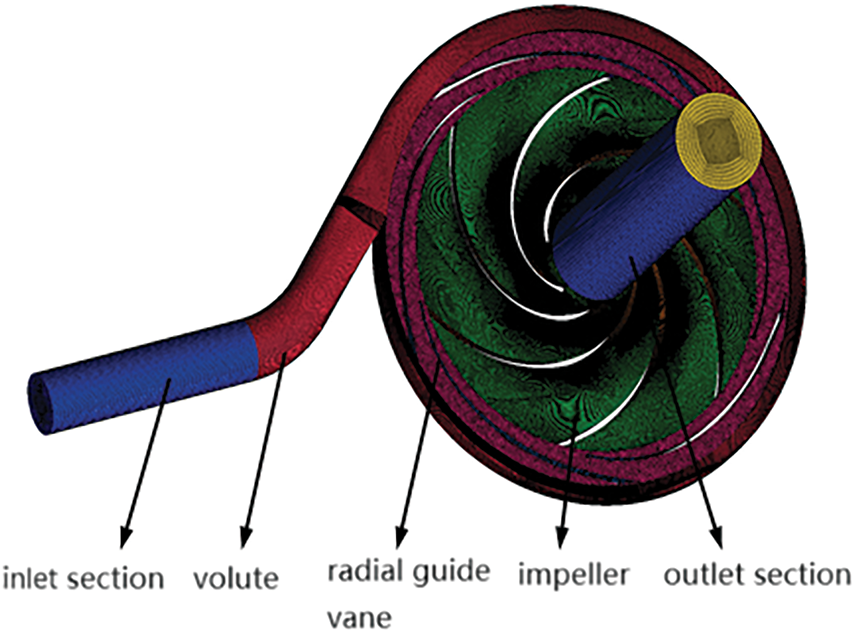
Figure 3: Fluid domain grid of PAT with guide vanes
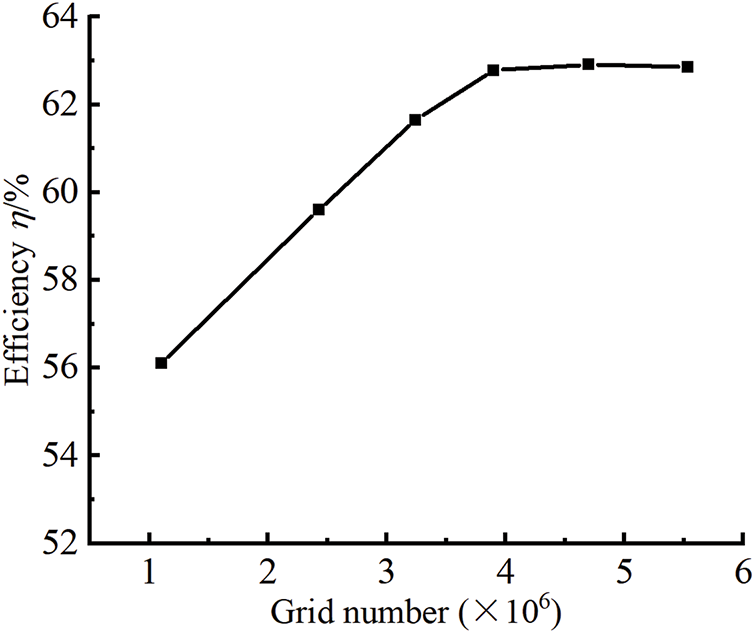
Figure 4: Grid independence verification
2.4 Validation of the Validity of Numerical Calculations
The experimental setup is shown in Fig. 5. Fig. 6 shows the comparison of the test and numerical calculation of the flow efficiency and water head curves. The findings indicate that the numerical simulation data and test data are consistent and in good agreement. The flow efficiency result of the numerical calculation is significantly greater than the flow efficiency result of the test, whereas the simulated head value is less than the test head value. The value of numerical computation is 3.36% greater than the test value under the optimal condition, and the value of the test head is 0.15% greater than that of the simulated head. This is because the flow in the front and rear chambers has a large impact on the turbine during the operation of the hydraulic turbine [26], which results in the difference between the numerical simulation results and the test results. However, according to the analysis of the test results and the numerical calculation results, the error is still within the acceptable range. This proves that the mesh type and the turbulence model used in the numerical calculation are feasible.
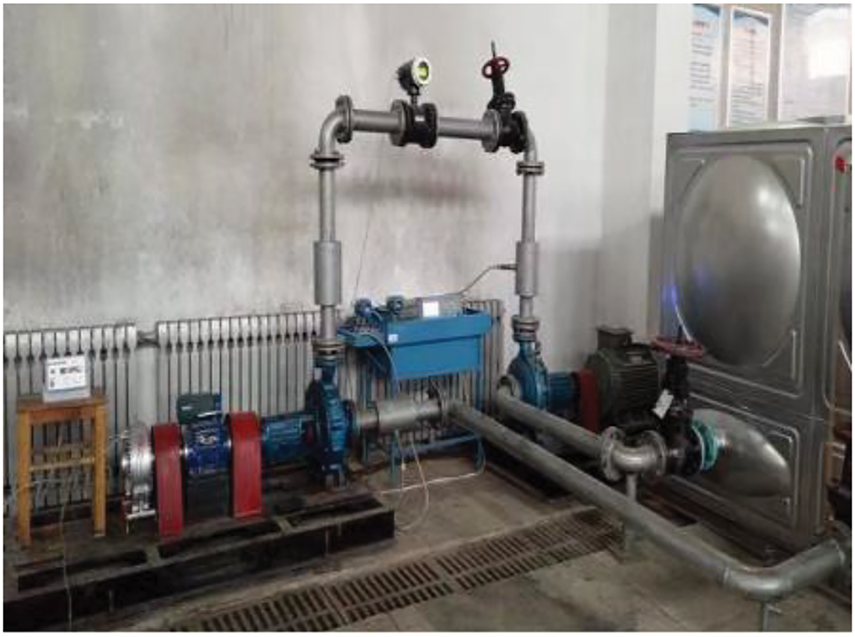
Figure 5: Hydraulic turbine test bench
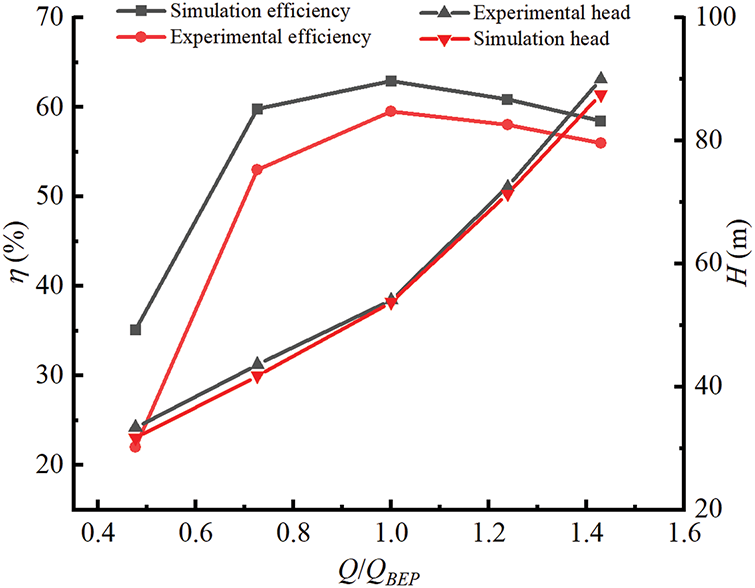
Figure 6: Comparison of experimental and numerical calculations
In this work, ANSYS-CFX software was used to numerically simulate all the overflow components of the PAT. The turbulence model was selected as the standard RNG (Renormalization Group) k-ε, and the internal flow state is described by the Reynolds-Averaged Navier–Stokes equations [27]. The momentum equation and the continuity equation were solved simultaneously by using the SIMPLEC algorithm [28], and the spatial discrete scheme adopts a second-order central difference. The fluid media studied in this paper were all clean water at normal temperature, the inlet boundary condition was normal speed, and the outlet condition was static pressure. The computational convergence accuracy was set to 10−6. The value of the solution time option was calculated to be 0.04 s. The unsteady calculation was set on the basis of the steady calculation setting. When the impeller rotates 2° in a time step, the impeller passes 180 time steps in a rotation cycle, and the calculated time step is △t = 2.299 × 10⁻⁴ s. The total calculation time T for a rotation cycle of PAT guide vanes is 3.311 × 10⁻¹ s. The impeller rotates 8 times in total, and the data of the last circle were selected for the research in this study.
3 Steady Numerical Calculation and Analysis
In this work, different geometric parameters with respect to the radial guide vane in the flow parts of the PAT were combined, and the orthogonal test design method was adopted. According to the orthogonal principle, only L16 (34) times are needed to obtain a model of a PAT with guide vanes, and the influence of different parameter combinations on the radial guide vanes on the hydraulic efficiency and water head of the PAT was analyzed.
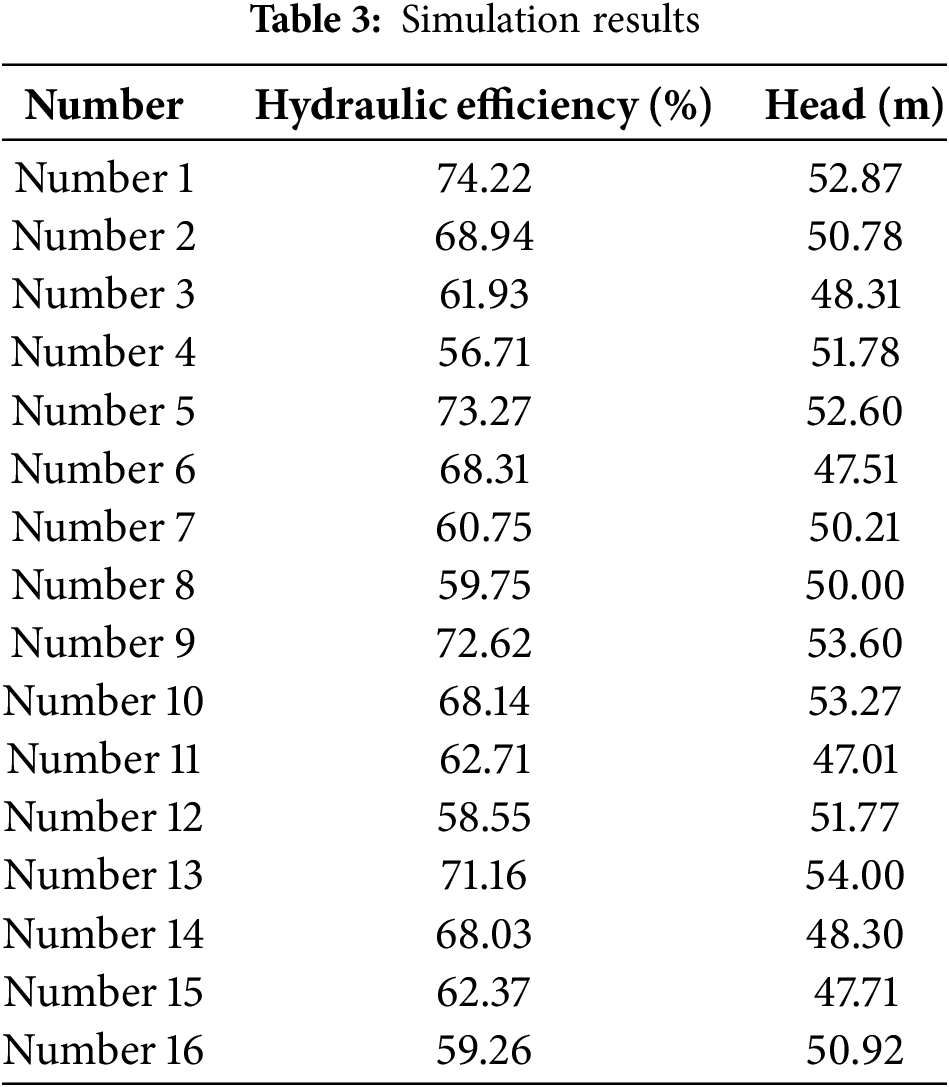
The 16 models in Table 2 were numerically calculated by using CFX, and the water head and hydraulic efficiency of 16 groups of PAT models with different combinations of radial guide vane geometric parameter were obtained under optimal working conditions (QBEP). Table 3 shows the simulation calculation results.
To evaluate the influence of the parameters selected by the radial guide vanes on the performance of the PAT, the advantages and disadvantages of the primary and secondary factors influencing the PAT and the specific levels were determined. The optimal parameter combination of the guide vane was sought, and range analysis was carried out on the results of the orthogonal test design, as shown in Table 4. The formula for calculating R is as follows:
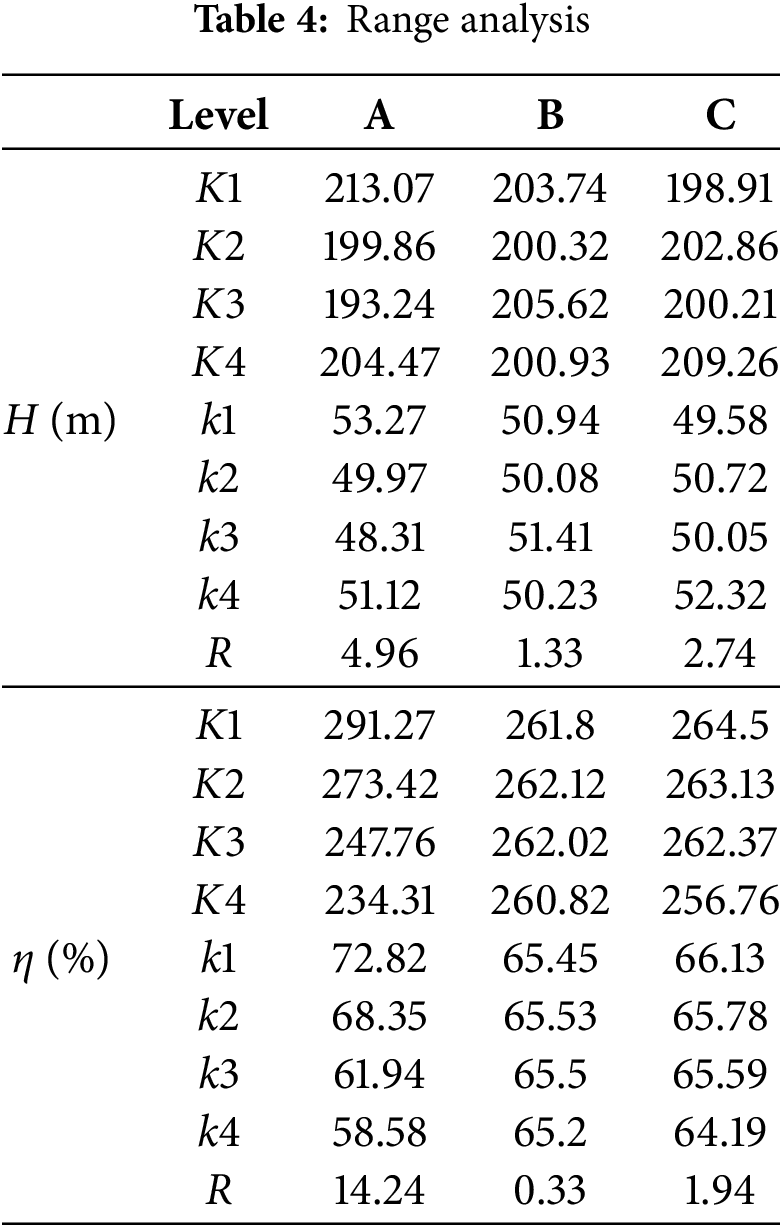
In Table 4, A is the number of radial guide vane blades, B is the outlet angle of the radial guide vanes, C is the radial height of the radial guide vanes, H is the water head of the PAT, η is the hydraulic efficiency, K is the accumulation of experimental data at the same level with the same factor, k is the average value of the experimental data at the same level with the same factor, and R represents the extreme value. According to the range analysis, the influence of the selected geometric parameters on the hydraulic efficiency and water head of the PAT with guide vanes is as follows: number of blades > radial height > outlet angle. Fig. 7 shows the relationships between hydraulic efficiency and various parameters. The figure also shows that the number of blades has the greatest influence on the hydraulic efficiency and water head of the PAT with guide vanes. Therefore, the numbers 1, 5, 9 and 13 with the highest hydraulic efficiency and water head were selected for further study.
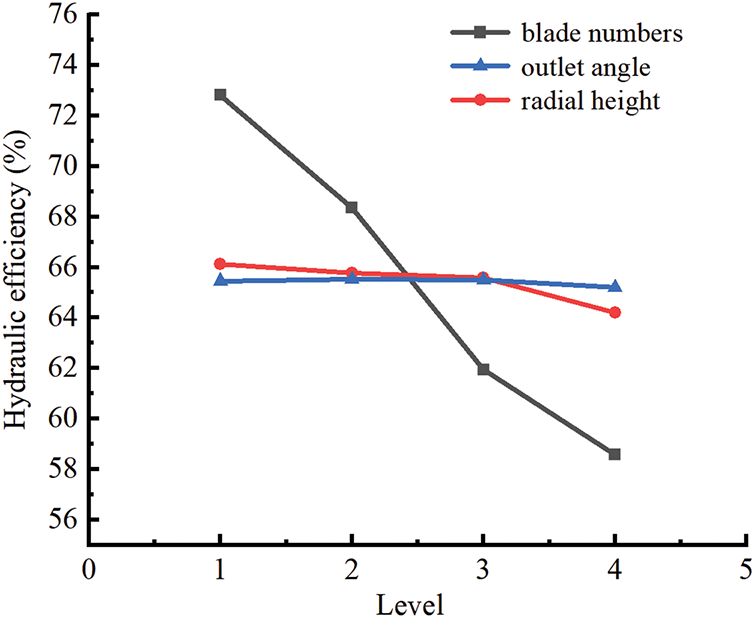
Figure 7: Relationship between hydraulic efficiency and parameters
3.3 Analysis of the Performance of the PAT
The hydraulic efficiency and water head of the 4 types of PAT with guide vanes under different working conditions were calculated by using CFX, and the calculation results are shown in Fig. 8.
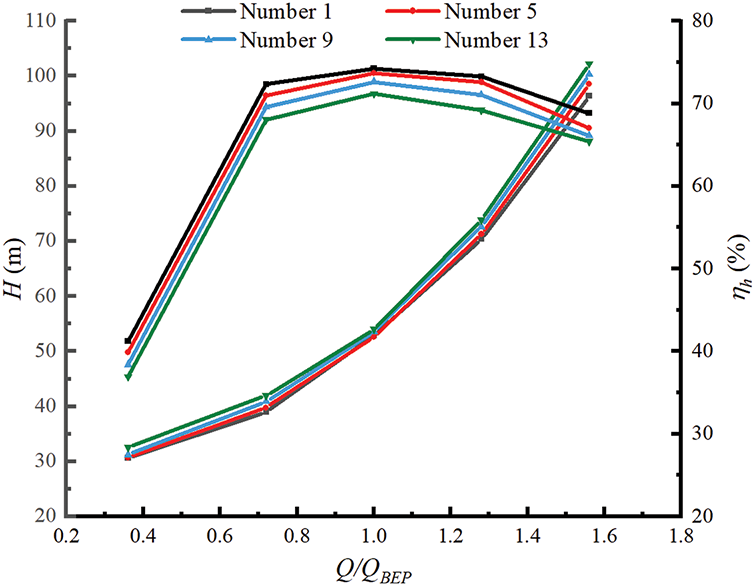
Figure 8: The performance curve of PAT with guide vaens
As shown in Fig. 8, the variation trends in the external characteristics of the four types of PATs with guide vanes are consistent, and the water head increases gradually with increasing flow rate, whereas the hydraulic efficiency first increases and then decreases with increasing flow rate. In this case, the working condition corresponding to the maximum hydraulic efficiency is the optimal working condition of the PAT. The figure shows that the optimal working conditions of the 4 models are all 1.0QBEP, and the hydraulic efficiency values under each working condition are in the following order: No. 1 > No. 5 > No. 9 > No. 13. The hydraulic efficiency of No. 1 in the 1.0QBEP is 4.31% higher than that of No. 13, while the value of the head under each working condition is No. 13 > No. 9 > No. 5 > No. 1. The water head changes the most under the 1.56QBEP working condition, where the water head of No. 13 is 6.03% greater than that of No. 1. Under low flow conditions and optimal conditions, the heads of the different models change little.
3.4 Turbulence Kinetic Energy Distribution
Under normal circumstances, the turbulence kinetic energy is used mainly to measure the degree of energy loss during turbulent pulsation. The degree of turbulence kinetic energy represents the degree of energy dissipation in the process of converting mechanical energy into heat energy in the flow process. The specific expression of the turbulence kinetic energy TKE can be expressed as follows:
where u is the initial velocity (m/s) and I is the initial turbulence intensity.
Fig. 9 shows the turbulence kinetic energy distributions of the four groups of models in the circumferential direction of the impeller at 0.5 times the height of the cascade under the best efficiency points. It can be concluded from the figure that under the best efficiency points, the distributions of the turbulence kinetic energy of blade expansion on different model impellers are more consistent. There are regions with high local turbulence kinetic energy at the impeller inlet. The main reason is that with increasing outlet angle and height of the radial guide blade, the flow area at the inlet of the impeller blade increases, resulting in a decrease in the restriction ability of the impeller blade to the liquid. The enhanced rotor–stator interaction between the radial guide blade and the impeller leads to enhanced turbulent kinetic energy dissipation at the impeller blade inlet and at the blade root, and the turbulent kinetic energy dissipation at the blade root of model 13 is the strongest.
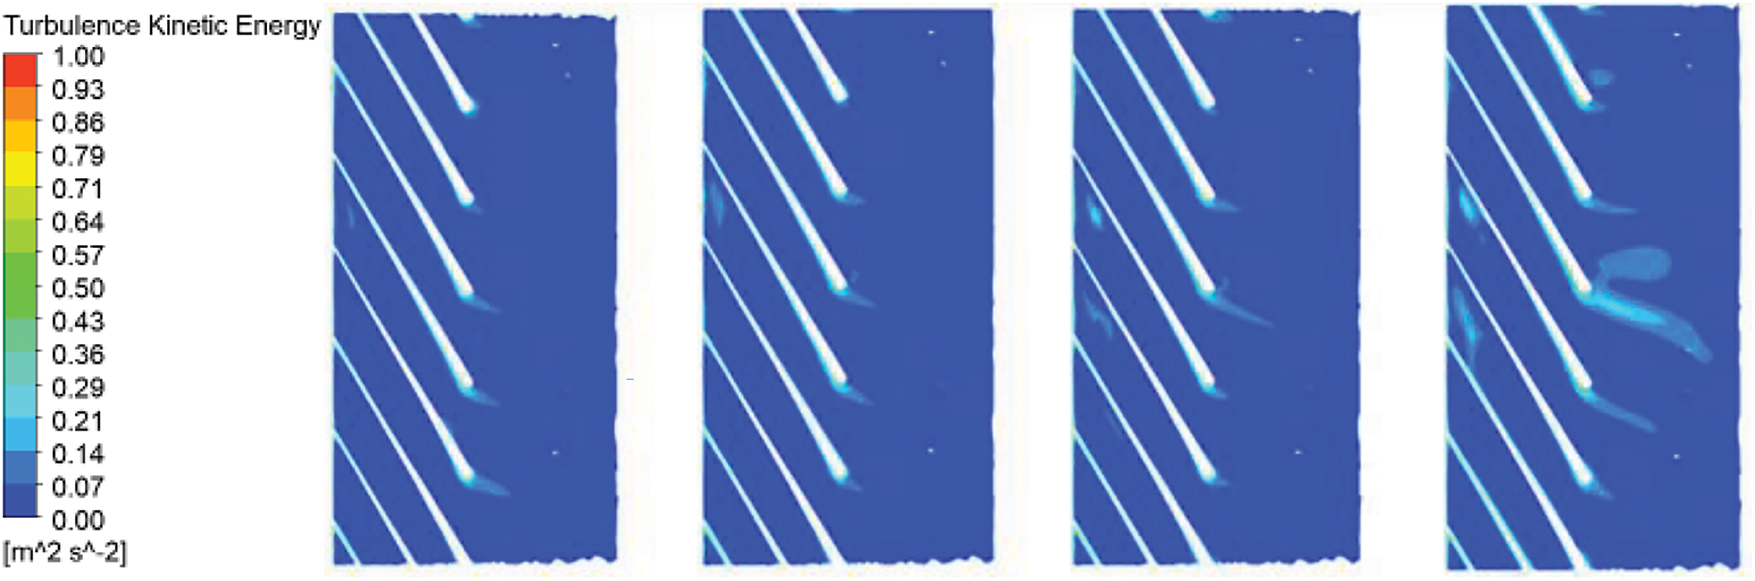
Figure 9: Distribution of turbulence kinetic energy of different models under best efficiency points (1.0QBEP)
4 Unsteady Numerical Simulation
Fig. 10 shows the blade load distribution of the guide blade PAT under different flow rate conditions. The figure shows that the blade load distribution of the guide blade PAT is complex under different flow rate conditions. Under different flow rate conditions, the blade load from the impeller inlet diameter to the outlet diameter first increases but then decreases slowly. With increasing flow, the blade load at the impeller outlet diameter becomes more concentrated. Under low flow rate conditions, the blade loads of the four groups of models within the radius R = 0.1575−0.1423 m are negative. This finding indicates that the liquid does not push the runner to work in this area and that the blades do not work but hinder the rotation of the impeller. With increasing flow rate, the area of this area gradually decreases. Under the best conditions, the liquid pushes the blades and starts to do work when it enters the impeller. At radii of R = 0.1575−0.0831 m, the blade load first increases rapidly to the maximum value. Then, the blade load distribution in the impeller outlet region becomes more stable, which is also one of the reasons for the relatively higher efficiency under the optimal working conditions. Under the condition of high flow, the blade load distribution first increases and then decreases rapidly, and the energy conversion between pressure energy and mechanical energy greatly affects the efficiency and safe and stable operation of the guide blade PAT. In addition, the four groups of models have a direct effect on the load distribution of the impeller blade because of the change in the diameter guide blade parameters. Under low flow conditions, the blade load distribution is disordered, and the law is not obvious. At the optimal condition of R = 0.1575−0.1099 m and the high flow condition of R = 0.1575−0.1045 m, the blade load distribution of impeller No. 1 is greater than that of impeller No. 5, impeller No. 9 and impeller No. 13. This shows that the smaller the outlet angle and the radial height of the radial guide blade are, the greater the influence on the blade load distribution when fluid enters the impeller. As the fluid continues to flow to the impeller outlet, the influence of the radial guide blade on the blade load distribution gradually decreases.
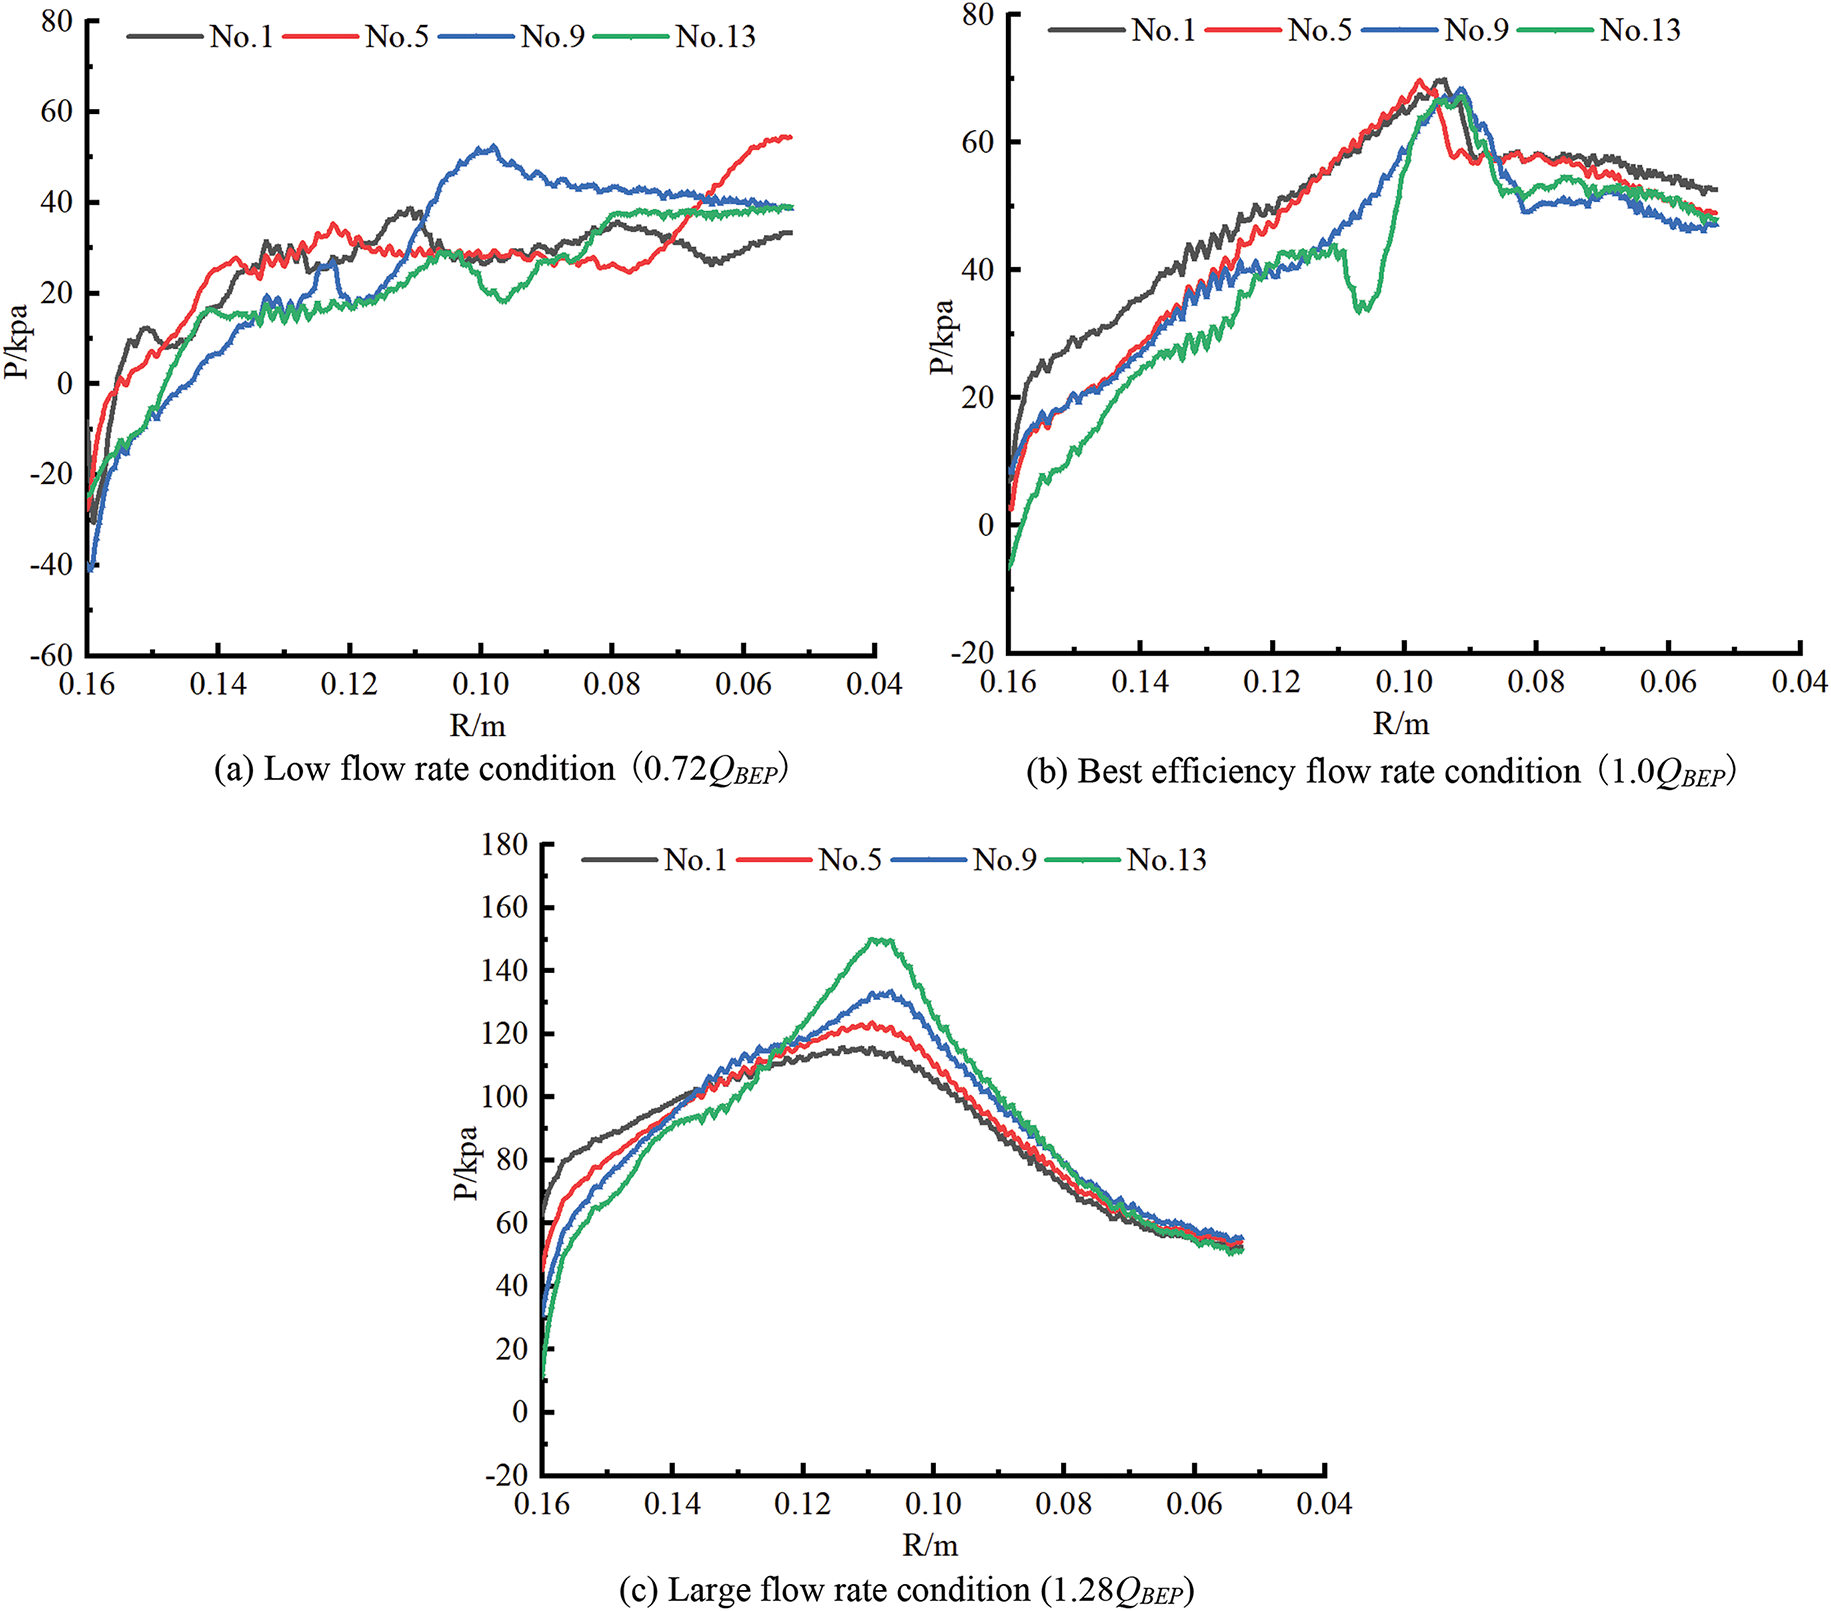
Figure 10: Load distribution of impeller blades of different models under different conditions
4.2 Transient Axial Force Simulation
The rotation axis of all the models in this paper is the Z-axis. The value of the transient axial force Fz under each condition was obtained by setting a user-defined function in the CFX code, and the dimensionless axial coefficient was introduced. Its calculation formula is expressed as follows:
where Fz is the transient axial force, N; r2 is the impeller radius, m; and H is the hydraulic turbine head, m.
Fig. 11 shows the time domain of the axial force on different model impellers. The transient axial force formula was used to calculate the unsteady axial force, and the time domain of the axial force coefficient of the guide blade PAT with different models under different conditions was obtained. Under different flow rate conditions, the axial force coefficient of the PAT with different guide blade geometric parameters changes periodically with time, and the number of cycles is equal to the number of impeller blades. With increasing flow rate, the axial force coefficient on the impeller gradually decreases, and the axial force coefficient curve of the different models increases but then decreases. Subsequently, the coefficient increases to the maximum value between two neighboring blades, whereas the variation range of the axial force coefficient of model 13 is more obvious. The axial force variation of the different models under low flow rate conditions is as follows: model No. 9 > No. 5 > No. 13 > No. 1. The maximum axial force of model No. 5 is 3.25% greater than that of No. 13, whereas the minimum axial force of No. 9 is 2.31% greater than that of No. 13. The axial force variation under the best and high flow rate conditions is as follows: No. 13 > No. 9 > No. 5 > No. 1. The axial coefficient of model No. 1 is 1.47% greater than that of model No. 13 under the best conditions and 2.01% greater than that of model No. 13 under high flow rate conditions. The axial force of model No. 1 is the smallest, and the axial force coefficient of model No. 13 is the largest under low flow rate and high flow rate conditions. The axial force coefficients of the four groups of models changed the least under the best conditions.
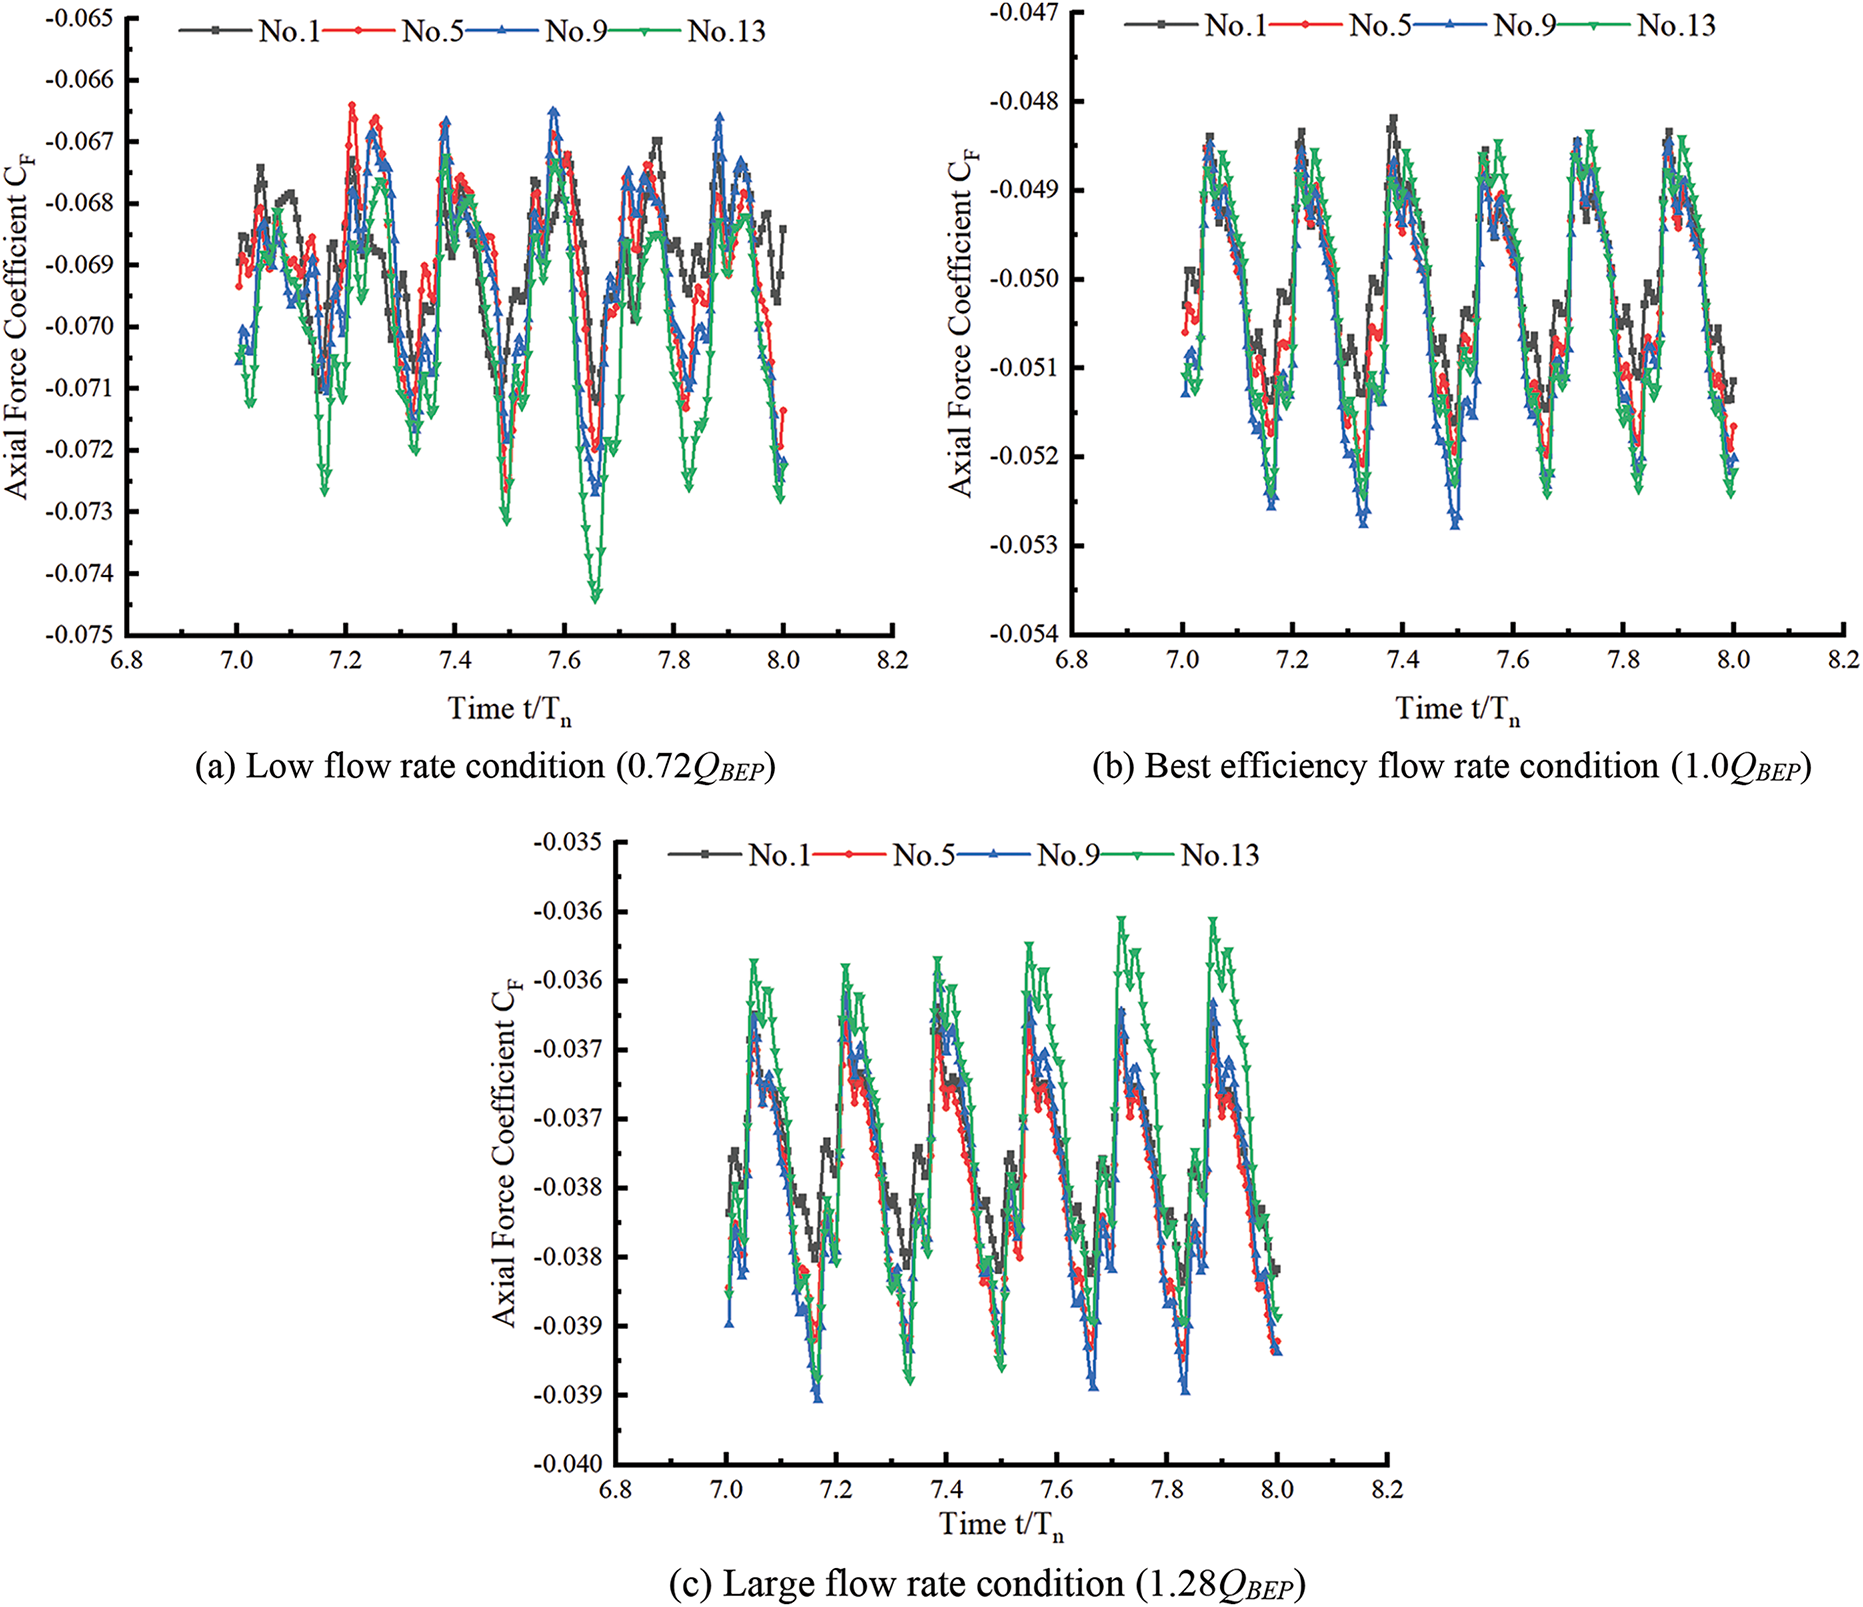
Figure 11: Time domain figure of axial force on different model impellers under different conditions
4.3 Transient Radial Force Simulation
To systematically analyze the generation mechanism of vibration and noise during the operation of the guide blade PAT, the influence of the geometric parameters of the radial guide blade on the transient radial force of the impeller was investigated. The transient radial force vectors under the best condition (1.0 QBEP) and high flow rate condition (1.28 QBEP) were analyzed and compared. The rotating axis of the guide blade PAT model is the Z-axis, and the value of the radial force is as follows:
where
Fig. 12 shows the radial force vector distribution of the impeller of the guide blade PAT with the best combination of radial guide blade parameters under different conditions. The monitoring points in the figure show the distribution of the radial force of the impeller at different times during the last revolution of the PAT in the unsteady calculation. The figure shows that in a rotation cycle, the radial force vector changes periodically in the four quadrants under different flow rate conditions. In addition, the number of cycles is the same as the number of impeller blades, indicating that the size and distribution of the radial force vector are related to the rotation of the impeller. The distribution of the radial force vector under low flow rate conditions is unclear and disordered, and the value of the radial force vector is densely distributed near the zero radial force value. This proves that the force distribution of the radial guide blade under low flow rate conditions is uneven. Furthermore, long-term operation under low flow rate conditions results in hidden dangers and affects the service life of the PAT. The radial force distribution becomes more uniform and regular, and its value gradually deviates from the zero radial force value and is symmetrically distributed at the central origin. Under different flow rate conditions, the size of the radial force vector exhibits the following sequence: No. 1 < No. 5 < No. 9 < No. 13. Moreover, the values of the components
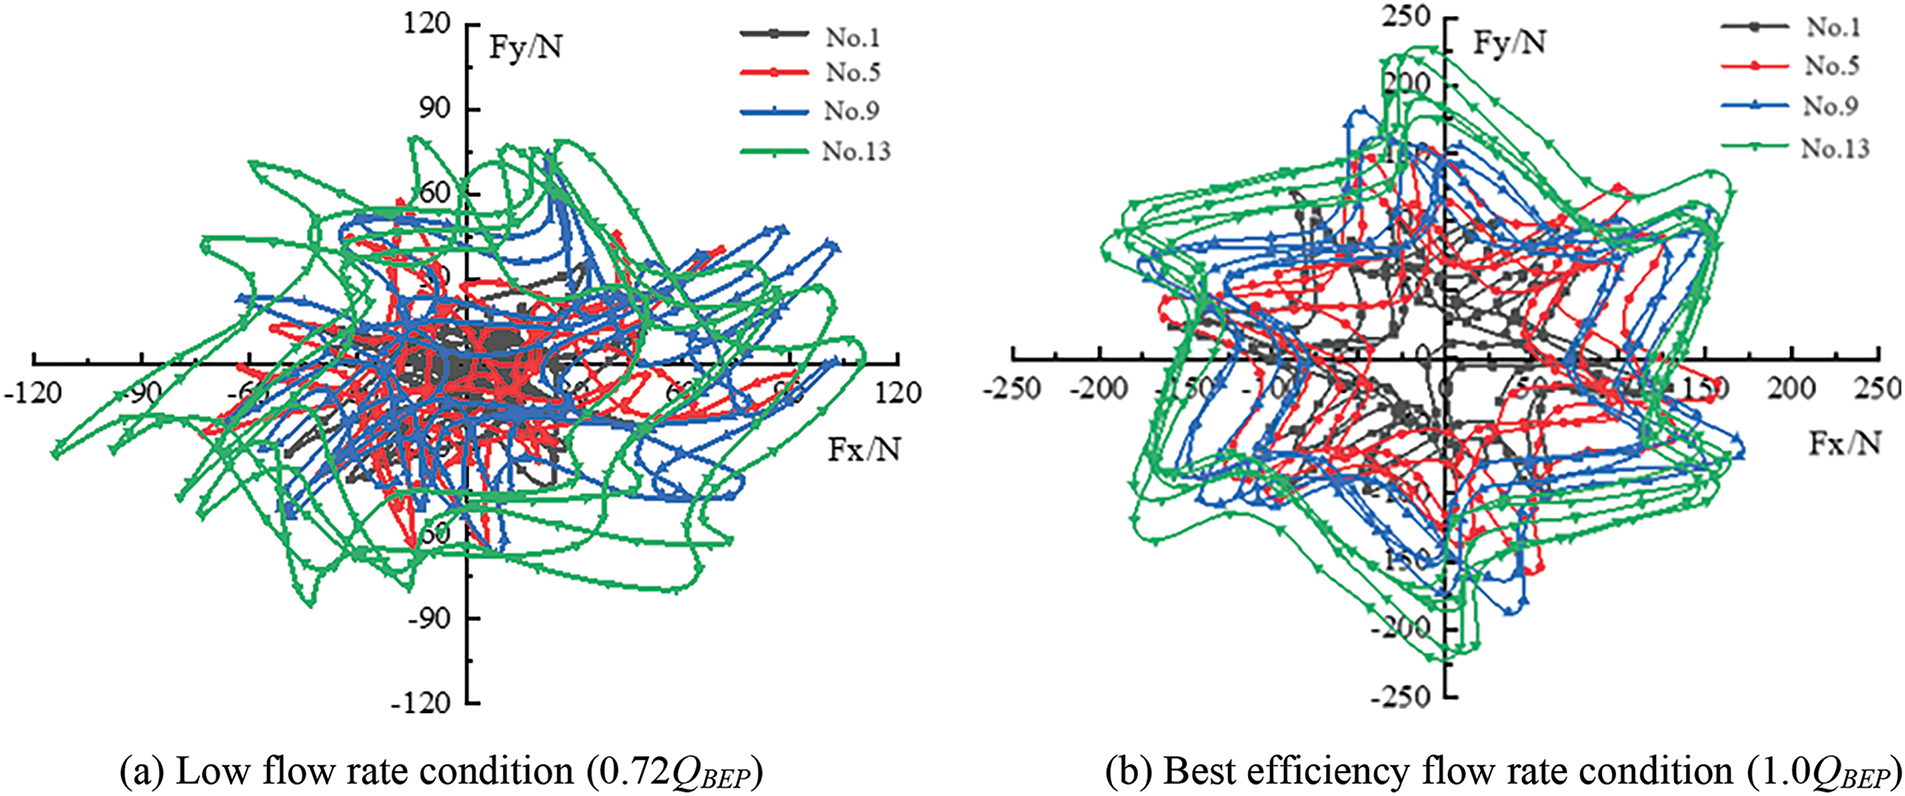
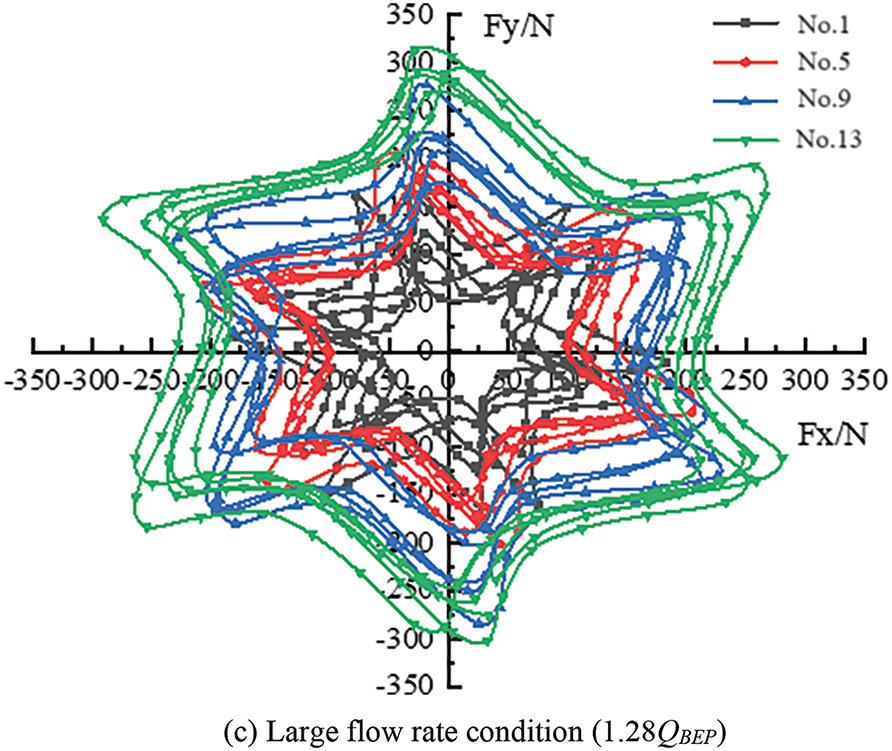
Figure 12: Radial force vector distribution of different model impellers of guide blade pump as turbine under different conditions
To further study the influence of the guide blade parameters on the radial force of the guide blade PAT, the variation in the radial force in a rotation cycle of the four groups of models under different flow rate conditions is taken as the time length. The time domain of the radial force in a rotation cycle is explored, as shown in Fig. 13. The results indicate that the time domain of the radial force of different models reveals the same trend under different flow rates. The fluctuation range is in the following order: No. 13 > No. 9 > No. 5 > No. 1; there are periodic changes equal to the number of impeller blades. When the time is 7.77 t/Tn under low flow rate conditions, the radial force of the four groups of models is the largest, and the radial force value of model No. 9 is 25.67% greater than that of model No. 13. Under the best conditions, the maximum radial force of model No. 5 and model No. 9 between different impeller blades remains the same, whereas the radial force of model No. 1 and model No. 13 between different blades exhibits a greater change. The maximum radial force value of No. 13 is 42.28% greater than that of No. 1. Under the condition of a high flow rate, the radial force distribution of the four groups of models is more stable and has an obvious gradient.
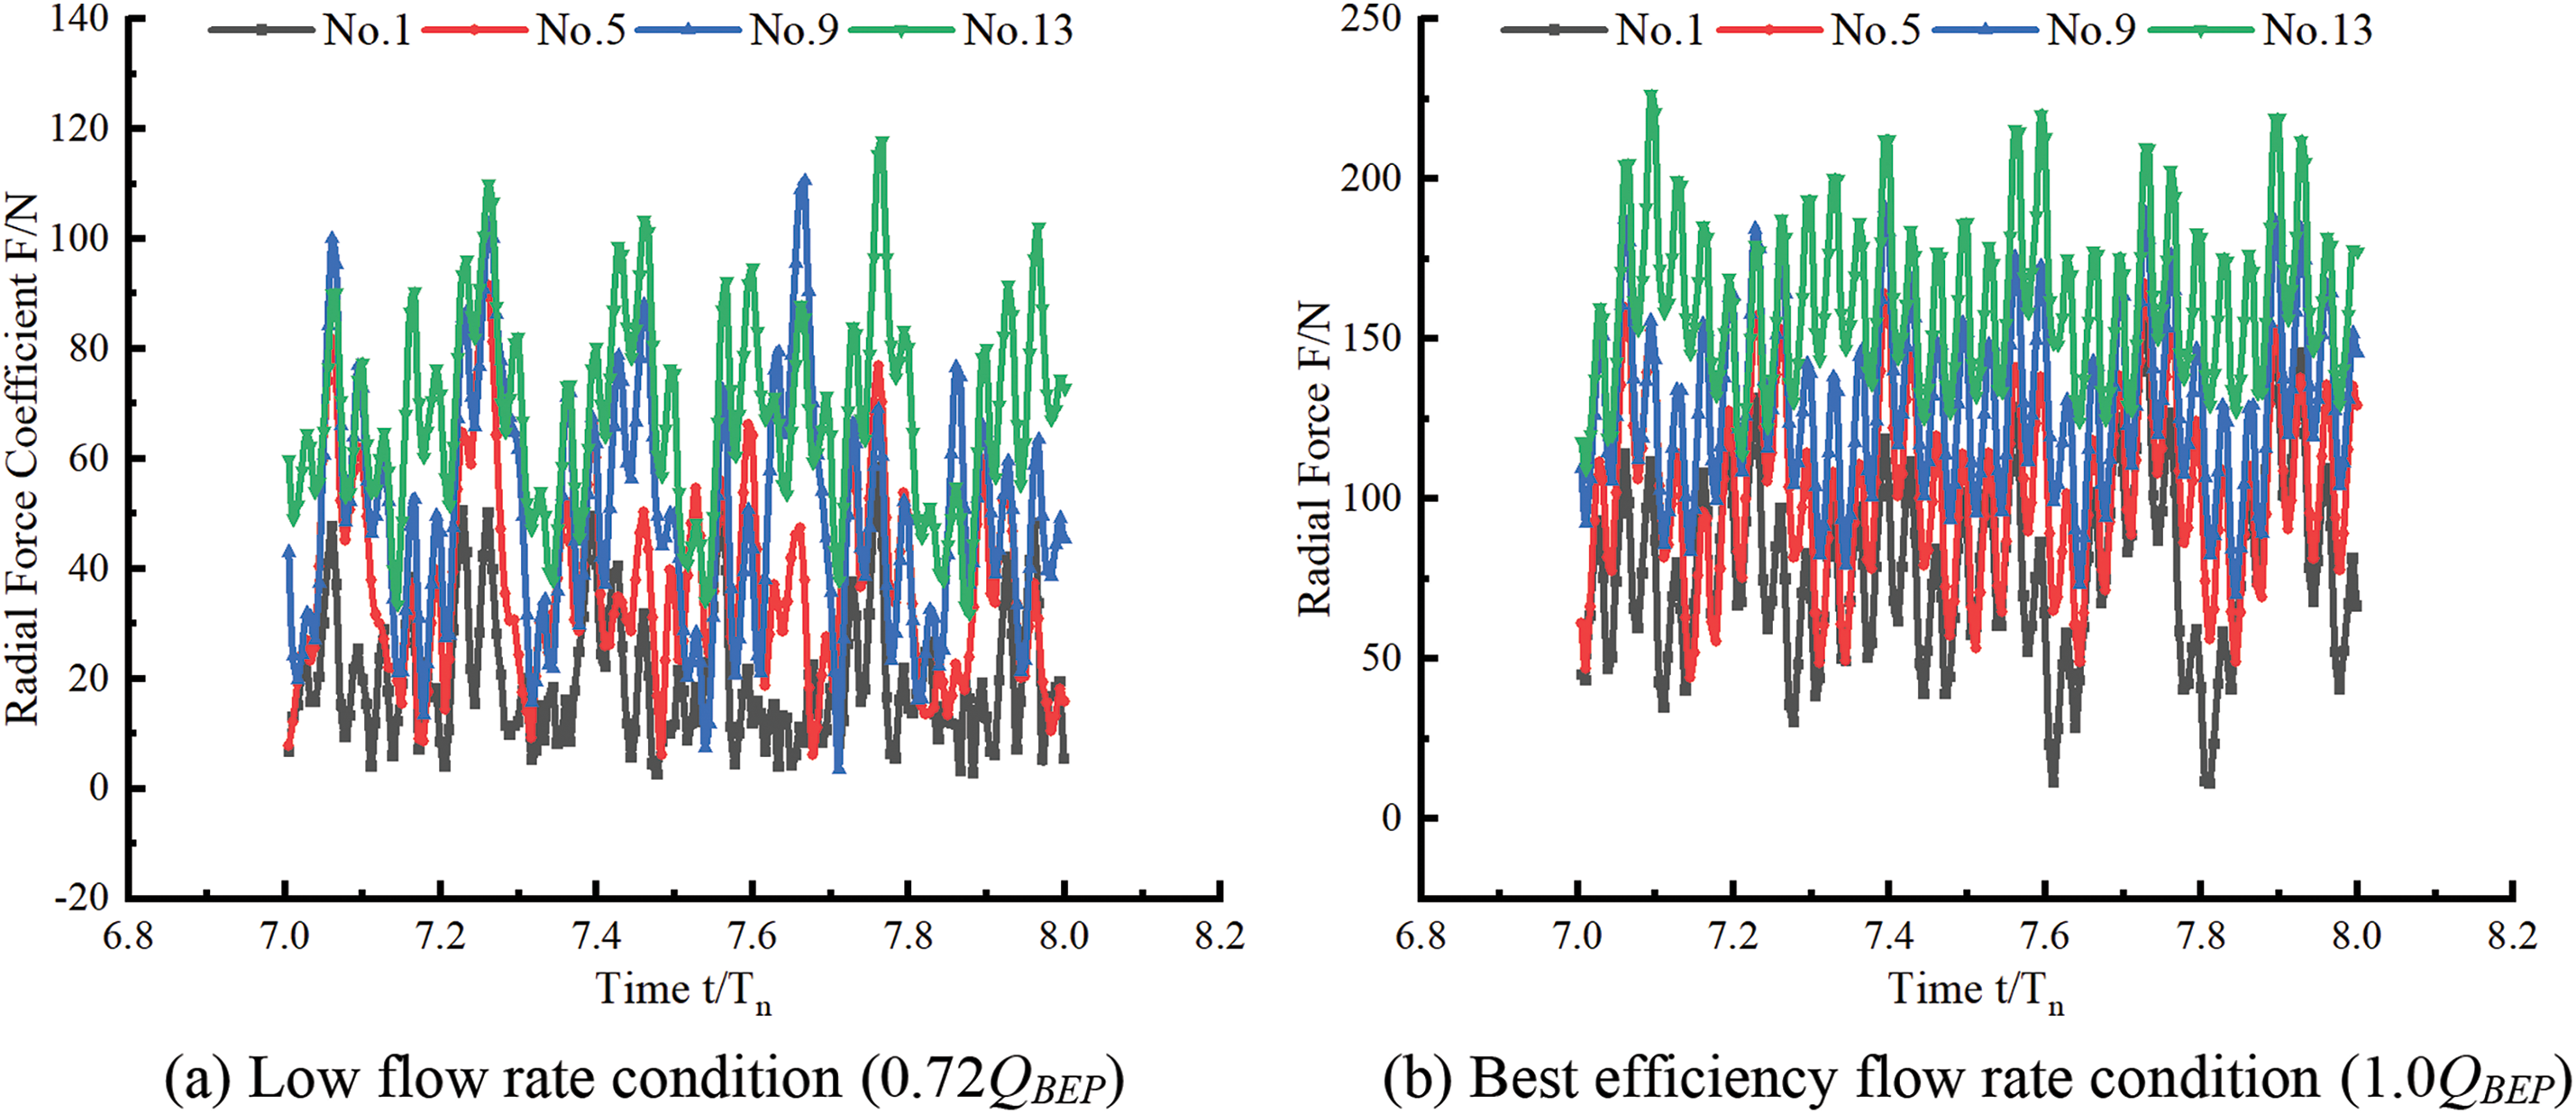
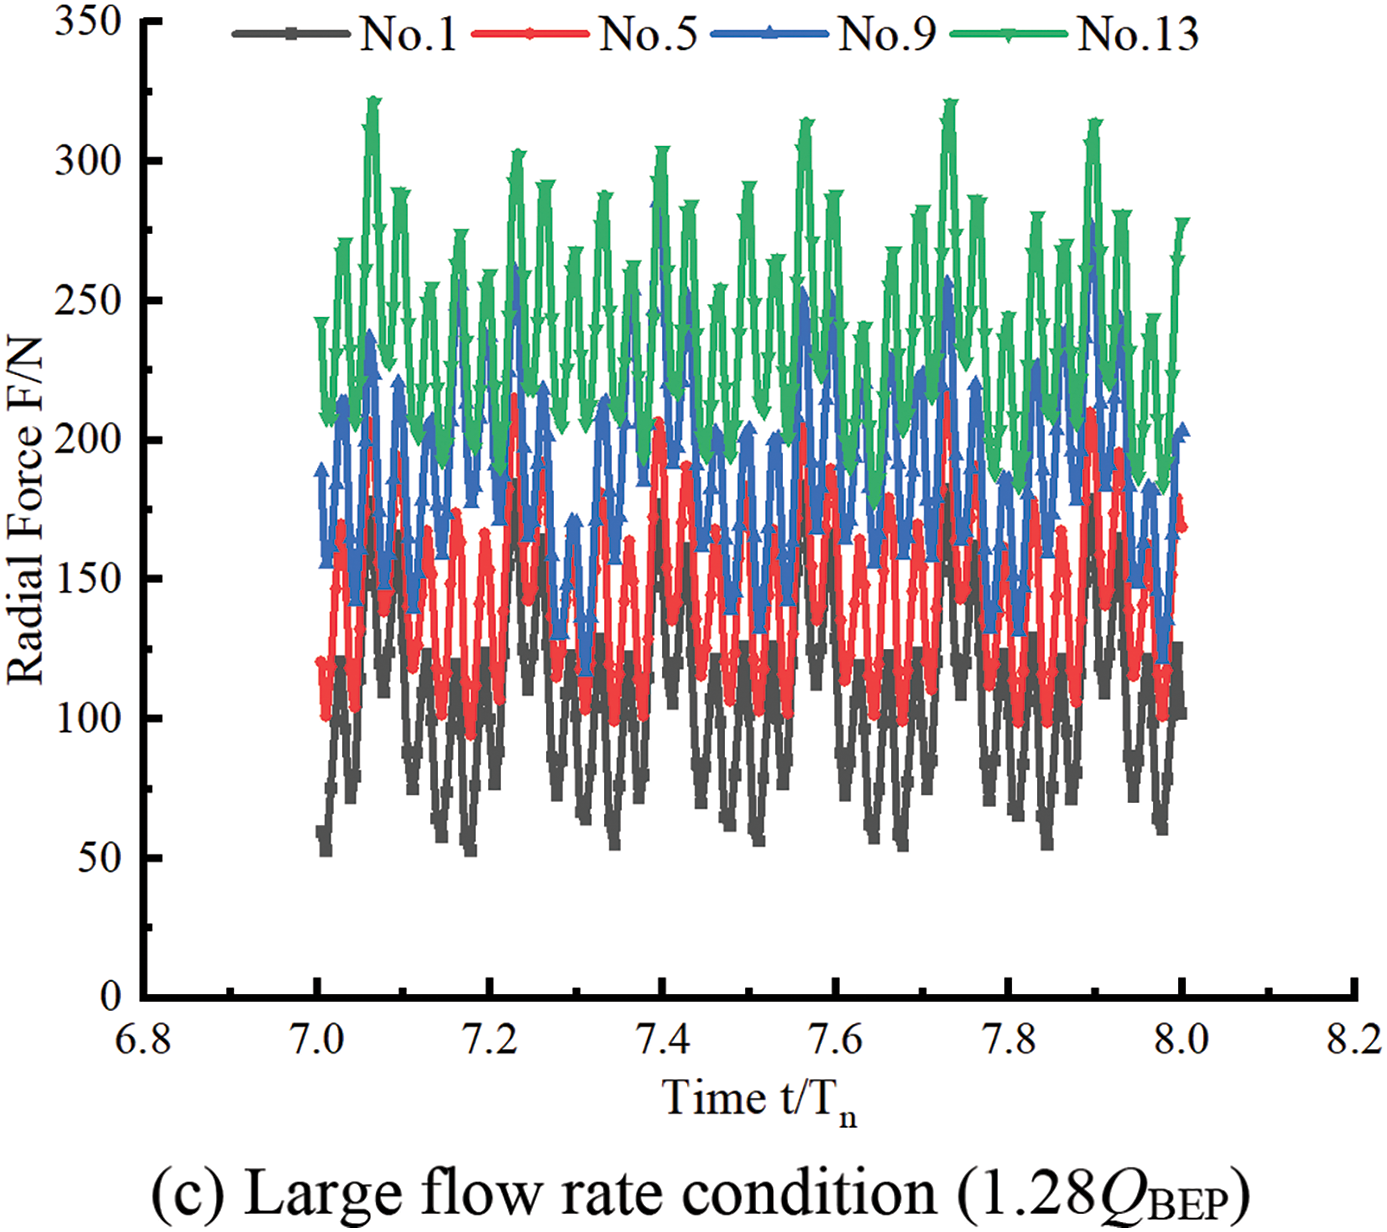
Figure 13: Time domain figure of radial direction force on different model impellers of guide blade pump as turbine under different conditions
The radial force of the last cycle of the unsteady calculation results of the four groups of models was selected, and the fast Fourier transform (FFT) was used to obtain the frequency graph of the radial force of the four groups of models under different conditions. As shown in Fig. 14, the abscissa is the frequency, and the ordinate is the amplitude of the radial force. The results indicate that the fluctuation amplitude of the radial force resultant force under different flow rate conditions is as follows: model No. 13 > No. 9 > No. 5 > No. 1. The radial force of the impeller fluctuates greatly in frequency under low flow rate conditions, and the variation in the radial guide blade parameters strongly affects the radial force on the impeller. The basic frequency amplitude of the pressure fluctuation of model No. 13 is 3.44 times greater than that of model No. 1 under low flow rate conditions. This finding indicates that when the outlet angle and radial height of the radial guide blade are small, the generation of vibrational signals can be reduced, and the stability during operation can be improved.
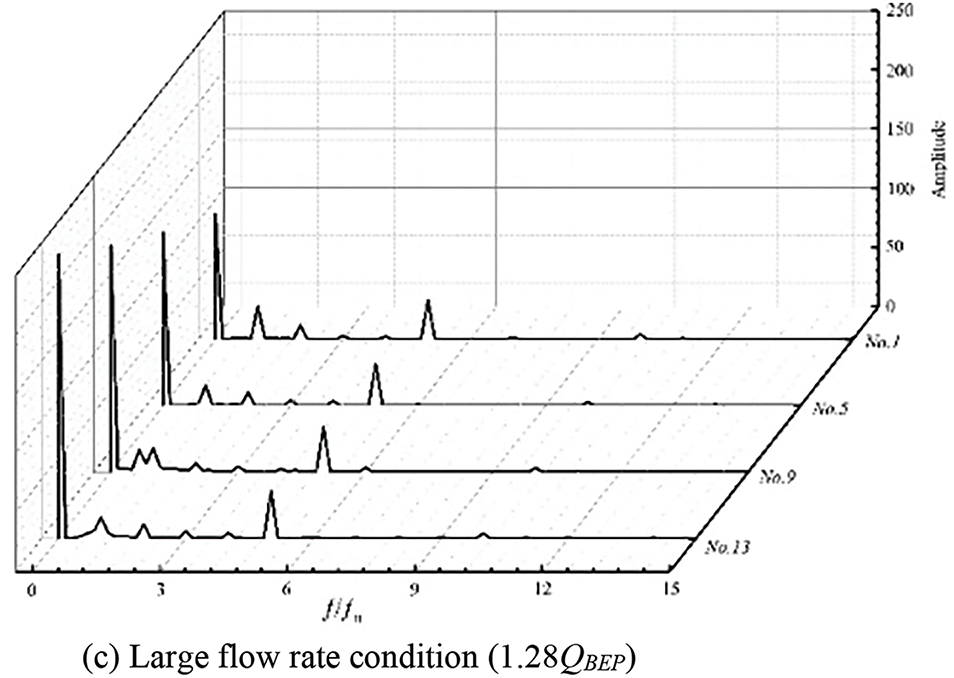
Figure 14: Frequency figure of radial force of different model impellers under different conditions
In this work, by adding a radial guide blade in front of the inlet of a low specific speed PAT impeller, and by combining the different geometric parameters of the radial guide blade by using orthogonal experiments, the best combination scheme is obtained. The following conclusions are obtained through comparative analysis:
(1) Through range analysis, the influence of various parameters of the radial guide blade on the hydraulic efficiency and the water head of the PAT under the best efficiency point condition is as follows: the influence of the number of blades is greater than that of the radial height is greater than that of the outlet angle. The best combination is when the number of guide blades is 5, the outlet angle is 6°, and the radial height is 46 mm.
(2) Under the best efficiency point conditions, there are regions with large local turbulent kinetic energy at the impeller inlet. This is because with increasing outlet angle and height of the radial guide blade, the flow area at the inlet of the impeller blade increases, resulting in a decrease in the restriction ability of the impeller blade to the liquid. The turbulent kinetic energy dissipation capacity at the impeller blade inlet and blade root is enhanced owing to the enhanced rotor–stator interaction between the radial guide blade and the impeller. The blade load distribution from the impeller inlet to the outlet first increases to the maximum value and then decreases slowly. When the outlet angle and radial height of the radial guide blade are small, the influence on the blade load distribution when the fluid enters the impeller is more obvious.
(3) The axial force coefficient of the guide blade pump as the turbine changes periodically with time and the number of cycles is equal to the number of blades. With increasing flow, the axial force coefficient decreases, and the radial force changes periodically in a rotation cycle. Its value gradually moves away from the zero radial force value and is symmetrically distributed with increasing flow rates. The variation rules of the radial force time domain under different flow rates are the same, and there are periodic changes equal to the number of impeller blades.
(4) Among the four models under optimal working conditions, model No. 1 has the highest hydraulic efficiency. Additionally, model No. 1 has the smallest variation range in axial force and experiences the greatest blade load within the radial distance of R = 0.1575–0.1099 m. Under varying flow conditions, model No. 1 also has the smallest radial force vector and the lowest pulsation amplitude of the resultant radial force compared with those of the other three models.
Acknowledgement: Not applicable.
Funding Statement: The authors would like to thank the support of the Innovation Fund for College Teachers of Department Education of Gansu (No. 2024A-021), Colleges and Universities Industrial Support Program Projects of Gansu Province (Grant No. 2020C-20), Key Laboratory of Fluid and Power Machinery, Ministry of Education, Xihua University (Grant Nos. szjj2019-016, LTDL2020-007) and Key Research and Development Program of Gansu Province-Industrial Project (No. 25YFGA021).
Author Contributions: The authors confirm contribution to the paper as follows: study conception and design: Fengxia Shi, Pengcheng Wang; data collection: Pengcheng Wang, Haonan Zhan, Xiangyun Shi; analysis and interpretation of results: Pengcheng Wang, Haonan Zhan, Xiangyun Shi; draft manuscript preparation: Pengcheng Wang. All authors reviewed the results and approved the final version of the manuscript.
Availability of Data and Materials: The data that support the findings of this study are available from the corresponding author, upon reasonable request.
Ethics Approval: Not applicable.
Conflicts of Interest: The authors declare no conflicts of interest to report regarding the present study.
Nomenclature
| D1 | Impeller inlet diameter (mm) |
| D2 | Impeller outlet diameter (mm) |
| dh | Hub diameter (mm) |
| b1 | Inlet width (mm) |
| Z | Impeller blade numbers |
| D3 | Volute base circle diameter (mm) |
| b3 | Volute outlet width (mm) |
| D | Volute inlet diameter (mm) |
| Greek Symbols | |
| Inlet Placement Corner (°) | |
| Blade Wrapping angle (°) | |
References
1. Wang X, Yang J, Shi F. Research status and prospect of energy recovery hydraulic turbines. J Drain Irrig Mach Eng. 2014;32(9):742–47. doi:10.3969/j.issn.1674-8530.14.0115. [Google Scholar] [CrossRef]
2. Carravetta A, Derakhshan Houreh S, Ramos HM. Pumps as turbines fundamentals and applications introduction. Berlin: Springer-Verlag; 2018. [Google Scholar]
3. Gao Z, Zhu W, Lu L, Deng J, Zhang J, Wuang F. Numerical and experimental study of unsteady flow in a large centrifugal pump with stay vanes. J Fluids Eng. 2014;136(9):071101. doi:10.1115/1.4026477. [Google Scholar] [CrossRef]
4. Guleren KM, Pinarbasi A. Numerical simulation of the stalled flow within a vaned centrifugal pump. Proc Inst Mech Eng C J Mech Eng Sci. 2004;218(4):425–35. doi:10.1177/095440620421800407. [Google Scholar] [CrossRef]
5. Inoue M, Cumpsty N. Experimental study of centrifugal impeller discharge flow in vaneless and vaned diffusers. J Eng Gas Turbines Power. 1984;106(2):455–67. doi:10.1115/1.3239588. [Google Scholar] [CrossRef]
6. Venturini M, Manservigi L, Alvisi S, Simani S. Development of a physics-based model to predict the performance of pumps as turbines. Appl Energy. 2018;231:343–54. doi:10.1016/j.apenergy.2018.09.054. [Google Scholar] [CrossRef]
7. Maleki A, Ghorani MM, Sotoude Haghighi MH, Riasi A. Numerical study on the effect of viscoscity on a multistage pump running in reverse mode. Renew Energy. 2020;150(4):234–54. doi:10.1016/j.renene.2019.12.113. [Google Scholar] [CrossRef]
8. Singh P, Nestmann F. An optimization routine on a prediction and selection model for the turbine operation of centrifugal pumps. Exp Therm Fluid Sci. 2010;34(2):152–64. doi:10.1016/j.expthermflusci.2009.10.004. [Google Scholar] [CrossRef]
9. Yang J, Gong Z, Xia S, Luo K, Li H. Numerical analysis on influence of guide vanes on performance of centrifugal pump acting as hydraulic turbine. J Drain Irrig Mach Eng. 2014;32(2):113–8. doi:10.3969/j.issn.1674-8530.13.0056. [Google Scholar] [CrossRef]
10. Wang S, Yang J, Xu G. Influence of positive guide vane geometric parameters on power-flow curves of multistage pump as turbine. Trans Chin Soc Agric Mach. 2023;54(12):166–72. doi:10.3390/pr11123393. [Google Scholar] [CrossRef]
11. Miao S, Zhang J, Wang X, Shi F, Yang J. Effect of inlet and outlet angles of positive guide vanes on performance of multistage hydraulic turbine. J Hydroelectr Eng. 2023;42(3):60–9. doi:10.11660/slfdxb.20230306. [Google Scholar] [CrossRef]
12. Ventrone G, Ardizzon G, Pavesi G. Direct and reverse flow conditions in radial flow hydraulic turbomachines. Proc Inst Mech Eng A-J Power Energy. 2000;214(6):635–44. doi:10.1243/0957650001538155. [Google Scholar] [CrossRef]
13. Chai L, Huang X, Zou W, Pan Y, Yang Z. Influence of number of guide vanes on performance of inverted turbine of multistage centrifugal pump. China Rural Water Hydropower. 2018;5:181–85. [Google Scholar]
14. Li Y, Jiang Y, Zhang Z, Chen D. Performance analysis of a new type of space guide vane for T-type hydraulic turbine. IOP Conf Ser: Earth Environ Sci. 2021;774(1):012099. doi:10.1088/1755-1315/774/1/012099. [Google Scholar] [CrossRef]
15. Schennach O, Woisetschläger J, Marn A, Göttlich E. Laser-Doppler-velocimetry measurements in a one and a half stage transonic test turbine with different angular stator-stator positions. Exp Fluids. 2007;43(2–3):385–93. doi:10.1007/s00348-007-0285-3. [Google Scholar] [CrossRef]
16. Jia H, Xi G, Müller L, Mailach R, Vogeler K. Effect of clocking on unsteady rotor blade loading in a low-speed axial compressor at design and off-design operating conditions. Proc Inst Mech Eng G-J Aerospace-Eng. 2008;222(6):895–906. doi:10.1243/09544100JAERO262. [Google Scholar] [CrossRef]
17. Ren X, Gu C. Investigation on clocking effect of 1.5-stage transonic compressor. J Aerospace Power. 2010;25(4):891–96. [Google Scholar]
18. Sun Q. Research on the influence of centrifugal pump blade profile on pump performance. China: Lanzhou University of Technology; 2011. [Google Scholar]
19. Al-Obaidi AR, Alhamid J. Analysis of unsteady internal flow characteristics in axial pump with varying number of blades using computational modelling and vibration techniques. Flow Meas Instrum. 2024;99(6):102654. doi:10.1016/j.flowmeasinst.2024.102654. [Google Scholar] [CrossRef]
20. Bhukya NK, Rai AK. Effect of wrap angle on performance of Pump As Turbine (PAT) in both pump and turbine modes. IOP Conf Ser Earth Environ Sci. 2024;1411(1):012029. doi:10.1088/1755-1315/1411/1/012029. [Google Scholar] [CrossRef]
21. Kim S-J, Suh J-W, Yang H-M, Park J, Kim J-H. Internal flow phenomena of a Pump-Turbine model in turbine mode with different Thoma numbers. Renew Energy. 2022;184(3):510–25. doi:10.1016/j.renene.2021.11.101. [Google Scholar] [CrossRef]
22. Wang Z, Wang W, Wang D, Song Y. Numerical analysis of energy loss characteristics of guide vane centrifugal pump as turbine. Front Energy Res. 2024;12:1410679. doi:10.3389/fenrg.2024.1410679. [Google Scholar] [CrossRef]
23. Stefan D, Rossi M, Hudec M, Rudolf P, Nigro A, Renzi M. Study of the internal flow field in a pump-as-turbine (PaTnumerical investigation, overall performance prediction model and velocity vector analysis. Renew Energy. 2020;156(2):158–72. doi:10.1016/j.renene.2020.03.185. [Google Scholar] [CrossRef]
24. Wang X, Yang J, Guo Y, Xia Z, Miao S. Research on slip phenomenon of pumps as turbines. J Mech Eng. 2018;54(24):189–96. doi:10.3901/JME.2018.24.189. [Google Scholar] [CrossRef]
25. Guan X. Modern pumps theory and design. Beijing, China: China Aerospace Publishing House; 2011. [Google Scholar]
26. Derakhshan S, Nourbakhsh A. Theoretical, numerical and experimental investigation of centrifugal pumps in reverse operation. Exp Therm Fluid Sci. 2008;32(8):1620–27. doi:10.1016/j.expthermflusci.2008.05.004. [Google Scholar] [CrossRef]
27. Abo Elyamin GRH, Bassily MA, Khalil KY, Gomaa MS. Effect of impeller blades number on the performance of a centrifugal pump. Alex Eng J. 2019;58(1):39–48. doi:10.1016/j.aej.2019.02.004. [Google Scholar] [CrossRef]
28. Kang C, Cao Q, Teng S, Liu H, Ding K. Wear characteristics of a centrifugal pump transporting solid-liquid mixture: an experimental and numerical study. Ain Shams Eng J. 2024;15(1):102277. doi:10.1016/j.asej.2023.102277. [Google Scholar] [CrossRef]
Cite This Article
 Copyright © 2025 The Author(s). Published by Tech Science Press.
This work is licensed under a Creative Commons Attribution 4.0 International License , which permits unrestricted use, distribution, and reproduction in any medium, provided the original work is properly cited.
 Downloads
 Citation Tools