
 Submit a Paper
 Propose a Special lssue
 Open Access
ARTICLE

Numerical Analysis of the Aerodynamic Performance of an Ahmed Body Fitted with Spoilers of Different Opening Areas
School of Automotive and Traffic Engineering, Jiangsu University, Zhenjiang, 212013, China
* Corresponding Author: Haichao Zhou. Email:
(This article belongs to the Special Issue: Recent Advances in Computational Fluid Dynamics)
Fluid Dynamics & Materials Processing 2025, 21(5), 1113-1131. https://doi.org/10.32604/fdmp.2025.064991
Received 28 February 2025; Accepted 14 April 2025; Issue published 30 May 2025
 View Full Text
 Download PDF
Abstract
The configuration of a spoiler plays a crucial role in the aerodynamics of a vehicle. In particular, investigating the impact of spoiler design on aerodynamic performance is essential for effectively reducing drag and optimizing efficiency. This study focuses on the 35° Ahmed body as the test model and examines six different spoiler types mounted on its slant surface. Using the Lattice Boltzmann Method (LBM) in XFlow and the Large Eddy Simulation (LES) technique, the aerodynamic effects of these spoilers were analyzed. The numerical approach was validated against published experimental data. Results indicate that aerodynamic drag is strongly influenced by the spoiler’s opening area, with certain configurations achieving a drag reduction as high as 6.5%. This configuration effectively suppresses airflow separation in the wake of the Ahmed body, reducing the formation of separation bubbles on the slant surface and enhancing pressure recovery on both the slant and base regions. The observed pressure recovery is attributed to the reduction in vortex loop breadth and length.Keywords
In recent years, the escalating global energy crisis has coincided with a sustained increase in automobile numbers worldwide. Consequently, vehicle energy consumption has markedly increased, prompting governments and consumers to emphasize fuel efficiency and implement increasingly stringent automotive fuel economy standards. Empirical studies demonstrate that 10% reduction in aerodynamic drag can yield 2%–3% fuel economy improvement in automotive applications [1]. This correlation has driven extensive investigations into flow separation mechanisms and vortex dynamics through representative vehicle models. Due to the inherent geometric complexities of production vehicles, the Ahmed body has become a widely recognized benchmark geometry for systematic automotive aerodynamic analysis [2–5]. Its simplified configuration facilitates fundamental investigations into three critical aerodynamic phenomena: flow separation patterns, wake characteristics, and drag reduction strategies.
Comprehensive experimental and computational fluid dynamics (CFD) investigations have elucidated the pivotal role of the rear slant angle (α) in shaping wake morphology. For α < 12.5°, attached flow along the slanted surface generates coherent wake vortices, specifically counter-rotating longitudinal vortex pairs, which dominate the overall flow topology [6]. Transitional flow regimes (12.5° < α < 30°) exhibit significant pressure reduction effects, causing the drag coefficient to increase by approximately 50% compared to the zero-slant configuration as α approaches 30° [7]. Beyond the critical threshold at α = 30°, complete flow separation occurs at the upper edge, resulting in uniform pressure distributions across the rear surfaces and suppression of typical counter-rotating vortex structures [8]. This distinct flow regime produces characteristic flow structures, including turbulent separation bubbles along the slant surface, longitudinal vortices adjacent to the slant edges, and recirculation zones at the base, all significantly contributing to the overall aerodynamic drag.
As shown in Fig. 1, the wake flow behind the Ahmed model is highly complex, necessitating the use of an appropriate numerical analysis method. The size of the recirculation zone directly influences the aerodynamic drag. Therefore, controlling this region is a critical factor in the development and optimization of flow control systems [9]. Han [10] conducted simulations of the Ahmed body using an incompressible turbulence model and found that the k-ε turbulence model underestimated the base pressure. Makowski and Kim [11] applied the Reynolds-Averaged Navier-Stokes (RANS) equations to simulate the Ahmed body. They analyzed in detail the effects of the turbulence model, meshing, and flow structure on the Ahmed body. Guilmineau [12] reported that the RANS model accurately predicted the flow behavior around the 35° Ahmed model due to its predominantly two-dimensional characteristics. Therefore, the prediction of the flow behavior was accurate. However, the 25° Ahmed model exhibits three-dimensional flow behavior, and the RANS model failed to capture wake reattachment accurately. Igali et al. [13] argued that the RANS model can accurately predict complex three-dimensional flows on the Ahmed body when combined with refined meshing and appropriate discretization schemes. This was demonstrated using RANS combined with various turbulence models, among which the SST k-ω model yielded the most accurate results. Furthermore, Tian et al. [14] applied the RANS approach with the SST k-ω turbulence model and achieved excellent agreement with experimental data for the Ahmed body. Moreover, numerous investigations utilizing Unsteady Reynolds-averaged Navier-Stokes equations (URANS) had been conducted on the Ahmed body [15,16]. In summary, conventional numerical methods such as finite volume and finite element approaches when applied to the Navier-Stokes equations, face limitations including meshing uncertainty, empirical turbulence modeling, nonlinear convection term handling, and reliance on artificial stability parameters. These limitations result in engineers being unable to accurately model real systems and relying on simplified models and approximations. These methods are time-consuming and not applicable to moving parts and are often limited to steady-state analyses, ignoring transient dynamics [17,18]. Large eddy simulation (LES) can accurately resolve unstable largescale turbulent dynamics. Nevertheless, the approach is frequently impractical in computing due to its stringent grid resolution demand in the vicinity of the wall [19]. The lattice Boltzmann method (LBM) considers the movement and interaction of fluid particles at a mesoscopic scale, offering the potential for studying disconnected unstable flows [20]. Recently, Zhou et al. [21] applied the LBM-LES method, which proved effective in resolving unsteady large-scale turbulent flows. Therefore, this study employs the LBM-LES approach to investigate the aerodynamic characteristics of the Ahmed body equipped with various spoiler configurations.
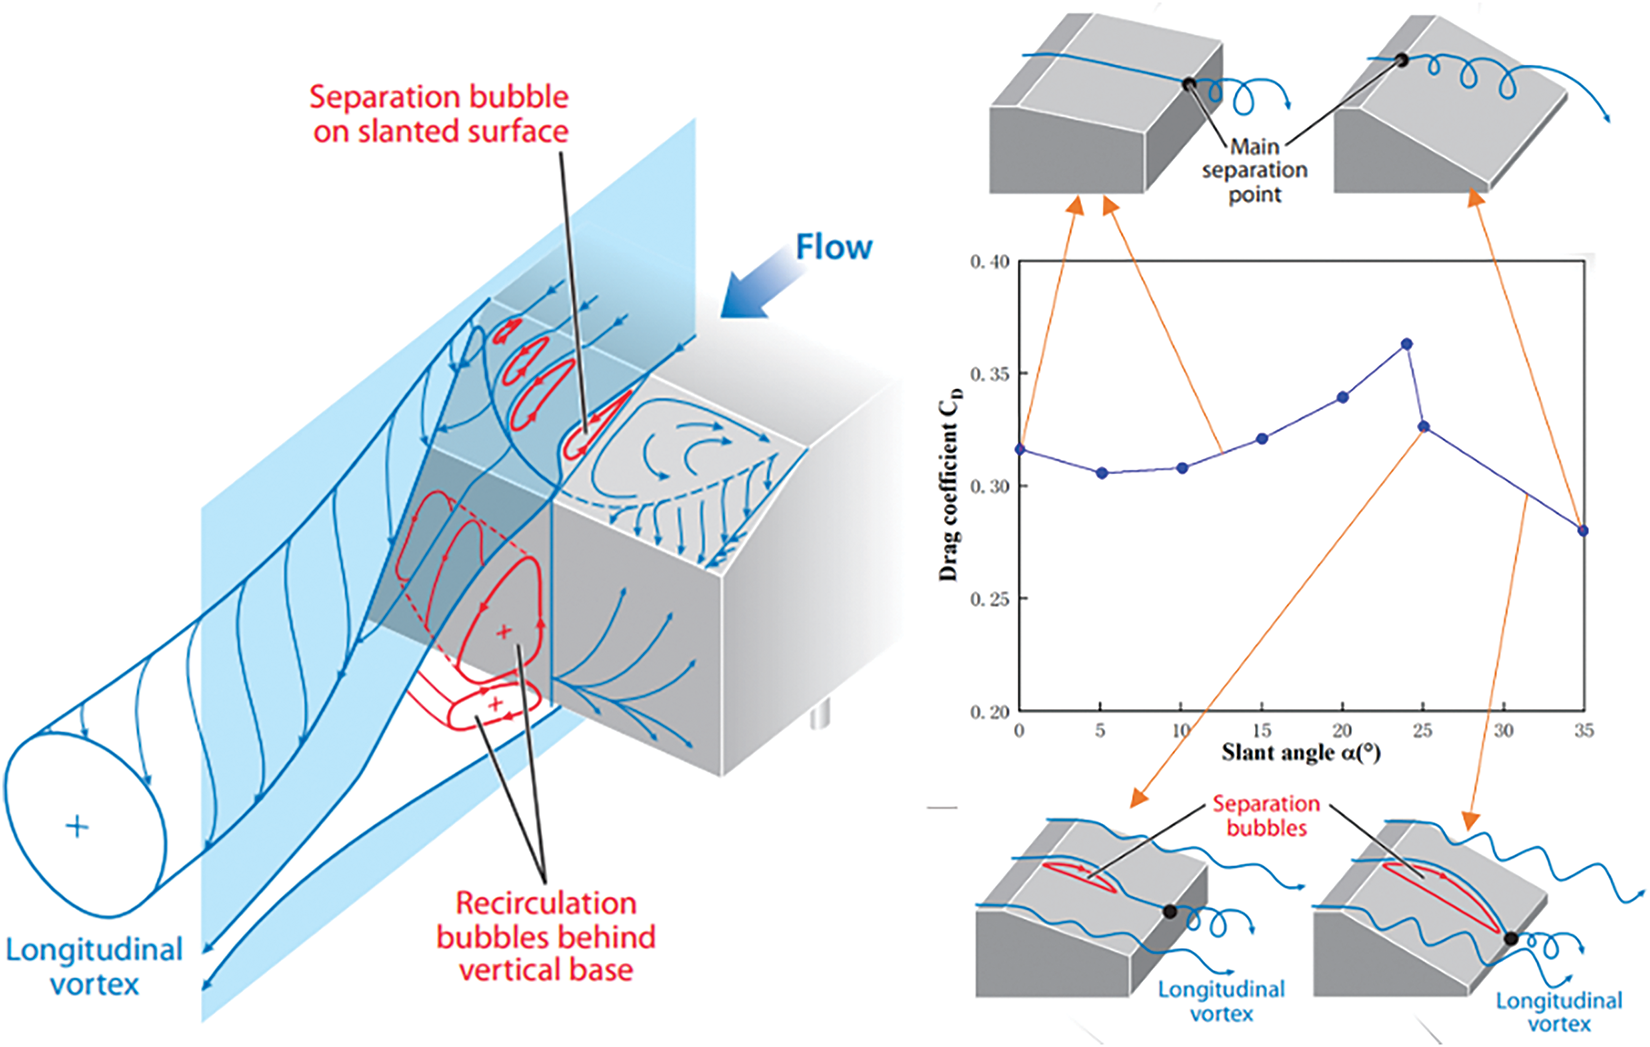
Figure 1: Flow structure in the rear of the Ahmed body and the changes in the drag coefficient for various slant angles [2]
In the Ahmed body wake, pressure drag primarily arises from flow separation mechanisms, specifically twin counter-rotating vortices along the slant edges and recirculating bubbles near the vertical base [22]. Previous studies have identified two main strategies for mitigating pressure drag in Ahmed body configurations. The first strategy aims to prevent separation bubble formation by maintaining attached flow over the slanted surface through the strategic placement of aerodynamic devices. Choi et al. [23] demonstrated that placing cylindrical elements upstream of the separation line effectively suppresses bubble formation, thereby reducing aerodynamic drag. The complementary strategy focuses on weakening the longitudinal vortices originating from the slant-edge boundaries, as these vortices are key contributors to pressure differential and drag generation [24–26]. Empirical comparisons between passive and active flow control systems reveal that passive devices achieve superior drag reduction performance. Beaudoin and Aider [27] reported a 25% drag reduction on a 30° Ahmed body using rectangular spoilers, whereas Fourrié et al. [28] documented a 9% drag reduction using similar configurations. Subsequent parametric studies by Tian et al. [14] demonstrated angle dependent effectiveness, yielding 21.2% drag reduction for 25° Ahmed models compared to 6% for 35° configurations. Comparative evaluations of spoiler geometries (rectangular, elliptical, triangular) on commercial vehicle analogs showed maximum drag reduction of 11.1% for elliptical profiles, with other configurations achieving 6% drag reduction [29]. These findings are further supported by Ha et al. [30], who achieved a 5.6% drag reduction with optimized flap geometries on pickups, and Cheng et al. [31], who reported a 10.7% drag reduction using variable-angle spoilers on hatchbacks.
Existing literature primarily focuses on geometric shape optimization, while critical parameters such as spoiler opening areas remain largely unexplored—an important oversight considering the growing use of perforated rear spoilers in full-size SUVs (Fig. 2) to improve aerodynamics. This gap significantly constrains the understanding of flow modification mechanisms in production-oriented aerodynamic designs. Comprehensive analysis of opening area effects will enable systematic optimization of wake management strategies, providing essential guidance for developing energy efficient vehicle aerodynamics solutions. Our study specifically addresses this underexplored parameter by quantifying opening area dependent flow interactions.
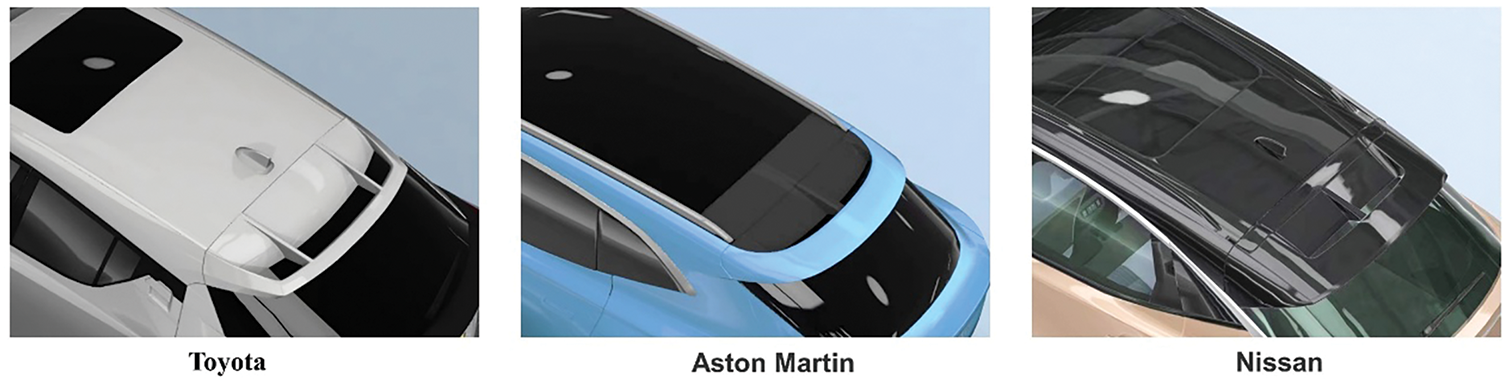
Figure 2: Different spoiler shapes for SUVs
The paper is structured as follows: Section 2 details the Ahmed model geometry, the solver methodology (LBM-LES), boundary conditions, and mesh generation. Section 3 validates the numerical approach. Section 4 analyzes the simulation results, focusing on aerodynamics performance and flow characteristics. Finally, Section 5 summarizes the conclusions.
The inherent complexity of surface geometries and structural details in full-scale vehicle models results in considerable computational expenses during numerical simulations. To address this challenge, using simplified aerodynamic prototypes has become an established methodological approach in automotive research. Ahmed body has been widely adopted to investigate rear-end flow characteristics of passenger vehicles. This configuration specifically targets the investigation of flow separation phenomena in the wake region, which generates significant pressure drag—the primary contributor to total aerodynamic resistance. This study adopts the classic Ahmed model with a 35° rear slant angle (illustrated in Fig. 3). The baseline dimensions are configured as follows: four cylindrical underbody supports with radius 15 mm and height 50 mm, along with a front-end rounding radius of 100 mm.
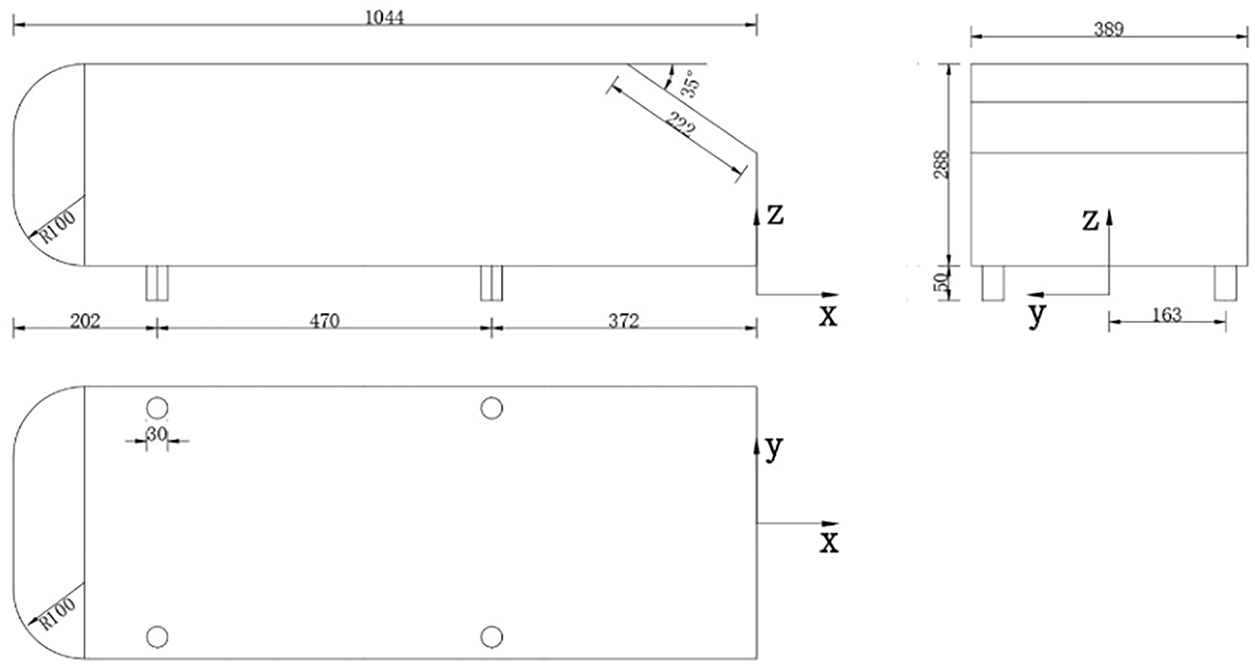
Figure 3: Sizes of Ahmed body in unit mm
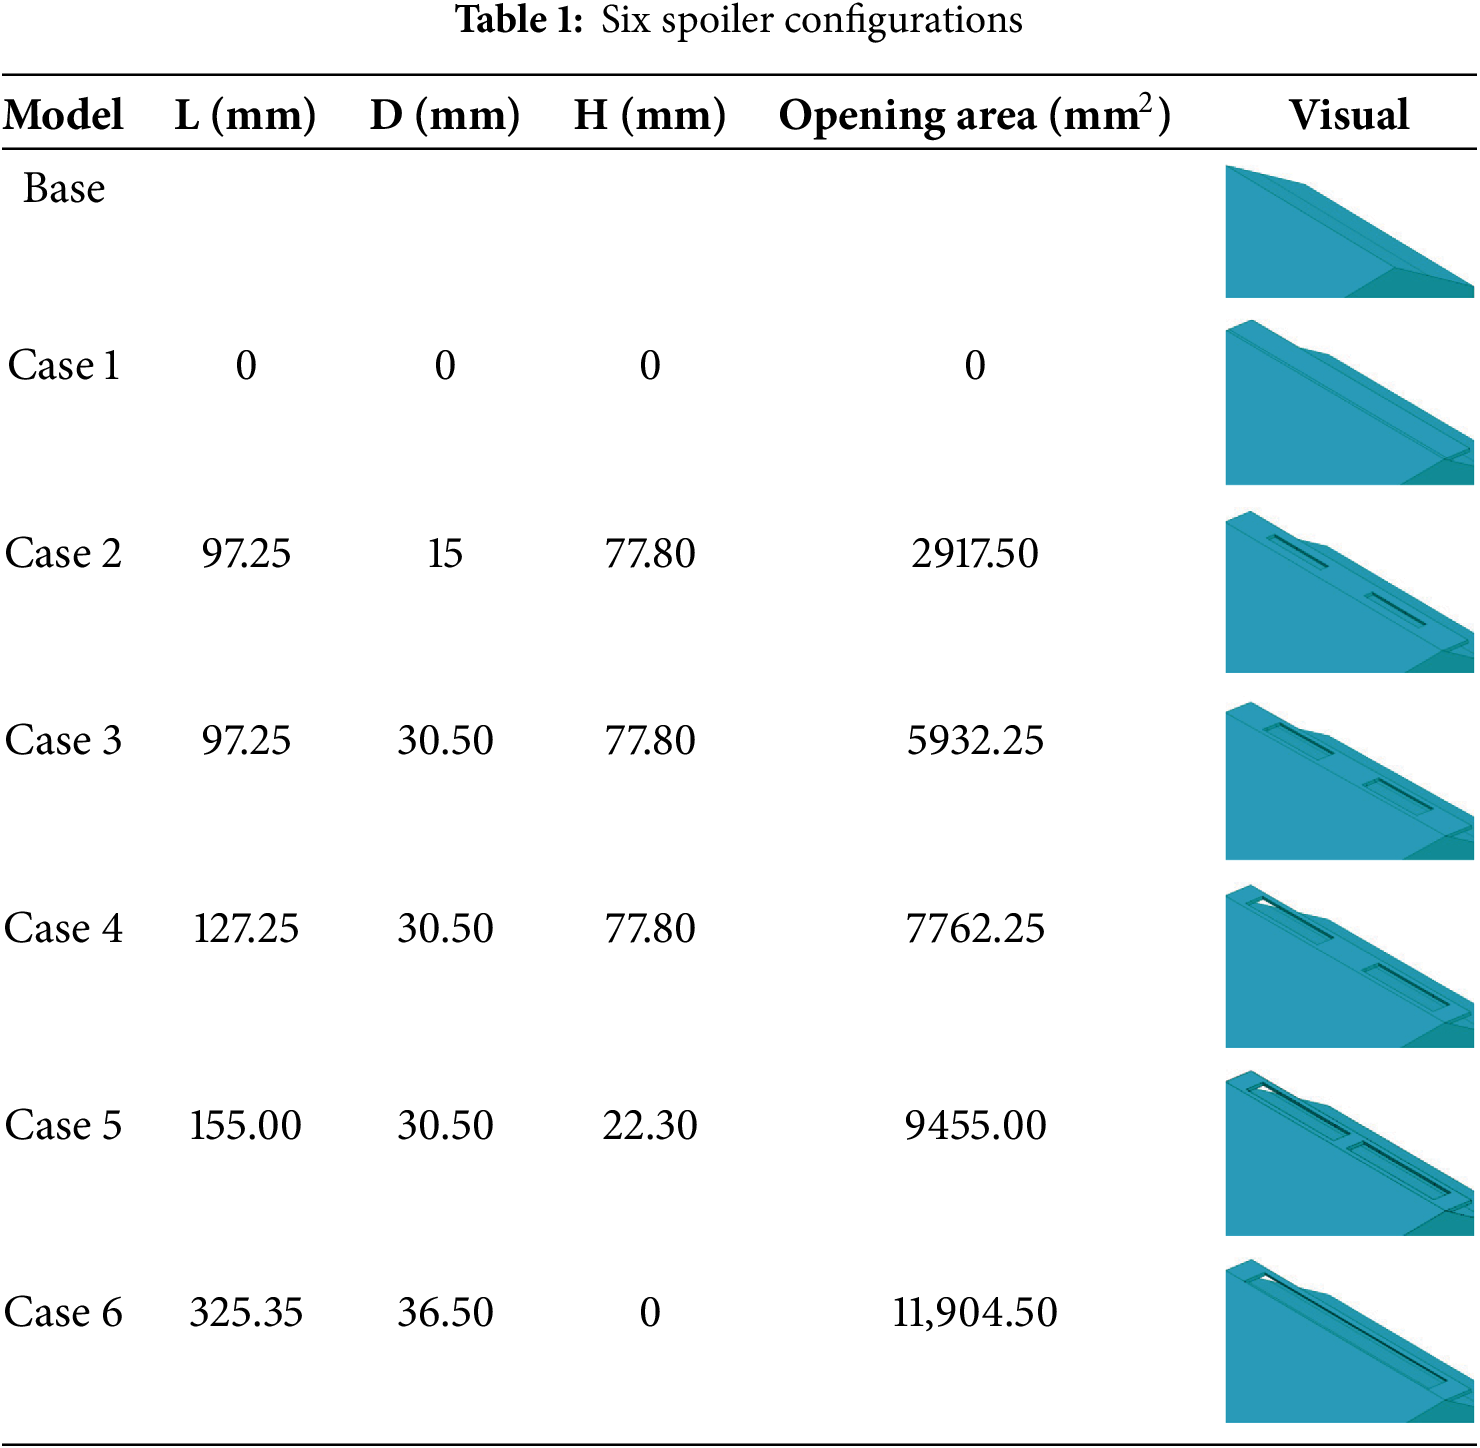
Six spoiler configurations with varying opening areas were integrated onto the baseline Ahmed model. As shown in Fig. 4, Case 2–Case 5, all four configurations have two symmetrical airflow inlets and outlets; Case 1 has no opening, and Case 6 has a full opening. The spoiler’s angle to the slant surface is 25° because the spoiler has the best drag reduction at 25° inclination [32]. The spoiler dimensions consist of a total length of 389 mm, an upper-layer width of 46 mm, a lower-layer width of 38 mm, and a vertical spacing of 5 mm between the two layers. This design allows refined airflow management to increase downforce and reduce aerodynamics drag at high speeds. Table 1 summarizes the spoiler configurations, including their visual representation, length, width, vertical spacing, and opening area across various operating conditions.

Figure 4: Ahmed body has a 35° slant angle detailed view with a hollow roof spoiler
2.3 Calculation Domain and Boundary Conditions
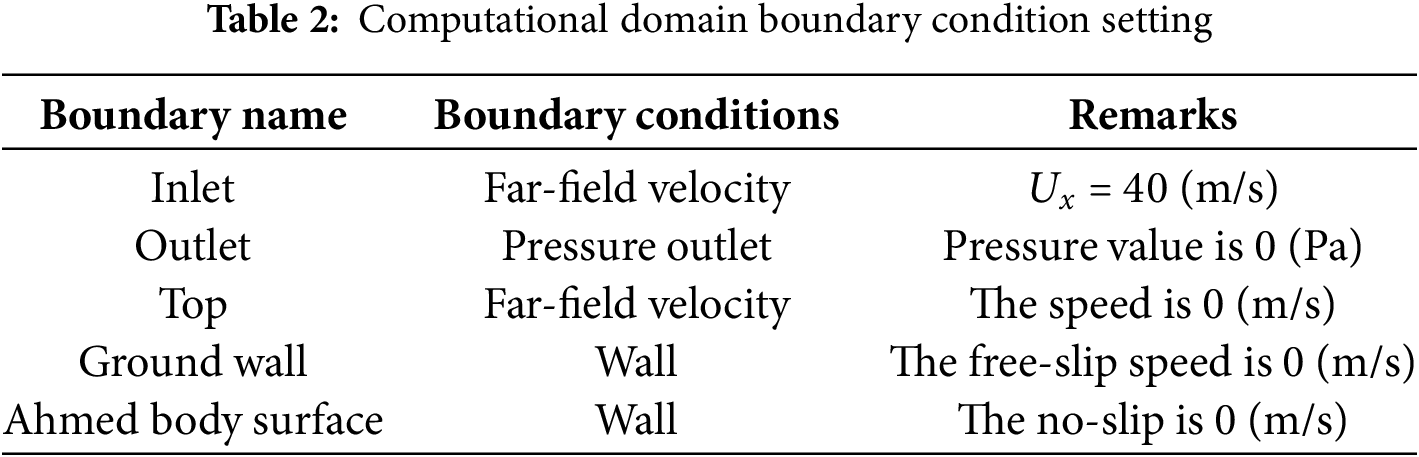
All Ahmed models were positioned within a rectangular computational domain for numerical simulation. To minimize the influence of boundary layer effects on numerical calculations, the front end of the model was placed approximately 2.5 L from the domain’s inlet. In contrast, the rear end was positioned 4.5 L from the outlet. The computational domain dimensions were 8 × 103 mm × 3 × 103 mm × 3 × 103 mm (L × W × H), as illustrated in Fig. 5. The projected area of the Ahmed model perpendicular to the YZ plane was determined as S = 1.12 × 105 mm2, corresponding to a blockage ratio of 1.28%, satisfying computational accuracy requirements. The boundary conditions used in the simulation are listed in Table 2. The total simulation time was 0.6 s, with a frame frequency of 100 Hz. The simulated wind tunnel fluid material was set to air, with a temperature of 288.15 K, a density of 1.225 kg/m3, a molecular weight of 28.996 u and a dynamic viscosity of 1.7894 × 10⁻⁵ Pa·s.

Figure 5: The dimensions of the computational domain in unit mm
This study employs the Lattice Boltzmann Method (LBM) to characterize fluid particle dynamics on a fixed computational grid using predefined discrete velocity sets. The LBM equation generally comprises three key components: an evolution equation derived from the fluid particle distribution function, a lattice structure, and a discrete velocity set. The lattice Boltzmann equation is represented as follows:
where
In the Lattice Boltzmann Method (LBM), the macroscopic physical quantities of the fluid obtained by the summation of discrete velocity distribution functions can be proved through the Chapman-Enskog [33] multiscale expansion, and the LBM evolution equations strictly satisfy the conservation form of the Navier-Stokes equations at the macroscopic scale:
Mass conservation equation (continuity equation):
where
where
The Large Eddy Simulation (LES) method used in XFlow is based on the control equations obtained by spatially filtering the original Navier-Stokes equations. After filtering, the basic form of the momentum equations can be expressed as follows:
Meanwhile, for incompressible flow, the continuity equation can be expressed as follows:
where
Incorporating the Large Eddy Simulation (LES) turbulence model into the Lattice Boltzmann Method (LBM) does not alter the form of the distribution function for the large eddies. It allows for the calculation of the influence of small eddies on large-scale eddies using the sub-grid scale (SGS) turbulence model. The introduction of the sub-grid scale viscosity coefficient in Large Eddy Simulation (LES) allows for modeling the effect of smaller-scale turbulence on the larger eddies [34,35].
where CS is the model constant, Δ is the filter scale,
The above equation selects the wall-adapting local eddy-viscosity (WALE) model to simulate sublattice turbulence. This model is suitable for complex turbulence simulation [36] and can better reflect the changing law of the eddy-viscosity coefficient in the near-wall region and the constant of the WALE model. CS is 0.2 by default. The model operator is as follows [37].
where Sαβ denotes the trace symmetric part of the square of the velocity gradient tensor;
The nonequilibrium-enhanced wall function is also utilized, providing an improved wall treatment method that accounts for local pressure gradient effects when solving boundary layer physics. This approach helps capture the non-equilibrium effects of near-wall flow, which can effectively improve the simulation accuracy. Based on
XFlow employs adaptive mesh technology, enabling automatic mesh refinement in response to local flow-field features and geometric details. This approach allows finer meshes in critical regions to accurately resolve intricate flow structures, while coarser meshes are applied in less critical regions to optimize computational efficiency.
In XFlow, adaptive mesh refinement leverages the vorticity field scale to effectively capture fluctuations in the wake and near-wall regions. Mesh resolution, defining local mesh size, is critical for ensuring numerical simulation reliability. Typically, three distinct resolution levels far-field, near-wall, and wake resolutions—are required for accurate flow field calculations, as depicted in Fig. 6. In the three mesh schemes, the far-field resolution is set to h = 0.08 m, while the near-wall and wake resolutions are 0.01, 0.005, and 0.0025 m, respectively.
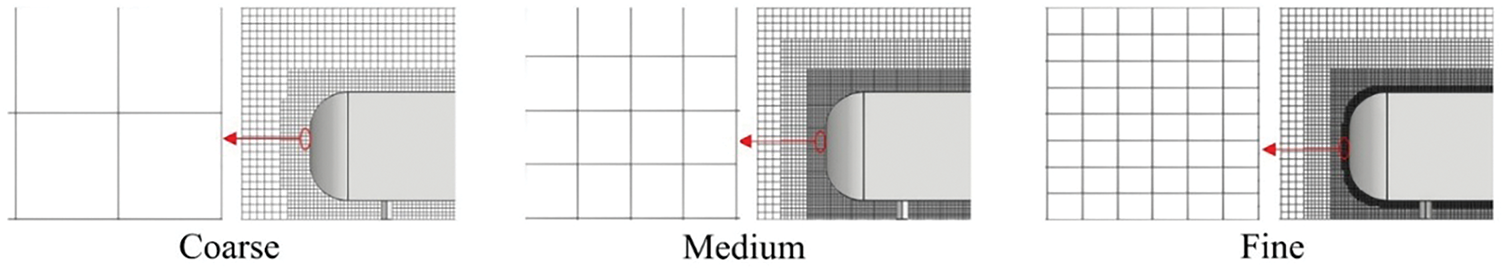
Figure 6: Coarse, medium, and fine grids
Fig. 7a presents the front section of the Ahmad body modeled with a fine mesh; Fig. 7b displays the trailing mesh around the Ahmed body. Fig. 7c,d provides localized, magnified views of the mesh around the spoiler region. Given the complex flow dynamics in the body and wake regions, four refinement regions, labeled Region 1 to Region 4 are defined, as illustrated in Fig. 8. The mesh resolution settings for the model surface and refined zones are summarized in Table 3.

Figure 7: Mesh diagrams of different regions of Ahmed body: (a) Front view. (b) Rear view. (c) Side view. (d) Top view
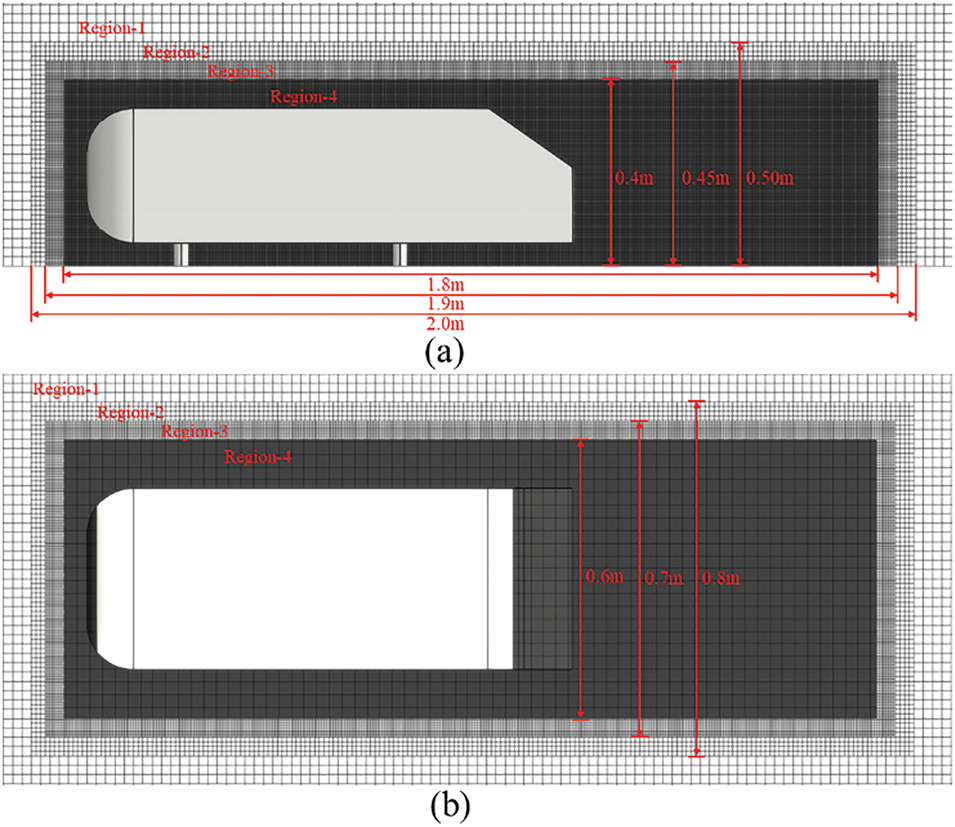
Figure 8: Mesh view of different regions around Ahmed’s body: (a) Side view; (b) Top view
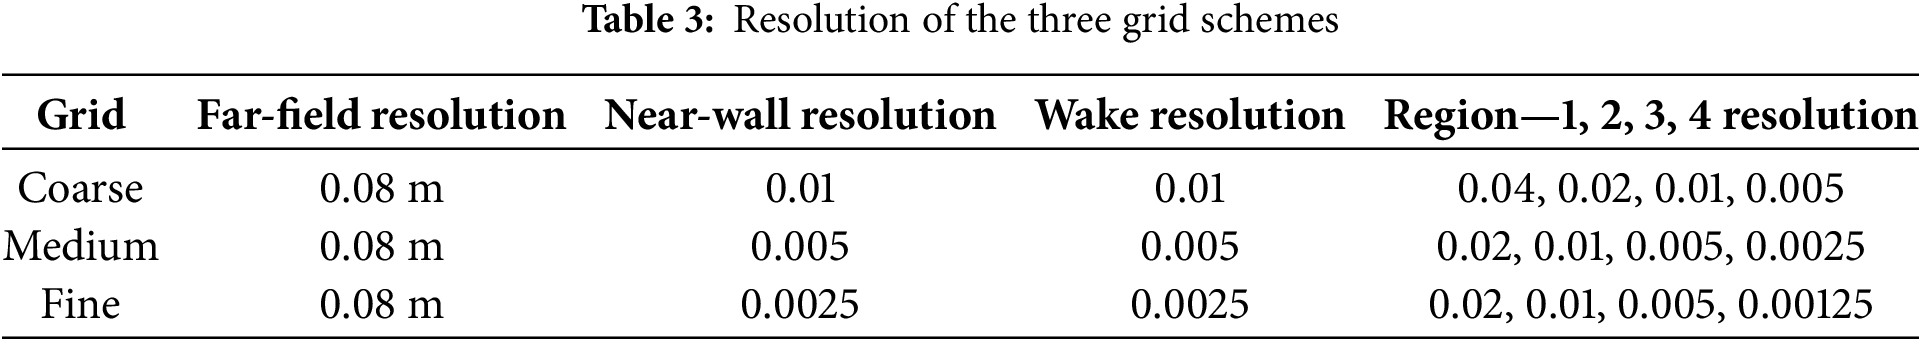
Fig. 9a demonstrates substantial fluctuations in the drag coefficients for the three resolutions during the initial stage of the simulation. As the simulation progresses, the drag coefficients gradually converge and stabilizes after 0.3 s. Additionally, Fig. 9a indicates that the simulation results for the medium and fine grids are closely aligned. To further analyze the results, the average drag coefficients between 0.3 and 0.6 s were computed and compared with published data, as summarized in Table 4. The drag coefficients obtained in this study are consistent with the empirical values reported by Meile et al. [38], demonstrating agreement with previous research. Moreover, the errors for the coarse, medium, and fine resolutions were 14.69%, 1.43%, and 2.86%, respectively, as illustrated in Fig. 9b. Notably, the medium grid exhibited the lowest numerical error. As the resolution was further refined, the number of particles and simulation time increased significantly, while the variation in the drag coefficient remained minimal. Therefore, the medium-resolution mesh is recommended for subsequent stages of the simulation.
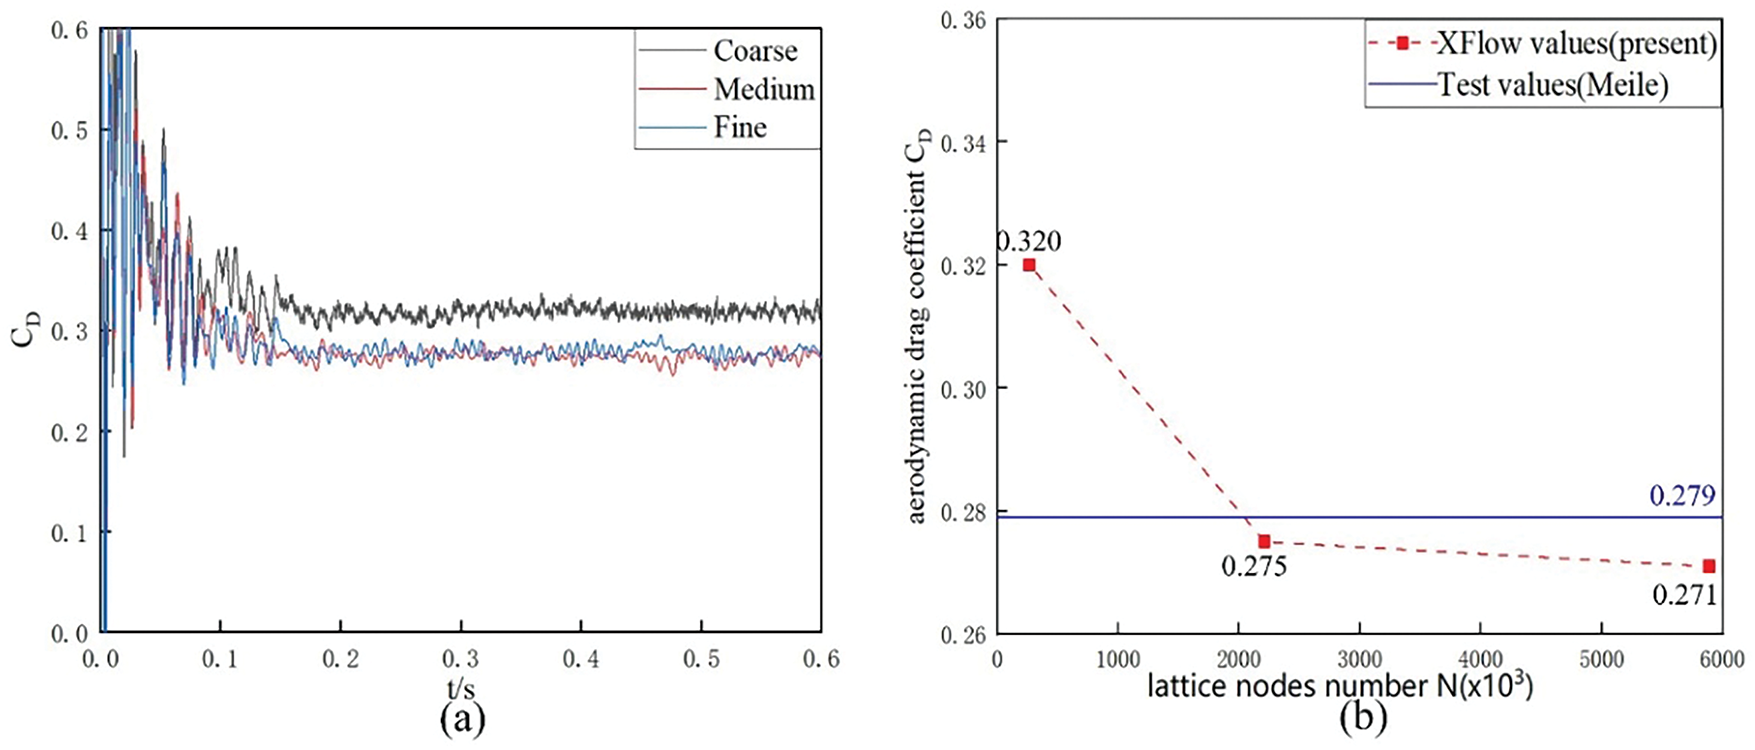
Figure 9: Comparison of three mesh schemes, coarse, medium, and fine: (a) Time progression of aerodynamic drag coefficients; (b) Comparison of the number of lattice nodes for aerodynamics drag

The medium resolution was employed to further validate the accuracy of the numerical method. The time averaged streamwise velocity field in the x-direction, obtained from simulating the flow around the rear slant of the Ahmed body, was compared with experimental measurements by Meile et al. [38]. As shown in Fig. 10, the velocity distributions from the simulation and the experiments showed good agreement. However, slight discrepancies were observed between the simulation and experimental values in regions with large velocity gradients. Although the velocity directions at each point matched the experimental data, small differences in velocity magnitude were noted. Overall, these minor deviations were deemed acceptable.

Figure 10: Comparison of simulated and experimental Streamwise velocity of Ahmed’s body
Fig. 11 presents the aerodynamic drag coefficients and corresponding drag reduction rates for various spoiler configurations. The baseline model, indicated by the red line, serves as a reference for comparison. The results reveal that Case 2 achieved a drag coefficient of 0.261 and a drag reduction rate of 6.5% compared to the baseline. In contrast, Cases 4 and 6 produced higher drag coefficients of 0.281 and 0.286, representing increases of 0.7% and 2.5%, respectively. Additionally, Fig. 12 illustrates the relationship between the spoiler opening area and drag reduction rate, revealing an initial upward trend in drag reduction as the opening area increased, followed by a peak and subsequent decline. Subsequently, the drag reduction rate increased again as the opening area was further increased, failing to reach the initial peak and decreasing again as the opening area continued to increase. These fluctuations in drag reduction suggest that modifying the spoiler opening area can enhance wake flow within a specific operational range. Still, beyond this range, it could result in a reversal of the effect and an increase in drag instead.

Figure 11: Drag coefficient for each spoiler configuration
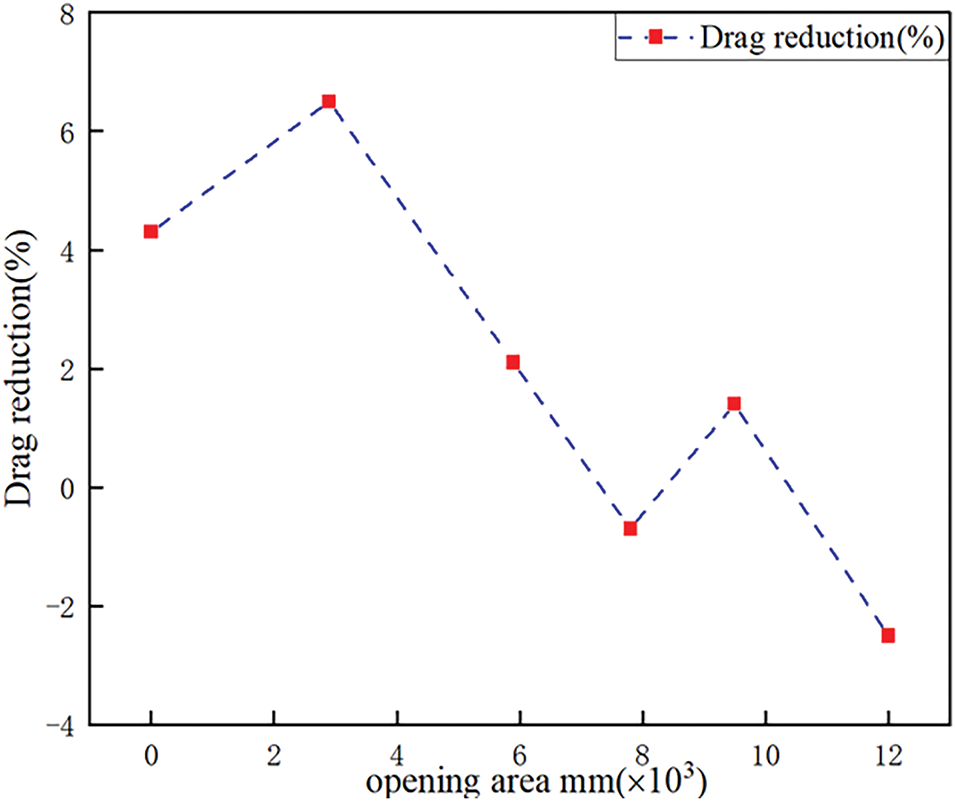
Figure 12: Drag reduction for each opening area
Fig. 13 presents the average pressure distributions along the top and bottom centerlines of the Ahmed body. In Fig. 13a, upper surface pressures on all Ahmed models were similar, with consistent trends despite minor fluctuations. Significant differences existed on the slant of the Ahmed model. The local magnification in Fig. 13b revealed that surface pressure coefficients for Case 1 and Case 2 were highest in the 0.9–1 interval and on the model’s slant, while Case 6 was lowest. Fig. 13c illustrates the flow conditions at the bottom of the Ahmed body, where trends were generally consistent across all conditions. Although variations in spoiler opening area had minimal influence on the front half, they substantially impacted flow conditions at the rear half, resulting in significant differences in bottom-surface pressure distributions. Specifically, the Base model exhibited the highest rear-bottom surface pressure, whereas Case 2 showed the lowest pressure values. This observation suggests that spoiler structures with varying opening areas significantly influence flow conditions around the rear of the Ahmed model.
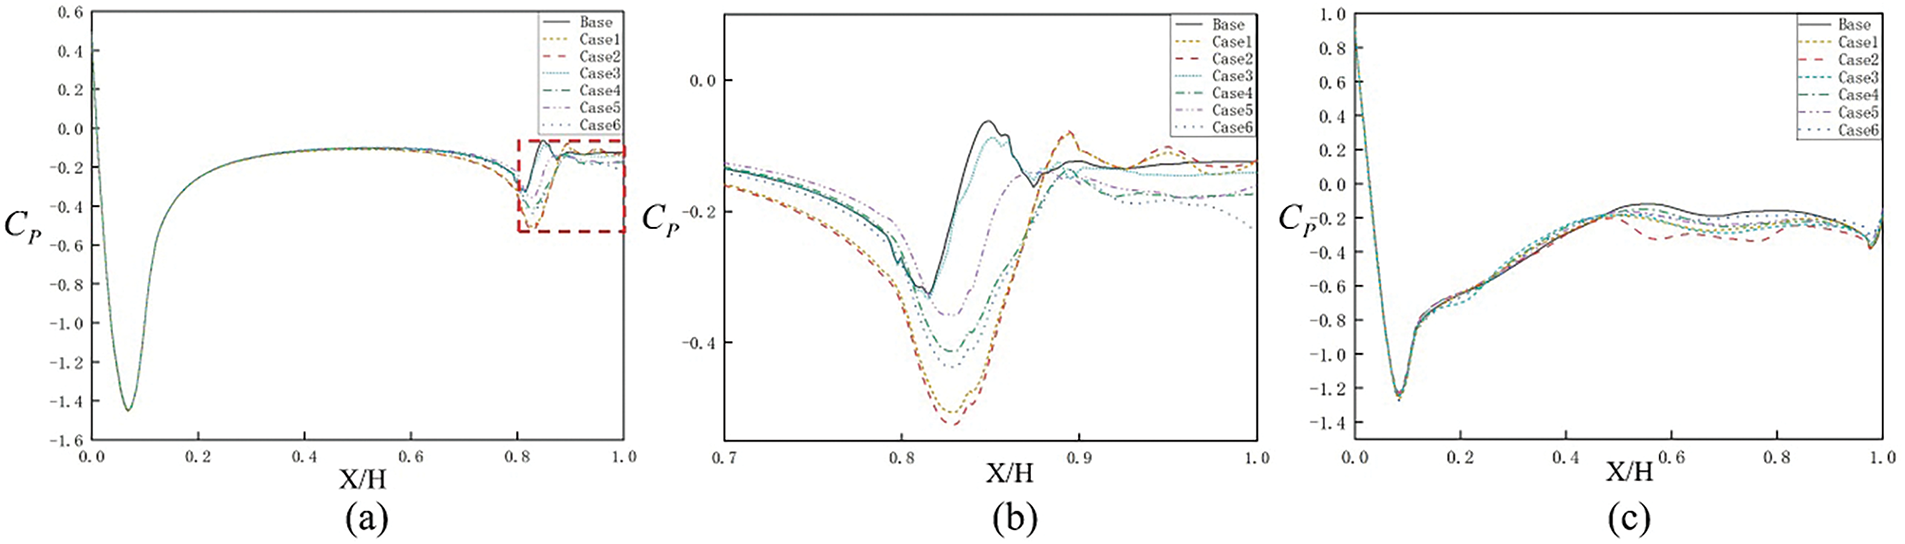
Figure 13: Average Cp values from the center line of the model: (a) the top; (b) the enlarged image; (c) the bottom
4.2 Analysis of the Flow Field around the Ahmed Model
Fig. 14 presents the time-averaged flow velocity on the ZY plane at X = 0 m for each investigated condition. A pair of symmetric drag vortices can be observed in all model wake streams. As shown in Fig. 14, the structural distributions of the drag vortices corresponding to Cases 3, 4, and Case 6 were all almost identical to those of Base. Cases 1 and 2 had a more obvious difference with the Base model. The range of the trailing vortex became larger. Nevertheless, the velocity at the vortex center was substantially lower, and the trailing vortex strength for Cases 1 and 2 was notably weaker than the Base model. The reduced trailing vortex strength contributed to lowering the overall drag coefficient.
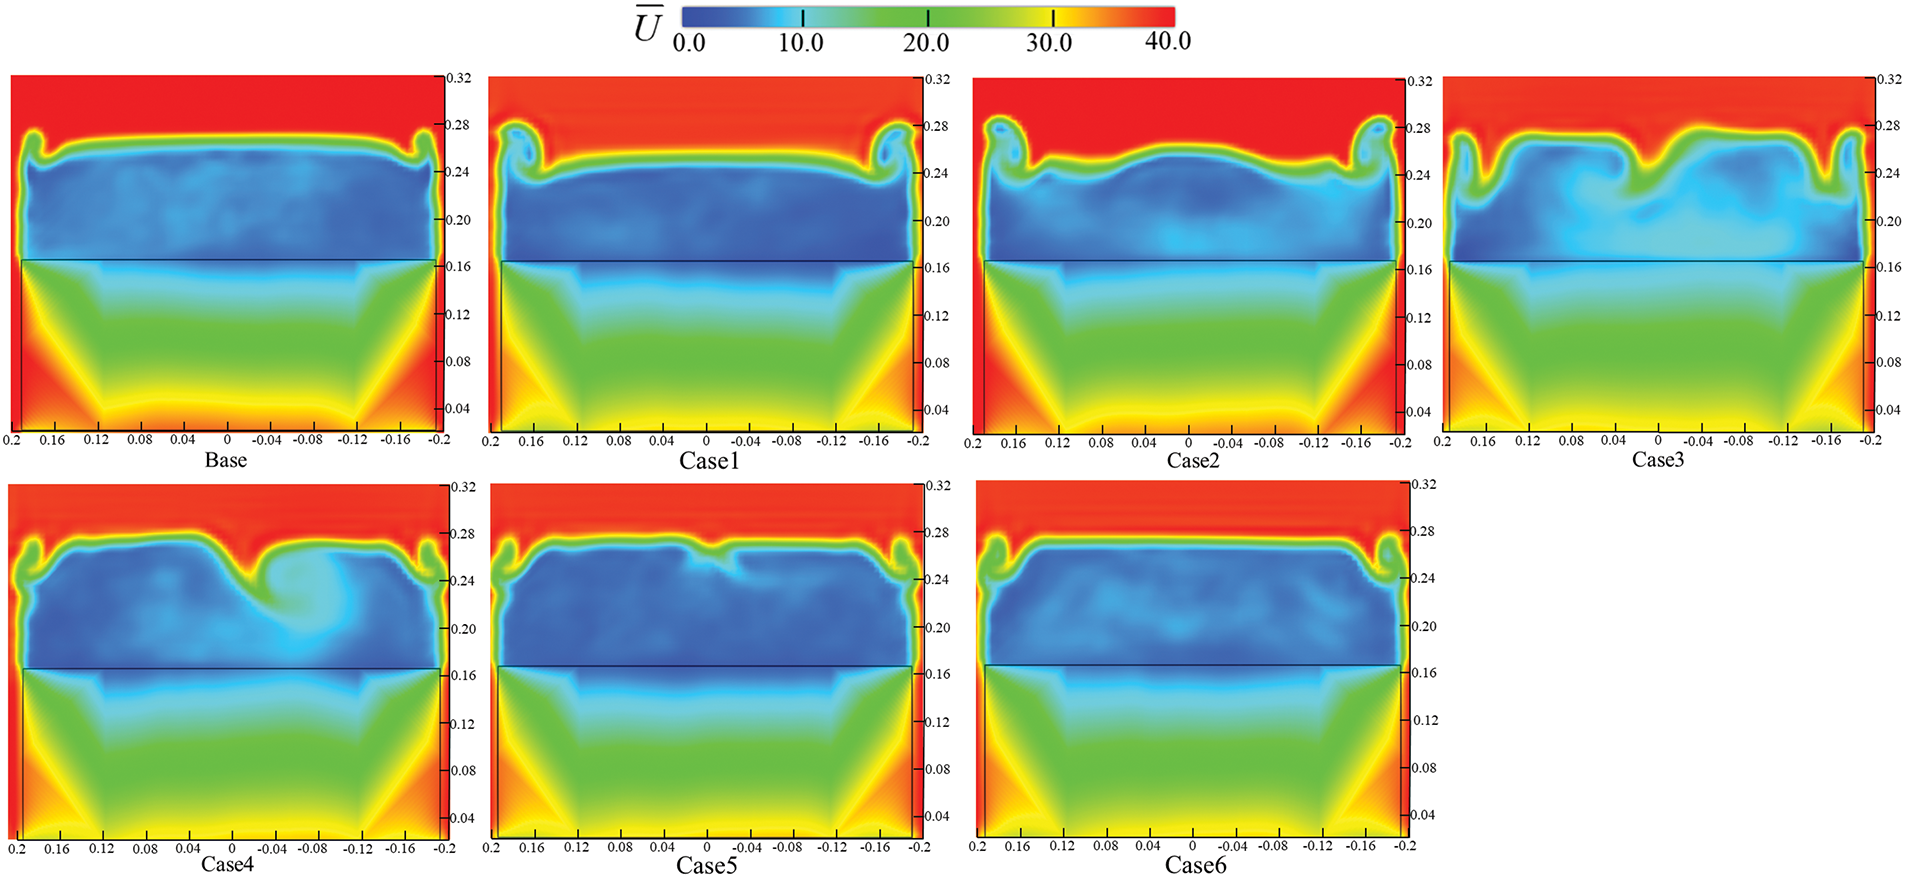
Figure 14: Time-averaged velocity distribution on plane ZY at X = 0 m
Fig. 15 shows the velocity distribution in the Y = 0.1 m plane for each Case. We can see that the low-velocity region at the upper end of the slant surface of the model in the Case 2 condition was significantly reduced. Especially, the sweeping velocity under the Case 2 flow was significantly increased, which meant that the obstruction of the airflow into the slant surface was reduced after the spoiler with a suitable opening area was installed, and it also facilitated the airflow out of the opening. Additionally, the wake velocity of the optimized model increased slightly, indicating enhanced airflow into the wake region, thereby injecting additional kinetic energy, elevating its velocity, improving wake structure, and consequently reducing aerodynamic drag in Case 2. Cases 3 and 4 had improved tail flow structure compared to the Base, but the effect was less obvious than in Case 2.
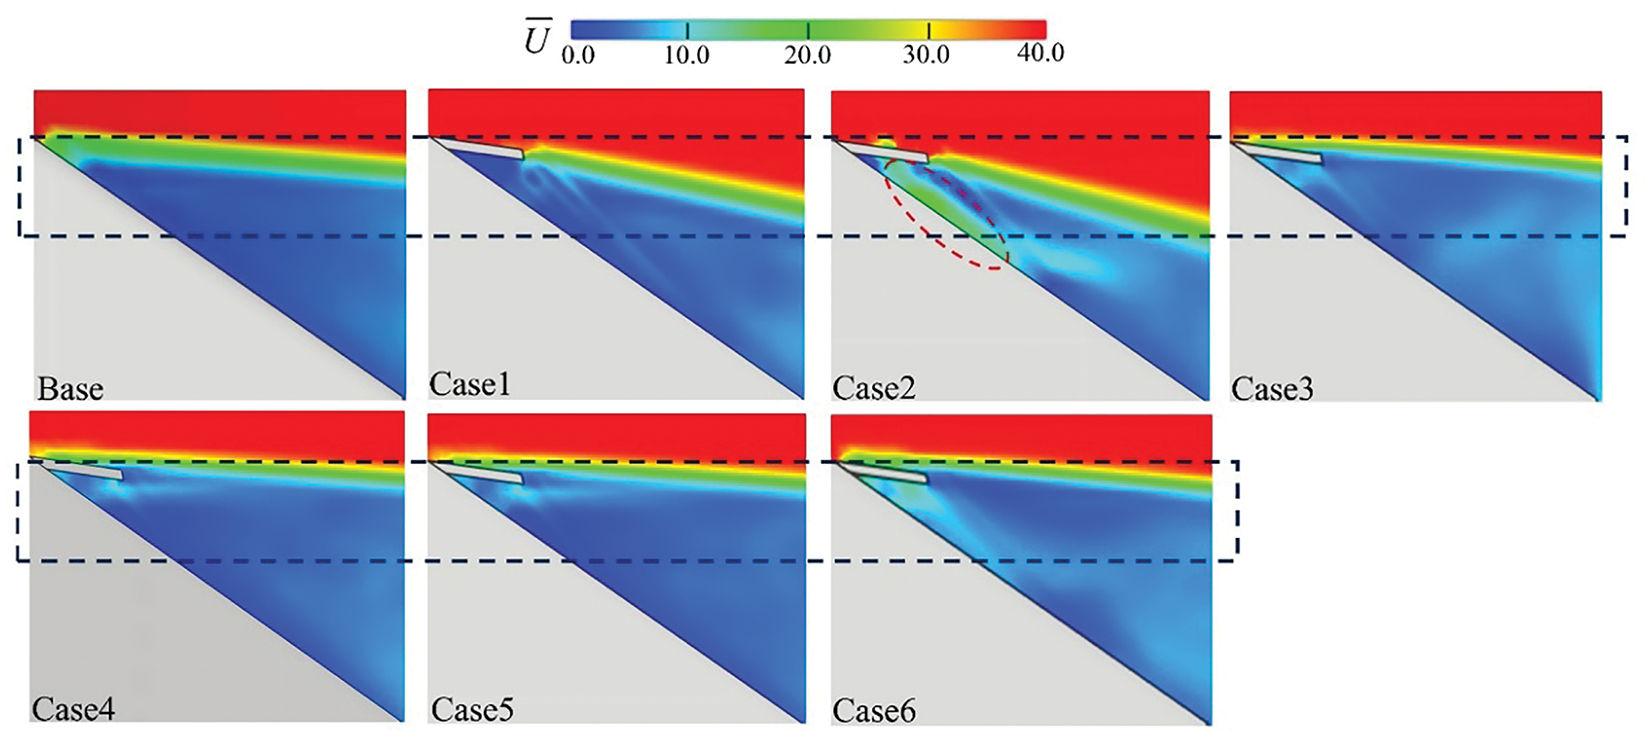
Figure 15: Comparison of the velocity distribution in the Y = 0.1 m plane
The Q-criterion is a second invariant tensor based on the velocity gradient that identifies the 3D vortex structure and distribution around the Ahmed model, defined as follows [40]:
where Ωij is the rotation tensor and Sij is the strain rate tensor; Ωij and Sij are rotation and deformation of the flow field, respectively.
Fig. 16 illustrates the vortex structures in the wake regions of the Ahmed model for various spoiler configurations. The wake of the Ahmed model is characterized by a vortex structure composed of three primary components: a separation bubble on the slant surface, following vortices on the sides of the slant top, and a recirculation zone at the bottom of the vertical surface [41]. As shown in Case 2, incorporating a spoiler with an appropriately sized opening area at the rear of the Ahmed model elongated the vortices formed by shear layers along the lateral edges of the slant under the downstream suction effect, facilitating the dissipation of wake energy and suppressing the formation of separation bubbles on the slant surface and recirculation zone. Consequently, this increased the slant surface pressure, consistent with Fig. 13, thereby substantially reducing the aerodynamic drag coefficient. In Cases 4 and 6, due to reduced airflow entering the region above the slant surface resulting from the spoiler configuration, the intensity of trailing vortices along the slant edges was diminished. Under the influence of wall viscosity, the lower slant region’s capacity to resist adverse pressure gradients decreased, resulting in increased flow separation vortices on the slant surface and subsequently leading to an increased aerodynamic drag coefficient.

Figure 16: Velocity contour on iso-surfaces of Q = 60,000
The iso-surfaces of the total pressure coefficient (CTP) effectively characterize vortex structures within the flow field. The iso-surfaces with CTP = 0 for the Ahmed model with spoiler of different opening area are shown in Fig. 17. The wake vortex area was larger for the Base and Case 6 configurations. However, in Cases 1 and 2, the wake vortex area at the model’s rear was smaller, indicating that the flow separation at the rear end of the Ahmed model has been improved. In contrast, Cases 3 and 5 showed some reduction in wake vortex area, but not as significantly as Cases 1 and 2. Thus, their drag reduction effects were less pronounced than those in Cases 1 and 2.
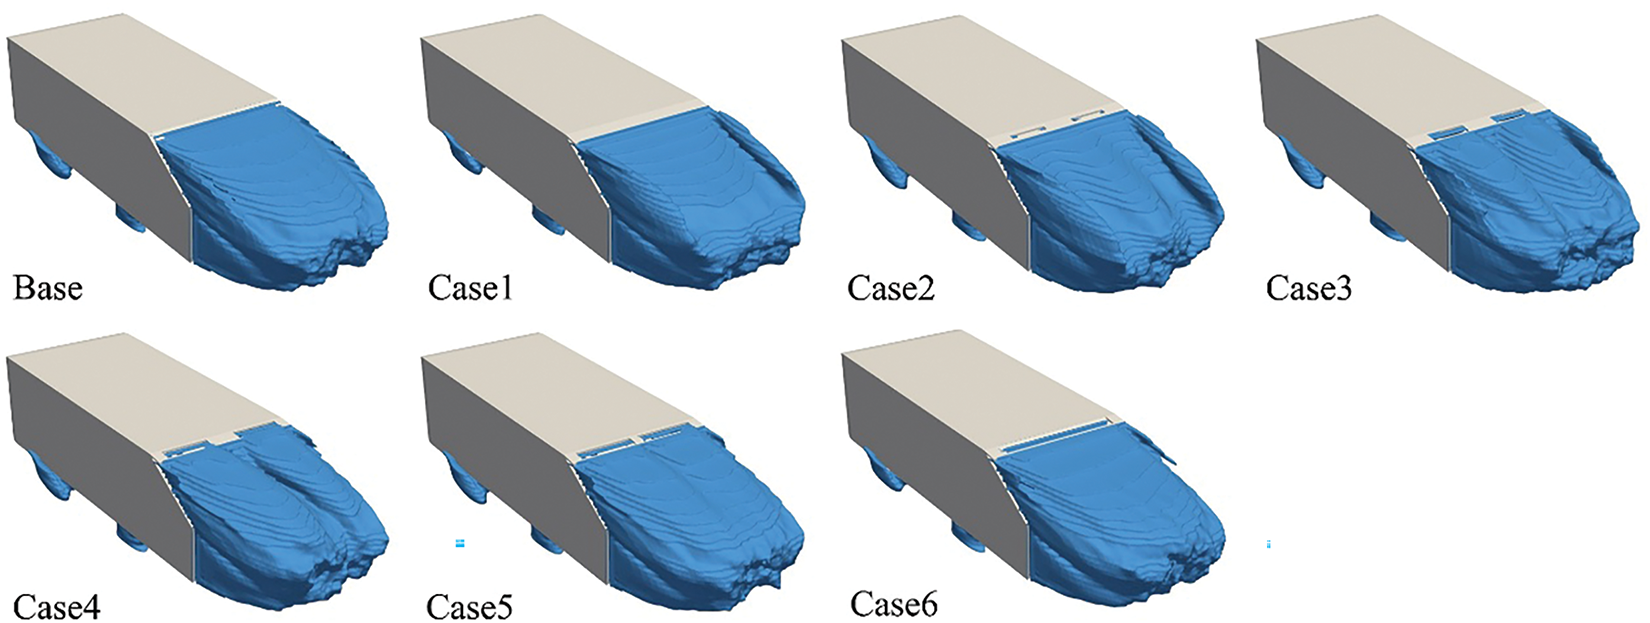
Figure 17: Iso-surfaces of CTP = 0
To analyze the influence of spoiler configurations on wake flow distributions, Fig. 18 presents the time-averaged streamlines on the central symmetry plane of the Ahmed model. As demonstrated in Fig. 18, the wake structure of the Ahmed model is mainly composed of a pair of rotating vortices V1 and V2, and a separation bubble induced by V1. From Cases 1 and 2, it could be observed that the V2 vortex core setback and the scale of vortex V1 decreased and moved backward, which played a positive role in the surface pressure recovery at the slant surface and the base and thus reduced the aerodynamics drag of the model. At the same time, the vortex above the slant was significantly reduced and tilted backward towards the slant. The increase of the wash flow along the slant also strengthened the interaction with the airflow through the bottom of the Ahmed model, resulting in a slow increase of the vortex at the bottom of the model. In Case 6, the vortex V2 increased significantly, and the Vortex core forwarded. This intensified vortex activity increased aerodynamic drag, indicating that this configuration failed to effectively suppress wake flow separation, instead exacerbating energy dissipation and instability in the wake region.
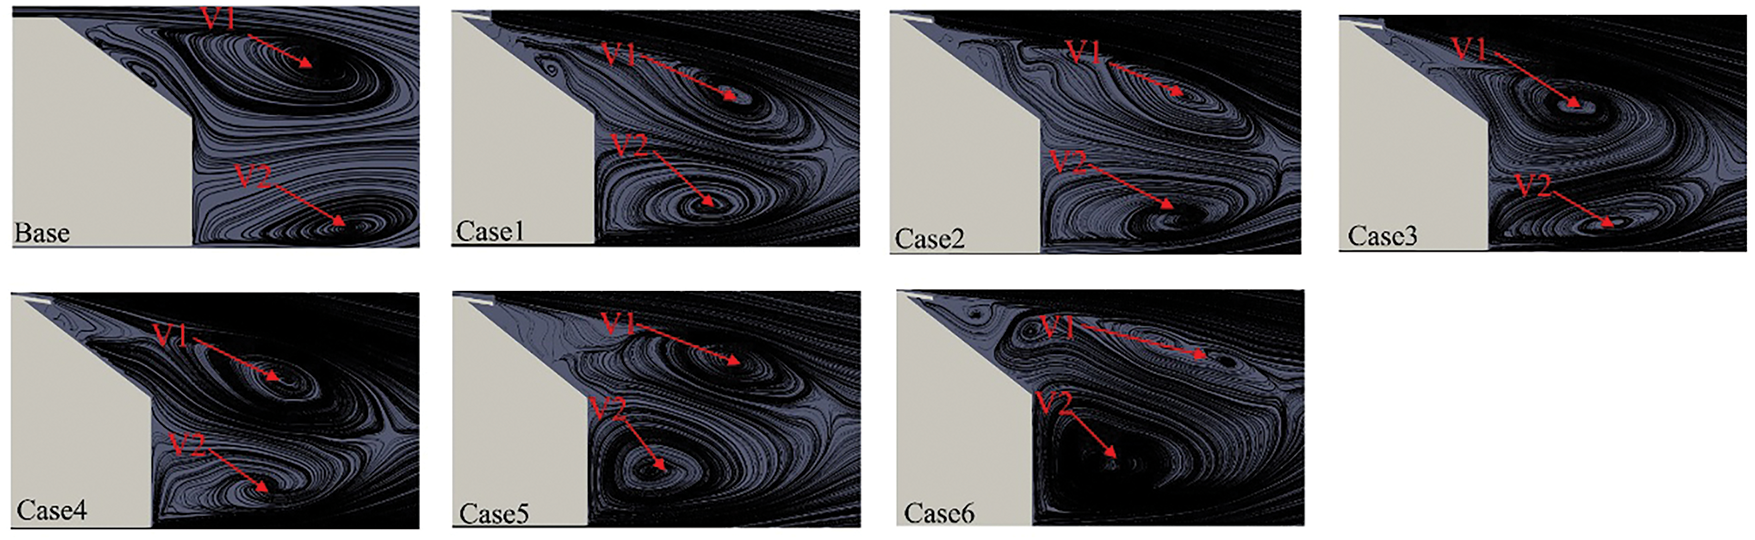
Figure 18: Time-averaged streamline distributions streamline in the symmetry planes
4.3 Ahmed Body Surface Pressure Coefficient
The flow separation occurring at the rear of the model impacts the distribution of the surface pressure coefficient, which is an important factor causing pressure difference drag between the front and rear of the model. The surface pressure at the rear of the model directly relates to the pressure difference drag of the entire Ahmed body, and the distribution of the surface pressure coefficient under various conditions is shown in Fig. 19. In all conditions, the distribution of the average pressure coefficient on the front surface of the model was the same, generating positive pressure under the influence of the airflow. As the airflow flowed along the Ahmed model, the surface pressure on the body significantly decreased, resulting in a large area of negative pressure, followed by a gradual increase in surface pressure. Changed occur at the end of the roof, with the lowest surface pressure on the spoiler surfaces in Cases 1 and 2, while the average pressure near the slant increases. This occurred because the spoilers altered airflow at the Ahmed body’s rear, inducing a larger low-pressure region on the slant’s trailing edge surfaces. Simultaneously, the spoilers increase airflow kinetic energy over the slant, enhancing the boundary layer’s resistance to adverse pressure gradients. Consequently, static pressure on both the slant surface and base increases, improving rear-end pressure recovery and effectively reducing the overall aerodynamic drag coefficient. As the spoiler opening area increased, the surface pressure on the slant and base of the Ahmed model decreased in Cases 4 and 6 compared to the base condition, increasing the overall aerodynamics drag coefficient.
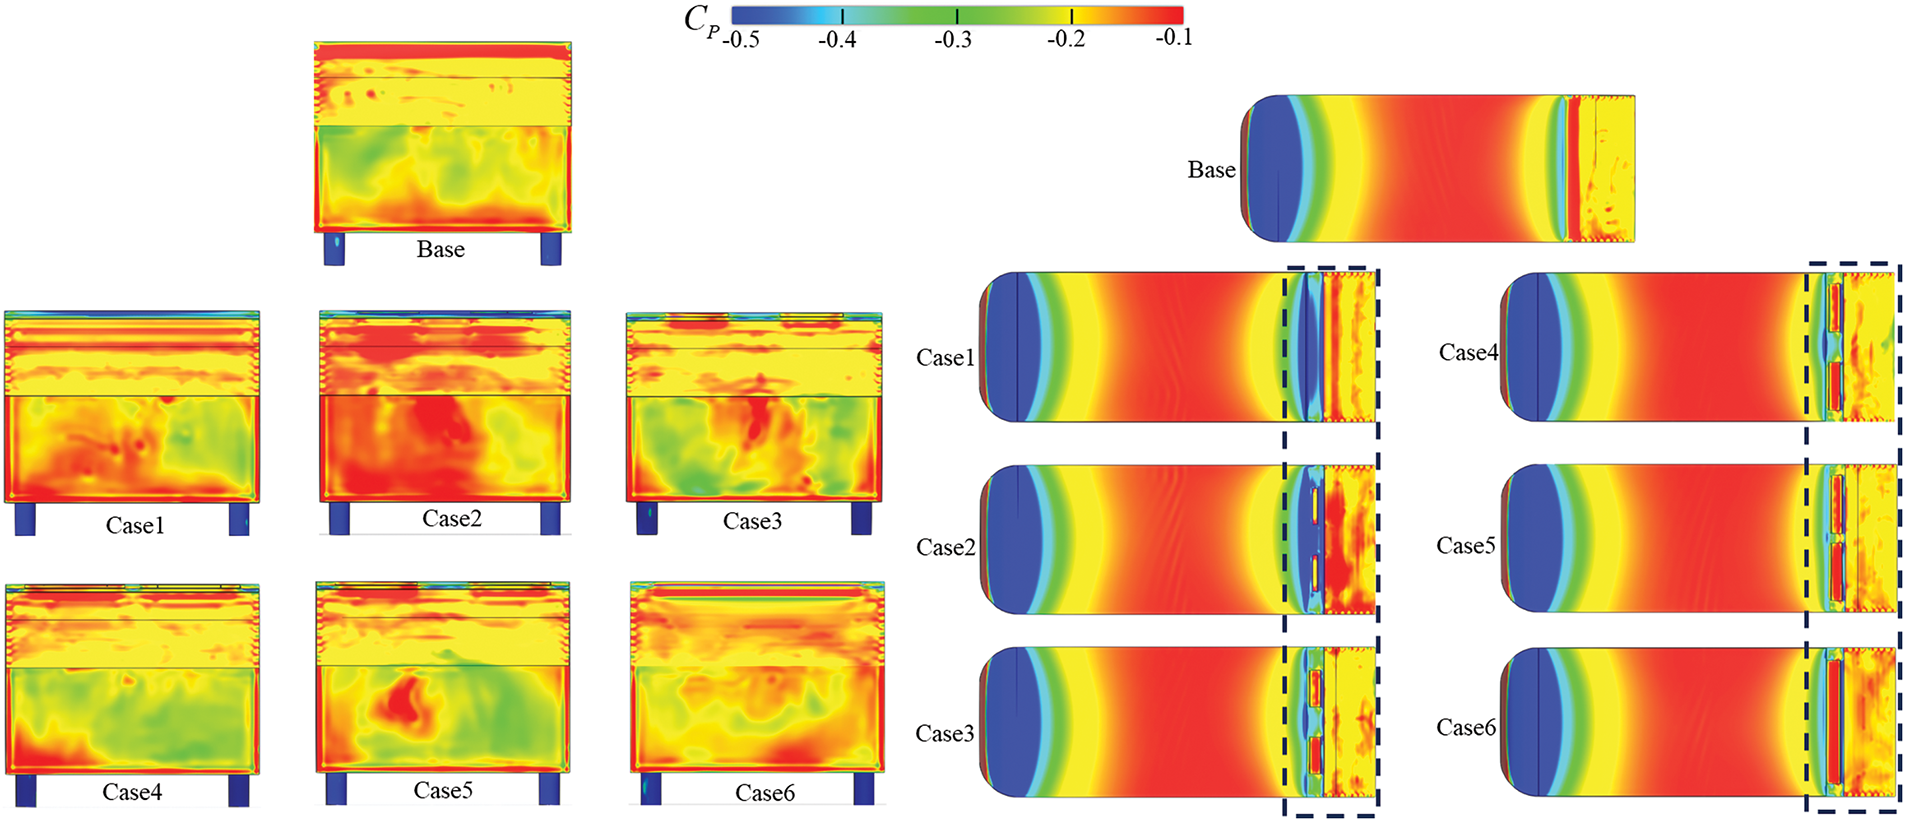
Figure 19: Average surface pressure coefficient of Ahmad body: (a) the base and (b) the upper
The measurement of model surface pressure coefficients is conducted on the rear vertical surface of Ahmed body symmetry plane, as indicated in Fig. 20a. For analytical convenience, dimensionless coordinates were adopted. The vertical axis represents the ratio of the measurement point height (Y) to the vehicle height (H), while the horizontal axis represents the pressure coefficient, as shown in Fig. 20b. Due to flow separation in the wake, there was a large region of low pressure, resulting in negative values for the overall rear surface pressure coefficients. Compared to the Base model, Cases 1 and 2 exhibited higher surface pressure coefficients on both the rear and the slant surfaces. This indicated that installing the spoiler configuration benefited pressure recovery on the model’s slant and base, yielding the best drag reduction effect. Conversely, Cases 4 and 6 exhibited lower surface pressures on the slant and rear surfaces relative to the Base model, leading to increased pressure drag and consequently elevating the overall aerodynamic drag coefficient.
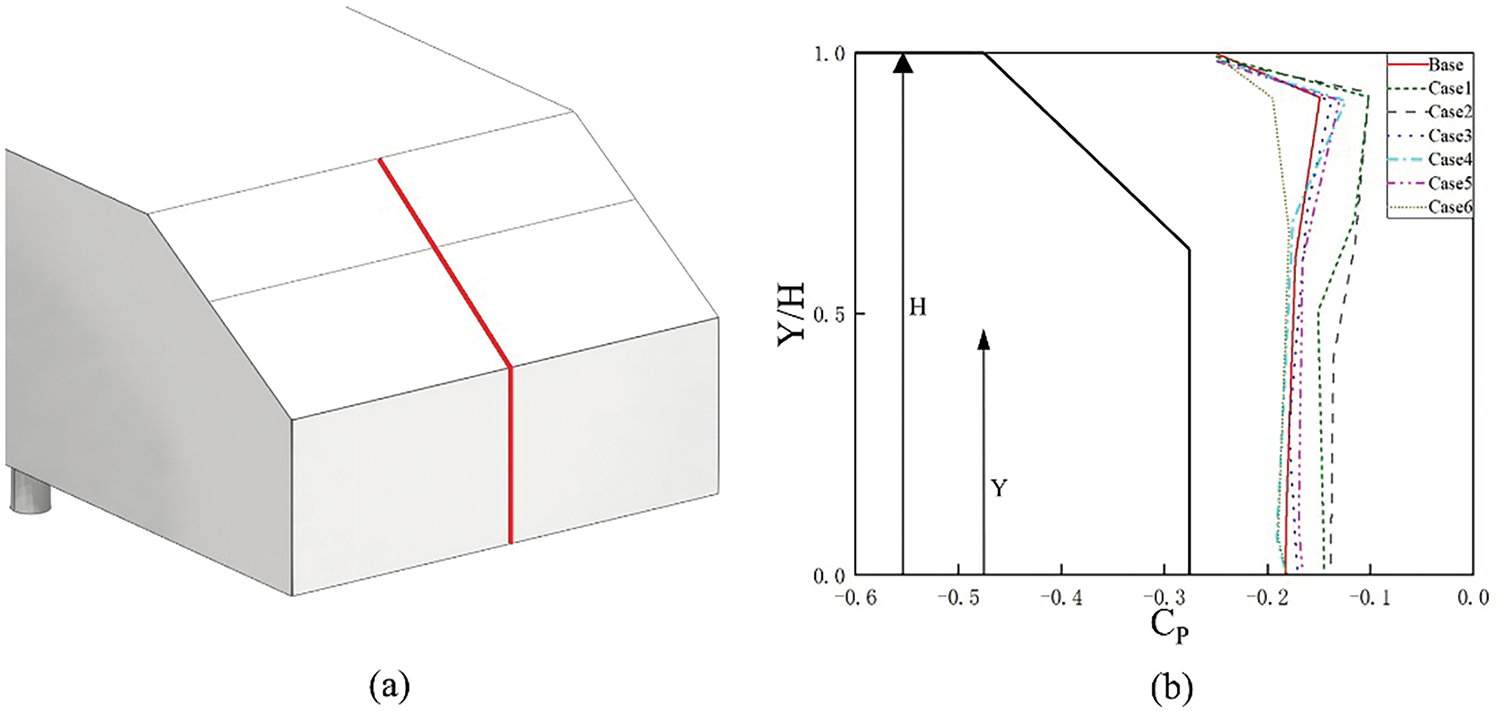
Figure 20: Comparison of the Cp located the rear: (a) Ahmed body symmetry plane; (b) Pressure coefficient
This study analyzes the impact of the spoiler with varying opening areas on the aerodynamics characteristics of a 35°Ahmed model. A combined method of LES and LBM is employed to explore their impact on the flow field and aerodynamics characteristics. The analysis includes aerodynamics drag, surface pressure distribution, flow structure at the back of the Ahmed model, velocity, vorticity, and pressure iso-surface distributions. The conclusions are summarized as follows:
(1) As the size of the spoiler opening area grows, the reduction in drag initially exhibits an upward trend, reaches a peak, and then decreases, and then the drag reduction rate picks up again when the opening area is further increased, fails to reach the initial peak, and decreases with further increase in the opening area. The relationship between the opening area and modeled resistance was nonlinear; compared to the Base case, Case 2 exhibits the smallest drag coefficient, achieving a 6.5% reduction, while Case 6 shows the highest drag coefficient, with a 2.5% increase.
(2) Appropriately enlarging the spoiler opening area can lower the velocity and intensity of drag vortex center airflow, thereby reducing separation vortices near the Ahmed rear. It also enhances the airflow speed below the vehicle, aiding in the recovery of surface pressure on the slant and base, thus reducing pressure drag. However, further enlarging the spoiler openings leads to the opposite effect.
(3) The vortex structure at the rear of the Ahmed model is significantly influenced by the spoiler configuration, exhibiting notable differences between the model’s rear and slant. In Case 2, the drag vortices extend along both sides of the slant, suppressing the formation of separation vortices on the slant surface and reducing the area of the base vortex. The scale of vortex V1 decreases, and vortex V1, V2 move backward, thereby ameliorating flow separation at the model’s rear.
Acknowledgement: The authors acknowledge the computing resources provided by the China Automotive Engineering Research Institute Co., Ltd., Chongqing.
Funding Statement: All the authors were pleased to acknowledge funding from the National Natural Science Foundation of China (No. 52272366, No. 52072156). And the Postdoctoral Foundation of China (2020M682269).
Author Contributions: Haichao Zhou: Discussion & review, Supervision. Wei Zhang: Conceptualization, Software, Methodology. Tinghui Huang: Conceptualization, Formal analysis & Discussion, Validation, Writing review & Editing. Haoran Li: Discussion & Revise. All authors reviewed the results and approved the final version of the manuscript.
Availability of Data and Materials: The data used in this study can be obtained by contacting the corresponding author.
Ethics Approval: Not applicable.
Conflicts of Interest: The authors declare no conflicts of interest to report regarding the present study.
References
1. Hucho W, Sovran G. Aerodynamics of road vehicles. Annu Rev Fluid Mech. 1993;25(1):485–537. doi:10.1146/annurev.fl.25.010193.002413. [Google Scholar] [CrossRef]
2. Siddiqui NA, Agelin-Chaab M. Investigation of the wake flow around the elliptical Ahmed body using detached Eddy simulation. Int J Heat Fluid Flow. 2023;101:109125. doi:10.1016/j.ijheatfluidflow.2023.109125. [Google Scholar] [CrossRef]
3. Deng E, Liu XY, Yue H, Yang WC, Ouyang DH, Ni YQ. How do dunes along a desert urban motorway affect the driving safety of sedans? Evidences from long-and short-term monitoring and IDDES. J Wind Eng Ind Aerodyn. 2023;243:105595. doi:10.1016/j.jweia.2023.105595. [Google Scholar] [CrossRef]
4. Keogh J, Barber T, Diasinos S, Doig G. The aerodynamic effects on a cornering Ahmed body. J Wind Eng Ind Aerodyn. 2016;154:34–46. doi:10.1016/j.jweia.2016.04.002. [Google Scholar] [CrossRef]
5. Rao A, Minelli G, Basara B, Krajnovic S. On the two flow states in the wake of a hatchback Ahmed body. J Wind Eng Ind Aerodyn. 2018;173:262–78. doi:10.1016/j.jweia.2017.10.021. [Google Scholar] [CrossRef]
6. Grandemange M, Gohlke M, Cadot O. Turbulent wake past a three-dimensional bluntbody. Part 1. Global modes and bi-stability. J Fluid Mech. 2013;722:51–84. doi:10.1017/jfm.2013.83. [Google Scholar] [CrossRef]
7. Lienhart H, Stoots C, Becker S. Flow and turbulence structures in the wake of a simplified car model (Ahmed model). In: New results in numerical and experimental fluid mechanics III. Berlin/Heidelberg: Springer; 2002. p. 323–30. [Google Scholar]
8. Ahmed SR, Ramm G, Faltin G. Some salient features of the time-averaged ground vehicle wake. SAE Trans. 1984;93(2):473–503. doi:10.4271/840300. [Google Scholar] [CrossRef]
9. Zhou HC, Jiao DQ, Wang QY, Chen QY, Xin L, Wang GL. Aerodynamic shape optimization of passenger car fender based on the FFD method. Proc Inst Mech Eng Part D J Automob Eng. 2023;239(2–3):722–35. [Google Scholar]
10. Han T. Computational analysis of three-dimensional turbulent flow around a bluff body in ground proximity. AIAA J. 1989;27(9):1213–9. doi:10.2514/3.10248. [Google Scholar] [CrossRef]
11. Makowski FT, Kim SE. Advances in external-aero simulation of ground vehicles using the steady RANS equations. Warrendale, PA, USA: SAE Technical Paper, SAE International; 2000. Report No.: 2000-01-0484. [Google Scholar]
12. Guilmineau E. Computational study of flow around a simplified car body. J Wind Eng Ind Aerodyn. 2008;96(6–7):1207–17. doi:10.1016/j.jweia.2007.06.041. [Google Scholar] [CrossRef]
13. Igali D, Mukhmetov O, Zhao Y, Fok SC, Teh SL. Comparative analysis of turbulence models for automotive aerodynamic simulation and design. Int J Automot Technol. 2019;20:1145–52. doi:10.1007/s12239-019-0107-7. [Google Scholar] [CrossRef]
14. Tian J, Zhang Y, Zhu H. Aerodynamic drag reduction and flow control of Ahmed body with flaps. Adv Mech Eng. 2017;9(7):67–87. doi:10.1177/1687814017711390. [Google Scholar] [CrossRef]
15. Guilmineau E, Deng GB, Leroyer A, Queutey P, Visonneau M, Wackers J. Assessment of RANS and DES methods for the Ahmed body. ECCOMAS Congress 2016. In: Proceedings of the 7th European Congress on Computational Methods in Applied Sciences and Engineering; 2016 Jun 5–10; Crete, Greece. p. 912–21. [Google Scholar]
16. Hinterberger C, Garcia-Villalba M, Rodi W. Large eddy simulation of flow around the Ahmed body. In: The aerodynamics of heavy vehicles: trucks, buses, and trains. Berlin/Heidelberg, Germany: Springer; 2004. p. 77–87. [Google Scholar]
17. Gu LY, Qin SH, Xu L, Chen RL. Physics-informed neural networks with domain decomposition for the incompressible Navier-Stokes equations. Phys Fluids. 2024;36(2):021914. doi:10.1063/5.0188830. [Google Scholar] [CrossRef]
18. Cai SG, Mozaffari S, Jacob J, Sagaut P. Application of immersed boundary-based turbulence wall modeling to the Ahmed body aerodynamics. Phys Fluids. 2022;34(9):095106. doi:10.1063/5.0098232. [Google Scholar] [CrossRef]
19. Mokhtarpoor R, Heinz S. Dynamic large eddy simulation: stability via realizability. Phys Fluids. 2017;29(10):105104. doi:10.1063/1.4986890. [Google Scholar] [CrossRef]
20. Holman DM, Brionnaud RM, Modena MC, Sánchez EV. Lattice Boltzmann method contribution to the second high-lift prediction workshop. J Aircr. 2015;52(4):1122–35. doi:10.2514/1.C033219. [Google Scholar] [CrossRef]
21. Zhou HC, Huang TH, Zhang W, Zhang Y, Li T. Aerodynamic and flow behaviors of Ahmed model mounted with wheel under crosswinds using the orthogonal test design. Phys Fluids. 2025;37(3):034127. doi:10.1063/5.0255712. [Google Scholar] [CrossRef]
22. Wu CY, Zhang YF. Enhancing the shear-stress-transport turbulence model with symbolic regression: a generalizable and interpretable data-driven approach. Phys Rev Fluids. 2023;8(8):084604. doi:10.1103/PhysRevFluids.8.084604. [Google Scholar] [CrossRef]
23. Choi H, Lee J, Park H. Aerodynamics of heavy vehicles. Annu Rev Fluid Mech. 2014;46(1):441–68. doi:10.1146/annurev-fluid-011212-140616. [Google Scholar] [CrossRef]
24. Huang TH, Zhou HC, Yang J, Zhang W, Chen QY. Study and evaluation of the effects of bionic groove structures applied to wheel spokes on the aerodynamics of a car model. J Appl Fluid Mech. 2025;18(6):1652–68. [Google Scholar]
25. Altaf A, Omar AA, Asrar W. Review of passive drag reduction techniques for bluff road vehicles. IIUM Eng J. 2014;15(1):61–9. doi:10.31436/iiumej.v15i1.477. [Google Scholar] [CrossRef]
26. Xu L, Hansen AC, Li Y, Liang Z, Yu L. Numerical and experimental analysis of airflow in a multi-duct cleaning system for a rice combine harvester. Trans ASABE. 2016;59(5):1101–10. doi:10.13031/trans.59.11569. [Google Scholar] [CrossRef]
27. Beaudoin JF, Aider JL. Drag and lift reduction of a 3D bluff body using flaps. Exp Fluids. 2008;44(4):491–501. doi:10.1007/s00348-007-0392-1. [Google Scholar] [CrossRef]
28. Fourrié G, Keirsbulck L, Labraga L, Gilliéron P. Bluff-body drag reduction using a deflector. Exp Fluids. 2011;50:385–95. doi:10.1007/s00348-010-0937-6. [Google Scholar] [CrossRef]
29. Altaf A, Omar AA, Asrar W. Passive drag reduction of square back road vehicles. J Wind Eng Ind Aerodyn. 2014;134:30–43. doi:10.1016/j.jweia.2014.08.006. [Google Scholar] [CrossRef]
30. Ha J, Jeong S, Obayashi S. Drag reduction of a pickup truck by a rear downward flap. Int J Automot Technol. 2011;12(3):369–74. doi:10.1007/s12239-011-0043-7. [Google Scholar] [CrossRef]
31. Cheng SY, Chin KY, Mansor S, Abd Rahman AB. Experimental study of yaw angle effect on the aerodynamic characteristics of a road vehicle fitted with a rear spoiler. J Wind Eng Ind Aerodyn. 2019;184:305–12. doi:10.1016/j.jweia.2018.11.033. [Google Scholar] [CrossRef]
32. Siddiqui NA, Chaab MA. A simple passive device for the drag reduction of an Ahmed body. J Appl Fluid Mech. 2020;14(1):147–64. [Google Scholar]
33. Chávez-Modena M, Martinez JL, Cabello JA, Ferrer E. Simulations of aerodynamic separated flows using the lattice Boltzmann solver XFlow. Energies. 2020;13(19):5146. doi:10.3390/en13195146. [Google Scholar] [CrossRef]
34. Laloglu C, Emre A. Mesh-free analysis of a vertical axis wind turbine using Lattice Boltzmann method and various turbulence models. Appl Sci. 2023;13(15):8800. doi:10.3390/app13158800. [Google Scholar] [CrossRef]
35. Freile R, Tano ME, Ragusa JC. CFD assessment of RANS turbulence modeling for solidification in internal flows against experiments and higher fidelity LBM-LES phase change model. Ann Nucl Energy. 2024;197:110275. doi:10.1016/j.anucene.2023.110275. [Google Scholar] [CrossRef]
36. Jaiswal AK, Dewan A, Bhattacharya A. Development of an interpolated RANS-LES solver for wall-bounded turbulent fluid flows. Comput Fluids. 2023;267:106086. doi:10.1016/j.compfluid.2023.106086. [Google Scholar] [CrossRef]
37. Sharafabadi VM, Fathali M. Comparison of effects of four subgrid-scale turbulence models in large eddy simulation of a large wind farm. J Mech Sci Technol. 2023;37(5):2439–49. doi:10.1007/s12206-023-0420-y. [Google Scholar] [CrossRef]
38. Meile W, Brenn G, Reppenhagen A, Lechner BF. Experiments and numerical simulations on the aerodynamics of the Ahmed body. CFD Lett. 2011;3(1):32–9. [Google Scholar]
39. Mohammadikalakoo B, Schito P, Mani M. Passive flow control on Ahmed body by rear linking tunnels. J Wind Eng Ind Aerodyn. 2020;205:104330. doi:10.1016/j.jweia.2020.104330. [Google Scholar] [CrossRef]
40. Hunt JC, Wray AA, Moin P. Eddies, streams, and convergence zones in turbulent flows. Studying turbulence using numerical simulation databases, 2. In: Proceedings of the 1988 Summer Program; 1998 Jun 20–24; San Francisco, CA, USA. Stanford, CA, USA: Center for Turbulence Research; 1998. p. 193–208. [Google Scholar]
41. He H, Li GZ, Yang WC, Liu YK, Deng E. Crosswind-induced aero-performance deterioration of a vehicle passing by a hill with different windproof measures. Phys Fluids. 2025;37(1):015116. doi:10.1063/5.0244864. [Google Scholar] [CrossRef]
Cite This Article
 Copyright © 2025 The Author(s). Published by Tech Science Press.
This work is licensed under a Creative Commons Attribution 4.0 International License , which permits unrestricted use, distribution, and reproduction in any medium, provided the original work is properly cited.
 Downloads
 Citation Tools