
 Submit a Paper
 Propose a Special lssue
 Open Access
ARTICLE

Boiling Dynamics and Entropy Generation in Inclined Tubular Systems: Analysis and Optimization
1 National Joint Engineering Research Center of Energy Saving and Environmental Protection Technology in Metallurgy and Chemical Engineering Industry, Kunming University of Science and Technology, Kunming, 650093, China
2 Engineering Research Center of Metallurgical Energy Conservation and Emission Reduction, Ministry of Education, Kunming University of Science and Technology, Kunming, 650093, China
3 Faulty of Metallurgical and Energy Engineering, Kunming University of Science and Technology, Kunming, 650093, China
* Corresponding Author: Jianxin Xu. Email:
Fluid Dynamics & Materials Processing 2025, 21(7), 1571-1600. https://doi.org/10.32604/fdmp.2025.063741
Received 22 January 2025; Accepted 29 April 2025; Issue published 31 July 2025
 View Full Text
 Download PDF
Abstract
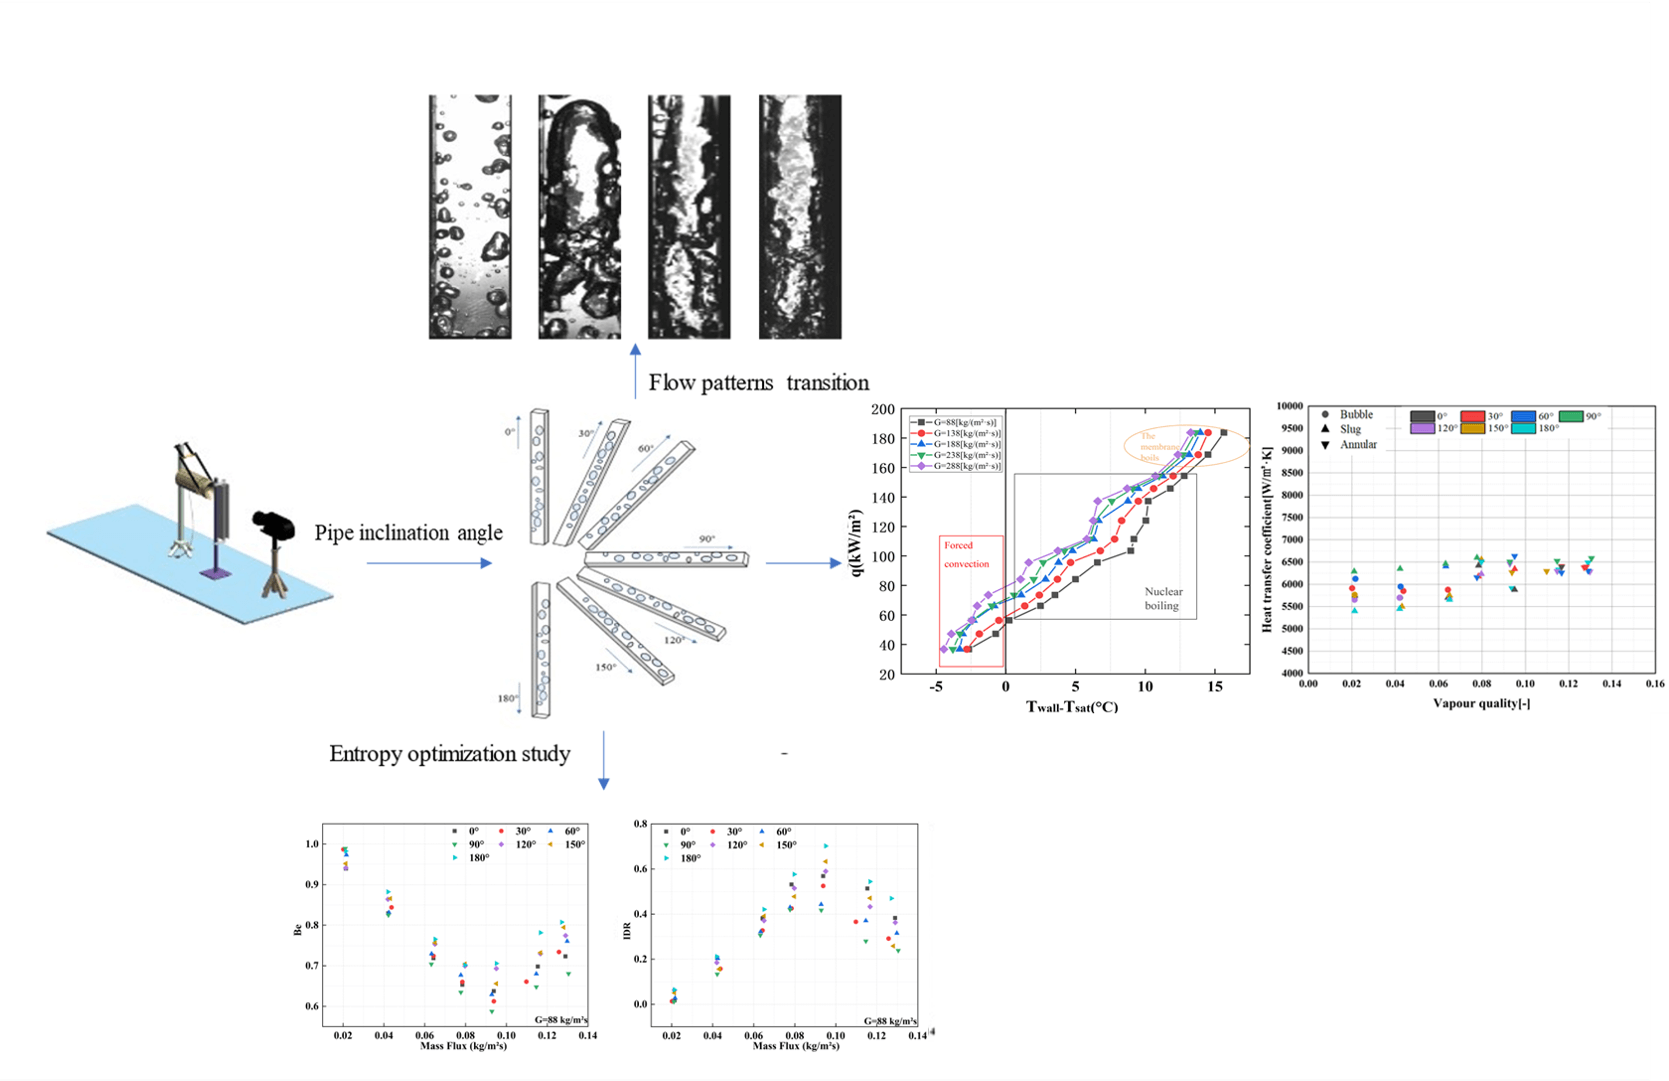
This research explores the characteristics of boiling in inclined pipes, a domain of great importance in engineering. Employing an experimental visualization technique, the boiling dynamics of deionized water are examined at varying inclination angles, paying special attention to the emerging flow patterns. The findings demonstrate that the inclination angle significantly impacts flow pattern transitions within the 0° to 90° range. As the heat flux rises, bubbles form in the liquid. The liquid’s inertia extends the bubble-wall contact time, thereby delaying the onset of bulk bubble flow. Beyond a 90° inclination, however, the patterning behavior is more influenced by the fluid velocity. At low speeds, incomplete pipe filling results in a large liquid plug hindering flow, while high speeds lead to full pipe filling. In general, gravity, inertia, buoyancy forces, and capillary forces are the main influential factors in the considered problem. However, an analysis of the heat transfer coefficient and boiling curve for different inclination angles reveals that the observed variations are essentially due to corresponding changes in the flow pattern. Finally, an optimal mass flux and inclination angle, able to minimize total entropy generation and improve heat transfer efficiency, are determined by means of an entropy generation analysis.Graphic Abstract
Keywords
Gas-liquid two-phase flow [1] represents a significant phenomenon characterized by the concurrent movement of two distinct fluid phases—gas and liquid—within a shared pipeline or apparatus. This flow pattern is of considerable relevance across various disciplines, including chemical engineering, petroleum engineering, energy production, and environmental engineering, owing to its intricate dynamics and diverse applications. The primary attributes of gas-liquid two-phase flow encompass the development and transformation of microscopic structures, such as bubbles, droplets, and interfaces, as well as the interactions and transfer mechanisms that occur between these phases.
Historically, many studies have focused on flow behavior in vertical and horizontal orientations [2–4]. However, in practical engineering applications, it is common to encounter flows with varying inclination angles. As a result, the study of gas-liquid two-phase flow at different inclination angles has become an increasingly important research direction.
Several significant studies have focused on the heat transfer characteristics of gas-liquid two-phase flow. For instance, Maqbool [5] and Oliveira [6], for instance, studied heat transfer coefficients in horizontal and vertical tubes using propane and R-1270 as refrigerants. They emphasized how mass flux, heat flux, vapor quality, and flow patterns influence heat transfer. Their findings indicate that heat flux and saturation temperature significantly affect the heat transfer coefficient, while mass flow rate and vapor quality have a minor impact. Similarly, studies by Harirchian and Garimella [7] and Cheng and Xia [8] have examined the effects of inlet subcooling and surface wettability on flow boiling pattern transitions in both horizontal and vertical tubes, noting that these factors play a crucial role in flow dynamics.
Recent investigations into nanofluids have underscored their influence on heat transfer within intricate systems. Notably, the research conducted by Maqbool and Haider [9] examines the time-dependent flow of Reiner–Rivlin nanofluid over a stretching sheet, incorporating Arrhenius activation energy and binary chemical reactions. This study offers valuable insights into the thermal and flow characteristics of nanofluids under unsteady conditions. Employing Buongiorno’s model for nanoscale particles, the authors account for variables such as Joule heating and activation energy, which significantly affect both heat transfer and flow dynamics in complex fluid systems. Their findings demonstrate that the presence of nanoparticles in the fluid can markedly improve heat transfer efficiency, a principle that may also be applicable to gas-liquid two-phase flow systems, particularly when evaluating the effects of nanoparticle concentration and magnetic fields on flow properties.
Cheng et al. [10] and Li et al. [11] conducted investigations into the behaviors of pressure drop, revealing that increased heat fluxes, mass flow rates, and vapor qualities result in elevated two-phase frictional pressure drop gradients. Their research also indicated that the two-phase frictional pressure drop gradient diminishes at elevated saturation temperatures. Following the occurrence of the dry point, it was observed that at higher mass flow rates, both the heat transfer coefficient and the two-phase frictional pressure drop gradient exhibit a tendency to decrease. Established correlations for two-phase pressure drop, as proposed by Rao et al. [12], Yao et al. [13] and Zhang et al. [14], along with correlations for two-phase heat transfer coefficients developed by Thome [15], and Lin et al. [16], have demonstrated a strong predictive capability for experimental data.
In thermodynamics, entropy quantifies the degree of disorder in a system, while entropy generation refers to the total amount of entropy produced during a process. Entropy generation analysis [17] is used to optimize thermodynamic systems by minimizing irreversibility. Feizabadi et al. [18], Hojati et al. [19], and Abdous et al. [20] investigated the impact of entropy generation resulting from structural changes in tubes. Their findings suggest that during flow boiling, the contribution of pressure drop to entropy generation increases with rising vapor quality and mass flux, while the heat transfer contribution diminishes. By minimizing entropy generation, systems can achieve higher heat transfer efficiency.
This research employs deionized water to explore the transitions of diverse flow patterns at varying inclination angles. The study assesses the impact of these flow pattern variations on heat transfer and pressure drop by manipulating parameters such as heat flux, mass flux, and vapor quality. Additionally, the study provides a comprehensive summary of the heat transfer and pressure drop characteristics across different flow patterns. Ultimately, through an analysis of entropy generation, this investigation seeks to determine the optimal mass flux and inclination angles that minimize entropy generation while improving heat transfer efficiency.
2 Experimental Equipment and Methods
The experiment was conducted in a narrow channel featuring both a downward and upward slanted heating wall. As illustrated in Fig. 1, the experimental apparatus comprises a test section, a condenser, and a heating unit. The test section is specifically designed to facilitate the regulation of the inclination angle and mass flow rate. Deionized water is circulated through the experimental loop, where it transforms into a vapor-water mixture within the test section. Upon exiting the test section, the mixture proceeds to the condenser, where it undergoes condensation into liquid form and accumulates in a water tank. This liquid subsequently combines with a subcooled fluid in the tank, is reheated to a constant temperature by a heater, and is then directed into a constant temperature water tank. The fluid, now stabilized at a consistent temperature, is drawn by a pump and reintroduced into the test section.
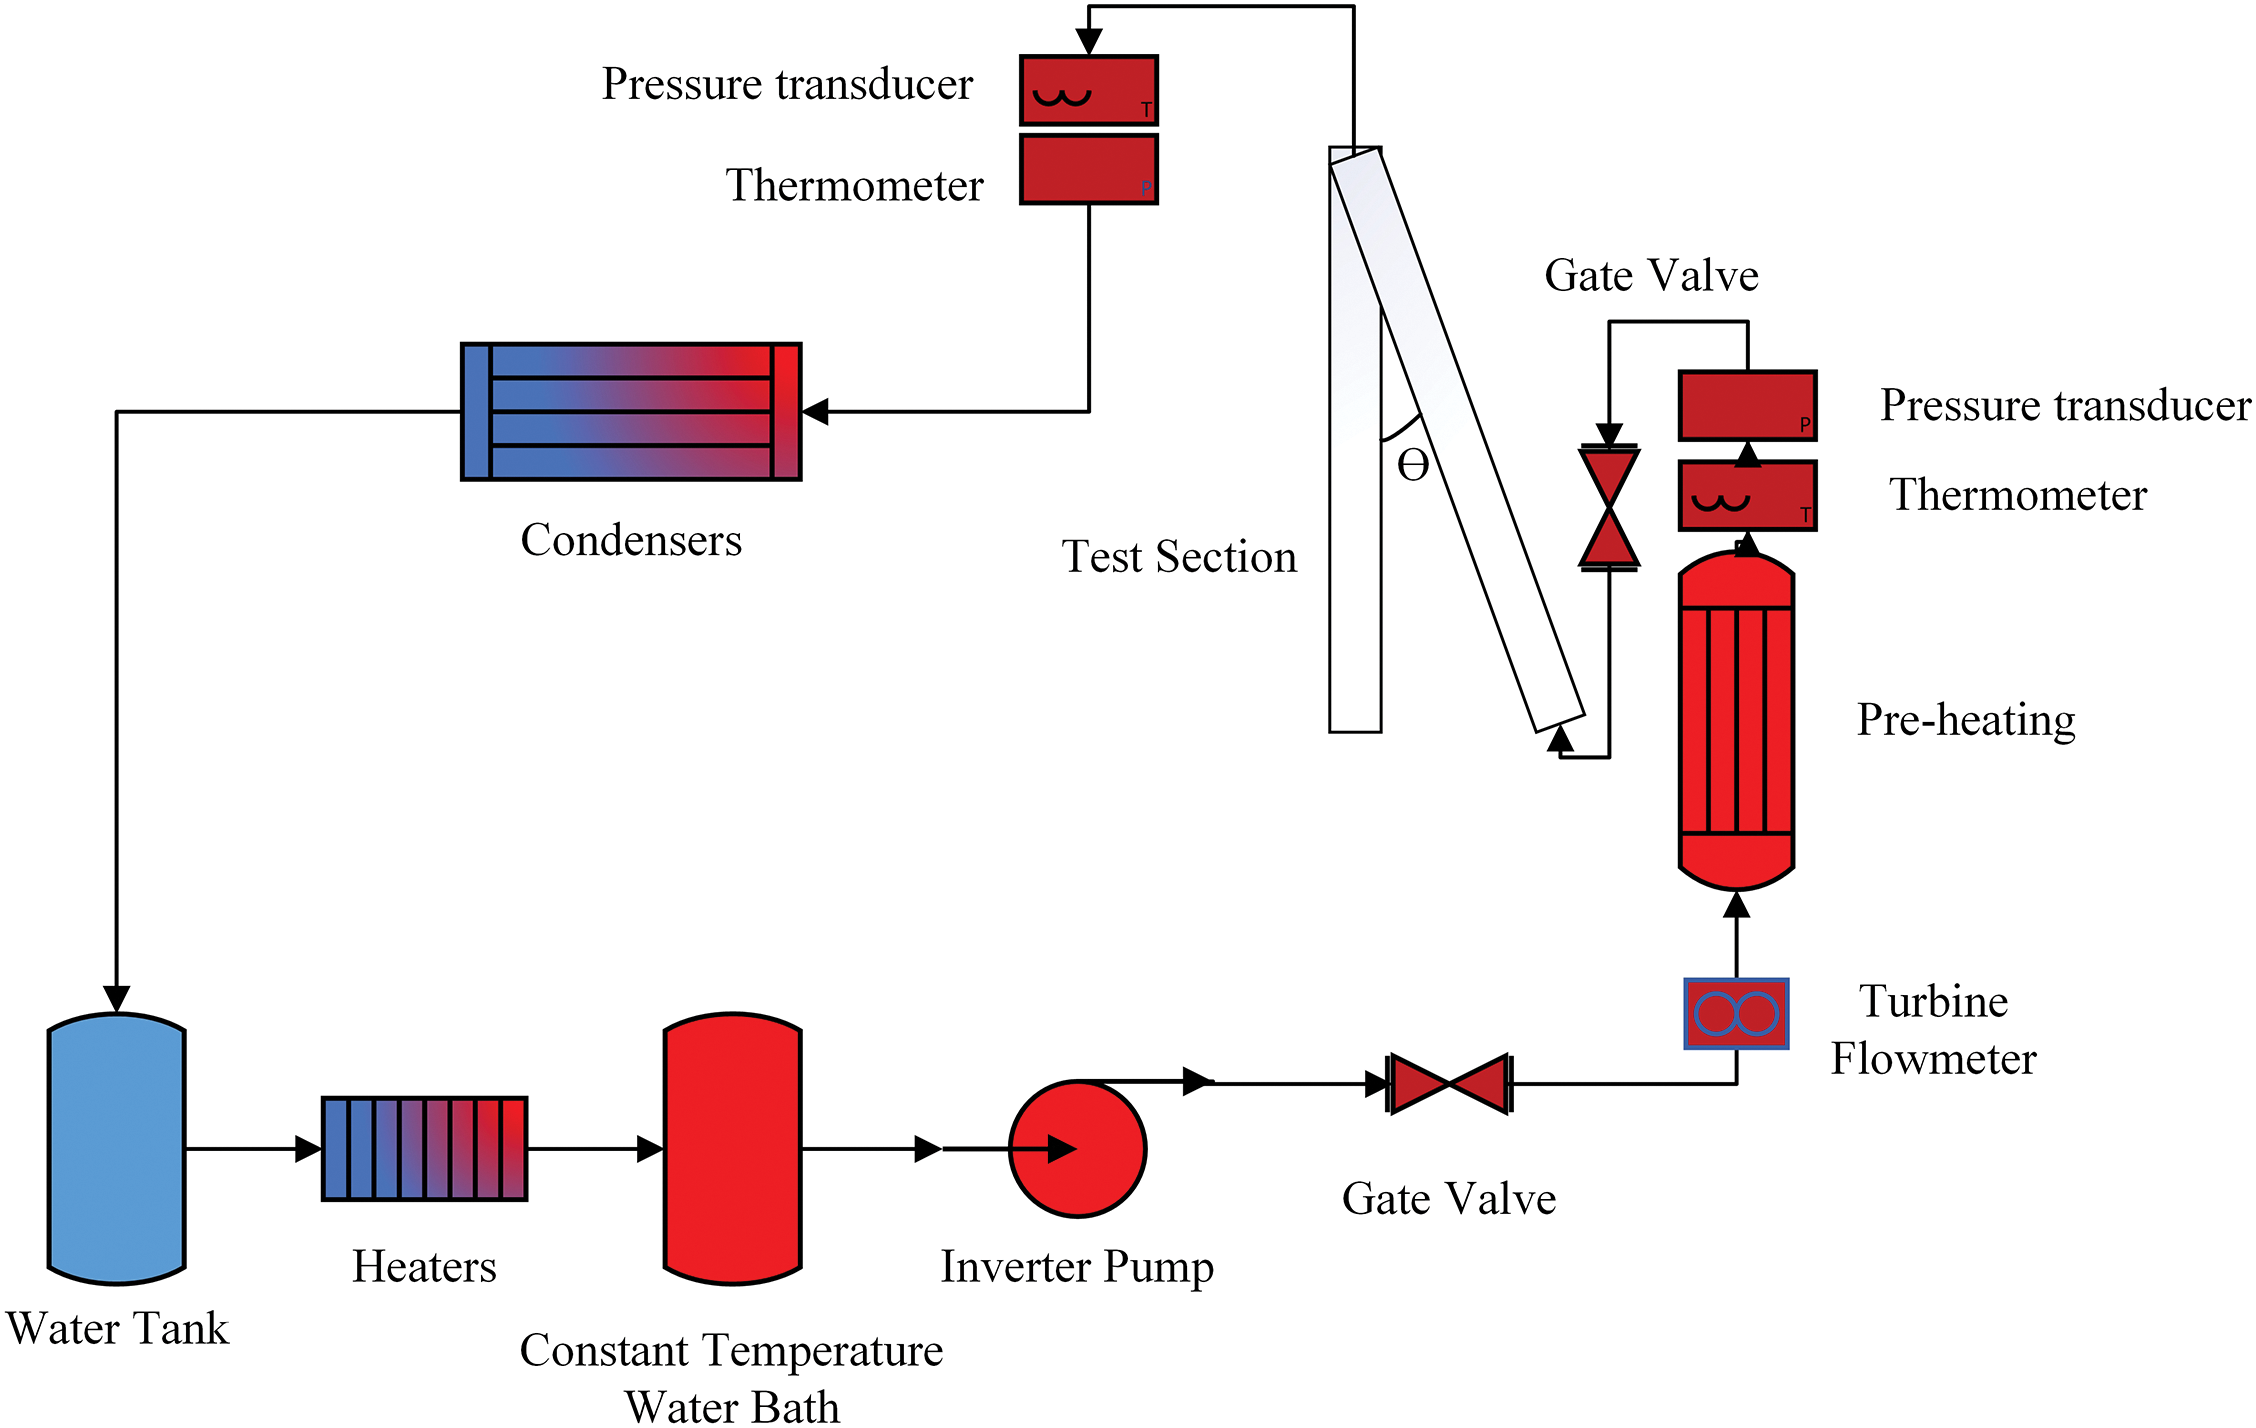
Figure 1: Experimental flow chart
A flow meter located at the outlet of the pump provides precise measurements of the flow rate of deionized water, with an accuracy of ±0.03%. A preheater, situated at the inlet of the test section, facilitates the regulation of the mass of the two-phase flow by adjusting the input power, thereby compensating for any losses encountered during the process and ensuring a consistent inlet temperature. Temperature and pressure differential sensors are strategically placed at both the inlet and outlet of the test section to monitor the temperature and pressure drop, while also guaranteeing the maintenance of a constant inlet temperature. Once the inlet temperature is stabilized at the predetermined level, the valve is opened, permitting the deionized water to flow into the test section for heating, which is essential for achieving stable subcooling conditions.
Fig. 2 illustrates the double-sided heating test section employed for visualization studies. This test section comprises a tiltable aluminum frame that supports the circuit, a transparent glass tube, and heating elements. To facilitate the direct observation of flow patterns within the evaporator, LED lights and a high-speed camera are utilized. The overall length of the test section measures 500 mm, with both the height and width of the channel cross-section being 10 mm. The effective heating length is 200 mm, accompanied by an inlet length of 200 mm and an outlet length of 100 mm; the primary focus for observation and measurement is the effective heating distance. The transparent portion of the narrow channel is constructed from 4 mm quartz glass, while 2 mm thick copper plates are employed for heating, secured in position by support brackets and screws. Sealing is achieved through the application of sealing tape to ensure the integrity of the heating surface. Additionally, five K-type thermocouples, each with a diameter of 0.3 mm, are uniformly distributed along the heating wall to monitor temperature, and they are affixed using high-temperature adhesive to ensure optimal contact. The heater operates on direct current, with the total power being quantified using a multimeter.
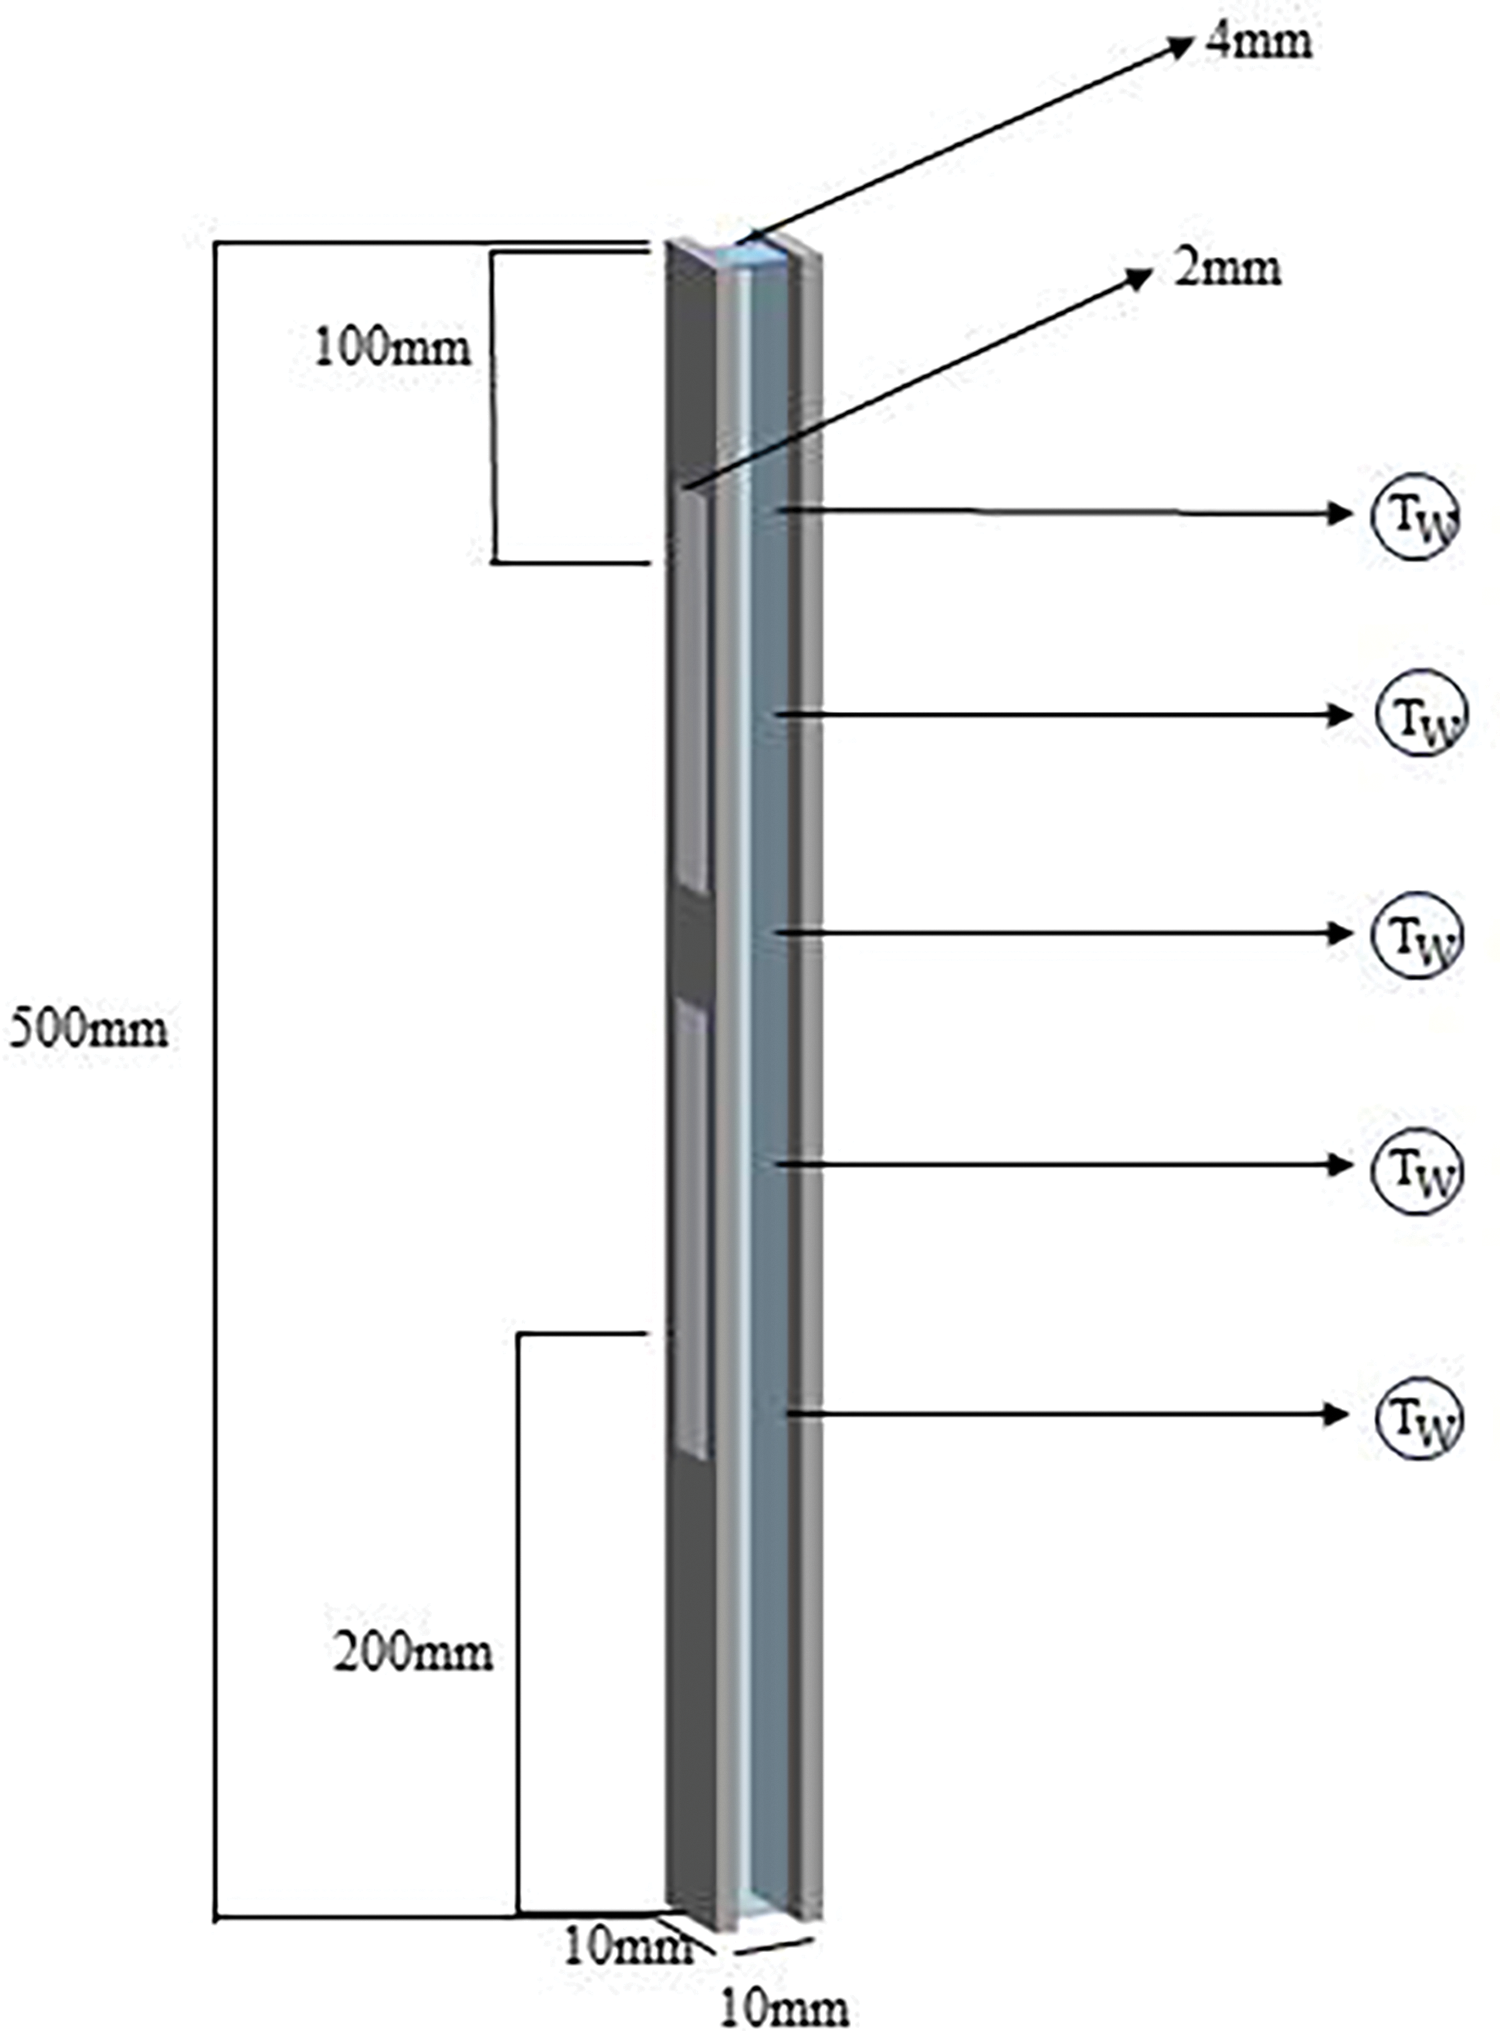
Figure 2: Structure of the test section
Utilizing LED background illumination in conjunction with a high-speed camera, as illustrated in Fig. 3, we effectively visualized bubble dynamics within the channel. To document the boiling flow phenomena occurring in the channel, we employed a high-speed camera capable of recording at a rate of 2000 frames per second. The LED lights were strategically positioned behind the transparent viewport, providing illumination perpendicular to the lens of the high-speed camera. As the inclination angle of the test section was modified, the angles of both the LED light source and the high-speed camera were concurrently adjusted to ensure optimal direct illumination of the camera. The computer system is responsible for managing high-speed camera image acquisition and collecting pressure data.
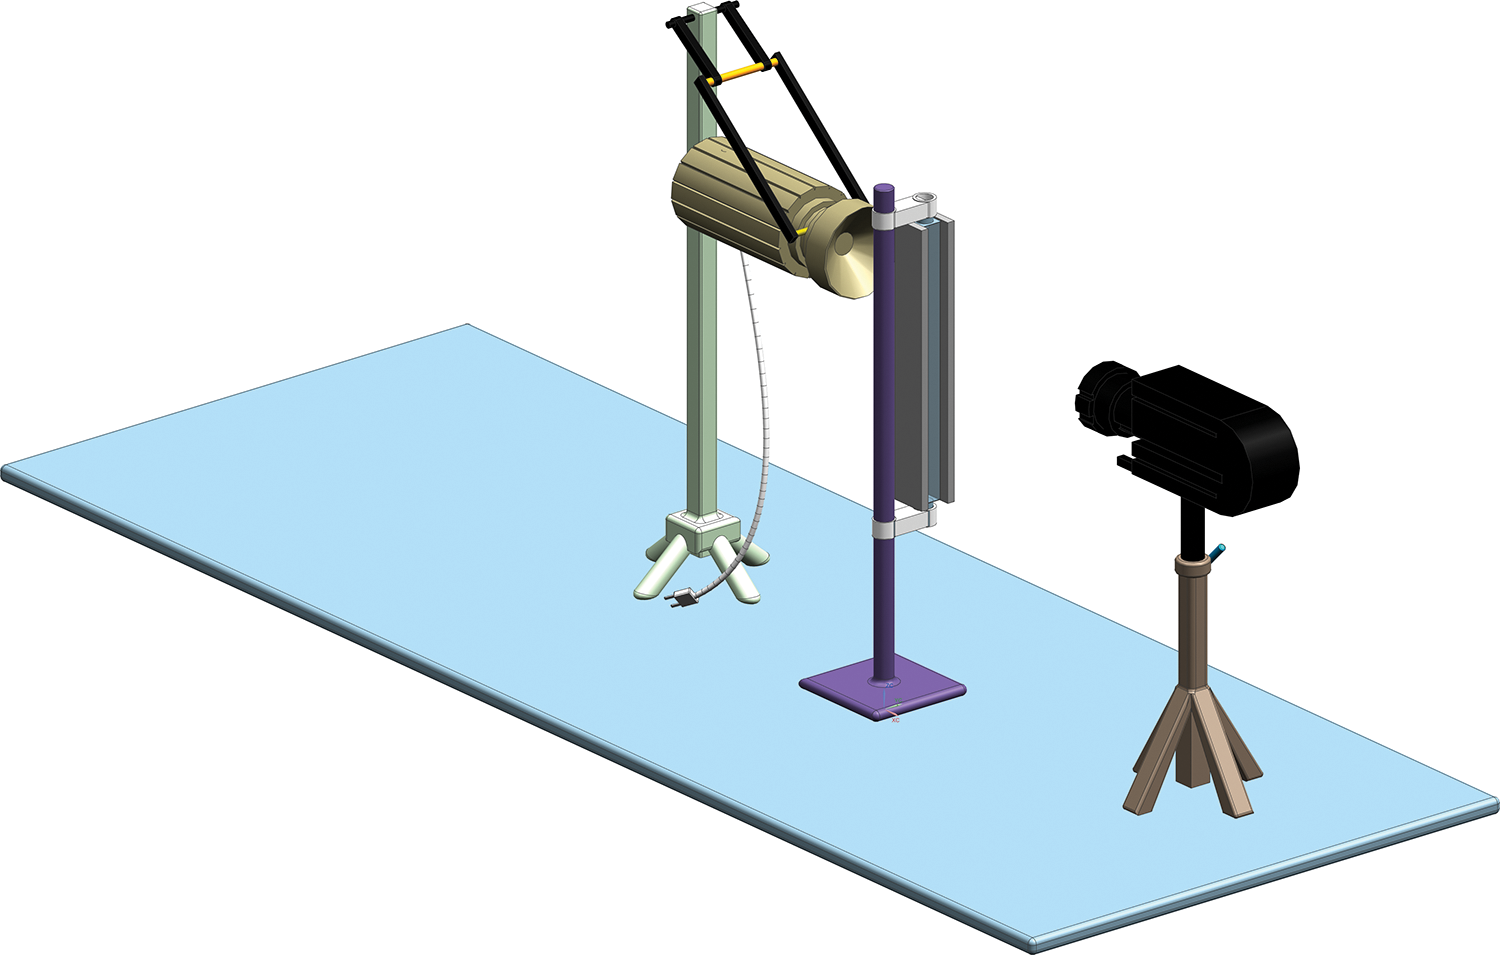
Figure 3: Layout of the experimental setup
2.3 Experimental Conditions and Data Reduction
Prior to the commencement of the experiment, all instruments underwent calibration. The initial phase of the experiment was executed as a unidirectional convective heat transfer assessment. To guarantee the reliability and precision of the data collected, ten independent tests were performed, with the saturation temperature for each trial documented as presented in Table 1:

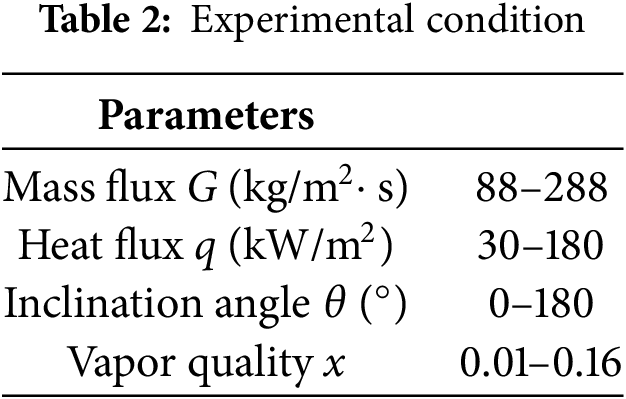
According to the data presented, the computed average saturation temperature is 93°C, accompanied by a standard deviation of 0.15°C. This finding corroborates the repeatability of the experimental procedure and the precision of the measurement instruments, both of which fall within an acceptable range. To further assess the stability of the experimental conditions, we defined “acceptable ranges” for the variations in parameters. These ranges, derived from preliminary test outcomes, are designed to maintain the stability of the flow boiling state. In each experimental group, the variations of these parameters were meticulously regulated within the established acceptable ranges, as illustrated in Table 2.
In addition, all inclination angles ranging from 0° to 180° were established as a set of experimental conditions, while maintaining a constant inlet temperature. The heat flux and mass flux were varied for each group to assess the pressure drop associated with each experiment. Each experimental group was designed to ensure that the fluid traversed the test section for over 5 min, with stable data collected for 2 min.
Utilizing measurements of outlet temperature, the external wall temperature of the test section, pressure, heat flux density, and a stable inlet temperature, adjustments were made to the flow rate and heat flux. This facilitated the calculation of vapor quality, internal wall temperature, saturation temperature, and heat transfer coefficient for each group across the different inclination angles.
The experimental heating process comprises two components: preheating and the heating of the test section. The preheating segment is primarily designed to elevate the fluid to a predetermined temperature prior to its entry into the test section. The heating of the test section is accomplished using resistance heaters that are affixed at both extremities of the straight pipe, utilizing direct current. Consequently, the heat flux within the test section is defined as follows:
where U, I are the measured voltage and current, respectively,
The contact area of the test section:
where C is the total heated perimeter of the channel cross-section, equal to the sum of the widths of the two heated sides, and L is the test section’s effective heated length.
where
The fluid data at the inlet and outlet of the heating section were measured using thermocouples and pressure sensors. Using this data, the enthalpy values at specific pressures and temperatures were obtained from the Refprop database.
For the two-phase flow of deionized water, the mixture enthalpy was determined by using the following equation:
Comprehensive experimental assessments have established that the thermal efficiency of the system is approximately 95%. This finding suggests that a significant proportion of the input energy is successfully transformed into heat energy within the test section.
In order to more precisely represent the distribution and transmission of heat within the copper plate resulting from the Joule effect, this research utilizes a multidimensional heat conduction model. Since heat is transmitted not only in the thickness direction but also across the width and length of the copper plate, a multidimensional approach offers a more thorough understanding of the temperature field.
The multidimensional heat conduction equation is based on Fourier’s law of heat conduction, expressed as follows:
where
Boundary and Initial Conditions
Boundary Conditions: Depending on the experimental setup or real-world application scenario, this might include constant temperature boundaries, convective heat transfer boundaries, or adiabatic boundaries.
Initial Conditions: Assuming that at the beginning of the experiment, the entire copper plate is at ambient temperature or a predefined temperature.
Assuming that axial heat transfer can be neglected and the heat flux density is uniformly distributed on the heated surface, according to Eq. (5), the heat transfer coefficient h(z) at the axial position z of the test section can be calculated as [21]:
where
The theoretical enthalpy of the test point is calculated by Eq. (7):
where
Therefore, the steam quality x of the test section can be obtained from Eq. (8):
where
According to the second law of thermodynamics, combined with Bejan [22], the entropy generation of the control volume can be expressed as:
where
According to Revellin and Bonjour [23], Eq. (10) is expressed in terms of length dL.
Substituting the steam quality, Eq. (11) is expressed as:
where
From the Gibbs relation [24], available:
Considering that in flow boiling
According to the first law of thermodynamics, assuming that the kinetic energy term and the gravitational term can be neglected compared to the thermal energy term, then calculate the heat transfer rate
Substitute into Eq. (14) as:
For the heat flux q, Eq. (1) is expressed as:
Combining Eqs. (17) and (18), the total entropy generation of two-phase flow is obtained as:
where
In Eq. (19),
The formula for its pressure drop under gravity is as follows:
where
The momentum term pressure drop is estimated:
Finally combining Eq. (22), the total entropy produced per unit length is:
Then the contribution of heat transfer to entropy production is:
The contribution of pressure drop to entropy production is:
From Eqs. (24) and (25), it can be obtained:
The Irreversibility Distribution Ratio (IDR) represents:
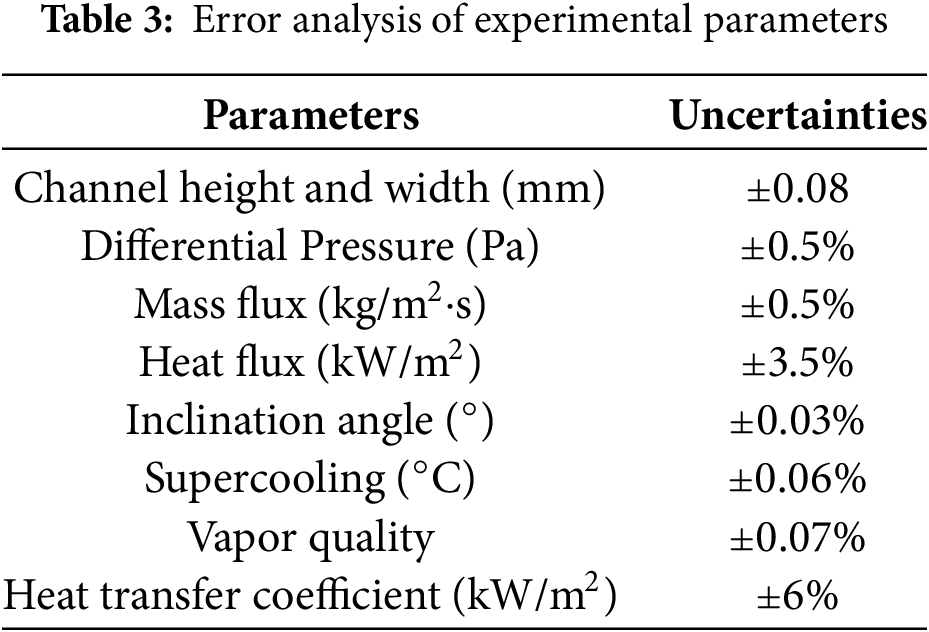
During the experiment, there will be systematic errors and random errors. These errors will always lead to varying degrees of fluctuations in the experimental parameters. To ensure the accuracy of the experiment, all experimental apparatus should be calibrated before the start of the experiment, and human interference should be minimized during the experimental process. The primary experimental data are calculated using the relative uncertainty method proposed by Xin et al. [25]. The relative uncertainty of the heat flux is:
The relative uncertainty of the heat transfer coefficient is:
The error analysis of the experimental parameters is shown in Table 3.
High-speed cameras are utilized to record videos of the subcooled flow boiling process, which are subsequently analyzed using MATLAB to discern flow patterns. The identification of these patterns relies primarily on the observation and analysis of flow characteristics. Although direct observation offers an intuitive approach to recognizing flow patterns, it is susceptible to subjective biases. To mitigate this potential influence, the present study employs an image processing technique to analyze the captured images, as illustrated in Fig. 4. The processed images are then compared with flow pattern maps derived from the research of Baker [26] and Mandhane et al. [27], which categorize various flow patterns based on distinctive flow features. This methodology facilitates a more objective and consistent classification of the flow patterns.
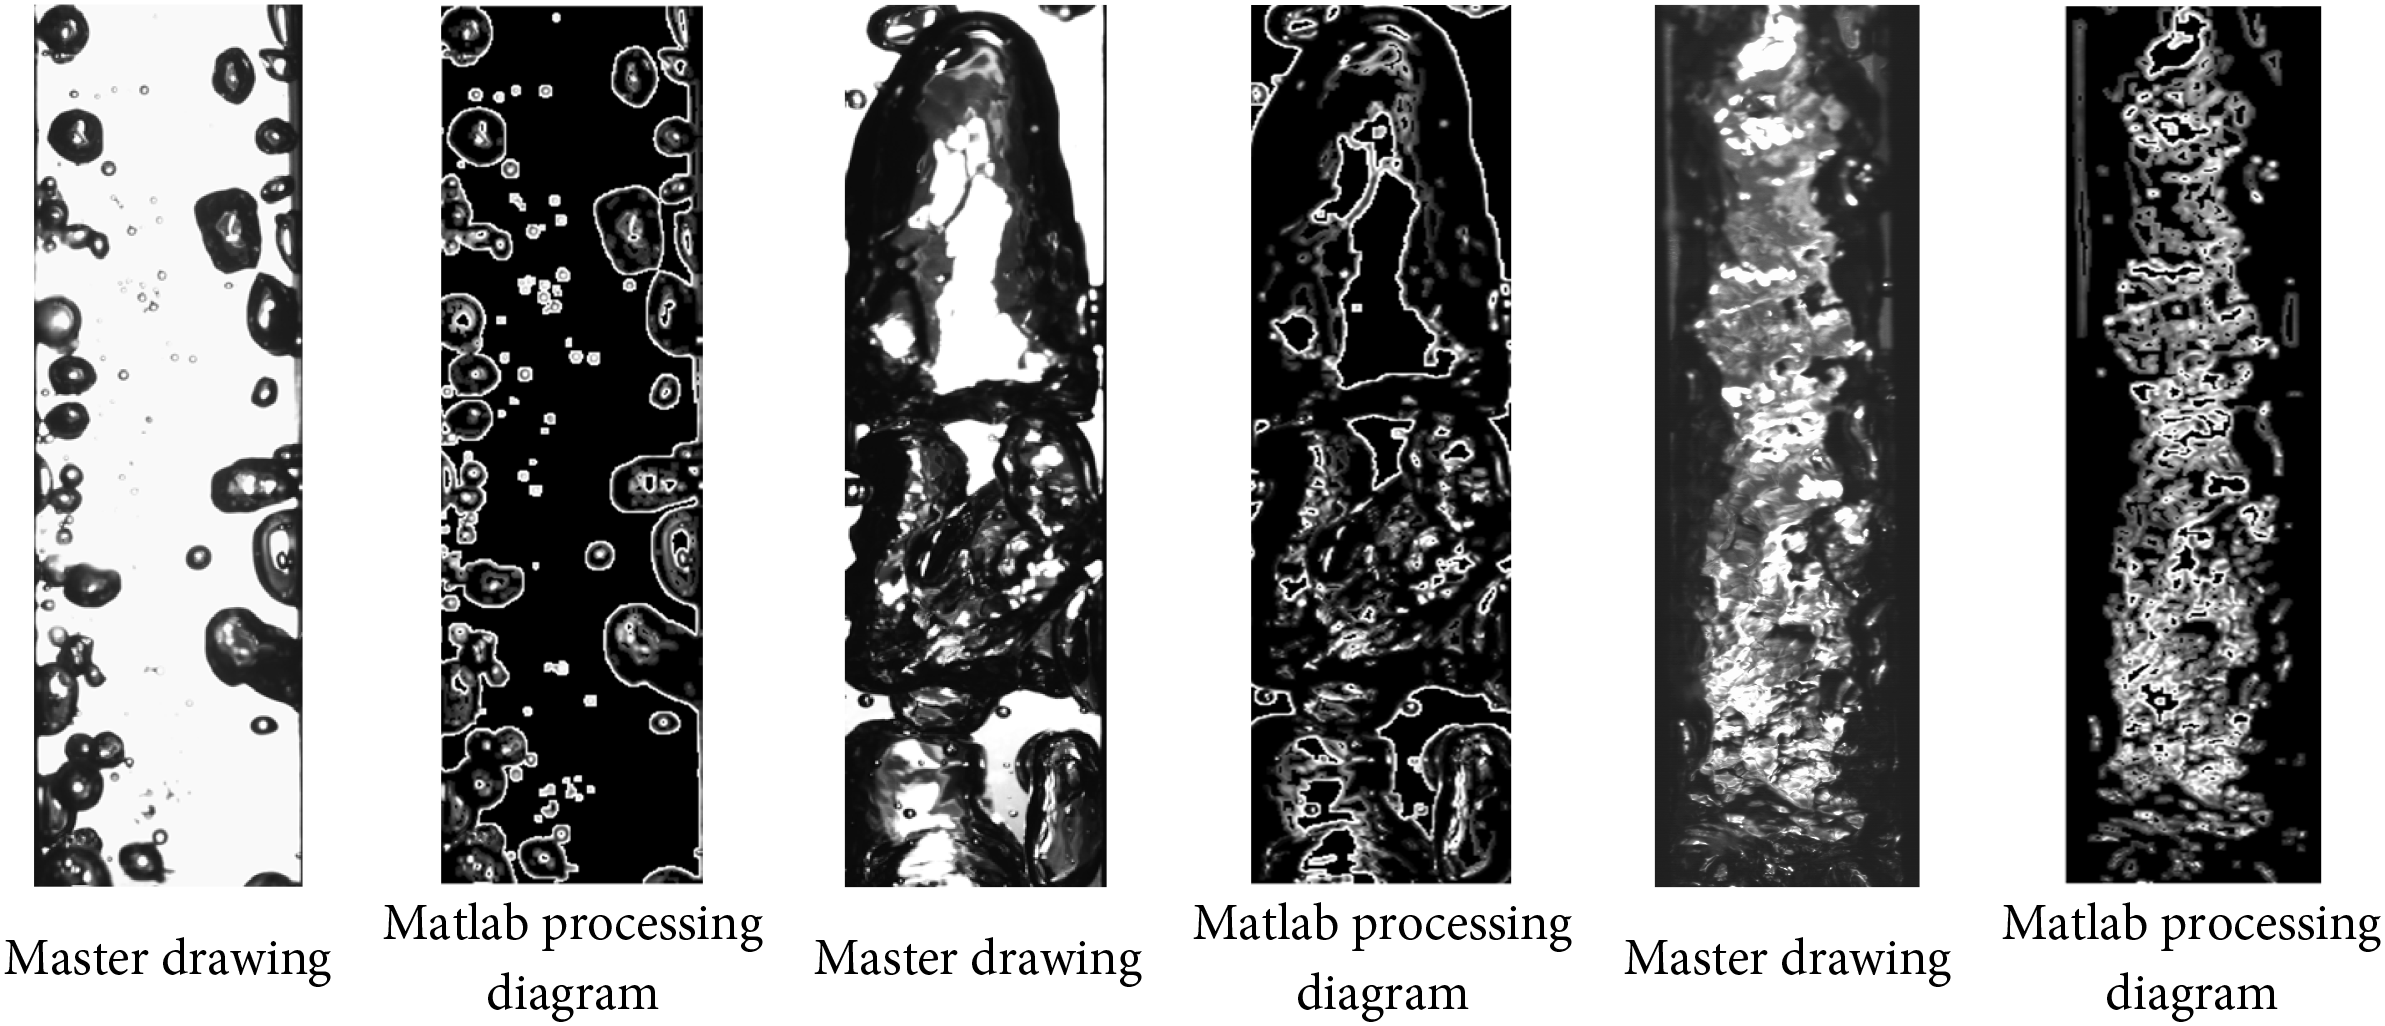
Figure 4: Processing chart
Deionized water within the tube demonstrates a range of flow patterns, which encompass bubble flow, slug flow, throat-annular flow, stirring flow, annular flow, and annular wavy flow. Among these, the four primary flow patterns identified are bubble flow, slug flow, throat-annular flow, and annular flow.
Bubbly flow: This is a flow state formed when bubbles are generated in a liquid under heating and boiling conditions, as shown in Fig. 5a.
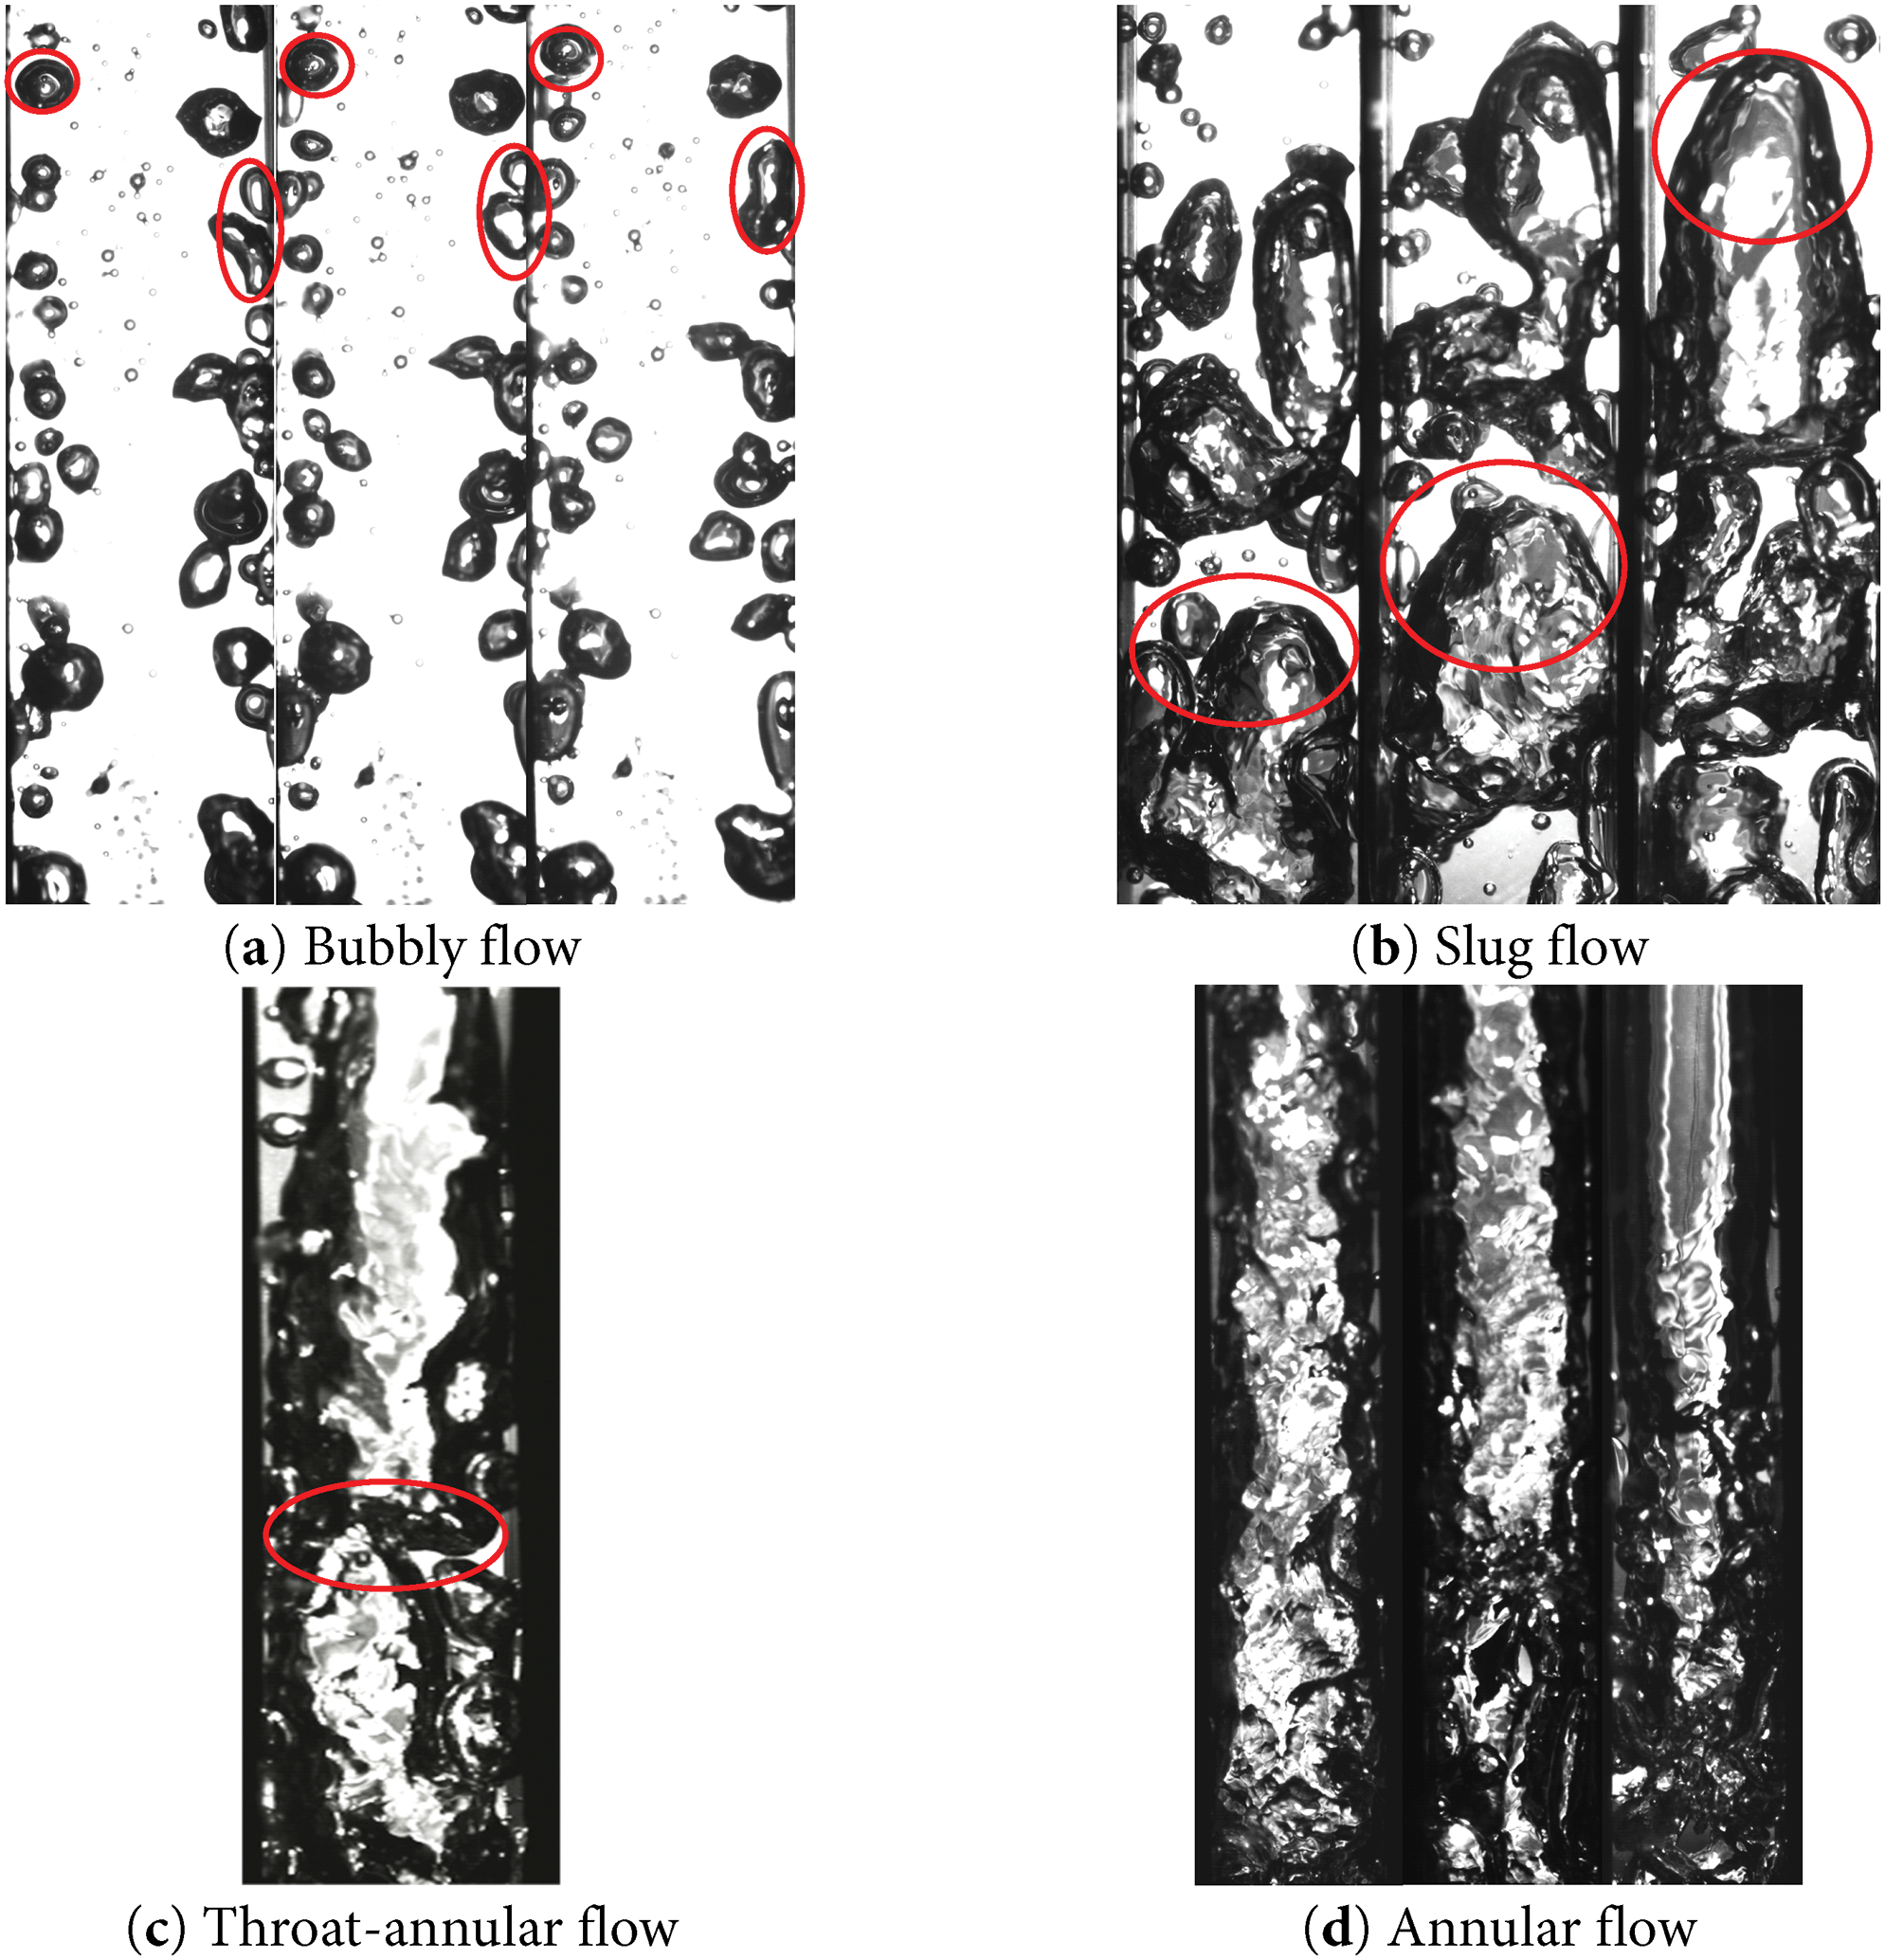
Figure 5: The visualization results of flow pattern (a–d)
Slug flow: Slug flow is a specific state of fluid flow within a pipe characterized by the discontinuous movement of the liquid. In this flow pattern, the fluid traverses the pipe in distinct, spaced units known as “slugs” or “plugs,” which are separated by well-defined boundaries. The dynamics of slug flow are further complicated by the variations in velocity and pressure that occur with the movement of each slug or plug, resulting in a more intricate behavior of the fluid, as illustrated in Fig. 5b.
Throat-annular flow: Throat-annular flow, also referred to as slug-annular flow, denotes a distinct flow pattern that arises when a liquid or gas traverses a constricted passage, commonly referred to as the throat, during fluid movement. This phenomenon is characterized by the interaction between two slugs. As the fluid navigates through the throat, it experiences an increase in velocity accompanied by a decrease in pressure, leading to a notable alteration in the flow characteristics of the liquid or gas [28].
Annular flow: Annular flow represents a prevalent flow configuration observed in two-phase flow systems. This pattern is distinguished by a central gas core encircled by a slender liquid film that adheres to the pipe walls. The defining feature of this flow pattern is the continuous gas phase occupying the center of the conduit, while the liquid phase forms an annular ring surrounding it.
In the conducted experiment, illustrated in Fig. 6, it was observed that under a constant mass flux, an increase in heat flux initiated a transition from an initial one-way flow to the gradual formation of bubbles. These bubbles migrated towards the heated wall, detaching after a certain distance, cooling, and ultimately dissipating into the liquid within the pipe, which remained below the saturation temperature. Upon reaching the saturation temperature, the bubbles within the pipe coalesced due to inertial and buoyant forces, resulting in the formation of Taylor bubbles [29]. This transition altered the flow pattern from bubbly flow to slug flow. As the accumulation of bubbles continued, additional slugs were generated, leading to a phenomenon where one slug penetrates another, termed Throat-annular flow, as depicted in Fig. 5c. This observation aligns with findings by Saisorna et al. [30] and is also known as other names such as Rayleigh–Taylor instability [31] or Kelvin–Helmholt [32] which are associated with specific instability phenomena in fluid dynamics.
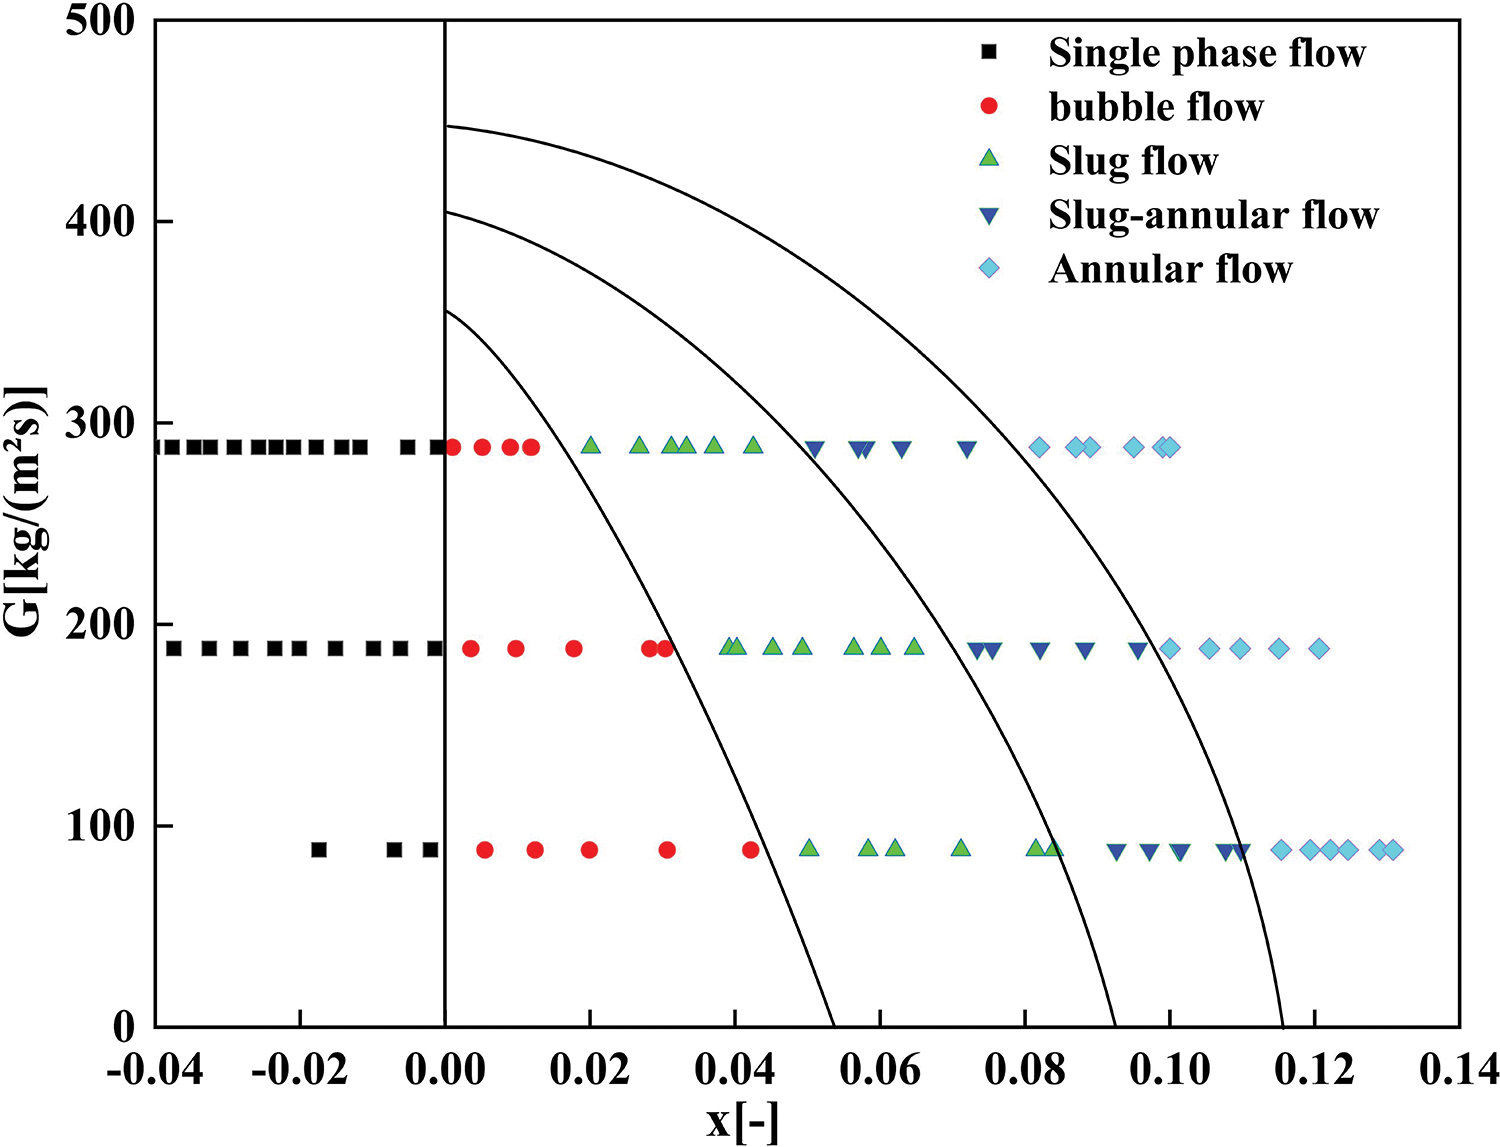
Figure 6: Impact of steam quality and mass flux on flow pattern transitions
Within the pipe, two slugs progressively approached and merged. As their boundaries came into contact, the resultant intense vortices and velocity gradients induced disturbances in the flow region. The interaction between the fluid layers during the merging of the slugs instigated either Kelvin-Helmholtz or Rayleigh-Taylor instabilities. These instabilities facilitated the development of eddies and vortices, leading to the mixing and interweaving of fluid layers. As these instabilities intensified, the disturbances between the fluid layers escalated, and the interaction among the eddies and vortices culminated in the establishment of annular flow. This annular flow, characterized by periodic fluctuations in fluid velocity and pressure distribution, formed a stable annular structure around the central axis of the pipe. An increase in mass flux corresponds to an increase in flow velocity, which enhances turbulent forces within the fluid. This turbulence disrupts the slug or bubble flow pattern and promotes the formation of a central gas core enveloped by a liquid film, thereby facilitating the emergence of ring flow. Consequently, elevated flow rates may expedite the onset of annular flow.
When the mass flux remains constant, the flow angle is gradually changed, with a change every 30 degrees. 0° represents vertical upward flow, 90° represents horizontal flow, and 180° represents vertical downward flow. As shown in Fig. 7.
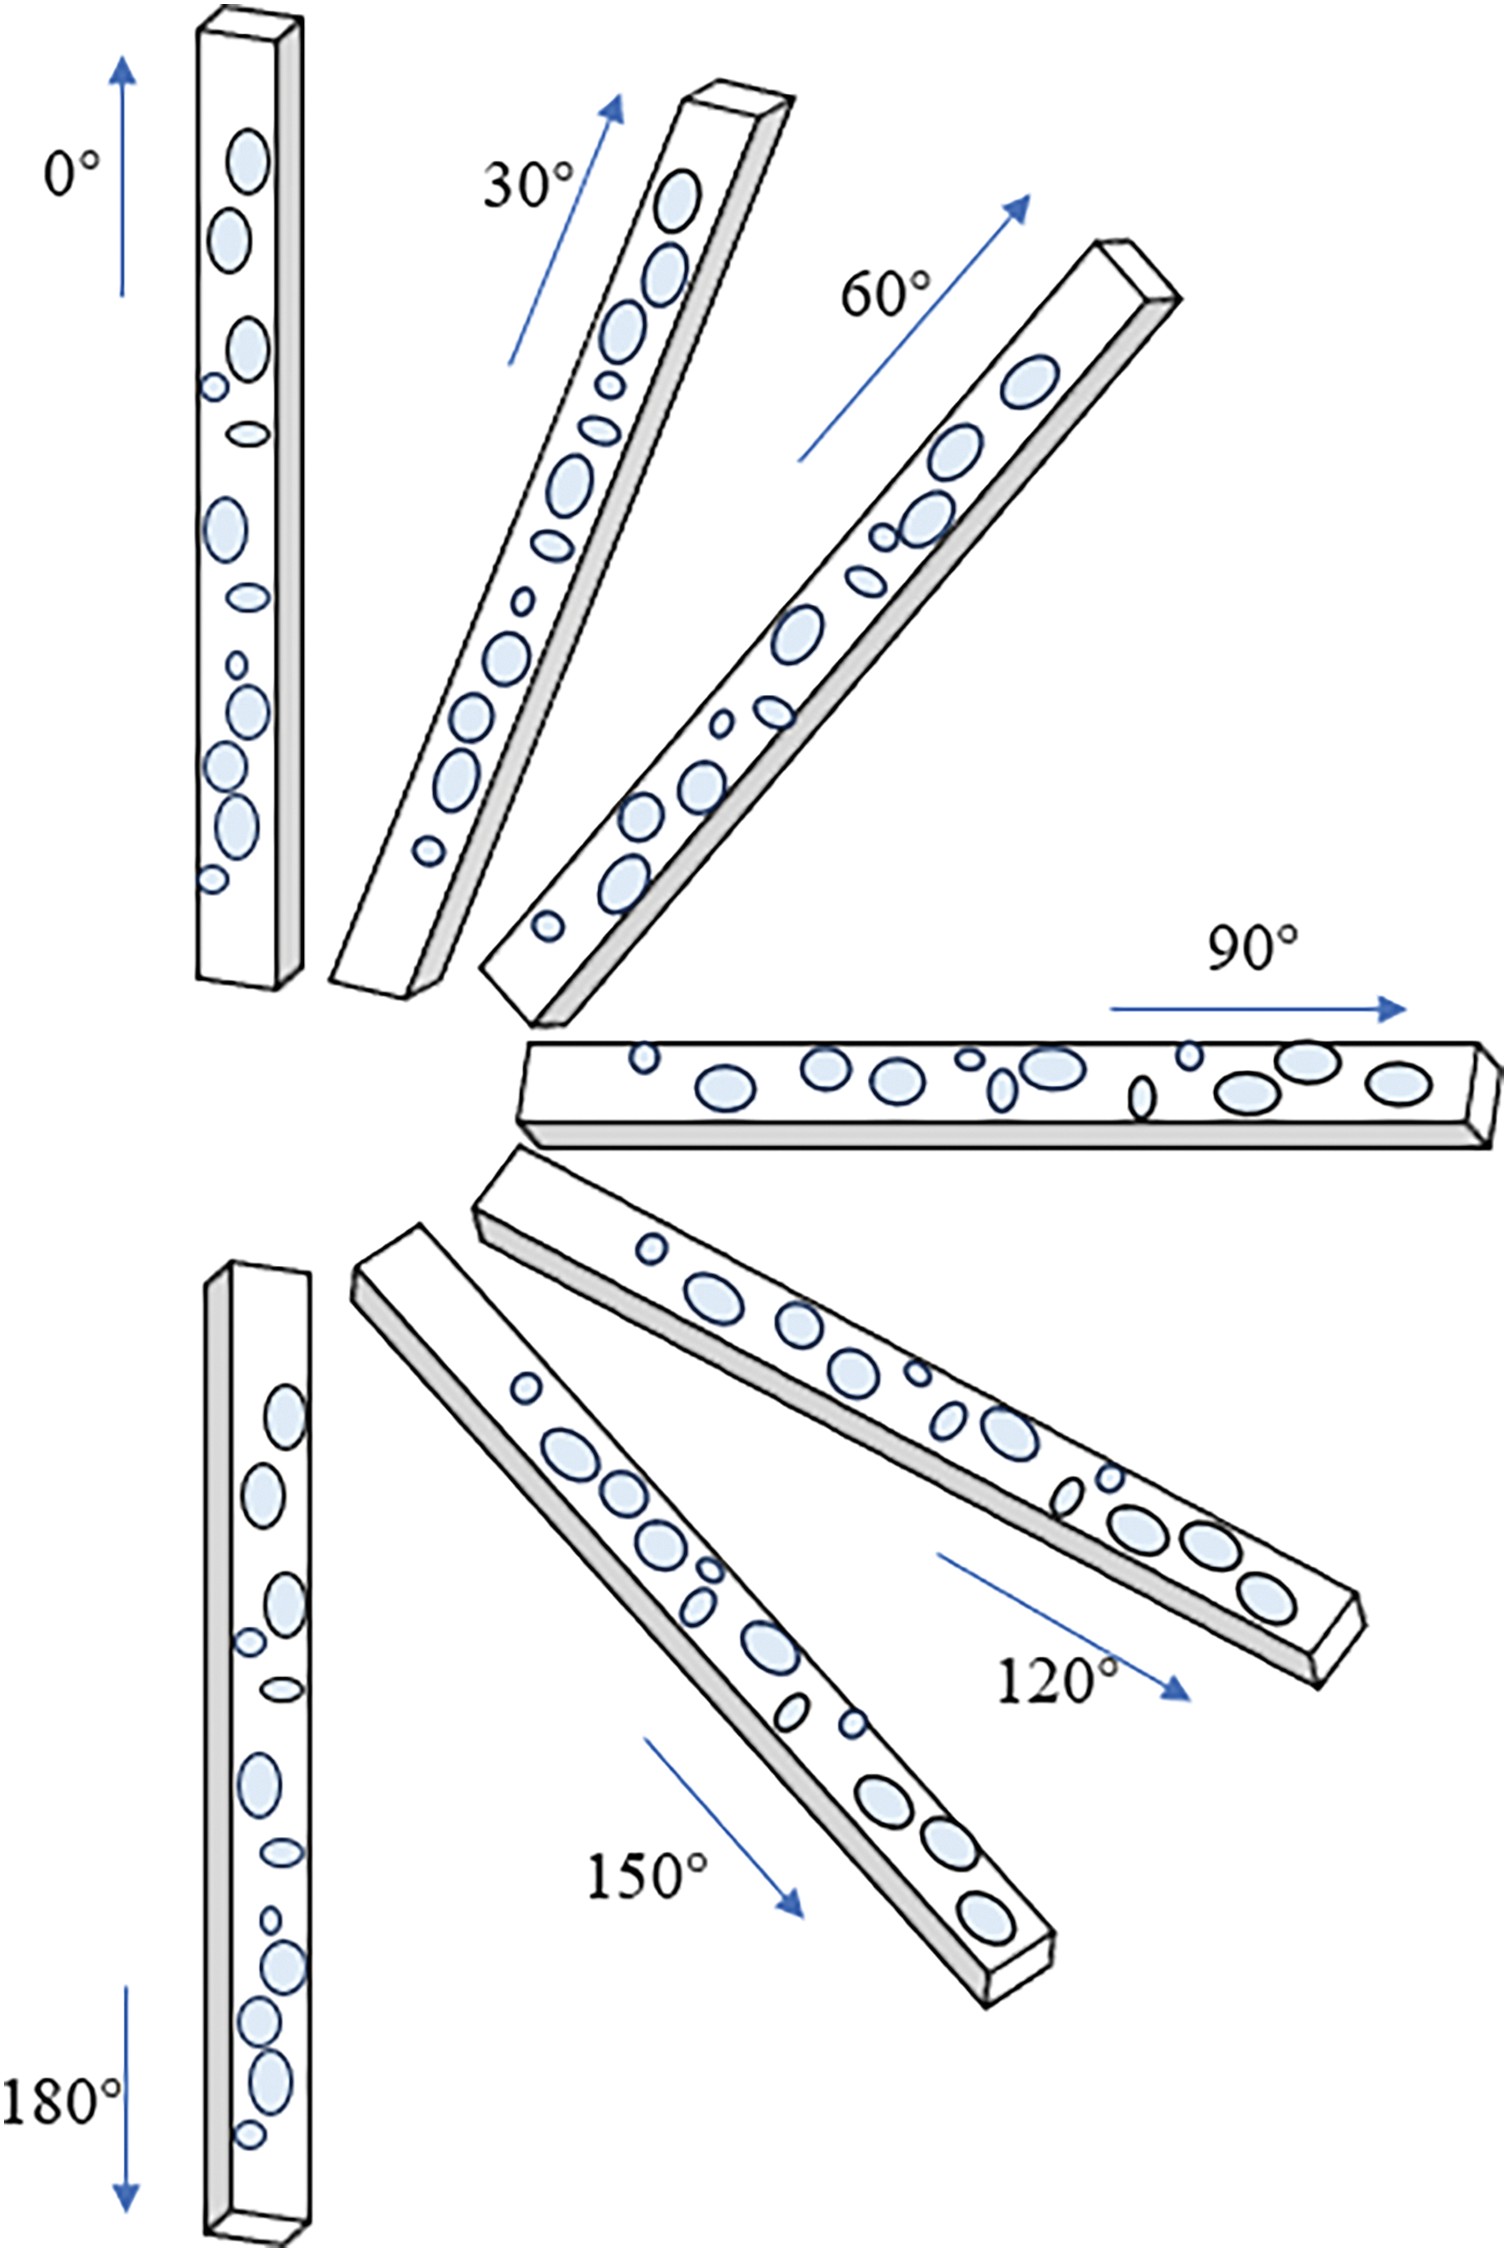
Figure 7: Inclined channel
Within this range, variations in the flow angle will result in alterations to the forces exerted on the bubbles, consequently influencing the fluid’s flow patterns. Distinct inclination angles will yield diverse modifications in flow patterns, and these alterations exhibit asymmetry. As the inclination angle varies, the direction of the force acting on the bubble also shifts, which in turn impacts the stability of the gas-liquid interface and the dynamics of bubble coalescence.
Fig. 8 illustrates the bubble force analysis at different tilt angles. Fig. 9 illustrates how the flow pattern changes with steam quality at various inclination angles under mass fluxes of 88, 188, and 288 kg/m2·s.

Figure 8: Force analysis of bubbles at different angles (a–e)
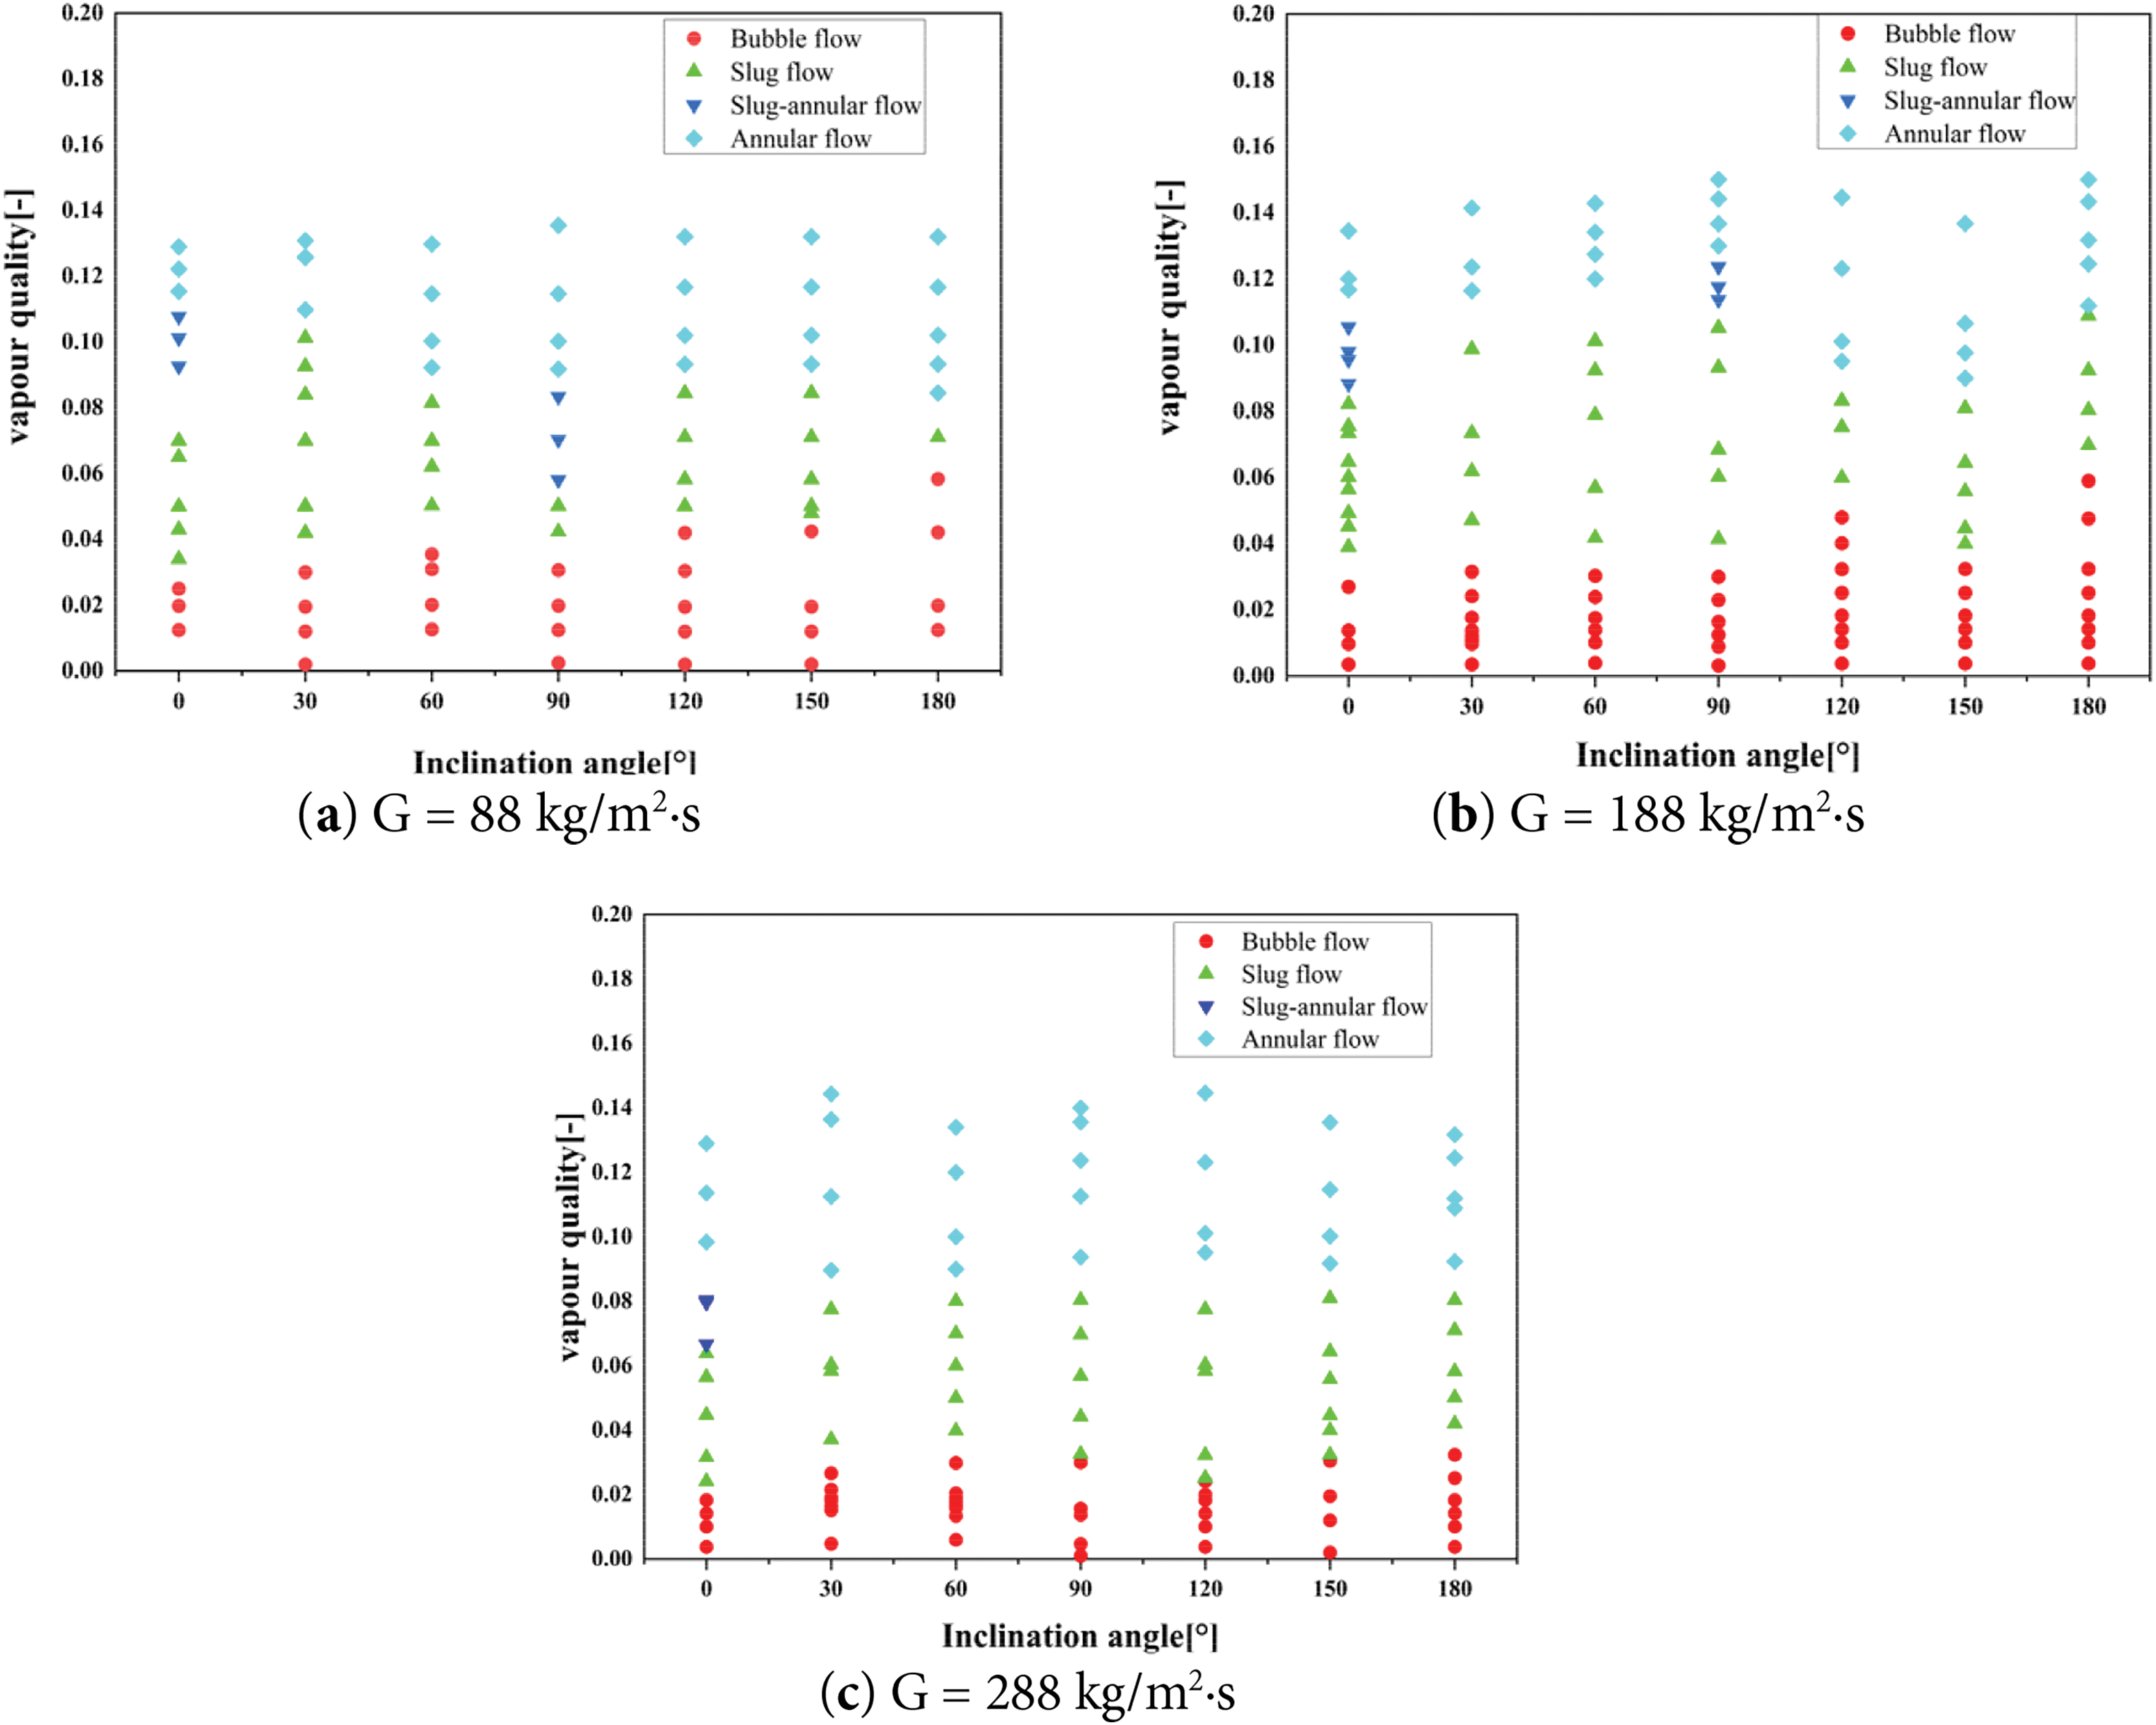
Figure 9: Changes in flow pattern with tilt angle for varying mass fluxes (a–c)
In forced convection boiling systems, the forces acting on the bubbles significantly influence bubble formation, movement, and departure from the heated surface. These forces, as identified by Klausner et al. [33], include surface tension force, drag forces (both steady and unsteady), buoyancy force, lift force, and contact pressure forces. These forces interact differently depending on the inclination angle, thereby affecting the transition between flow patterns and heat transfer performance.
3.1.1 For 0° ≤ θ < 90° (Upward Flow)
In the range of 0° to 90°, the direction of fluid flow partially or fully aligns with the direction of buoyancy acting on the bubble. In this range, the combined effect of buoyancy and the lift significantly enhances the driving force for bubble detachment from the heated surface. After the bubble forms, the main fluid flow quickly carries it away, facilitating its rapid departure from the surface. In addition to buoyancy and lift, the following forces play a key role in the detachment process:
Surface Tension Force (
Quasi-Steady Drag Force (
Unsteady Drag Force Due to Asymmetrical Growth (
Buoyancy Force (
Lift Force (
Effect on Flow Pattern: In the range of 0° to 90°, the synergistic effects of buoyancy, lift, and drag forces result in extremely fast bubble detachment. The bubbles have a very short residence time on the surface, and the flow pattern quickly transitions from bubbly flow to slug flow, significantly enhancing heat transfer efficiency.
3.1.2 For 90° < θ ≤ 180° (Downward Flow)
In the downward flow pattern (90° < θ ≤ 180°), In the flow angle range from 90° to 180°, the fluid flow direction gradually transitions from horizontal to vertically downward, partially or fully opposing the direction of buoyancy acting on the bubble. In this range, the driving force for bubble detachment is significantly weakened, while resistance increases, leading to a longer detachment time. Below is a detailed analysis of the specific forces at play:
Surface Tension Force (
Quasi-Steady Drag Force (
Unsteady Drag Force Due to Asymmetrical Growth (
Buoyancy Force (
Lift Force (
Effect on Flow Pattern: The opposition between buoyancy and drag forces dominates, while the anchoring effect of surface tension increases. As a result, the bubble tends to stay attached to the surface, significantly prolonging the detachment time.
3.1.3 For θ = 90° (Horizontal Flow)
At 90° inclination angle (horizontal flow), the buoyancy force acting on the bubble is directed vertically upward, and the orthogonality between buoyancy and flow direction means that the detachment driving force relies on the synergistic effect of shear force and lift. Below is a detailed analysis of the mechanisms of each force:
Surface Tension Force (
Horizontal component: Anchors the bubble, resisting the lateral shear induced by the drag force.
Vertical component: Presses the bubble downward, requiring buoyancy to overcome this force.
Quasi-Steady Drag Force (
Unsteady Drag Force Due to Asymmetrical Growth (
Buoyancy Force (
Lift Force (
In cooperation with buoyancy, it accelerates vertical detachment, making it one of the core driving forces for bubble detachment in horizontal flow.
Effect on Flow Pattern: In horizontal flow (90°), bubble detachment depends on the synergistic effect of lift and drag forces, with its efficiency lying between that of upward and downward flow.
Under different flow velocity conditions, the flow pattern of flow boiling will undergo different changes. At low flow velocities, the liquid stays longer on the heated wall, leading to partial evaporation of the liquid, which makes it easier to form bubbles. On the contrary, higher flow velocities can significantly change the behavior of flow boiling. First, the high flow velocity reduces the residence time of the liquid on the heated wall, thus reducing the chance of liquid evaporation. This helps prevent the formation of dry spots (areas or points on the heated wall where the liquid cannot fully cover the wall, usually occupied by bubbles), making flow boiling more stable. Moreover, high flow velocity also increases the mixing effect inside the liquid, helping to distribute the liquid and bubbles more evenly in the pipe. This uniform distribution helps reduce the accumulation of bubbles and improves heat transfer efficiency.
3.2 Prediction of Void Fraction
Since the void fraction is required for calculating various pressure drops, such as in Eq. (21), there are about as many void ratio prediction methods documented in the literature as there are which are as follows: (1) Homogeneous flow model, where the slip ratio
Each method has different applications. In this article, the homogeneous flow model proposed by Peng and Shimizu [35] and the slip ratio model proposed by Cioncolini and Thome [36] are used. The calculation methods are as follows:
where
where the parameters h and n are functions of the density ratio
The model based on the drift flux model proposed by Bhagwat and Ghajar [37] can predict the void fraction at different inclination angles. It involves the calculation of the distribution parameter (Co) and the drift velocity (Ugm).
where
where g, r,
Finally:
where
The void fraction measurements are subject to significant uncertainties, primarily stemming from the relative uncertainties in vapor quality and tube diameter. Despite these considerable uncertainties, Fig. 10 shows a limited variation in void fraction with inclination, which aligns well with the predictions from the Bhagwat and Ghajar [37] model.
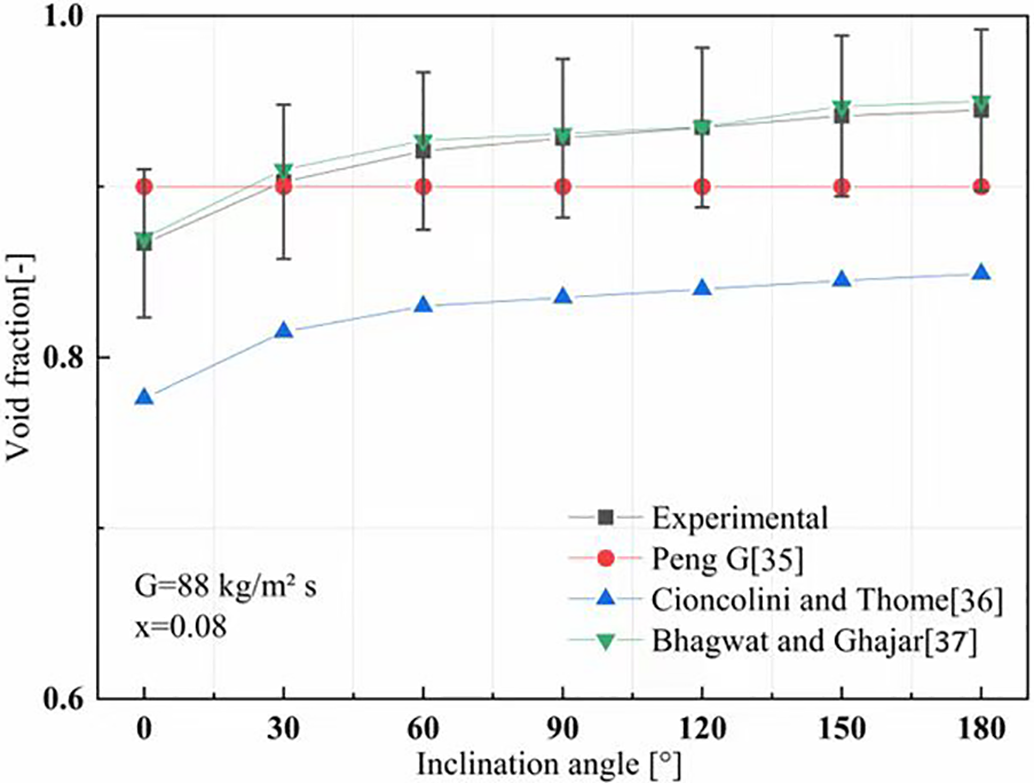
Figure 10: Comparison of the experimental results with three predictive models [35–37]
3.3 Flow Boiling Heat Transfer
Fig. 11 indicates the relationship between wall superheat and heat flow density for different mass fluxes with the same wall in the state of 0°.
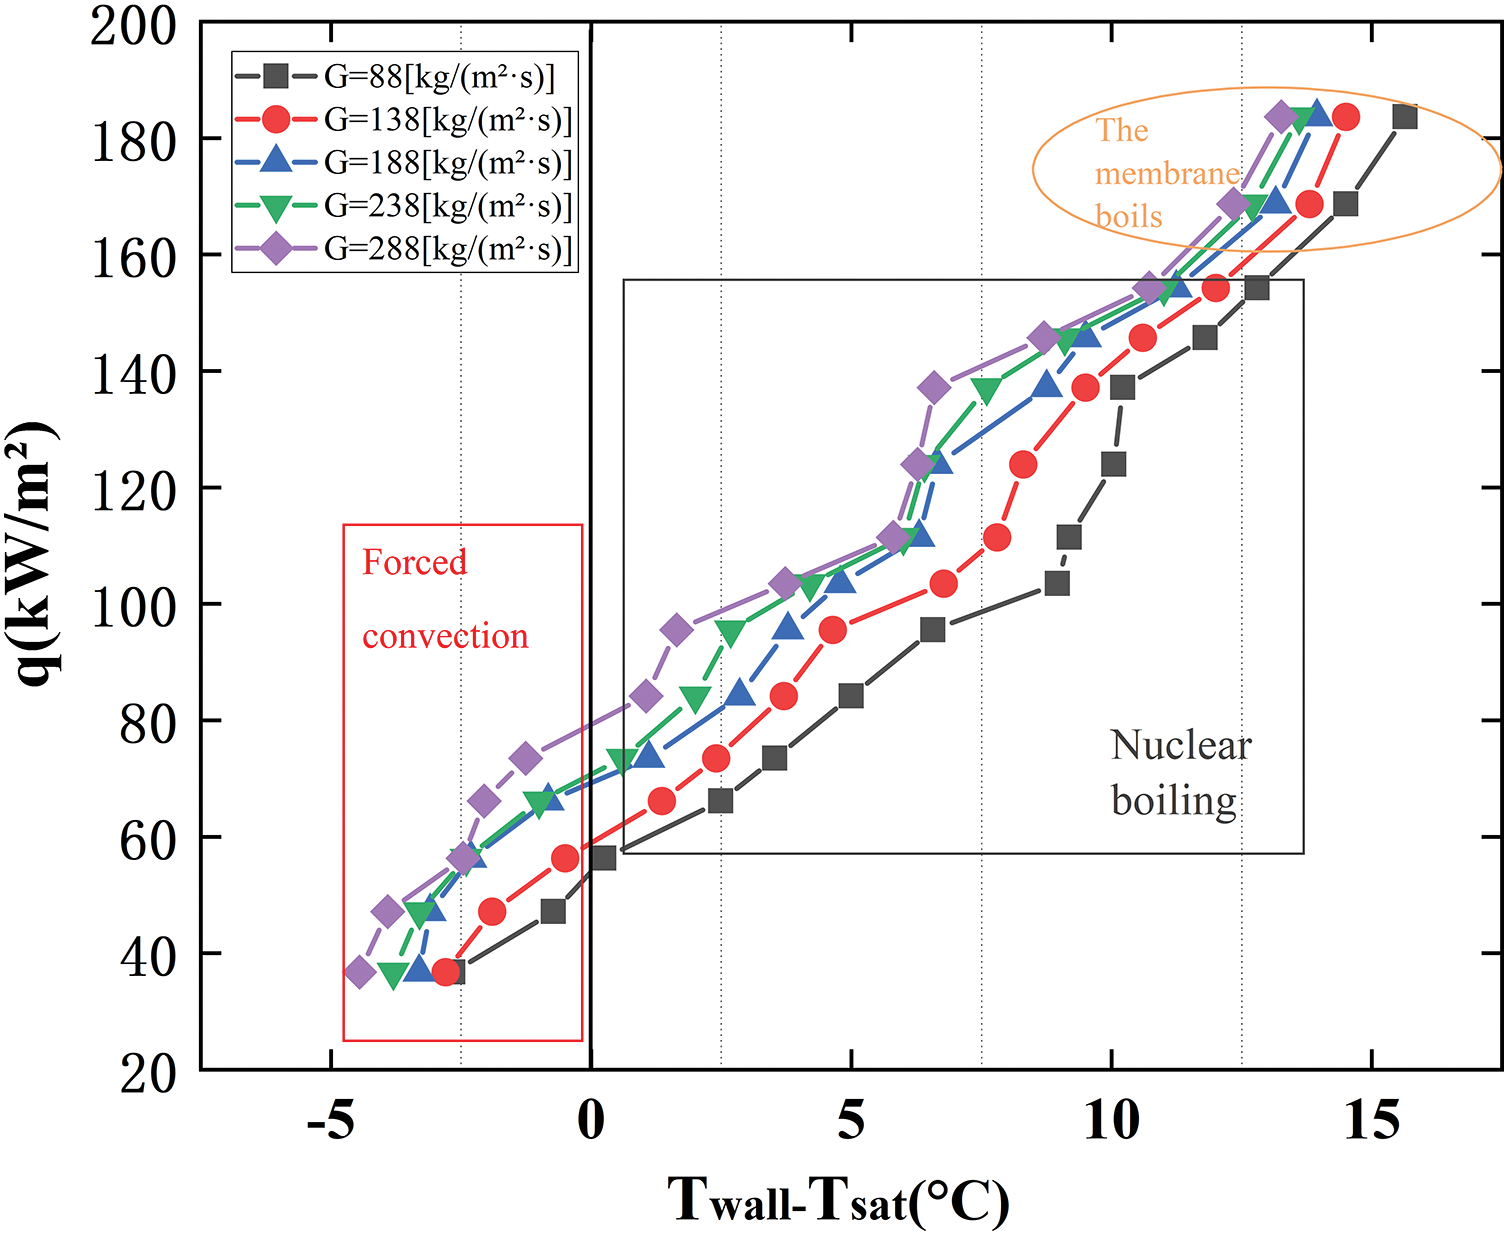
Figure 11: Correlation between superheat and heat flux density for various mass fluxes at a 0° inclination angle
Forced Convection: When the wall temperature is slightly above the saturation temperature (the left side of
Nucleate boiling is a fundamental phenomenon in the context of flow boiling. It occurs when the temperature of a surface exceeds the saturation temperature, leading to the absorption of sufficient energy by the fluid in proximity to the heated surface. This energy enables the fluid to overcome both surface tension and vapor pressure, resulting in the formation of vapor bubbles. These bubbles originate at designated locations on the heated surface, referred to as nucleation sites, which may consist of impurities, surface irregularities, or cavities. During the process of nucleate boiling, heat transfer is notably efficient. The generation and subsequent detachment of bubbles from the heated surface facilitate fluid mixing, thereby enhancing the overall heat transfer rate. The correlation between heat flux density and wall superheat becomes increasingly evident during this phase. As the wall superheat escalates, the frequency of bubble formation also rises, leading to an increase in heat flux density.
Fig. 11 also highlights the region of film boiling, which describes a boiling regime in which the wall temperature reaches significantly higher values, leading to the formation of a continuous vapor film on the wall surface. This vapor film serves as an insulating layer, considerably diminishing the efficiency of heat transfer from the wall to the liquid. Consequently, the heat flux density increases dramatically due to the greater temperature difference necessary to transfer heat through the vapor film.
Fig. 12 also illustrates this phenomenon, showing that for different mass flow rates, the shapes of the curves are similar. Nevertheless, it is noticeable that as the mass flow rate increases, the wall superheat needed to achieve the same heat flux density decreases.
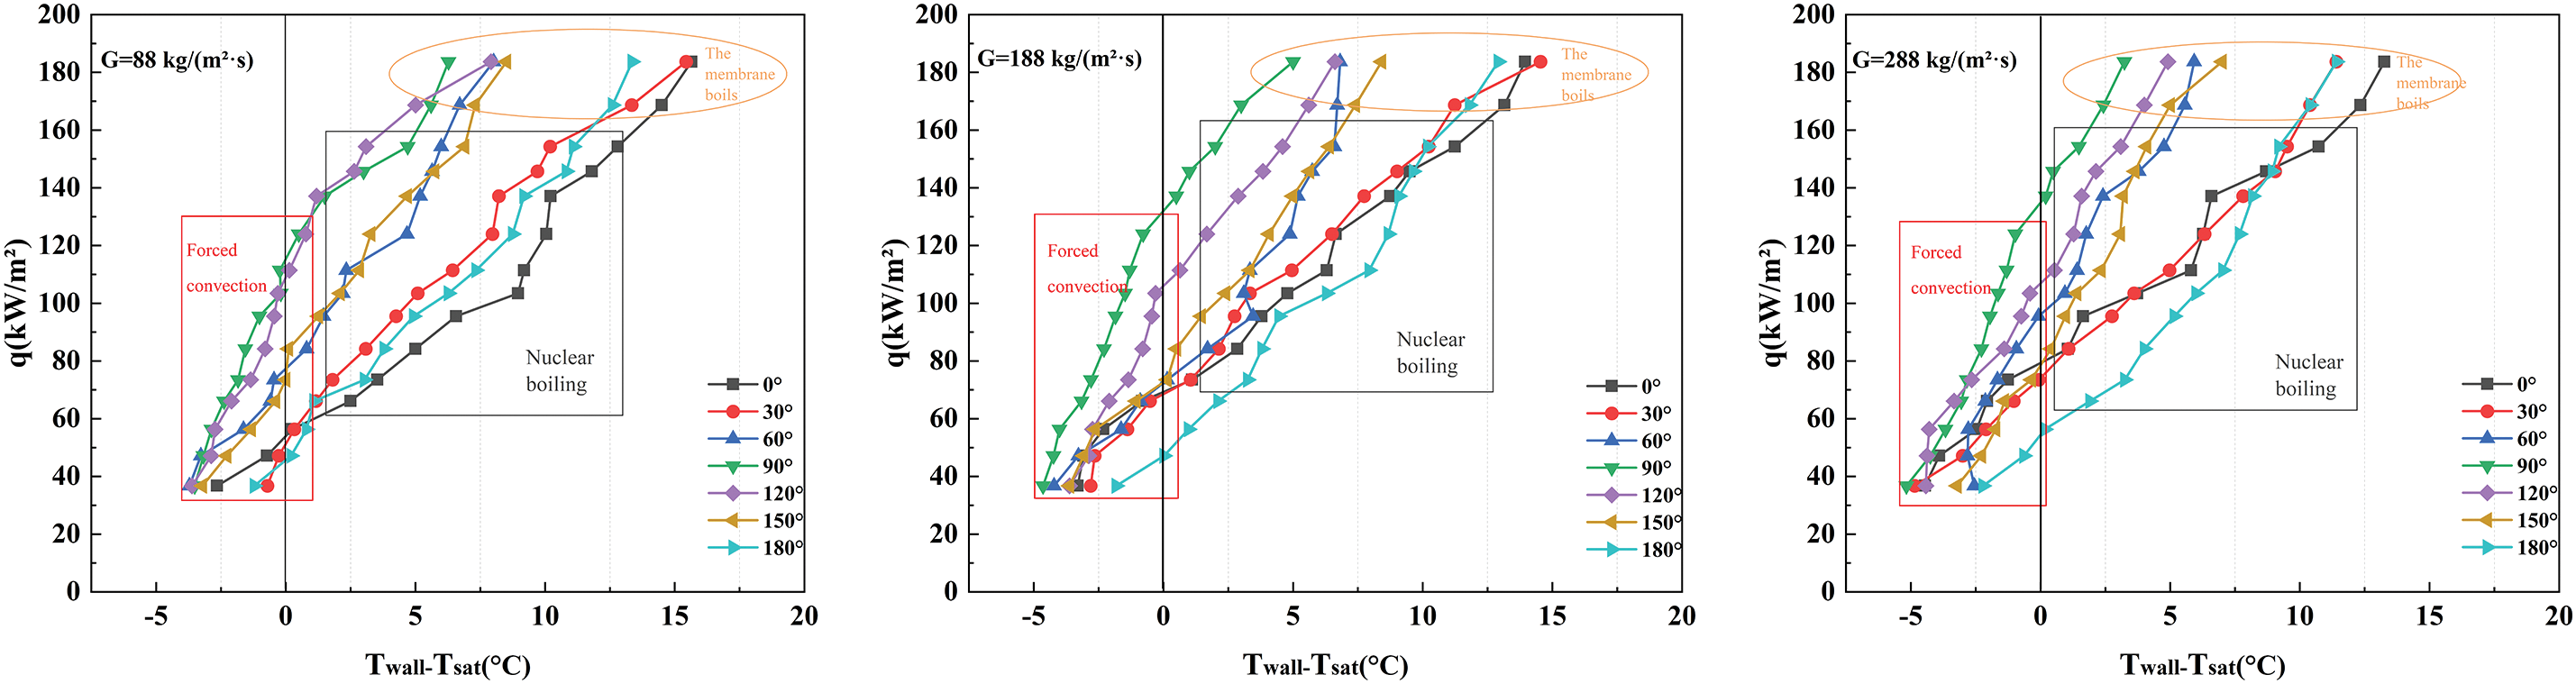
Figure 12: Relationship between boiling curves and mass fluxes at different tilt angles
In other words, higher mass flow rates can more effectively conduct heat exchange. This is due to the fact that as the mass flow rate of the fluid increases, it can carry more heat. Therefore, the wall does not need to be heated to a higher temperature to achieve a higher heat flux density. This observation is consistent with the statement made by Keepaiboon et al. [38].
Fig. 12 illustrates the impact of inclination on the boiling heat transfer curve.
At low wall superheats, where boiling is not yet significant, heat transfer is predominantly influenced by liquid forced convection. The impact of inclination on single-phase flow is minimal; however, moderate tilting, generally within the range of 30° to 60°, facilitates a more uniform distribution of the fluid along the surface, thereby enhancing heat transfer marginally by improving the liquid’s capacity to replenish the heated surface. In vertical (0°) and near-horizontal (90°) orientations, buoyancy-driven flow and turbulence play a crucial role in establishing a stable convective heat transfer coefficient.
As the superheat of the wall rises and surpasses the saturation temperature, the predominant mechanism of heat transfer shifts to bubble formation and detachment. The angle of inclination plays a critical role during this phase. In orientations ranging from nearly vertical to horizontal (0°–90°), bubbles detach from the surface with high efficiency, allowing the liquid to rapidly replace the heated fluid, which results in an elevated heat transfer rate. Conversely, when the inclination angle exceeds 90°, particularly as it approaches 180° (in an inverted position), bubbles tend to aggregate near the surface, leading to a decrease in the efficiency of liquid replenishment and, consequently, a decline in heat transfer performance.
At elevated wall superheats, a persistent vapor film develops on the heating surface, with the angle of inclination significantly affecting the dynamics and stability of this film. In orientations that are nearly vertical or slightly inclined, the vapor film may intermittently rupture due to gravitational forces and flow perturbations, resulting in a minor reduction of thermal resistance. Conversely, at inclination angles approaching 180°, the vapor film attains a stable state that is challenging to displace, thereby inhibiting the rewetting of the surface by liquid and leading to a substantial decline in heat transfer efficiency.
3.3.2 Heat Transfer Coefficient
The findings from our experiments demonstrate a pronounced influence of inclination angle on the heat transfer coefficient during flow boiling, as illustrated in Fig. 13. As the flow direction shifts from vertical upward (0°) to horizontal (90°), the buoyancy component gradually decreases; however, it continues to facilitate a relatively high heat transfer efficiency by promoting bubble detachment and enhancing turbulent mixing. Conversely, when the inclination angle is further increased to vertical downward (180°), the buoyancy force acts against the flow direction, resulting in bubble retention and the formation of localized vapor films. This condition leads to a marked deterioration in heat transfer, as depicted in Fig. 14. The overall heat transfer coefficient exhibits an asymmetric decay pattern, with the following hierarchy: vertical upward > horizontal flow > vertical downward. It is noteworthy that moderate inclination angles (30°–60°) may result in localized enhancements in heat transfer due to secondary flow effects, a phenomenon that aligns with the findings of Maughan’s research [39]. Additionally, elevated flow rates have been shown to alleviate the negative impacts of inclination angles by increasing inertial forces, corroborating the experimental results reported by Sulaiman and Wang [40].
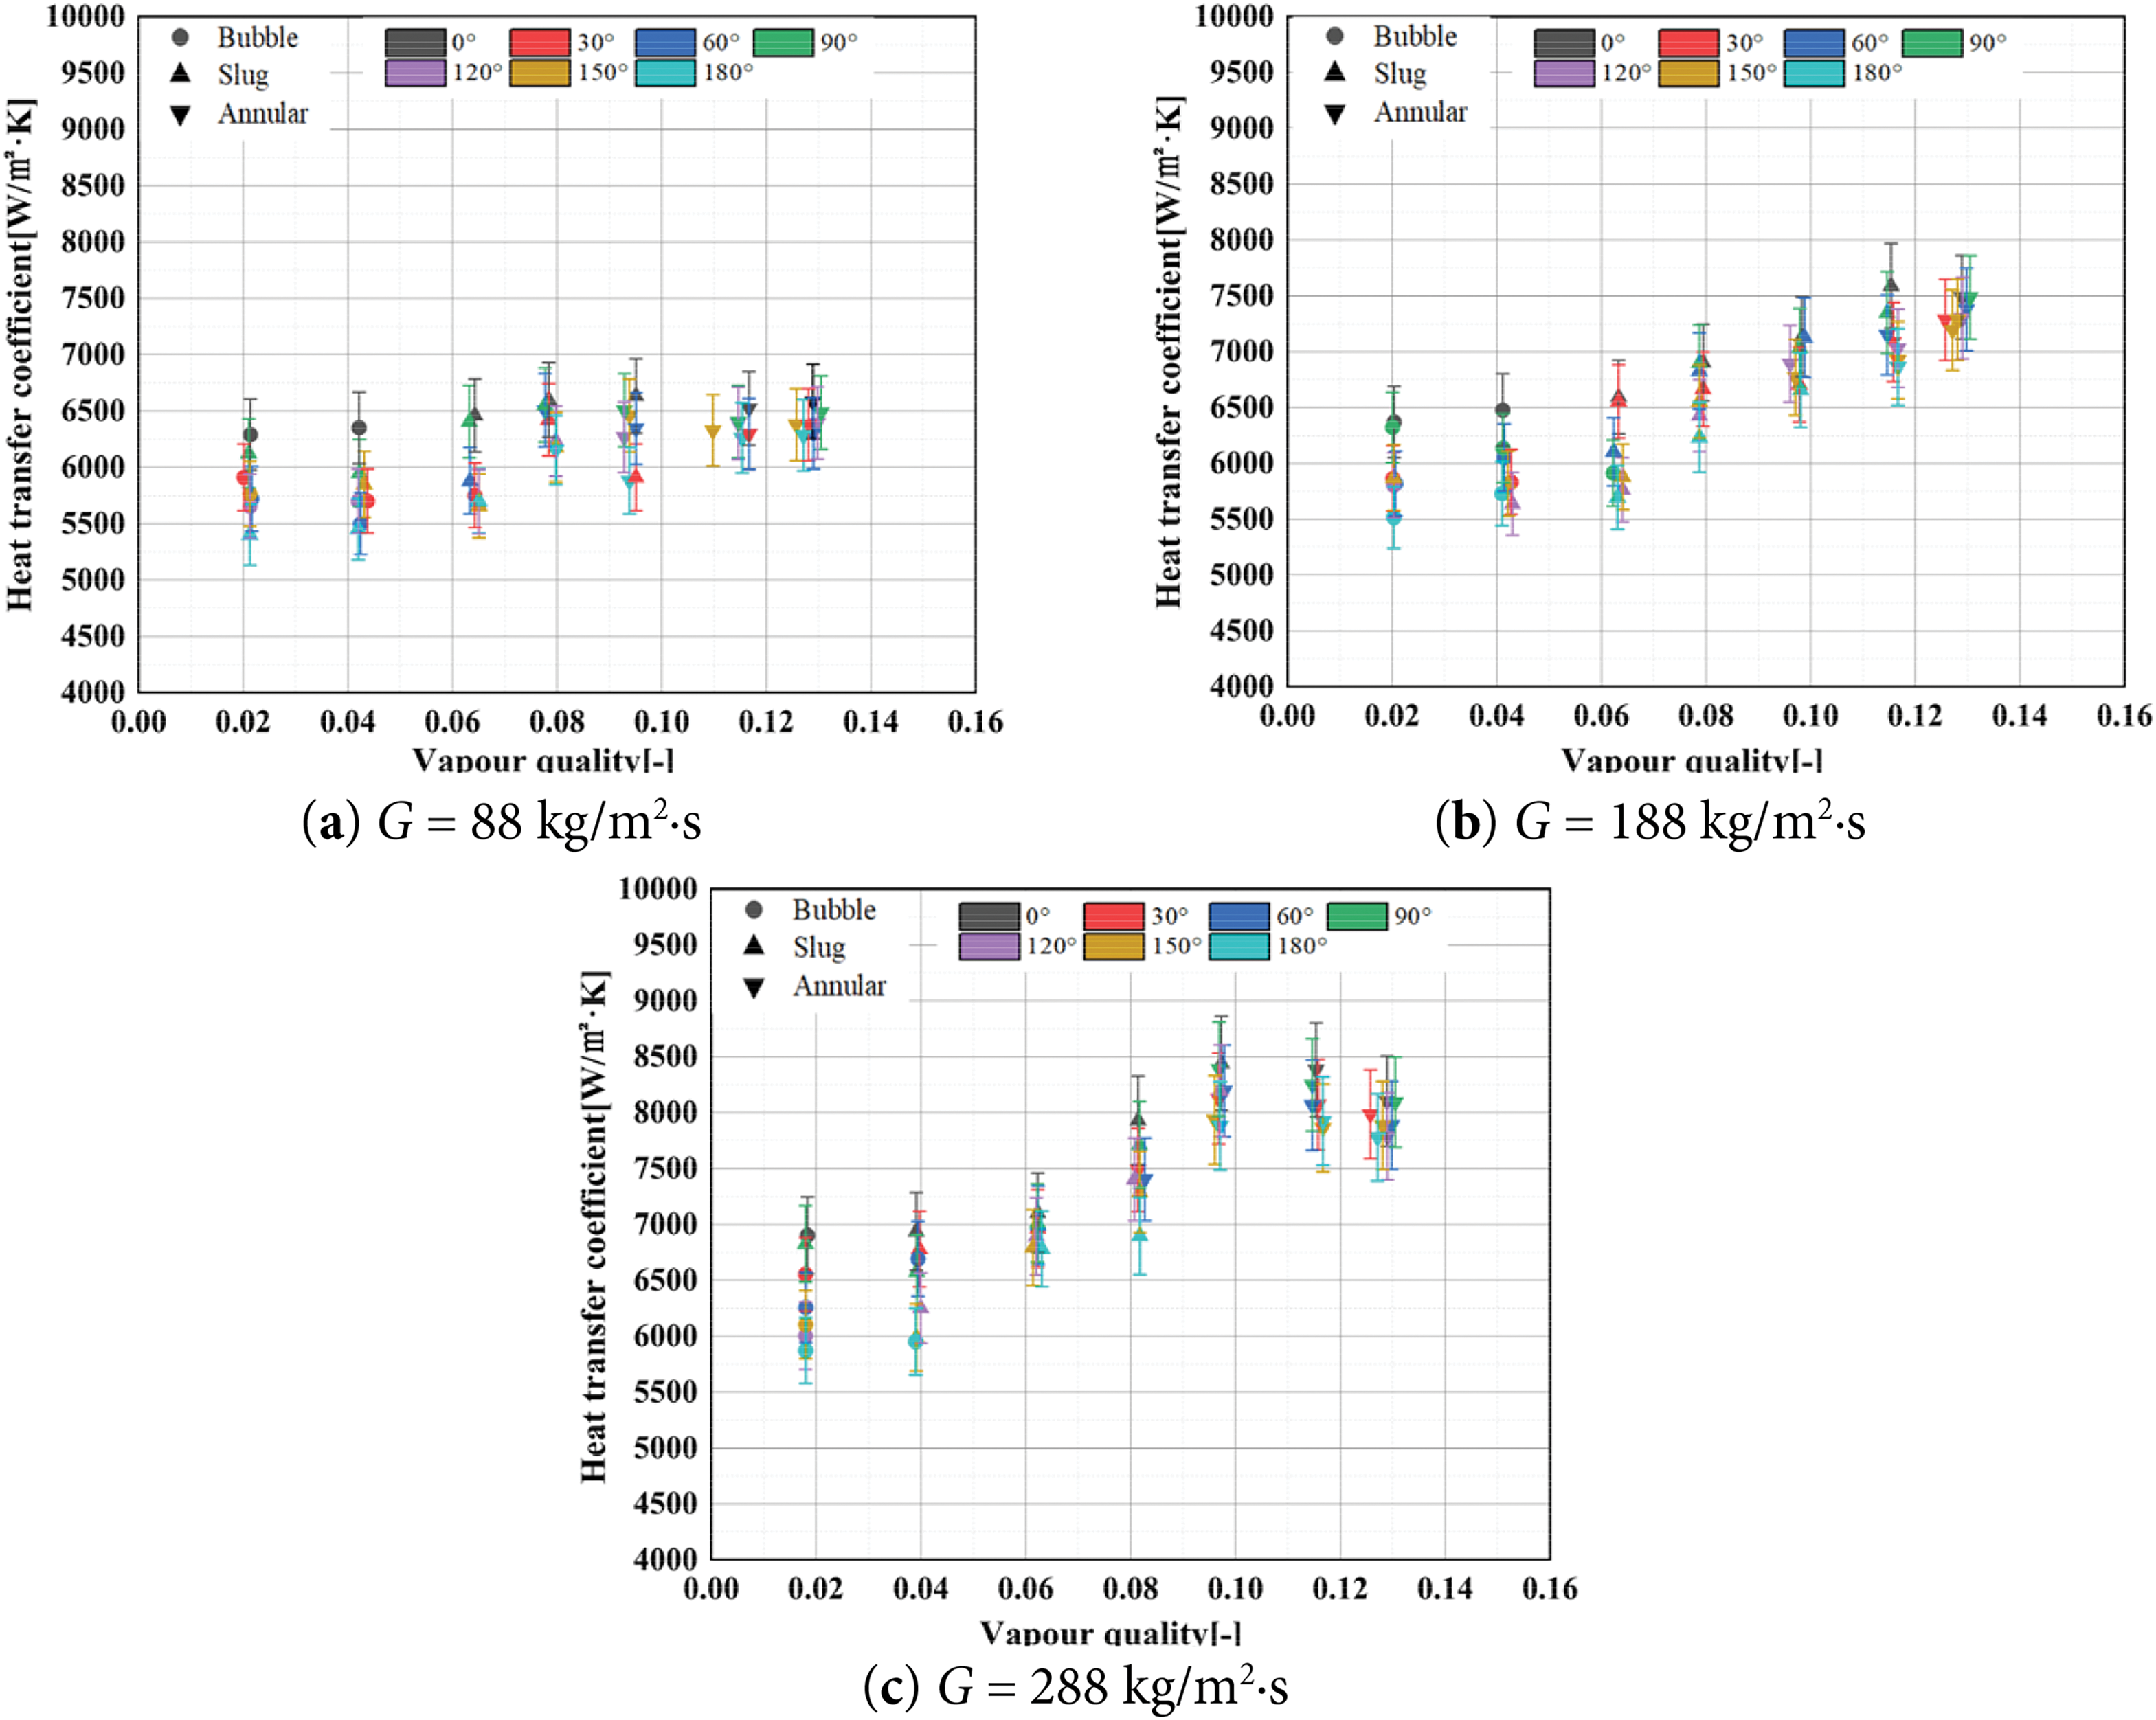
Figure 13: The distribution of heat transfer coefficients corresponding to various vapor masses (a–c)
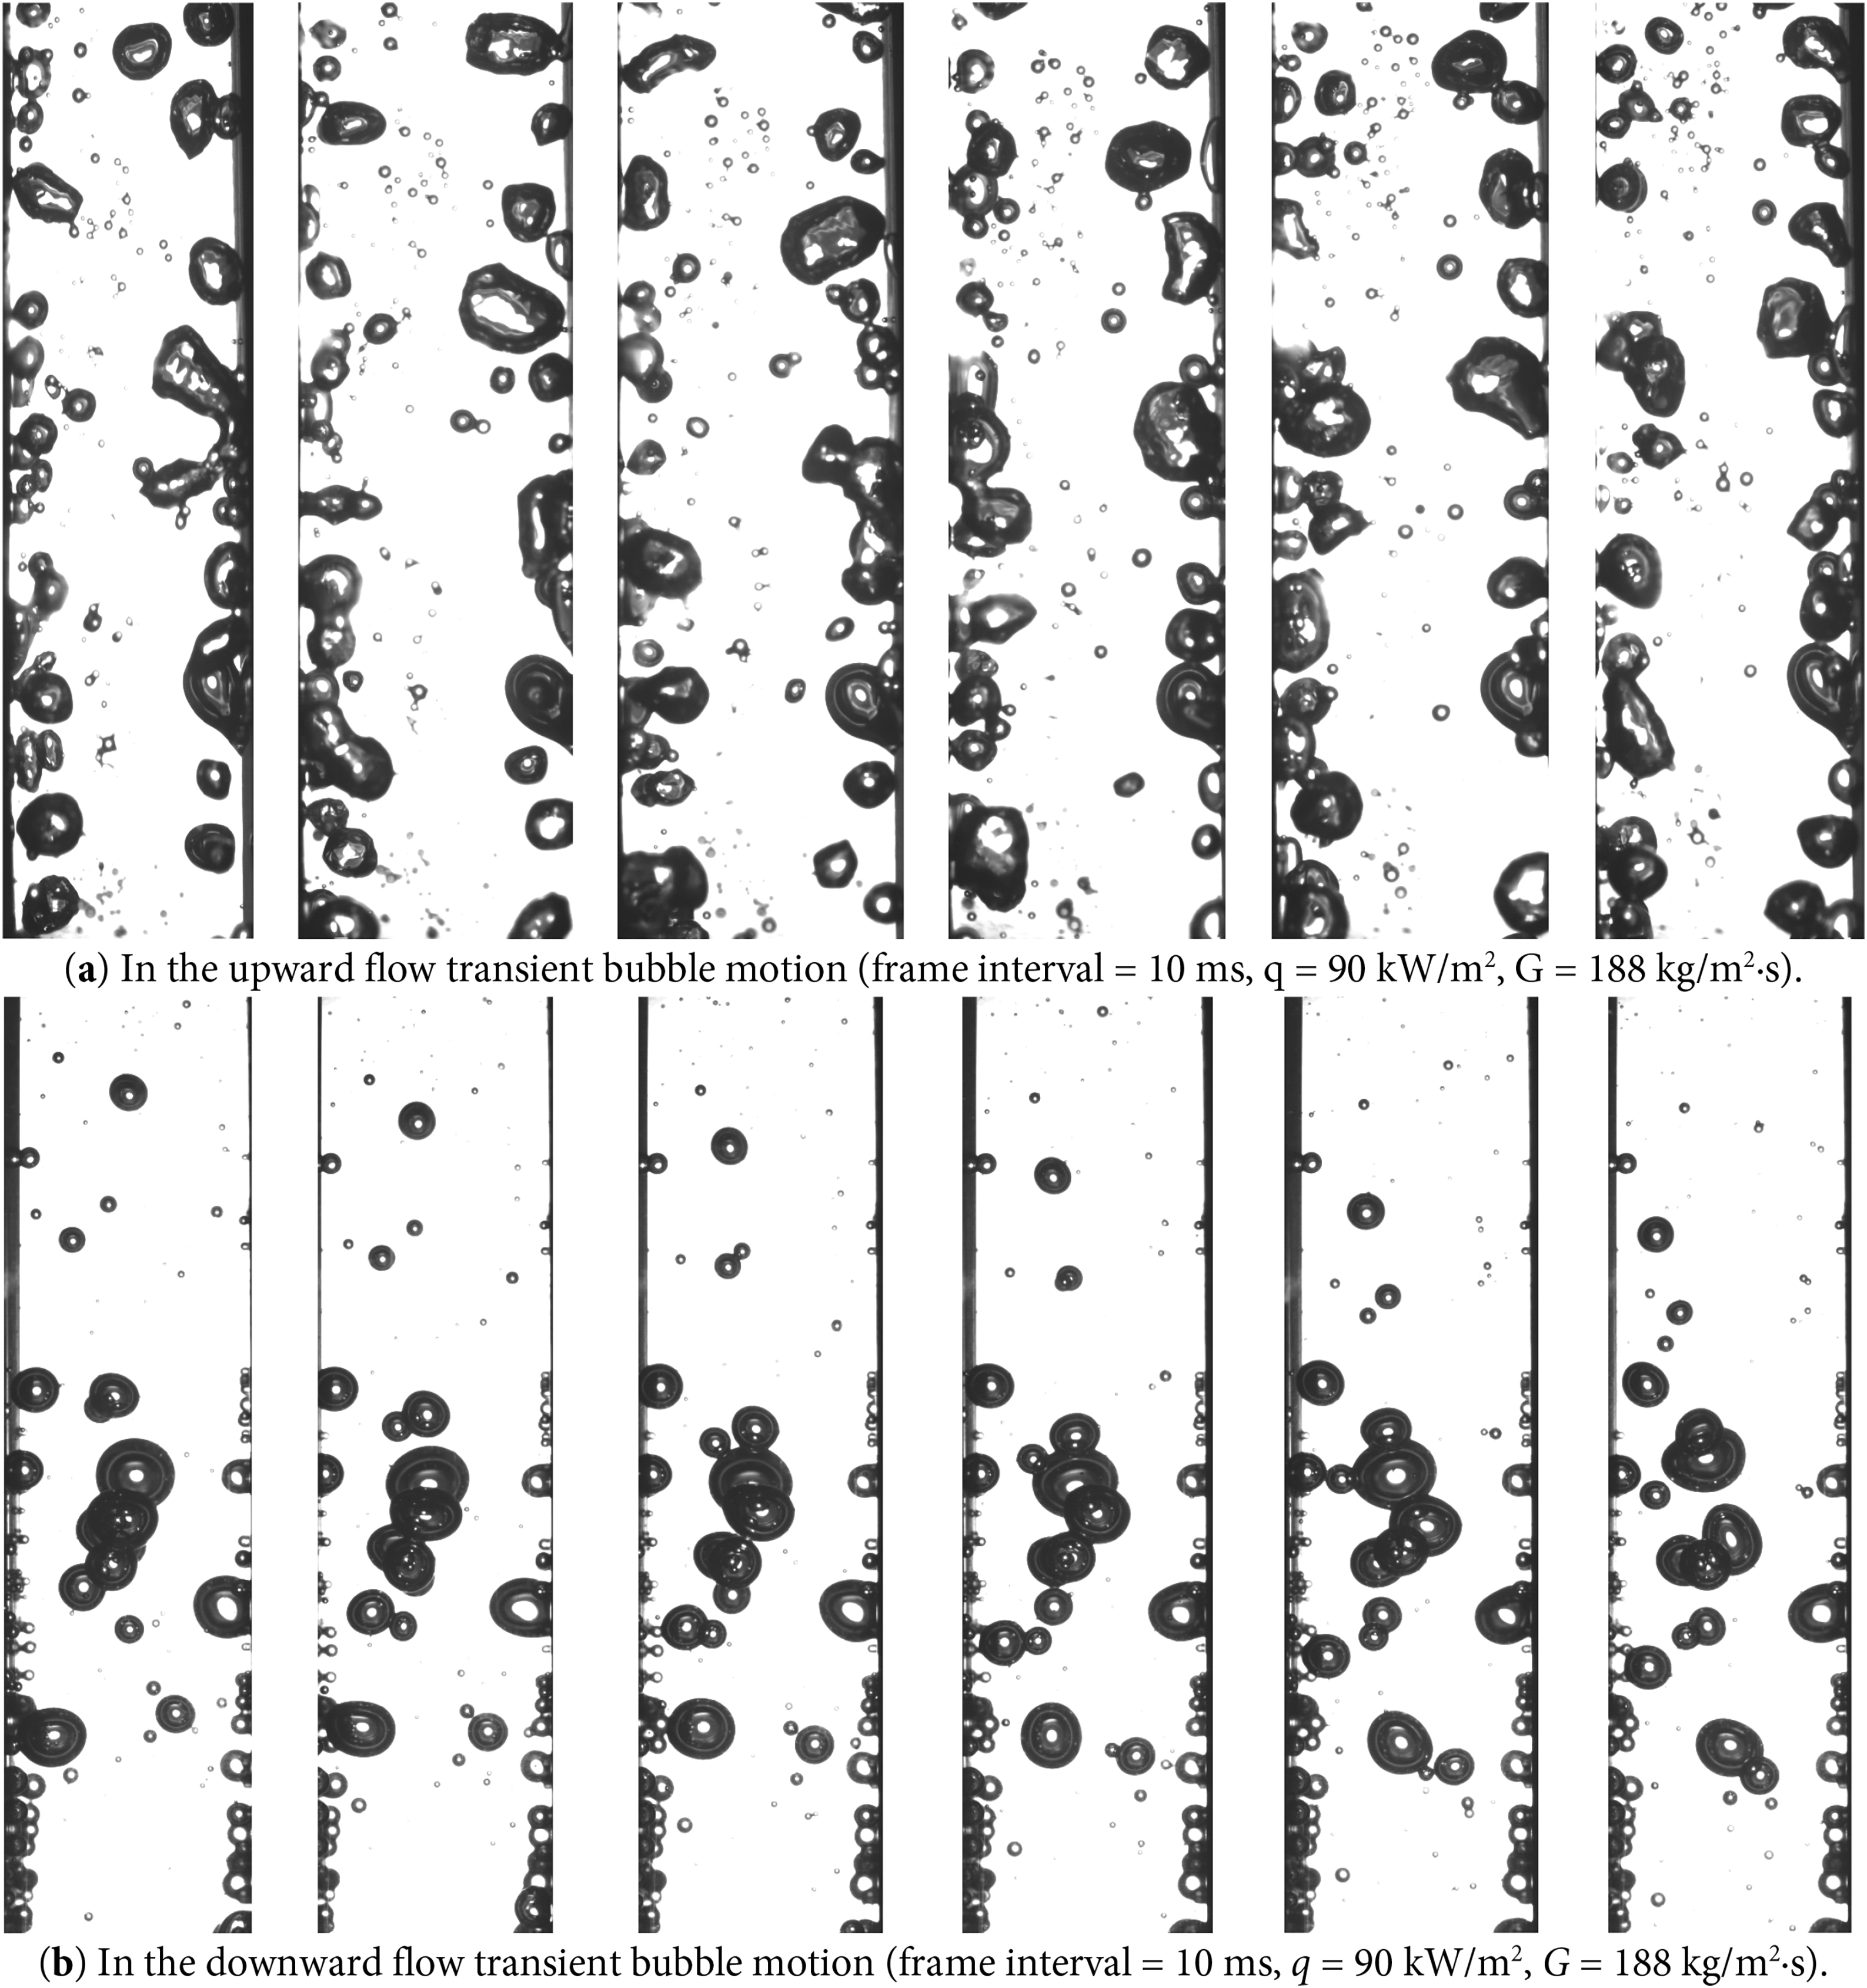
Figure 14: Bubble visualization (a,b)
3.3.3 The Predicted Results Were Compared with the Experimental Data
This study presents a comparative analysis of four models that describe flow boiling heat transfer relationships, evaluated against experimental data. The models under consideration include established frameworks such as the Qiu model, the Ma model, and Cao model, in addition to the recently developed GA-BP model.
The GA-BP model was developed to predict the heat transfer coefficient under varying inclination angles, mass flux, and heat flux conditions. This model integrates a genetic algorithm (GA) to optimize the weights and biases of a backpropagation neural network (BP). The genetic algorithm effectively explores the parameter space, while the backpropagation network captures the complex, nonlinear relationships within the data, thereby enhancing the accuracy of predictions related to heat transfer in flow boiling systems.
The correlation is shown in Table 4.

These three correlations are macroscopic channels.
The correlations shown in Table 4 were evaluated based on two main criteria: (1) the value of the mean absolute error (MAE), and (2) the percentage of data points predicted within the ±30% error range
MAE is calculated as follows:
The analysis illustrated in Fig. 15 indicates that the methodology proposed by Qiu et al. [41] is insufficient in distinguishing between various boiling flow patterns, including bubble flow, slug flow, and annular flow. These distinct patterns have markedly different effects on heat transfer coefficients under diverse operational conditions, resulting in suboptimal predictions of heat transfer coefficients during subcooled boiling flow. It is important to highlight that Ma et al. [42] concentrated on circular or toroidal channels in their research, whereas the current study utilizes rectangular channels, which may introduce a degree of bias into the predictive outcomes. Additionally, the model developed by Cao et al. [43] may not adequately account for certain dynamic changes that occur during the flow boiling process in regions of high heat flux, such as variations in flow patterns and bubble dynamics. This limitation can lead to diminished accuracy in the prediction of these phenomena. In contrast, the GA-BP model demonstrates a significant enhancement in the accuracy of predicting the heat transfer coefficient across different inclination angles. Notably, it effectively incorporates the non-linear dynamics of flow boiling, which traditional models, including those of Qiu et al. [41], Ma et al. [42] and Cao et al. [43], do not accurately capture at various inclination angles.
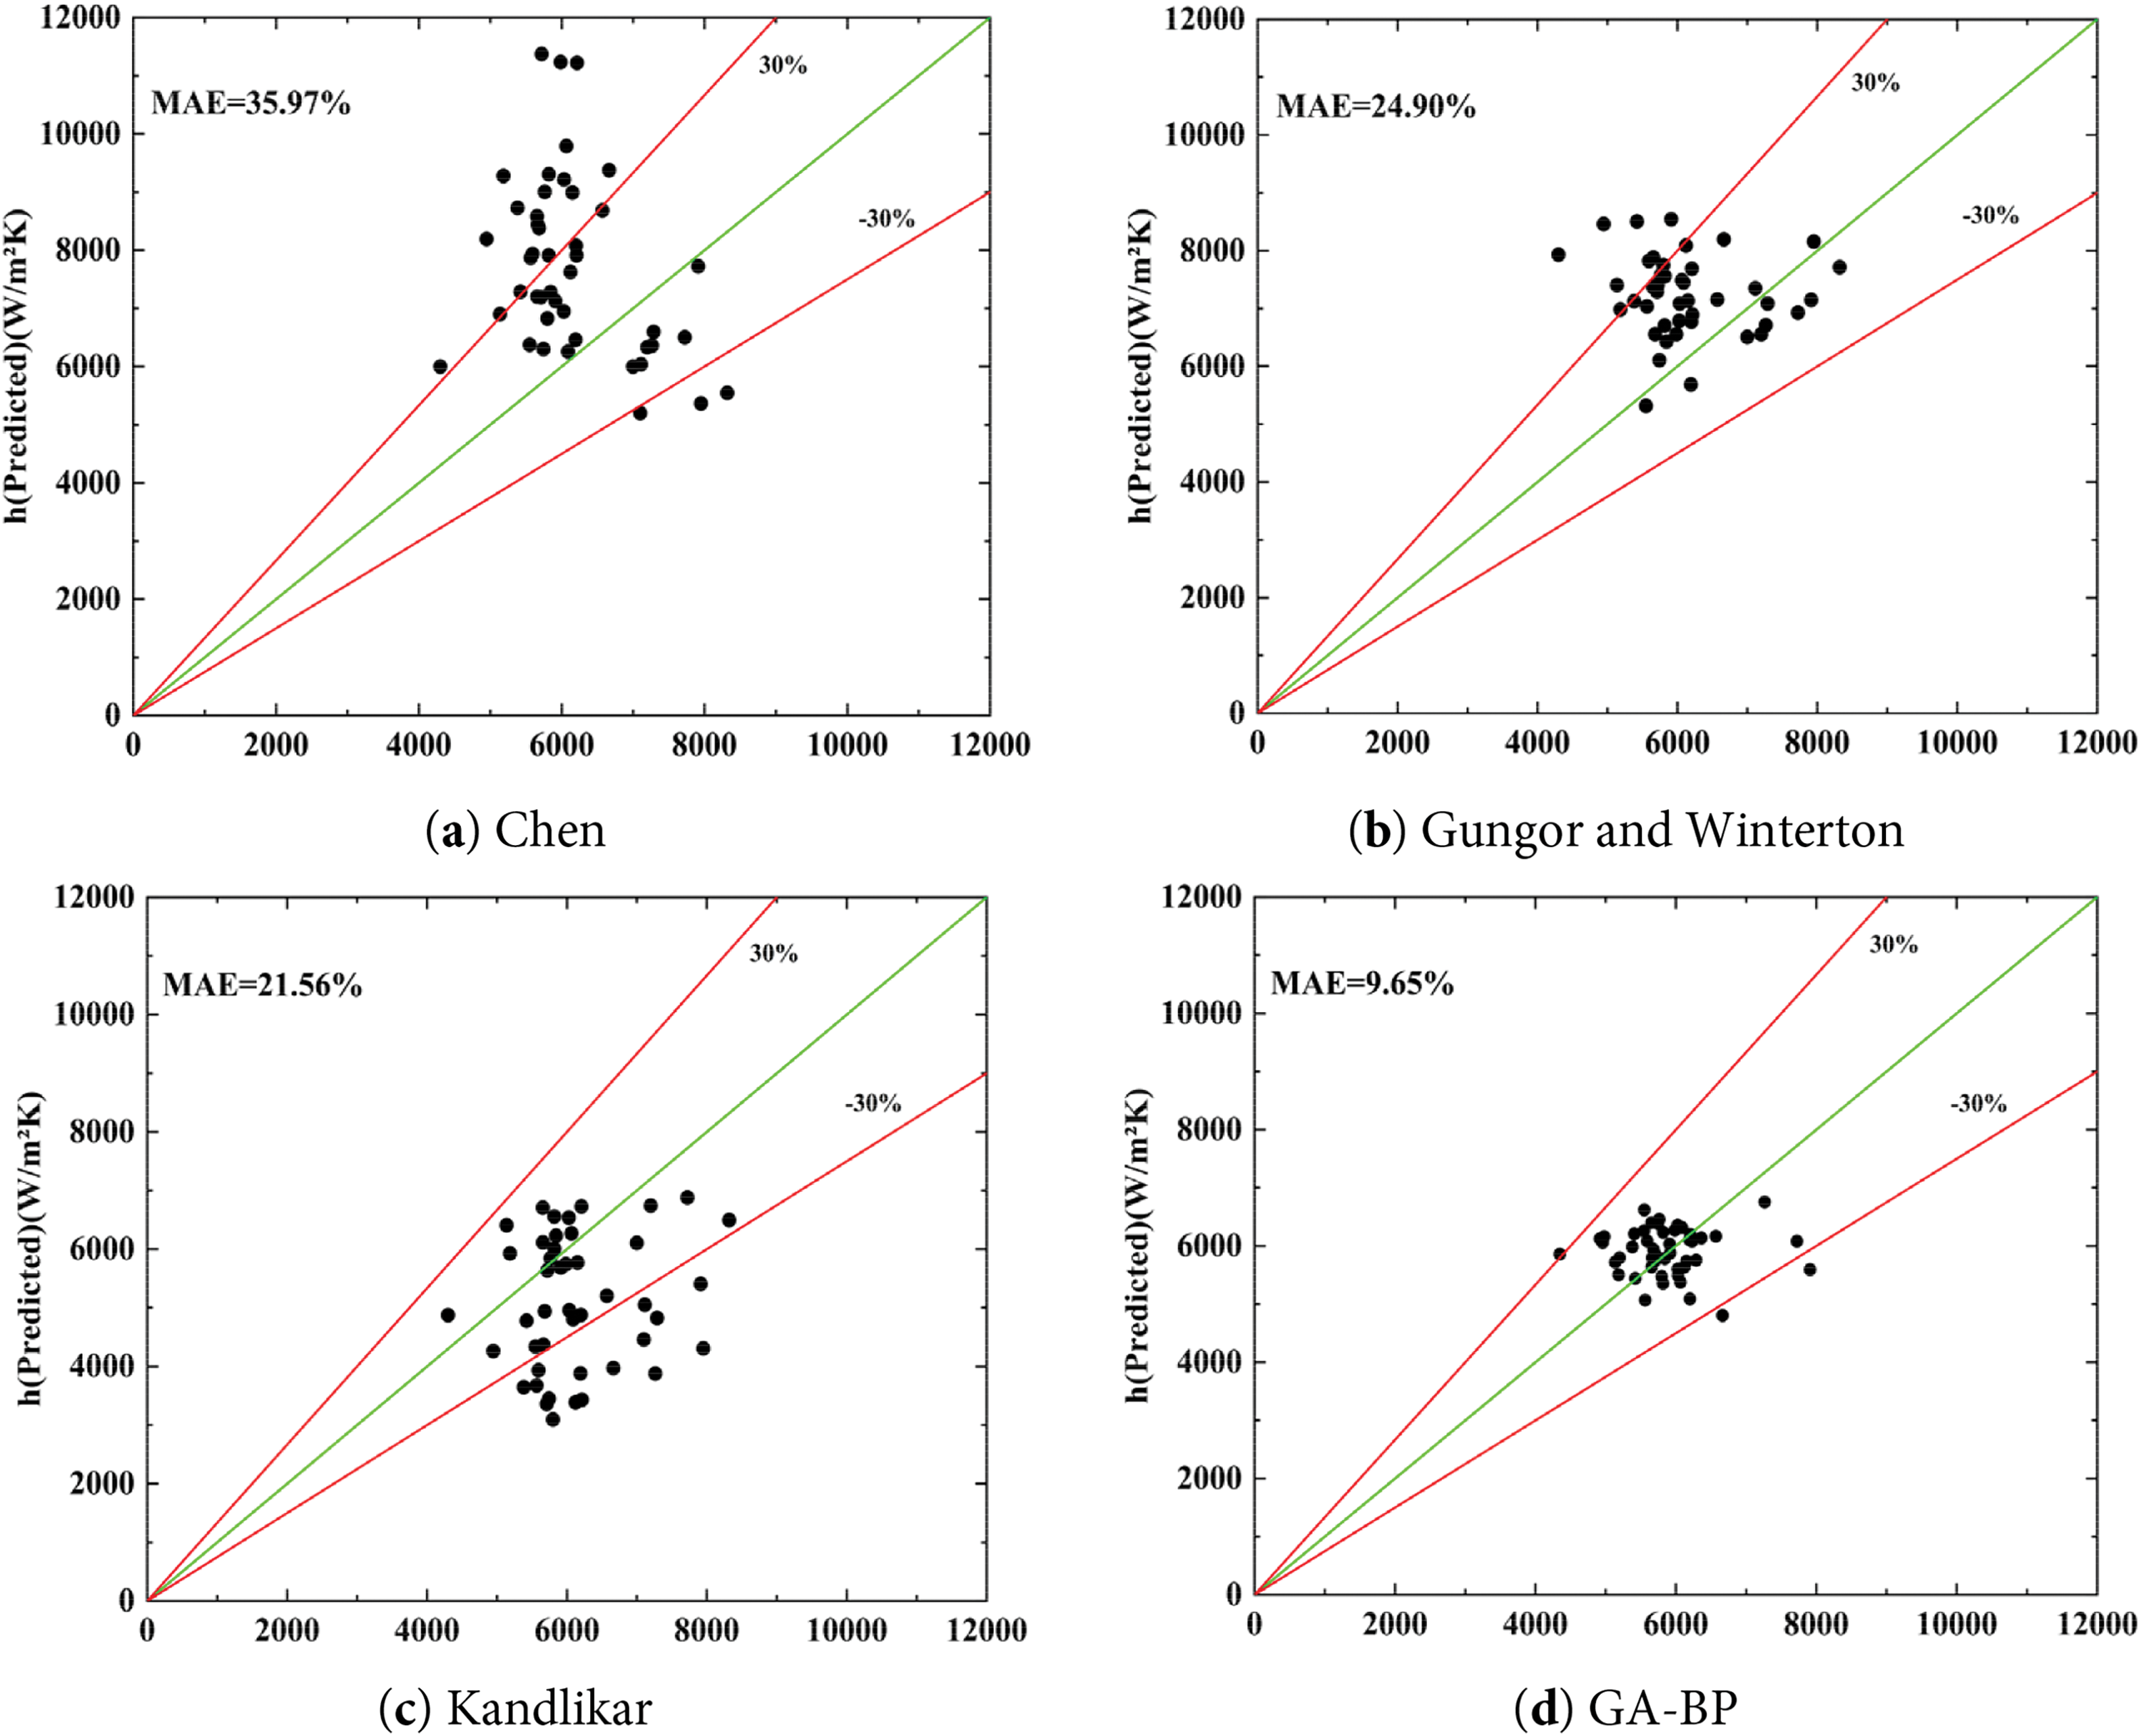
Figure 15: A comparative analysis of empirical data and forecasted data (a–d)
3.4 Entropy Generation Analysis
Heat transfer efficiency improves with increasing mass velocity as mass flow rises. However, the impact of flow on the pipe becomes more significant, resulting in a gradual increase in pressure drop. This increase can raise safety concerns in engineering applications. Therefore, it is essential to consider the combined effects of heat transfer and pressure drop. An entropy generation analysis offers a thorough approach to evaluating both heat transfer and pressure drop.
In Fig. 16, the variations in the Be number and IDR with mass flow rate during boiling flow at different inclination angles are presented for a steam quality of 0.1. The Be number is a dimensionless quantity that quantifies the distribution of entropy generation due to heat transfer within the total entropy generation. A value close to 1 indicates that the irreversibility of heat transfer is predominant, followed by the irreversibility associated with friction. The IDR serves as an index to assess the relative distribution of irreversibility caused by pressure drop (or friction loss) and heat transfer. A higher IDR value indicates that friction loss plays a more significant role in total entropy generation.
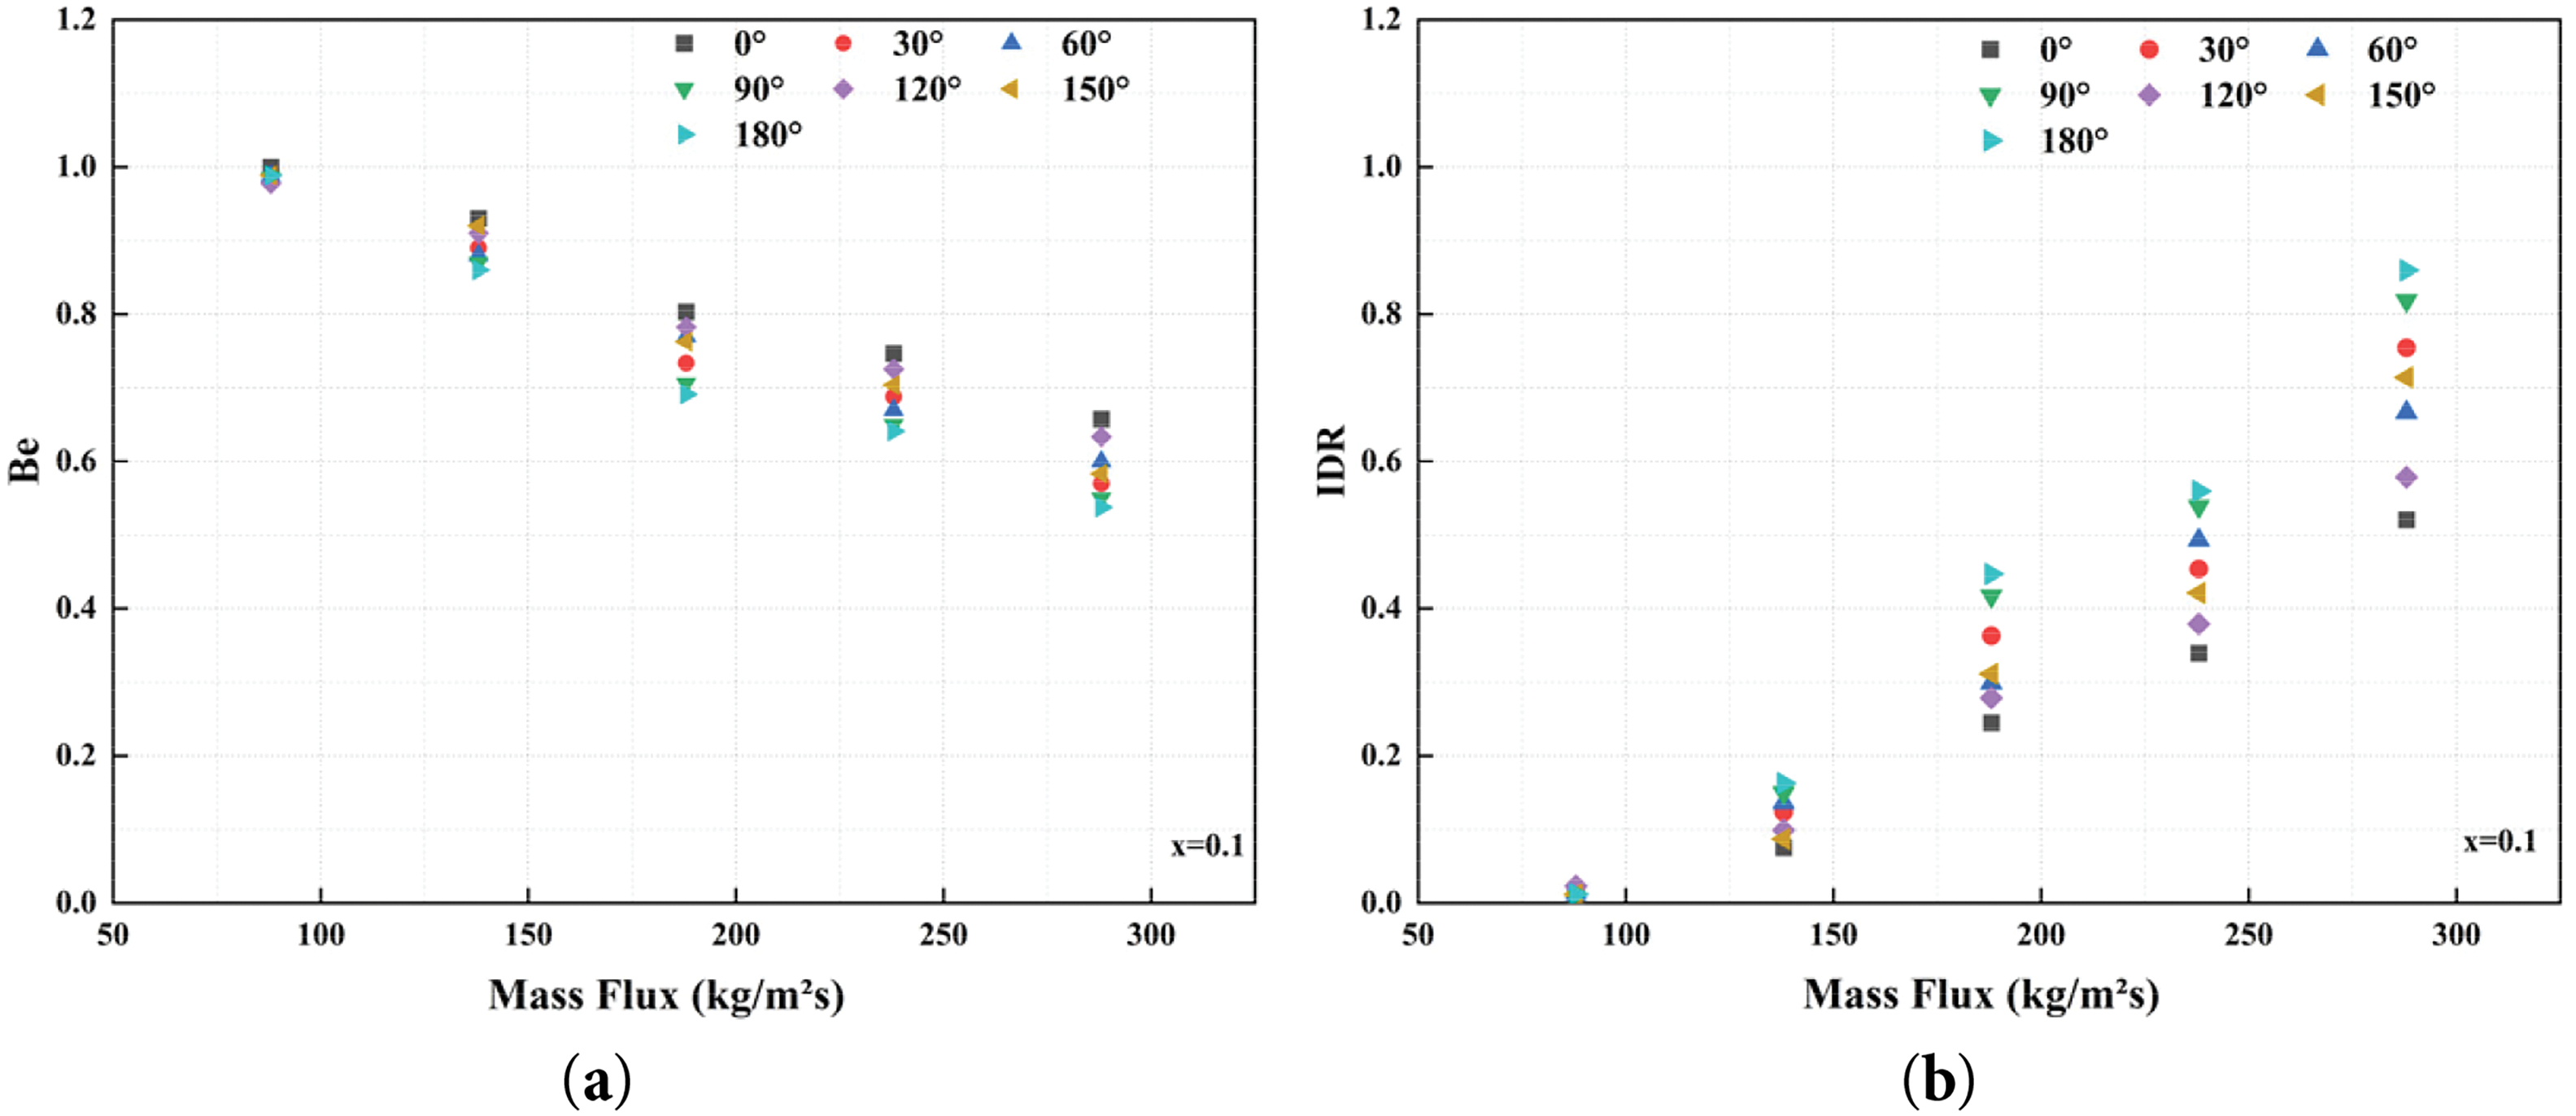
Figure 16: The influence of mass flux on both Be and IDR at different angles under the same steam quality
Fig. 16a depicts the irreversible heat transfer losses experienced by the system during the flow boiling process. The data presented in the figure indicates a clear trend: as the mass flux increases, the entropy generated due to heat transfer diminishes progressively. This reduction in entropy is attributed to the improved convective effects associated with elevated mass flow rates, which effectively decrease thermal resistance at the interface and enhance heat transfer efficiency. Additionally, specific angles, such as 0°, demonstrate lower entropy generation across a range of mass fluxes, suggesting superior thermal performance at these orientations. In the context of flow boiling, higher mass flow rates can facilitate improved fluid dynamics, thereby optimizing heat transfer and minimizing local entropy generation resulting from temperature gradients.
Fig. 16b provides a quantitative assessment of the irreversibility induced by the fluid as a result of pressure drop during the flow process. An increase in mass flux leads to a corresponding rise in fluid velocity, which in turn heightens flow resistance and results in an escalation of entropy generation attributed to pressure drop. In both figures, it is observed that while entropy generation from heat transfer diminishes with increasing mass flux, the entropy generation associated with pressure drop increases concurrently. This interplay underscores the necessity of determining the optimal operating point to effectively balance these two forms of entropy generation, thereby maximizing overall system efficiency. Furthermore, with respect to entropy generation at various angles, such as 0°, if this angle demonstrates the lowest entropy generation across all mass fluxes, it may suggest that the interaction between fluid flow and the boiling surface at this specific angle is most conducive, thereby minimizing irreversibility to the greatest extent.
Fig. 17 illustrates the functional relationship between IDR and Be as steam quality varies under a constant mass flux. Within the steam quality range of 0.08 to 0.1, the contribution of heat transfer to entropy decreases, while the contribution of pressure drop to entropy increases. The formation of annular flow may elevate the entropy associated with heat transfer, leading to a reduction in heat transfer efficiency when steam quality exceeds 0.1. At lower steam quality levels, heat transfer has a more significant impact than pressure drop. Consequently, as steam quality increases, IDR rises, peaking at a steam quality of 0.12 before declining, whereas Be exhibits an inverse trend.
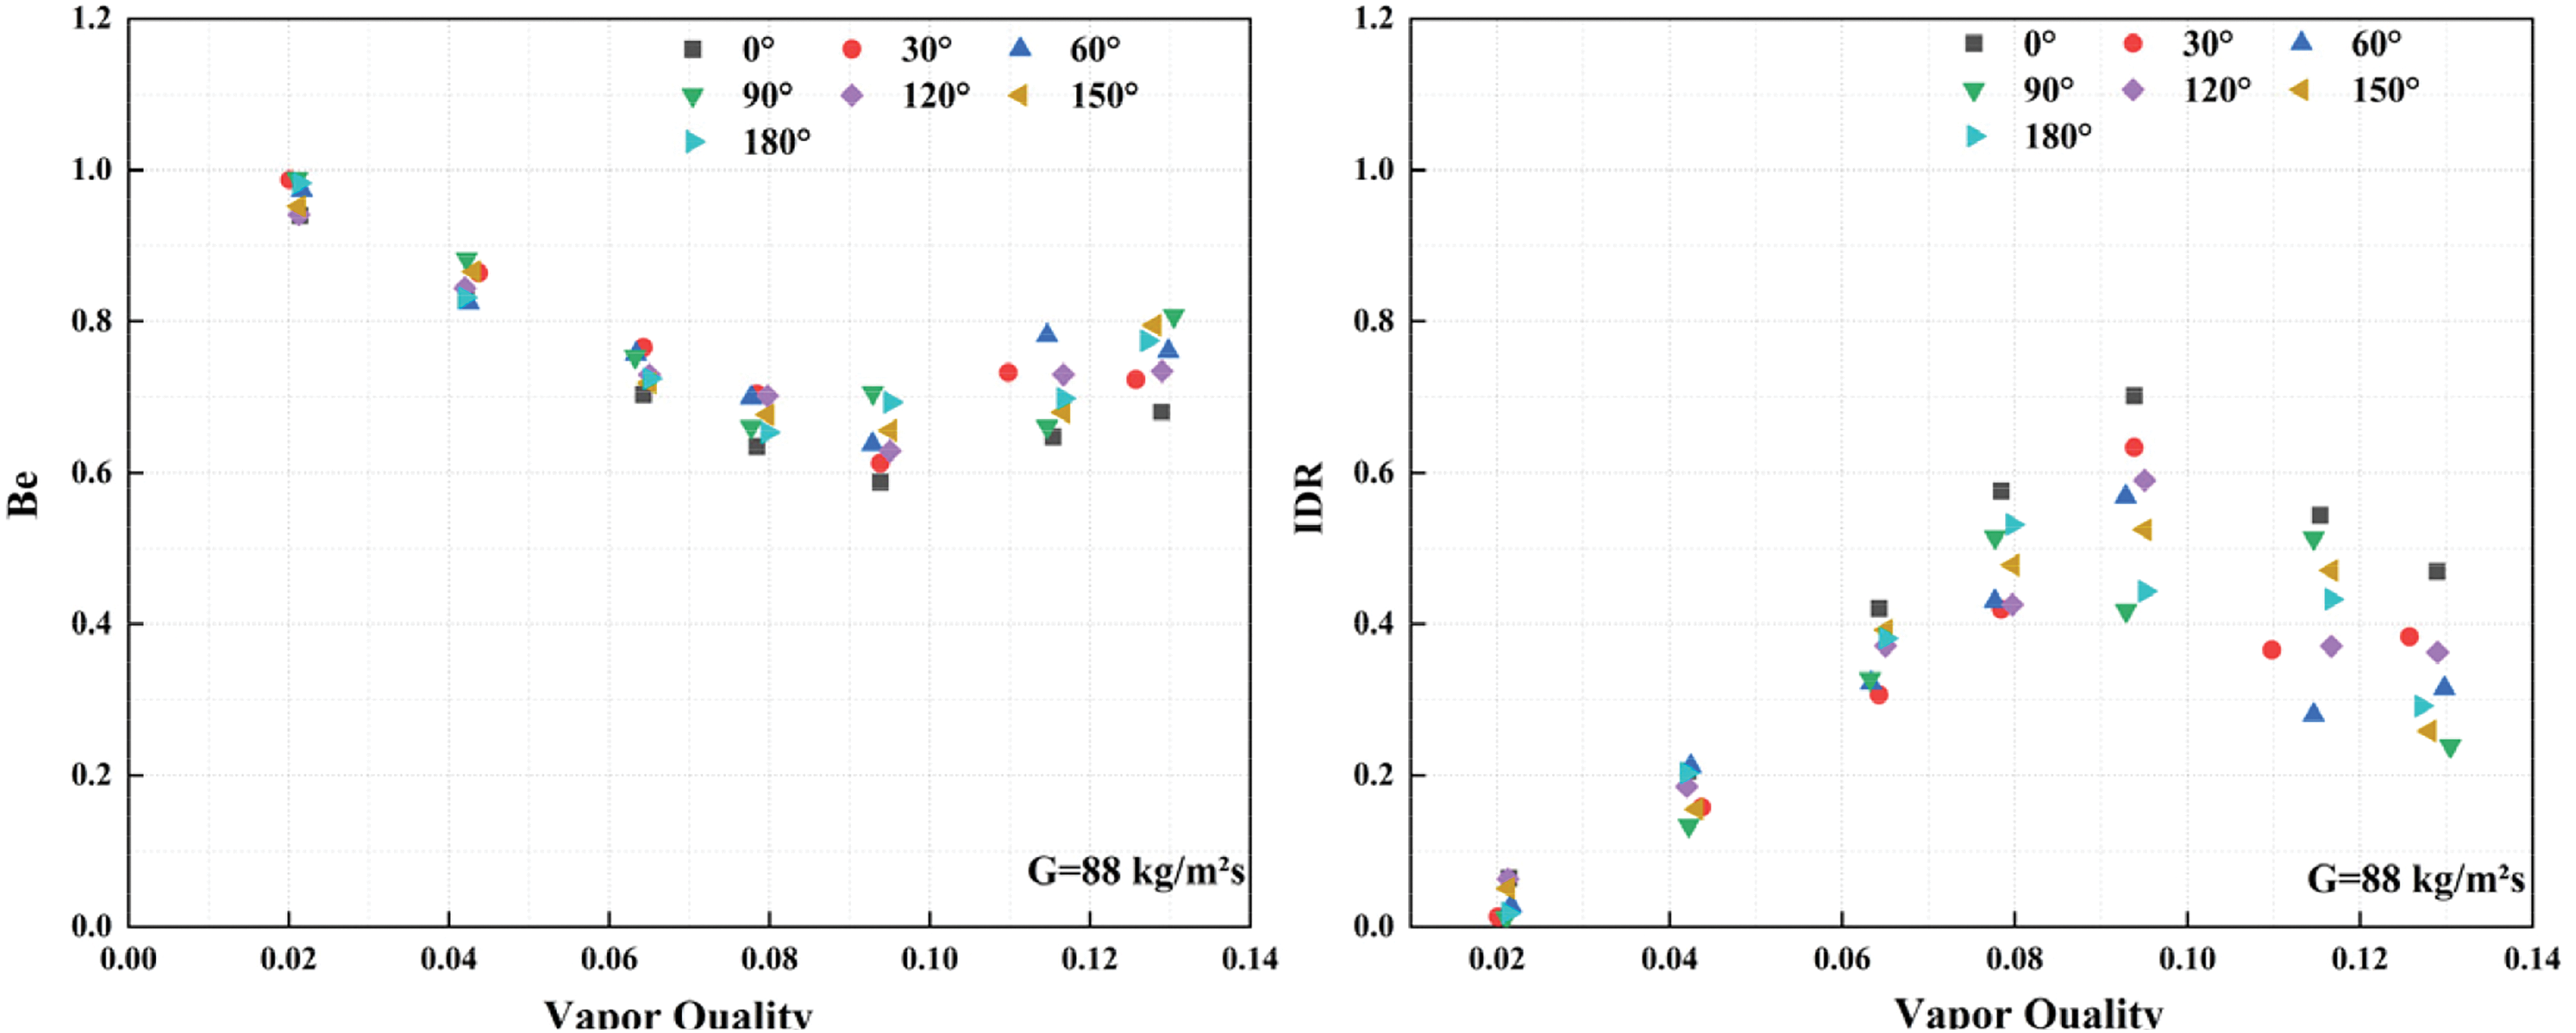
Figure 17: The influence of steam quality on Be and IDR at different angles under the same mass flux
This research explores the dynamics of flow boiling within inclined pipe systems, with a particular emphasis on the effects of inclination angles on flow pattern transitions, heat transfer characteristics, and entropy generation. A series of experiments were conducted utilizing varying heat fluxes, mass fluxes, and inclination angles to comprehensively analyze the flow boiling behavior of deionized water.
1. Flow Pattern Transitions: The experiments revealed that at various inclination angles, the flow patterns included bubbly flow, slug flow, throat-annular flow, and annular flow. Both the inclination angle and mass flux significantly influenced bubble formation, movement, and detachment. In upward flows (ranging from 0° to 90°), bubbles detached more rapidly, thereby enhancing heat transfer efficiency. Conversely, in downward flows (beyond 90°), bubbles tended to remain near the surface, resulting in a decrease in heat transfer performance.
2. Heat Transfer Efficiency: Heat transfer efficiency is closely related to the angle of inclination. Moderate inclination angles, ranging from 30° to 60°, can enhance local heat transfer. However, in nearly vertical downward flows (approaching 180°), a stable vapor film forms, which hinders liquid contact with the heating surface and reduces heat transfer performance. While higher mass flux improves heat transfer efficiency, it also leads to increased pressure losses.
3. Entropy Generation: The analysis of entropy generation revealed a trade-off between heat transfer and pressure drop. Although increasing mass flux decreased entropy generation associated with heat transfer, it concurrently increased entropy generation due to pressure drop. The study identified an optimal mass flux and inclination angle that minimized total entropy generation, thereby enhancing overall system efficiency.
4. Theoretical and Experimental Validation: This research introduced a Genetic Algorithm-Backpropagation (GA-BP) model for predicting heat transfer coefficients. The GA-BP model more effectively captured the nonlinear dynamics of flow boiling, particularly at varying inclination angles.
The innovation of this study lies in its comprehensive exploration of the impact of inclination angles on flow pattern transitions, as well as its analysis of their effects on heat transfer efficiency and entropy generation. Unlike previous studies that primarily focused on horizontal or vertical flows, this research offers new insights for optimizing the heat transfer performance of inclined systems. Specifically, it employs entropy generation analysis to balance heat transfer efficiency and pressure losses. Additionally, the introduction of the GA-BP model provides a more accurate predictive method for flow boiling systems, demonstrating significant potential for broad applications.
Acknowledgement: We acknowledged the support of the National Natural Science Foundation of China, Key Research and Development Plan Project and Yunnan Major Scientific and Technological Projects.
Funding Statement: This work was supported by the National Natural Science Foundation of China (Project No. 52166004), the National Key Research and Development Program of China (Project No. 2022YFC3902000), the Major Science and Technology Special Project of Yunnan Province (Project Nos. 202202AG050007; 202202AG050002).
Author Contributions: Hao Tang: Survey, methodology, data organization, validation, writing—original manuscript. Jianchang Yang: Investigation. Yunxin Zhou: Methodology, data organization. Jianxin Xu: Supervision, writing—review and editing. Hua Wang: Supervision, guidance. All authors reviewed the results and approved the final version of the manuscript.
Availability of Data and Materials: The datasets generated and analyzed during the current study are not publicly available due to confidentiality request by the party providing the data but are available from the corresponding author on reasonable request.
Ethics Approval: Not applicable.
Conflicts of Interest: The authors declare no conflicts of interest to report regarding the present study.
Nomenclature
| q | Heat flux (kW/m2) |
| G | Mass flux (kg/m2·s) |
| T | Temperature (°C) |
| L | Length of the heating section (m) |
| C | Total heating perimeter (m) |
| i | Enthalpy (J/kg) |
| x | Vapor quality |
| Latent heat of vaporization (J/kg) | |
| S | Entropy |
| Q | Heat transfer rate |
| Void fraction | |
| dL | Unit length (m) |
| h | Heat transfer coefficient (kg/m2·s) |
| v | Specific volume |
| P | Pressures (pa) |
| ρ | Density (kg/m^3) |
| θ | Inclination angle (°) |
| U | Voltage(V) |
| I | Current(A) |
| η | Thermal efficiency |
| Contact area of the test section(m2) | |
| k | Thermal conductivity of copper (kg/m2·s) |
| Specific heat capacity of copper (J/kg·°C) | |
| Enthalpy of the mixture of water vapor and water | |
| Entropy generation per unit length | |
| Total mass flow rate | |
| Perimeter of the pipe | |
| Void fraction for homogeneous flow | |
| Reynolds number based on the two−phase mixture velocity | |
| g | Gravitational acceleration |
| Superficial velocity of the gas phase | |
| Co | Distribution parameter |
| Ugm | Drift velocity |
| Subscripts | |
| in | Access to systems |
| out | Out of system |
| ew | External wall |
| iw | Inner wall |
| sat | Saturation |
| vap | Vapor phase |
| liq | Liquid phase |
| tp | Two-phase |
| frict | Frictional |
| gray | Gravitational |
| mom | Momentum |
References
1. Liu H, Fan J, Lin X, Lin K, Wang S, Liu S, et al. Identification of gas-liquid two-phase flow patterns based on flexible ultrasound array and machine learning. npj Flex Electron. 2024;8(1):67. doi:10.1038/s41528-024-00354-8. [Google Scholar] [CrossRef]
2. Du J, Zhao C, Bo H. Investigation of bubble departure diameter in horizontal and vertical subcooled flow boiling. Int J Heat Mass Transf. 2018;127(6):796–805. doi:10.1016/j.ijheatmasstransfer.2018.07.019. [Google Scholar] [CrossRef]
3. Piasecka M, Strąk K, Maciejewska B. Heat transfer characteristics during flow along horizontal and vertical minichannels. Int J Multiph Flow. 2021;137(6647):103559. doi:10.1016/j.ijmultiphaseflow.2021.103559. [Google Scholar] [CrossRef]
4. Holagh SG, Ahmed WH. Critical review of vertical gas-liquid slug flow: an insight to better understand flow hydrodynamics’ effect on heat and mass transfer characteristics. Int J Heat Mass Transf. 2024;225:125422. doi:10.1016/j.ijheatmasstransfer.2024.125422. [Google Scholar] [CrossRef]
5. Maqbool MH, Palm B, Khodabandeh R. Investigation of two phase heat transfer and pressure drop of propane in a vertical circular minichannel. Exp Therm Fluid Sci. 2013;46(3):120–30. doi:10.1016/j.expthermflusci.2012.12.002. [Google Scholar] [CrossRef]
6. de Oliveira JD, Copetti JB, Passos JC. On flow boiling of R-1270 in a small horizontal tube: flow patterns and heat transfer. Appl Therm Eng. 2020;178(2):115403. doi:10.1016/j.applthermaleng.2020.115403. [Google Scholar] [CrossRef]
7. Harirchian T, Garimella SV. Flow regime-based modeling of heat transfer and pressure drop in microchannel flow boiling. Int J Heat Mass Transf. 2012;55(4):1246–60. doi:10.1016/j.ijheatmasstransfer.2011.09.024. [Google Scholar] [CrossRef]
8. Cheng L, Xia G. Fundamental issues, mechanisms and models of flow boiling heat transfer in microscale channels. Int J Heat Mass Transf. 2017;108(9):97–127. doi:10.1016/j.ijheatmasstransfer.2016.12.003. [Google Scholar] [CrossRef]
9. Muhammad T, Haider F. Time-dependent flow of Reiner-Rivlin nanofluid over a stretching sheet with Arrhenius activation energy and binary chemical reaction. Multidiscip Model Mater Struct. 2025;21(1):1–18. doi:10.1108/MMMS-05-2024-0123. [Google Scholar] [CrossRef]
10. Cheng L, Wang Q, Xu J. Supercritical heat transfer of CO2 in horizontal tube emphasizing pseudo-boiling and stratification effects. Int J Heat Mass Transf. 2024;220(21):124953. doi:10.1016/j.ijheatmasstransfer.2023.124953. [Google Scholar] [CrossRef]
11. Li Y, Wu H, Yao Y. Experimental study on flow boiling characteristics in short counter-flow slot interconnected microchannels. Int J Therm Sci. 2024;203:109143. doi:10.1016/j.ijthermalsci.2024.109143. [Google Scholar] [CrossRef]
12. Rao Y-C, Ding B-Y, Wang S-L, Wang Z-W, Zhou S-D. Flow pattern and pressure drop of gas-liquid two-phase swirl flow in a horizontal pipe. J Cent South Univ. 2019;26(9):2528–42. doi:10.1007/s11771-019-4192-6. [Google Scholar] [CrossRef]
13. Yao C, Zhao Y, Ma H, Liu Y, Zhao Q, Chen G. Two-phase flow and mass transfer in microchannels: a review from local mechanism to global models. Chem Eng Sci. 2021;229:116017. doi:10.1016/j.ces.2020.116017. [Google Scholar] [CrossRef]
14. Zhang Z, Wu Y, He K, Yan X. Experimental investigation into flow boiling heat transfer and pressure drop in porous coated microchannels. Int J Heat Mass Transf. 2024;218(1):124734. doi:10.1016/j.ijheatmasstransfer.2023.124734. [Google Scholar] [CrossRef]
15. Thome JR. Boiling in microchannels: a review of experiment and theory. Int J Heat Fluid Flow. 2004;25(2):128–39. doi:10.1016/j.ijheatfluidflow.2003.11.005. [Google Scholar] [CrossRef]
16. Lin Y, Luo Y, Li W, Cao Y, Tao Z, Shih TIP. Single-phase and two-phase flow and heat transfer in microchannel heat sink with various manifold arrangements. Int J Heat Mass Transf. 2021;171(1):121118. doi:10.1016/j.ijheatmasstransfer.2021.121118. [Google Scholar] [CrossRef]
17. Holagh SG, Abdous MA, Shamsaiee M, Saffari H. Assessment of heat transfer enhancement technique in flow boiling conditions based on entropy generation analysis: twisted-tape tube. Heat Mass Transf. 2020;56(2):429–43. doi:10.1007/s00231-019-02705-y. [Google Scholar] [CrossRef]
18. Feizabadi A, Khoshvaght-Aliabadi M, Rahimi AB. Experimental evaluation of thermal performance and entropy generation inside a twisted U-tube equipped with twisted-tape inserts. Int J Therm Sci. 2019;145(93):106051. doi:10.1016/j.ijthermalsci.2019.106051. [Google Scholar] [CrossRef]
19. Hojati A, Akhavan-Behabadi MA, Hanafizadeh P, Ahmadpour MM. Effect of geometrical parameters on entropy generation during R134a boiling flow inside unique internally grooved tubes: experimental approach. Int J Therm Sci. 2021;163(3):106845. doi:10.1016/j.ijthermalsci.2021.106845. [Google Scholar] [CrossRef]
20. Abdous MA, Saffari H, Avval HB, Khoshzat M. Investigation of entropy generation in a helically coiled tube in flow boiling condition under a constant heat flux. Int J Refrig. 2015;60:217–33. doi:10.1016/j.ijrefrig.2015.07.026. [Google Scholar] [CrossRef]
21. Tang X, Xu Q, Li J, Yu H, Pei C, Guo L. Experimental study on flow boiling heat transfer in open copper microchannel heat sinks with different aspect ratios. Int J Heat Mass Transf. 2024;231(16):125879. doi:10.1016/j.ijheatmasstransfer.2024.125879. [Google Scholar] [CrossRef]
22. Bejan A. Entropy generation minimization: the new thermodynamics of finite-size devices and finite-time processes. J Appl Phys. 1996;79(3):1191–218. doi:10.1063/1.362674. [Google Scholar] [CrossRef]
23. Revellin R, Bonjour J. Entropy generation during flow boiling of pure refrigerant and refrigerant-oil mixture. Int J Refrig. 2011;34(4):1040–7. doi:10.1016/j.ijrefrig.2011.01.010. [Google Scholar] [CrossRef]
24. Hong Y, Guo J, Lucas A. Quantum memory at nonzero temperature in a thermodynamically trivial system. Nat Commun. 2025;16(1):316. doi:10.1038/s41467-024-55570-7. [Google Scholar] [PubMed] [CrossRef]
25. Xin C, Gang W, Yin YZ, Xiaojun WU. A review of uncertainty quantification methods for Computational Fluid Dynamics. kqdlxxb. 2021;39(4):1–13. doi:10.7638/kqdlxxb-2021.0012. [Google Scholar] [CrossRef]
26. Baker O. Design of pipelines for the simultaneous flow of oil and gas. In: Proceedings of the Fall Meeting of the Petroleum Branch of AIME; 1953 Oct 19-21; Dallas, TX, USA. doi:10.2118/323-G. [Google Scholar] [CrossRef]
27. Mandhane JM, Gregory GA, Aziz K. A flow pattern map for gas—liquid flow in horizontal pipes. Int J Multiph Flow. 1974;1(4):537–53. doi:10.1016/0301-9322(74)90006-8. [Google Scholar] [CrossRef]
28. Saisorn S, Benjawun P, Suriyawong A, Asirvatham LG, Mondal PK, Wongwises S. Two-phase flow structures in a helically coiled microchannel: an experimental investigation. Phys Fluids. 2023;35(10):102012. doi:10.1063/5.0171004. [Google Scholar] [CrossRef]
29. Fabre J, Figueroa-Espinoza B. Taylor bubble rising in a vertical pipe against laminar or turbulent downward flow: symmetric to asymmetric shape transition. J Fluid Mech. 2014;755:485–502. doi:10.1017/jfm.2014.429. [Google Scholar] [CrossRef]
30. Saisorn S, Wongpromma P, Wongwises S. The difference in flow pattern, heat transfer and pressure drop characteristics of mini-channel flow boiling in horizontal and vertical orientations. Int J Multiph Flow. 2018;101:97–112. doi:10.1016/j.ijmultiphaseflow.2018.01.005. [Google Scholar] [CrossRef]
31. Zhou Y. Rayleigh-Taylor and Richtmyer-Meshkov instability induced flow, turbulence, and mixing. I Phys Rep. 2017;720–722(2):1–136. doi:10.1016/j.physrep.2017.07.005. [Google Scholar] [CrossRef]
32. Lai SH, Lyu LH. Nonlinear evolution of the MHD Kelvin-Helmholtz instability in a compressible plasma. J Geophys Res. 2006;111(A1):A01202. doi:10.1029/2004JA010724. [Google Scholar] [CrossRef]
33. Klausner JF, Mei R, Bernhard DM, Zeng LZ. Vapor bubble departure in forced convection boiling. Int J Heat Mass Transf. 1993;36(3):651–62. doi:10.1016/0017-9310(93)80041-R. [Google Scholar] [CrossRef]
34. Huang SF. Mechanism study of bubble dynamics under the buoyancy effects. Nucl Anal. 2023;2(1):100060. doi:10.1016/j.nucana.2023.100060. [Google Scholar] [CrossRef]
35. Peng G, Shimizu S. Progress in numerical simulation of cavitating water jets. J Hydrodyn. 2013;25(4):502–9. doi:10.1016/S1001-6058(11)60389-3. [Google Scholar] [CrossRef]
36. Cioncolini A, Thome JR. Void fraction prediction in annular two-phase flow. Int J Multiph Flow. 2012;43:72–84. doi:10.1016/j.ijmultiphaseflow.2012.03.003. [Google Scholar] [CrossRef]
37. Bhagwat SM, Ghajar AJ. A flow pattern independent drift flux model based void fraction correlation for a wide range of gas-liquid two phase flow. Int J Multiph Flow. 2014;59:186–205. doi:10.1016/j.ijmultiphaseflow.2013.11.001. [Google Scholar] [CrossRef]
38. Keepaiboon C, Dalkilic AS, Mahian O, Ahn HS, Wongwises S, Mondal PK, et al. Two-phase flow boiling in a microfluidic channel at high mass flux. Phys Fluids. 2020;32(9):093309. doi:10.1063/5.0023758. [Google Scholar] [CrossRef]
39. Maughan JR, Incropera FP. Experiments on mixed convection heat transfer for airflow in a horizontal and inclined channel. Int J Heat Mass Transf. 1987;30(7):1307–18. doi:10.1016/0017-9310(87)90163-3. [Google Scholar] [CrossRef]
40. Sulaiman MW, Wang CC. Optimizing microchannel heat sink performance: effect of step-gap design and contraction on flow boiling stability and heat transfer. Appl Therm Eng. 2024;257(5):124467. doi:10.1016/j.applthermaleng.2024.124467. [Google Scholar] [CrossRef]
41. Qiu Y, Vo T, Garg D, Lee H, Kharangate CR. A systematic approach to optimization of ANN model parameters to predict flow boiling heat transfer coefficient in mini/micro-channel heatsinks. Int J Heat Mass Transf. 2023;202:123728. doi:10.1016/j.ijheatmasstransfer.2022.123728. [Google Scholar] [CrossRef]
42. Ma X, Ji X, Hu C, Yang X, Zhang Y, Wei J, et al. Saturated/subcooled flow boiling heat transfer inside micro/mini-channels: a new prediction correlation and experiment evaluation. Int J Heat Mass Transf. 2023;210(2):124184. doi:10.1016/j.ijheatmasstransfer.2023.124184. [Google Scholar] [CrossRef]
43. Cao S, Wang G, Wu X, Yang W, Hu C. An experimental investigation of R245fa flow boiling heat transfer performance in horizontal and vertical tubes. Int J Refrig. 2024;160:229–45. doi:10.1016/j.ijrefrig.2024.02.008. [Google Scholar] [CrossRef]
Cite This Article
 Copyright © 2025 The Author(s). Published by Tech Science Press.
This work is licensed under a Creative Commons Attribution 4.0 International License , which permits unrestricted use, distribution, and reproduction in any medium, provided the original work is properly cited.
 Downloads
 Citation Tools