
 Submit a Paper
 Propose a Special lssue
 Open Access
ARTICLE

Cavitation Control in Mixed-Flow Pumps through Blade Perforation
1 School of Mechanical Engineering, Nantong University, Nantong, China
2 School of Information Science and Technology, Nantong University, Nantong, China
* Corresponding Authors: Weidong Shi. Email: ; Yongfei Yang. Email:
(This article belongs to the Special Issue: Advances in Fluid Machinery and Fluid Mechanics for Deep-Sea Resource Extraction and Exploitation)
Fluid Dynamics & Materials Processing 2026, 22(2), 7 https://doi.org/10.32604/fdmp.2026.074543
Received 13 October 2025; Accepted 24 February 2026; Issue published 04 March 2026
 View Full Text
 Download PDF
Abstract
During high-speed operation, mixed-flow pumps are susceptible to cavitation, which destabilizes the internal flow, increases energy losses, and degrades hydraulic efficiency. To assess the effectiveness of blade perforation as a cavitation-mitigation strategy, in this study several mixed-flow pump models incorporating perforations were developed. Numerical simulations were performed for configurations with circular holes positioned at different locations along the blade leading edge, and the computational results were validated against experimental measurements. The findings indicate that the location of the perforations plays a decisive role in cavitation suppression. Moving from the blade rim toward the hub along the leading edge, the critical net positive suction head, NPSHcr, initially decreases and subsequently increases, while remaining consistently lower than that of the reference non-perforated configuration. The perforations promote the transfer of high-pressure fluid from the pressure side to the suction side of the blade, thereby alleviating local low-pressure regions. This pressure compensation significantly reduces the extent of low-pressure zones in the vicinity of the perforations, leading to a marked suppression of cavitation both locally and downstream of the perforated regions.Keywords
The mixed-flow pump, as a key component of the water jet propulsion system, has been widely applied in fields such as water conservancy and shipbuilding [1,2]. In the deep-sea hydraulic lifting system for marine mineral resource development, a mixed-flow mud lifting pump with similar specific speed and blade load characteristics has also been developed [3], indicating that the deep-sea lifting pump is essentially the same as the general mixed-flow pump in terms of the hydraulic type studied in this paper. However, cavitation cannot be avoided during high-speed operation, which will induce vibration, noise and performance degradation, thereby threatening the safe and stable operation of the device [4,5]. Therefore, clarifying the occurrence and evolution mechanism of cavitation in the mixed-flow pump and exploring effective suppression methods is of great theoretical and engineering significance for improving the operating efficiency, cavitation resistance and operational stability of the mixed-flow pump under low-pressure reserve conditions in deep-sea applications, and also provides technical approaches and mechanism basis for the design of pump devices for demanding deep-sea applications.
In recent years, in order to study the cavitation phenomenon and mechanism of the mixed-flow pumps, many scholars have studied the flow field of the mixed-flow pumps by numerical simulation and experimental test, which provides powerful support for understanding the cavitation mechanism deeply. Sedlar et al. [6] conducted a systematic analysis of cavitation flow within the mixed-flow pump using CFD numerical simulation, Rayleigh-Plesset cavitation model, and SST type turbulence model. They revealed the cavitation structure and flow field instability under different flow rates and NPSH conditions. Yang et al. [7] conducted a numerical study showing that, during the cavitation development stage, cavitation bubbles on the suction surface of the mixed-flow pump blade originate from the leading edge and gradually propagate as the available net positive suction head (NPSHa) decreases. Li et al. [8] conducted a numerical study on the cavitation flow characteristics in a mixed-flow pump using the Wray-Agarwal turbulence model and the homogeneous flow model. The results showed that as cavitation intensity increases, the low-pressure region at the leading edge of the blade extends toward the trailing edge, while the leakage flow intensifies and shifts toward the suction side of the blade.
With the rapid development of computational fluid dynamics (CFD) [9] and the maturity of cavitation mechanisms [10], how to suppress cavitation and improve pump performance has become the focus of current research. Timoshevskiy et al. [11] investigated the active control mechanism of cavitation flow through injection holes on the surface of hydrofoils. The experimental results indicated that the low-speed injection could effectively suppress cavitation, while the high-speed injection could enhance the hydrodynamic performance of the airfoil. Wang et al. [12] conducted a study and found that distributing water injection along the flow field on the suction surface of a hydrofoil can effectively suppress cavitation. They also revealed the appropriate porosity for single-row jet holes and the optimal placement position for double-row jet holes. Shi et al. [13] designed local micro-channels in the cavitation-prone area of the NACA0012 airfoil. Opening holes at 0.05–0.10 chord length of airfoil can significantly inhibit the development of cavitation, and a vortex is easy to form near the wall behind micro-channels. Tanaka et al. [14] achieved the elimination of the inlet swirl velocity component and the prevention of the expansion of the inlet backflow by installing a reduced-diameter suction pipe (RSP) with a swirl brake (SB) in the narrowed inlet pipe of the turbine pump. As a result, cavitation surge was completely suppressed at extremely low flow rates, and the suction performance was significantly improved. Khan et al. [15] controlled the cavitating flow within the impeller passage by introducing obstacles. Their results showed that these obstacles could significantly modify the flow field structure, reduce the growth rate of cavitation volume downstream of the blades, and influence the distribution of vorticity and turbulent kinetic energy, thereby enhancing overall flow stability and improving cavitation performance. Kadivar et al. [16] conducted an experimental study to investigate the effects of hemispherical vortex generators on cavitation over hydrofoils. Their results demonstrated that the vortex generators can mitigate the instability of cavitation structures and reduce pressure fluctuations in the wake, thereby enhancing flow stability. Zhang et al. [17] used numerical simulation methods to explore the influence of inlet side openings on the cavitation performance and turbulent kinetic energy of centrifugal pumps. The results show that the cavitation in the centrifugal pump is effectively suppressed by the inlet side opening, and the turbulent kinetic energy loss is smaller by using multiple small holes than by using a single hole, so that the flow field in the centrifugal pump is more stable. Biswas et al. [18] showed that the implementation of a triangular slot on a standard NACA 4412 hydrofoil considerably mitigates cavitation phenomena at lower cavitation numbers. Wang et al. [19] demonstrated that perforations in the front cover plate of a centrifugal pump can effectively increase the pressure within the cavitation region on the blade’s back surface. This alteration in the pressure gradient, to some extent, suppresses the progression of cavitation.
Perforations on blade surfaces have proven effective for cavitation suppression in hydraulic machinery like hydrofoils and centrifugal pumps, yet their application in the mixed-flow pump—with their distinct combined radial-axial flow—remains underexplored. This study systematically investigates how circular perforations at different spanwise positions affect cavitation in a mixed-flow pump. Through comparative analysis and quantitative flow diagnostics, we reveal how perforation location regulates local vortex structures and pressure fields to inhibit cavitation, offering new insights for passive flow control in pumps operating under critical conditions such as deep-sea environments.
2 Geometric Models and Numerical Methods
2.1 Model and Design Parameters
The mixed-flow pump model consists of four main components: inlet and outlet pipes, an impeller, and guide vanes. A three-dimensional model was constructed using Creo 9.0, and the fluid domains of each section were obtained through Boolean operations. A schematic of the 3D model is shown in Fig. 1. The main design parameters are as follows: rotational speed of 1450 rpm, a design flow rate of 136.8 m3/h, a head of 2.85 m, and a specific speed of 455.
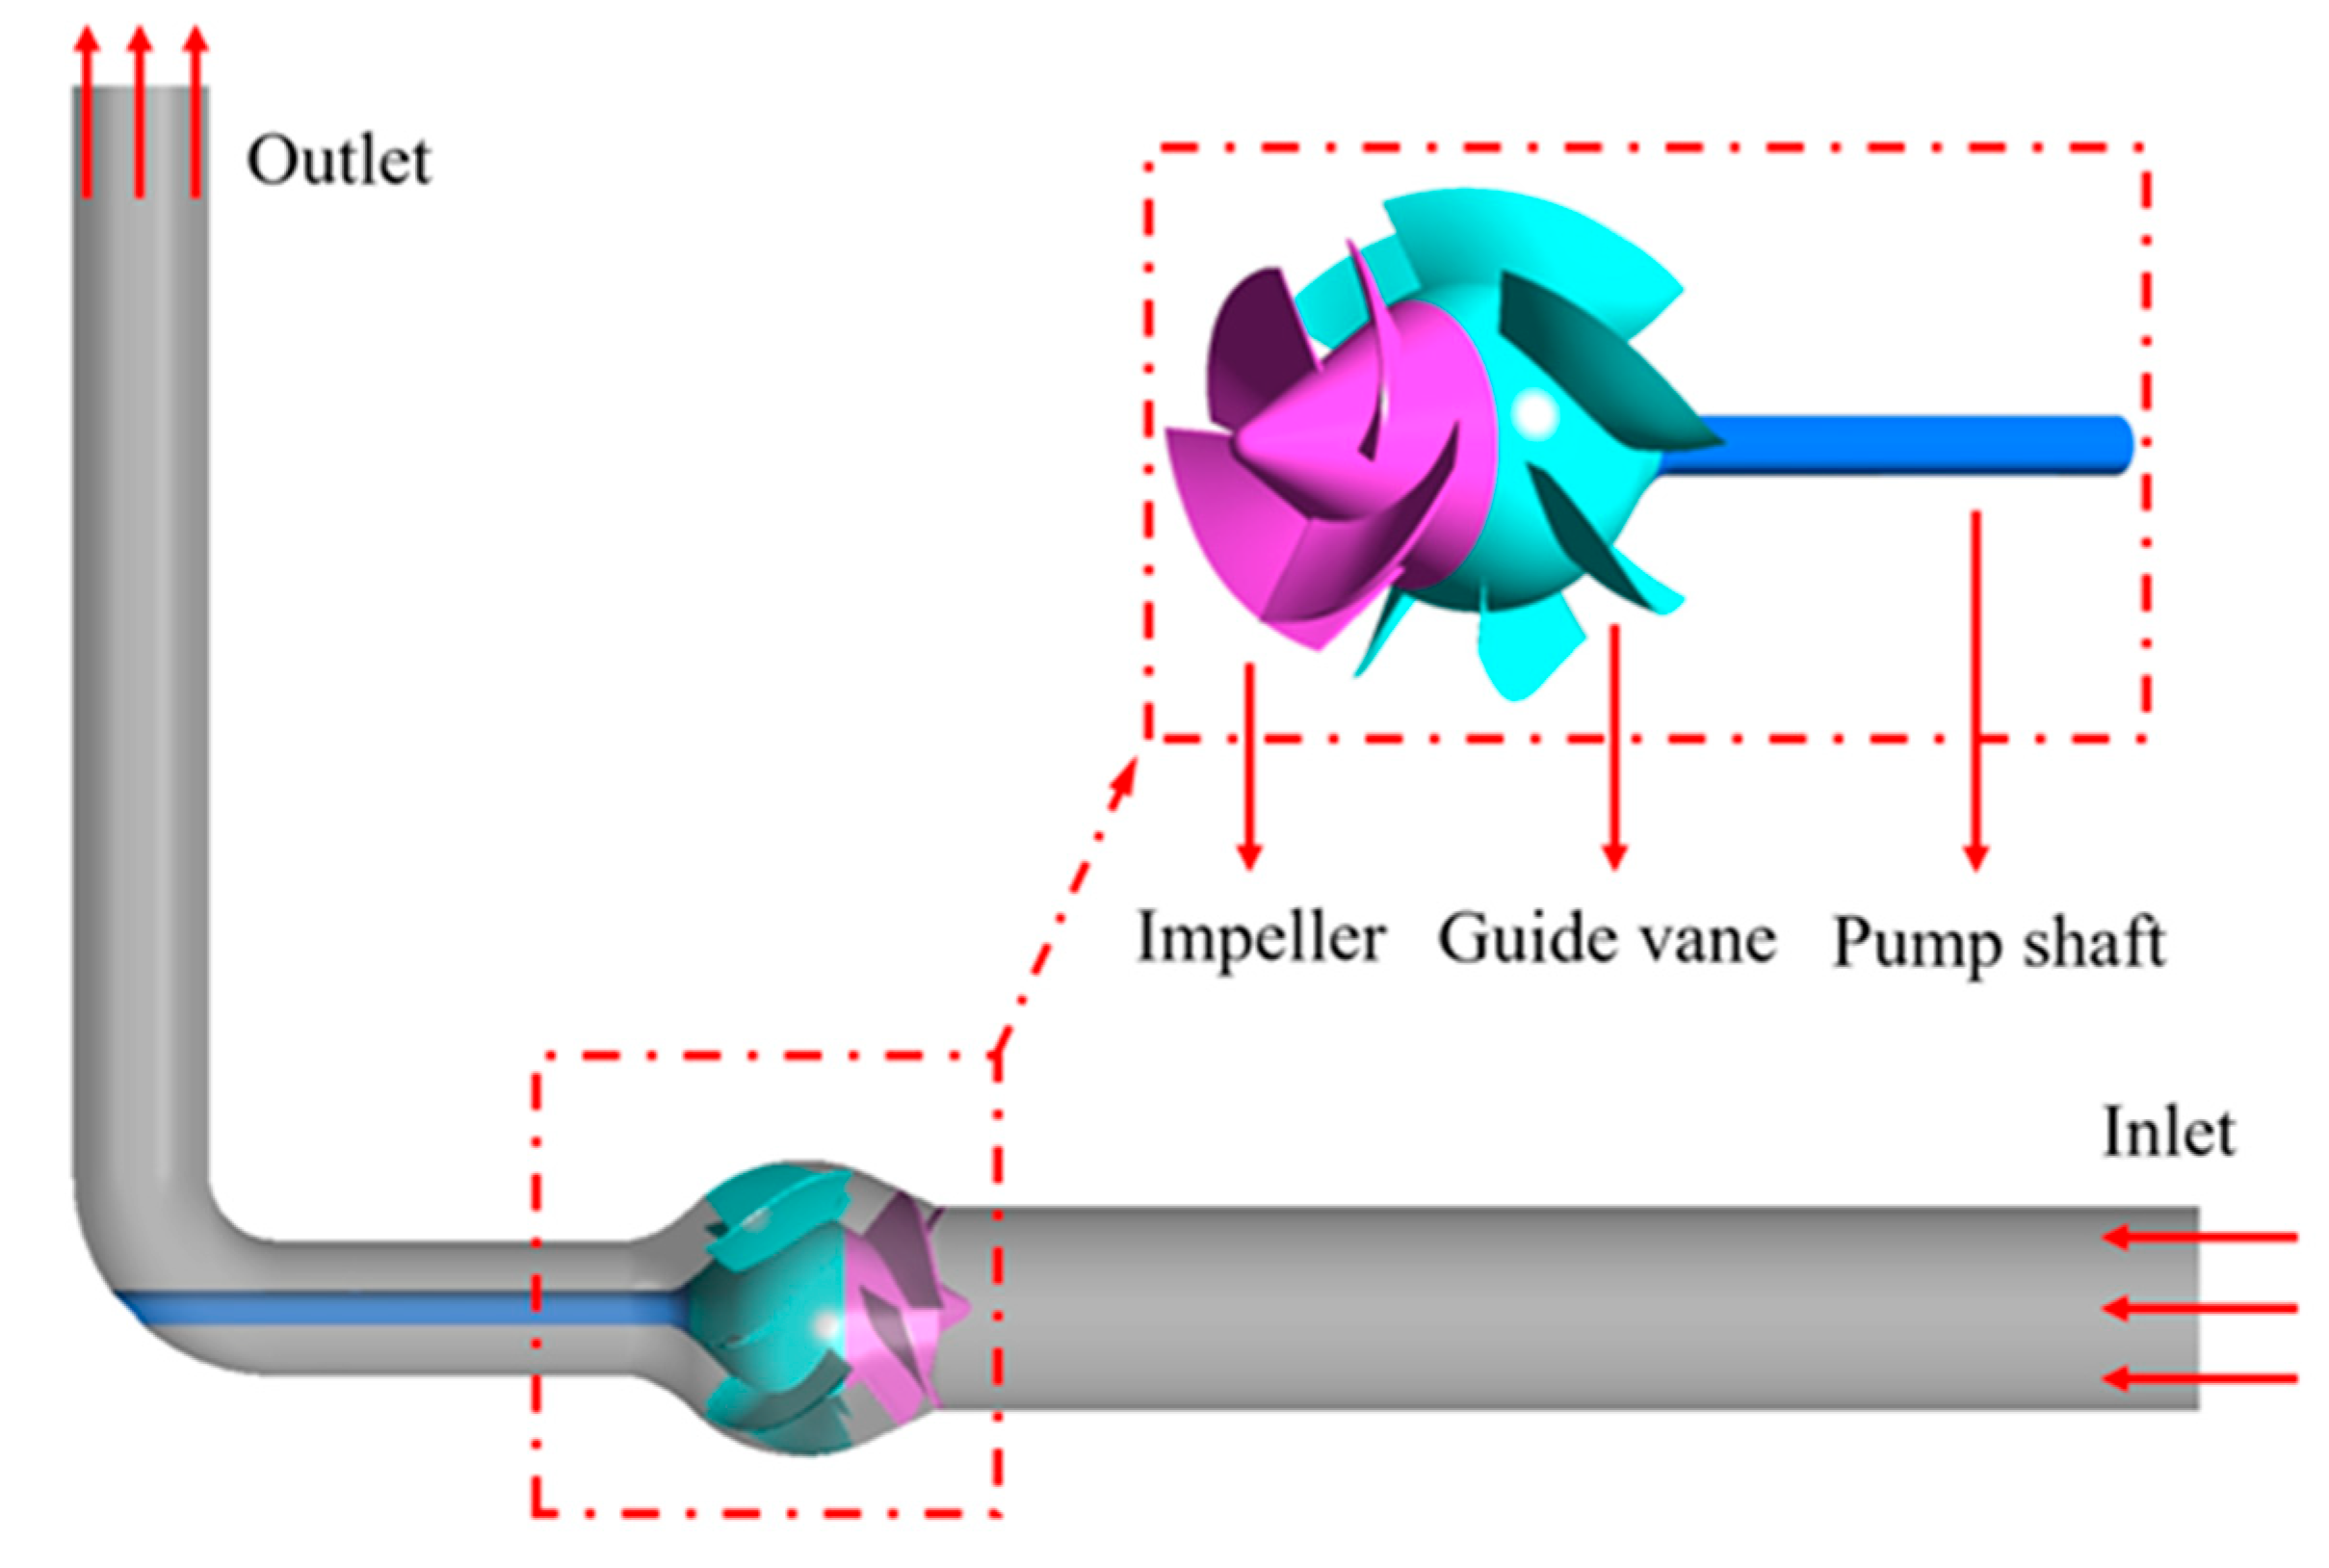
Figure 1: Three-dimensional model of the mixed-flow pump.
Mesh generation is a crucial step in numerical simulation, and the quality of the mesh plays an important role in the accuracy and efficiency of calculation results. Reasonable meshing not only captures the flow details accurately but also reduces the computational cost effectively. The generation of a hexahedral structured mesh for the impeller and inlet and outlet pipe fluid domain is to be undertaken using mesh generation software, as shown in Fig. 2. But because the blade twist degree of the mixed-flow pump studied in this paper is relatively high, the flow near the wall is relatively complex, and the grid quality requirements are also increased. Consequently, in the impeller grid generation process, the boundary layer grid and blade tip clearance are refined to make the grid quality above 0.4, and the guide vane and inlet and outlet pipes are also refined to ensure grid quality exceeds 0.6 and 0.65, respectively.
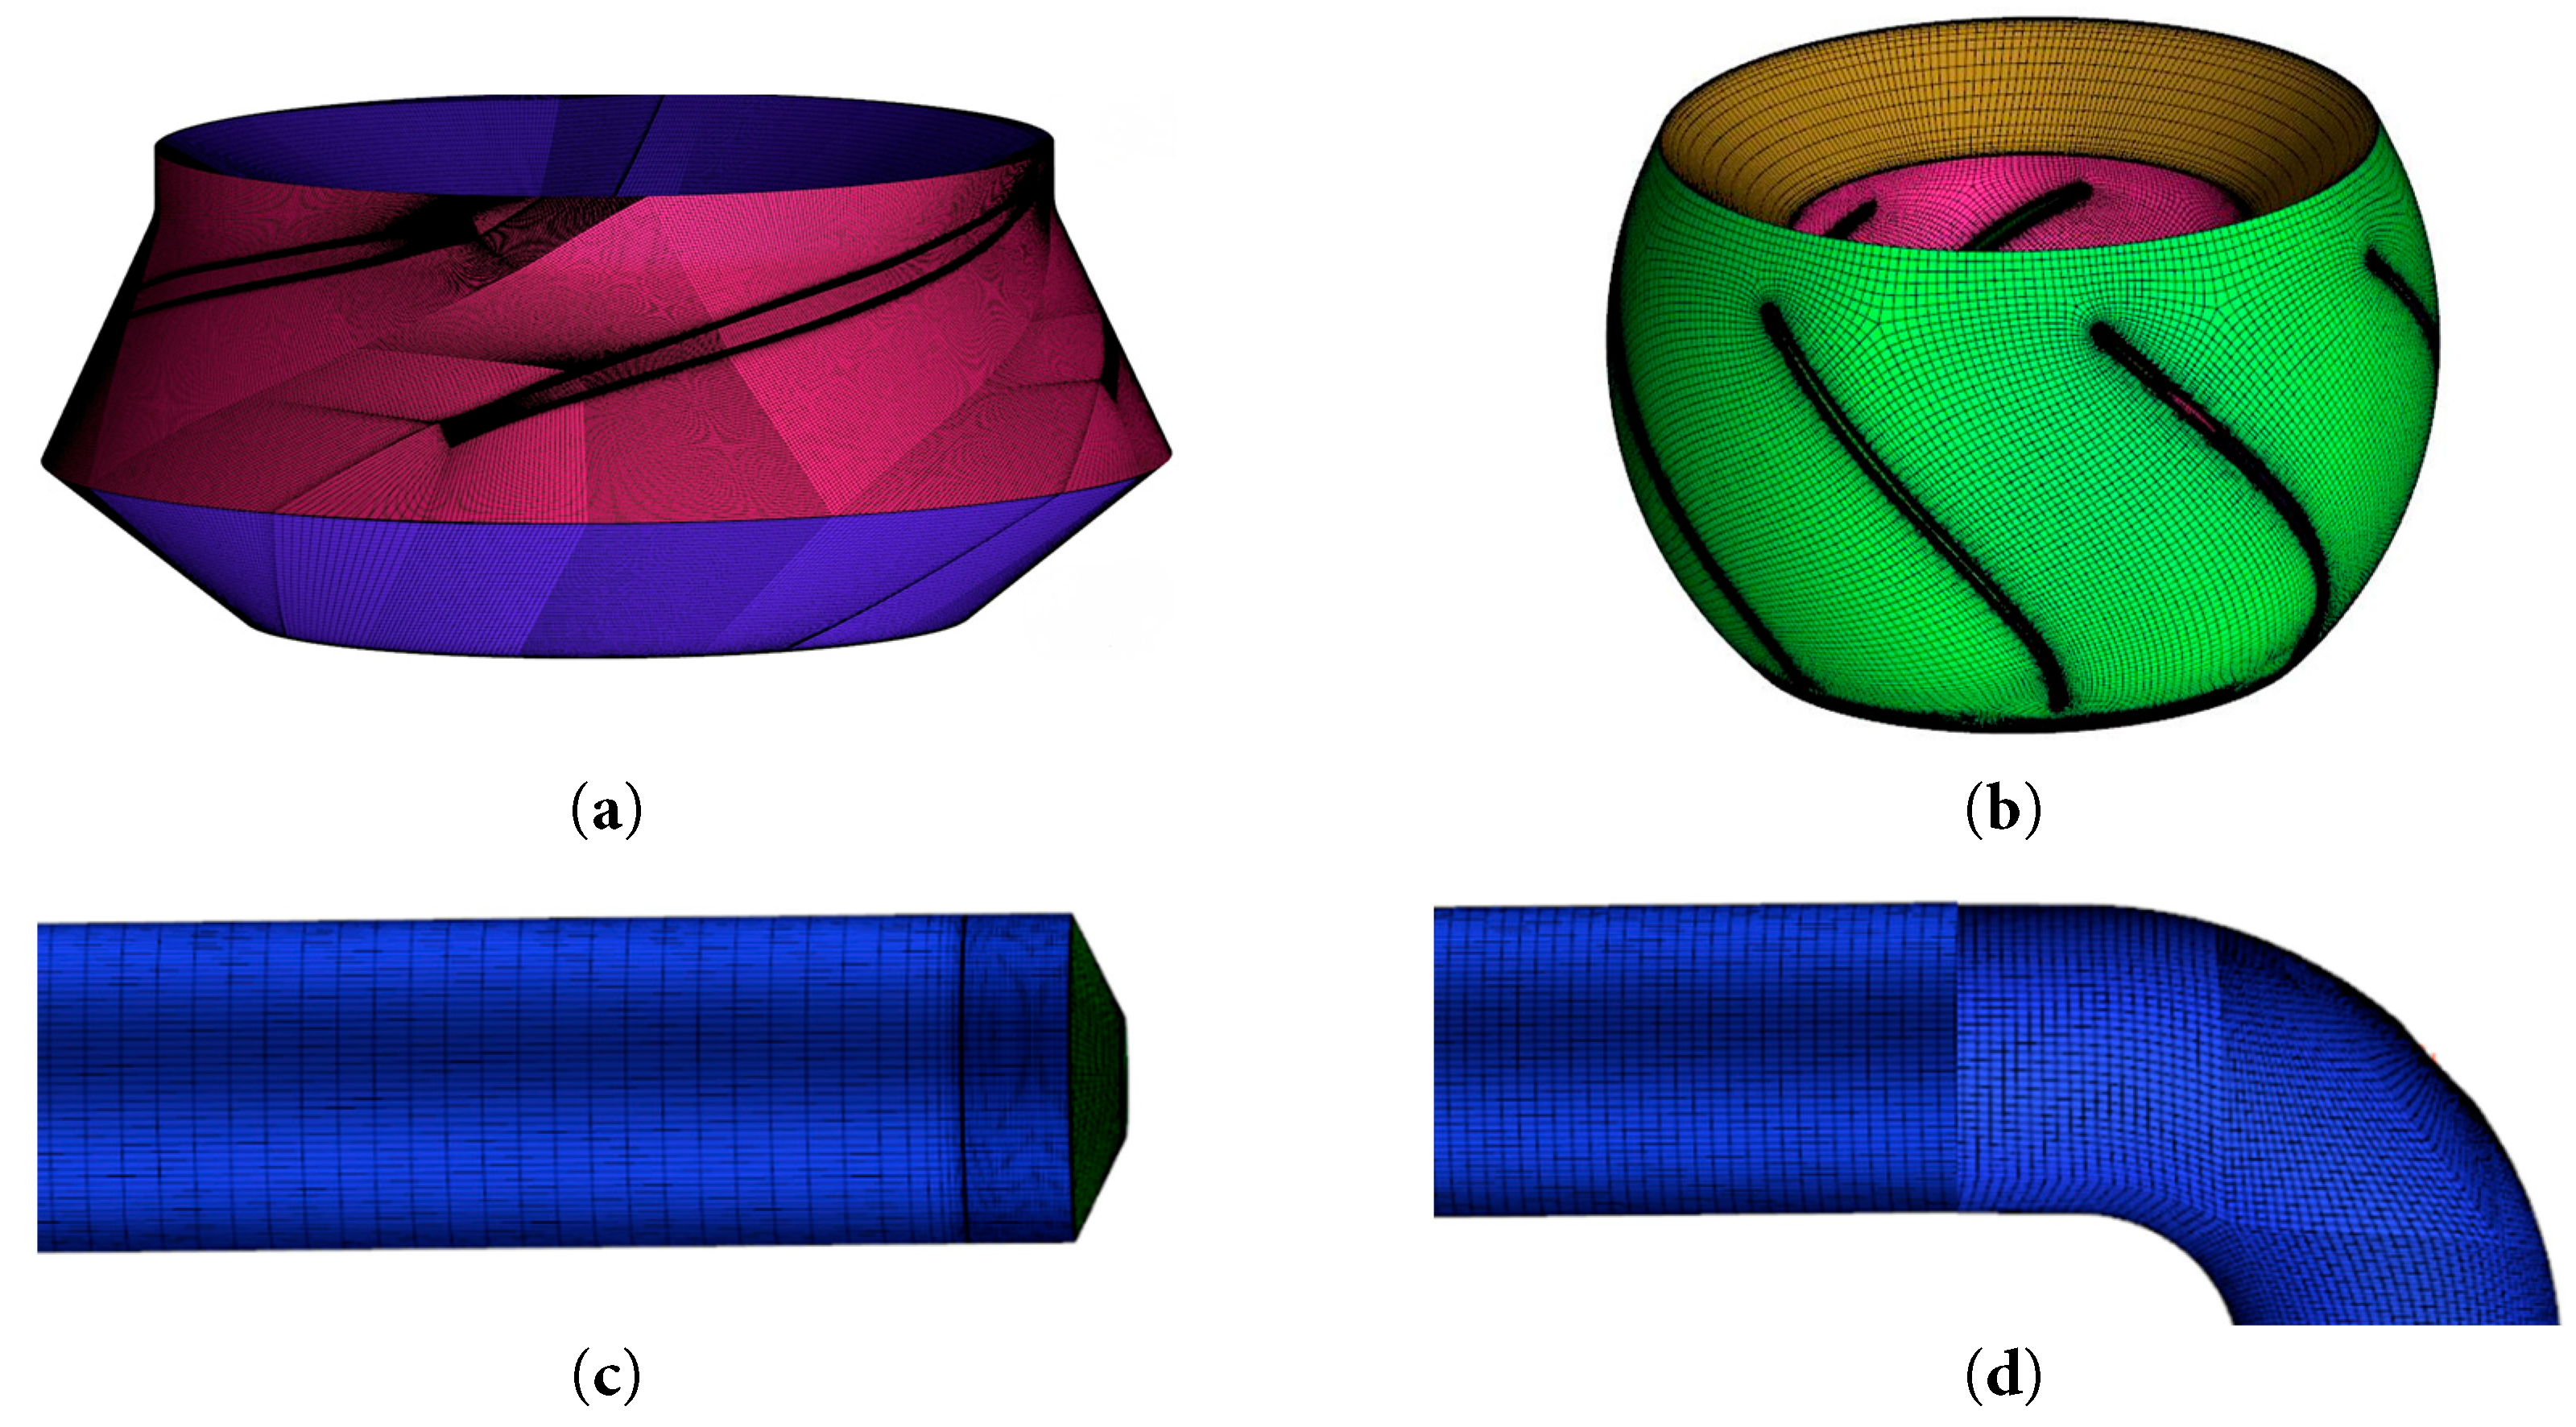
Figure 2: Mesh distribution of the computational domain. (a) Impeller mesh; (b) Guide vane mesh; (c) Inlet pipe mesh; (d) Outlet elbow pipe mesh.
In order to achieve an equilibrium between the accuracy and efficiency of computation, it is necessary to verify the grid independence of the computational domain. According to the broken line diagram of pump head and grid in Fig. 3, when the grid number is 6–7 million, the head change rate is less than 1%, which meets the calculation accuracy requirements. After careful consideration, a model with a total grid number of 6,639,297 was selected for numerical simulation.
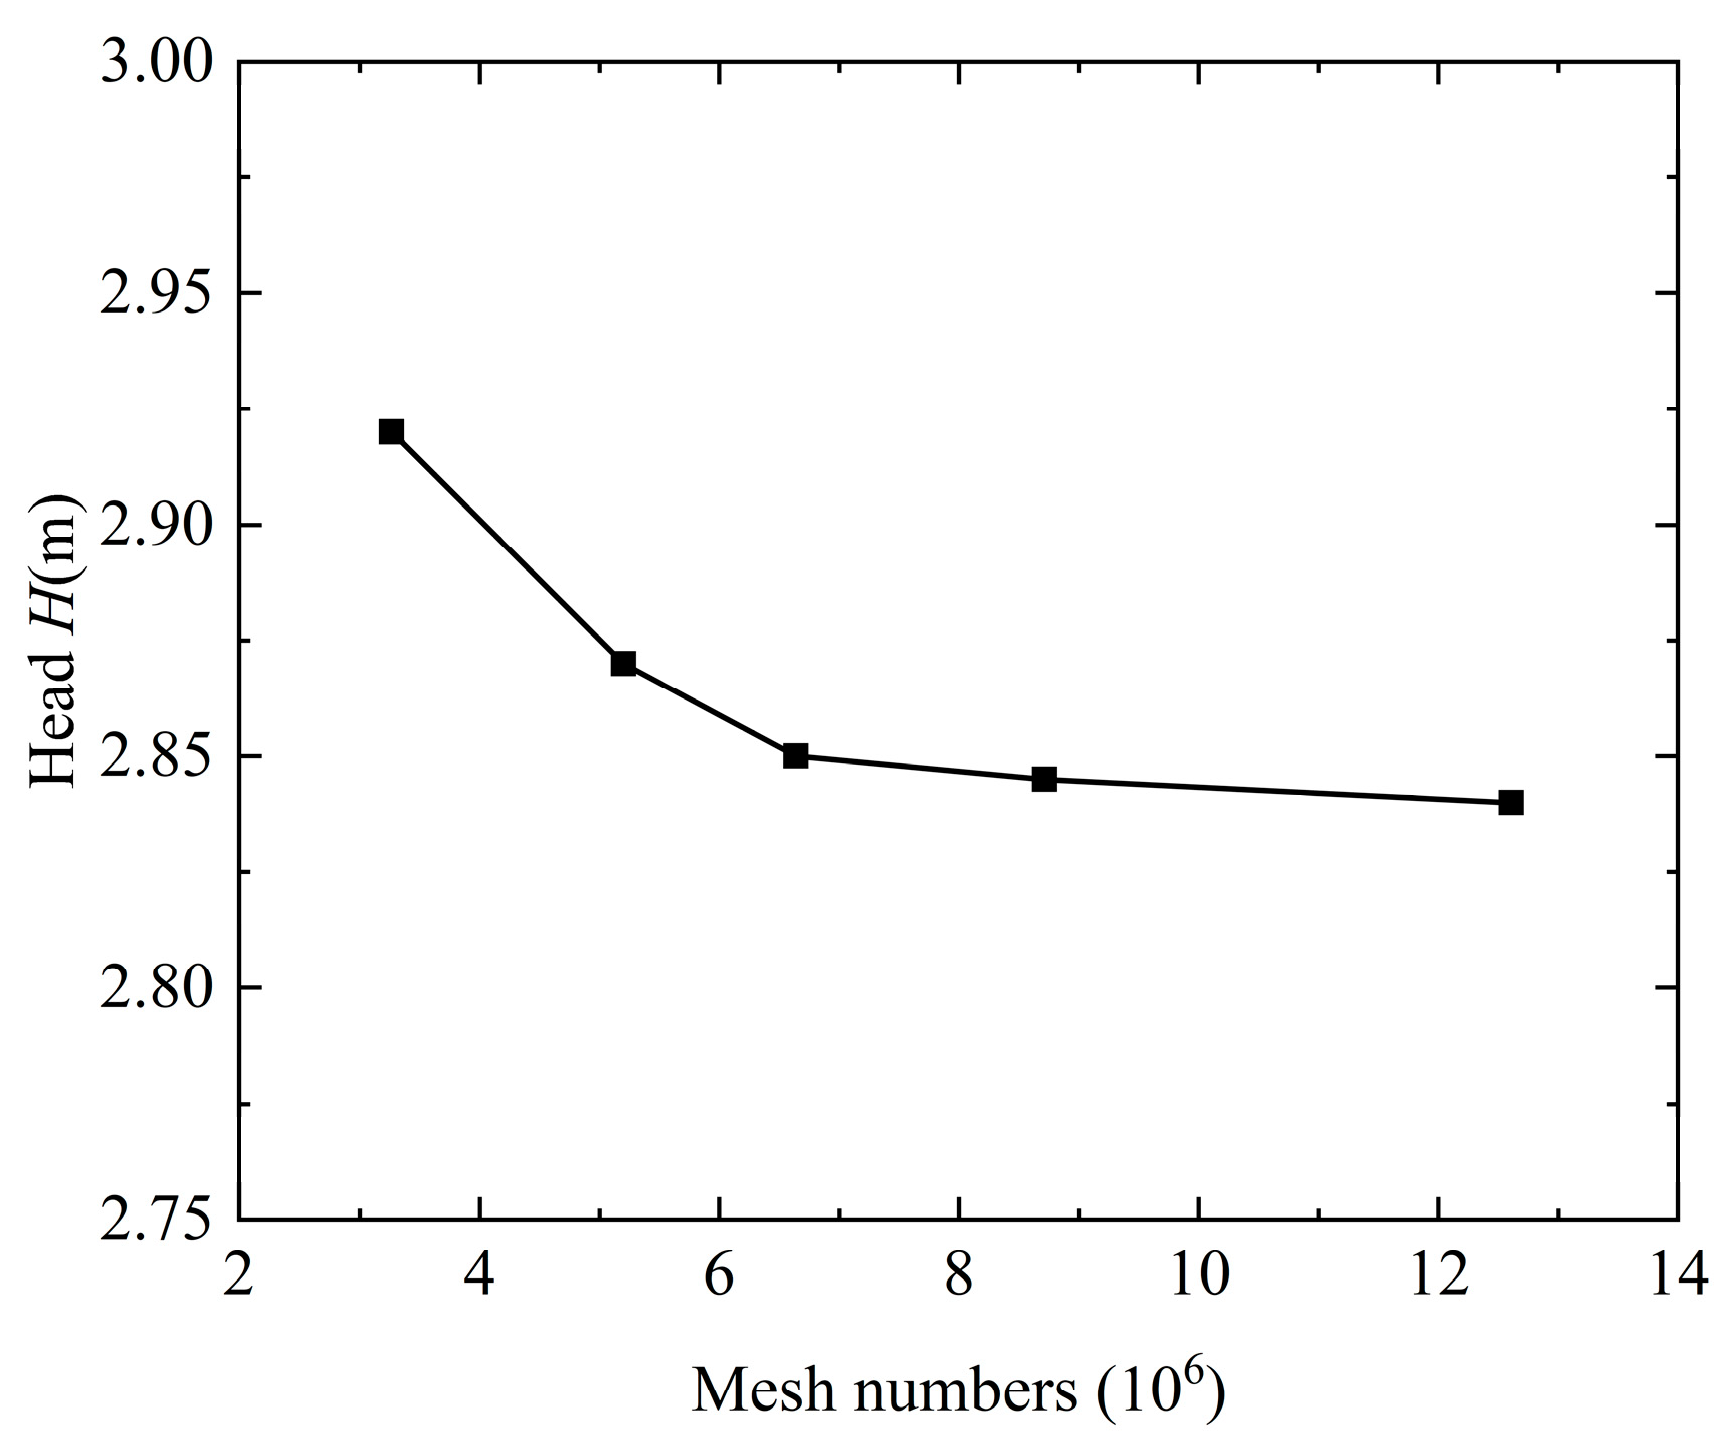
Figure 3: Mesh independence verification results.
To ensure the accuracy of numerical simulations and the precise capture of flow field details in the near-wall region, it is necessary to evaluate the quality of the near-wall mesh, which is typically assessed by examining the dimensionless wall distance y+. Generally, it is recommended to maintain the y+ value within the range of 10 to 200 in numerical calculations. However, in this work, while ensuring the effectiveness of the near-wall treatment of the k-ε model, the y+ value in the core flow-passage components is controlled below 70. The distribution of y+ values on the impeller and the guide vane is shown in Fig. 4.
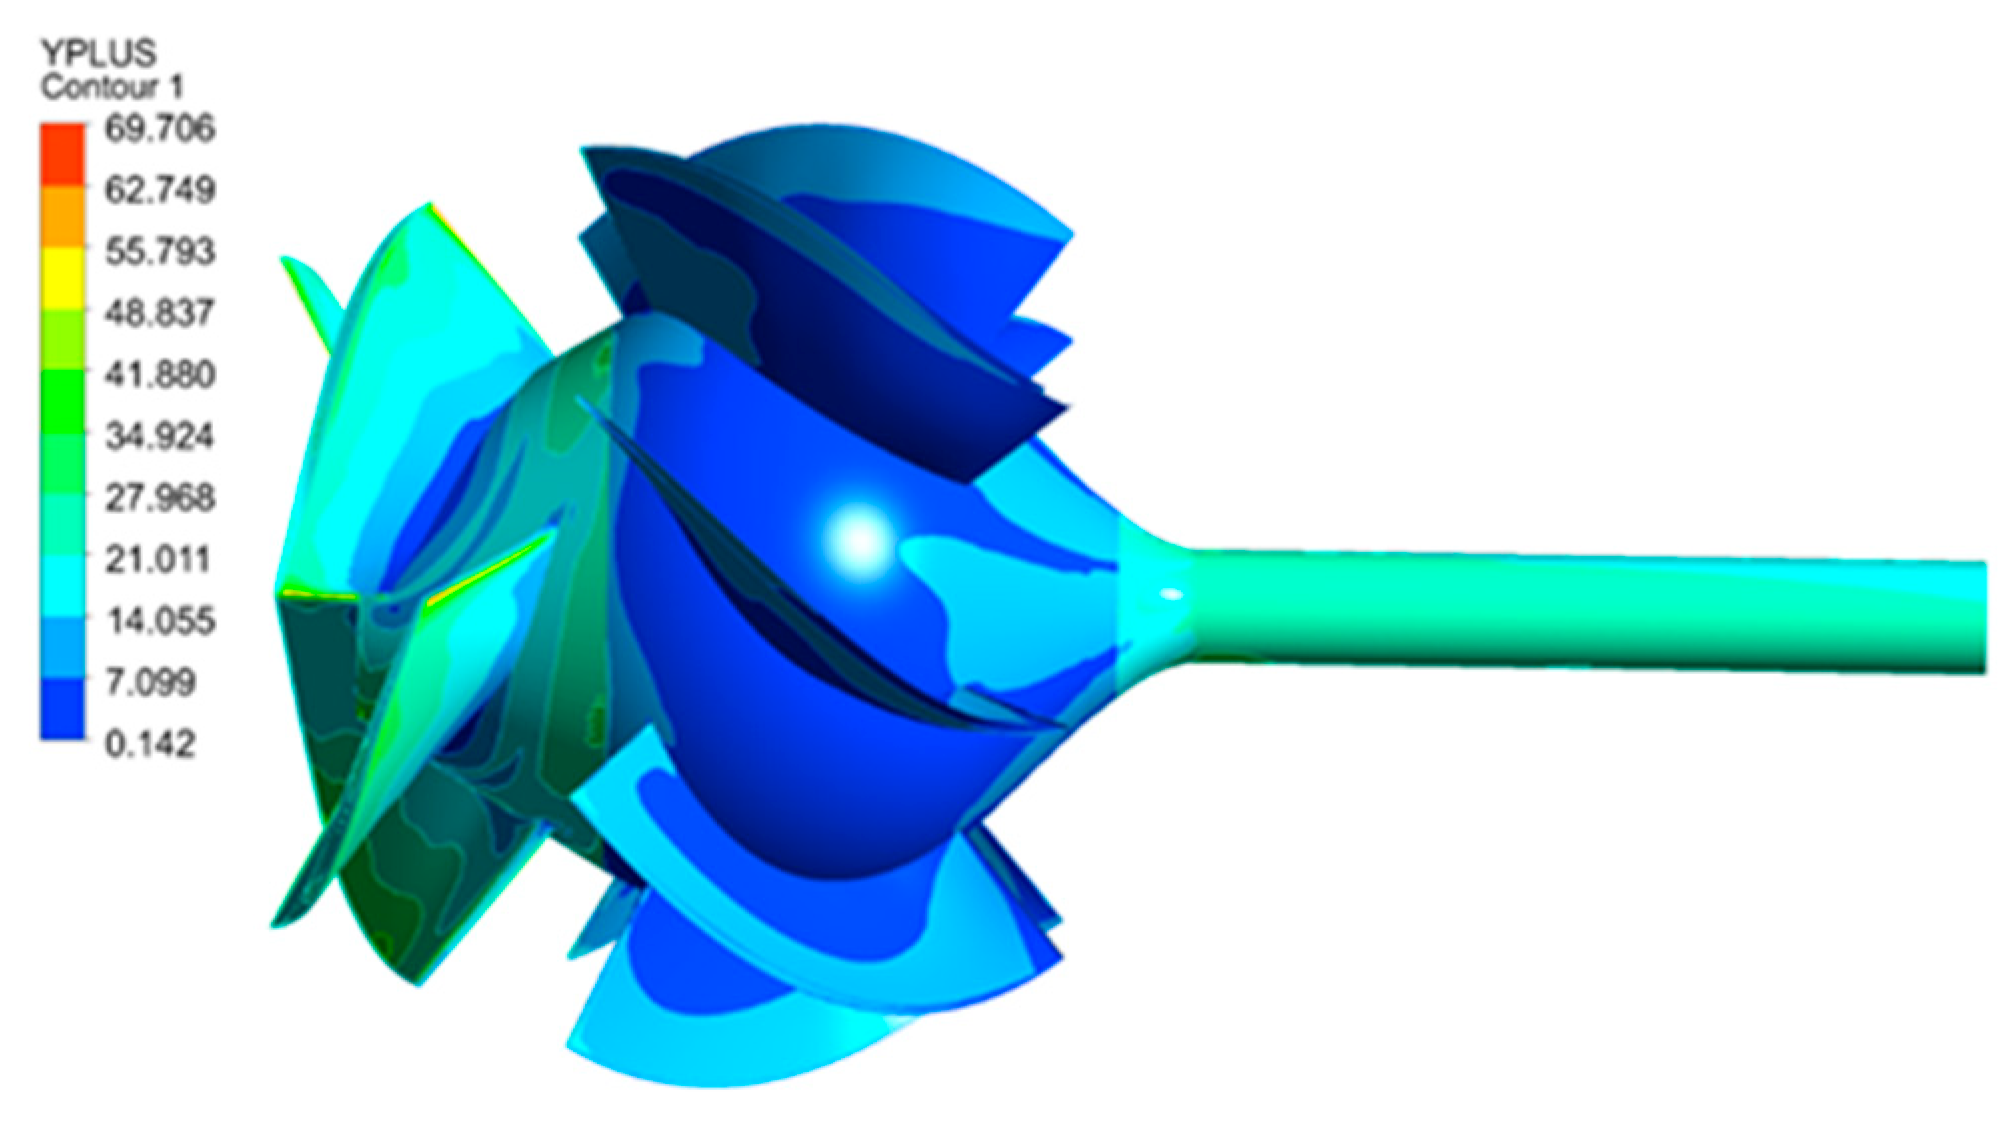
Figure 4: The y+ value of the main flow component.
2.3 Numerical Calculation Method
Cavitating flow is a two-phase flow of gas and liquid. The calculation method for such flow generally adopts the homogeneous flow model, treating the fluid throughout the entire flow field as a single-phase flow with variable density. The gas and liquid phases have the same velocity field and pressure field. When cavitation occurs inside the pump, the internal cavitation flow is a three-dimensional compressible viscous turbulent flow. The governing equation is expressed as follows [20,21]:
Turbulent flow is a highly complex unsteady flow phenomenon characterized by multi-scale vortices and random pulsations. At present, numerical simulation methods for turbulent flow mainly include direct numerical simulation (DNS), large eddy simulation (LES), and Reynolds-averaged Navier-Stokes (RANS) [24]. Among them, the RANS method has the advantages of high computational efficiency and is suitable for engineering problems with high Reynolds number, and can be further divided into Reynolds stress model and eddy viscosity model, among which the eddy viscosity model is most widely used, including standard k-ε model, RNG k-ε model, and SST k-ω model. The k-ε model is one of the most important turbulence models at present. It has been adopted by most general CFD software and is regarded as the industry standard model. This model has been proven to have stability, numerical robustness, and mature predictive capabilities [23,25]. For general simulations, this model achieves a good balance between accuracy and robustness. Therefore, in this study, we selected this model as a compromise solution between accuracy and computational cost. The standard k-ε model is selected for this study, as follows:
Based on the above equations, the corresponding values of k and ε can be obtained. The turbulent viscosity μt is then calculated from k and ε, and its expression is given as follows:
The cavitation model is a core tool for describing cavitation phenomena. The Rayleigh-Plesset cavitation model is selected through careful consideration of factors such as the research object and flow characteristics in this paper. Its advantage is that it can accurately describe the growth and collapse process of a single bubble, which is suitable for theoretical research and simulation of small-scale cavitation phenomena [27,28]. We used ANSYS CFX offers the Rayleigh-Plesset cavitation model, which is based on the simplified Rayleigh-Plesset equation of cavitation dynamics:
The cavitation flow is a two-phase flow with gas and liquid. The gas phase is governed by the transport equation as follows:
The simulations were performed using ANSYS CFX, which adopts a pressure-based fully coupled solver. The convective terms were discretized using the High Resolution scheme with second-order accuracy in smooth regions, while a second-order backward Euler scheme was employed for temporal discretization. The diffusive terms were discretized using a second-order central difference scheme. These default numerical settings are widely used for unsteady cavitating flows in turbomachinery [24]. This paper conducts a numerical calculation study on the mixed-flow pump using the k-ε turbulence model based on the ANSYS CFX software. The cavitation model adopts the Rayleigh-Plesset equation, which has good robustness. The boundary conditions for this numerical calculation are set as follows:
(1) The total pressure inlet is adopted. During the numerical simulation of cavitation, cavitation is simulated by controlling the inlet pressure. The volume fractions of the liquid phase medium water and the vapor phase medium water are 1 and 0, respectively. (2) The solid wall surface is set as a non-slip, smooth, and adiabatic wall surface. The standard wall function is used in the near-wall flow simulation. (3) In the calculation, water at 25°C is selected as the liquid phase, and water vapor at 25°C is selected as the vapor phase. The saturated vapor pressure of water is set to 3169 Pa. (4) In the steady-state numerical calculation, the convergence accuracy is set to 10−5, and the calculation is terminated when the accuracy is reached. For unsteady simulations, the time step size was determined based on the impeller rotational angle, with each time step corresponding to a small angular increment of approximately 2°. The total simulation time covered ten complete revolutions of the impeller to ensure statistically stable unsteady flow characteristics. The convergence criterion for each time step was set to 10−5. This time-stepping strategy is commonly adopted in unsteady CFD simulations of rotating machinery, allowing transient flow and cavitation structures to be adequately resolved with acceptable computational cost [21].
The schematic diagram illustrating the impeller blade opening is presented in Fig. 5. The center line of the circular through hole is perpendicular to the pump blade. In order to facilitate the accurate control of the position of the circular through hole and to enable subsequent research and analysis, we define the chordwise position coefficient Ka and the dimensionless distance Zspan of the section from hub to rim for different blade heights. Its expression is as follows:
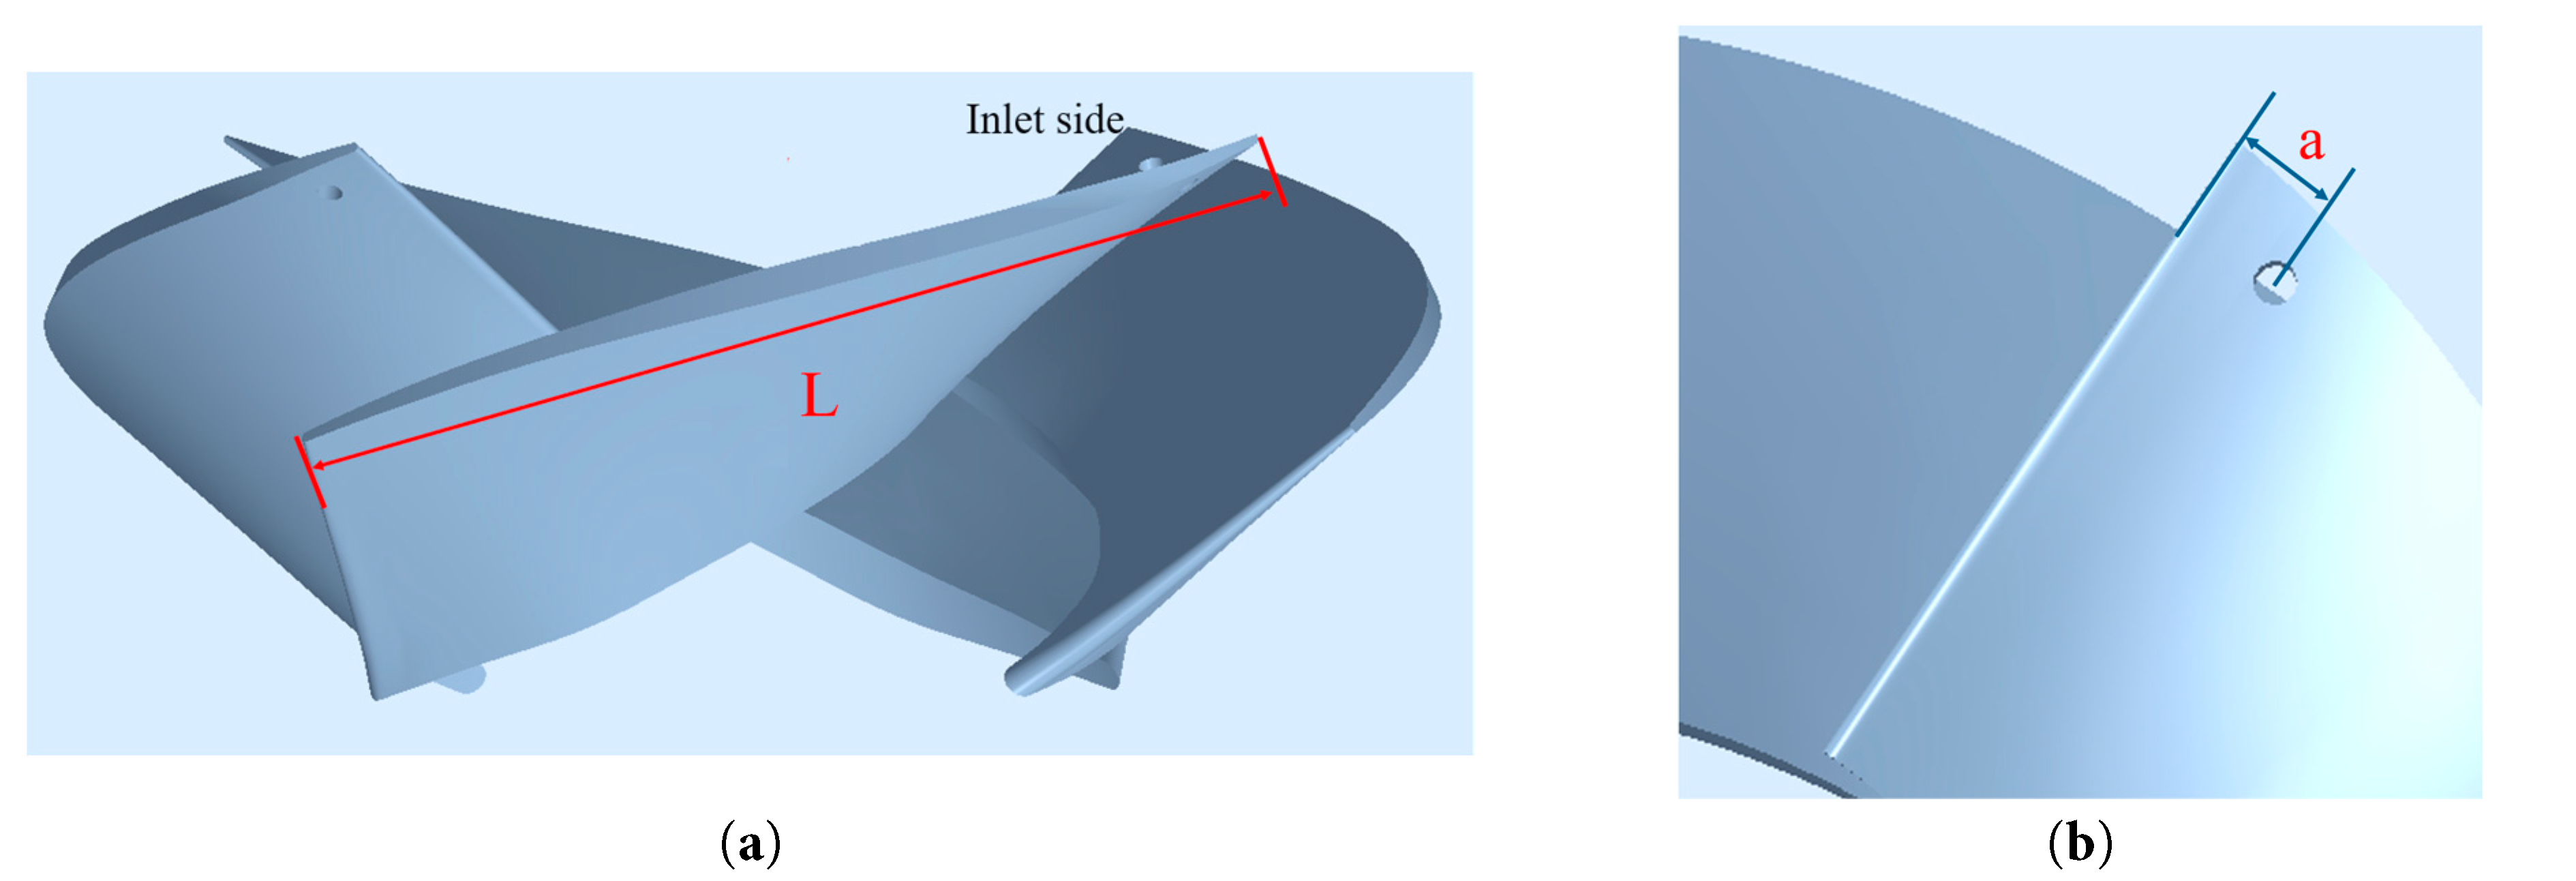
Figure 5: Schematic diagram of blade perforation. (a) Schematic illustration of the chord length L at different blade heights; (b) Schematic illustration of the distance a from the circular through-hole center to the blade leading edge.
To systematically investigate the influence of circular hole positions on cavitation suppression in the mixed-flow pump, four different perforation cases were designed along the blade height at the leading edge position of Ka = 0.1. The specific layout parameters of the circular holes in each case are listed in Table 1.
Table 1: Specific parameters of perforations at different positions.
| Case | Diameter d (mm) | Angle (°) | Ka | Zspan |
|---|---|---|---|---|
| Case 1 | 3 | 90 | 0.1 | 0.9 |
| Case 2 | 3 | 90 | 0.1 | 0.65 |
| Case 3 | 3 | 90 | 0.1 | 0.4 |
| Case 4 | 3 | 90 | 0.1 | 0.15 |
To ensure the accuracy of the numerical simulation, an O-type mesh was generated around the perforation position, and local mesh refinement was applied at the hole location, as shown in Fig. 6.
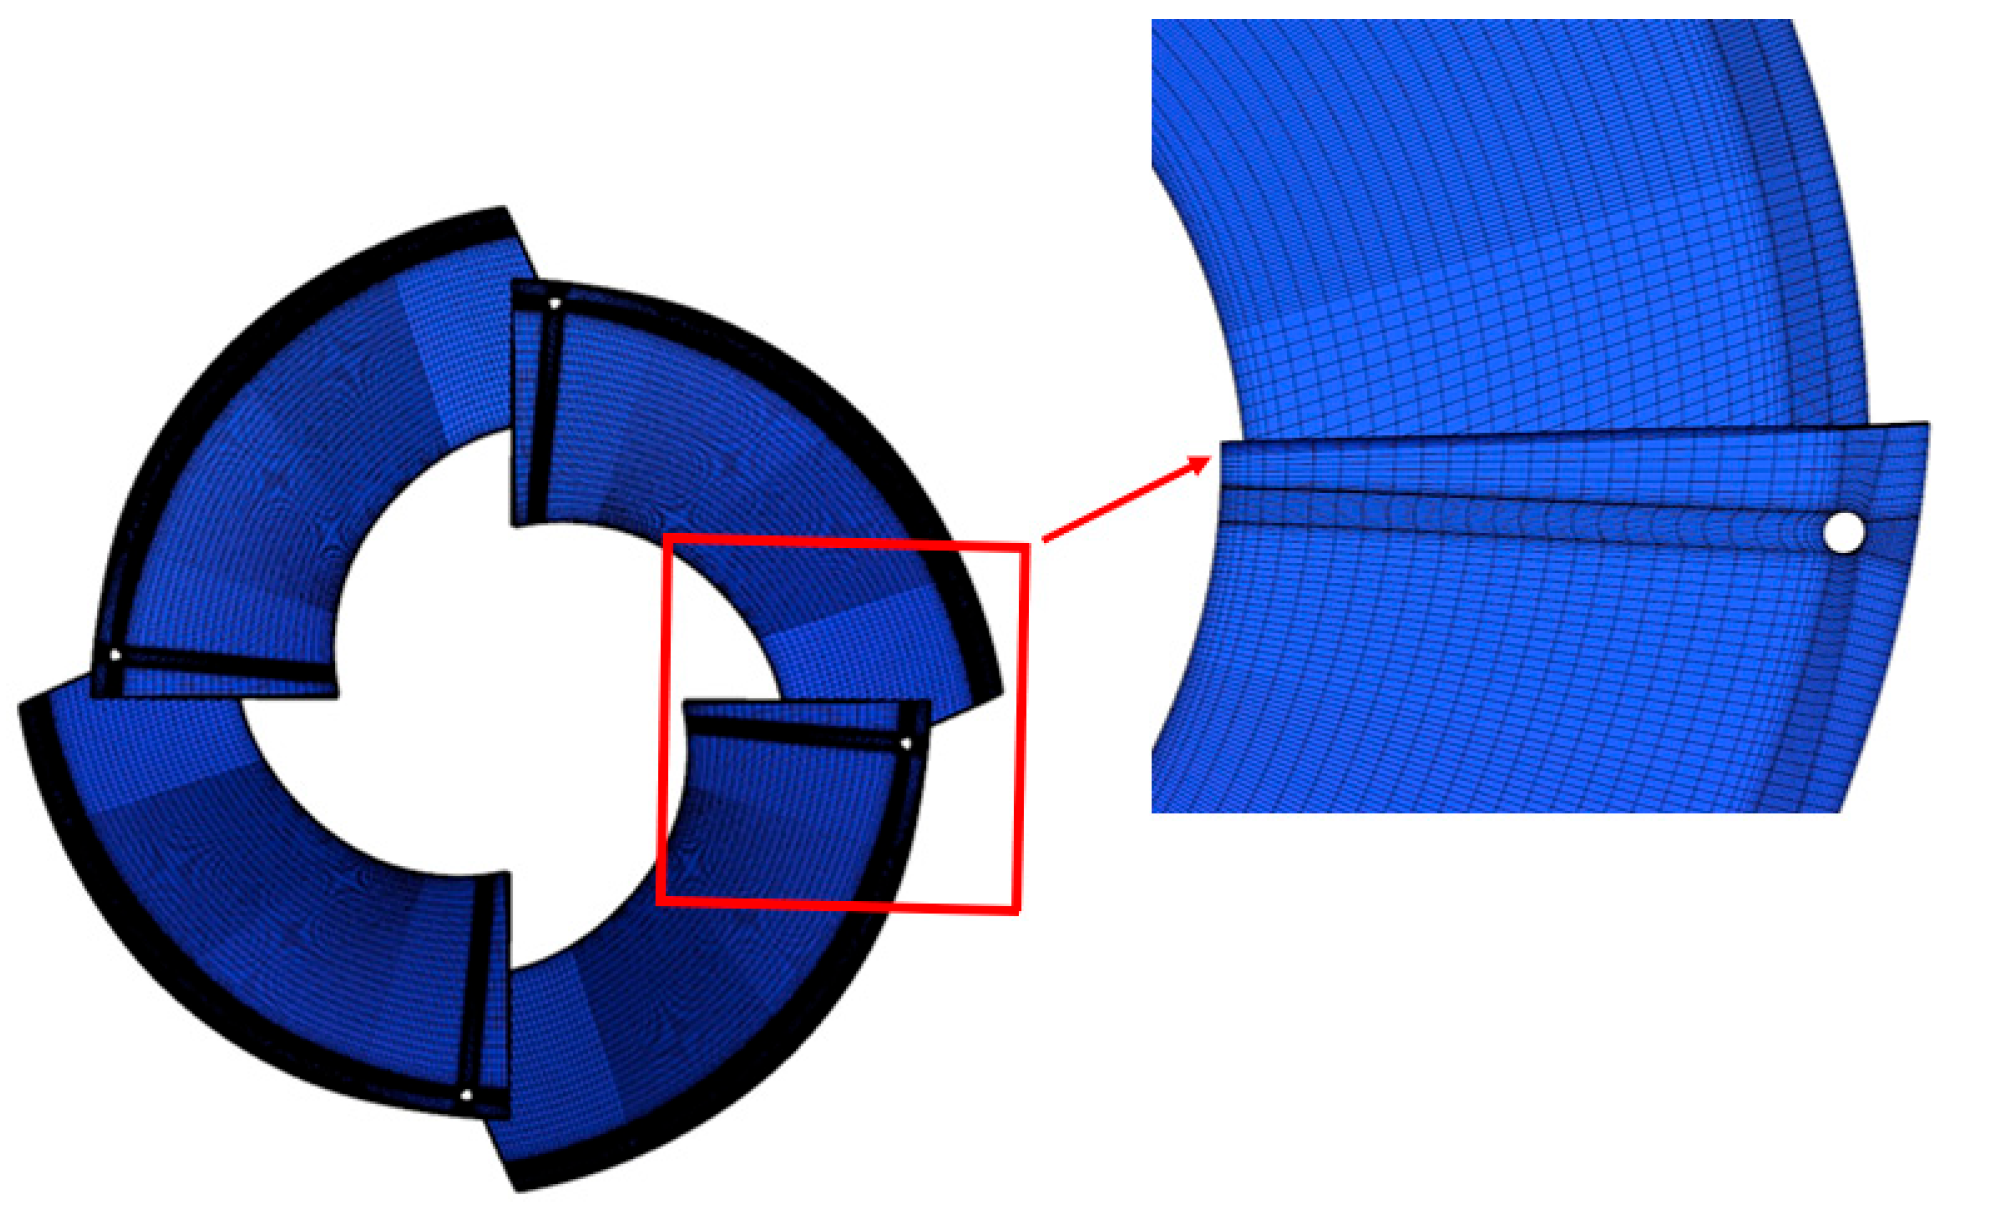
Figure 6: Mesh distribution at the blade perforation location.
3 Experimental Setup and Validation
The external characteristic, cavitation performance, and visualization experiments of the model pump conducted in this study were all carried out on a pump test rig. As demonstrated in Fig. 7a, the test rig is a closed-loop system composed of a power unit, model pump assembly, circulation piping, and measurement system. Fig. 7b shows the on-site layout of the experimental rig. The main measurement devices, together with their working ranges, resolutions and specified accuracies, are summarized in Table 2.
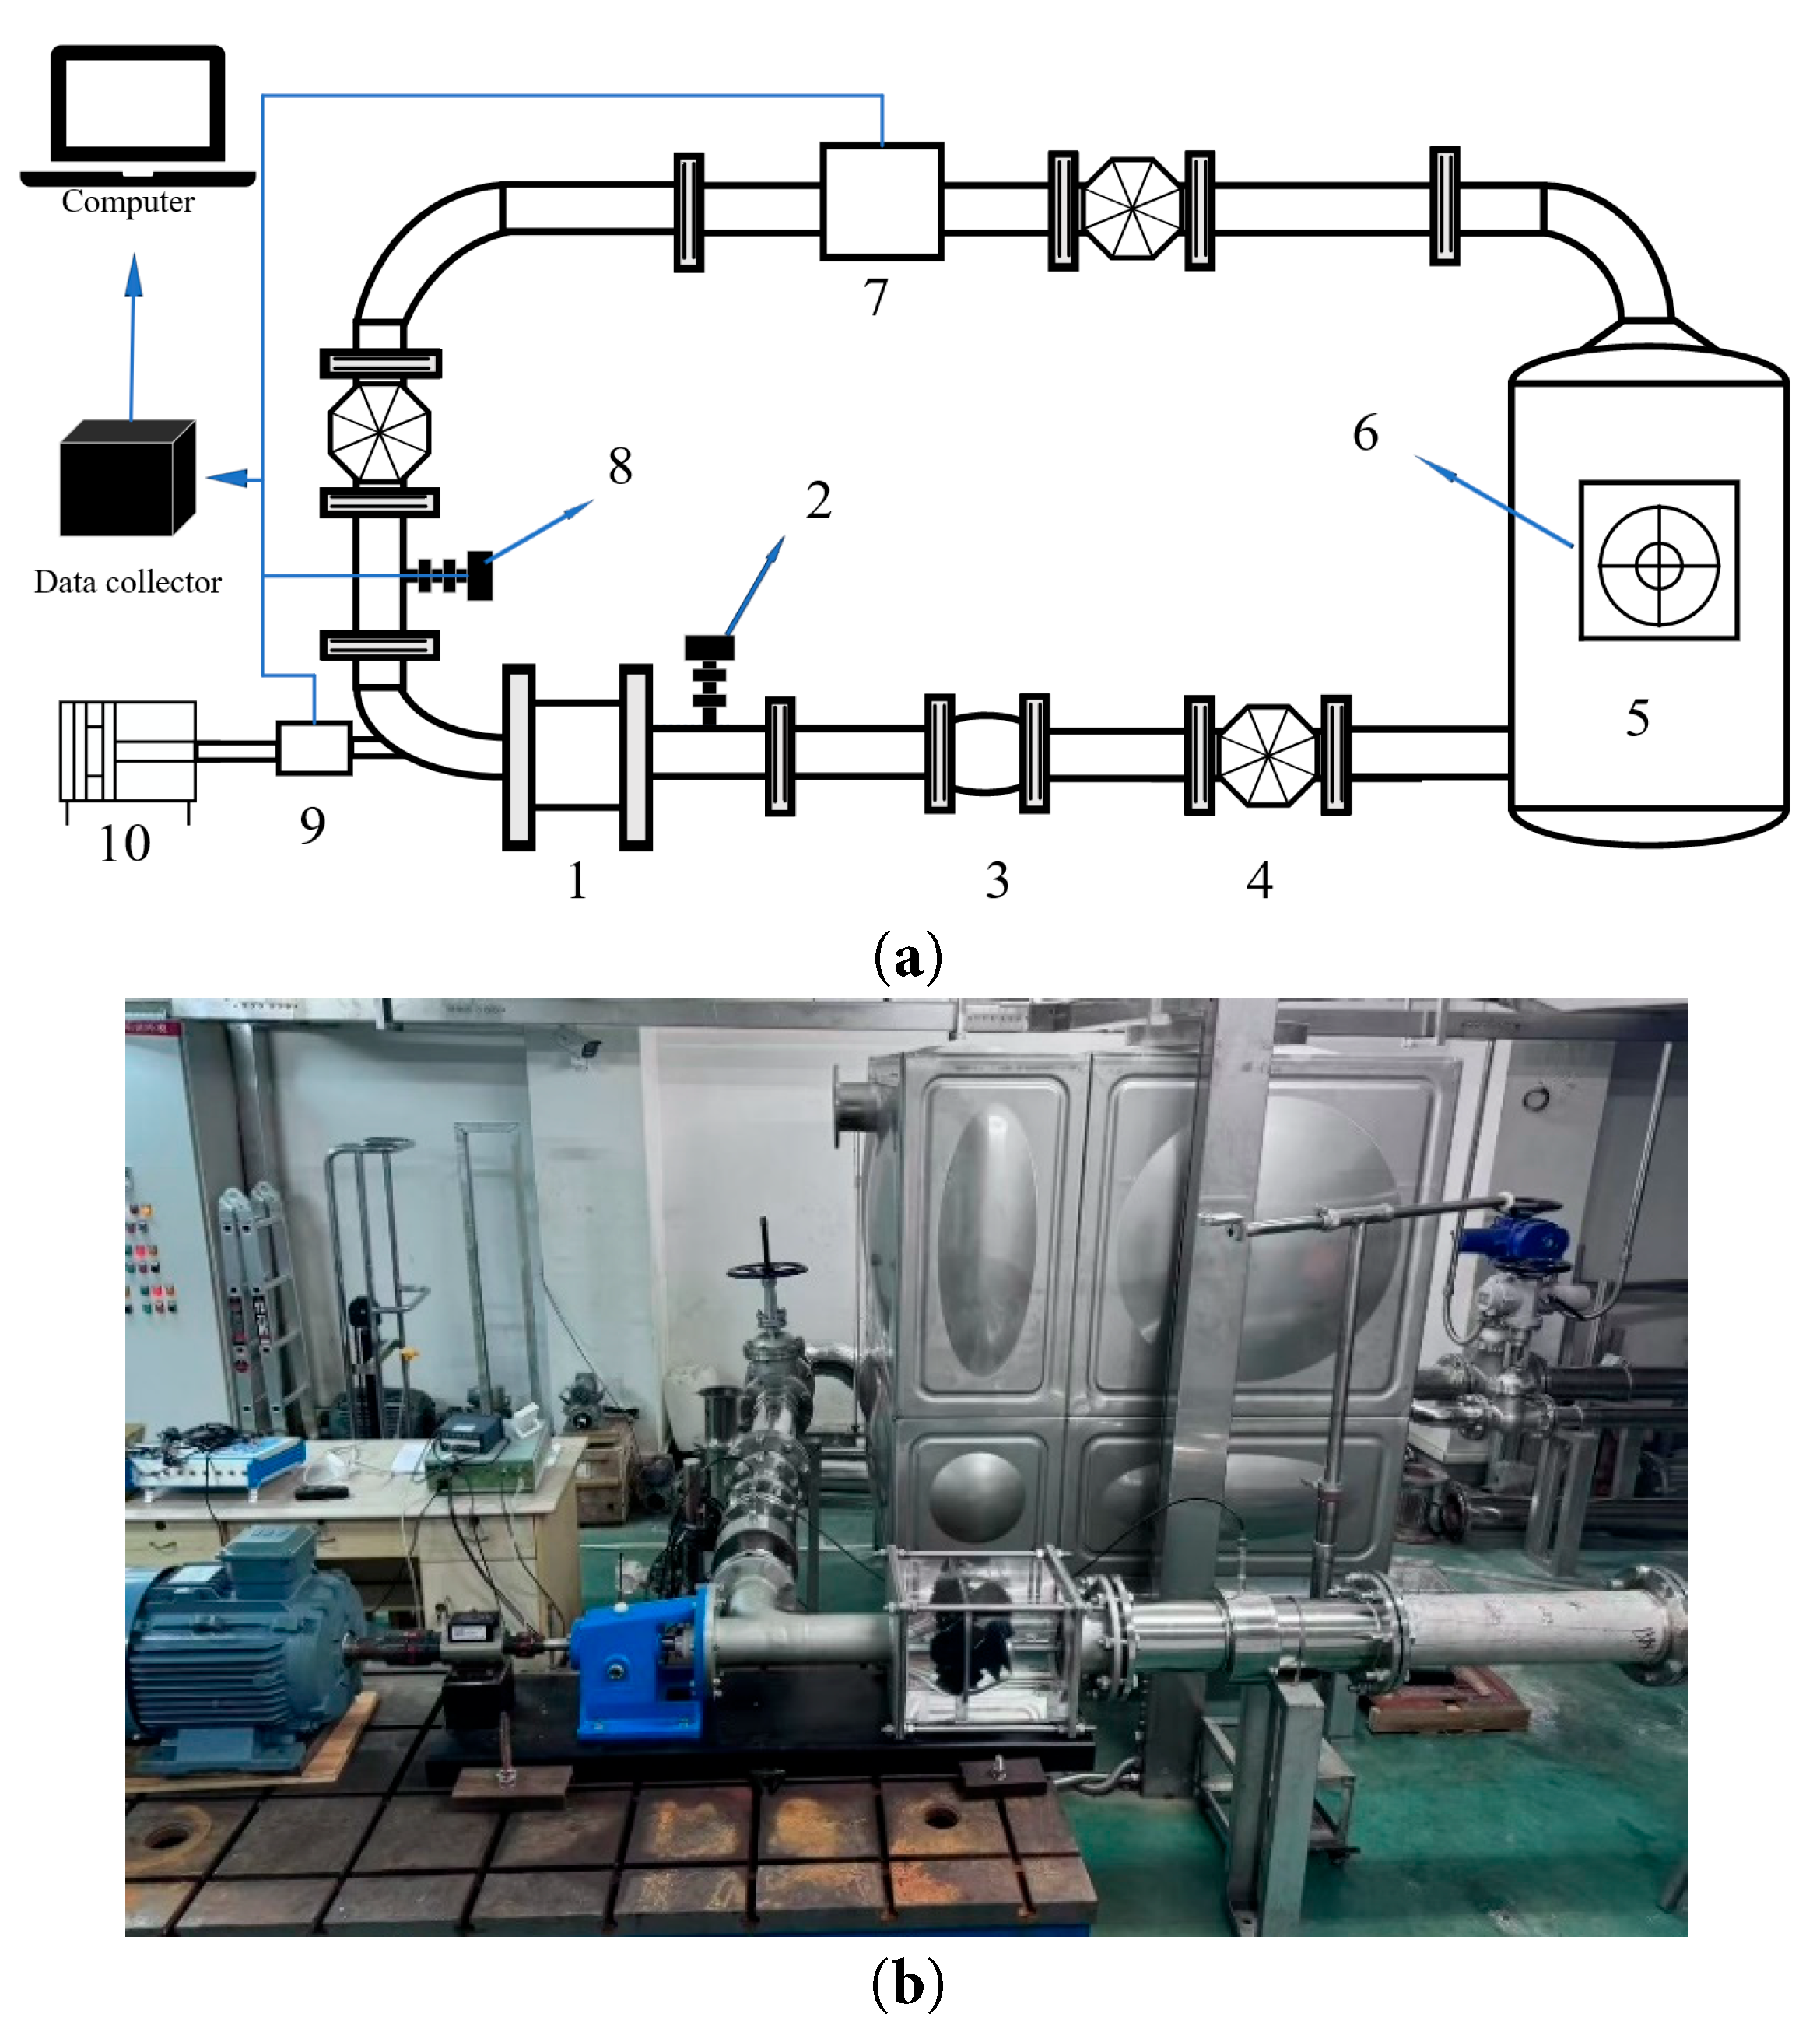
Figure 7: (a) Schematic diagram of the test rig. 1. mixed-flow pump test section; 2. inlet pressure measurement section; 3. telescopic rubber hose; 4. inlet gate valve; 5. water tank; 6. vacuum pump; 7. electromagnetic flowmeter; 8. outlet pressure measurement section; 9. torque measuring instrument; 10. motor. (b) Photograph of the test rig.
Table 2: Parameters and uncertainties of major measurement devices.
| Type | Working Range | Accuracy | Error Limit |
|---|---|---|---|
| Pressure Transmitter | 4–20 mA | 0.01 mA | ±0.5% |
| Electromagnetic Flowmeter | 0–200 m3/h | 0.001 m3/h | ±0.5% |
| Temperature gauge | 0–100°C | 1°C | ±1°C |
| Torque sensor | 0–20 Nm | 0.1 Nm | ±0.5% |
3.2 Comparison of Pump External Characteristic Test Results
As illustrated in Fig. 8, a comparison is presented between the numerical simulation results and experimental data for the external characteristics of the mixed-flow pump. It can be observed that the numerical results closely follow the trend of the experimental data, with a high degree of agreement between the two. The maximum error does not exceed 5%, which is within an acceptable range, thereby validating the reliability of the numerical simulation model.
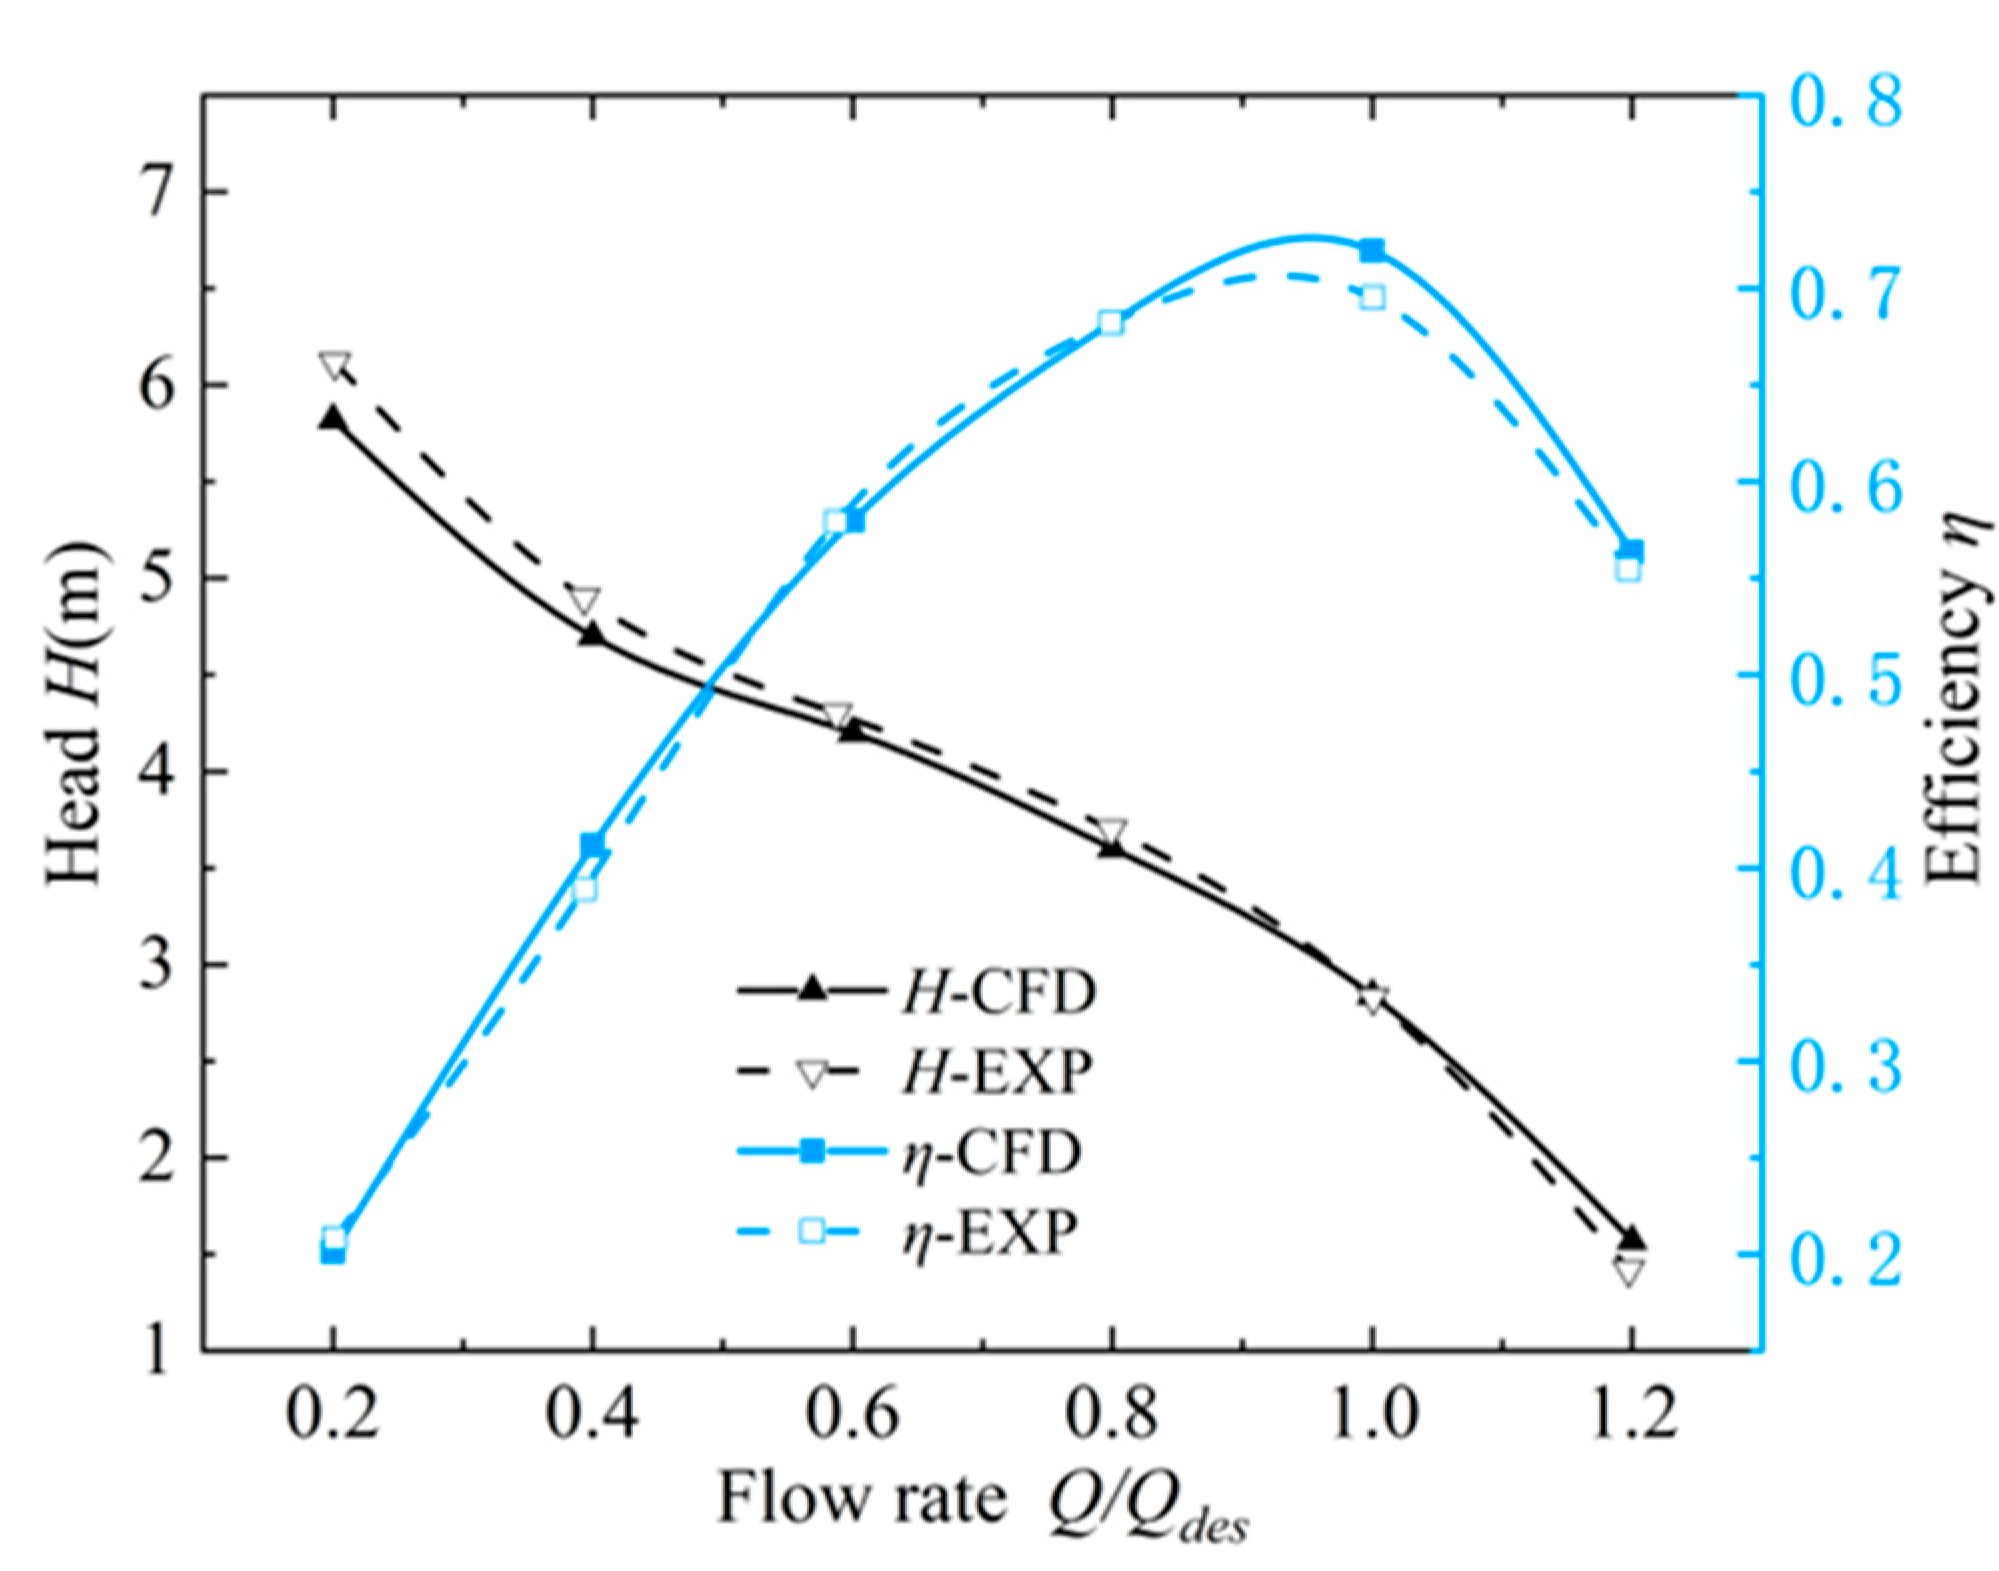
Figure 8: Comparison between numerical simulation results and experimental data.
3.3 Comparison of Pump Cavitation Performance
This study uses the Cavitation allowance (NPSHa) of the device to describe the cavitation characteristics of the mixed-flow pump, expressed as follows:
When the pump head drops by 3%, the corresponding NPSHa value is defined as the critical cavitation margin NPSHcr, indicating the anti-cavitation performance of the mixed flow pump. The larger the NPSHcr, the weaker the anti-cavitation performance of the mixed flow pump, and the easier cavitation occurs.
Fig. 9 presents the cavitation characteristic curves and a comparison of NPSHcr under different flow conditions. The simulation data is obtained by gradually reducing the total inlet pressure from high to low under a fixed flow rate. Each time the pressure is reduced, the calculation converges, and the corresponding head for each NPSHa condition can be obtained. When the head drops by 3%, the NPSHcr value for this flow rate condition can be obtained. Each flow rate condition is controlled by adjusting the pump speed through a frequency converter, and the flow rate is measured by an electromagnetic flowmeter. Once the flow rate stabilizes, the vacuum valve in the pipeline is regulated to gradually reduce the inlet pressure, thereby reducing NPSHa. Pressure sensors are used to measure the pressure at both ends of the pump. Each time the pressure is adjusted, after the system stabilizes, a set of flow rate, inlet pressure, and outlet pressure data is recorded, which constitutes one experimental point. This process is repeated until the corresponding NPSHcr value is obtained. As shown in Fig. 9a, the cavitation performance curve obtained by numerical simulation exhibits a trend similar to that of the experimental results. At higher NPSHa, when cavitation inside the mixed-flow pump is relatively weak, the agreement between the two curves is good. However, as NPSHa decreases and cavitation inside the pump becomes more severe, the discrepancy between the numerical and experimental results gradually increases. From Fig. 9b, it can be observed that the NPSHcr value increases with the flow rate, indicating that the larger the flow rate, the weaker the cavitation resistance of the mixed-flow pump. Long-term operation under such conditions may affect the operational stability of the pump.
Fig. 10 shows the distribution of steam volume fraction on the suction surface of the impeller for the O-model under four different NPSHa values. As shown in Fig. 10, as the NPSHa decreases, the cavitation intensifies. When NPSHa = 1.41 m, the cavitation phenomenon is clearly visible, but it has not yet developed to the severe cloud-like or super-cavitation stage. We define this operating condition as “moderate cavitation conditions” to study the role of perforation during the stage when cavitation has occurred, but the flow has not been severely disrupted.
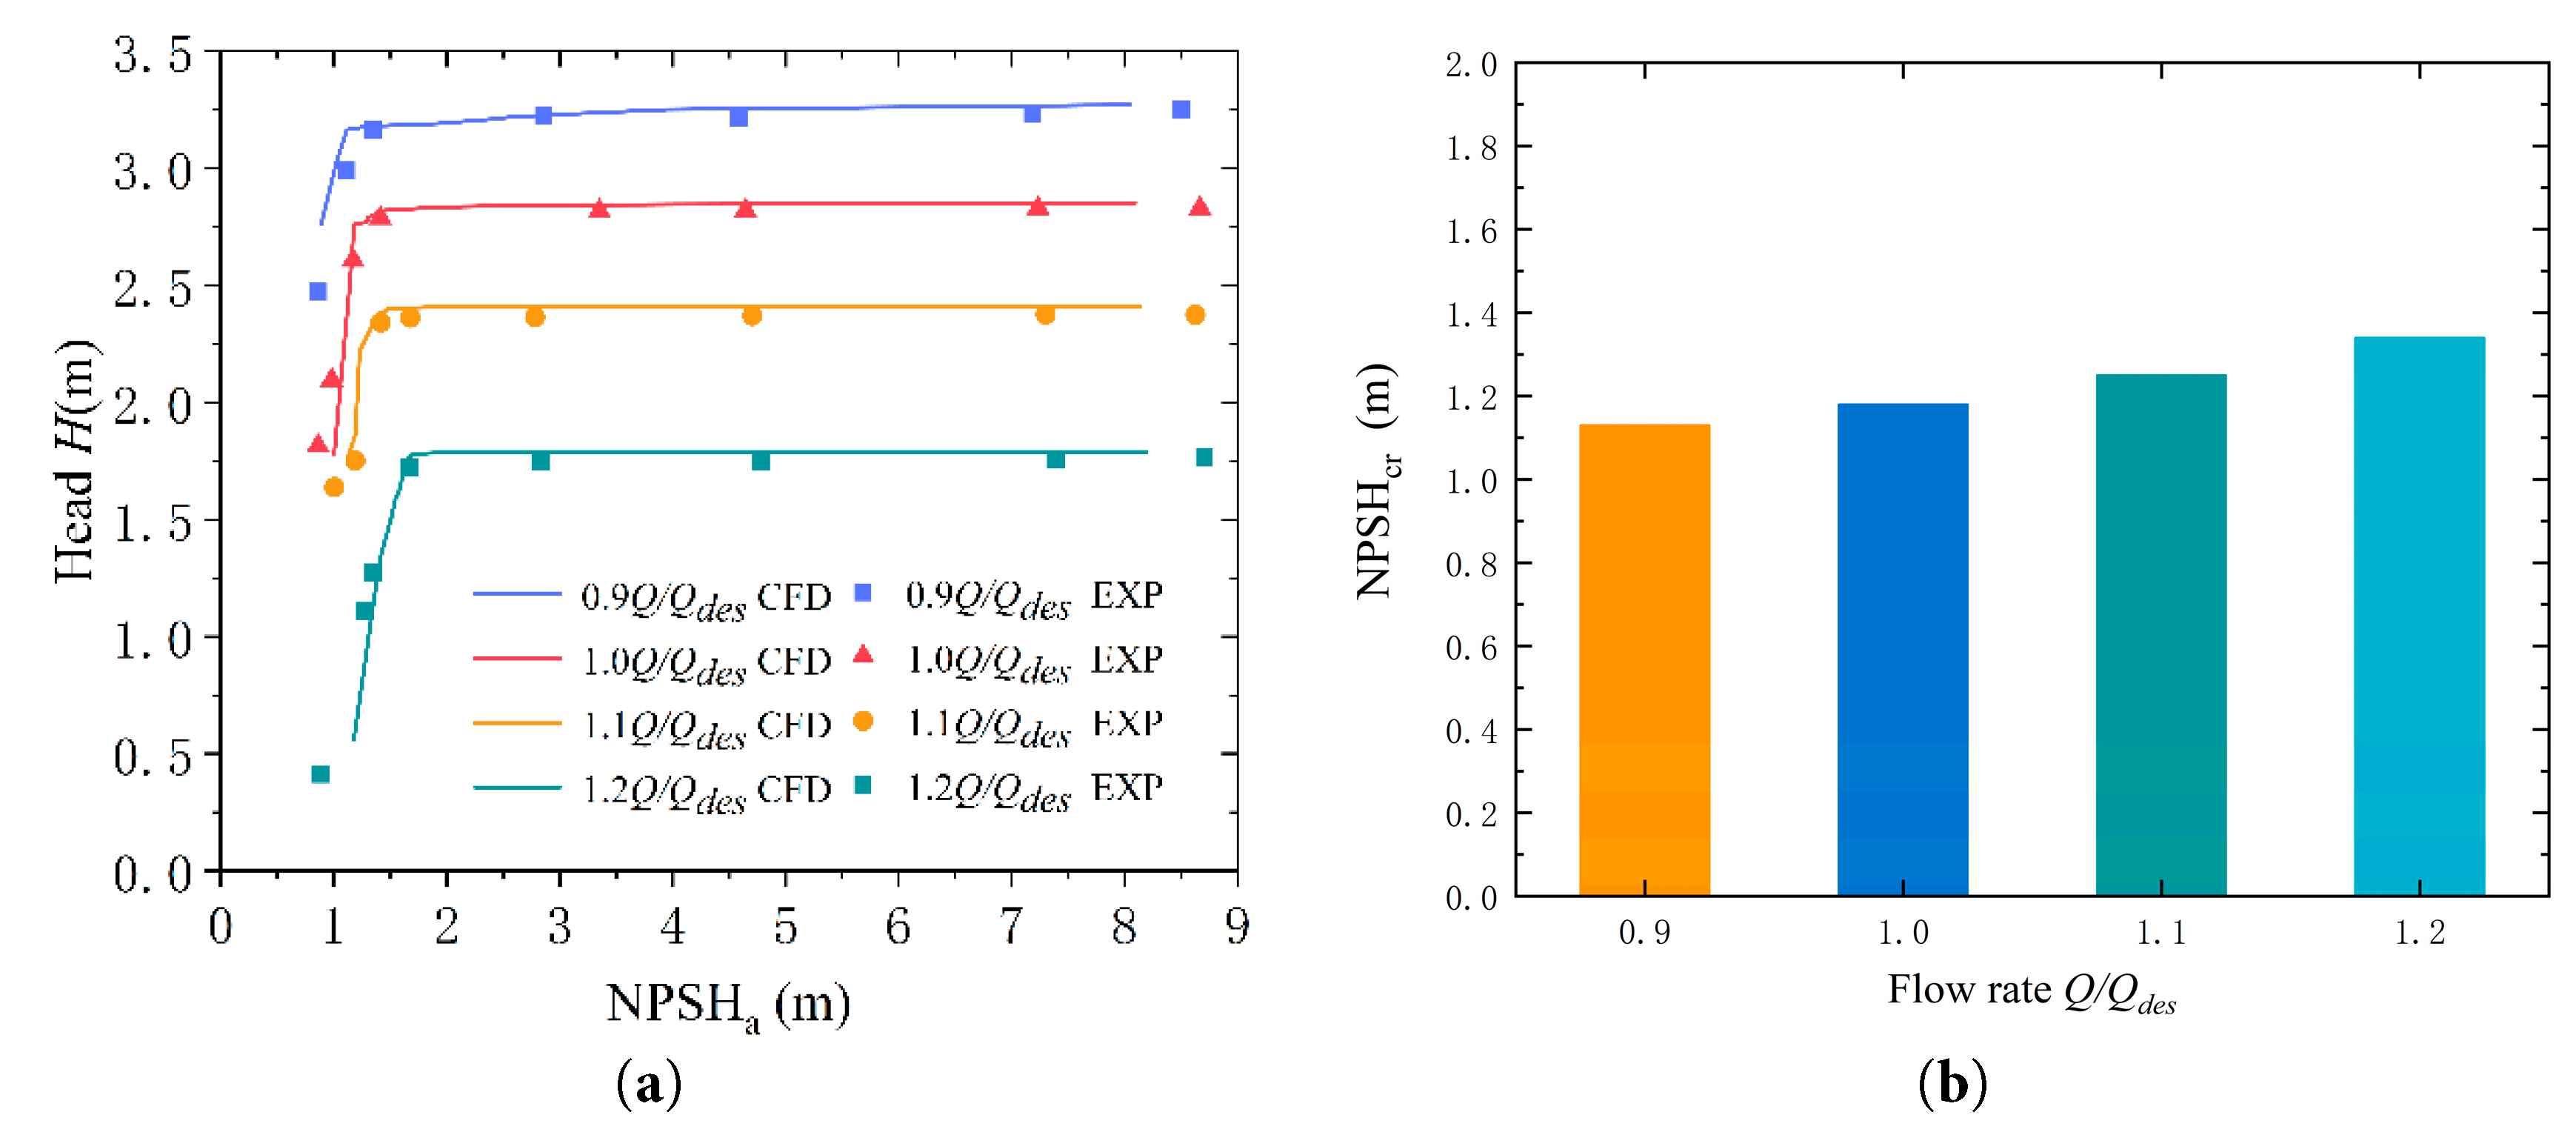
Figure 9: Comparison of the mixed-flow pump cavitation performance curves and NPSHcr Values. (a) Comparison of cavitation characteristic curves of the mixed-flow pump; (b) Comparison of NPSHcr at different flow rates.
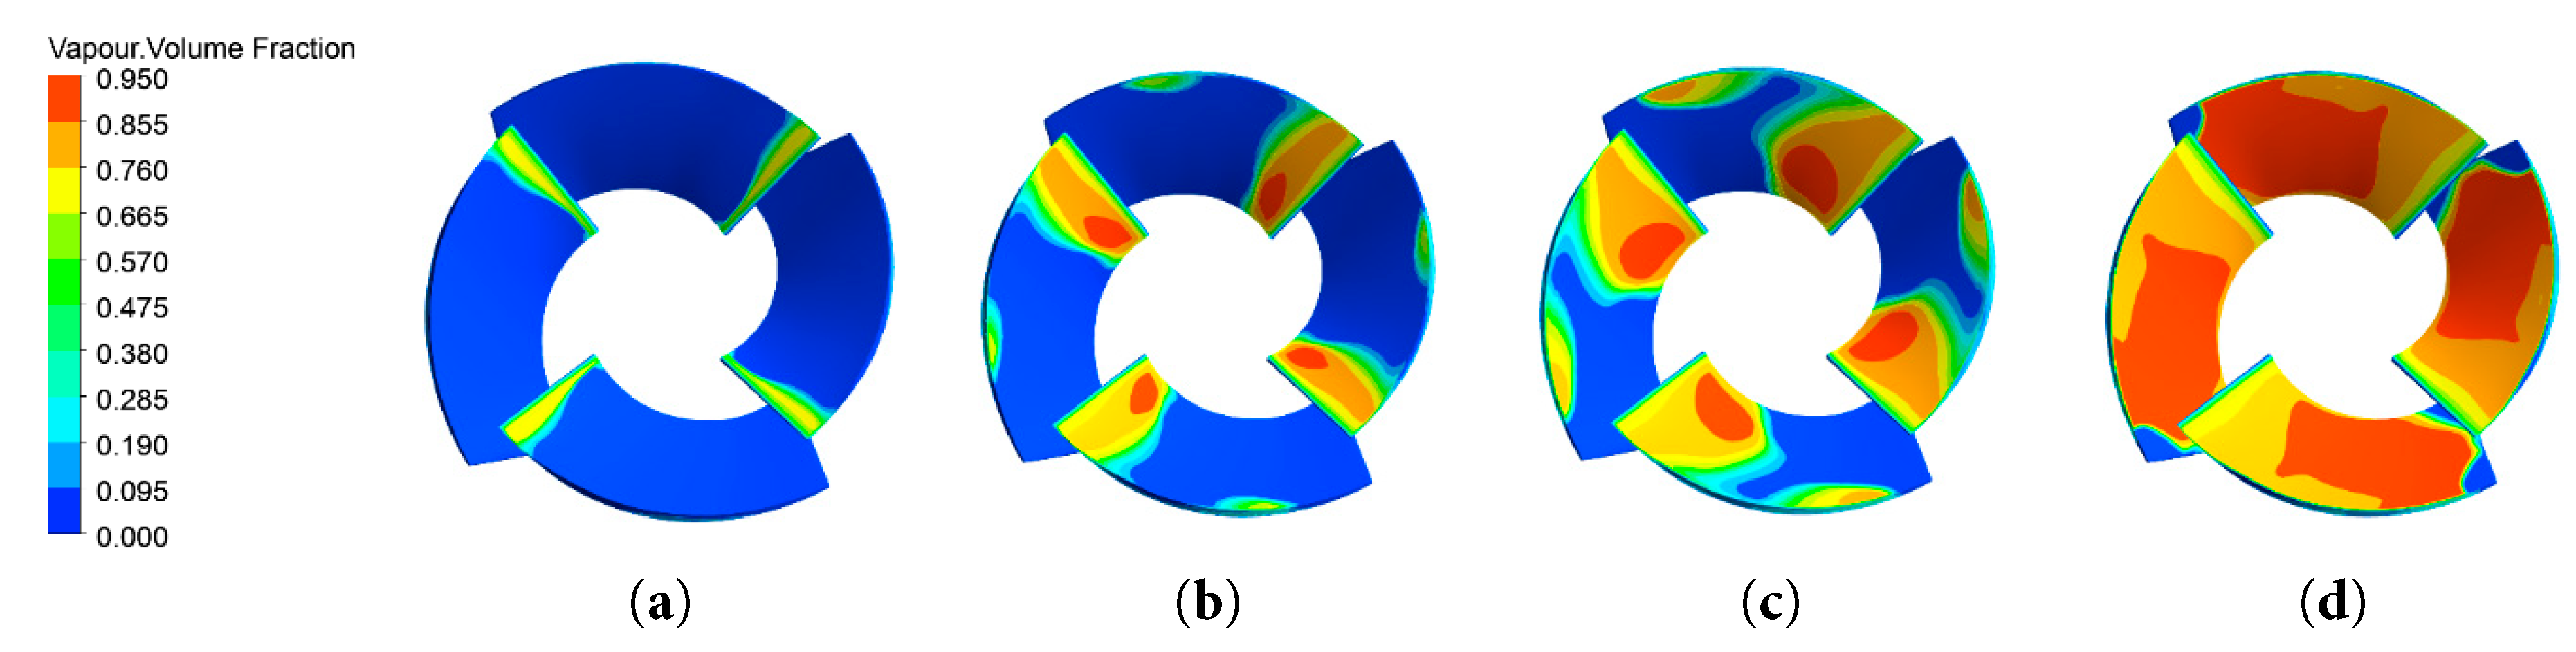
Figure 10: The distribution of vapour volume fraction on the impeller surface under different NPSHa conditions. (a) NPSHa = 1.96; (b) NPSHa = 1.41; (c) NPSHa = 1.18; (d) NPSHa = 0.94.
3.4 Analysis of Visualization Experiment Results
Cavitation visualization experiments are an important observational method in fluid mechanics research, aimed at exploring the dynamic behavior of cavitation bubbles in gas-liquid two-phase flow. Given that a moderately low vapor volume fraction threshold facilitates the observation of cavitation cloud evolution characteristics, and considering the relatively low cavitation intensity within the impeller at NPAHa = 1.41, subsequent analyses will be based on the iso-surface corresponding to a vapor volume fraction of 0.2 in the impeller region. Fig. 11 compares the transient numerical simulation results with the cavitation visualization experiment results of the mixed-flow pump under the rated flow condition and NPSHa = 1.41 m. It can be seen that cavitation leakage vortices occur at the blade tip due to a pressure difference. Within three rotation cycles, the growth, development, and collapse of the blade tip leakage vortex cavitation can be fully observed. The transient numerical simulation results agree well with the cavitation visualization experimental results.
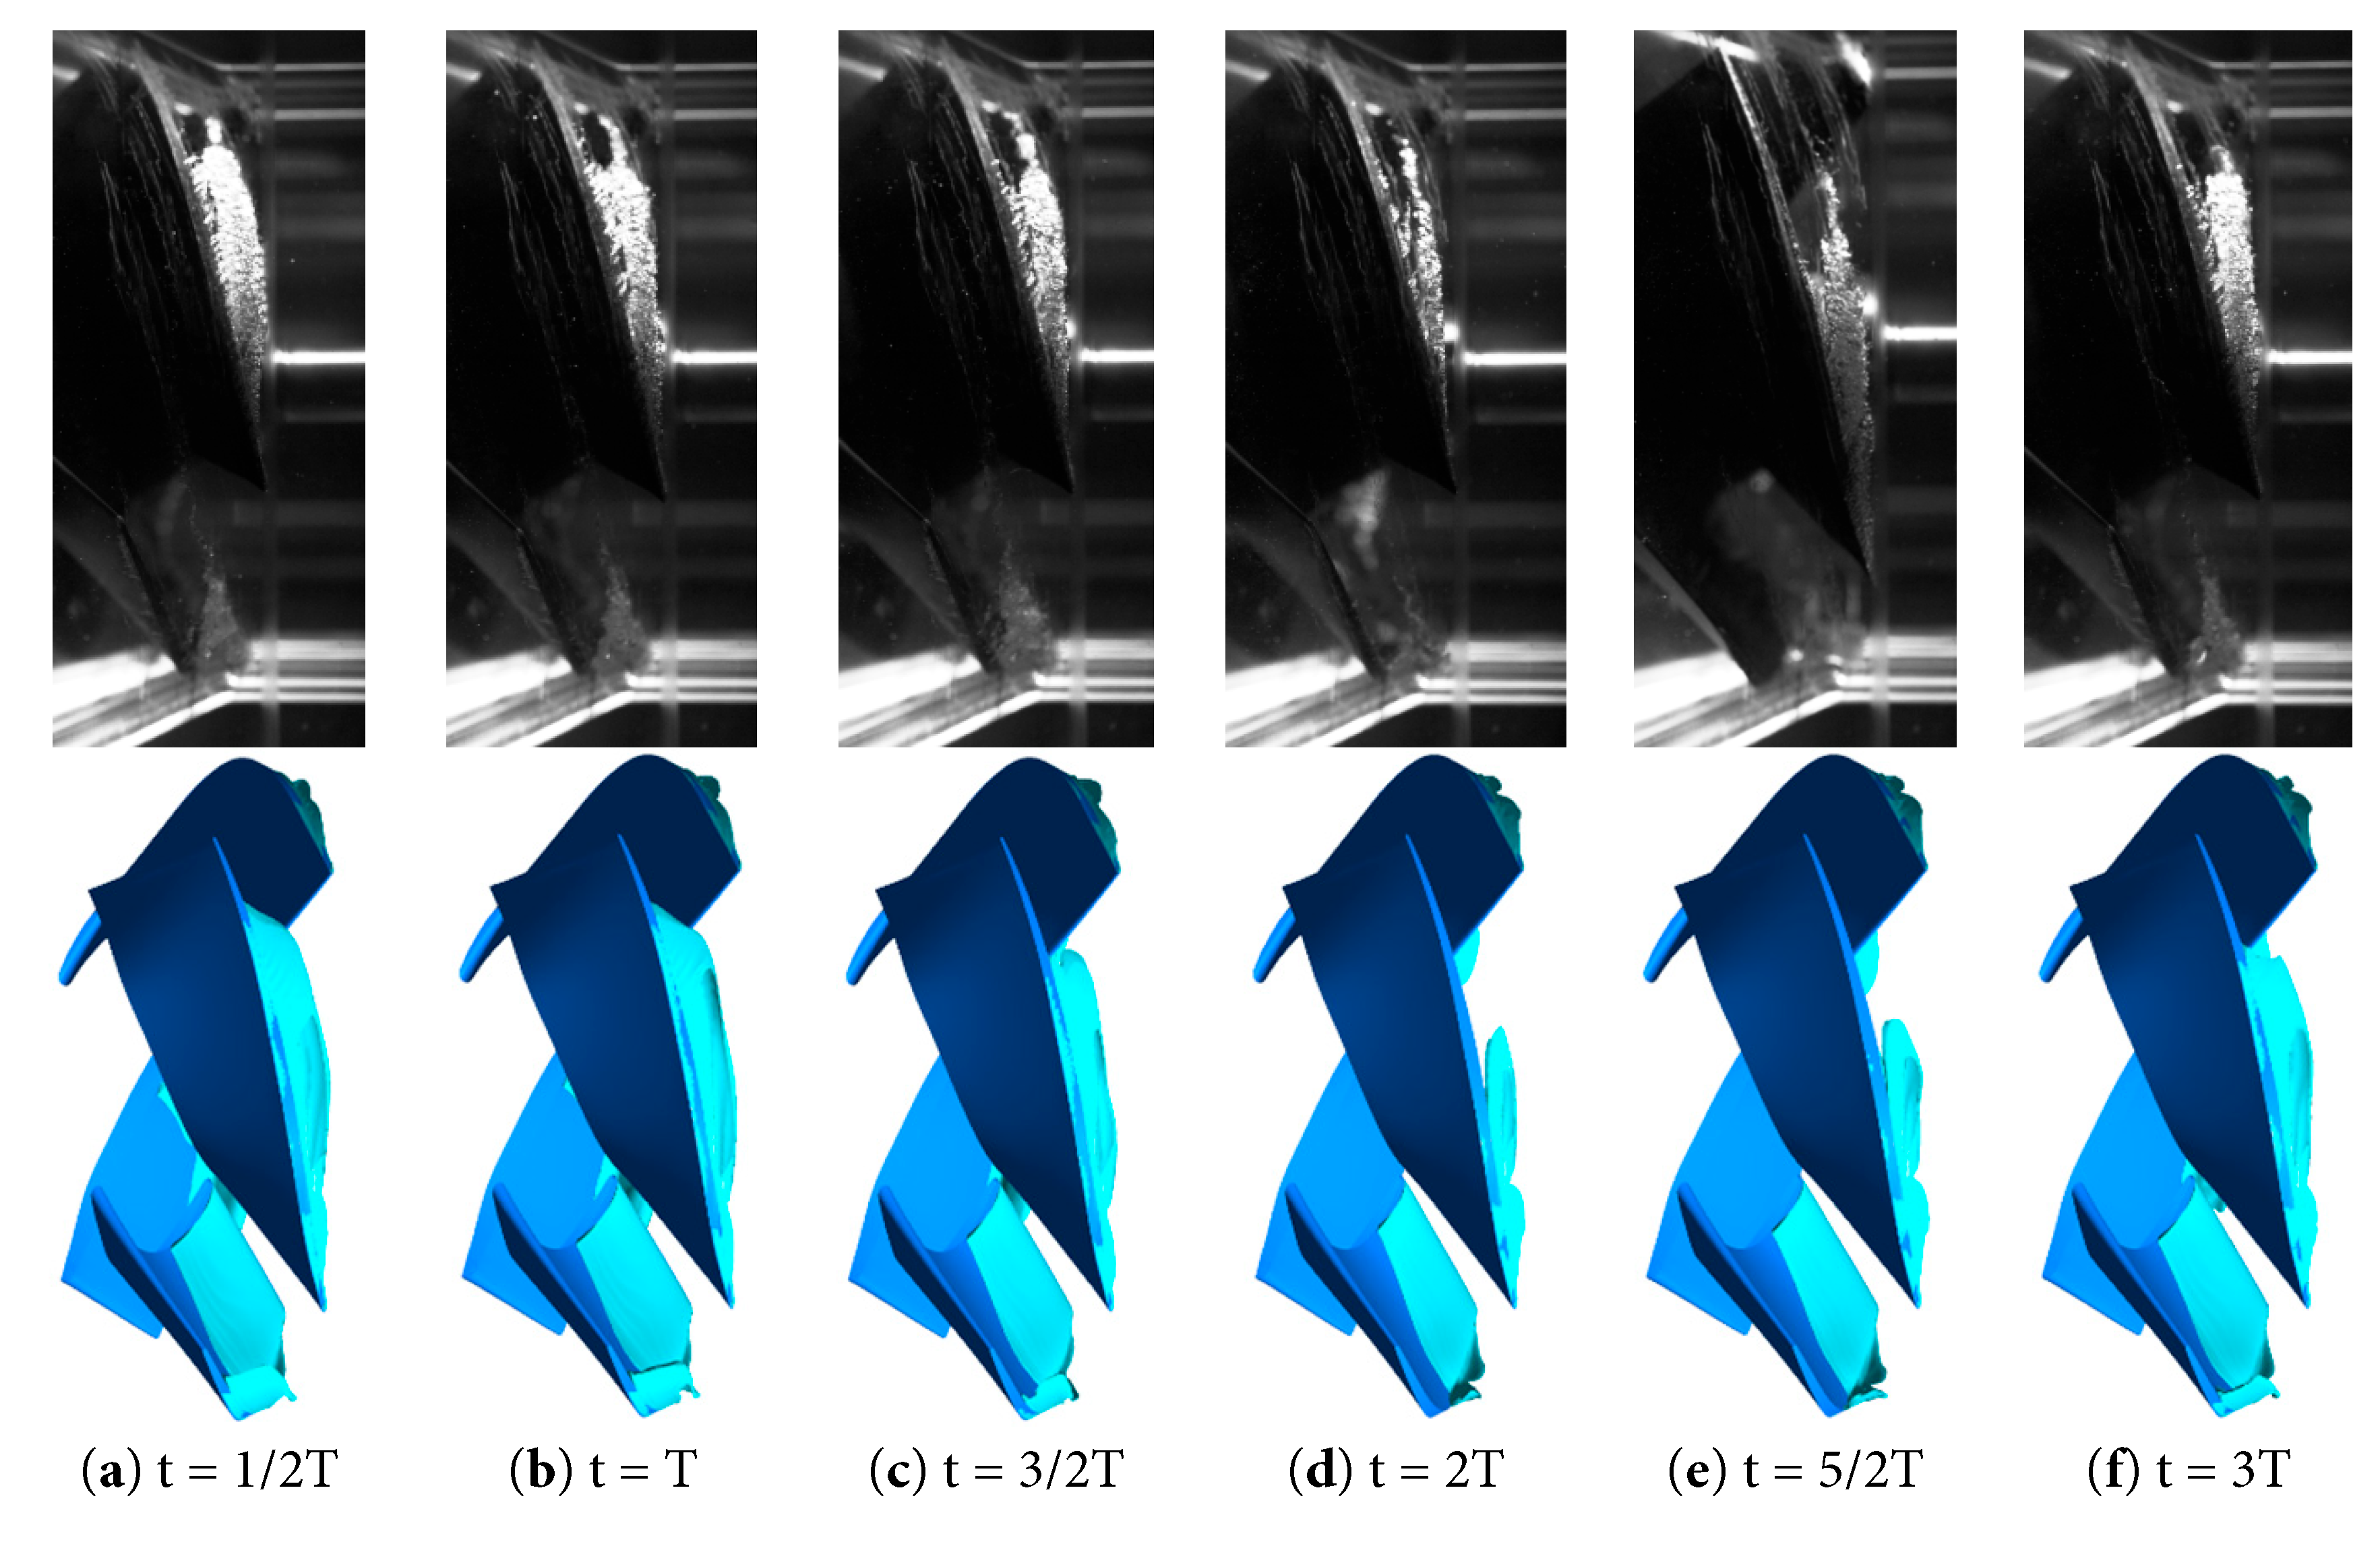
Figure 11: Transient variation of vapor bubbles in the impeller under rated flow and NPSHa = 1.41 m conditions.
4 Analysis of the Influence of Blade Perforation Location
4.1 Comparative Analysis of External Characteristics and Cavitation Performance
The following analysis of external characteristics and cavitation performance is based on steady-state simulation results. Each data point presented represents a fully converged, time-invariant solution for the corresponding operating condition. This approach ensures that the performance differences observed between the O-model and the perforated cases are attributable to geometric modifications rather than transient fluctuations, providing a reliable basis for comparative evaluation.
Fig. 12 shows the external characteristic curves of the four perforation cases compared with the O-model. As demonstrated by the head-flow rate curves, with the exception of Case 1, which exhibits a slightly lower head than that of the O-model at a flow rate ratio of 0.8, the head of all other cases is improved relative to the O-model. The efficiency-flow curve indicates that the first condition has a slightly lower efficiency at higher flow rates than the O mode. This may be attributed to the perforation location of Case 1 at the leading edge with Zspan = 0.9, where the inflow first impinges. The perforation at this position alters the flow field at the initial stage of entry into the blade passage. At low flow rates, such early disturbance helps improve the flow condition; however, at high flow rates, where the inflow carries higher energy, the early disturbance may disrupt the relatively stable flow structure, thereby exerting an adverse effect on overall performance. In contrast, the efficiencies of the other cases are generally higher than that of the O-model. Therefore, these external characteristic curves demonstrate that blade perforation has a positive effect on the hydraulic performance of the mixed-flow pump. Furthermore, it can be observed that under the design flow condition, Case 3 achieves the highest head and efficiency.
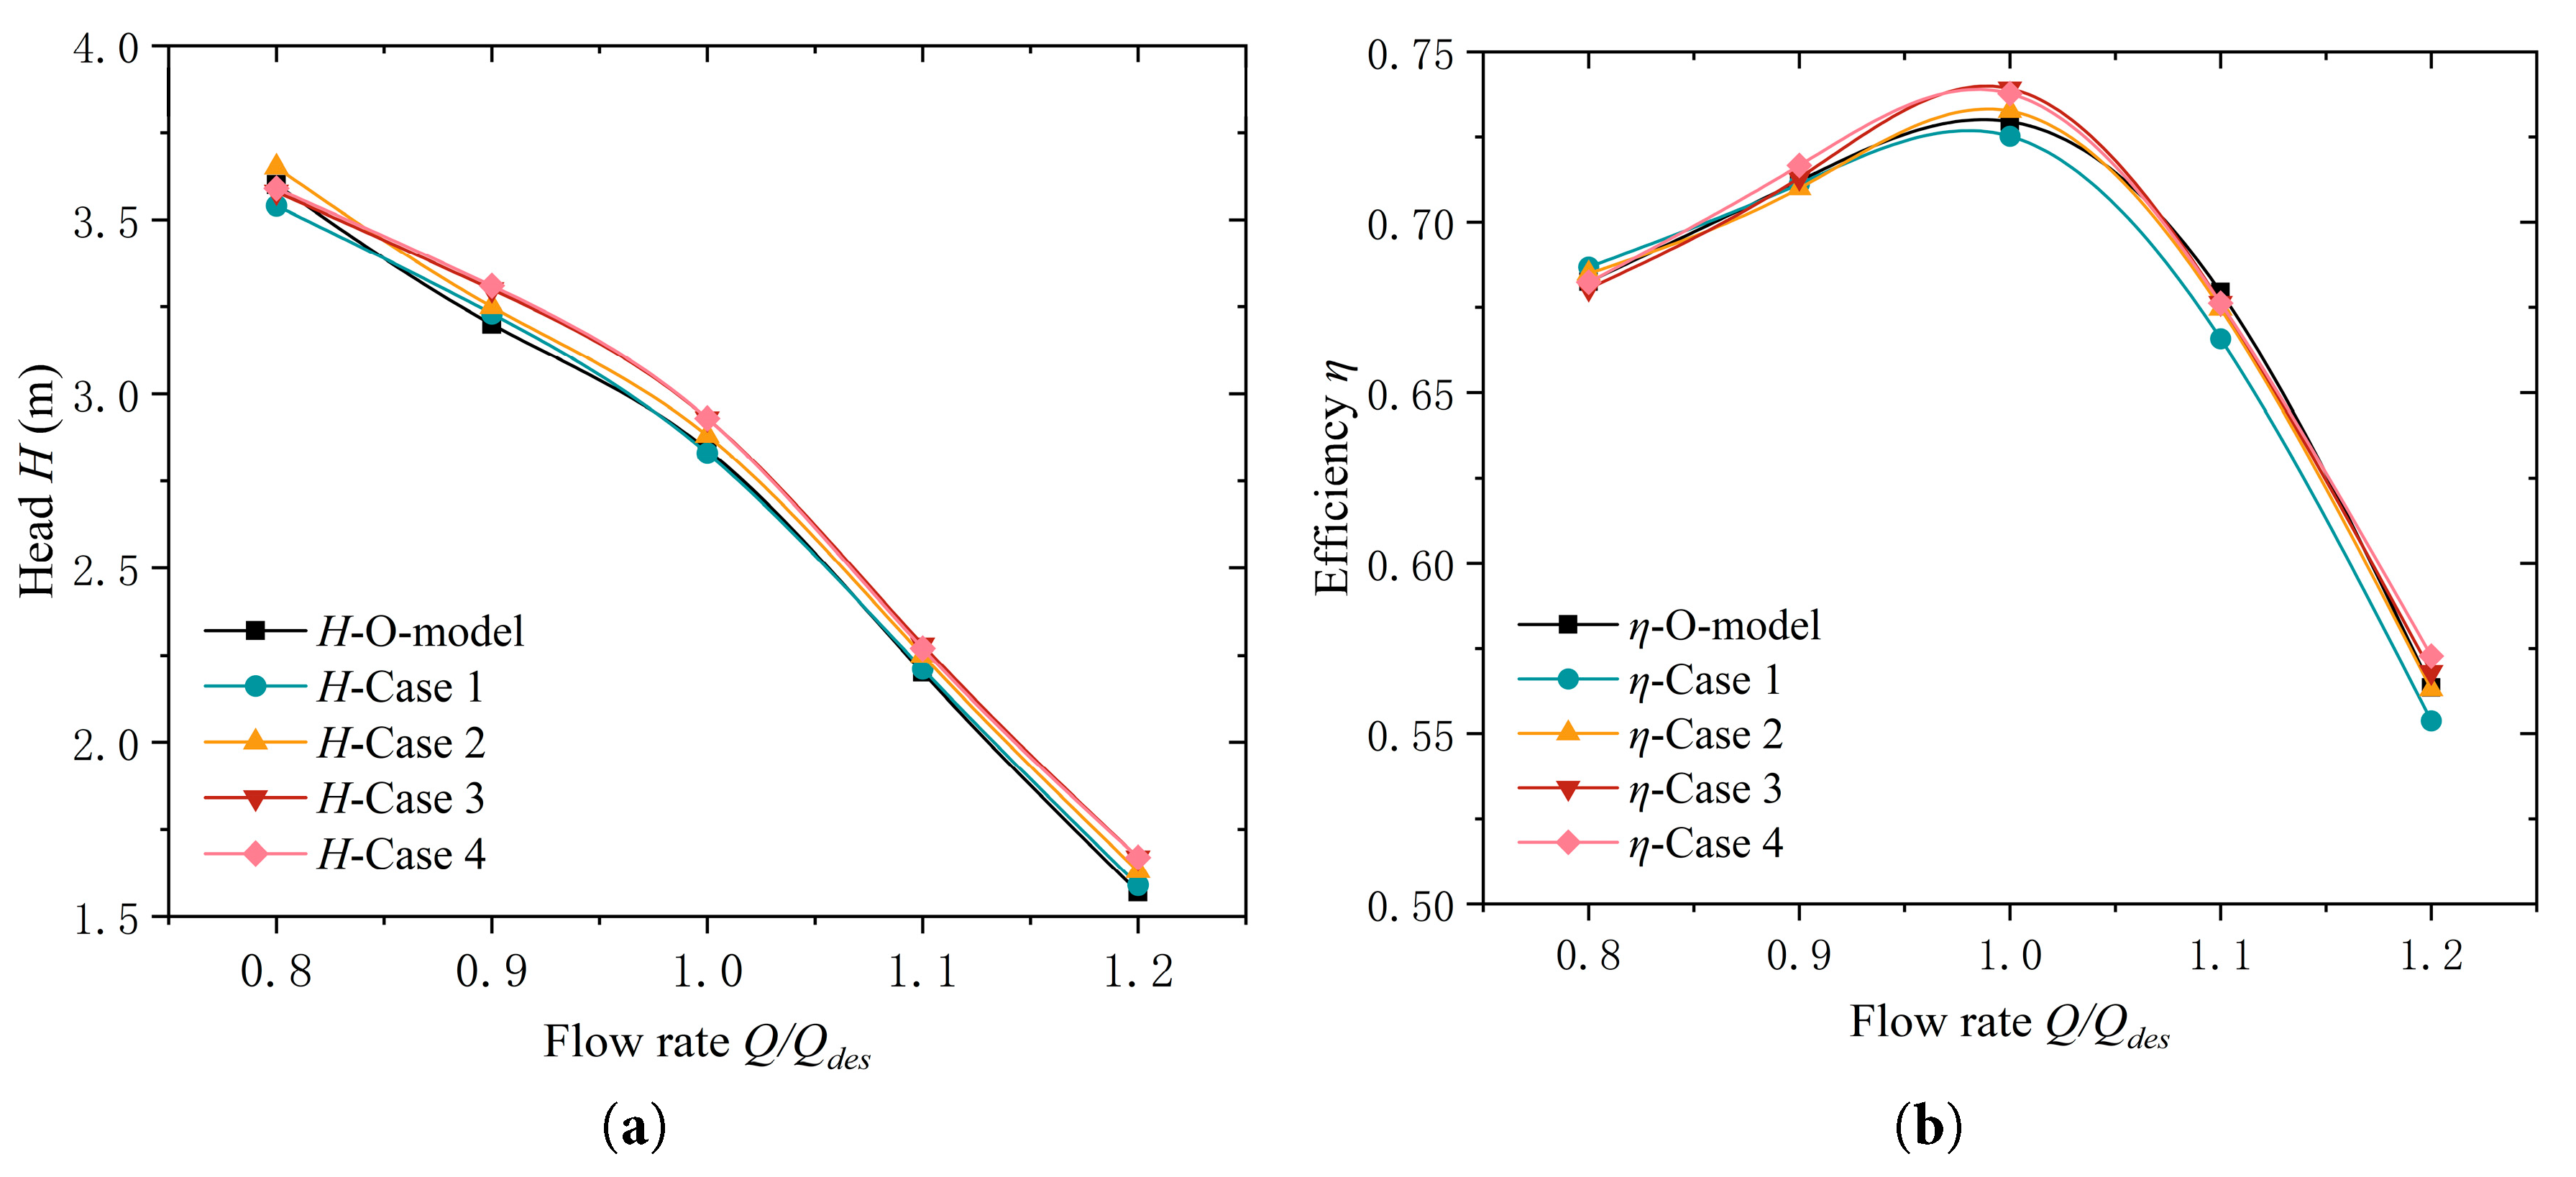
Figure 12: External characteristic curve of the mixed-flow pump with different opening cases (a) Head-Flow rate curves; (b) Efficiency-Flow rate curves.
Fig. 13 compares the NPSHcr values of different perforation cases along the blade height at the leading edge. Compared with the O-model, the NPSHcr of Cases 1, 2, 3, and 4 with the O-model revealed a decrease of 0.6%, 4.1%, 6.6%, and 5.4%, respectively. This suggests that perforations at the blade leading edge can enhance the cavitation resistance of the mixed-flow pump to some extent. By comparing the influence of perforations at different blade heights at Ka = 0.1, it can be observed that the NPSHcr decreases first and then increases from the rim to the hub. The minimum NPSHcr is observed in Case 3, suggesting that the cavitation resistance is initially augmented and subsequently diminished as the perforation position transitions from the leading-edge rim towards the hub. The most substantial enhancement in resistance is attained at Zspan = 0.4.
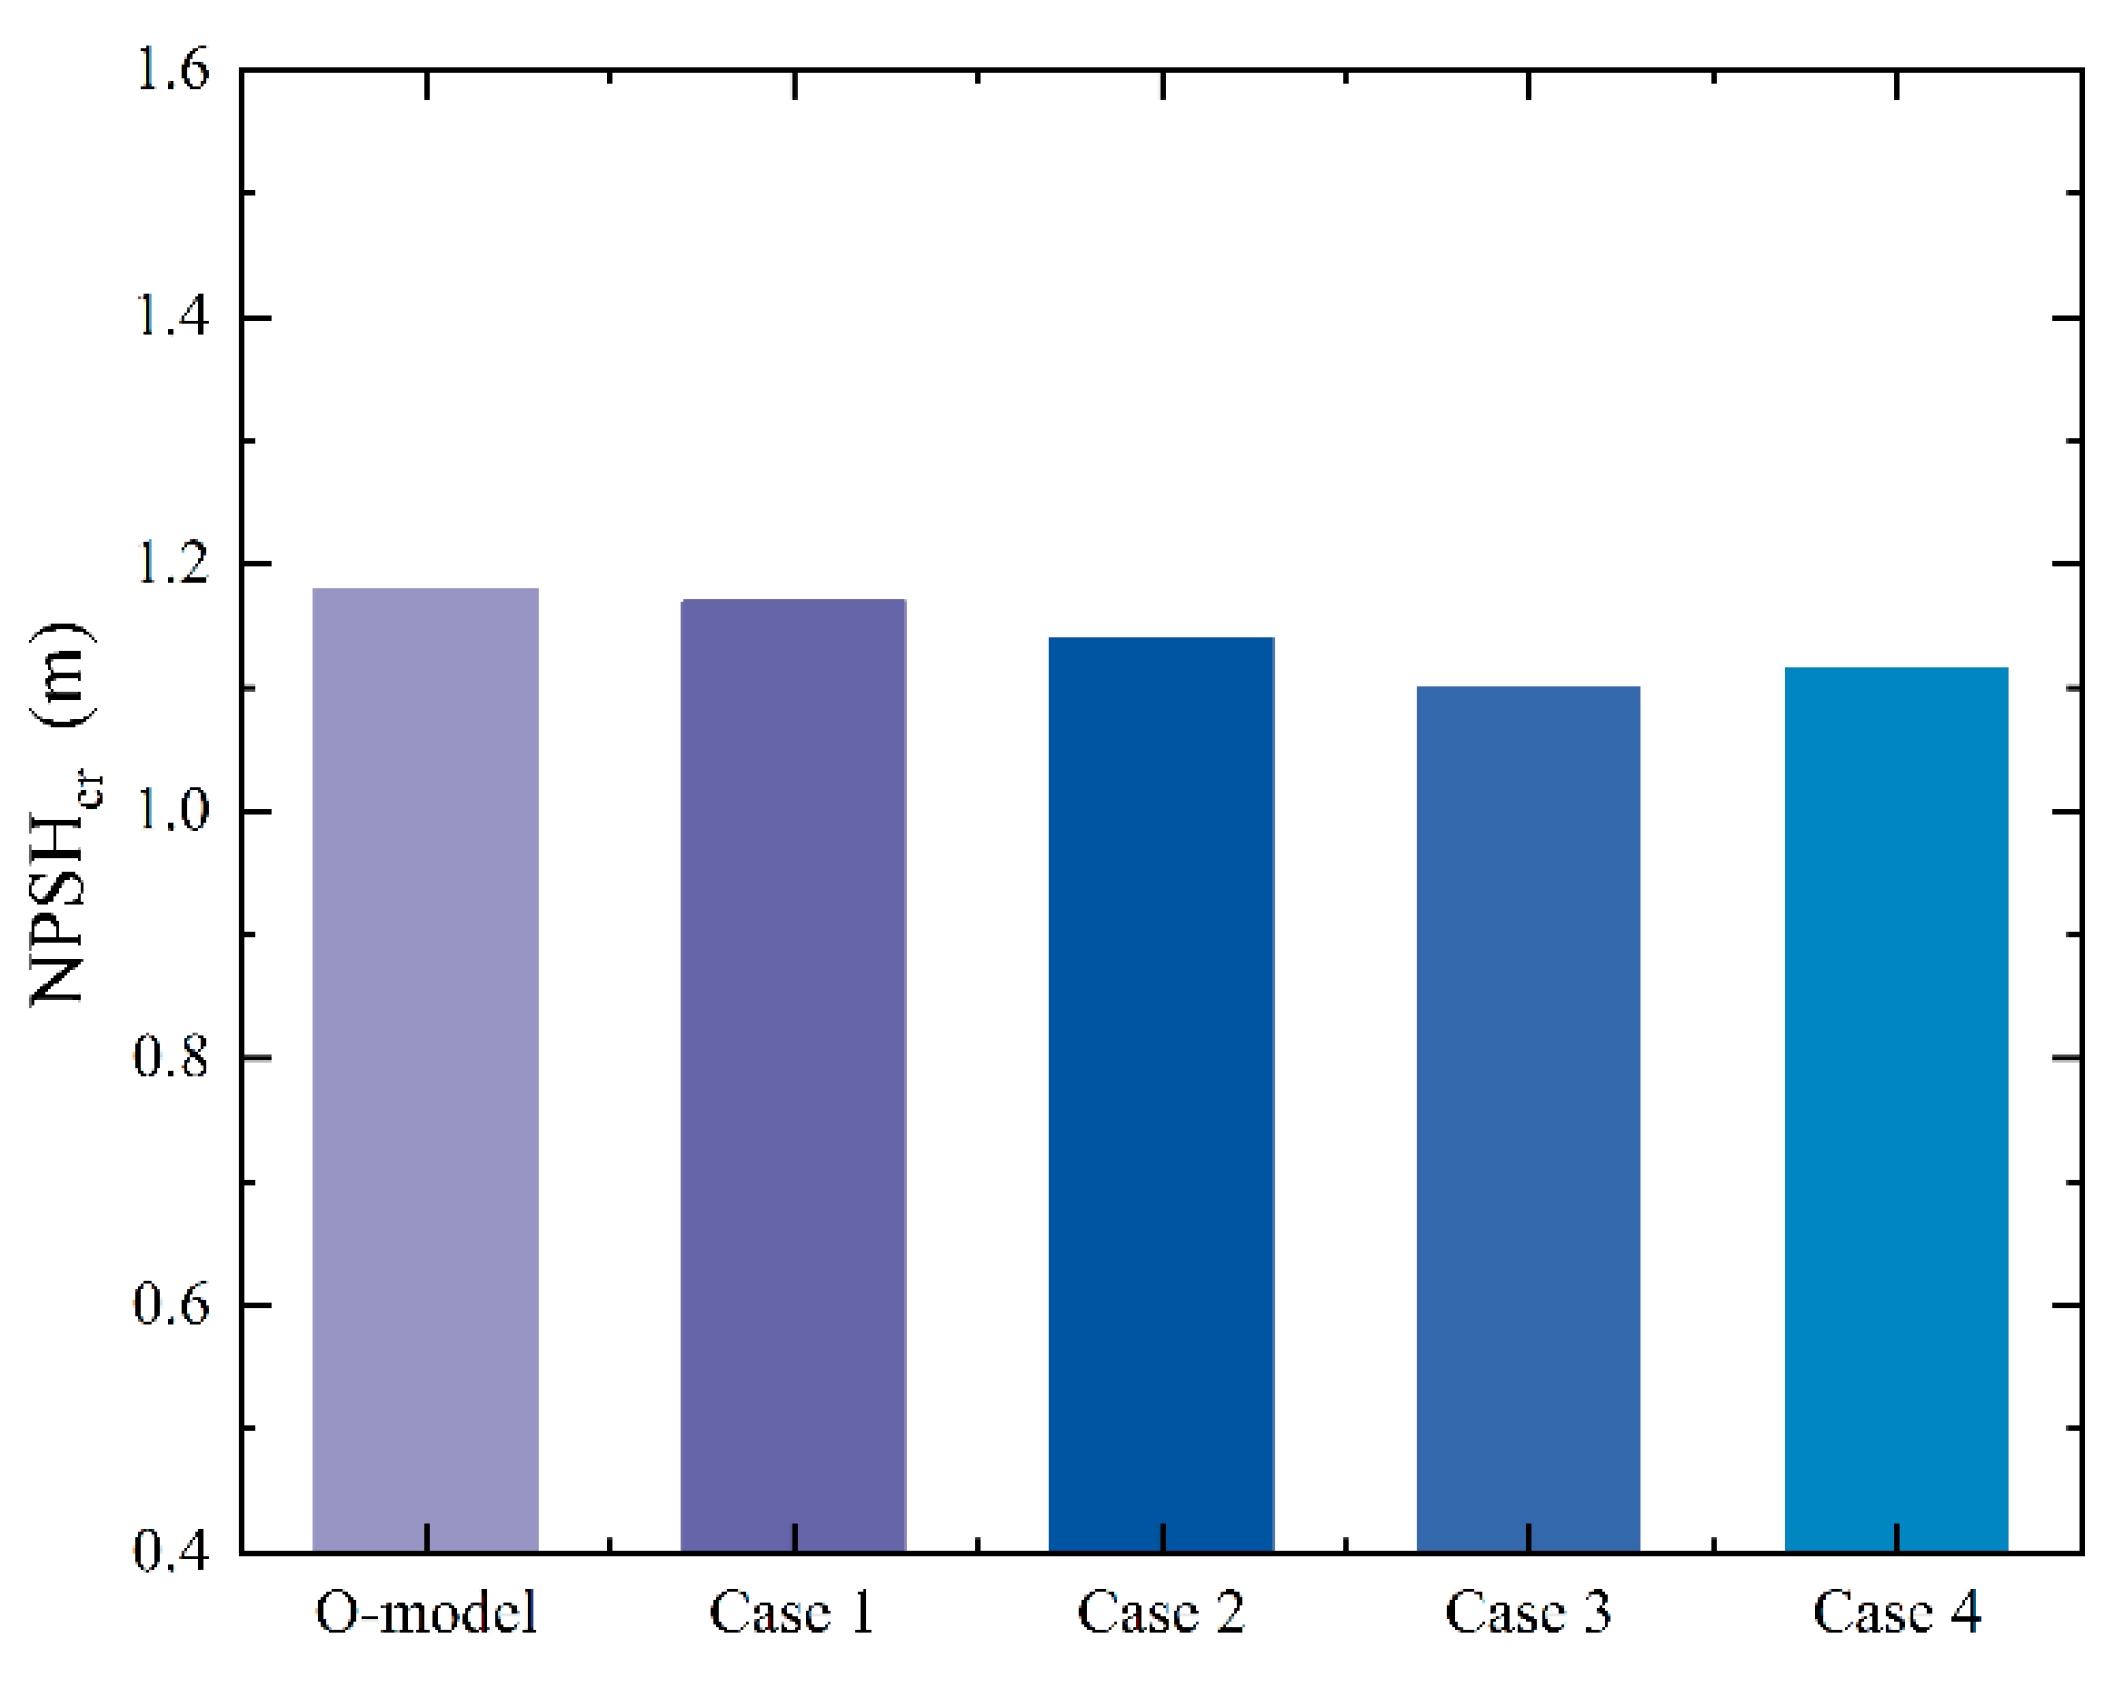
Figure 13: Comparison of NPSHcr of the mixed-flow pump under different perforation cases.
To quantitatively link this optimal performance to the underlying flow mechanism, the total flow rates passing through the perforations for different schemes are analyzed and presented in Fig. 14. The results indicate that as the perforation location shifts from the shroud toward the hub, the through-flow rate first increases and then decreases. Significantly, Case 3 achieves the maximum through-flow rate, which correlates directly with its superior cavitation suppression performance. This finding provides key quantitative evidence that the effectiveness of perforations is strongly associated with their ability to facilitate fluid exchange between the pressure and suction sides.
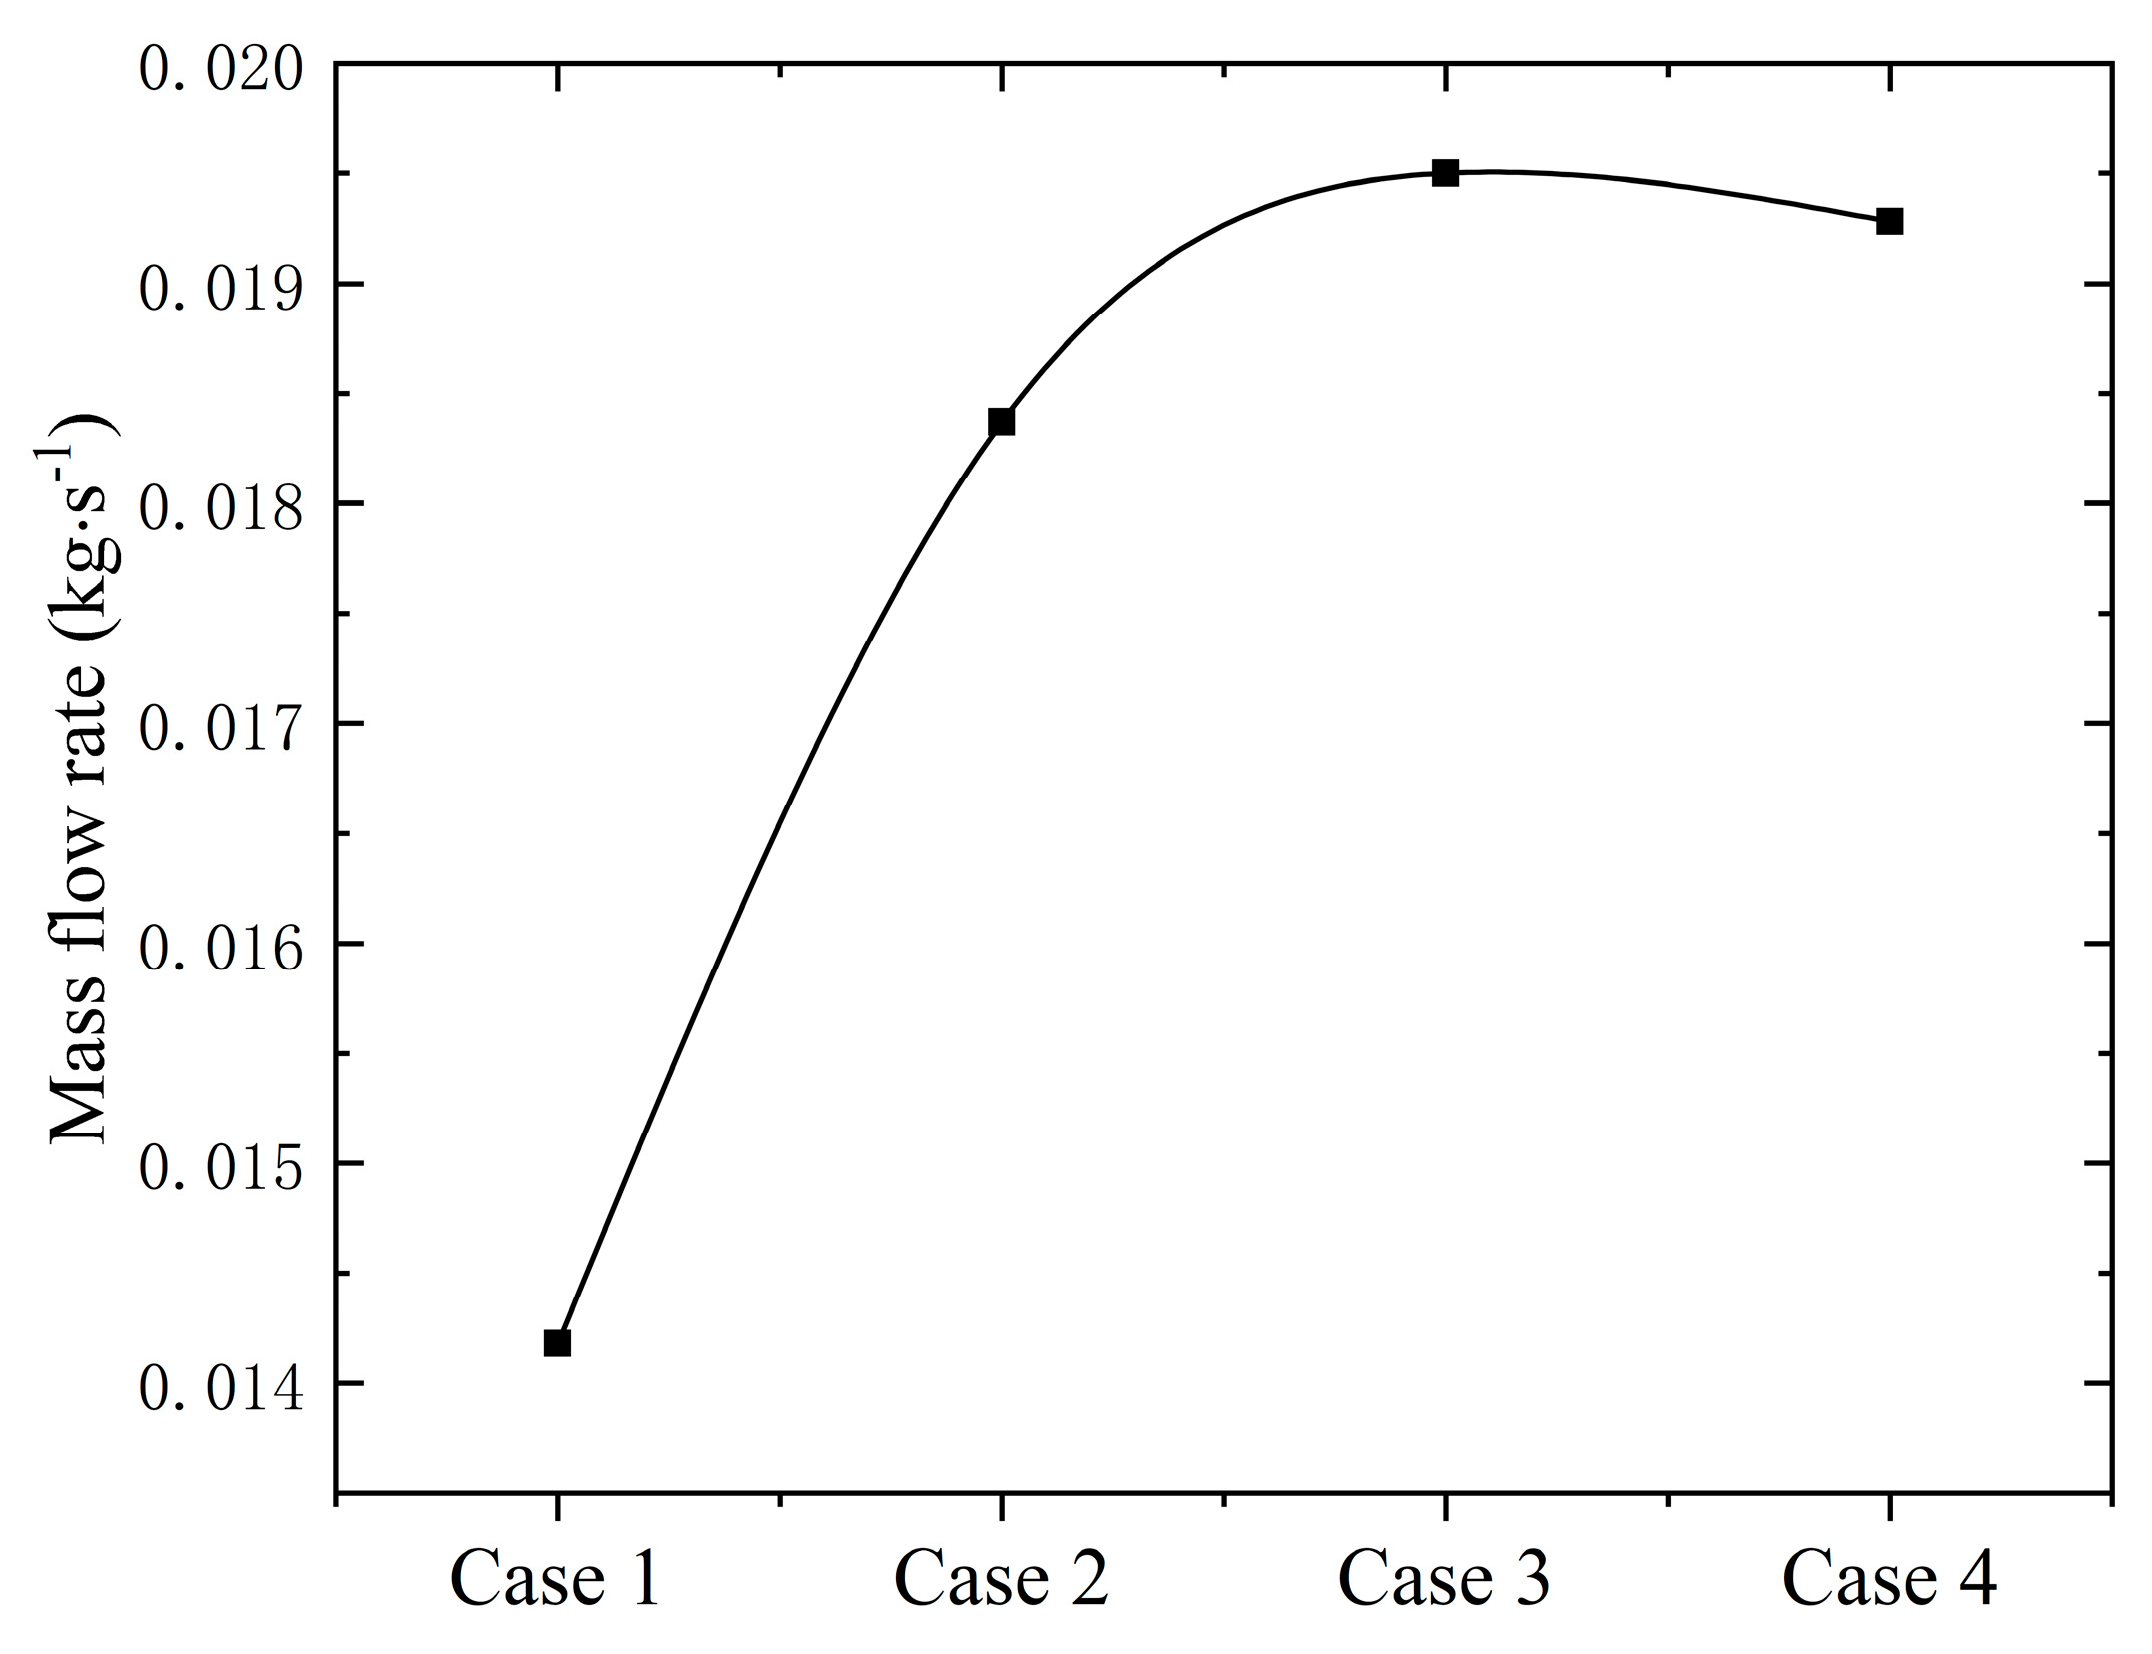
Figure 14: Different hole design schemes through the mass flow rate of the holes.
4.2 Analysis of the Mechanism of Cavitation Suppression by Blade Perforation
Fig. 15 illustrates that the internal flow characteristics of the impeller are dependent on the perforation case. It has been demonstrated that there is a clear similarity in the distributions of low pressure on the suction side, low-velocity regions, and vapor volume fraction. All of these factors occupy approximately one-fifth of the suction surface, mainly concentrated near the impeller leading edge. The closer to the hub, the lower the pressure and velocity, and the higher the vapor volume fraction. Conversely, in the regions downstream on both sides of the perforation, pressure and velocity increase compared with the O-model, while the vapor volume fraction decreases significantly. However, a small low-pressure zone appears behind the perforation, where the vapor volume fraction is also relatively high. Streamline distributions further indicate the absence of streamlines in this area, implying no fluid passage.
The underlying mechanism can be explained as follows: the perforation facilitates the ingress of high-pressure fluid from the pressure side into the suction side. Under the influence of the main flow, this fluid spreads laterally, compensating for the low-pressure zones on both sides of the perforation. This process effectively suppresses cavitation development in these regions. Concurrently, on the downstream side of the perforation, vortices generated by the high-pressure fluid induce boundary layer separation, leading to the formation of a localized separation bubble. Overall, compared to the O-model, perforation has a positive effect in suppressing the generation and development of cavitation. Especially for Cases 3 and 4, the area in the suction surface region where the bubble volume fraction is greater than 0.9 is reduced compared to the O-model. Among them, Case 3 performed the best among the tested cases.
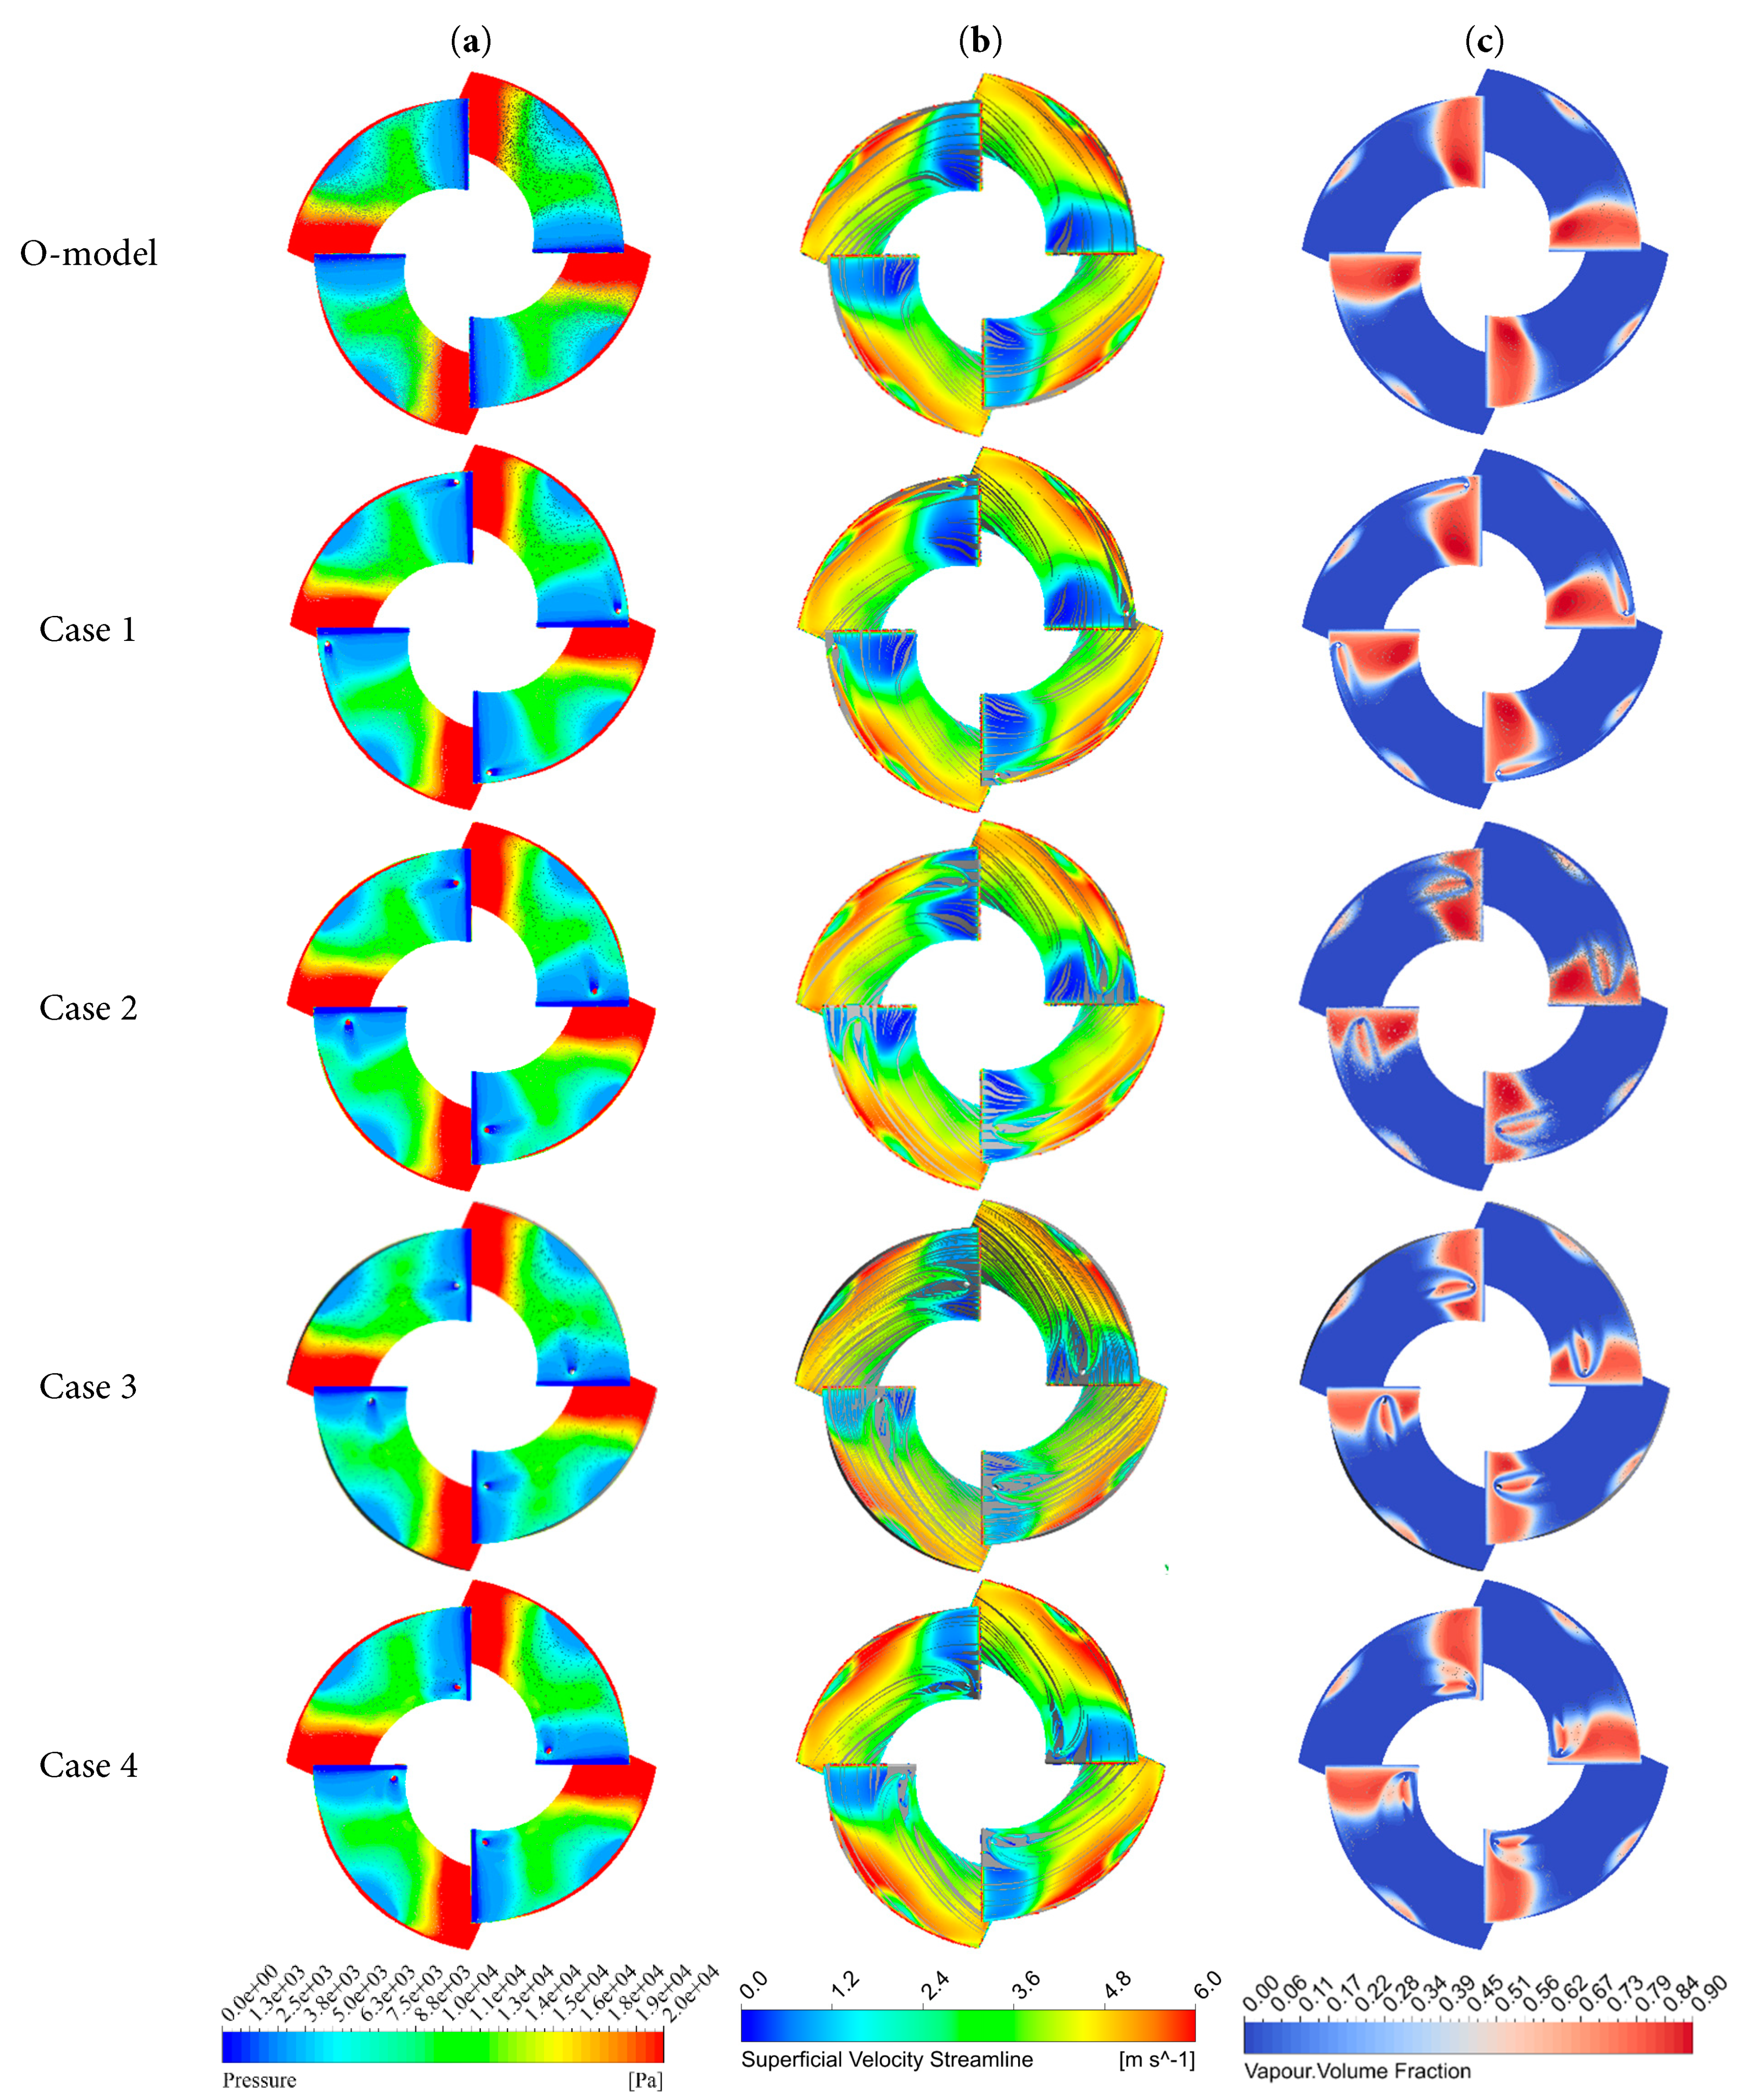
Figure 15: Flow characteristic nephogram of the impeller under different hole opening cases. (a) Pressure distribution nephogram; (b) Velocity streamline distribution nephogram; (c) Vapour volume fraction distribution nephogram.
Subsequently, we used the CFX-Post software to perform vortex core identification for all models based on the Q criterion (with a threshold of 0.005). The quantitative results are shown in Fig. 16. It can be observed that compared to the O model, the vortex core area in Case 1 expanded significantly, while in Case 3 it shrank considerably. Among all the cases with holes, the reduction in the size of the vortex core in Case 3 was the most significant. This quantitative finding is consistent with the conclusion we previously observed that “Case 3 performs best in reducing cavitation”. It provides direct quantitative evidence for the mechanism that “holes inhibit cavitation by altering the vortex structure”.
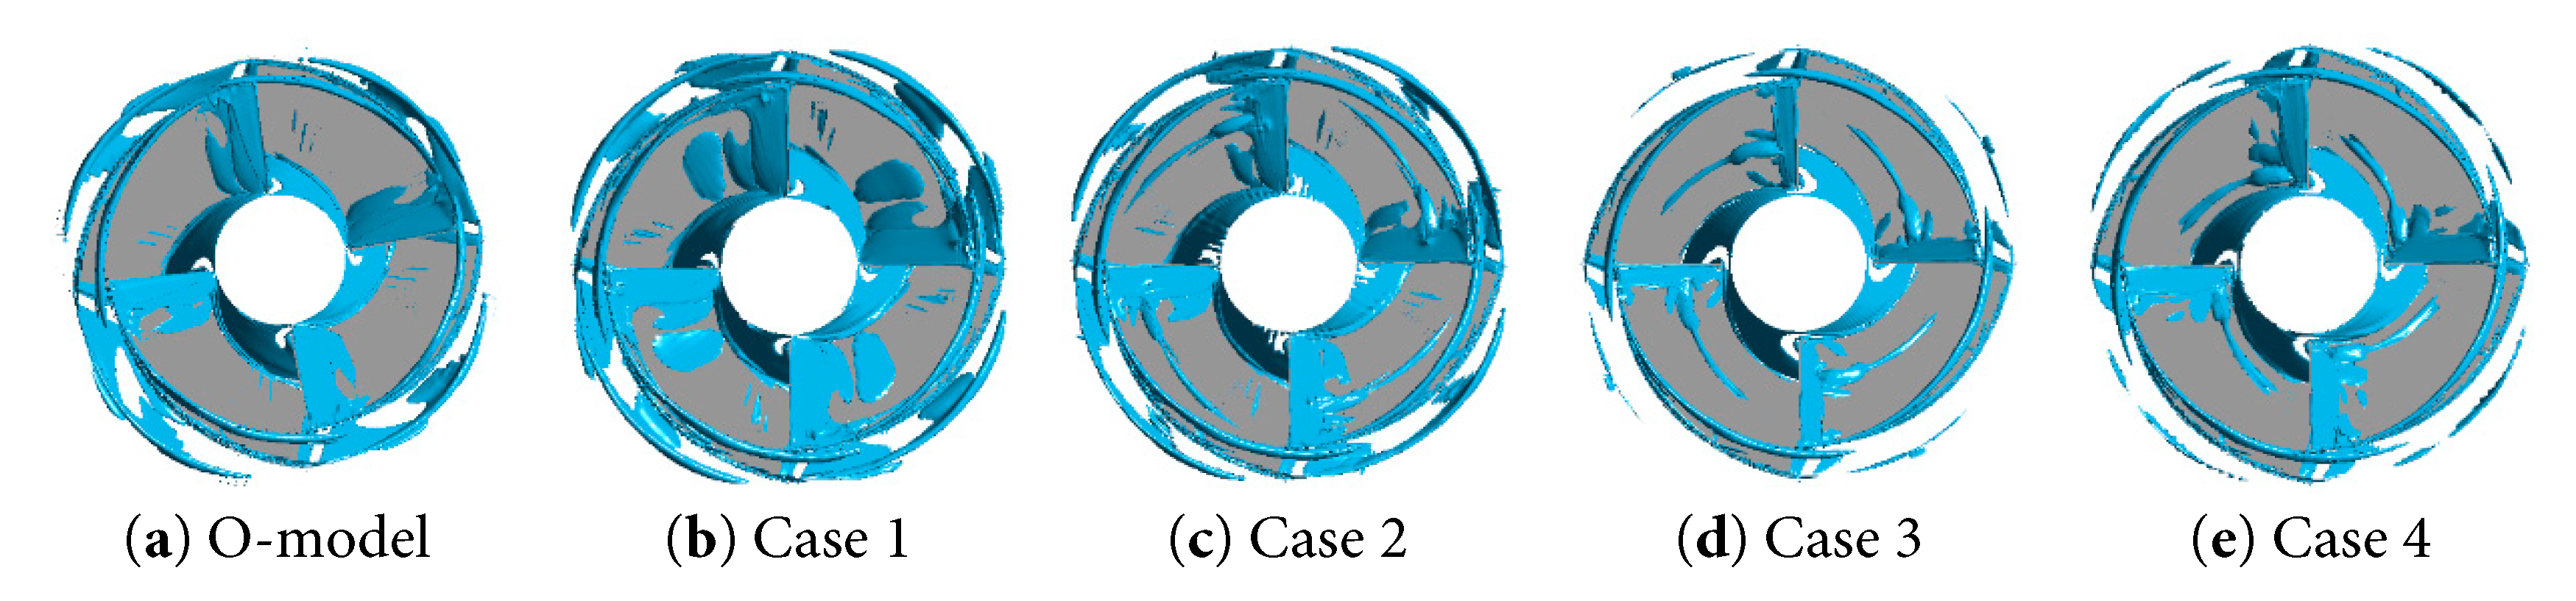
Figure 16: Distribution of vortex core regions for blades with different blade perforation schemes.
The vapour volume within the impeller domain of the O-model and the four perforation cases was integrated to obtain the impeller vapuor volume, and the results are compared in Fig. 17. As demonstrated in the figure, when NPSHa = 1.41 m, the impeller vapour volume of Case 1 increased by 4.1% compared with the O-model, whilst that of the alternative perforation cases demonstrated a decline. This finding is consistent with the external characteristic curves presented earlier, where both the efficiency and head of Case 1 were lower than those of the O-model.
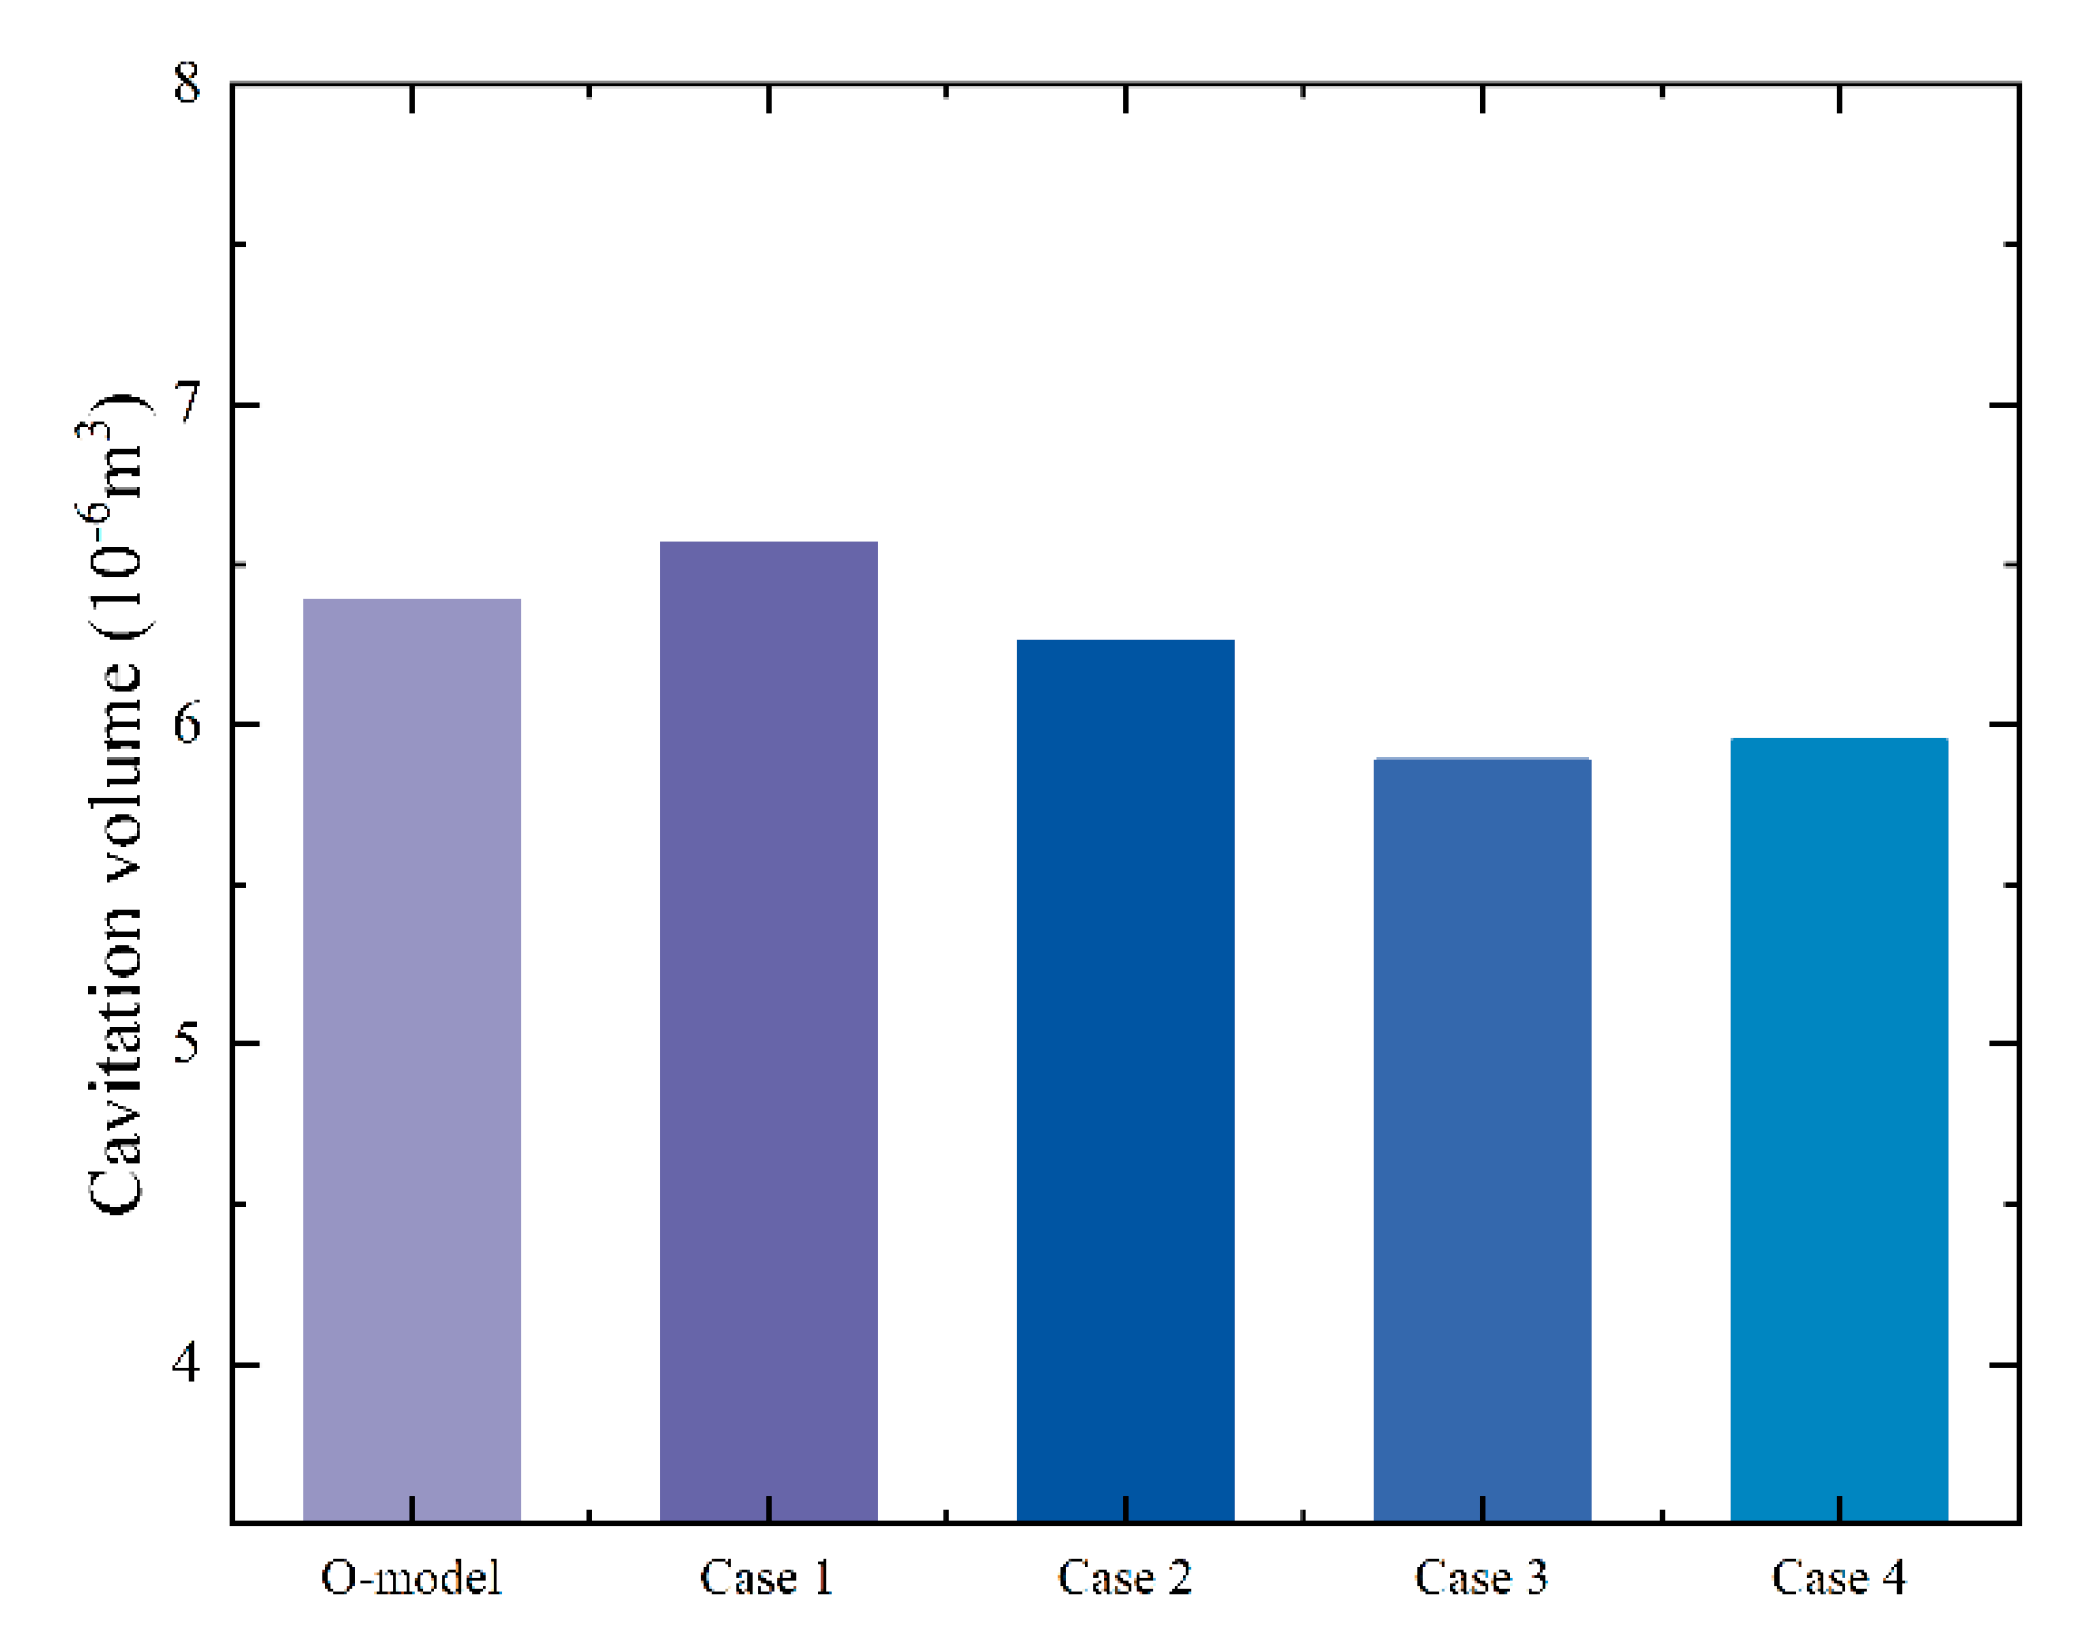
Figure 17: Comparison of cavitation volume in impeller with different opening cases.
To investigate the influence of perforation on the local flow field, the sectional velocity vector distribution at the perforation position of different opening cases is presented in Fig. 18. As demonstrated in the figure, the incoming flow on the pressure side initially makes contact with the lowermost wall of the hole and then passes into the suction side. Due to the high velocity, the low-speed fluid on the suction side is lifted, forming a “cavity-like” region with relatively low fluid content. Within this region, a large vortex develops under the influence of pressure, which diminishes gradually downstream. This observation is consistent with the streamline and vapor distribution results discussed earlier. Meanwhile, the reduction in impeller vapor volume may be related to the interaction between the separated bubble and the large-scale cavity in the flow passage after detachment, which promotes its breakup. Moreover, the generation of small-scale vortices has been demonstrated to enhance turbulence in the passage, leading to a more uniform velocity and energy distribution. However, further investigation is required to elucidate the underlying mechanisms, which will be the focus of future research.
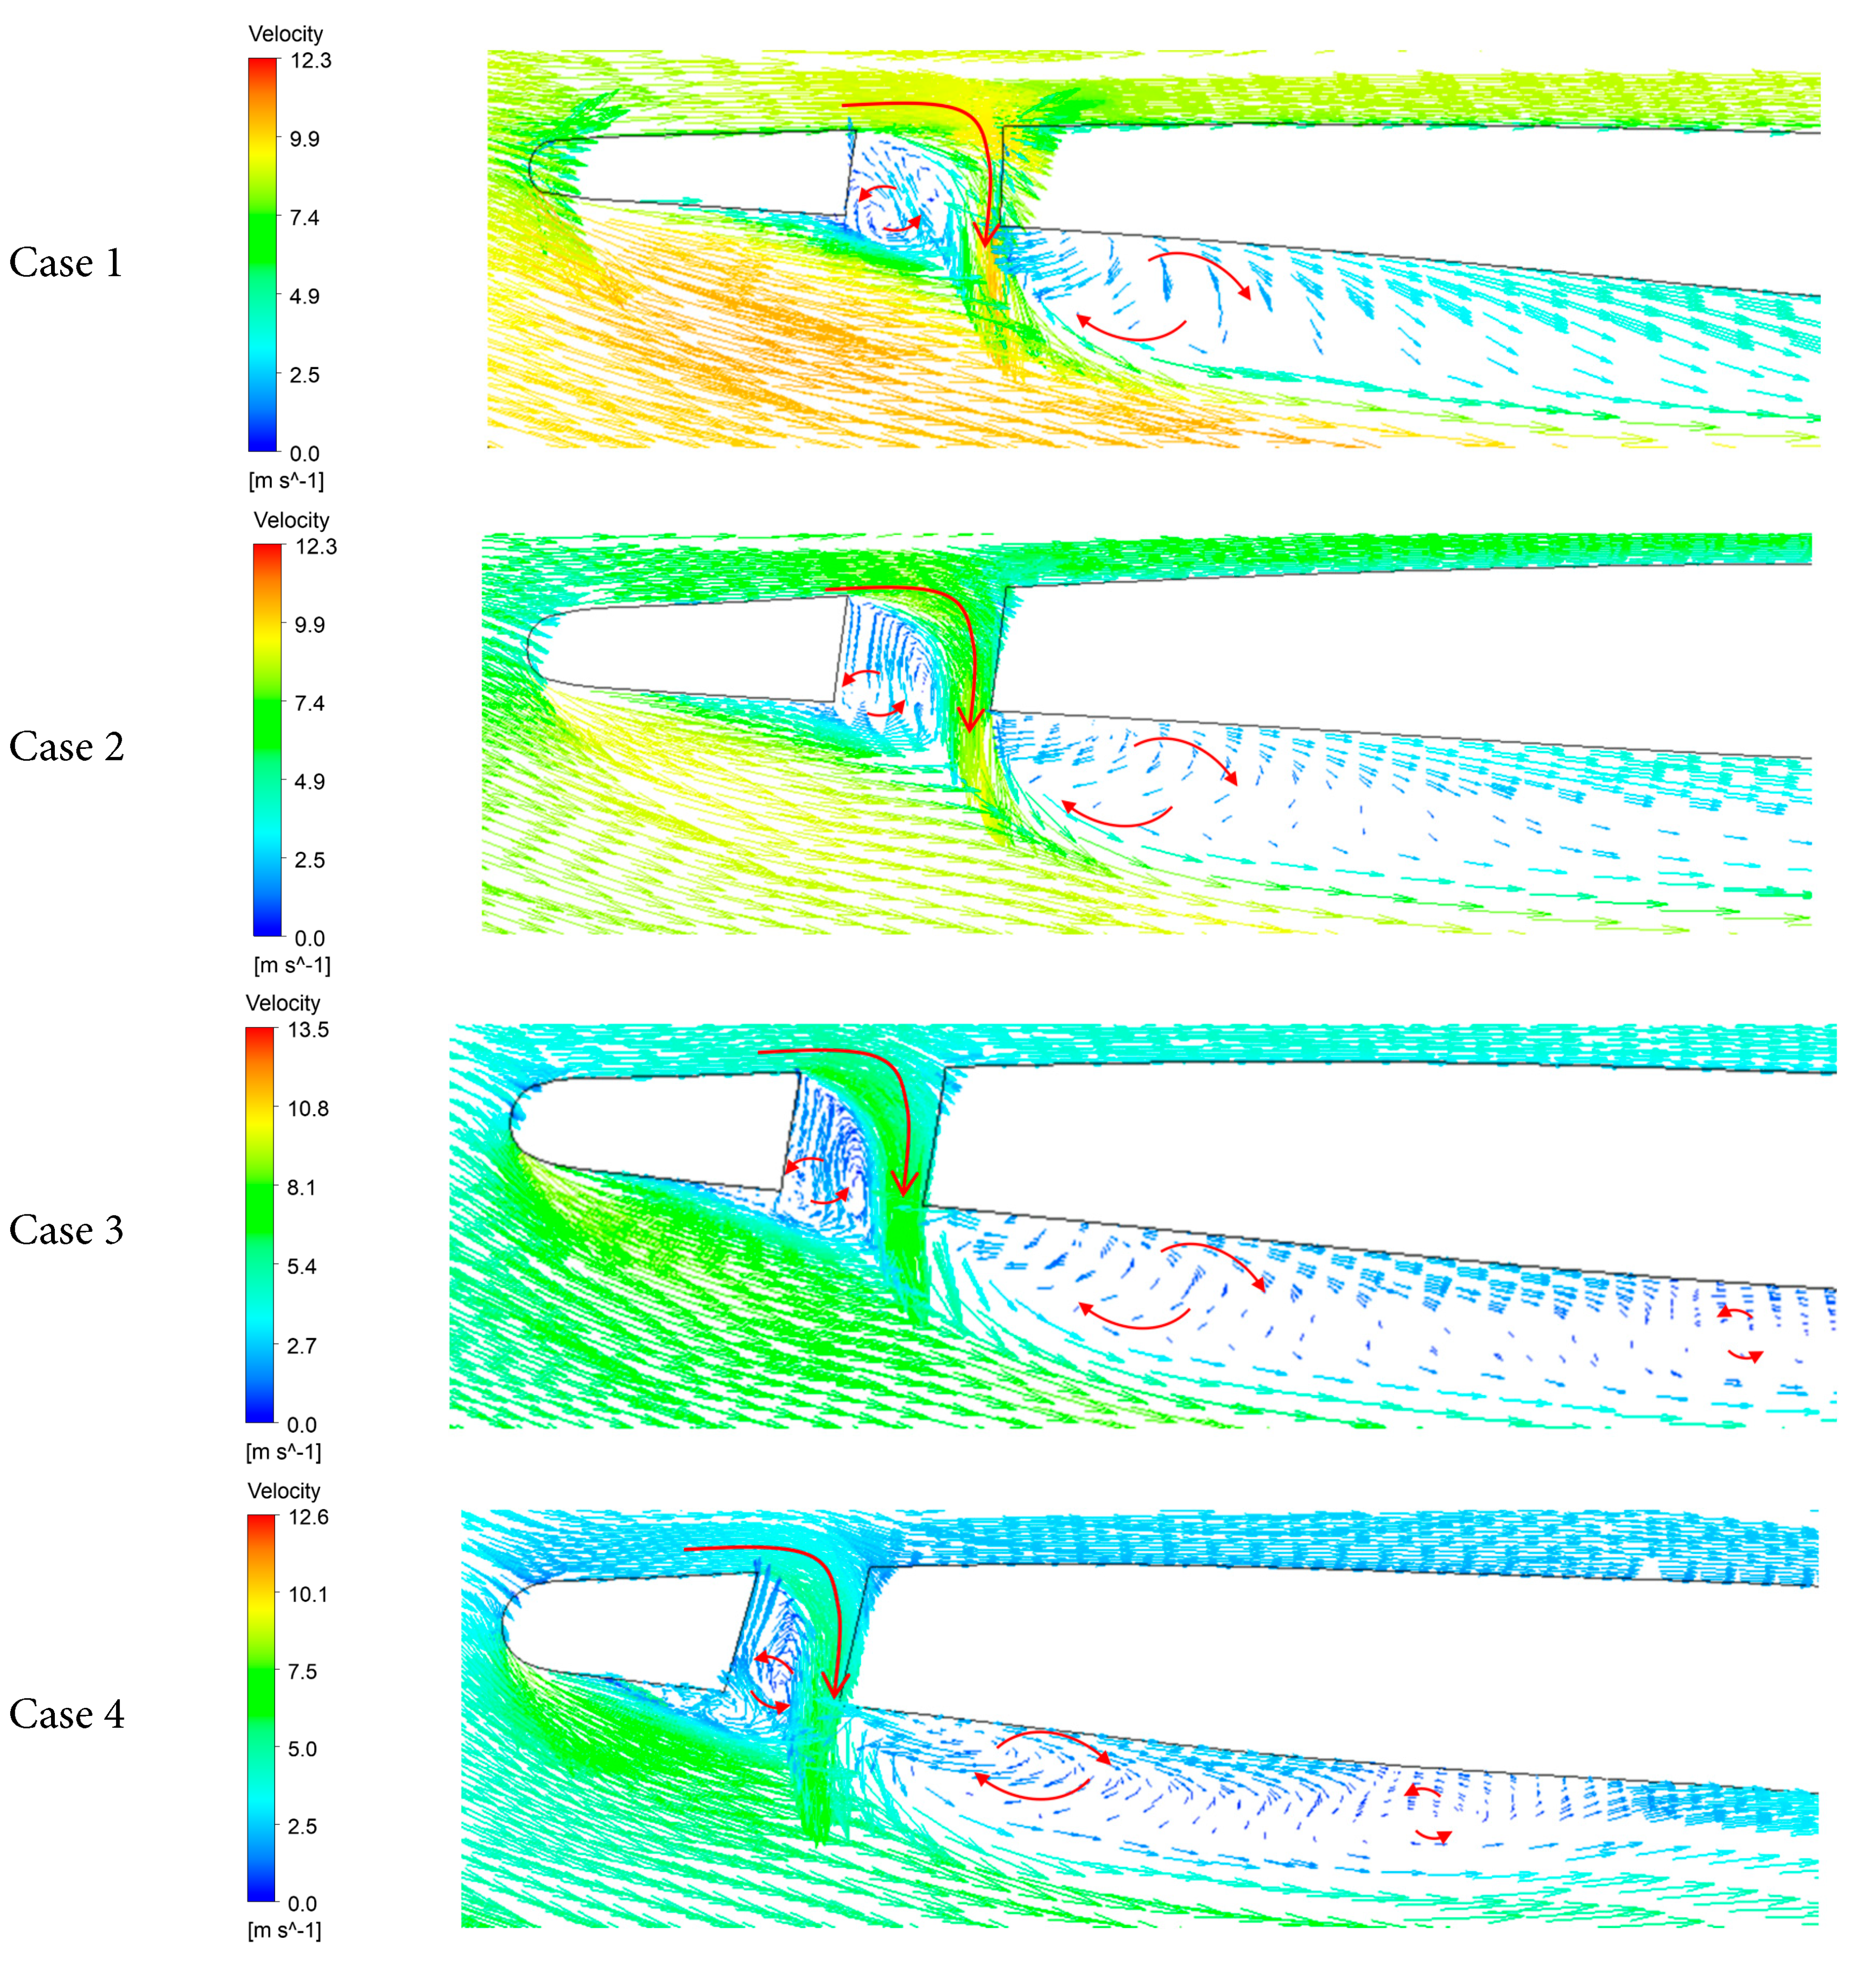
Figure 18: Velocity vector distribution diagram of the hole location section.
In this study, four single circular perforations were arranged at different blade heights along the leading edge (Ka = 0.1), and the influence of perforation positions on the external characteristics, cavitation performance, and internal flow field of the mixed-flow pump was systematically investigated. The following conclusions were drawn:
- (1)By comparing the external characteristics and cavitation characteristic curves under different perforation cases, it is found that the blade perforation position has little influence on the pump head and efficiency. The trends of the cavitation characteristic curves remain essentially unchanged. The NPSHcr of Cases 1, 2, 3, and 4 decreased by 0.6%, 4.1%, 6.6%, and 5.4%, respectively, compared with the O-model, indicating that perforations at the impeller leading edge can suppress cavitation development to some extent.
- (2)Comparisons of pressure distribution in the impeller passage, vapor distribution on the suction surface, and vapor volume inside the impeller under different perforation cases reveal that high-pressure fluid from the pressure side flows into the low-pressure region of the suction side through the circular perforation, reducing the extent of the low-pressure zone and effectively suppressing cavitation development near the perforation. With respect to cavitation performance, the impeller vapor volume increased slightly in Case 1 compared with the O-model, while it decreased noticeably in the other cases.
- (3)The sectional velocity vector diagrams at the perforation locations show that high-pressure fluid from the pressure side enters the suction side through the circular perforation. Small-scale vortices tend to form near the wall downstream of the perforation, consistent with the cavitation distribution observed in the same region. The interaction between these vortices and large-scale cavities promotes cavity breakup, thereby suppressing cavitation and improving pump performance. However, the underlying mechanisms require further investigation.
In conclusion, the present study confirms that perforations at specific locations along the blade leading edge serve as an effective means of cavitation suppression. This finding is not only applicable to general mixed-flow pump designs but also has significant implications for fluid transport equipment operating in the extreme environments of the deep sea. The present work elucidates a novel mechanism whereby perforations introduce high-pressure fluid to compensate for low-pressure regions, thus offering a promising technical approach to mitigating cavitation in deep-sea pumps operating under conditions of low inlet pressure and high load. It is important to note that the present study primarily focused on the influence mechanism of the spanwise position, while cavitation performance is also closely related to parameters such as hole diameter and number. Consequently, a systematic investigation into the synergistic effects of these parameters on both cavitation suppression and hydraulic performance is imperative for future research. The findings of this work establish a foundation for ongoing exploration in this field and indicate a preliminary technical pathway.
Acknowledgement:
Funding Statement: This research was funded by the National Key Research and Development Project of China (No. 2019YFB 2005300), the Natural Science Foundation of Jiangsu Province (No. BK20220609), and the National Natural Science Foundation of China (Grant Nos. 52109106, 52409122, and 12272187).
Author Contributions: Conceptualization, Weidong Shi and Yongfei Yang; methodology, Yongfei Yang; soft-ware, Chaoyu Wei and Haipeng Zhang; validation, Xianglong Wu; formal analysis, Xianglong Wu and Haipeng Zhang; investigation, Yurui Dai and Xianglong Wu; data curation, Chaoyu Wei; writing—original draft preparation, Yongfei Yang and Linwei Tan; writing—review and editing, Chaoyu Wei; visualization, Yurui Dai and Haipeng Zhang; supervision, Yongfei Yang; project administration, Weidong Shi and Yongfei Yang; funding acquisition, Weidong Shi and Linwei Tan. All authors reviewed and approved the final version of the manuscript.
Availability of Data and Materials: The data that support the findings of this study are available from the corresponding authors upon reasonable request.
Ethics Approval: Not applicable.
Conflicts of Interest: The authors declare no conflicts of interest.
References
1. Li W , Li E , Ji L , Zhou L , Shi W , Zhu Y . Mechanism and propagation characteristics of rotating stall in a mixed-flow pump. Renew Energy. 2020; 153: 74– 92. doi:10.1016/j.renene.2020.02.003. [Google Scholar] [CrossRef]
2. Ji L , Li W , Shi W , Tian F , Agarwal R . Effect of blade thickness on rotating stall of mixed-flow pump using entropy generation analysis. Energy. 2021; 236: 121381. doi:10.1016/j.energy.2021.121381. [Google Scholar] [CrossRef]
3. Zou W , Zhang H , Chen Y . China’s research and development of slurry pump for lift marine mineral resources. In: Proceedings of the 20th International Conference on Transport and Sedimentation of Solid Particles; 2023 Sep 26–29; Wroclaw, Poland. doi:10.30825/4.14-17.2023. [Google Scholar] [CrossRef]
4. Lu Y , Tan L , Han Y , Liu M . Cavitation-vibration correlation of a mixed flow pump under steady state and fast start-up conditions by experiment. Ocean Eng. 2022; 251: 111158. doi:10.1016/j.oceaneng.2022.111158. [Google Scholar] [CrossRef]
5. Liu T , Zhu J , Wang Z , Geng H , Zhu H . Experimental study on cavitation noise characteristics of a hydraulic model of mixed-flow pump. IEEE Access. 2023; 11: 111274– 80. doi:10.1109/ACCESS.2023.3312725. [Google Scholar] [CrossRef]
6. Sedlar M , Sputa O , Komarek M . CFD analysis of cavitation phenomena in mixed-flow pump. Int J Fluid Mach Syst. 2012; 5( 1): 18– 29. doi:10.5293/IJFMS.2012.5.1.018. [Google Scholar] [CrossRef]
7. Yang X , Zhu J , Zhang Y , Chen B , Tang Y , Jiang R , et al. Study on the cavitation performance in the impeller region of a mixed-flow pump under different flow rates. Water. 2024; 16( 22): 3195. doi:10.3390/w16223195. [Google Scholar] [CrossRef]
8. Li W , Li H , Liu M , Ji L , Agarwal RK , Jin S . Energy dissipation mechanism of tip-leakage cavitation in mixed-flow pump blades. Phys Fluids. 2024; 36: 015115. doi:10.1063/5.0183540. [Google Scholar] [CrossRef]
9. Dehghan AA , Shojaeefard MH . Experimental and numerical optimization of a centrifugal pump volute and its effect on head and hydraulic efficiency at the best efficiency point. Proc Inst Mech Eng Part C J Mech Eng Sci. 2022; 236( 9): 4577– 98. doi:10.1177/09544062211056019. [Google Scholar] [CrossRef]
10. Dehghan AA , Shojaeefard MH , Roshanaei M . Exploring a new criterion to determine the onset of cavitation in centrifugal pumps from energy-saving standpoint; experimental and numerical investigation. Energy. 2024; 293: 130681. doi:10.1016/j.energy.2024.130681. [Google Scholar] [CrossRef]
11. Timoshevskiy MV , Zapryagaev II , Pervunin KS , Maltsev LI , Markovich DM , Hanjalić K . Manipulating cavitation by a wall jet: experiments on a 2D hydrofoil. Int J Multiph Flow. 2018; 99: 312– 28. doi:10.1016/j.ijmultiphaseflow.2017.11.002. [Google Scholar] [CrossRef]
12. Wang W , Zhang Q , Tang T , Lu S , Yi Q , Wang X . Numerical study of the impact of water injection holes arrangement on cavitation flow control. Sci Prog. 2020; 103( 1): 0036850419877742. doi:10.1177/0036850419877742. [Google Scholar] [CrossRef]
13. Shi ZH , Shi WD , Xie ZS , Chen C , Tan LW , Cao YP , et al. Cavitation suppression of NACA airfoils by local microchannels. Fluid Mach. 2021; 49( 9): 47– 53. (In Chinese). [Google Scholar]
14. Tanaka Y , Kitabata T , Nasu K , Watanabe S , Sakata A . Suppression of cavitation surge in turbopump with inducer by reduced-diameter suction pipe with swirl brake. J Fluids Eng. 2022; 144( 7): 071205. doi:10.1115/1.4052926. [Google Scholar] [CrossRef]
15. Khan Z , Zhao W . Cavitation mitigation via curvilinear barriers in centrifugal pump. Discov Mech Eng. 2024; 3( 1): 14. doi:10.1007/s44245-024-00045-8. [Google Scholar] [CrossRef]
16. Kadivar E , Ochiai T , Iga Y , el Moctar O . An experimental investigation of transient cavitation control on a hydrofoil using hemispherical vortex generators. J Hydrodyn. 2021; 33( 6): 1139– 47. doi:10.1007/s42241-021-0097-6. [Google Scholar] [CrossRef]
17. Zhang J , Chen XP , Su CM , Zhao Z . Study on the influence of blade perforation near inlet edge on cavitation and turbulent kinetic energy of centrifugal pump. Fluid Mach. 2021; 49( 7): 14– 82. (In Chinese). [Google Scholar]
18. Biswas S , Harish R . Effect of unsteady cavitation on hydrodynamic performance of NACA 4412 Hydrofoil with novel triangular slot. Heliyon. 2025; 11( 3): e42266. doi:10.1016/j.heliyon.2025.e42266. [Google Scholar] [CrossRef]
19. Wang D , Liu Z , Han W . Study on improving cavitation performance of centrifugal pump by perforation at the front cover plate. Int J Fluid Mach Syst. 2020; 13( 4): 668– 76. doi:10.5293/IJFMS.2020.13.4.668. [Google Scholar] [CrossRef]
20. Ji B , Luo X , Peng X , Wu Y , Xu H . Numerical analysis of cavitation evolution and excited pressure fluctuation around a propeller in non-uniform wake. Int J Multiph Flow. 2012; 43: 13– 21. doi:10.1016/j.ijmultiphaseflow.2012.02.006. [Google Scholar] [CrossRef]
21. Cordisco I , Berni F , Paini G , Tonelli R , Fontanesi S . Performance and cavitation in automotive centrifugal pumps: experimental analysis and 3D-CFD modelling assessment. Appl Therm Eng. 2026; 284: 129130. doi:10.1016/j.applthermaleng.2025.129130. [Google Scholar] [CrossRef]
22. Mulbah C , Kang C , Mao N , Zhang W , Shaikh AR , Teng S . A review of VOF methods for simulating bubble dynamics. Prog Nucl Energy. 2022; 154: 104478. doi:10.1016/j.pnucene.2022.104478. [Google Scholar] [CrossRef]
23. ANSYS, Inc . ANSYS CFX theory guide. Canonsburg, PA, USA: ANSYS, Inc.; 2025. [Google Scholar]
24. Pope SB . Turbulent flows. Cambridge, UK: Cambridge University Press; 2000. doi:10.1017/CBO9780511840531. [Google Scholar] [CrossRef]
25. Dumitrescu O , Dobromirescu C , Dragan V , Vintila IS , Mihalache R . CFD and experimental comparison for micro-pump performance in space applications: a case study. Appl Sci. 2025; 15( 12): 6623. doi:10.3390/app15126623. [Google Scholar] [CrossRef]
26. Launder BE , Spalding DB . Lectures in mathematical models of turbulence. Cambridge, MA, USA: Academic Press; 1972. [Google Scholar]
27. Plesset MS , Prosperetti A . Bubble dynamics and cavitation. Annu Rev Fluid Mech. 1977; 9: 145– 85. doi:10.1146/annurev.fl.09.010177.001045. [Google Scholar] [CrossRef]
28. Orlandi F , Montorsi L , Milani M . Cavitation analysis through CFD in industrial pumps: a review. Int J Thermofluids. 2023; 20: 100506. doi:10.1016/j.ijft.2023.100506. [Google Scholar] [CrossRef]
Cite This Article
 Copyright © 2026 The Author(s). Published by Tech Science Press.
This work is licensed under a Creative Commons Attribution 4.0 International License , which permits unrestricted use, distribution, and reproduction in any medium, provided the original work is properly cited.
 Downloads
 Citation Tools