
 Submit a Paper
 Propose a Special lssue
 Open Access
ARTICLE

Enhanced Convective Heat Transfer in Pyrolysis Furnaces via Impeller-Induced Stirring
1 State Key Laboratory of Complex Nonferrous Metal Resources Clean Utilization, School of Metallurgical and Energy Engineering, Kunming University of Science and Technology, Kunming, China
2 Faulty of Metallurgical and Energy Engineering, Kunming University of Science and Technology, Kunming, China
3 Hongta Tobacco (Group) Co., Ltd., Yuxi, China
* Corresponding Author: Jianxin Xu. Email:
Fluid Dynamics & Materials Processing 2026, 22(2), 6 https://doi.org/10.32604/fdmp.2026.076265
Received 17 November 2025; Accepted 09 February 2026; Issue published 04 March 2026
 View Full Text
 Download PDF
Abstract
Optimizing pyrolysis processes is critical for improving the efficiency of pyrolysis furnaces. This study presents a strategy to enhance heat transfer through agitation, employing Fluent for detailed numerical simulation of the thermal behavior. The simulation results show strong agreement with experimental measurements of localized fluid temperature rise. Forced convection induced by impeller rotation significantly improves heat transfer between the fluid and the furnace walls, effectively reducing thermal stratification. At an impeller speed of 240 RPM, the axial temperature difference decreases from 200 K to 50 K compared with stationary conditions, while the average heat transfer coefficient increases by approximately 50% throughout the heating process. The swirl flow generated by impeller motion disrupts the thermal boundary layer, achieving a more uniform temperature distribution and faster thermal response.Keywords
The pyrolysis furnace is a commonly used pyrolysis equipment in industry, and its temperature is characterized by significant nonlinearity, large inertia, hysteresis, and time-varying characteristics [1]. The fundamental principle involves temperature regulation through the heating effect of electric filaments, thereby controlling the furnace temperature for material pyrolysis and ultimately obtaining the corresponding products. During the pyrolysis process in these furnaces, the variation in the heating rate curve significantly influences the outcome, typically leading to the generation of different pyrolysis products [2].
Furthermore, pyrolysis furnaces are commonly utilized in industries for the thermal decomposition treatment of organic substances, producing combustible gas mixtures, tar, and coke. Therefore, to obtain specific pyrolysis products, corresponding heating rate curves need to be conFig. Heating rate is another critical parameter influencing the distribution of biomass pyrolysis products. A faster heating rate helps reduce heat and mass transfer limitations, facilitating bond-breaking reactions and enhancing the yield of primary volatile components [3].
The complex heat transfer mechanisms involved inside pyrolysis furnaces, primarily comprising conduction, convection, and radiation [4,5,6,7]. Conduction exhibits linear characteristics, while radiation and convection demonstrate non-linear properties. Consequently, pyrolysis furnaces are characterized by strong coupling and nonlinearity. Factors such as the furnace’s structural design, volume, and the positioning of heating elements influence the temperature distribution within the furnace, imparting significant lag, and asymmetry to its temperature profile. The combined influence of conduction, convection, and radiation determines the temperature characteristics of the pyrolysis furnace.
Due to the temperatures inside the furnace typically reaching several hundred to even a thousand degrees Celsius, coupled with the complex interplay of multiple heat transfer mechanisms, studying heat transfer within the furnace poses significant challenges. The computational fluid dynamics (CFD) method provides an economical and reliable solution for complex fluid flow and heat transfer systems by solving a series of continuity, momentum and energy equations to obtain the numerical physical field. Ashouri and Mazaheri [8] conducted three-dimensional CFD simulations, employing the first application of the PaSR combustion model, to compare the performance of premixed and non-premixed burners in steam cracking furnaces. Their study revealed that the non-premixed configuration enhances furnace temperature, improves temperature uniformity, and reduces the temperature differential between reaction tubes, while also strengthening vortex mixing within the flow field. Zhao et al. [9] utilised computational fluid dynamics (CFD) methodology, incorporating the k-ε turbulence model, the eddy dissipation combustion model (EDM), and the P1 radiation model, to investigate the flow and heat transfer processes in an oilfield heating furnace under varying load conditions. The research demonstrated that the burner rotation device intensifies mixing, shortens the flame length, and improves the temperature distribution. Lu et al. [10] developed a CFD model for a natural gas combustion furnace, accounting for the mixing of air and flue gas. Employing the k-ε turbulence model, they compared three air–flue gas mixing methods and found that the structure with air entering the mixing chamber obliquely generates a helical flow, significantly enhancing heat exchange efficiency and outlet temperature uniformity. He et al. [11] employed CFD simulation techniques, based on the k-ε model, to analyse the flow field characteristics and gasification performance of a Shell gasifier under normal and abnormal feed conditions. The results indicated that the symmetrical swirl flow formed under normal operating conditions is conducive to high-temperature reactions.
Hernando A. Yepes et al. [12] investigated the impact of adding 30% syngas on the temperature field of flameless combustion in a regenerative furnace through a combined approach of numerical simulation (CFD) and experimentation. Analysis revealed that, compared to pure natural gas, the hybrid fuel reduced the average combustion chamber temperature by 6% but yielded superior thermal homogeneity. Teng Zhang et al. [13] established a model for the temperature distribution within a heating furnace and integrated it with a back-propagation neural network (BPNN) to analyse the influence of slab thickness, velocity, and furnace gas temperature distribution on the slab heating process and furnace efficiency. The study demonstrated that optimising the furnace gas temperature distribution can reduce heat transfer exergy loss, thereby increasing furnace efficiency from 28.5% to 45.2%. Chenchang Wu et al. [14] employed a methodology combining computational fluid dynamics (CFD) with various machine learning algorithms, such as Random Forest Regression, to study the effects of temperature uniformity in a multi-nozzle array and particle residence time on the decomposition rate of magnesium nitrate within a pyrolysis furnace. Results indicated that increasing the thermal carrier gas temperature and nozzle cone angle, along with optimising the nozzle arrangement, can effectively enhance the decomposition rate. Chen et al. [15] conducted a numerical simulation to analyse the influence of the corrugation pitch ratio and depth ratio of helical corrugated tubes, used in a grate furnace superheater, on the steam-side heat transfer performance. The research found that increasing the corrugation depth ratio significantly enhances cross-sectional secondary flow velocity, disturbs the boundary layer, and consequently improves the local Nusselt number and wall heat flux density. Panjkovic and Gloss [16] developed a synthesized model based on the commercial code CFX. The model takes into account conjugate heat transfer, free convection, and flow under the influence of inertial forces in the furnace. The model predicts the fluid flow and heat transfer in the blast furnace, especially the flow and temperature distribution in the ferro-water and the temperature distribution in the refractory material.
A review of previous research indicates that improving the uniformity of temperature distribution within the furnace has been established as a key objective for optimising heat transfer. The enhancement of convective effects is of pivotal significance in achieving temperature field homogeneity [17]. Despite the advances achieved in recent studies, which have enhanced our understanding of furnace heat transfer mechanisms, structural optimisation, and numerical simulation methods, there remains a paucity of in-depth and targeted research on the systematic enhancement of convective heat transfer in pyrolysis furnaces through active mechanical agitation. This is particularly evident in the context of the coupling between natural and forced convection in confined spaces. In pyrolysis processes, the accuracy and uniformity of temperature control directly affect the distribution and quality of pyrolysis products. This study proposes a novel approach to heat transfer optimisation in furnaces by introducing a rotating impeller to actively intensify convection inside the furnace. Provides a valuable addition to existing heat transfer optimisation strategies and offers a novel technical and theoretical foundation for achieving efficient, controllable, and uniform pyrolysis processes.
The pyrolysis furnace used in the experiments, shown in Fig. 1a, is cylindrical in shape and possesses a controller that can be used to precisely regulate the heating temperature and motor operation. Three thermocouples were placed inside the furnace and their temperature readings were conveniently displayed on an LED panel. The uncertainty in the temperature measurement process was analysed according to the method proposed by Moffat [18]. Using this method, the standard deviation of the average temperature was calculated to be 2.257 K, and the standard deviation of the average heat transfer coefficient was 1.2767. The maximum uncertainty of the average heat transfer coefficient was determined to be 4.4%. Consequently, the systematic error meets the testing requirements, and the test data possesses a degree of reliability. The high temperature exhaust gas is discharged from the top and is cooled and purified by special equipment. A discharge port controlled by a screw rod is provided at the bottom. In contrast to conventional pyrolysis furnaces, this particular furnace is equipped with two three-bladed impellers in the center with a spacing of 250 mm between them. The lower impeller is 100 mm away from the bottom of the furnace and the design of the impeller is shown in Fig. 1b. When the equipment is in operation, the impeller is driven by a motor at the top and rotates in a counterclockwise direction at a uniform speed to promote the mixing of the heat transfer medium in the furnace. From the top view in Fig. 1c, six high-temperature heating elements can be clearly seen evenly distributed around the furnace body. Each heating element is angled at an angle of 35° with respect to the contact surface of the furnace body, and a gap of 25° is maintained between the contact surfaces. Fig. 1d provides details of the localized dimensions of the pyrolysis furnace, including an inner diameter of 500 mm and an inner height of 570 mm. Three type K thermocouples were provided at the center point of the furnace, located at the upper, middle, and lower portions of the furnace body, with a longitudinal spacing of 210 mm between them.
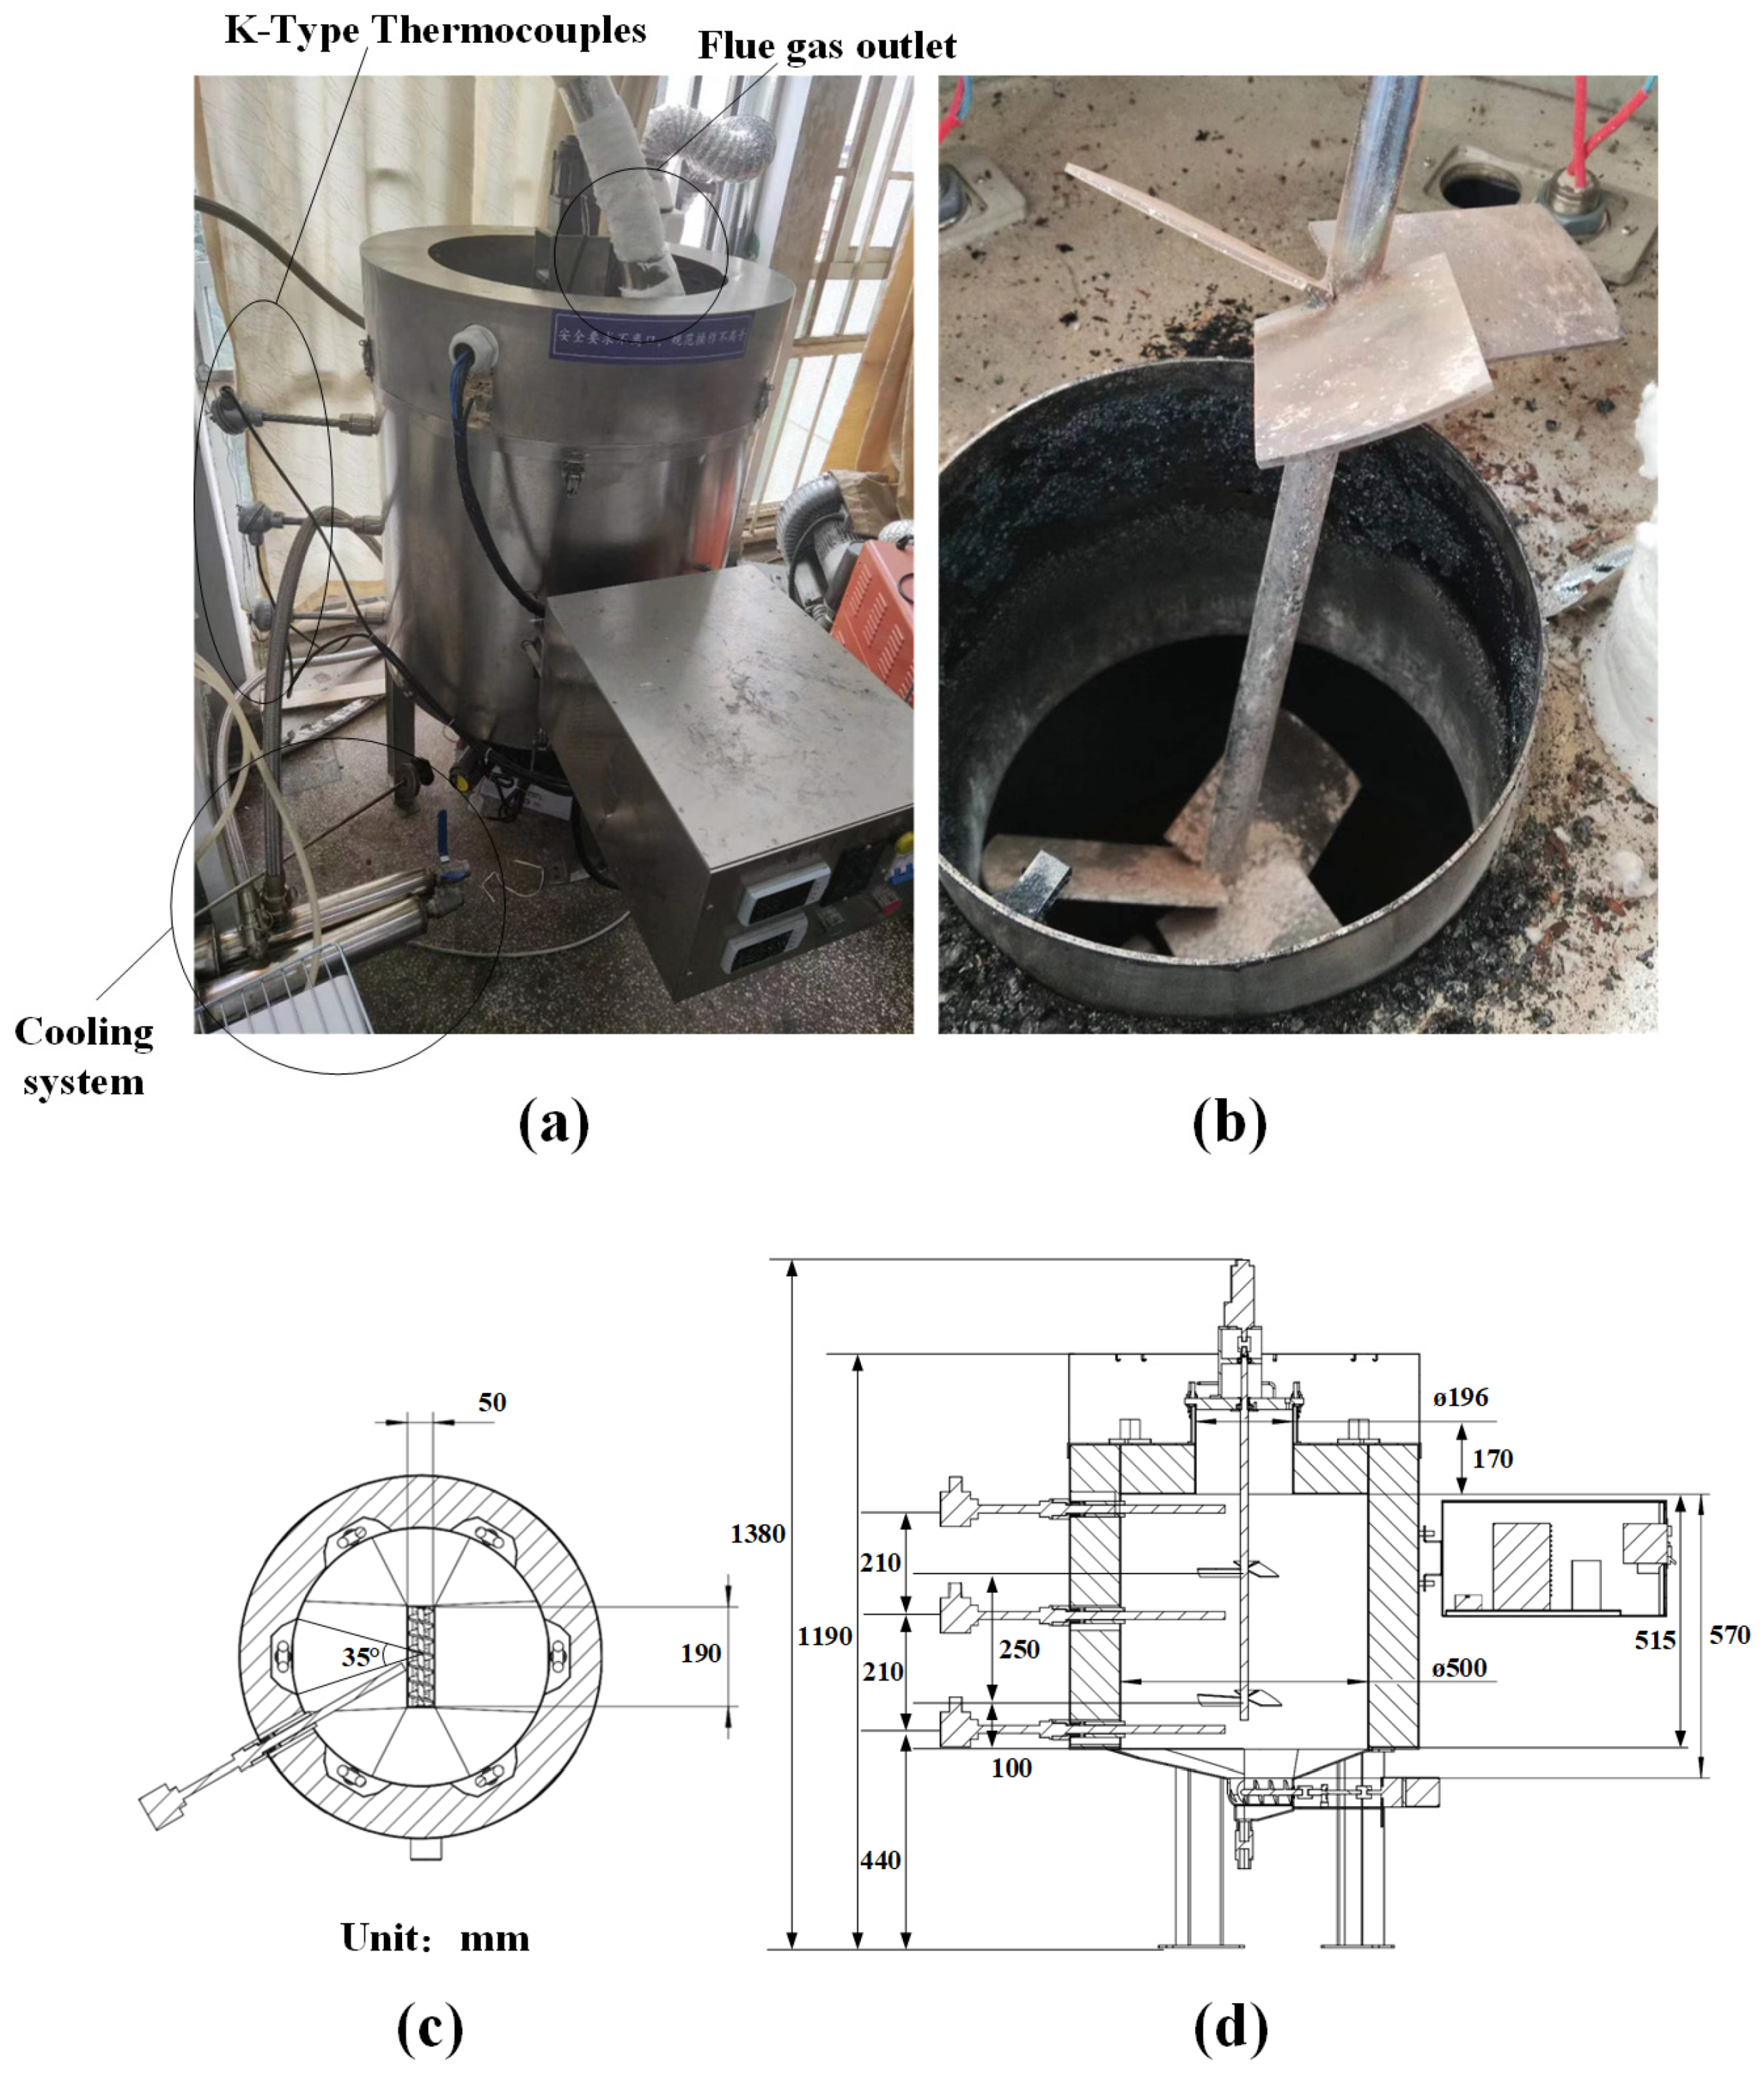
Figure 1: Schematic and dimensional details of the experimental setup. (a) Pyrolysis furnace; (b) Impellers; (c) Top view; (d) Side view.
3 Physical Model and Numerical Methods
The physical model used for calculations has undergone simplification based on the experimental platform. Geometric modeling was performed using the commercial CAD software Solidworks, and the simplified physical model is depicted in Fig. 2. This model comprises two cylinders with radii of 500 mm and 196 mm, and heights of 515 mm and 170 mm, respectively. The internal three-bladed impeller is dimensionally consistent with the physical model. Near the impeller, two regions were created with diameters of 300 mm and heights of 100 mm for establishing rotating zones. All geometric entities underwent Boolean operations; the impeller shaft and impeller regions were removed, while the two rotating zones were retained, resulting in three geometric entities.
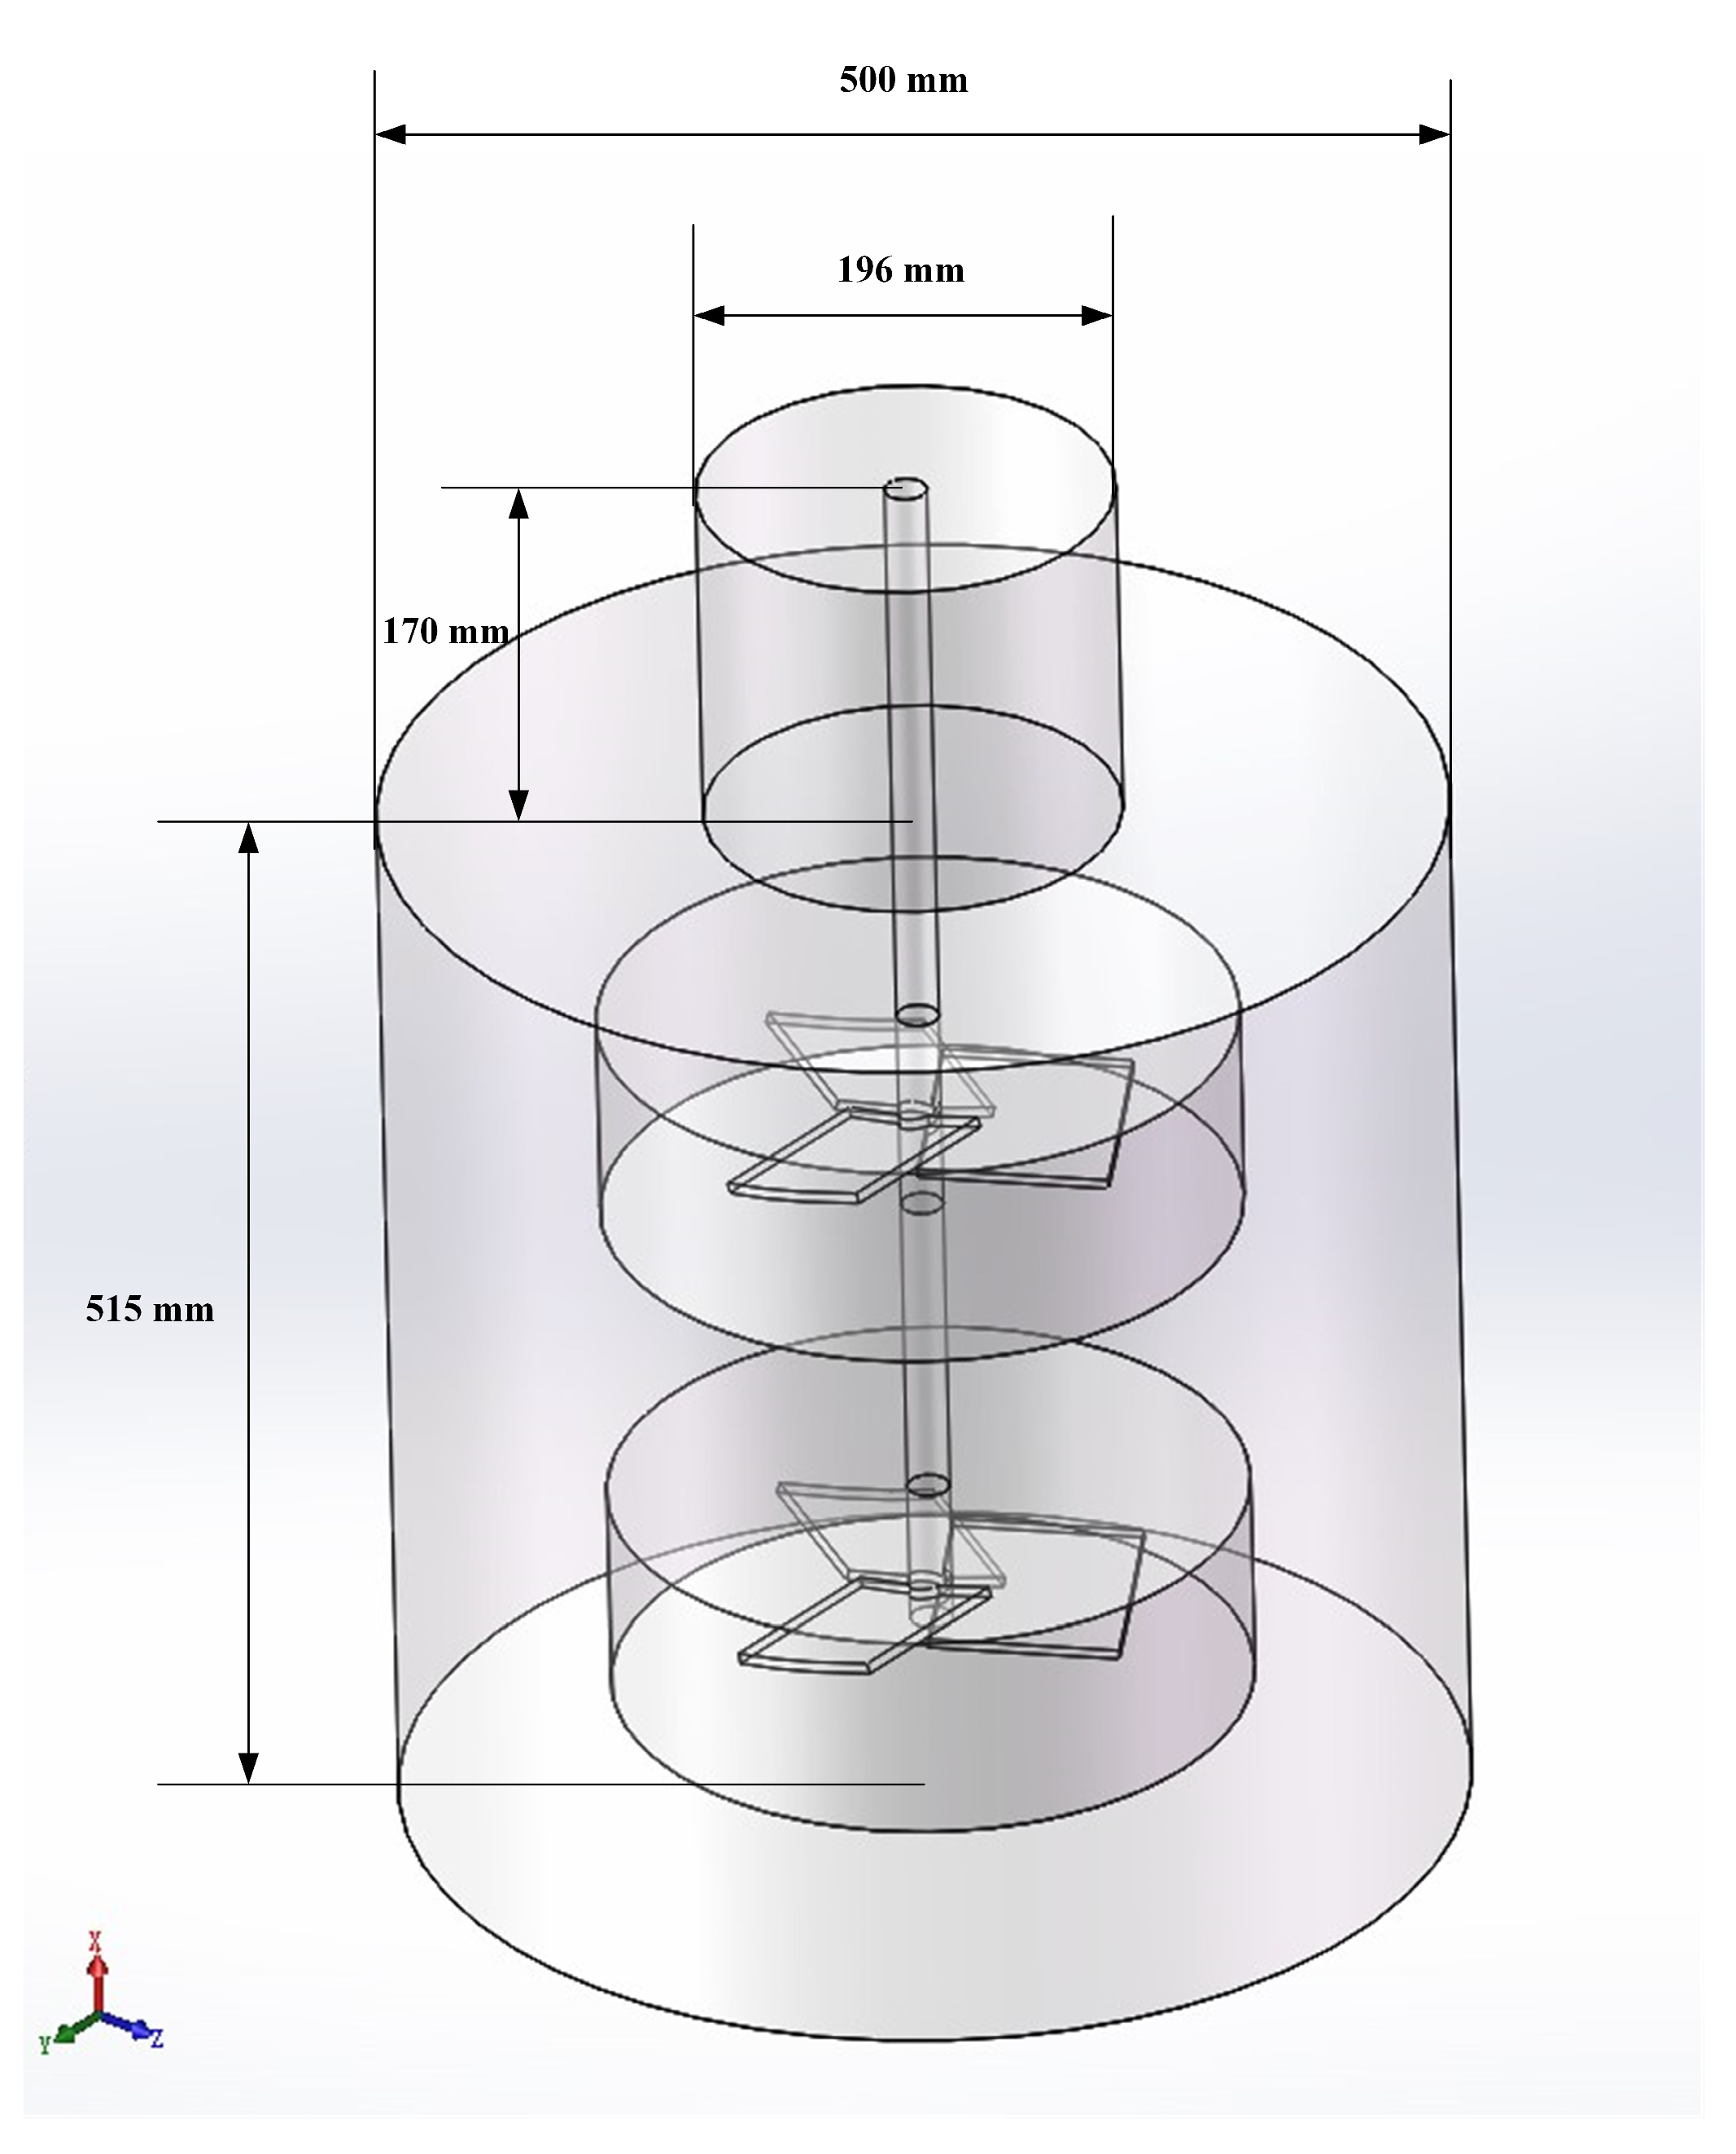
Figure 2: Physical model used for computation.
The flow within the pyrolysis furnace is assumed to be three-dimensional and incompressible turbulent flow. The fluid medium for flow and heat transfer within the fluid domain is air, and the thermal properties of the fluid (including specific heat Cp = 1006.63 J/(kg·K), thermal conductivity λ = 0.026 W/(m·K), dynamic viscosity μ = 1.86 × 10⁻⁵ Pa·s) are considered constant, with the exception of density, which varies with temperature as determined by the Boussinesq approximation [19]. This approximation is primarily employed in the analysis of thermal convection and buoyancy-driven convection. It more effectively captures the natural convection effects driven by thermal buoyancy. In this study, we use the commercial computational fluid dynamics software ANSYS Fluent as the solver.
In this study, the flow was mainly caused by impeller rotation and natural convection. Flow within the furnace is dominated by turbulence. By reference to the Re number calculation method proposed by Wang and Yu [20] which is applicable to stirred kettles, the flow induced by stirring is a turbulent flow regime. Natural convection uses the range of Rayleigh numbers considered to be 2.1 × 10¹⁰ < Ra < 6.4 × 10¹⁰, Ra > 1010, and natural convection can be considered to be a fully turbulent flow regime.
The governing equations for the fluid flow region with the Boussinesq approximation are as follows Eqs. (4)–(8) [21]:
Continuity equation:
For incompressible flow, with the density cancelled, the equation reduces to:
Momentum equation:
For incompressible flow, with the density cancelled, the equation reduces to:
Energy equation:
The RNG model takes into account small-scale effects, including explicitly calculated isotropic coefficients [22]. In this study, the more pronounced flows within the furnace were turbulent flow and rotational flow. Therefore, the hybrid turbulent RNG k-ε model is most suitable for turbulent simulations in this work [9,10]. The turbulent kinetic energy equation and the turbulent dissipation rate equation are expressed as follows Eqs. (9)–(12), the details of these equations can be found in the Ref [23]:
Turbulent kinetic energy (k):
For incompressible flow, with the density cancelled, the equation reduces to:
Dissipation rate (ε):
For incompressible flow, with the density cancelled, the equation reduces to:
3.3 Boundary Conditions and Computational Methods
Fig. 3 illustrates the boundary condition settings for the geometric entities. The blue regions denote adiabatic surfaces, while the red regions represent isothermal surfaces. The lateral surface of the large cylinder is subdivided into 12 zones, with this partitioning derived from the arrangement of heating rods within the experimental apparatus. The angles between adjacent zones are 35° (heating surfaces) and 25° (adiabatic surfaces). The heat transfer process between the heating surface and the heater is simplified as an isothermal wall. The white regions denote the impeller and impeller shaft, with relative motion within the flow field achieved through the Multiple Reference Frame (MRF) and Moving Wall Method [24].
The governing equations in the fluid domain are solved using the finite volume method. The SIMPLEC algorithm is used for the coupling of velocity and pressure. The pressure discretization scheme is based on the PRESTO method. Second order upwind space discretization is used for momentum, turbulent kinetic energy and turbulent energy dissipation rate equations. The numerical convergence criterion for all equations is 1 × 10⁻⁴. The time step is set to 0.001 s, and the maximum number of iteration steps for each time step is 50, and the total simulation time is 170 s. The calculation results are saved once per second for subsequent data processing.
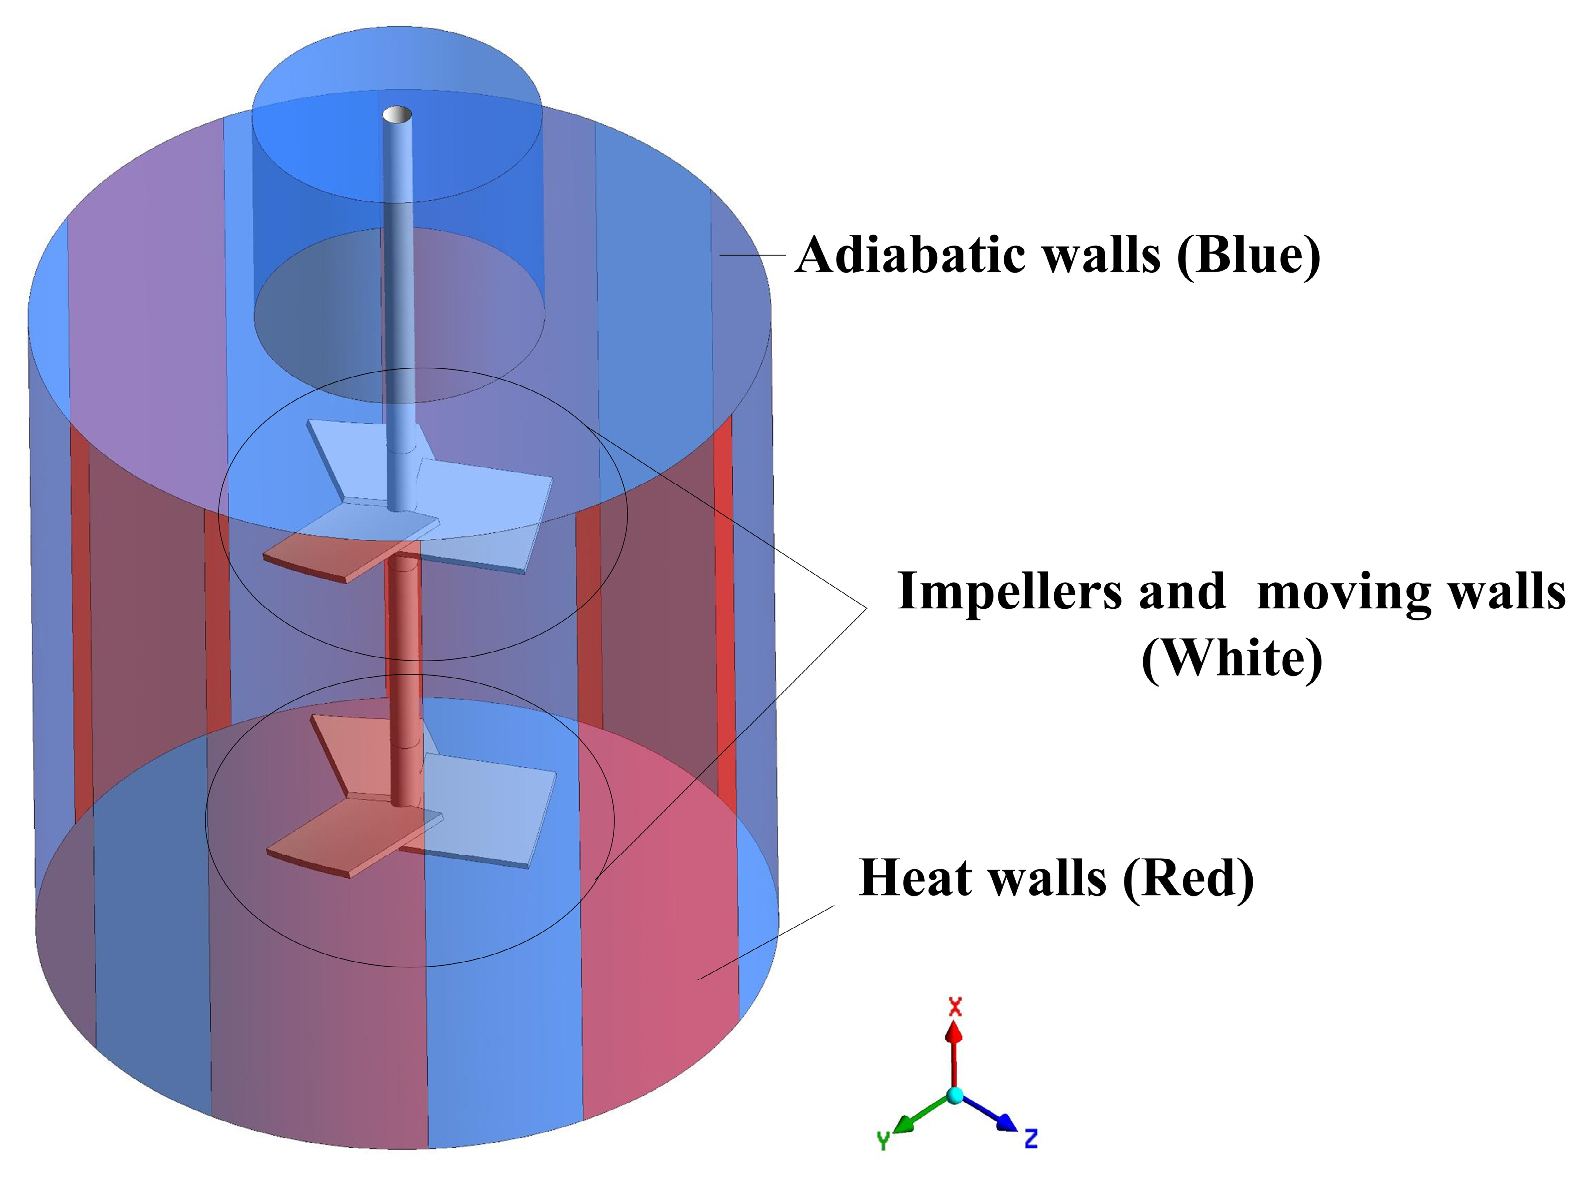
Figure 3: Computational domain and boundary conditions.
3.4 Grid Generation and Independence Test
For the cylindrical stirred pyrolyzer, the addition of two three-bladed impellers inside the pyrolyzer results in a complex geometry in the fluid domain. For complex geometric models, polyhedral meshing can reduce the number of meshes and save computational resources while ensuring the computational accuracy. Fig. 4 shows the polyhedral mesh generated by Fluent meshing, the mesh sizes of the impeller surface are encrypted, and 12 layers of boundary layer mesh are generated to ensure the computational accuracy on the wall surface where the velocity or temperature gradient changes drastically.
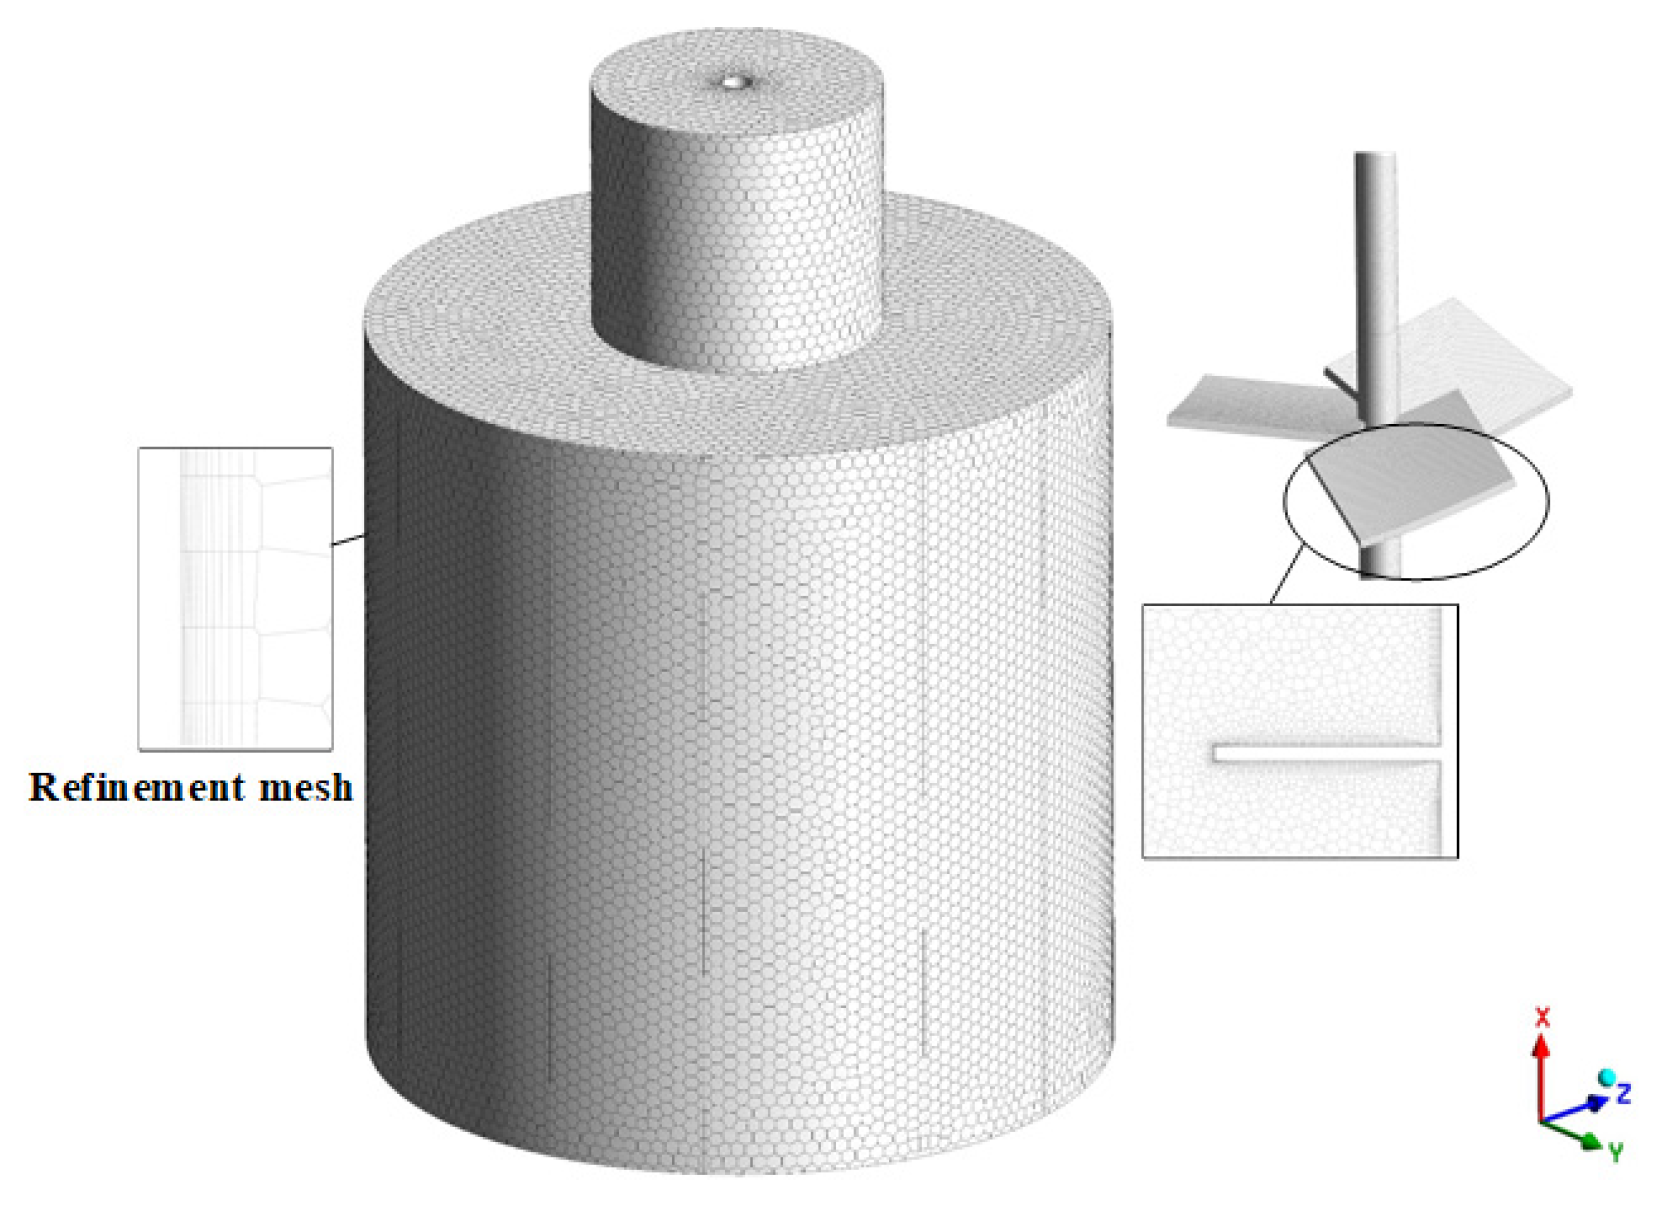
Figure 4: Polyhedral unstructured grid system.
Prior to the present numerical investigations, mesh independence tests were conducted for an impeller rotational speed of 120 RPM with air as the working fluid. Three mesh systems were selected: coarse (1,098,551), medium (1,895,376), and fine (3,452,923) meshes for three-dimensional steady-state numerical simulations. Upon obtaining converged numerical results, identical reference locations were selected across the three mesh sets to monitor pressure and local velocity, thereby verifying mesh independence. The reference position was a straight line at coordinates x = 0.15 m, z = 0 m, y = −0.25 m to 0.25 m. The local Y-velocity component (as shown in Fig. 5a) and dynamic pressure distribution (as shown in Fig. 5b) were extracted respectively. When the number of grid cells increased from 1,098,551 to 1,895,376, significant computational discrepancies were observed. However, when the grid size expanded from 1,895,376 to 3,452,923 cells, the calculated Y-velocity components and local pressure distributions exhibited negligible differences.
A mesh independence test was conducted under identical conditions for three-dimensional transient numerical simulations. Following the acquisition of transient results, the average temperature variation curves within the furnace were extracted for three distinct mesh sets (as shown in Fig. 5c). When the mesh size was 1,098,551, the computational results differed considerably from the other results. However, when the mesh size increased from 1,895,376 to 3,452,923, the differences in the calculated average temperature variation within the furnace were negligible. Through computations using ANSYS Fluent, the reliability of the numerical simulation method was validated under identical operating conditions to those employed by other researchers. The observed discrepancies in results stemmed from differing boundary conditions, whilst the simulation outcomes demonstrated good agreement with findings from other studies.
To ensure computational accuracy and conserve computational resources, the mesh system with 1,895,376 cells was adopted for subsequent numerical simulations in this study.
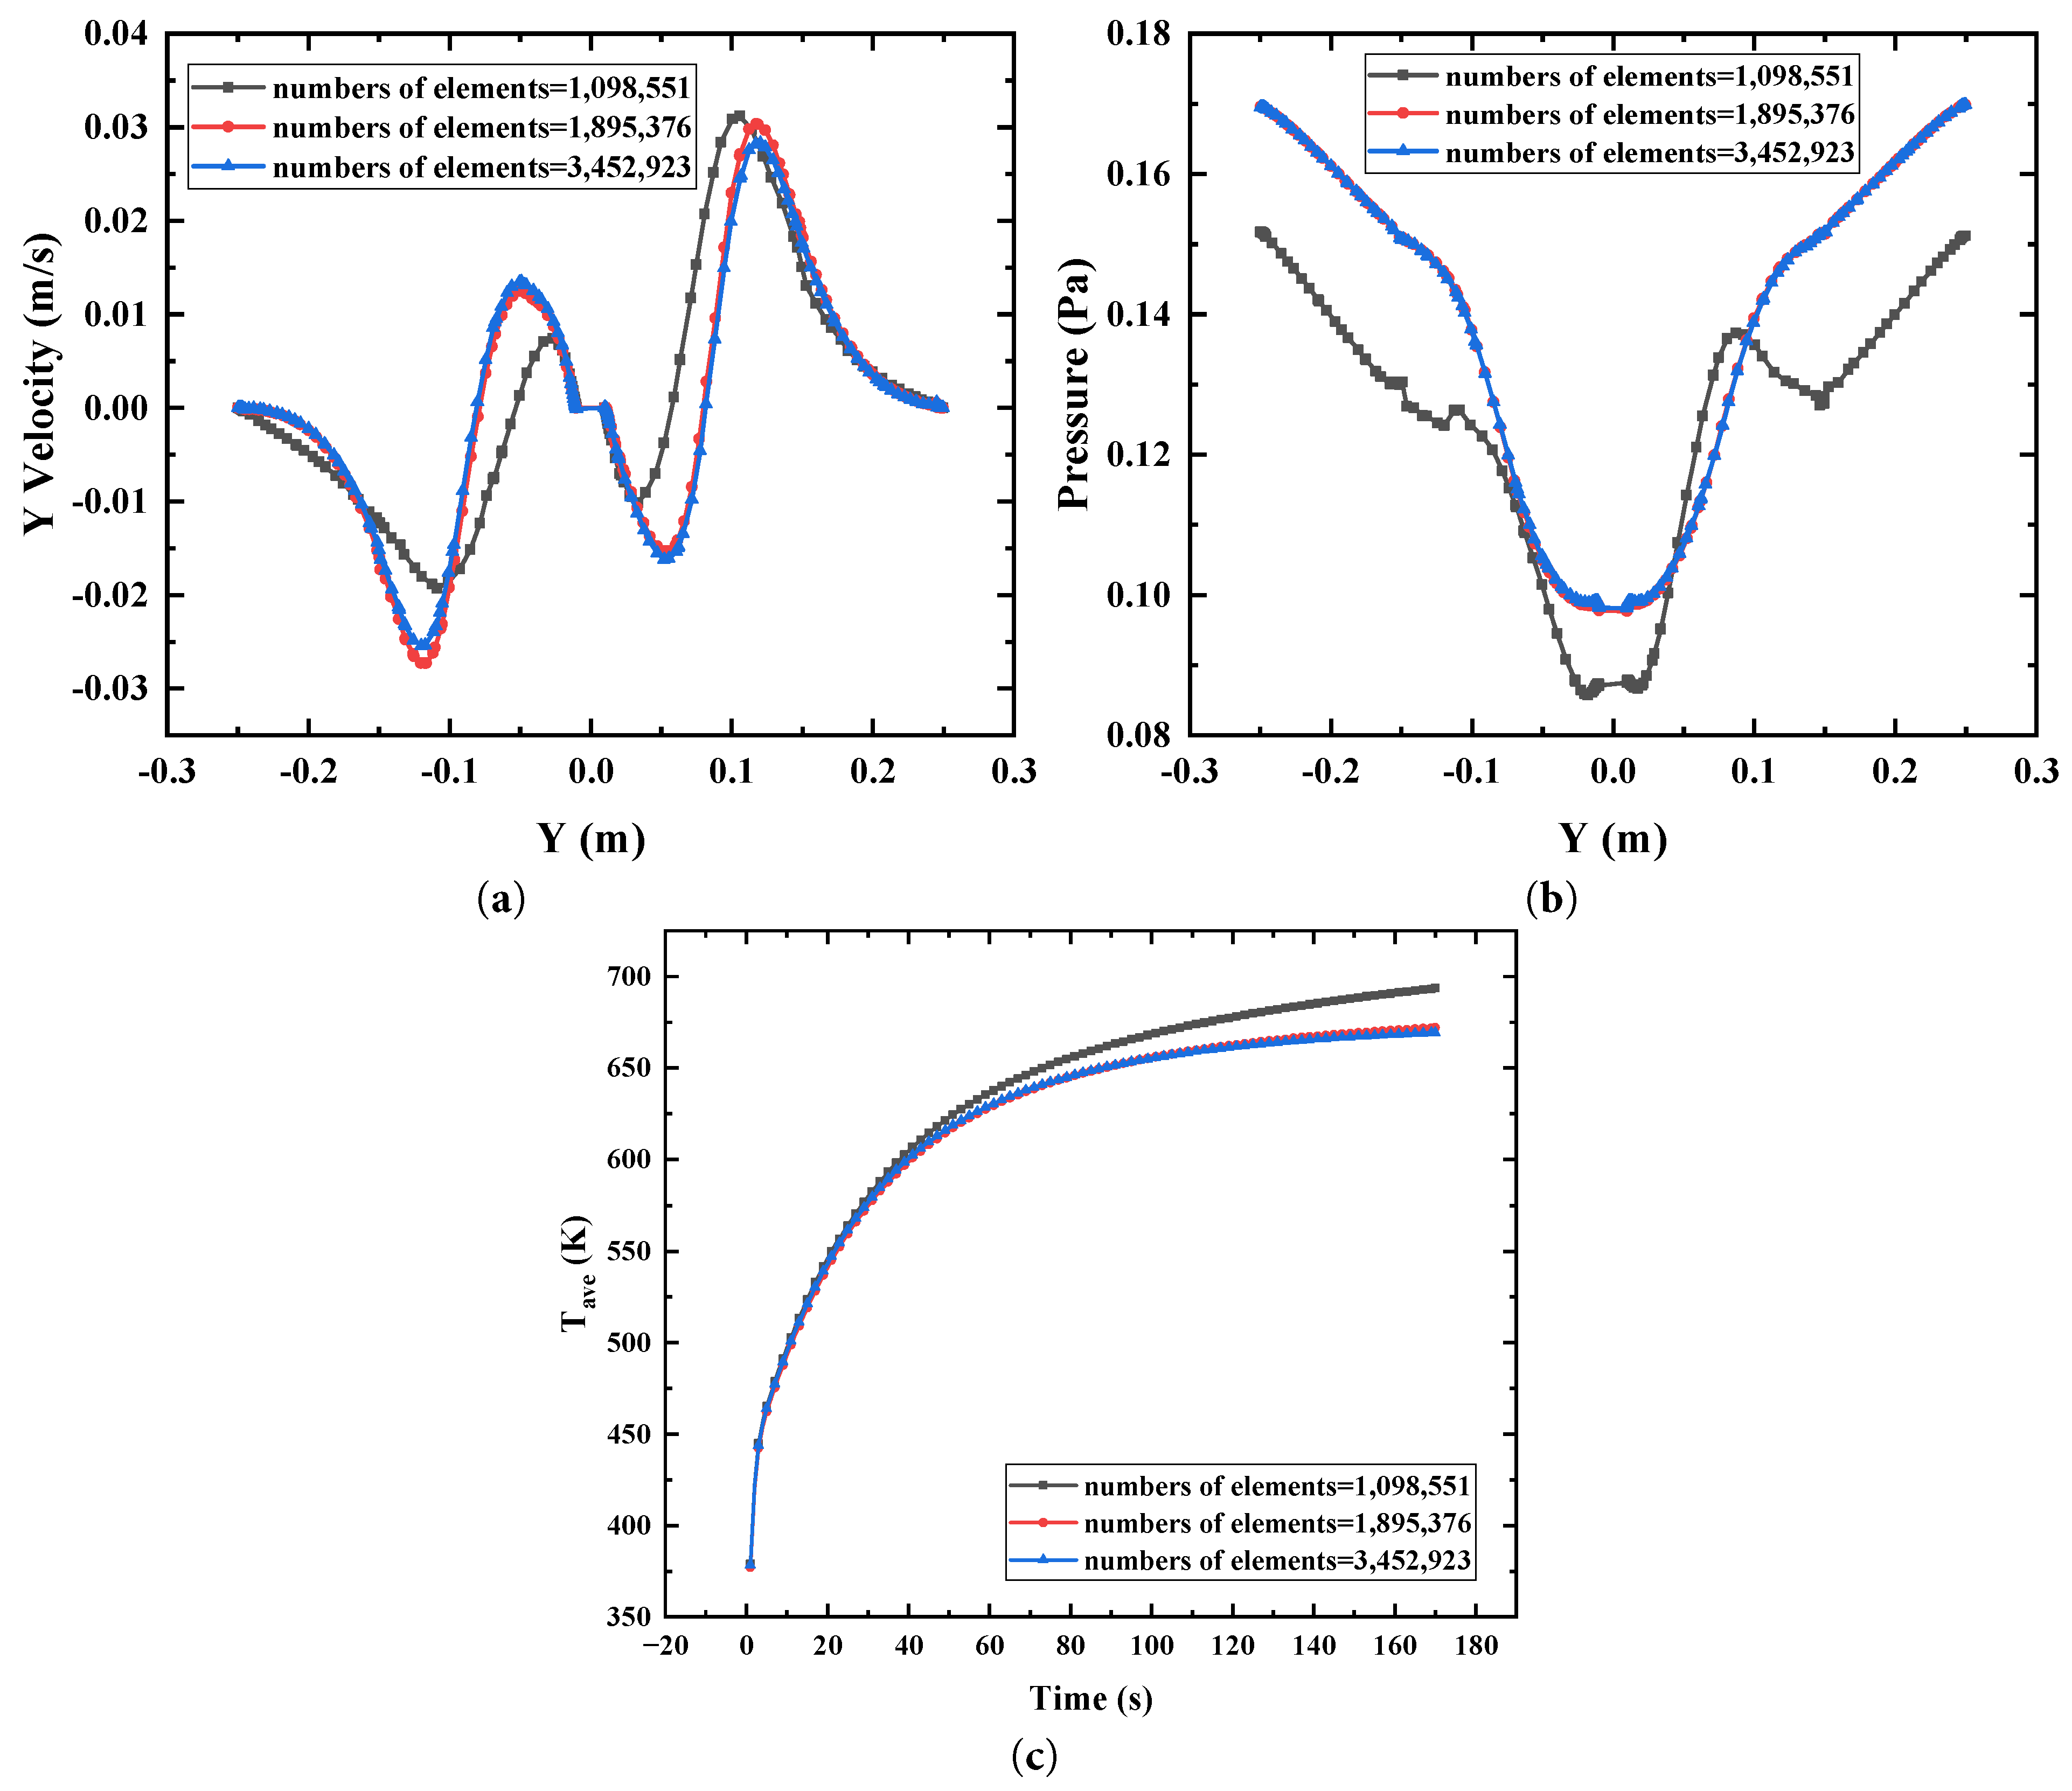
Figure 5: Verification of grid independence. (a) Local Y velocity components; (b) Local Y dynamic pressure distributions; (c) The average temperature variation curves within the furnace.
3.5 Experimental Verification of Temperature Rise Characteristics
This study focuses on the temperature rise characteristics within the furnace body. Three thermocouples were deployed to monitor the air temperature within the chamber, with these three monitoring points providing the basis for validating the numerical results. In the numerical simulation, temperatures were monitored at positions identical to those in the experimental setup to track changes over time, thereby verifying the accuracy of the numerical results. The validation was conducted under heating conditions of 673.15 K and an impeller rotational speed of 0 RPM. However, due to uneven furnace heating and natural convection effects during the experiment, the uneven distribution of the three thermocouples resulted in significant thermal stratification. Consequently, the validity of each temperature measurement point required separate verification. Fig. 6 presents a comparison between the temperatures measured at each point during the numerical simulation heating process to 673.15 K and the experimental results. The temperature values measured at the three thermocouple positions, from top to bottom, are labelled T1, T2, and T3 respectively. As the numerical simulation disregards heat dissipation from the furnace body to the surrounding environment, experimental data exhibits a pronounced lag compared to numerical results. This occurs because, with the impeller stationary, only natural convection effects exist with-in and outside the furnace body during the experiment. In the initial heating phase, heat loss to the external environment causes slower internal temperature rise. Consequently, experimental data exhibit a pronounced lag relative to numerical results during the initial 40 s of heating. Subsequently, as the ambient air temperature rises, the heat dissipation effect diminishes, reducing this lag in the experimental data. However, considering the overall heating trend, numerical simulation results demonstrate good agreement with experimental data. The temperature distribution also reflects the thermal stratification within the furnace caused by natural convection.
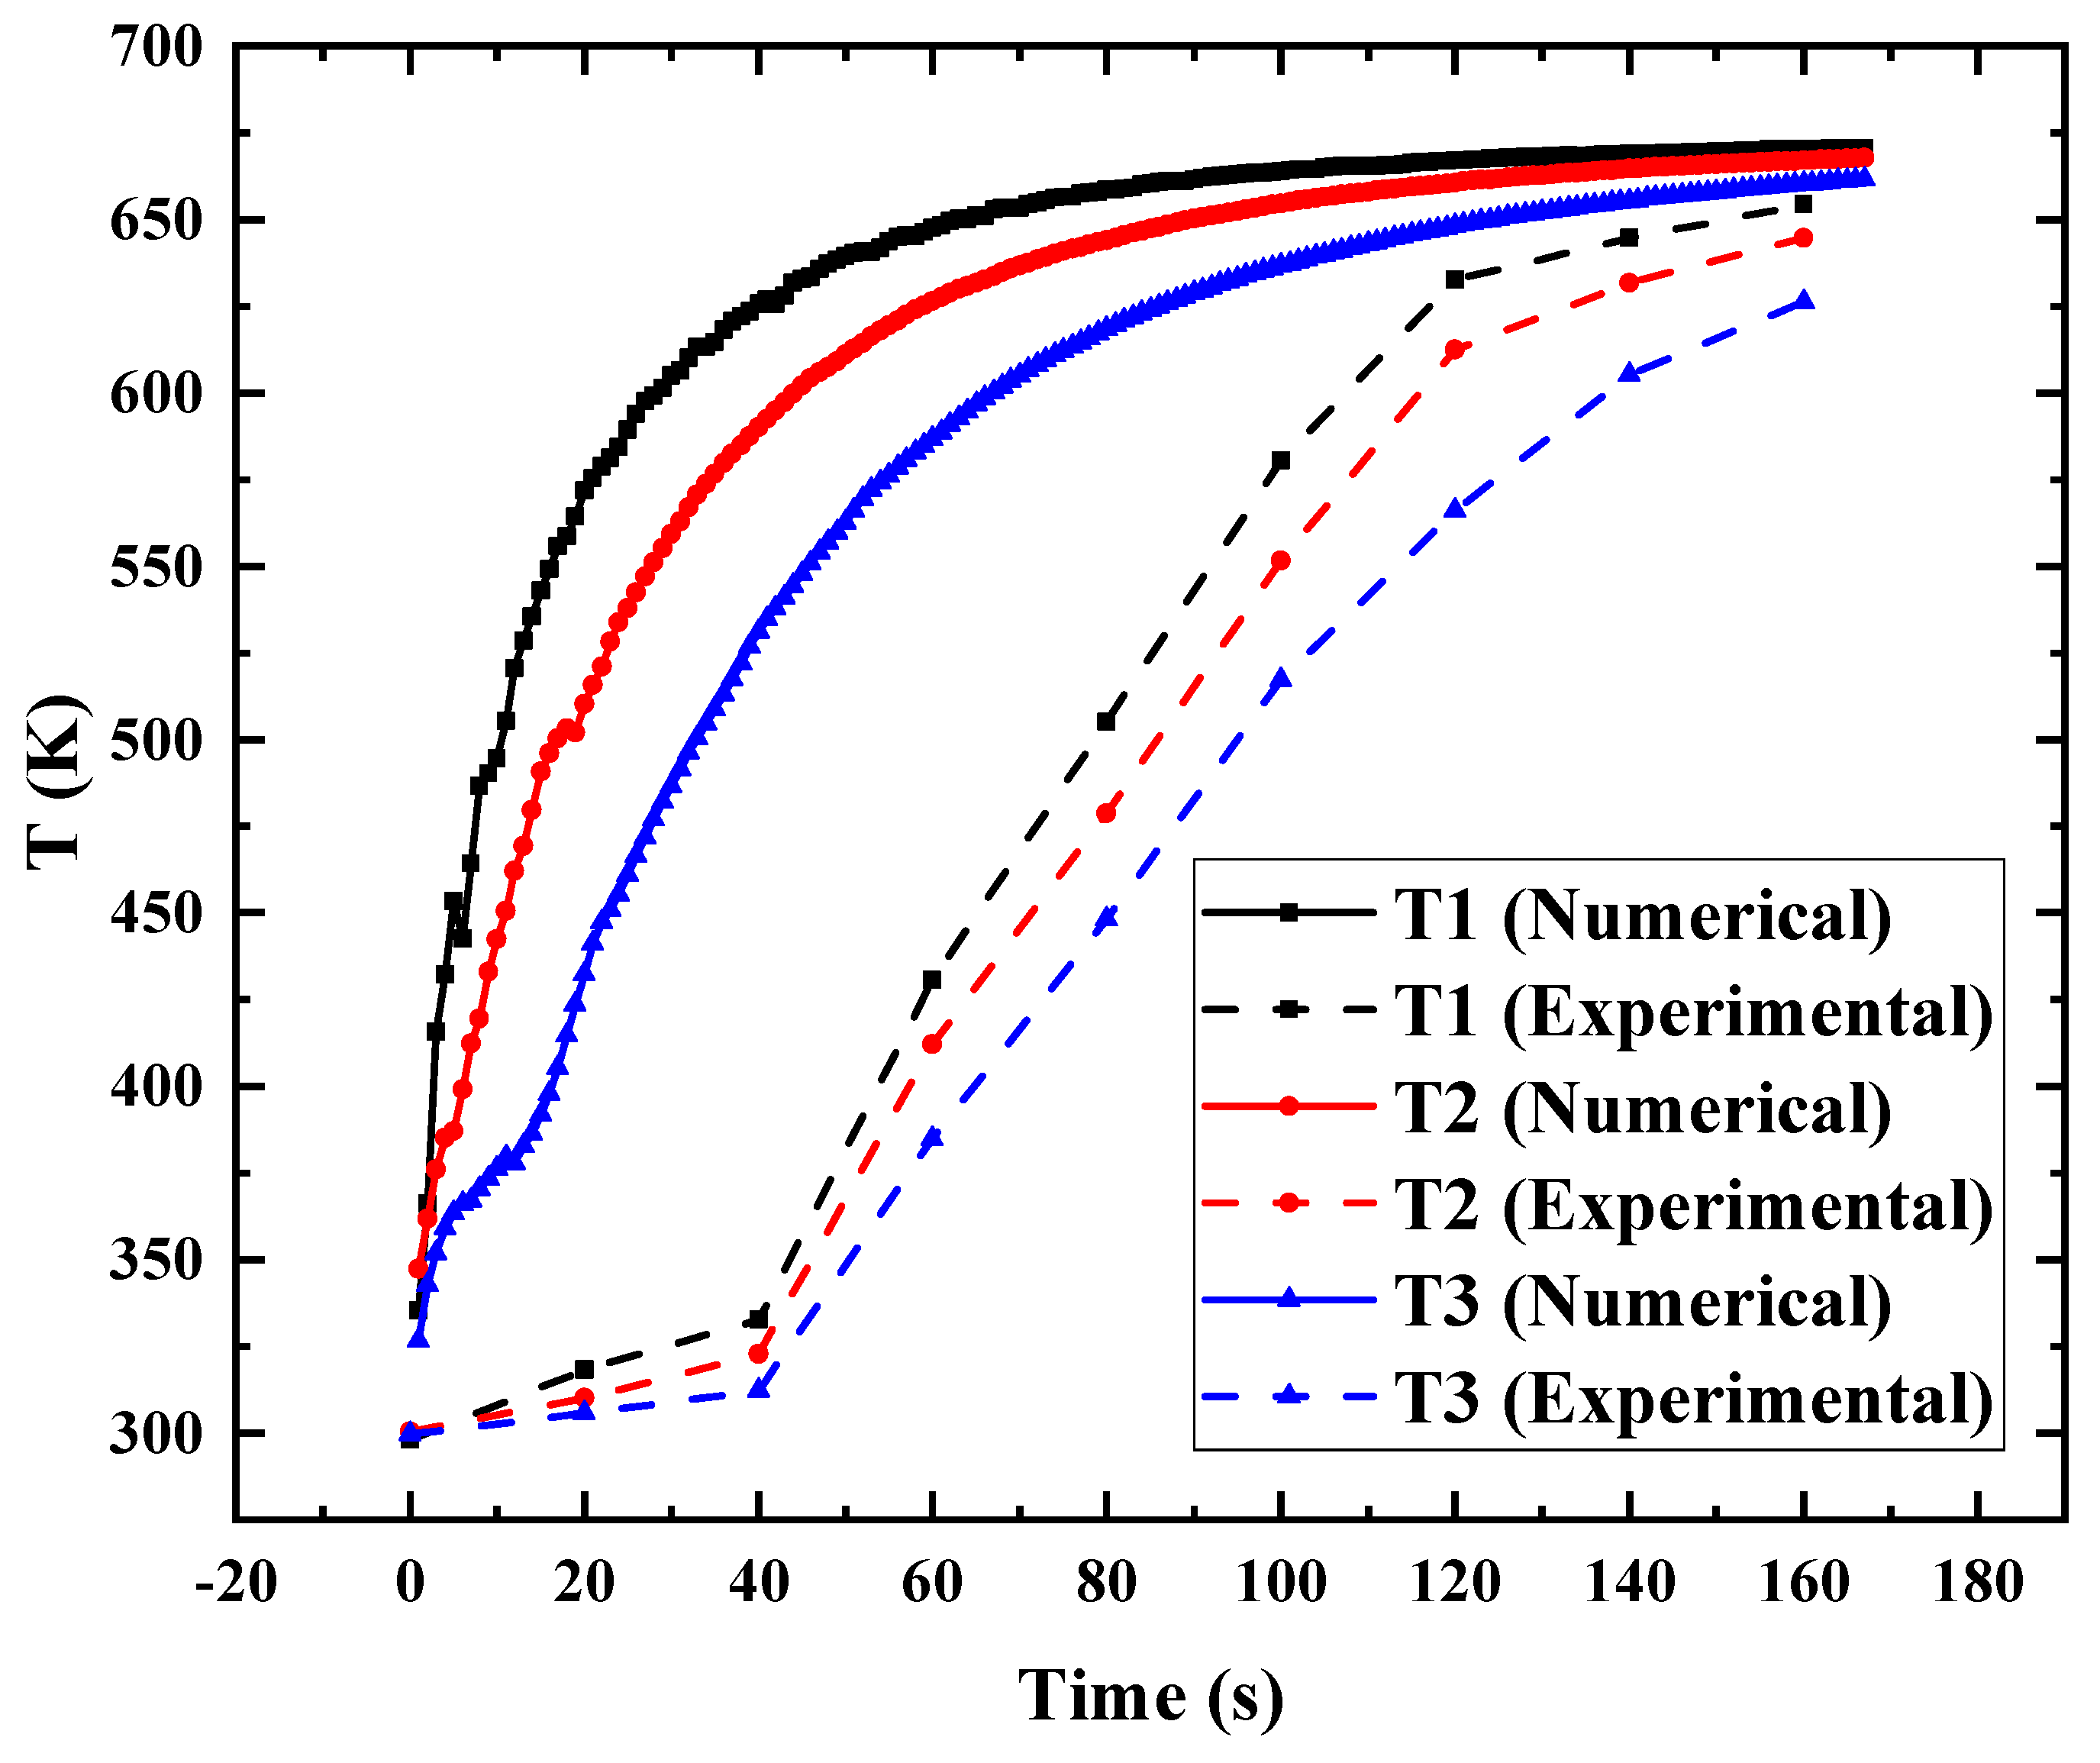
Figure 6: Validation of numerical results.
4.1 Fluid Temperature Rise Characteristics
Since the temperature of the fluid inside the furnace is not uniformly distributed, in order to analyze the overall heat transfer effect, the average temperature of the fluid inside the furnace is used as a reference to reflect the overall heat transfer effect within the furnace body. The heat balance between the fluid in the furnace and the wall temperature can be expressed as:
Fig. 7 shows the characteristics of the total body temperature rise within the furnace under different rotational speeds of the impeller, and the fluid temperature rise within the furnace shows a trend of first fast and then slow. At the beginning of heating, the rate of heat transfer is faster due to the larger temperature difference between the fluid and the wall, while the rate of heat transfer gradually decreases with the increase of the fluid temperature and the decrease of the temperature difference between the fluid and the wall. The rotational speed of the impeller in the furnace has an obvious strengthening effect on the heat transfer process, but this heat transfer strengthening effect is mainly concentrated in the first 60 s. After 60 s, the rotational speed of the impeller has a very weak influence on the heat transfer, but when the rotational speed of the impeller reaches 240 RPM, the overall performance of the heat transfer strengthening is enhanced more obviously, and the average temperature in the volumetric domain quickly reaches the set target temperature.
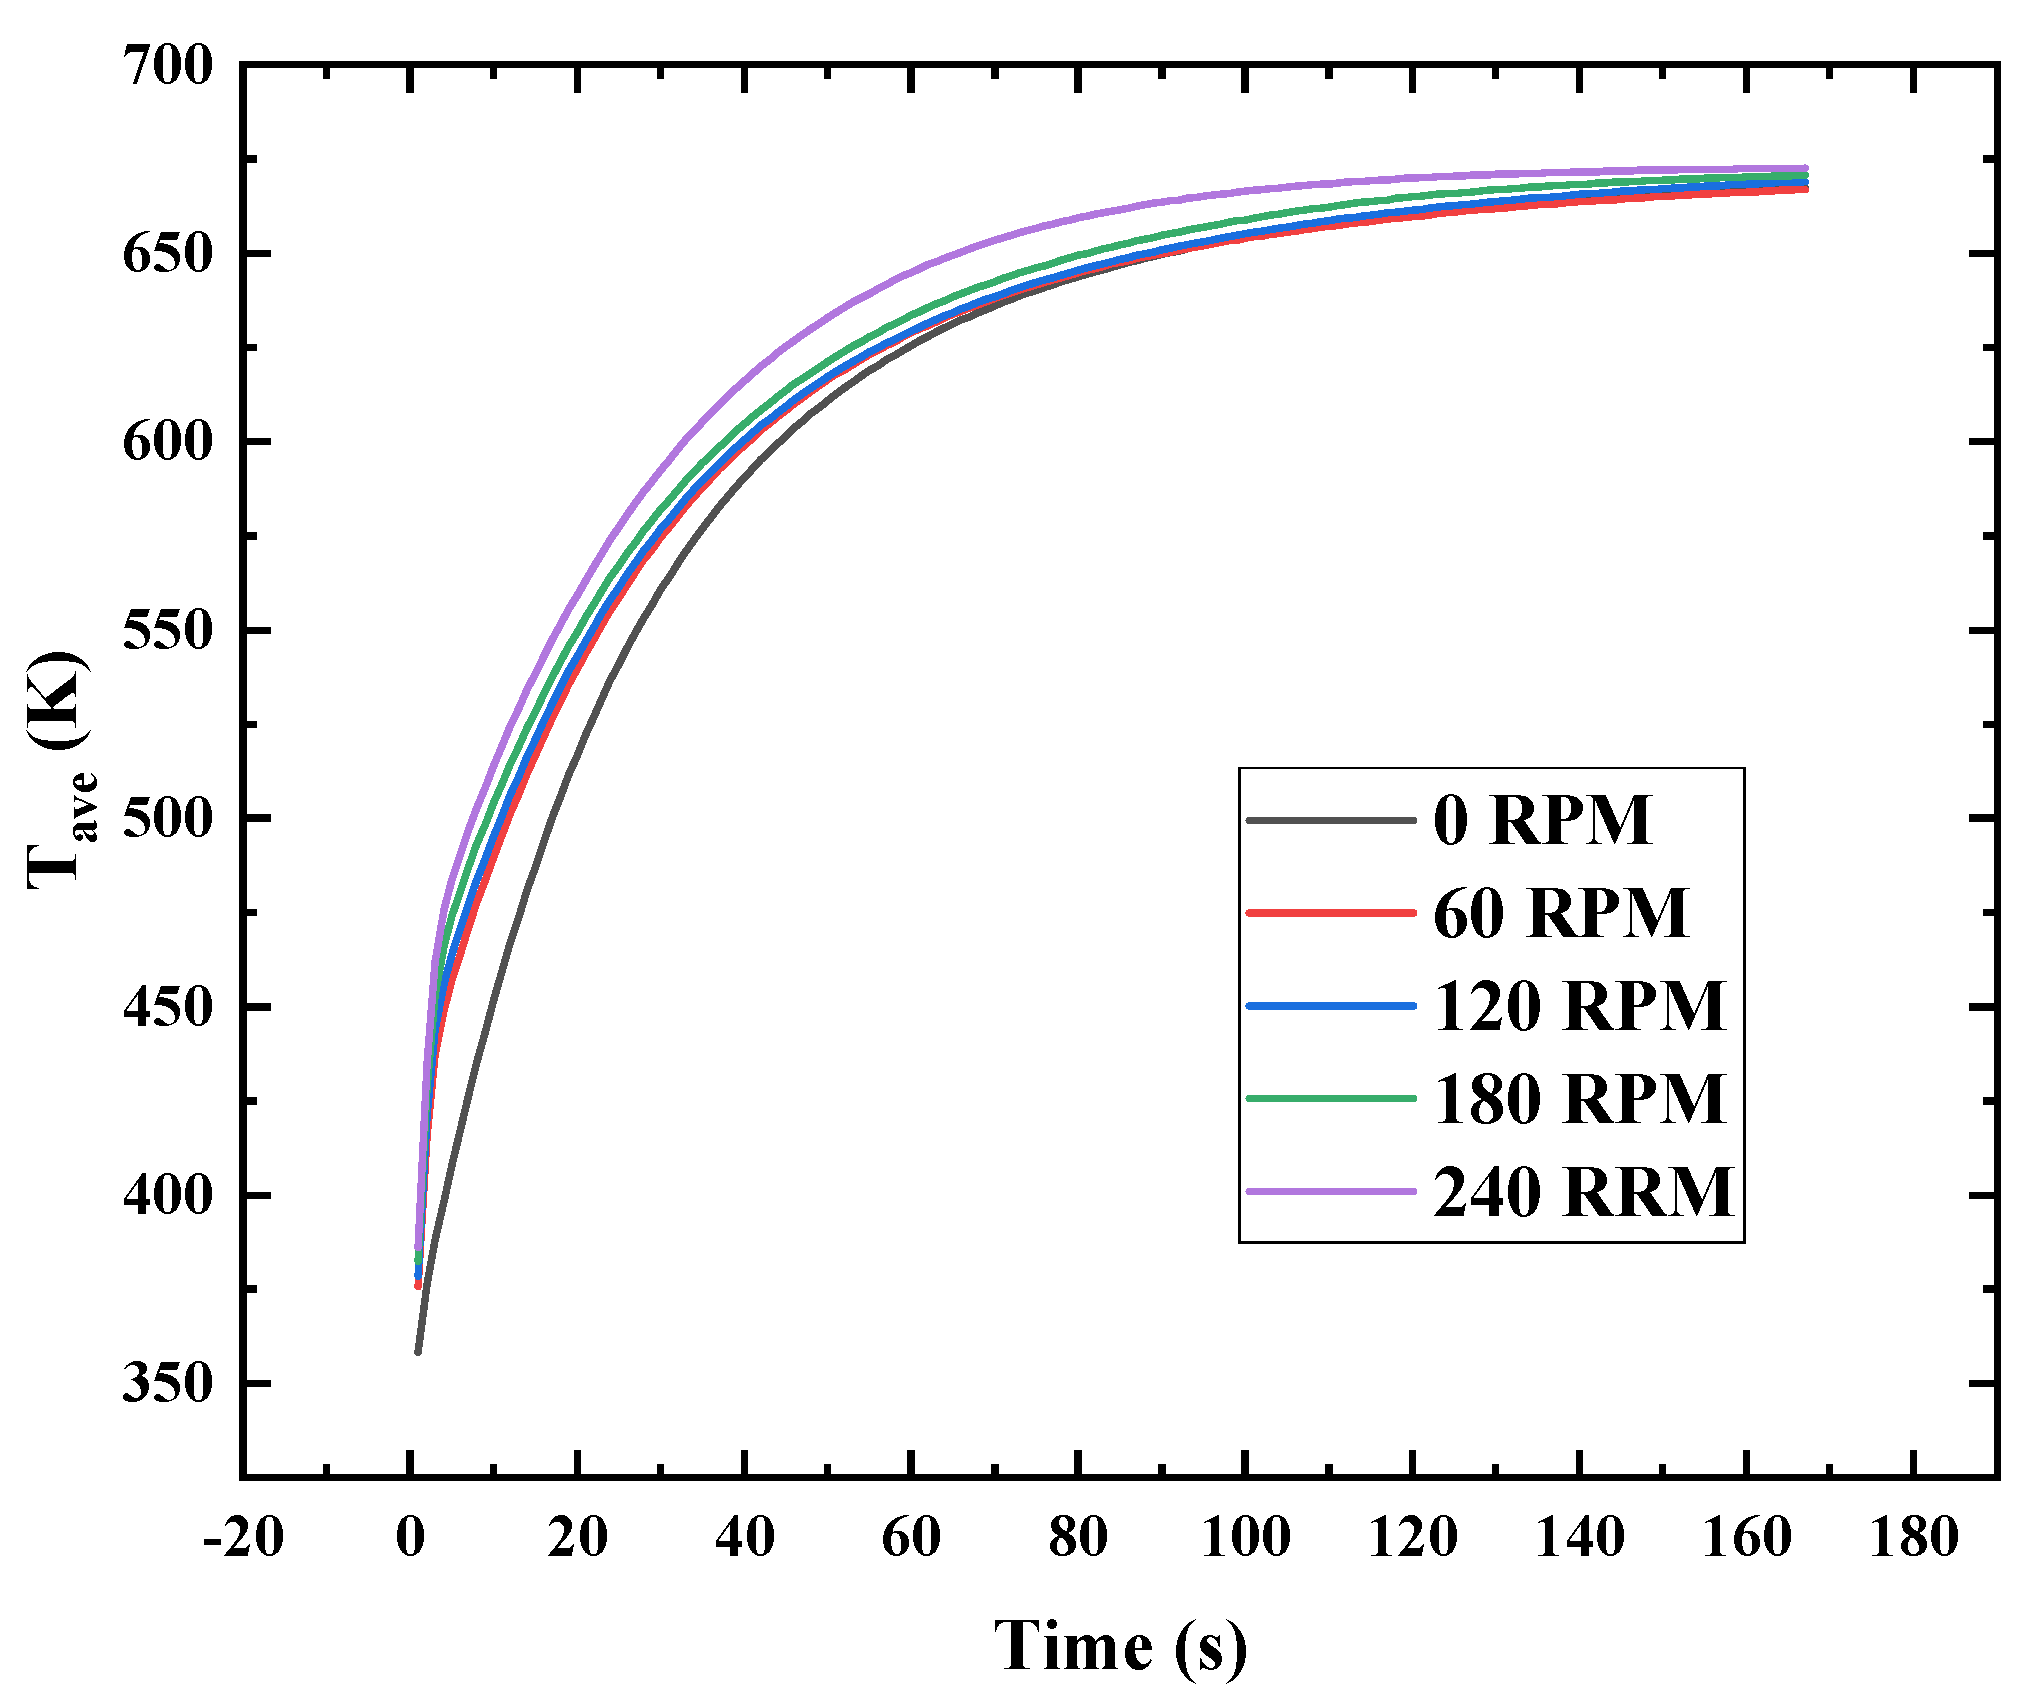
Figure 7: Temperature rise curves at different impeller rotational velocities.
Fig. 8 demonstrates the variation of heat transfer coefficient with time for different impeller velocities. Initially, a stable thermal boundary layer is not formed near the heated wall, and there is less thermal resistance between the heated wall and the fluid, so the heat transfer coefficient is significantly larger. For an impeller velocity of 60 RPM, the effect of impeller rotation on heat transfer in the furnace is very weak. When the impeller speed increases to 120–180 RPM, the heat transfer in the furnace is first dominated by the natural convection driven by the buoyancy force, and when the fluid temperature distribution in the furnace tends to be uniform, the forcing effect produced by the impeller rotation begins to significantly affect the heat transfer, increasing the heat transfer coefficient, the faster the rotational speed of the impeller, the faster it is able to make the heat transfer dominated by the forcible convection induced by the impeller rotation. For high impeller speed (240 RPM), the heat transfer coefficient tends to be constant throughout the steady heating process, and it can be assumed that the impeller rotation at this speed acts as a heat transfer enhancement for the heat transfer process.
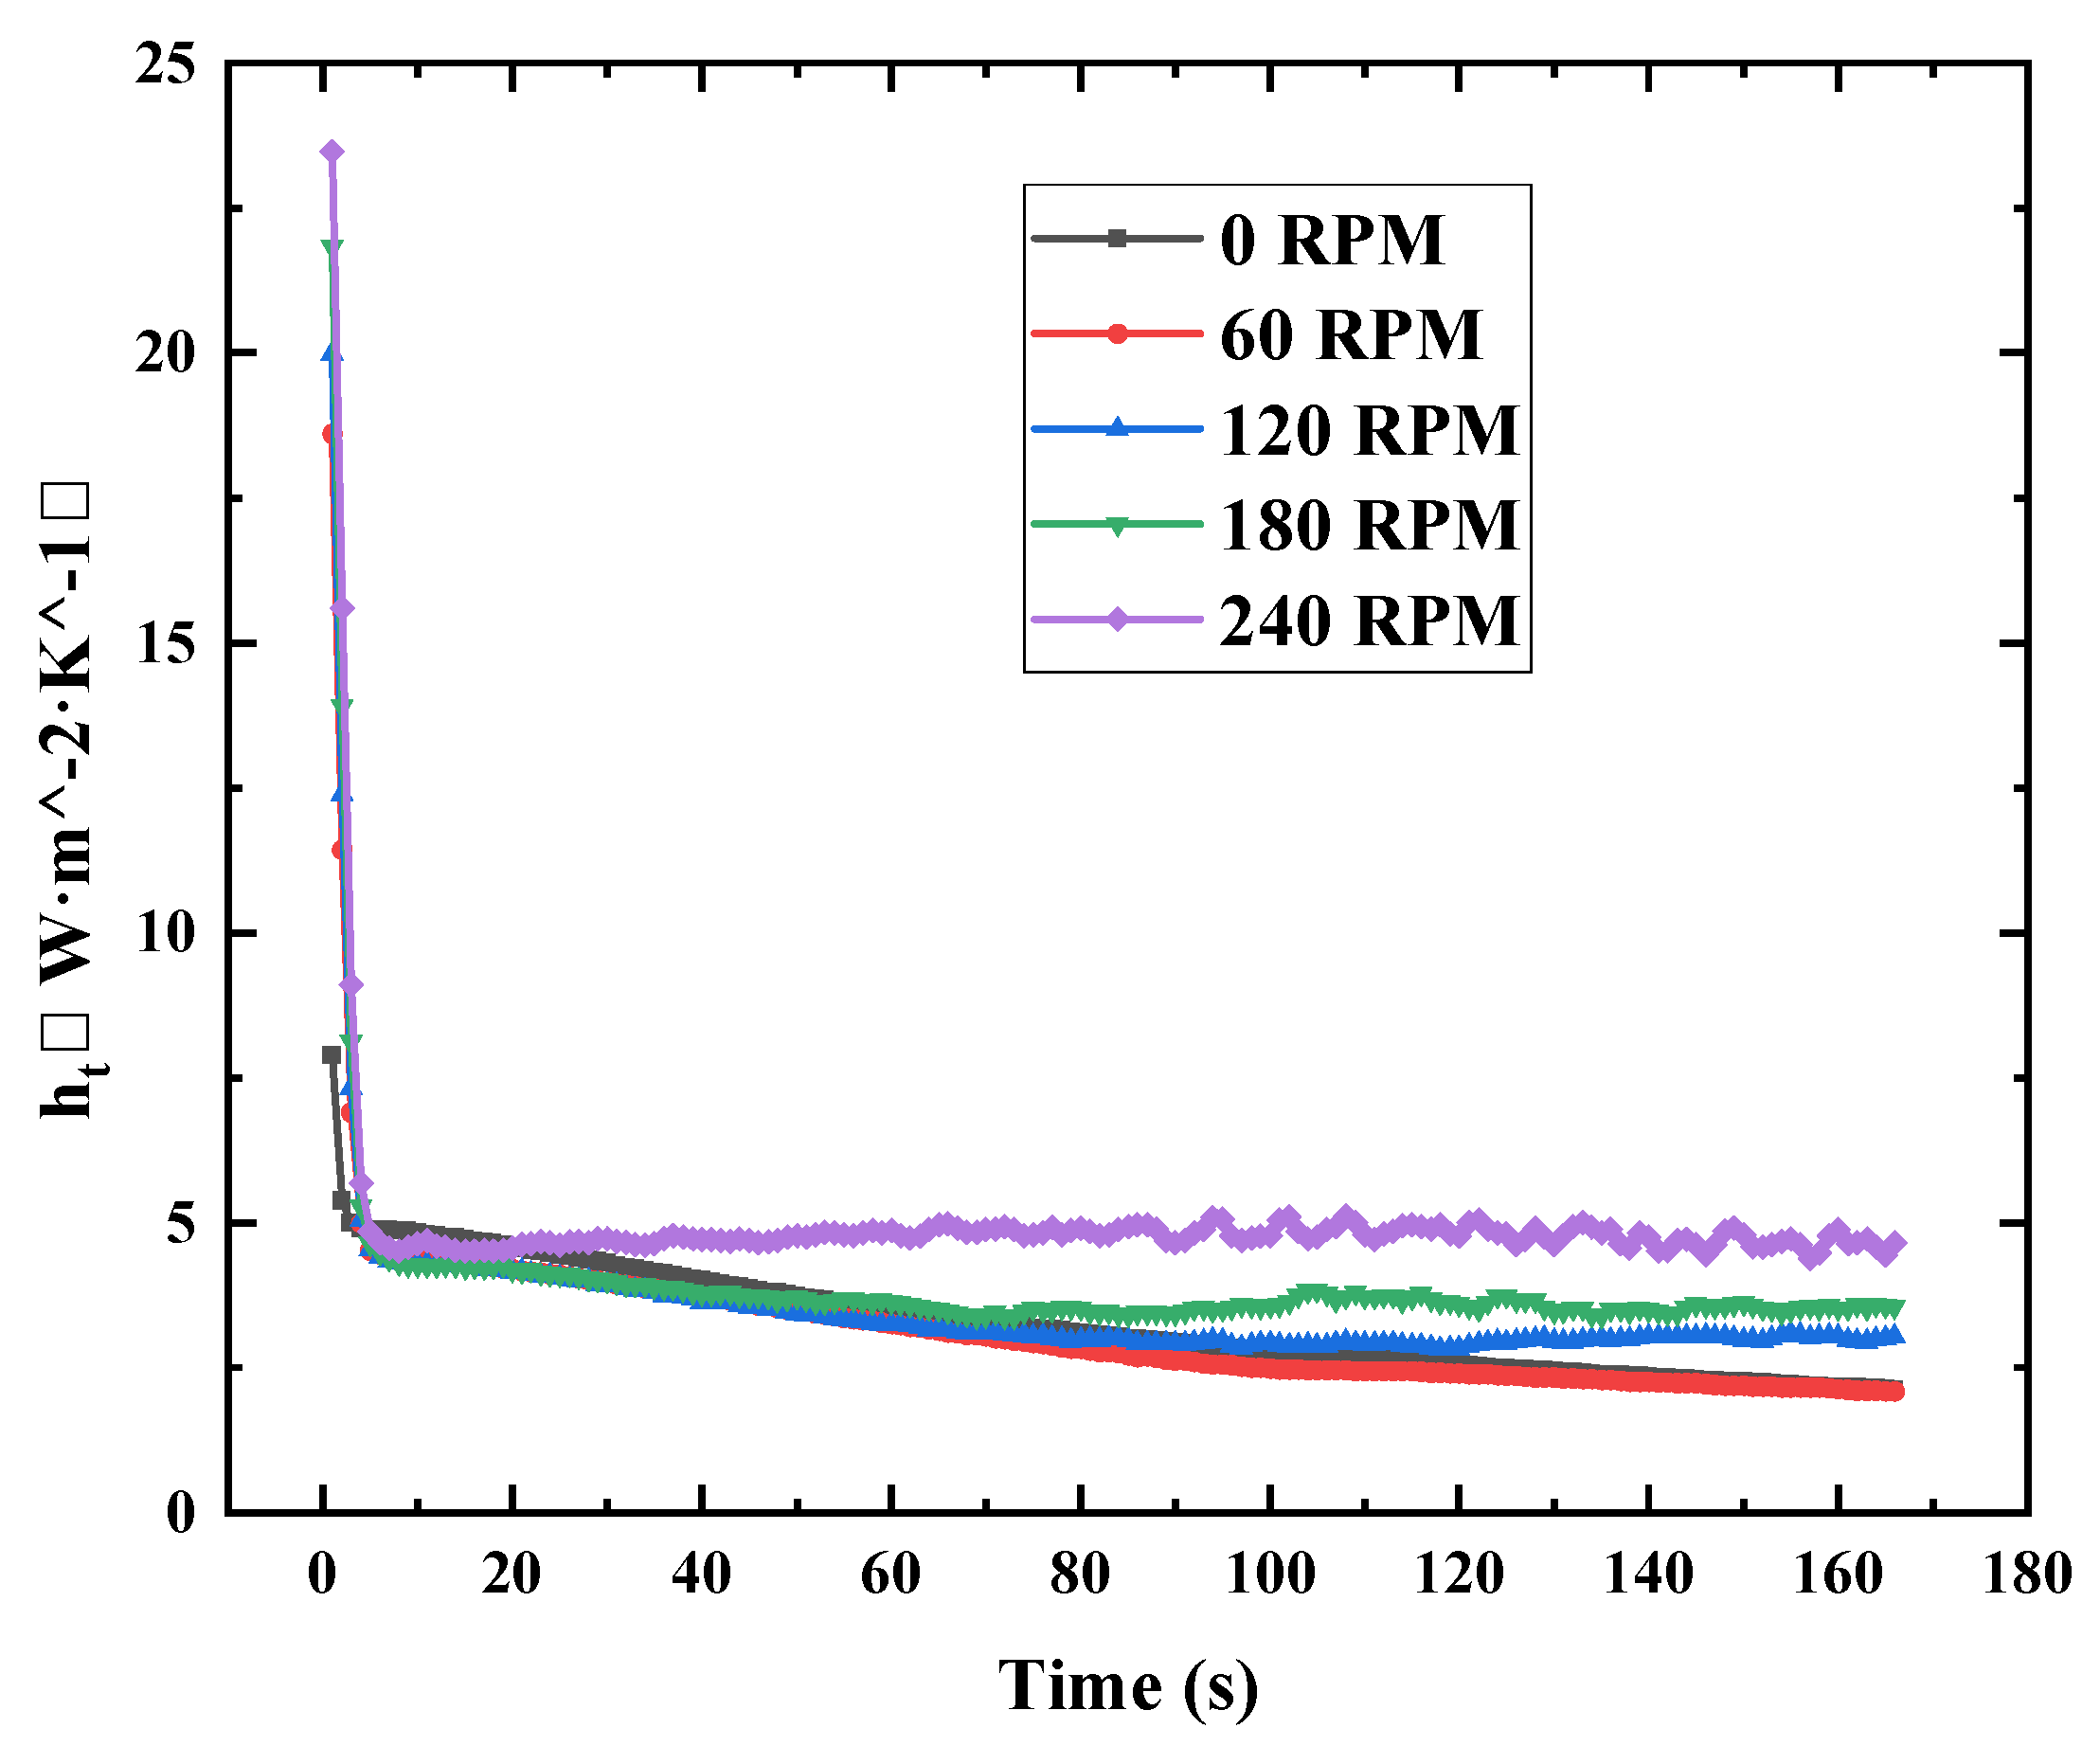
Figure 8: Variation of heat transfer coefficient (h) with time for different impeller rotational velocities.
4.2 Local Heat Transfer and Temperature Distribution
Fig. 9 illustrates the heat flux distribution across the heating wall surface when the impeller is stationary and rotating at 240 RPM. Over time, the heat flux intensity exhibits a decreasing trend. During the initial phase, the substantial temperature difference between the furnace fluid and the heated wall surface results in significantly elevated local heat flux intensities. This corresponds to the region where the slope of the furnace fluid temperature rise curve is maximal. At 30 s of heating duration, it can be observed that the heat flux intensity at the upper section of the heated wall is relatively low when the impeller speed within the furnace is 0 RPM. This distribution characteristic becomes increasingly pronounced as the heating time increases. This occurs because the heat transfer process within the furnace chamber is primarily governed by natural convection at this stage. Density differences in the heated fluid cause the high-temperature fluid to accumulate at the upper part of the furnace body due to thermal buoyancy. Consequently, the temperature difference between the fluid and the heating wall diminishes, resulting in poorer heat transfer efficiency at the upper section of the furnace. At an impeller speed of 240 RPM, the impeller rotation induces forced convection within the furnace. At 30 s, a uniform distribution of heat flux intensity is observed across the heating wall surface, with significantly higher heat flux intensities at the two corresponding impeller positions (X = 0.1 m and X = 0.35 m). Throughout the process, localised heat transfer at the heating wall is enhanced. The mixing effect generated by impeller rotation mitigates thermal stratification caused by thermal buoyancy, thereby promoting the mixing of fluids at different temperatures within the flow field.
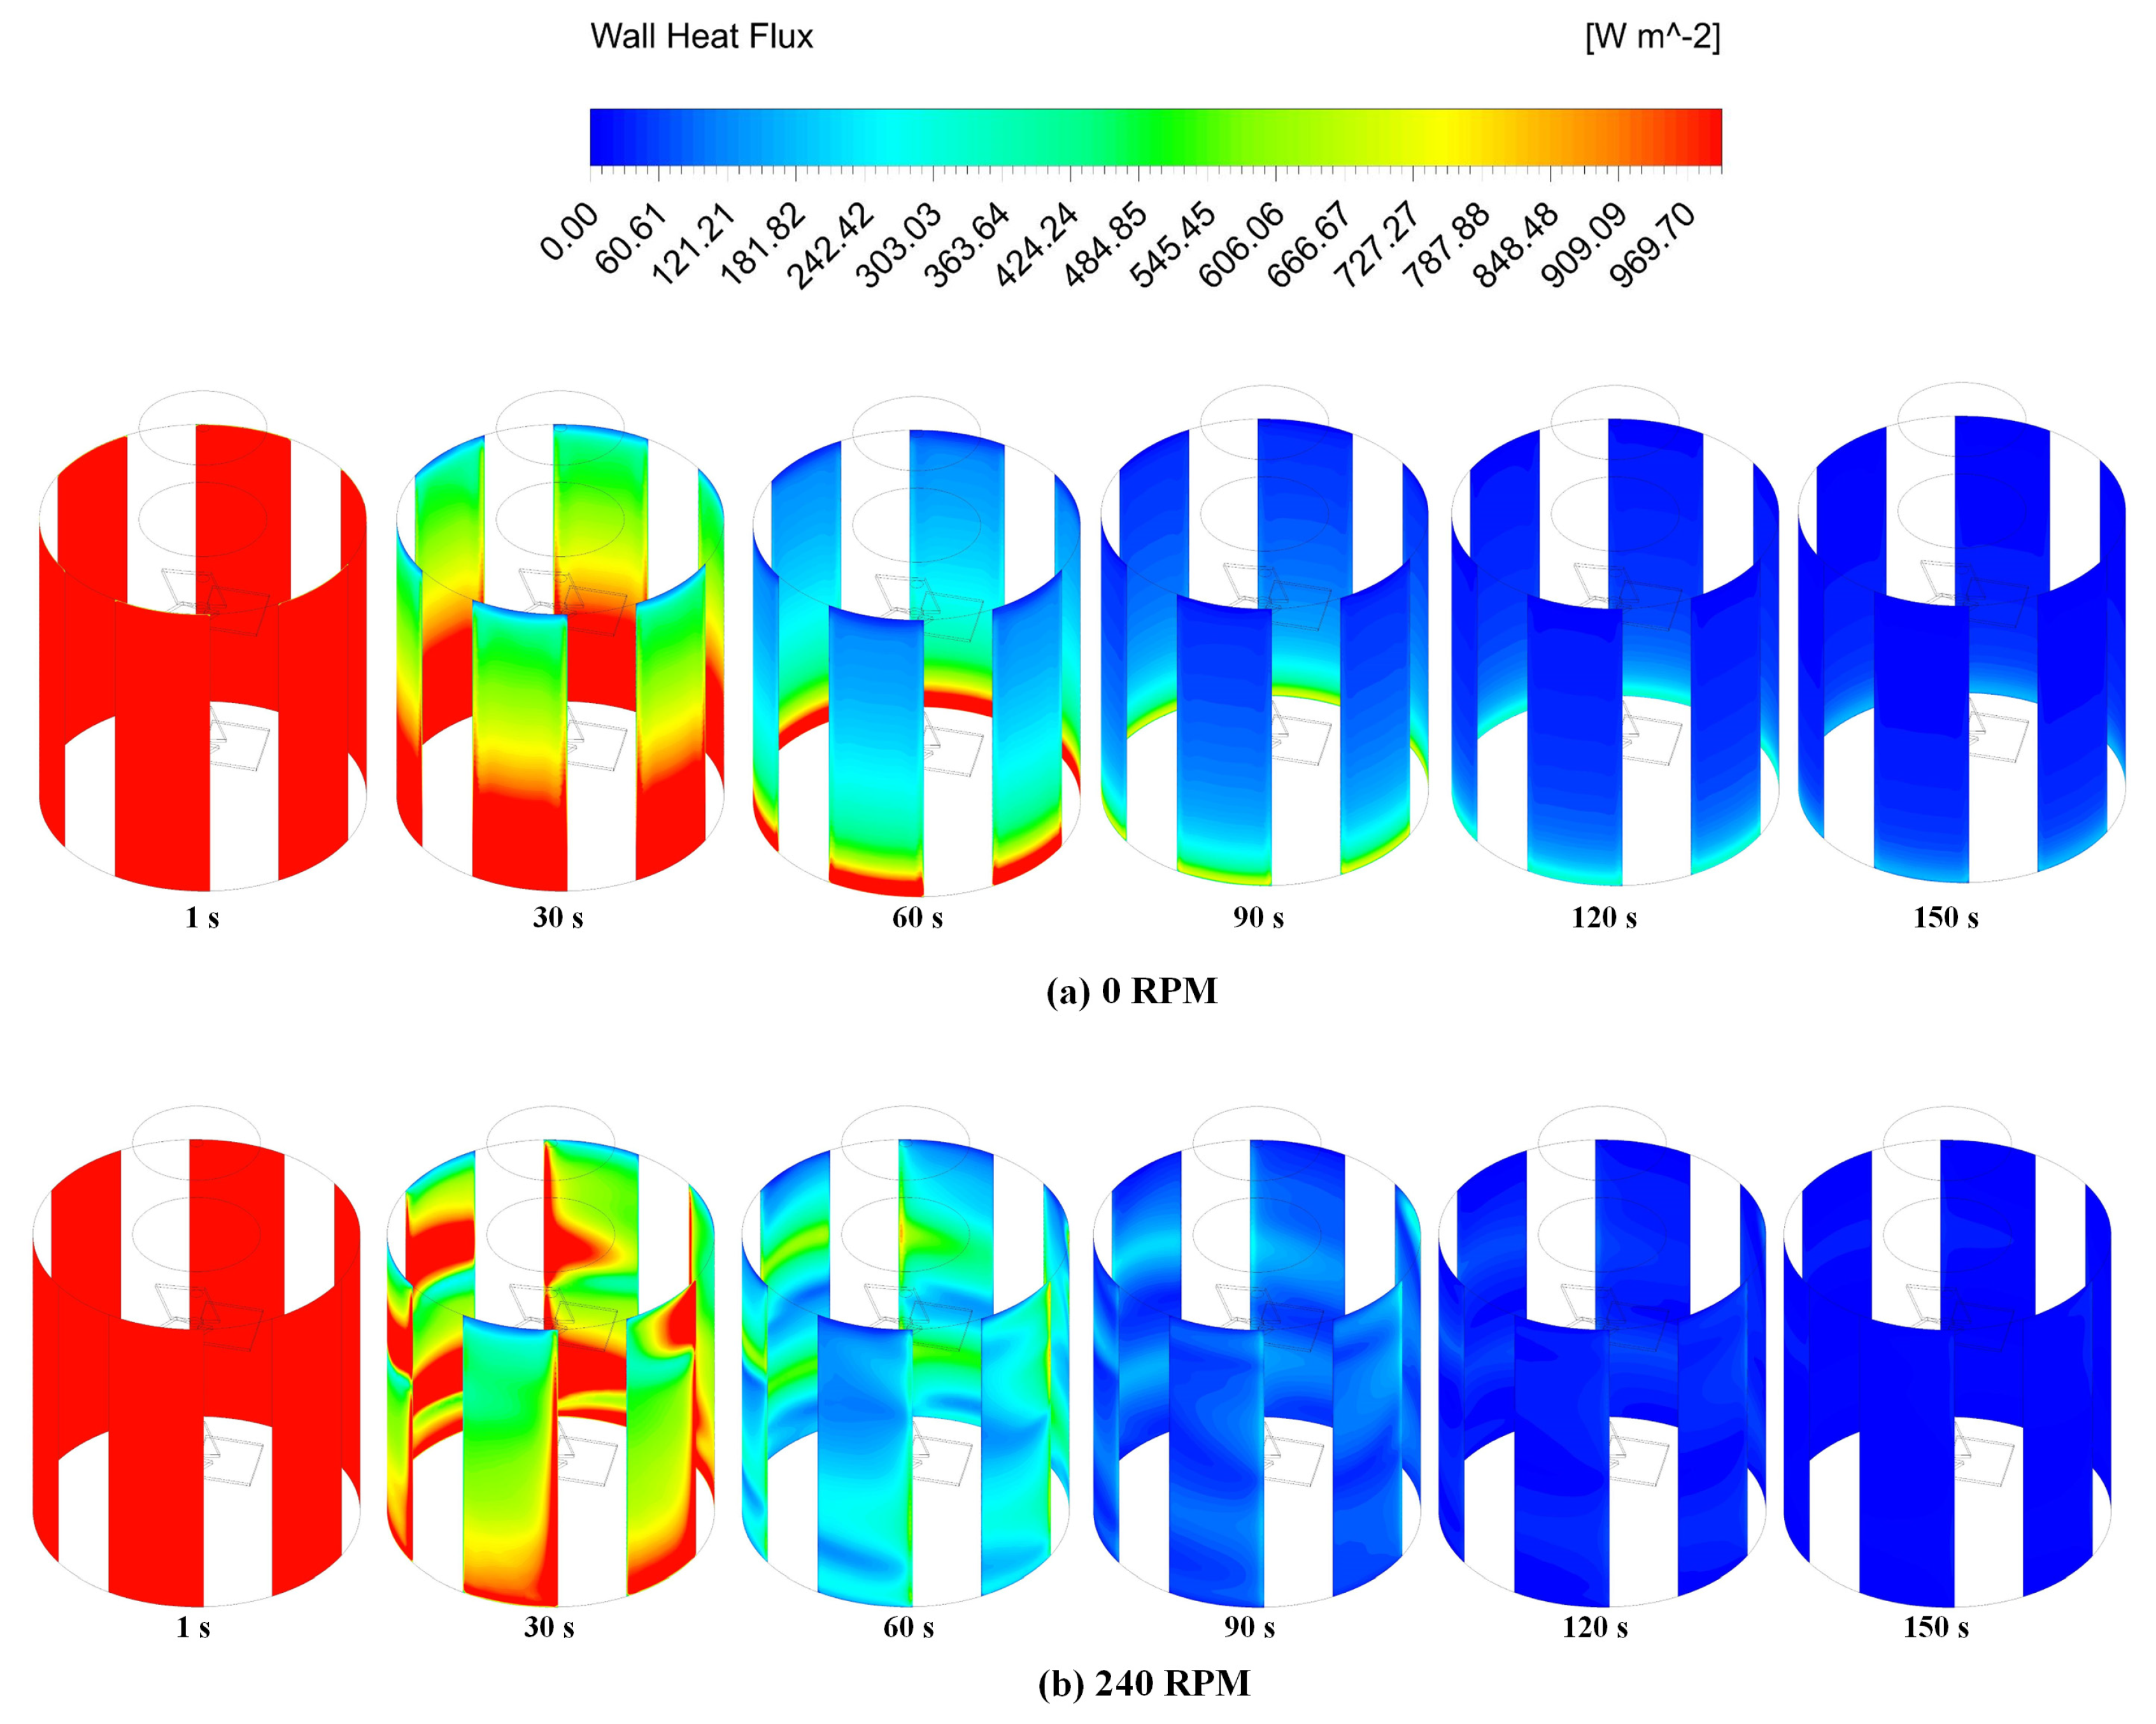
Figure 9: Heat flux distribution on the heated wall surface. (a) The impeller rotation speed of 0 RPM; (b) The impeller rotation speed of 240 RPM.
Fig. 10 illustrates the average axial temperature distribution within the furnace chamber after 30 s of heating. Axial temperature data were processed using CFD post-processing software, with cross-sections extracted at 1-mm intervals along the x-axis. The temperature at each cross-section was then calculated by integration using Eq. (15).
At 30 s of heating, heat transfer between the furnace fluid and heated walls had not yet reached equilibrium. Thermal stratification persisted within the furnace due to natural convection. At 0 RPM, this stratification effect was pronounced, with an average axial temperature difference reaching approximately 200 K. At 60 RPM, the temperature variation trend along the axial span was broadly consistent with that at 0 RPM, though the average axial temperature difference diminished by approximately 50 K. As impeller rotational speed increases, the axial temperature distribution tends towards uniformity. The average axial temperature difference across different rotational speed analysis groups decreases by approximately 50 K. At the maximum impeller speed of 240 RPM, the average axial temperature difference reduces to approximately 50 K. Notably, when rotational speeds exceed 120 RPM, the axial temperature distribution trends at two corresponding impeller positions (X = 0.1 m and X = 0.35 m) undergo significant changes. Within a small range, the axial temperature difference markedly diminishes, indicating that impeller rotation promotes localised temperature mixing within the furnace chamber.
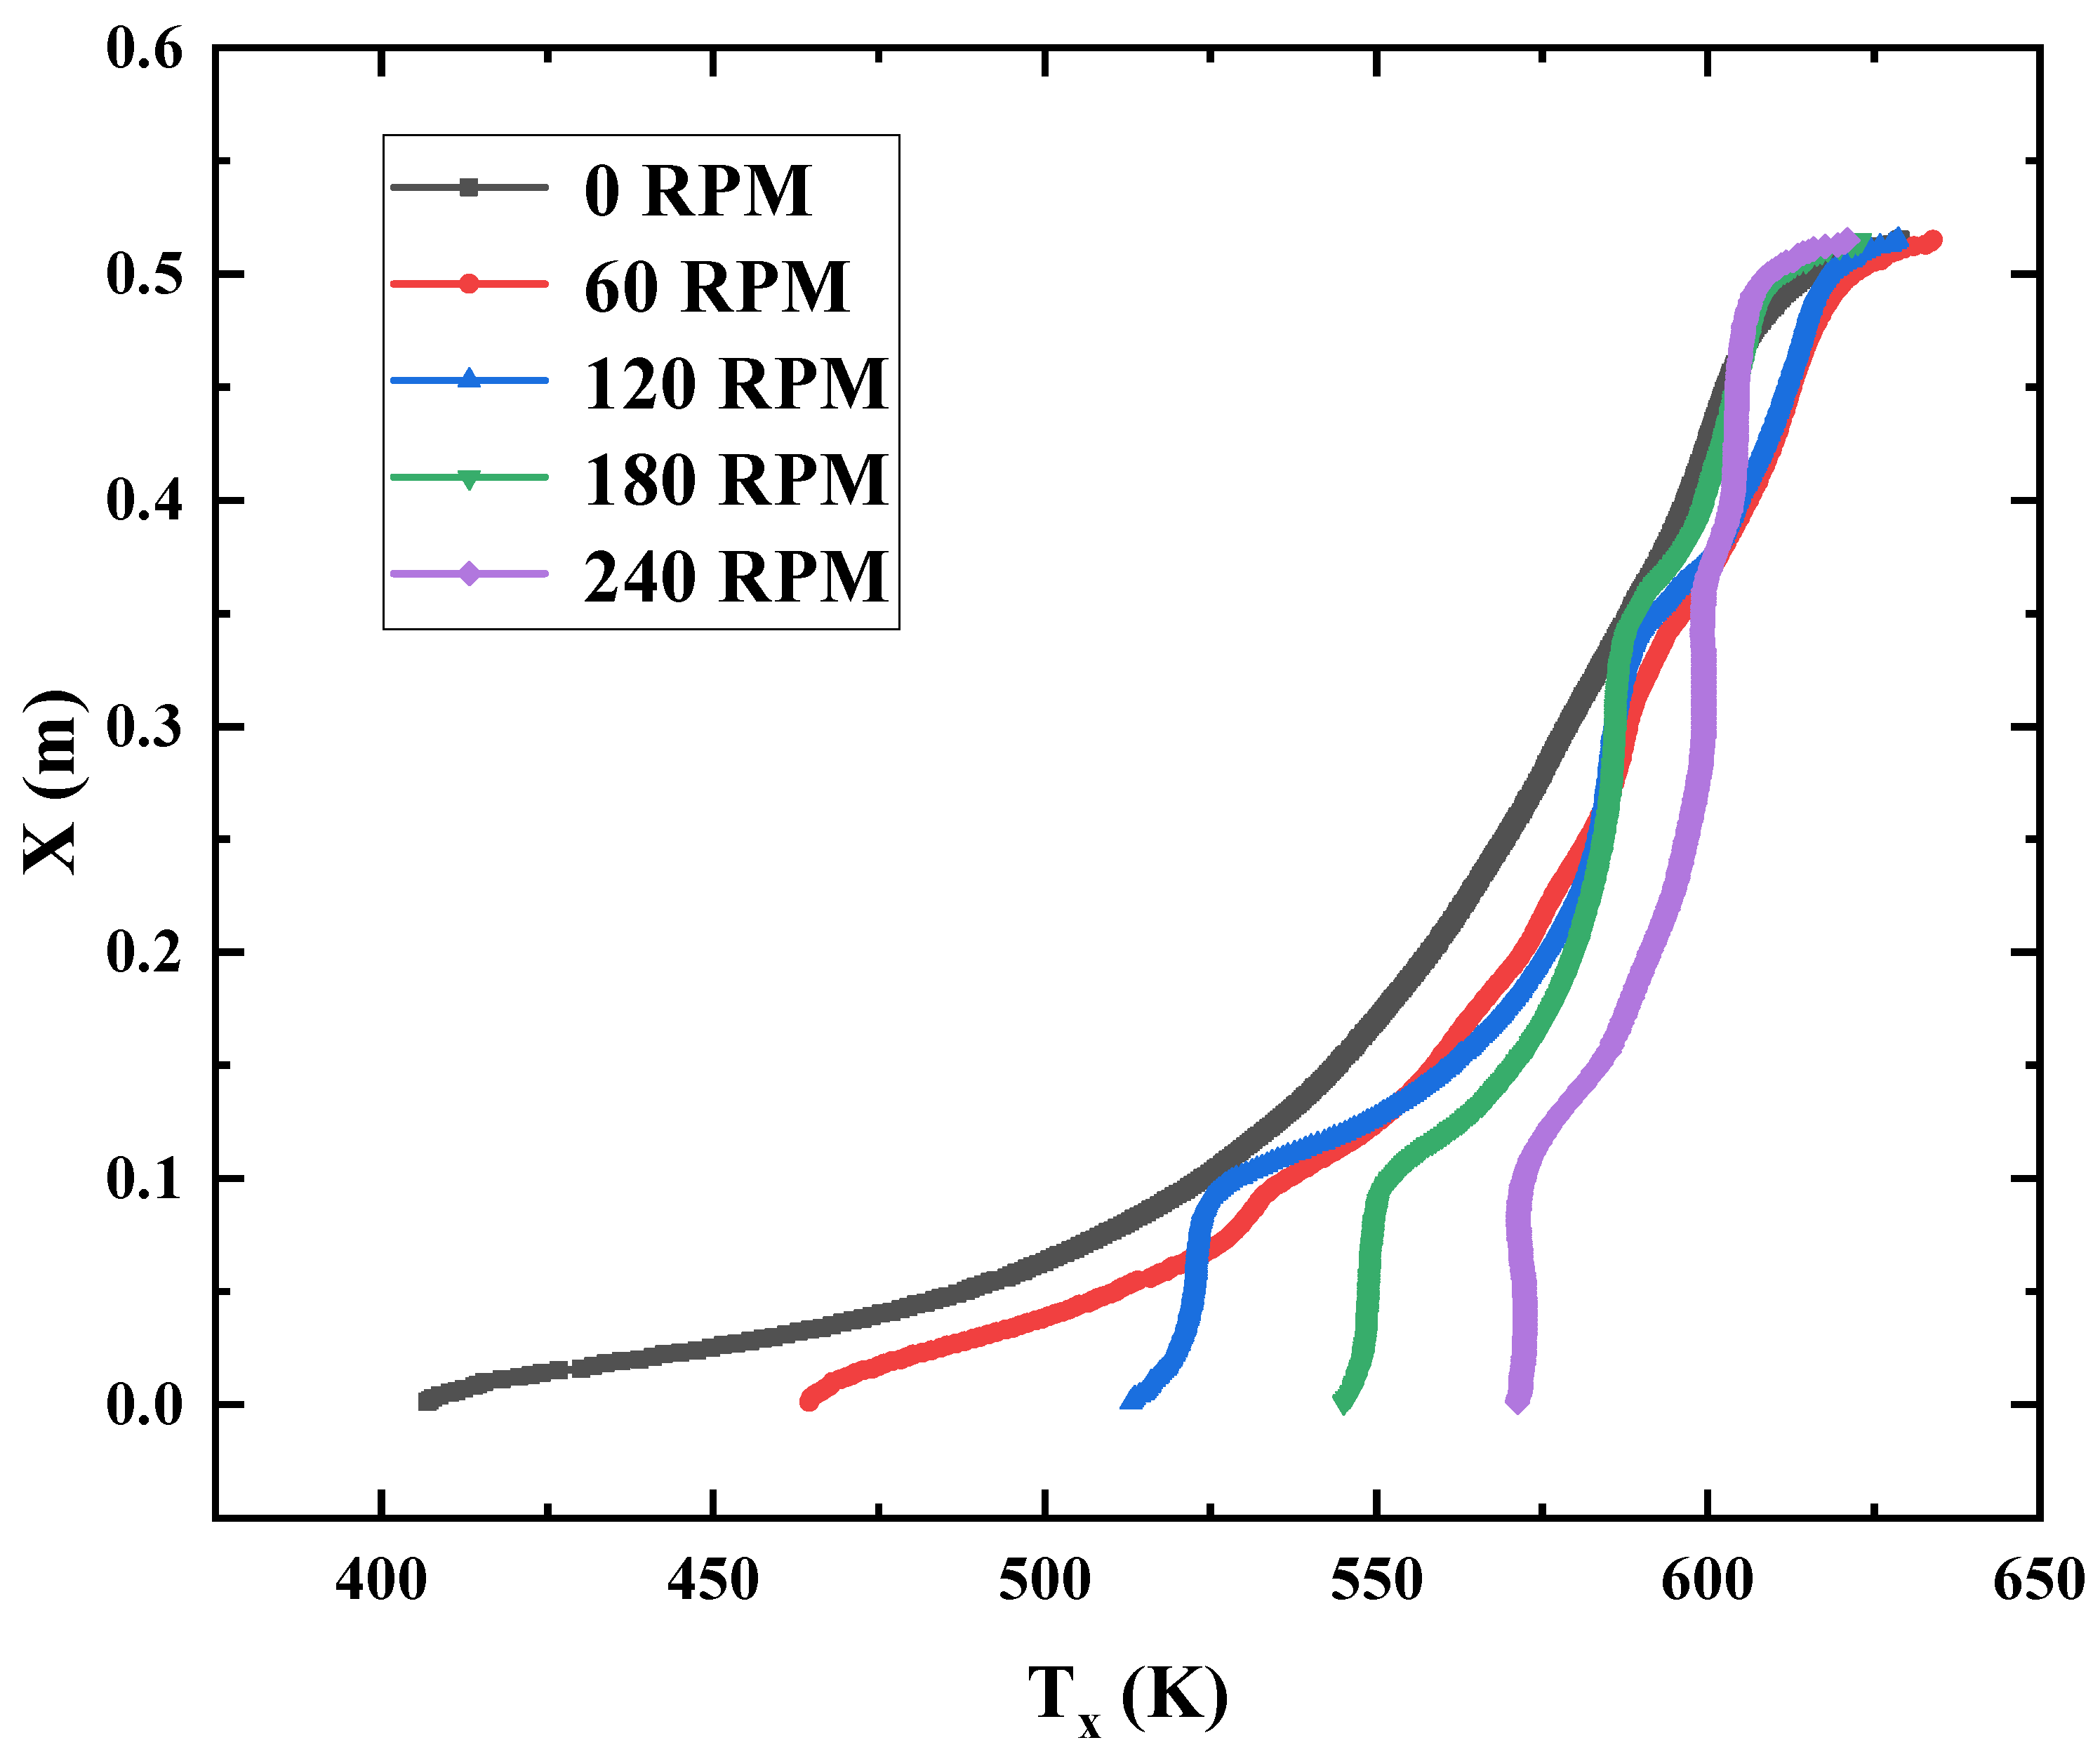
Figure 10: Temperature distribution in the axial direction at 30 s.
Fig. 11 illustrates the average heat flux at the heating wall surface. As the fluid temperature within the furnace increases, the temperature difference between the heating wall and the furnace fluid diminishes, causing the average heat flux to gradually decrease. With an increase in impeller rotational speed, the average heat flux at the heating wall surface also decreases. This may be attributed to improved temperature uniformity, resulting in reduced localised heat transfer temperature differentials. During the initial heating phase, the average heat flux at the heating wall surface at 0 RPM is markedly higher and exhibits a weaker decline trend. This correlates with the heat flux distribution at the heating wall surface depicted in Fig. 9: thermal buoyancy within the furnace fluid creates distinct temperature stratification, resulting in a larger temperature difference between the lower furnace fluid and the heating wall surface. However, the weaker decline in the average heat flux curve at this stage also indicates a longer duration required for the furnace fluid to reach its final temperature. During the mid-heating phase, heat exchange between the furnace fluid and heating wall stabilises. At an impeller speed of 240 RPM, the average heat flux on the heating wall decreases by approximately 50 W/m2 compared to other conditions. This may be attributed to the superior temperature distribution uniformity during the initial heating phase under high rotational speeds, resulting in higher overall heat transfer efficiency compared to other conditions. Following the preliminary heating process, the reduced temperature differential between the furnace fluid and heating surface at this stage leads to a decrease in the average heat flux on the heating surface. Overall, the enhanced heat transfer effect from impeller rotation primarily manifests in intensified thermal mixing of the fluid, thereby shortening the time required for the furnace fluid to reach its target temperature.
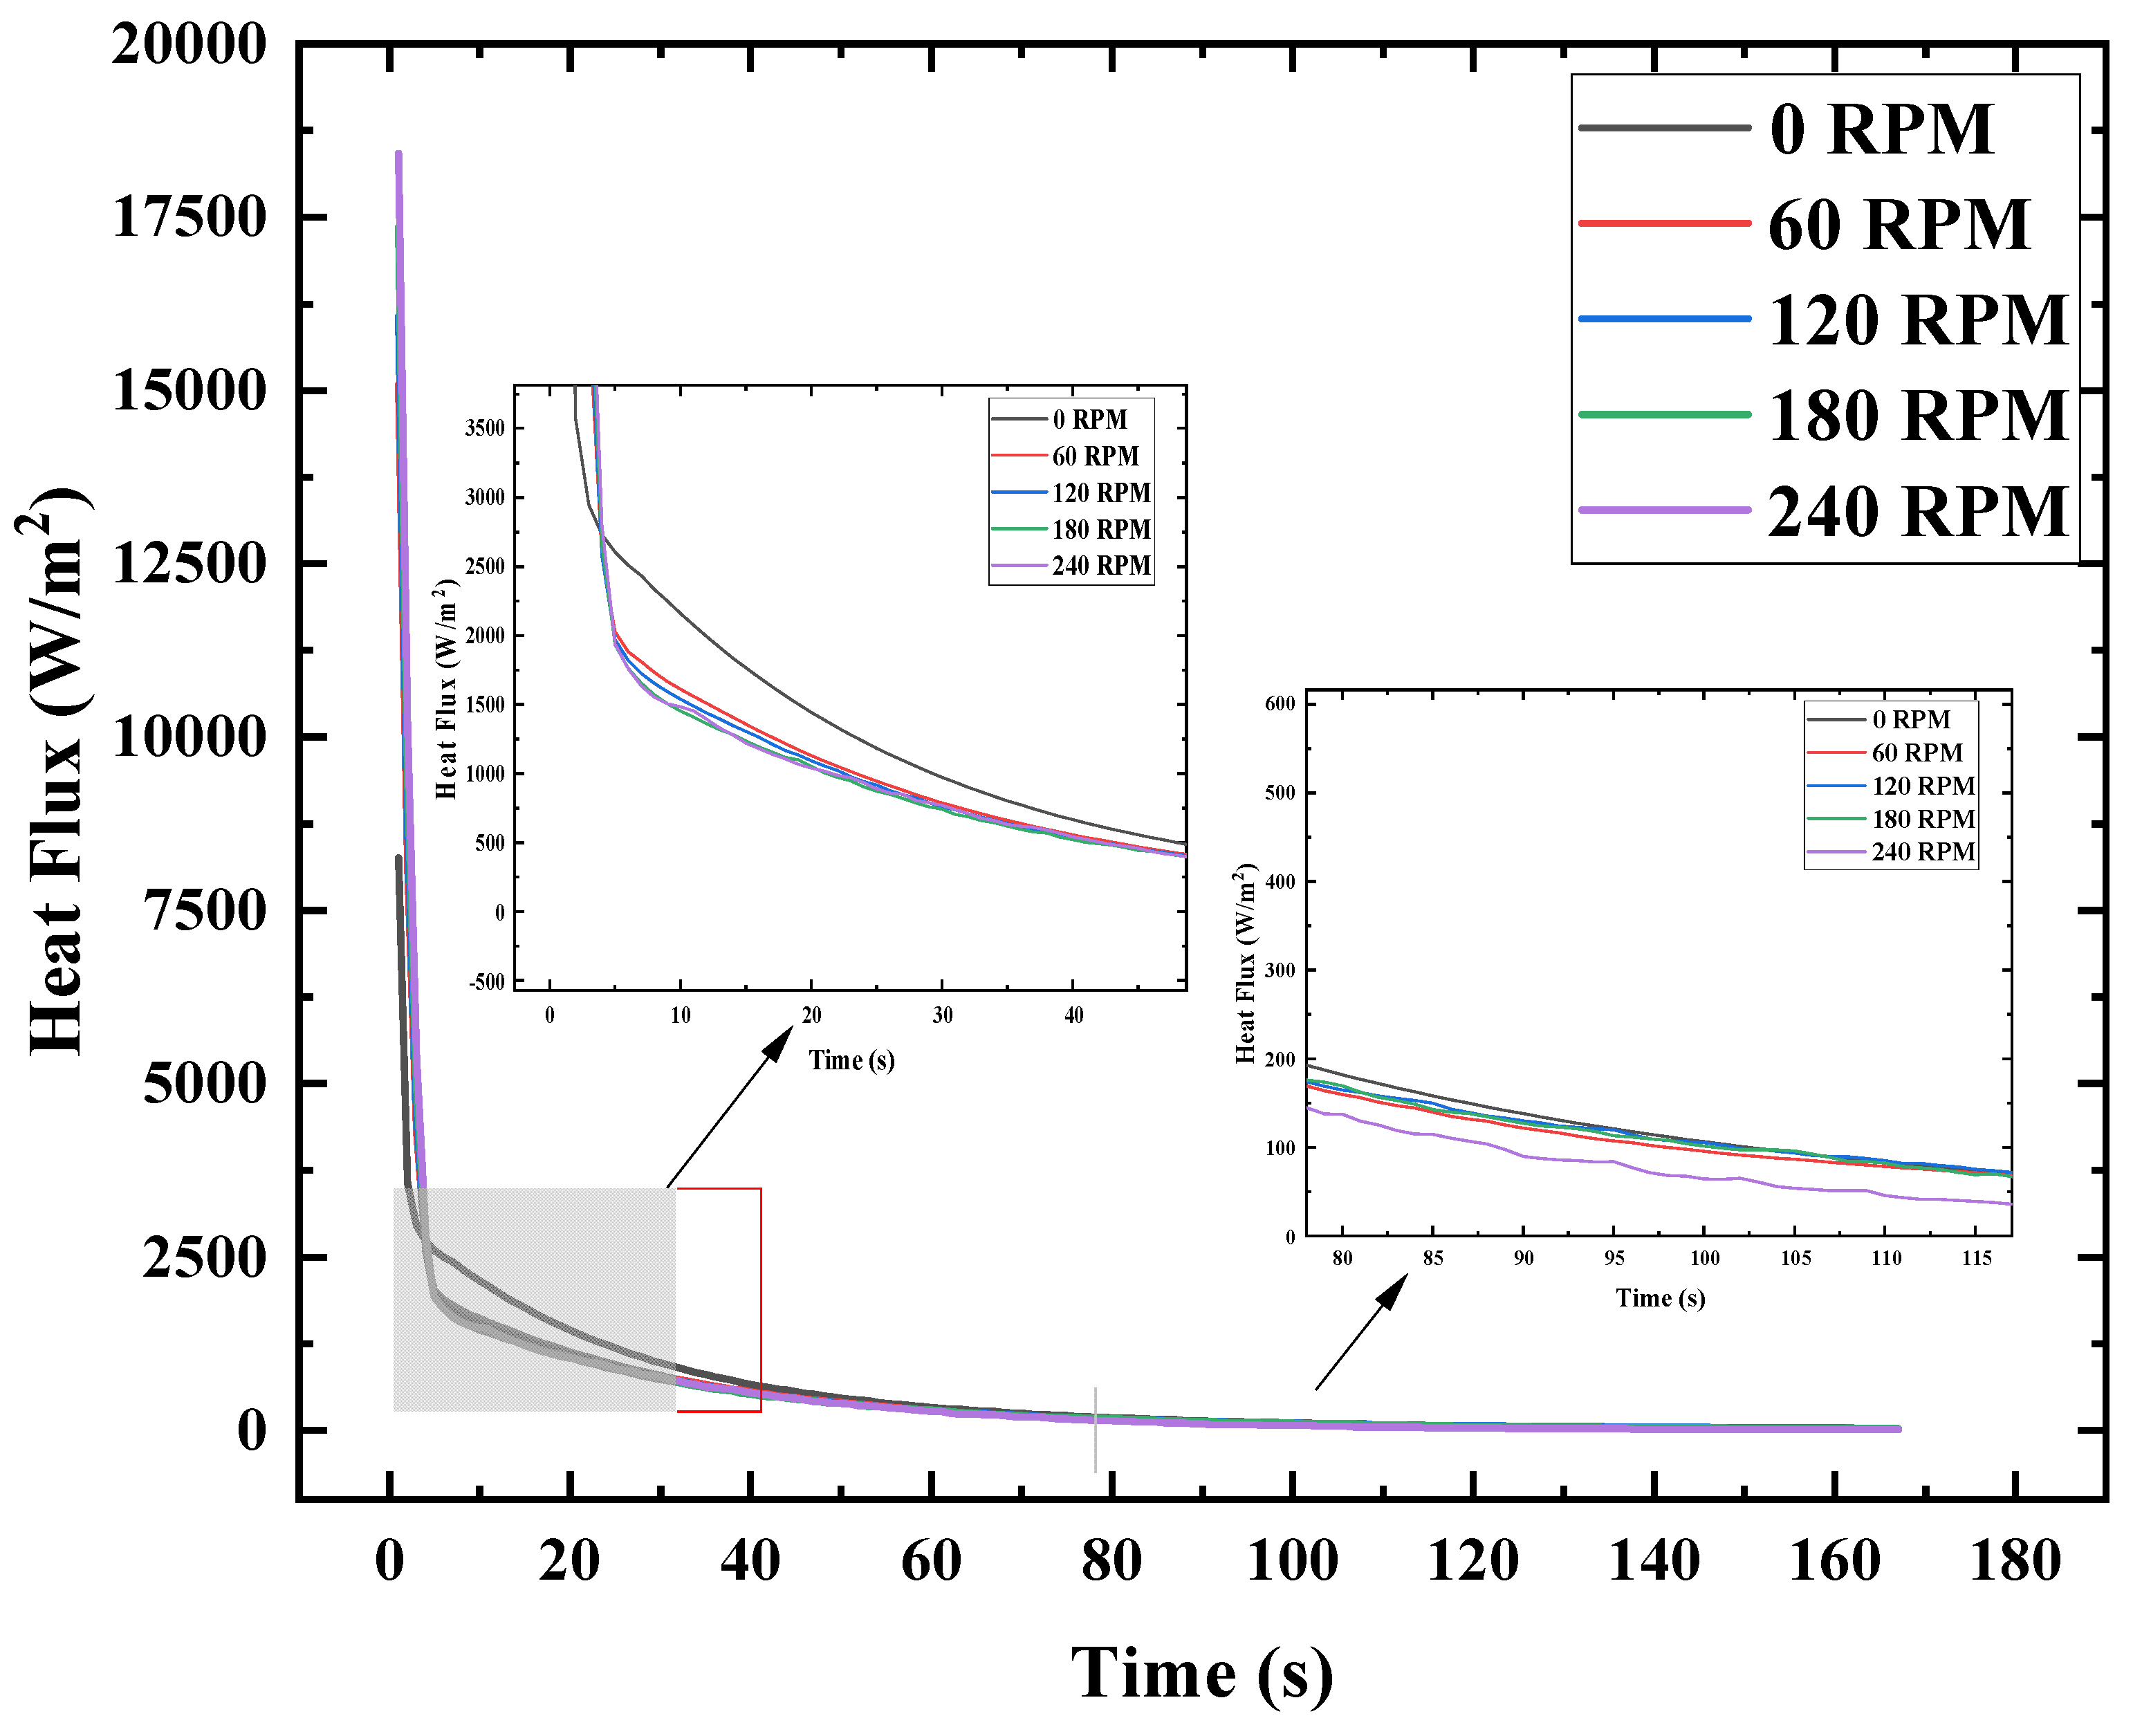
Figure 11: Variation of average heat flux with time for different impeller rotational velocities.
4.3 Evaluation of Flow Field Temperature Uniformity
Fig. 12 illustrates the temperature distribution at rotational speeds of 0 RPM and 240 RPM. The furnace body achieves full heating within 150 s. At 0 RPM, pronounced thermal stratification is observable throughout the heating process; conversely, when the impeller speed increases to 240 RPM, this stratification is markedly reduced, yielding a more uniform overall temperature distribution. Comparing the temperature distribution within the furnace chamber at the same moment, the distribution at 240 RPM is not only more uniform but also exhibits a higher overall temperature than at 0 RPM. This corroborates the observation in Fig. 11 that higher rotational speeds result in lower heat flux on the heating wall surfaces. Consequently, the homogeneity of temperature field mixing serves as a crucial indicator of how the forced convection generated by impeller rotation enhances both heat transfer efficiency and thermal mixing uniformity within the furnace.
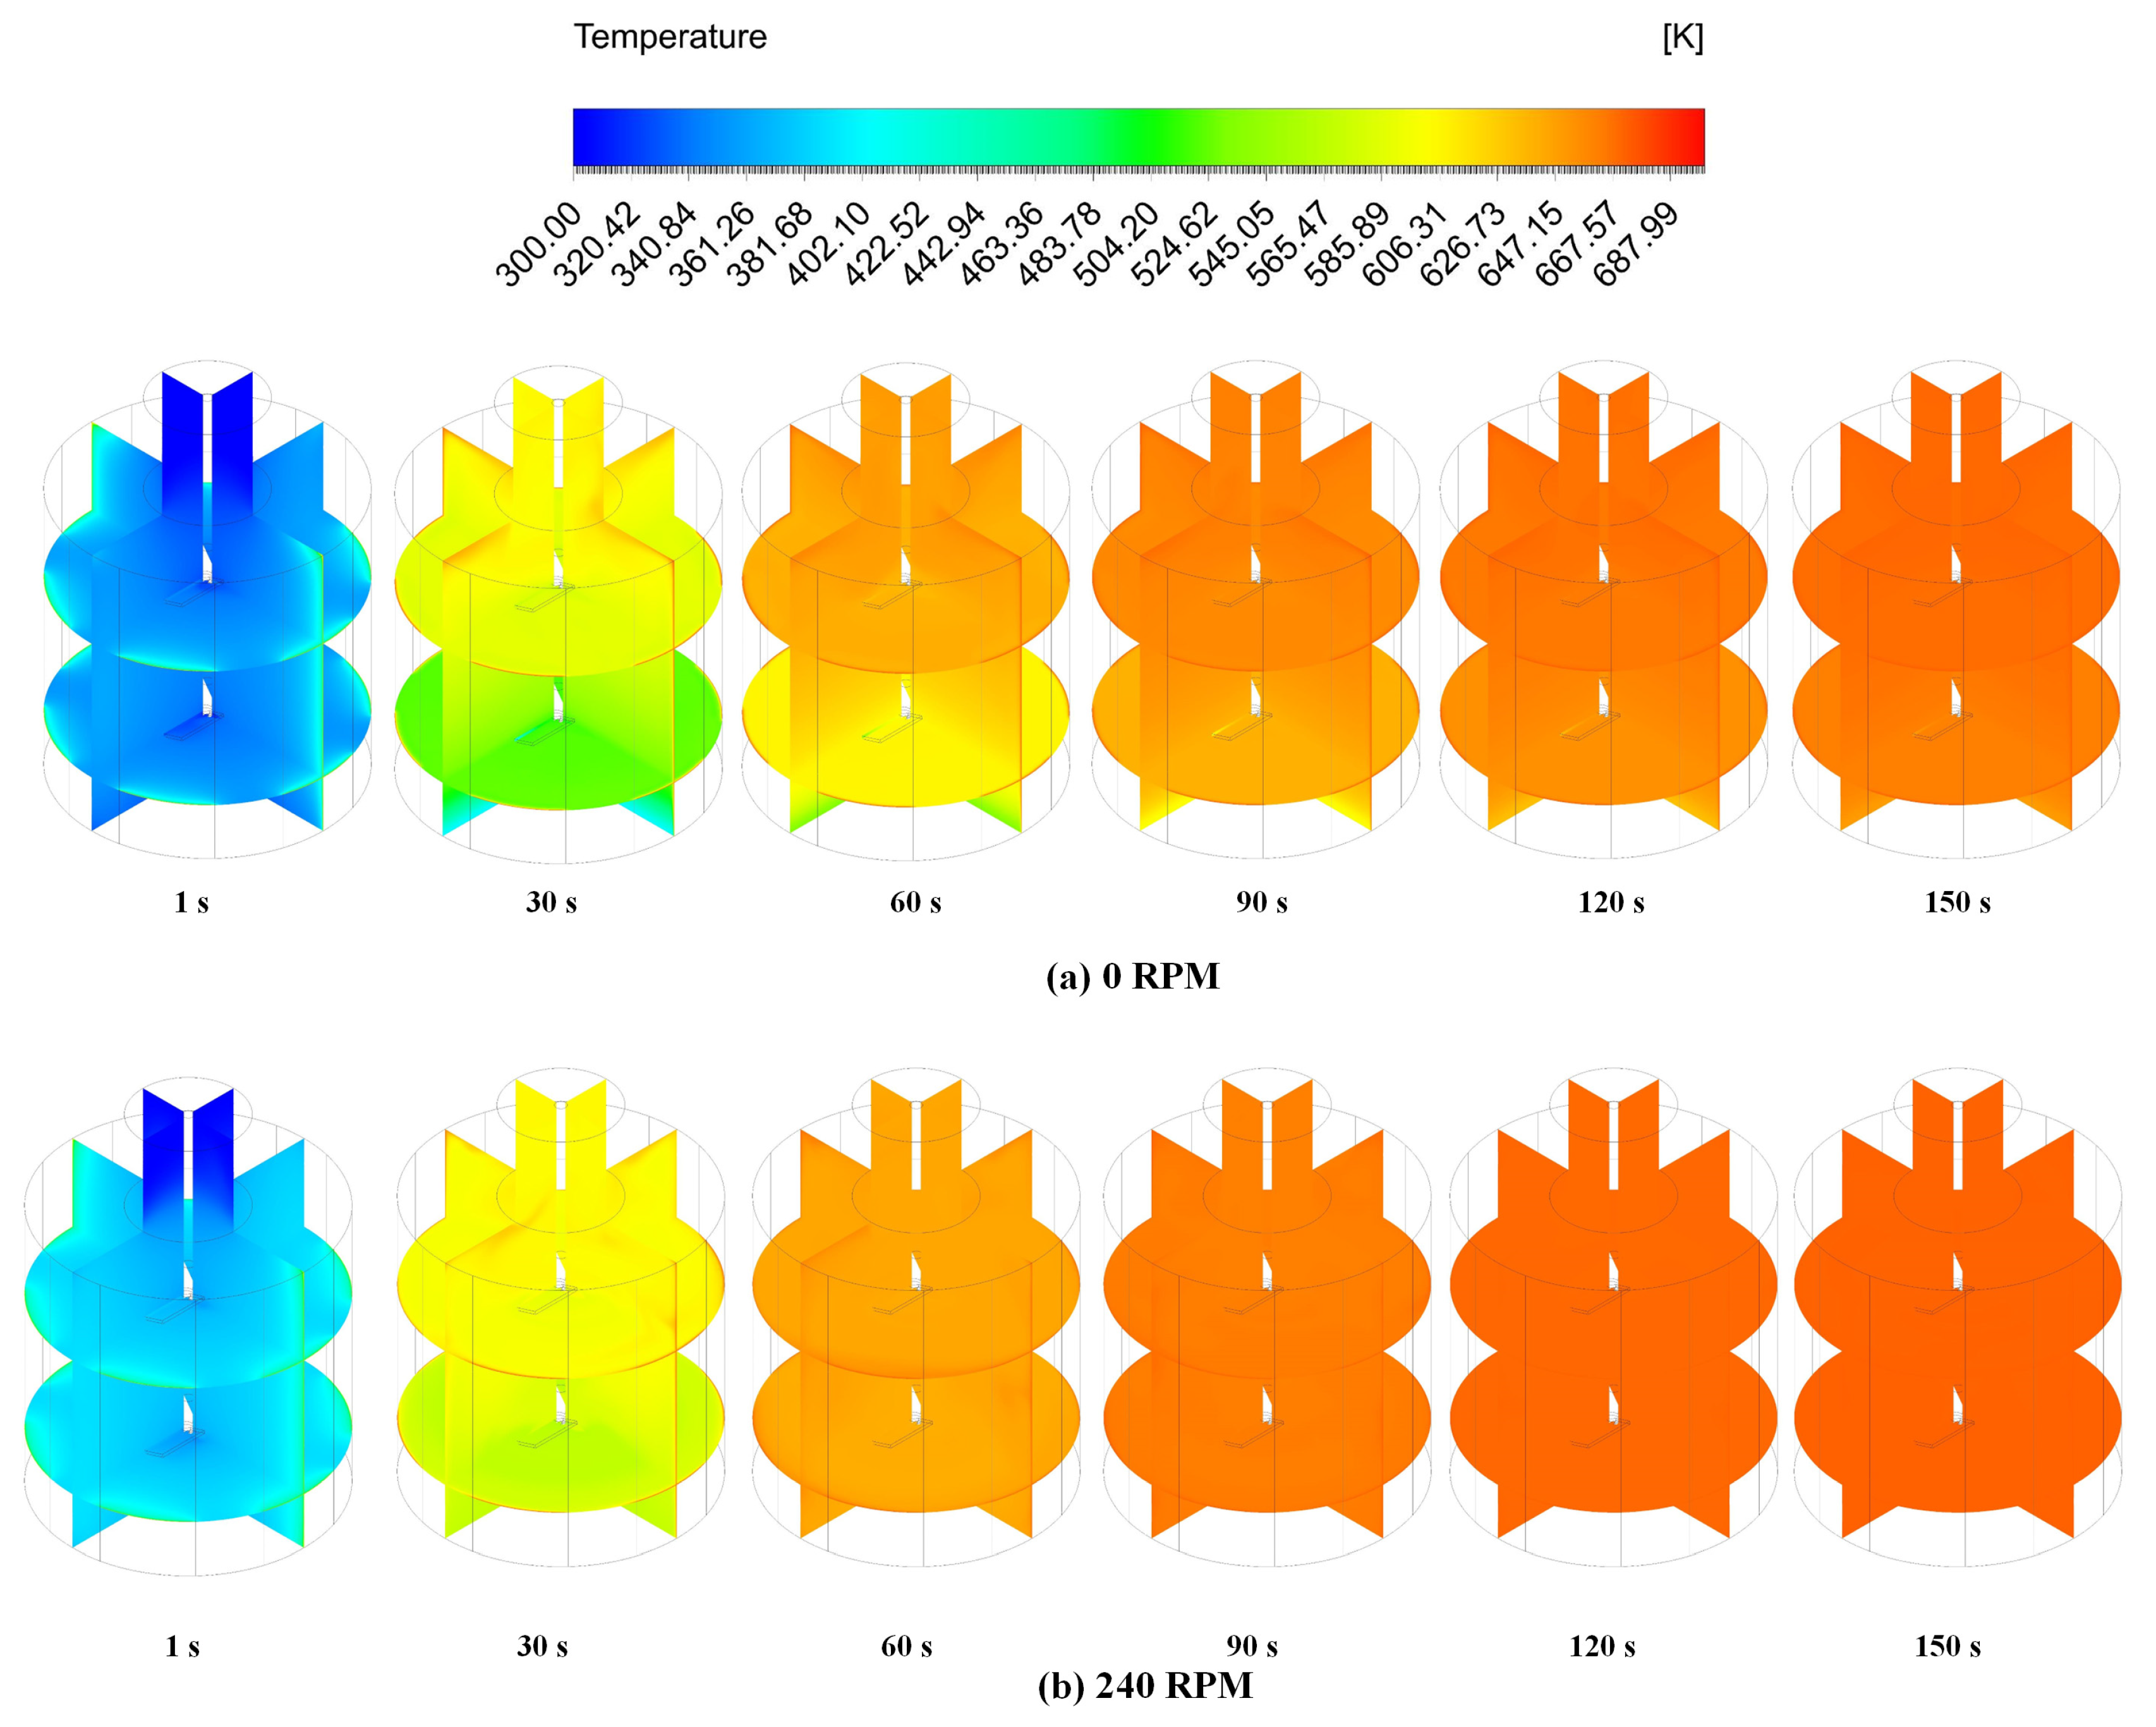
Figure 12: Temperature distribution in the furnace with time. (a) The impeller rotation speed of 0 RPM; (b) The impeller rotation speed of 240 RPM.
To compare the heat transfer enhancement effects and thermal mixing uniformity at different impeller rotational speeds, the temperature field standard deviation (σ) is introduced to evaluate the mixing uniformity of the temperature field [25]. The calculation method for the temperature field standard deviation is shown as Eq. (16).
Fig. 13 illustrates the distribution of standardised variance in the temperature field across different rotational speeds. The standardised variance consistently exhibits a decreasing trend. This indicates that as temperature increases, fluid uniformity within the furnace progressively improves. During the initial heating phase, significant temperature field non-uniformity arises due to the substantial temperature differential between the wall surface and the fluid region. Within the first 30 s, the standardised variance of the temperature field initially increases gradually, reaching a maximum before commencing a gradual decrease. As the impeller rotational speed increases, the maximum value of the standardised variance also diminishes. At an impeller speed of 60 RPM, the variance in the temperature field differs from that at 0 RPM primarily during the first 70 s; thereafter, the standardised variance of the temperature field remains largely consistent. This indicates that the impact of low rotational speeds on thermal mixing uniformity is only pronounced during the initial heating phase. As the impeller speed continues to increase, the decay of the standardised variance accelerates. Furthermore, when elevated to the maximum rotational speed of 240 RPM, the peak standardised variance of the temperature field is lowest and declines more rapidly to zero. This demonstrates that an impeller speed of 240 RPM significantly enhances the uniformity of the temperature field within the furnace, thereby accelerating the heating process.
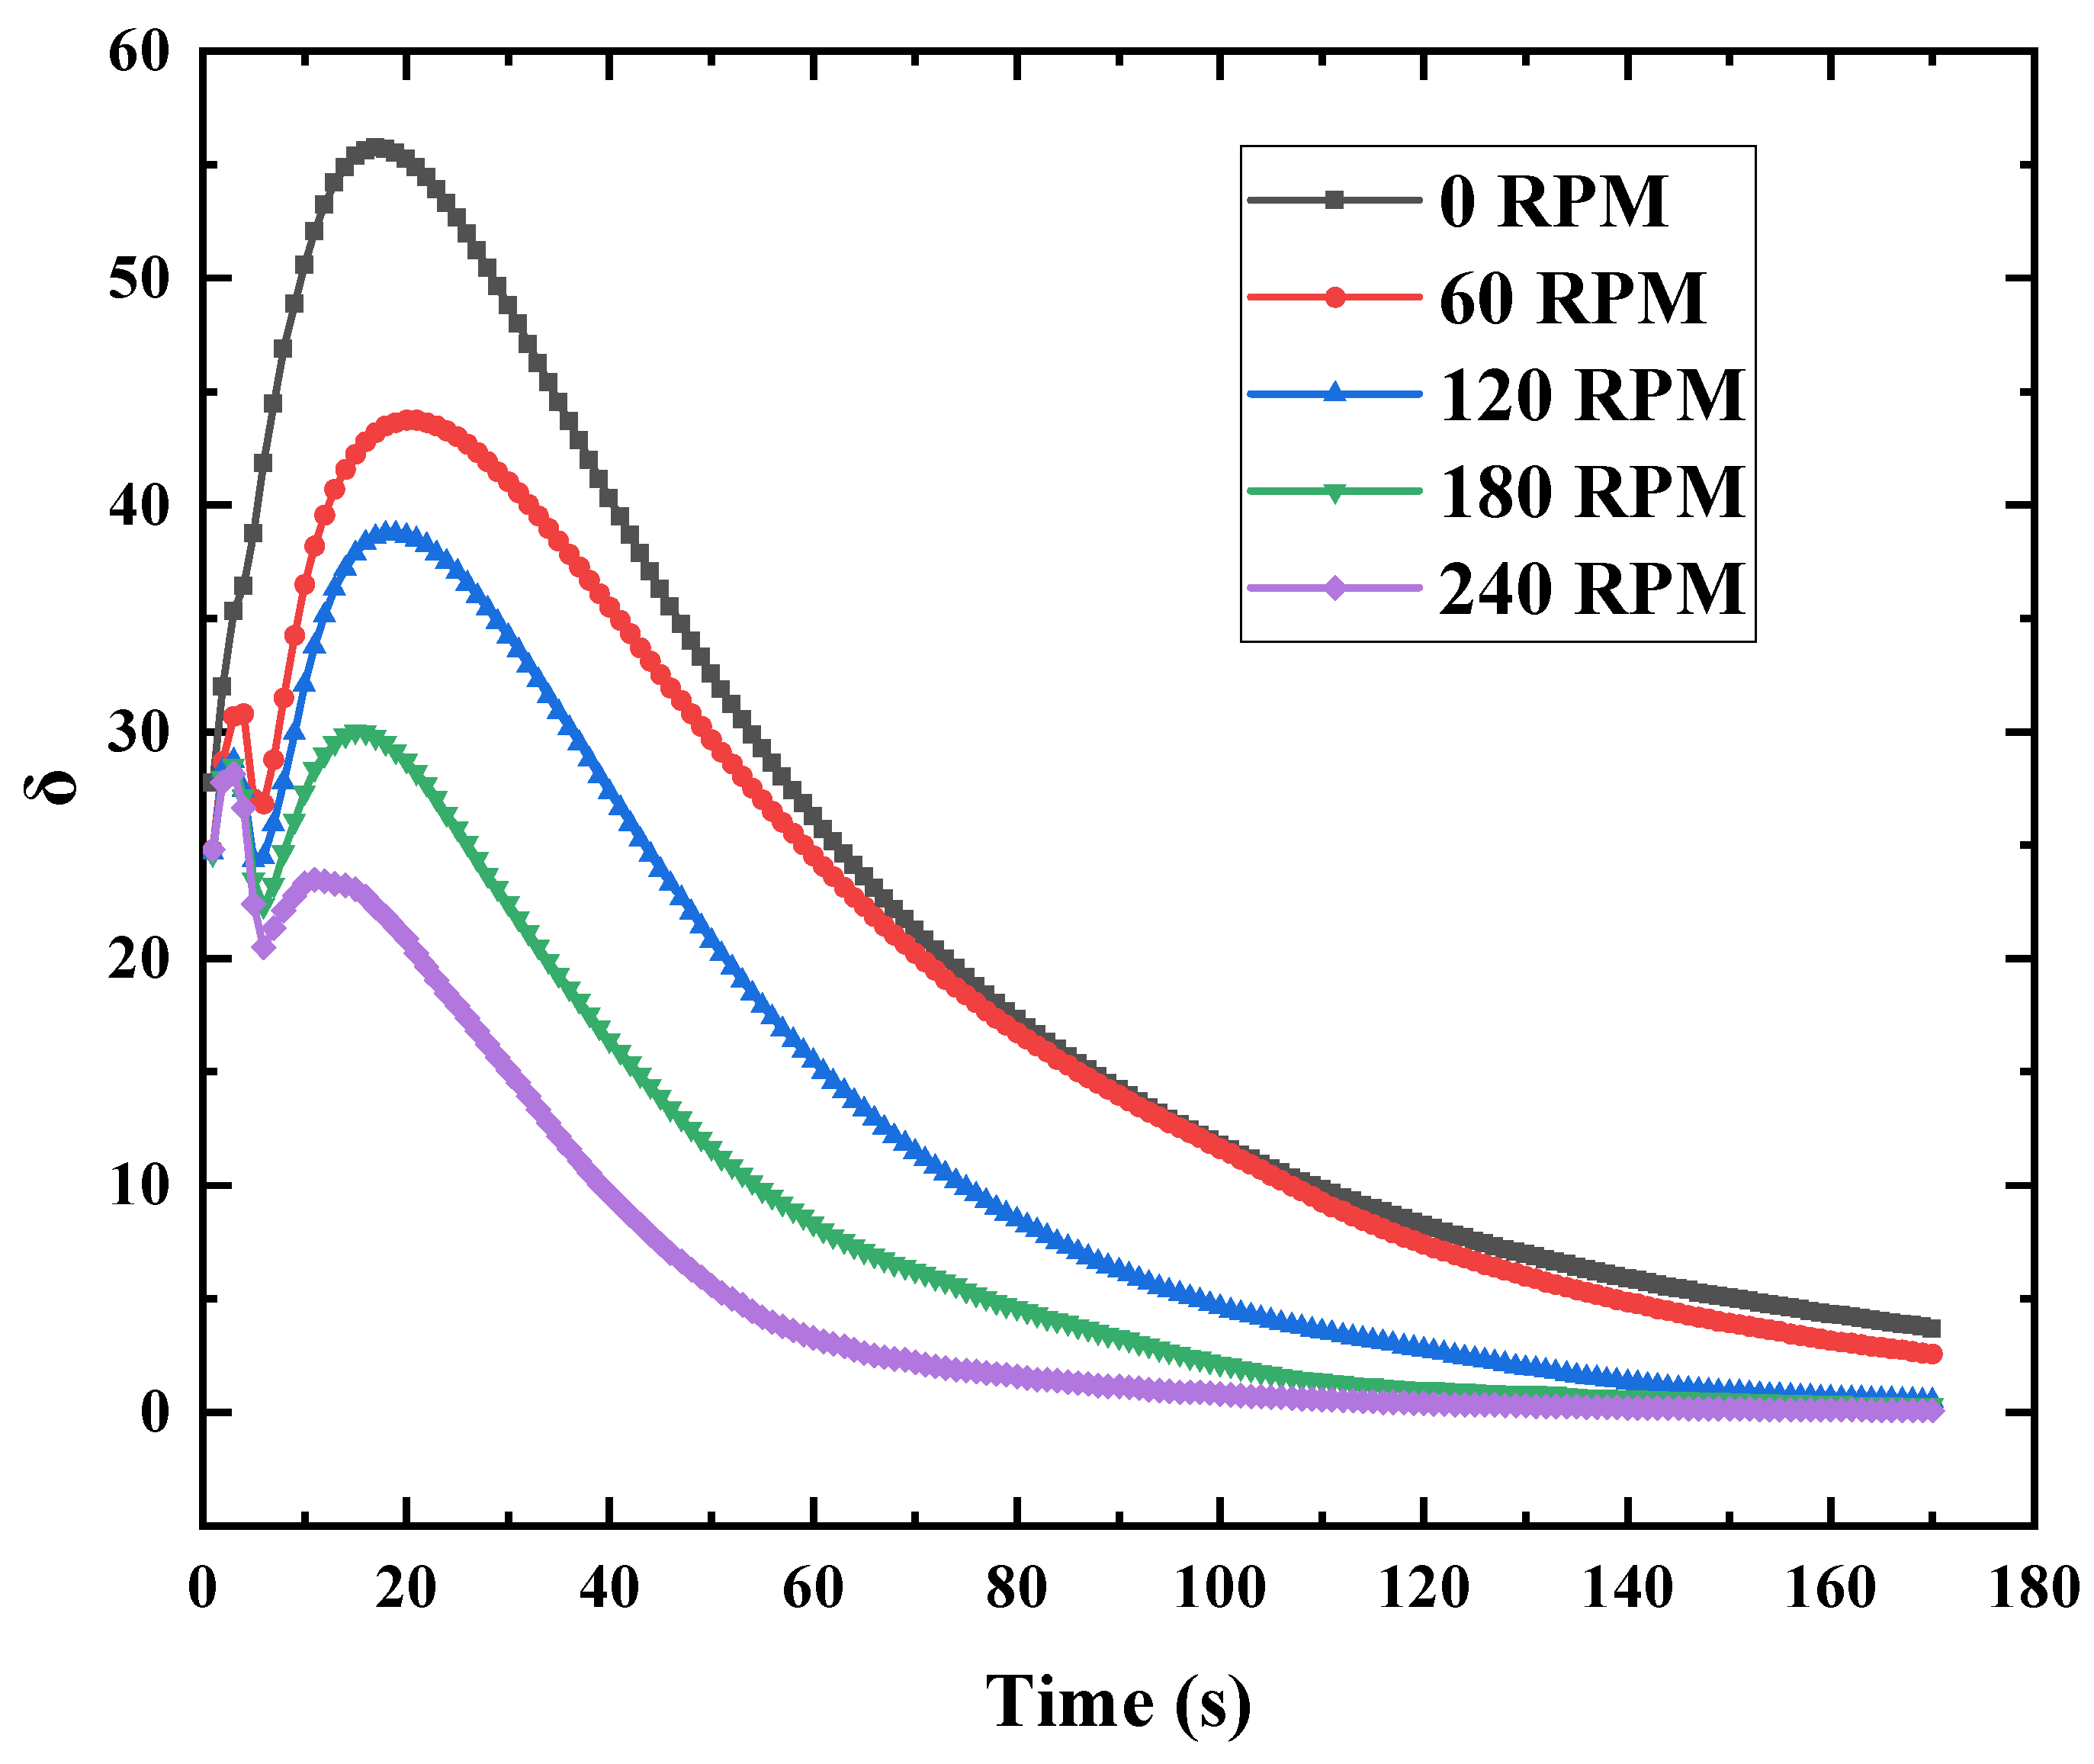
Figure 13: Standard deviation of the temperature field in the furnace relative to time.
When the standardised variance of the temperature field drops to zero, this indicates that the furnace has achieved a state of complete thermal uniformity. Throughout the simulation, the standardised variance of the temperature field failed to reach zero at impeller speeds of 0 RPM and 60 RPM. In actual equipment operation, complete fluid uniformity cannot be achieved due to factors such as heat dissipation from the furnace body to the external environment and leakage of high-temperature fluid. Under such circumstances, increasing the impeller speed to enhance forced convection can effectively improve temperature uniformity within the furnace.
Fig. 14 illustrates the axial distribution of mean temperature standard deviation at different rotational speeds after 30 s of heating. The mean temperature standard deviation at each axial position was calculated using temperature data within a 0.01 m radius of that location. At impeller speeds of 0 RPM and 60 RPM, the standardised variance at the furnace base exhibits significant values, further demonstrating that thermal buoyancy-induced thermal stratification exacerbates local temperature field inhomogeneity. As rotational speed increases, the overall uniformity of the temperature field markedly improves. Notably, substantial fluctuations in temperature field standard deviation occur at the impeller’s corresponding positions (X = 0.1 and X = 0.35). This arises because the forced convection effect generated by impeller rotation disrupts thermal buoyancy, making the rotational zone the primary location where fluids of differing temperatures within the furnace converge. At an impeller rotational speed of 240 RPM, the axial temperature distribution within the furnace is most uniform.
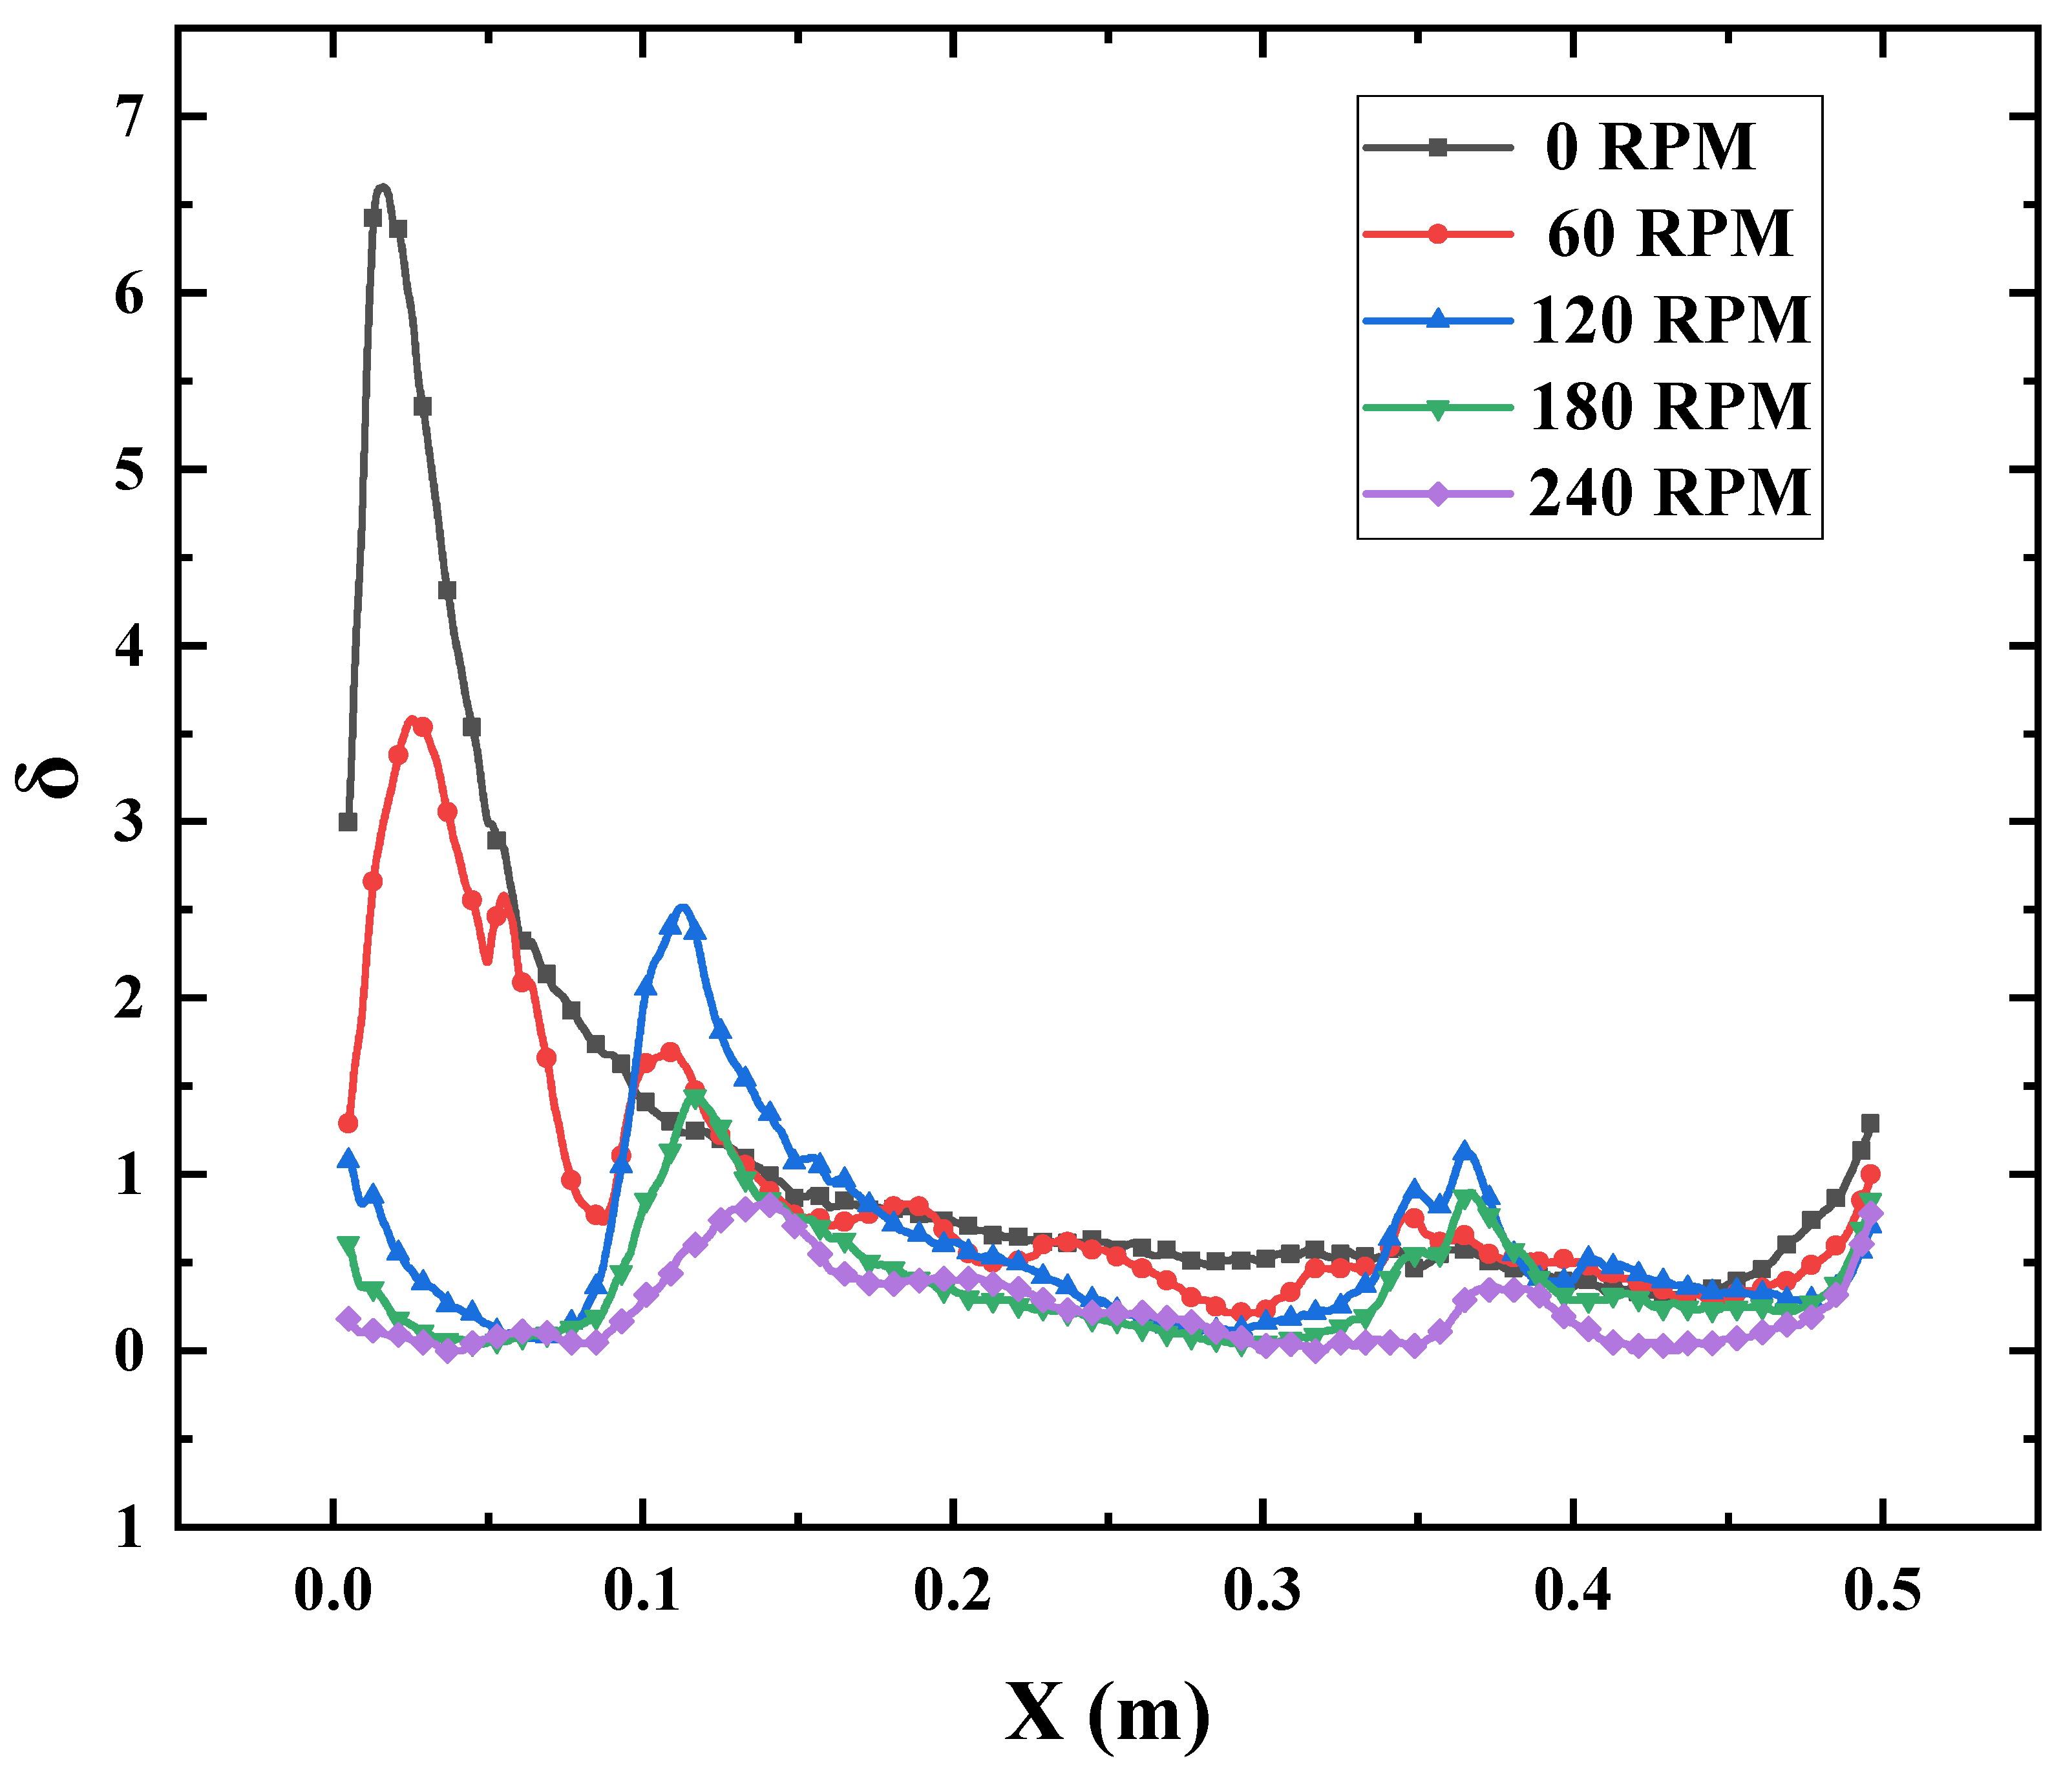
Figure 14: Standard deviation of the temperature field within the furnace relative to the axial direction.
Based on analysis of the heat flux density on the heating wall surface and the temperature distribution within the furnace. It is evident that as the impeller rotational speed increases, the dominant mechanism governing air flow within the furnace undergoes a dynamic evolution from thermal buoyancy-driven to impeller-driven. At initial low rotational speeds, flow is dominated by thermal buoyancy induced by temperature gradients, resulting in a pronounced thermal stratification within the temperature field. As rotational speed increases, inertial forces intensify, propelling the system into a transitional regime. Here, buoyancy forces become comparable to the forced inertial forces generated by the impeller, disrupting thermal stratification and evolving the flow field into a mixed convective state. At high rotational speeds, the flow is predominantly governed by forced convection driven by the impeller, with inertial forces and turbulent viscous effects controlling the overall behaviour. At this stage, the influence of thermal buoyancy is confined to fine-tuning local turbulent structures, thereby achieving intense mixing of the furnace fluid and homogenisation of the temperature field.
The motion of the fluid in the flow field is not only caused by the rotation of the impeller, but also the thermal buoyancy after the fluid is heated will be the relative motion of the fluid.
Fig. 15 illustrates the velocity field distribution during the heating process at impeller speeds of 0 RPM and 240 RPM. At 0 RPM, flow velocities near the heating wall are markedly higher than in other regions. As fluid temperature gradually increases, localised flow zones within the furnace diminish, with movement confined primarily to the vicinity of the heating wall. This occurs because, with the impeller stationary, the flow field is dominated by natural convection, resulting in only minor fluid motion near the heating surface. At an impeller speed of 240 RPM, the overall flow velocity is markedly higher than when the impeller is stationary. Furthermore, the vicinity of the impeller becomes the primary flow development zone, with a more uniform distribution of overall flow intensity. This demonstrates that under the influence of impeller rotation, the forced convection effect achieves effective fluid mixing throughout the entire flow process within the furnace.
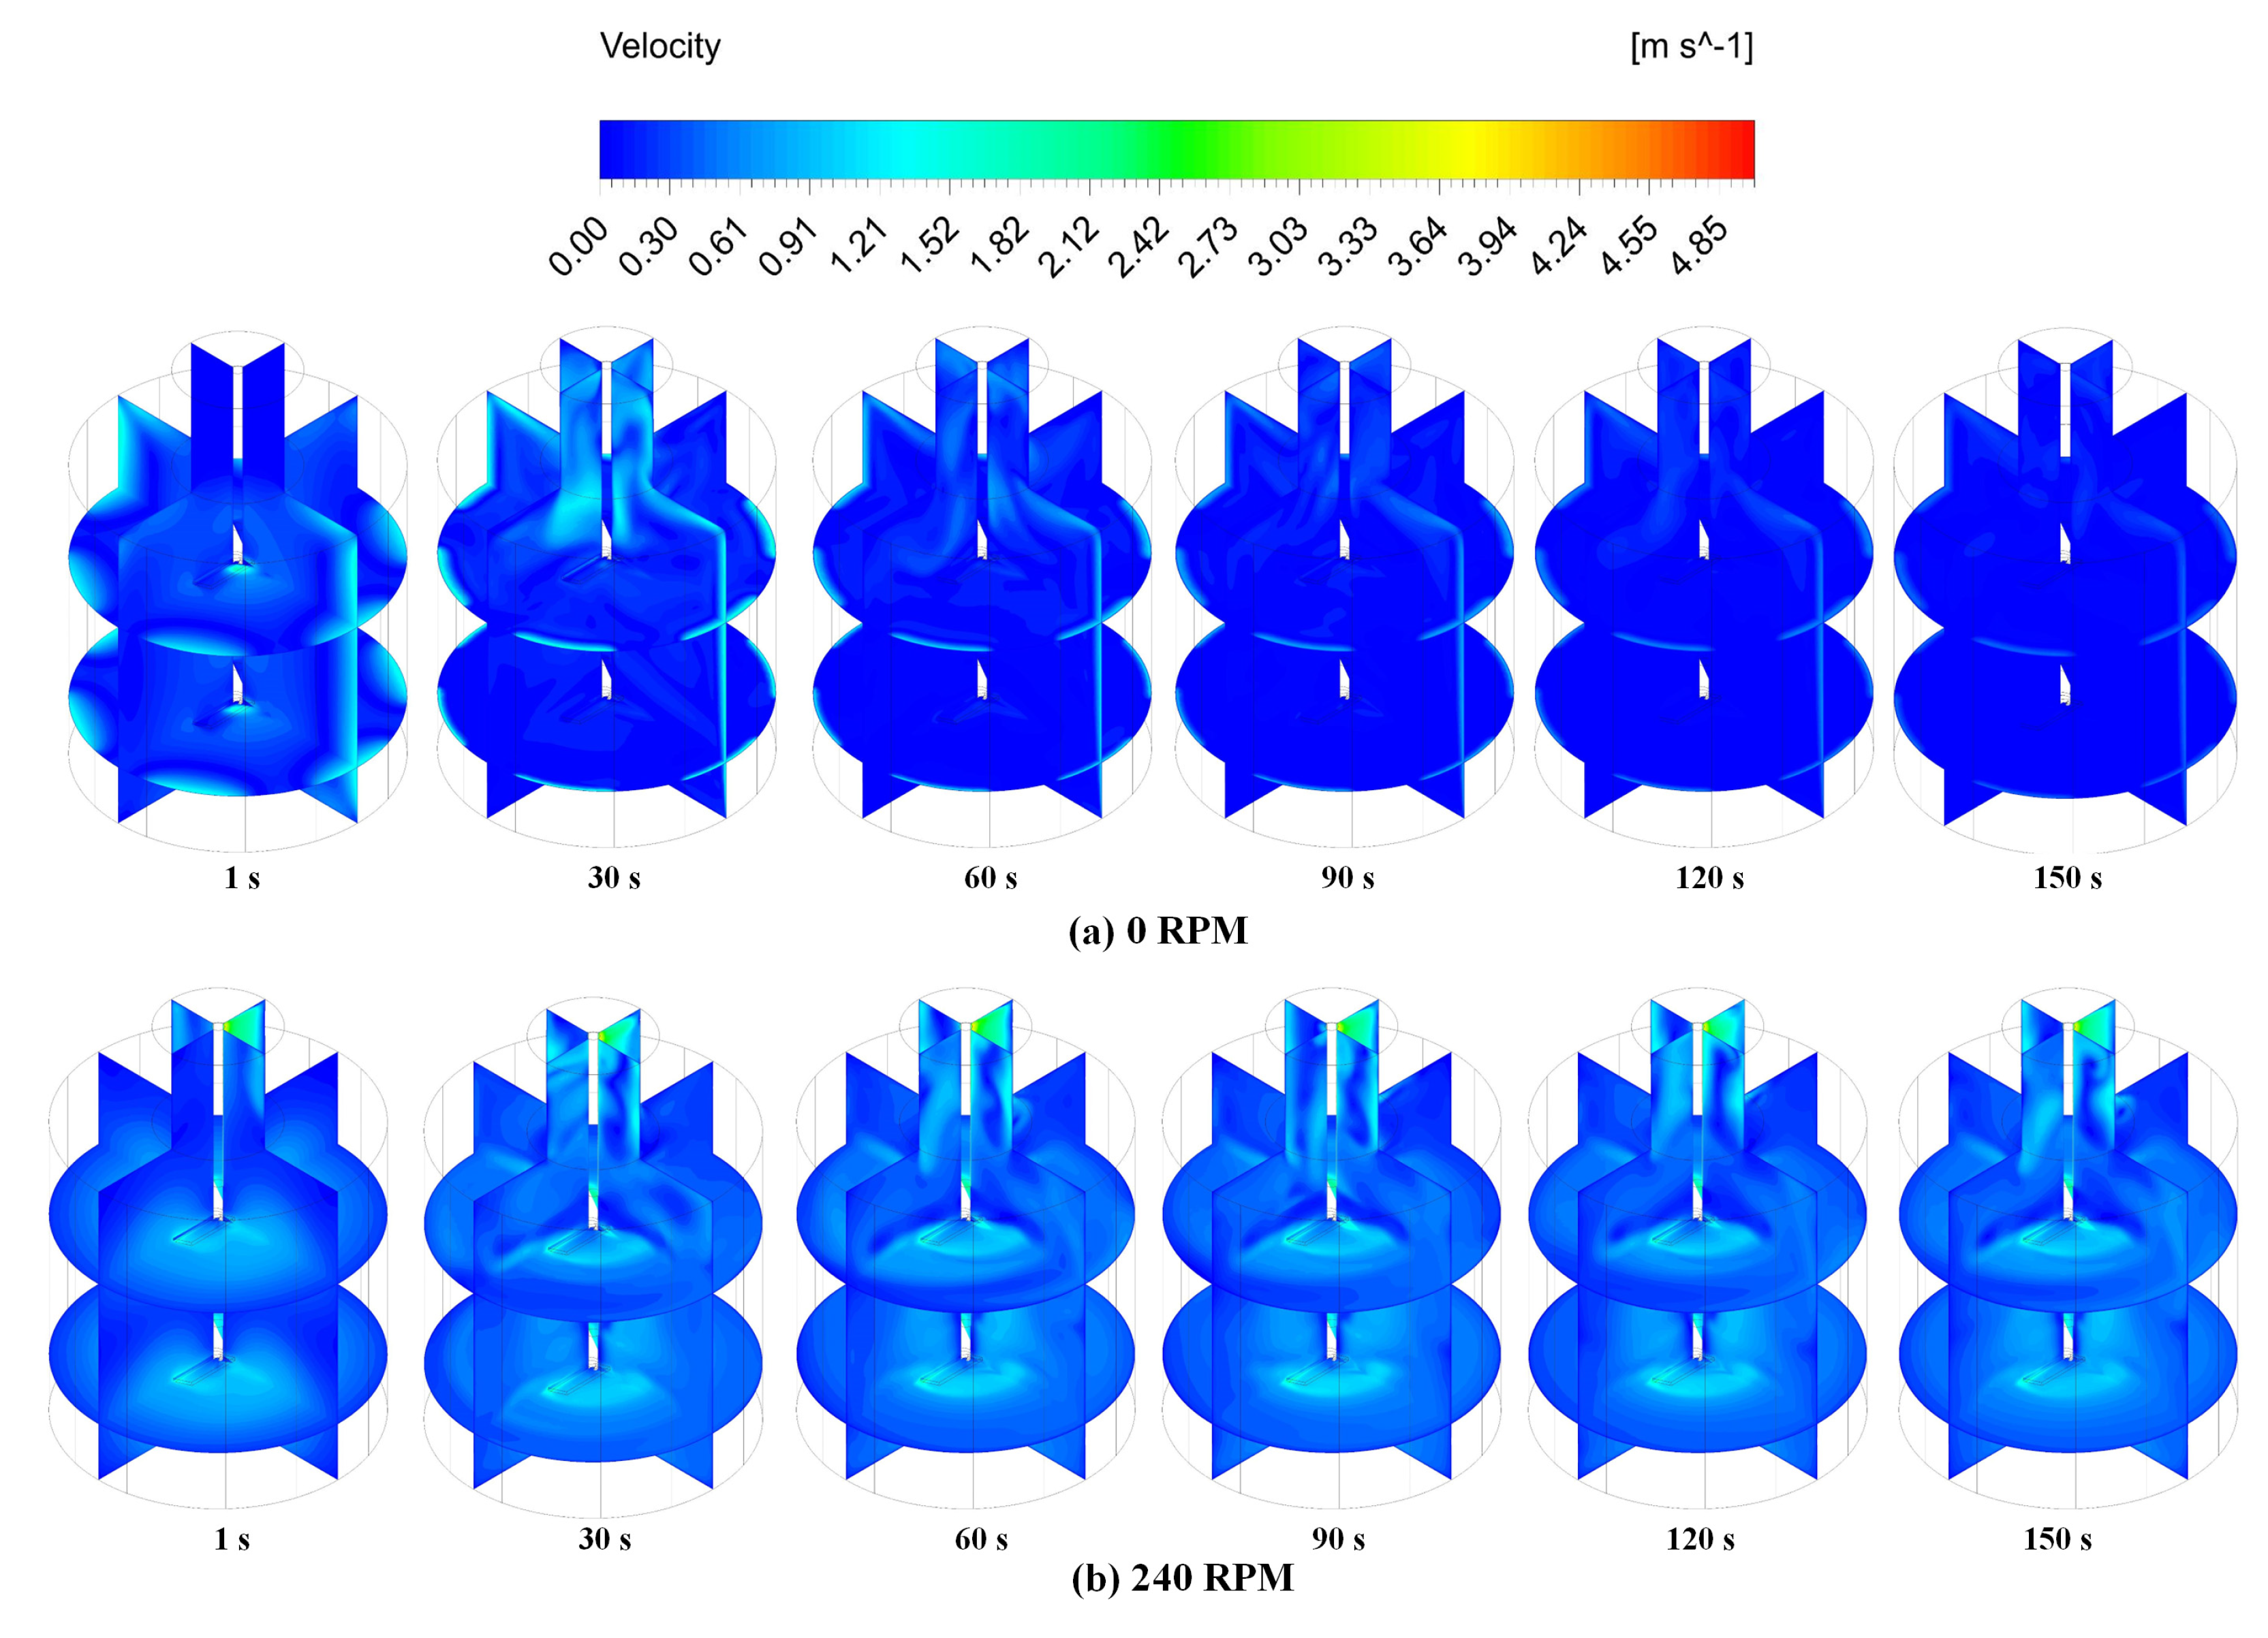
Figure 15: Velocity distribution in the furnace with time. (a) The impeller rotation speed of 0 RPM; (b) The impeller rotation speed of 240 RPM.
Fig. 16 illustrates the distribution of turbulent kinetic energy in the furnace for impeller speeds of 0 RPM and 240 RPM. For an impeller speed of 0 RPM, the flow in the furnace is dominated by natural convection. Initially, the temperature distribution in the furnace is not uniform and the intensity of natural convection is higher, but the intensity of natural convection decreases as the temperature of the air in the furnace tends to become more uniform. It is worth noting that the turbulent kinetic energy is mainly concentrated in the distribution near the heated wall. The overall turbulent kinetic energy in the furnace is more intense at 240 RPM, and the turbulent kinetic energy is mainly induced by the impeller rotation. And it did not show decay within the whole time period.
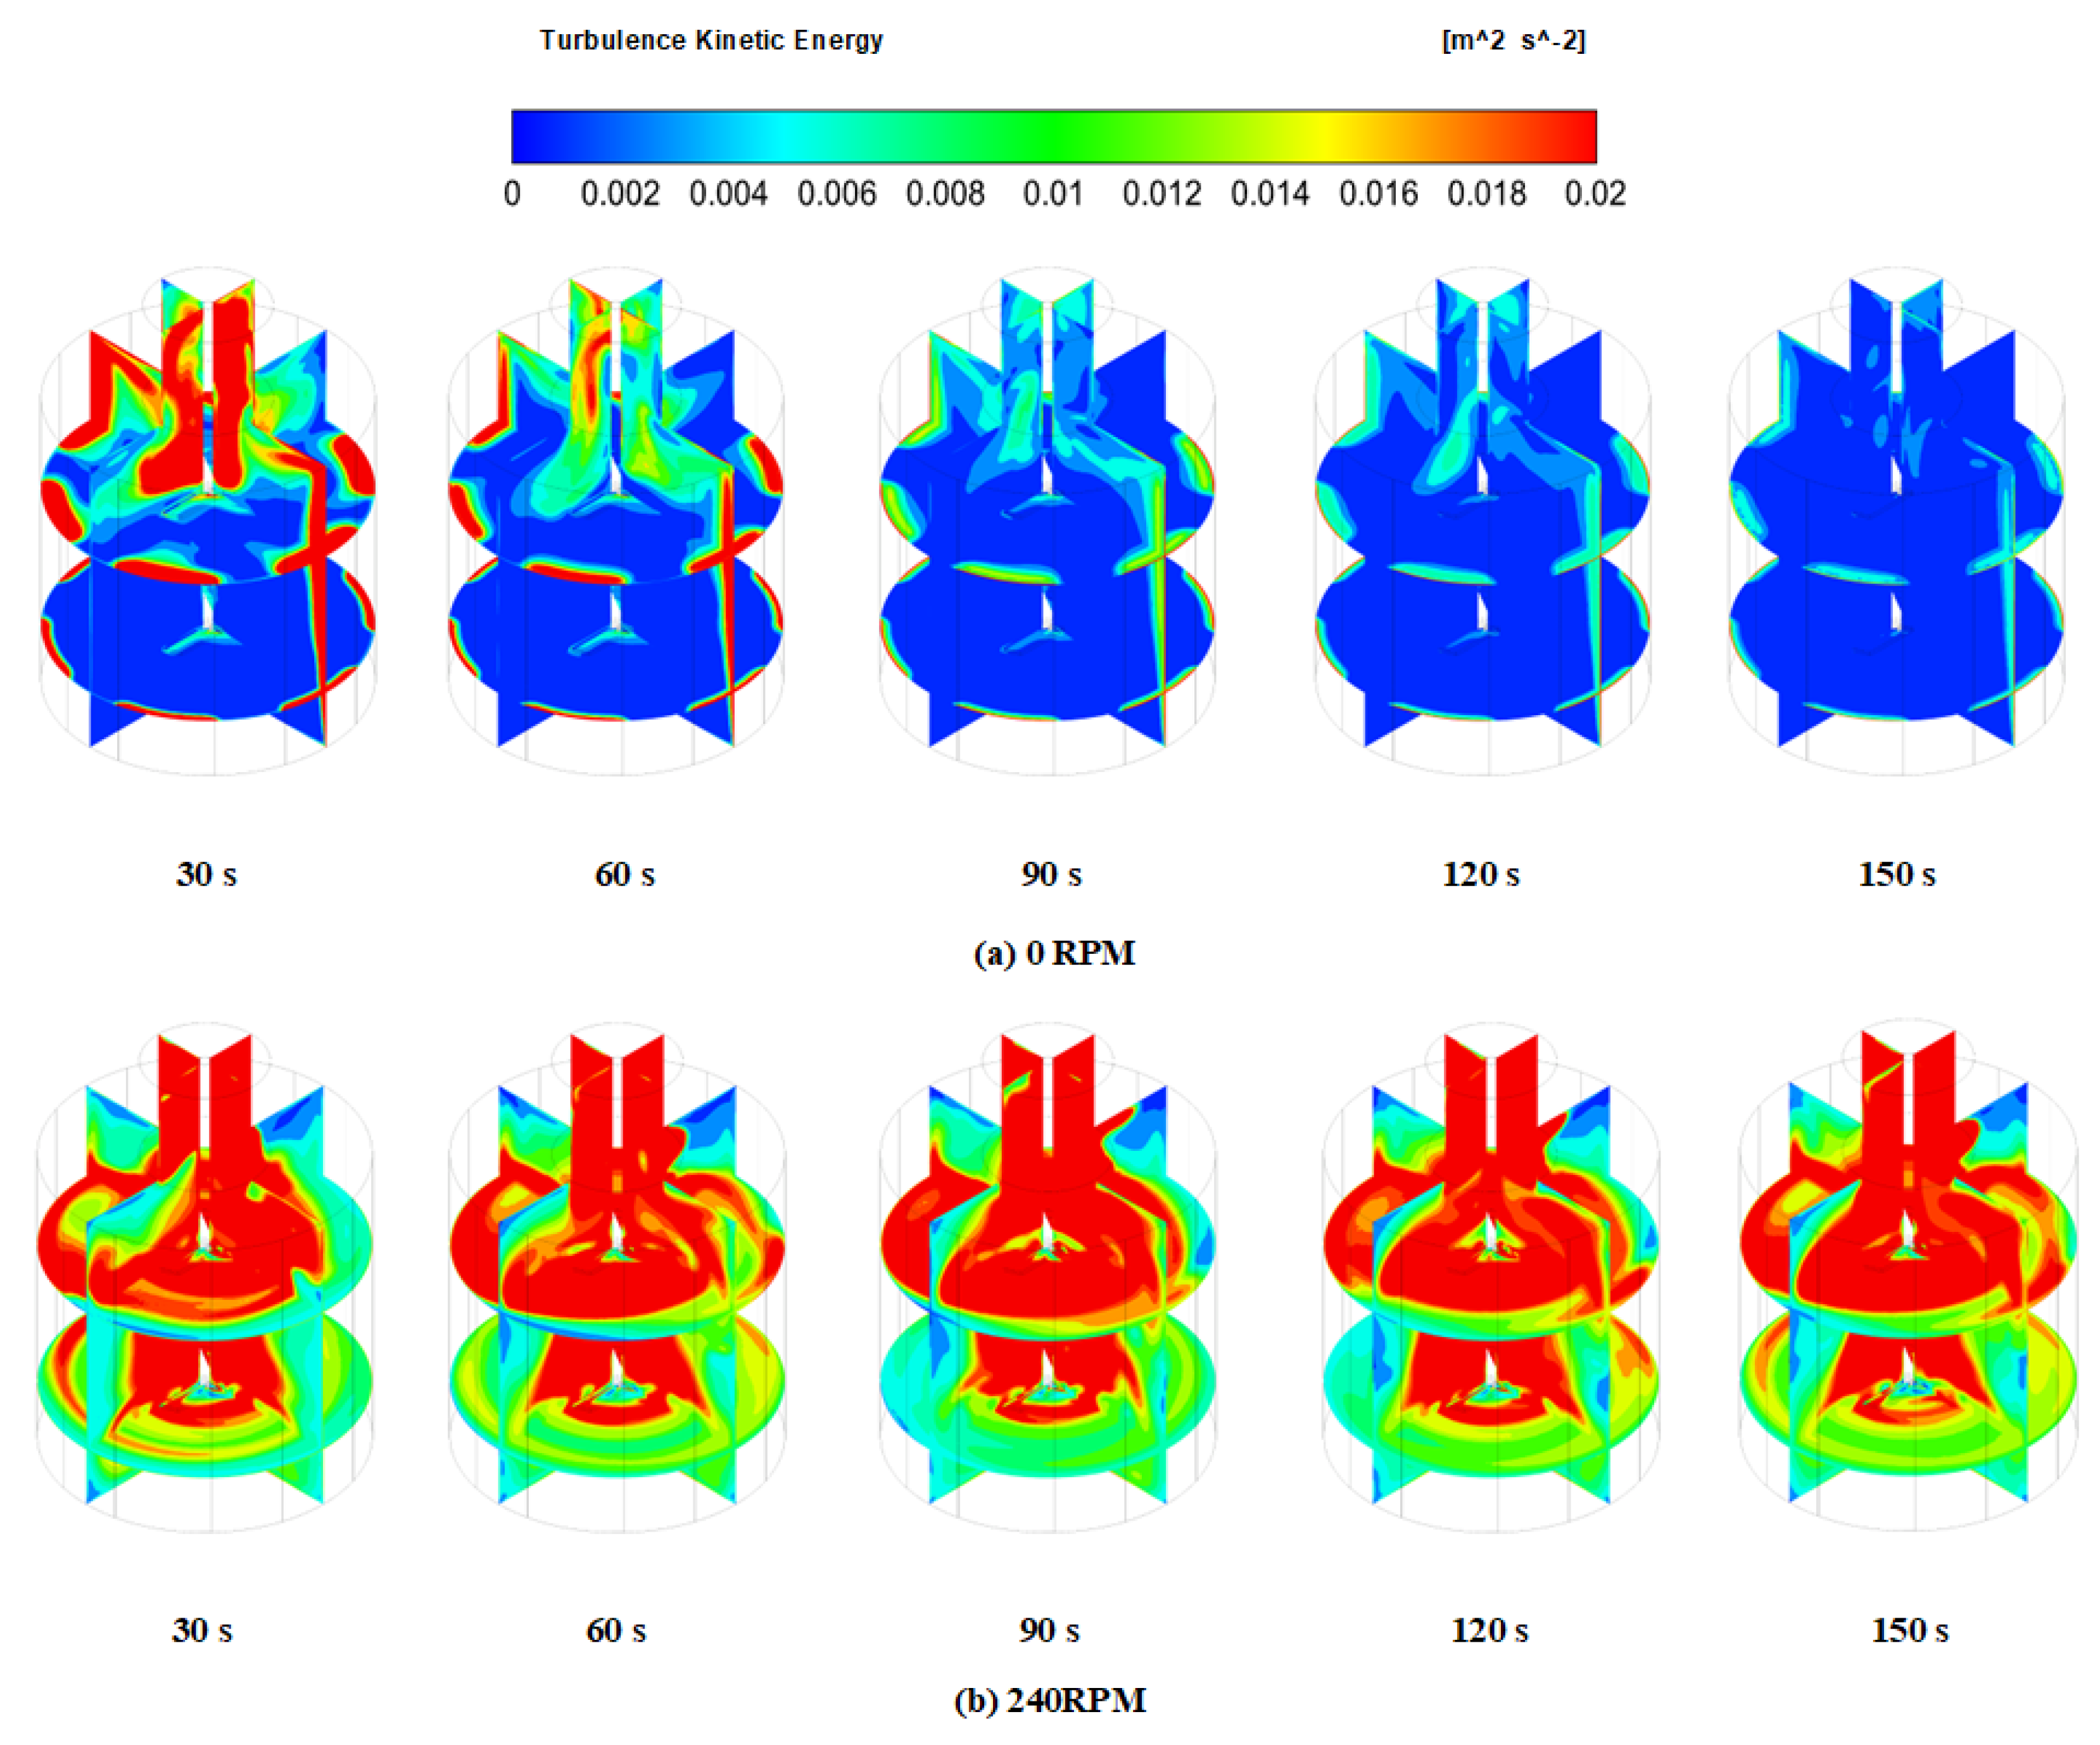
Figure 16: Turbulent kinetic energy distribution in the furnace with time. (a) The impeller rotation speed of 0 RPM; (b) The impeller rotation speed of 240 RPM.
As shown in the Fig. 17, in addition to the initial unsteady state of the flow, the volume-averaged turbulent kinetic energy inside the furnace increases as the impeller speed increases. At an impeller speed of 60 RPM, the turbulent kinetic energy induced by impeller rotation is small, and the turbulent kinetic energy is still due to natural convection in the furnace. As the impeller does not rotate or the impeller speed is low (60 RPM), the turbulent kinetic energy inside the furnace will be attenuated with the intensity of natural convection weakened by the uniform fluid distribution inside the furnace. When the impeller speed exceeds 120 RPM, the flow is mainly driven by impeller rotation, and the turbulent kinetic energy tends to remain constant as the flow enters a steady state.
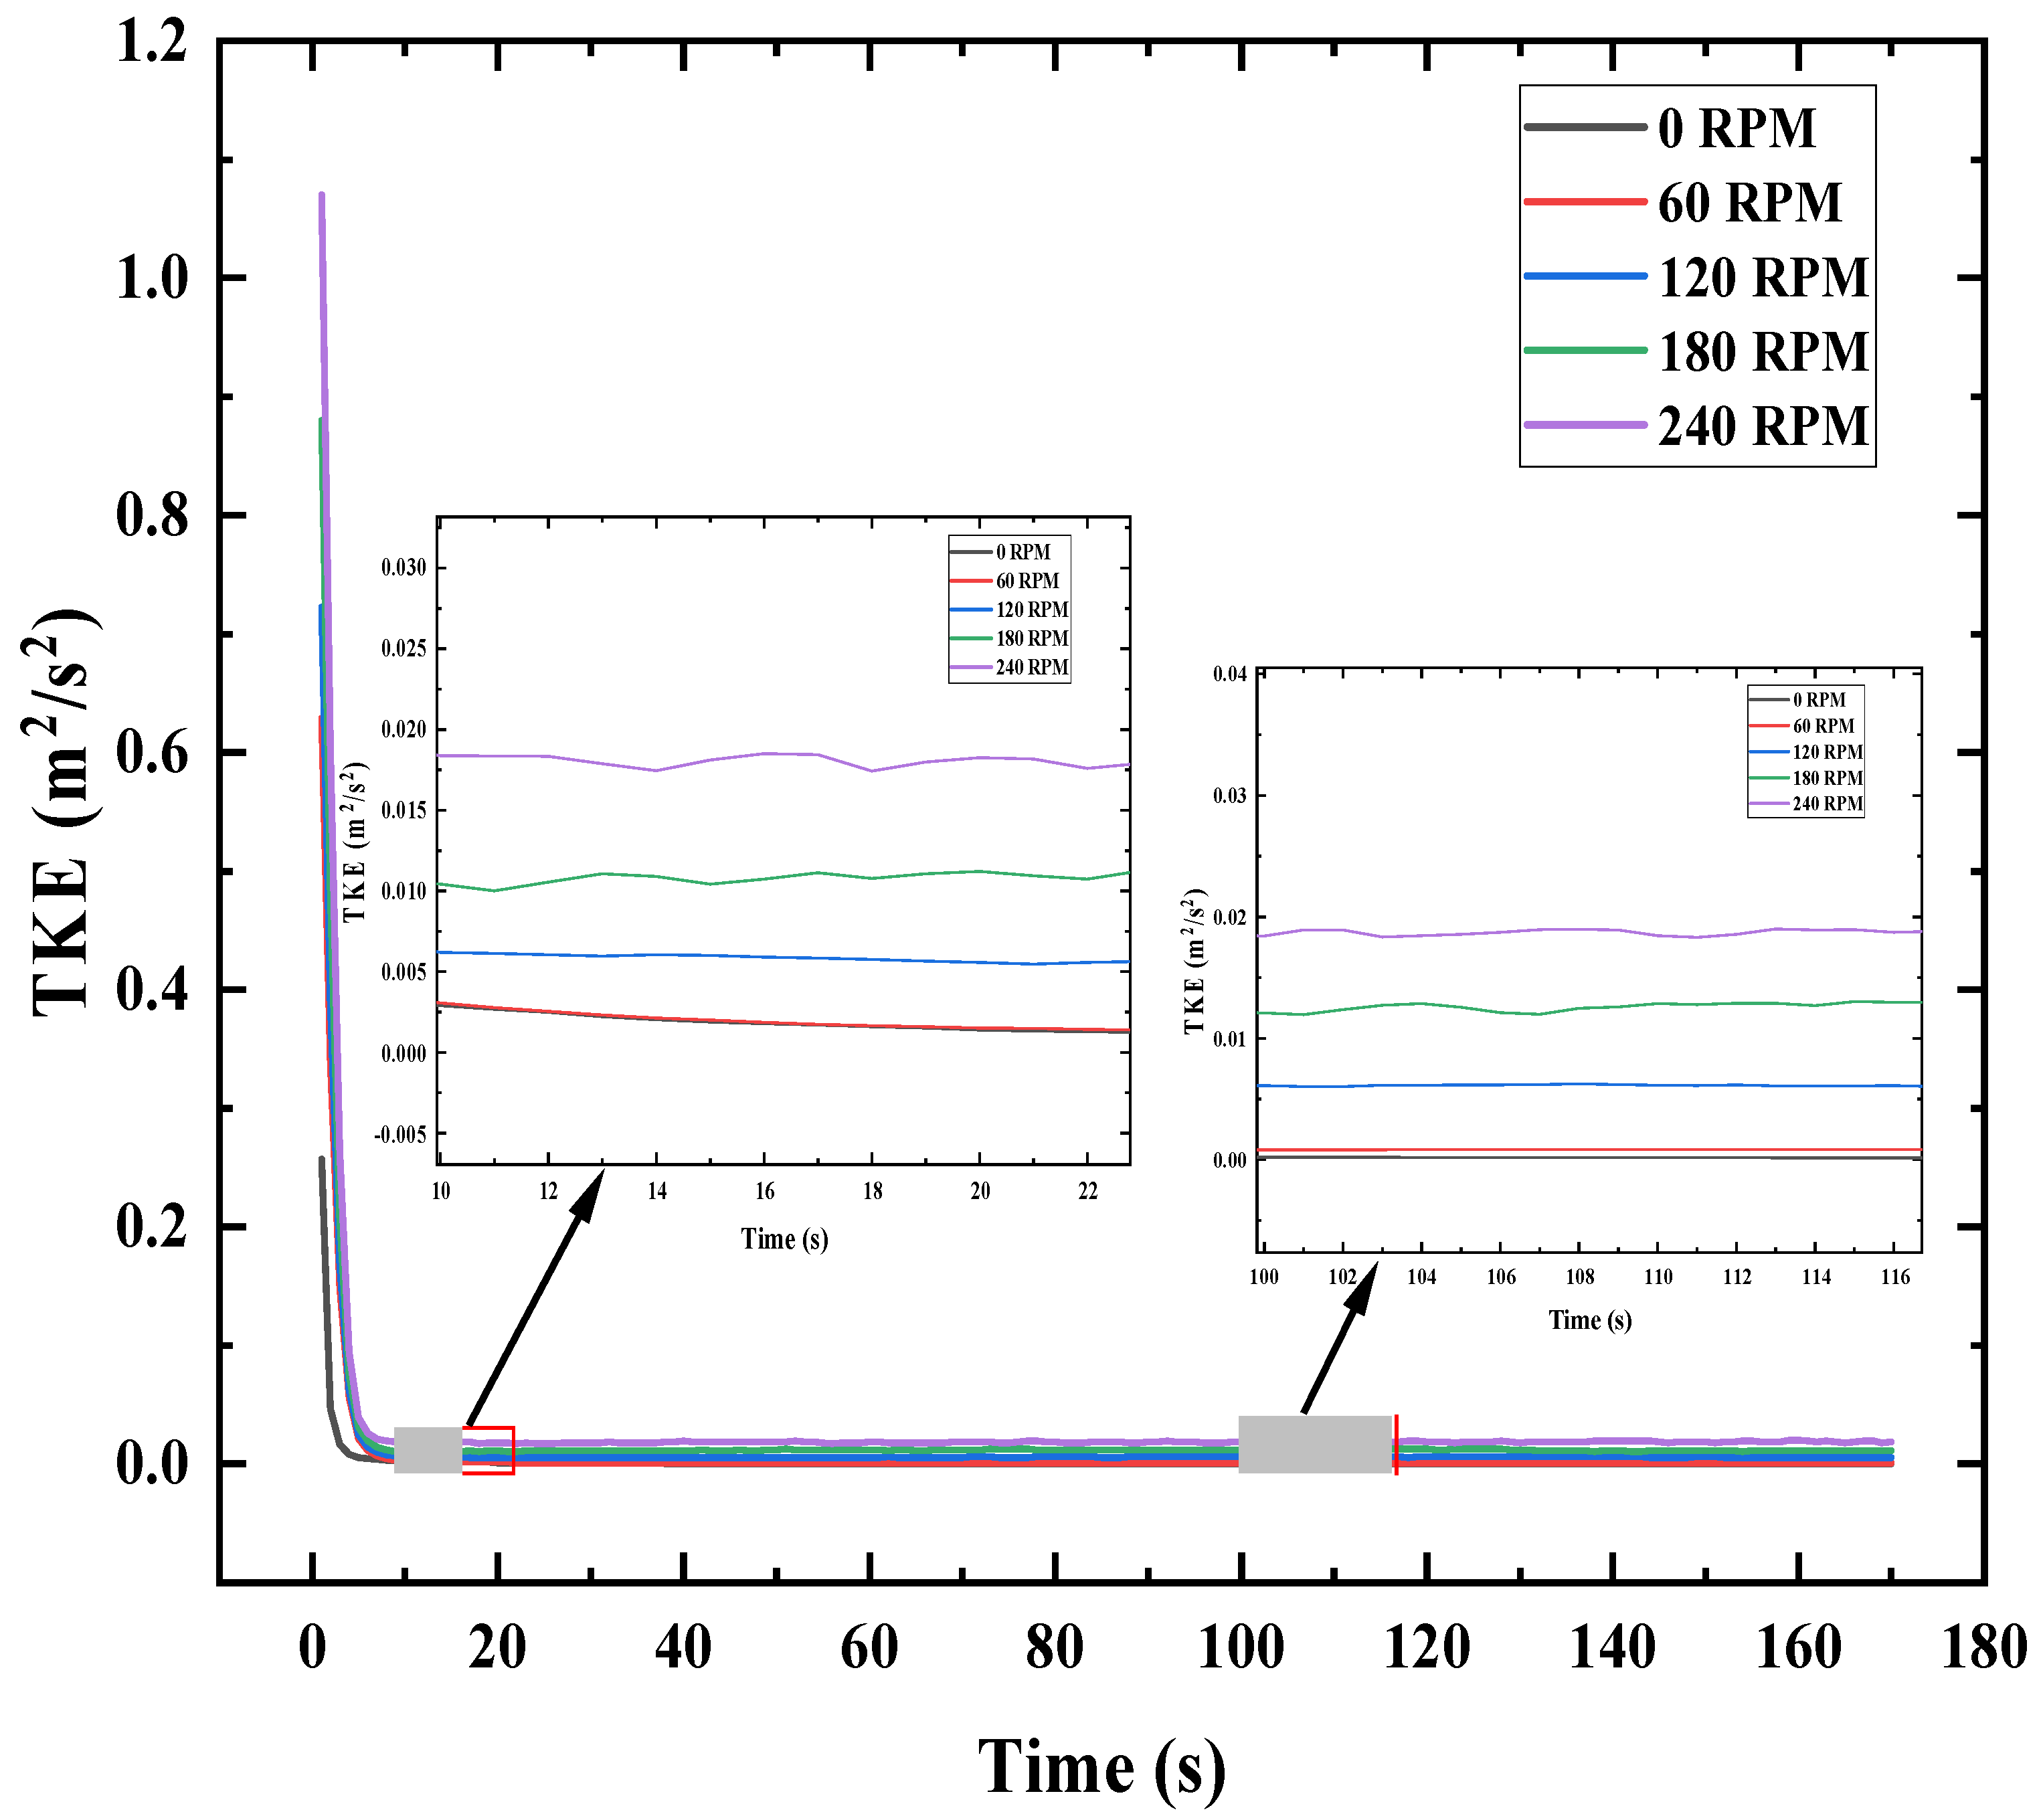
Figure 17: Variation of Turbulent kinetic energy with time for different impeller rotational velocities.
Fig. 18 shows the flow lines in the furnace at different rotational speeds when the heating time is 30 s. The localized flow generated by the natural convection leads to the flow in the flow field and its instability, and the natural convection generates an upward flow near the wall, which generates vortices near the wall, and multiple vortices that are smaller than the scale of the flow field are generated in the furnace due to the combined effect of the natural convection and the rotation of the impeller. For an impeller speed of 0 RPM, the vortices are mainly concentrated at the upper end of the flow field, indicating that the buoyancy force generated by the density difference is the main factor in generating mixing. When the impeller speed is 60 RPM, only very small vortices are generated near the impeller, indicating that the rotation of the impeller does not produce strong mixing. As the rotational speed of the impeller continues to increase, the vortex generated by the impeller rotation dominates the whole flow field, especially when the rotational speed reaches 240 RPM, the vortex generated by the impeller rotation occupies the whole flow field, which significantly weakened the thermal boundary layer of the heated wall, which explains why the rotational speed of the impeller of 240 RPM brings about a significant enhancement of heat transfer.
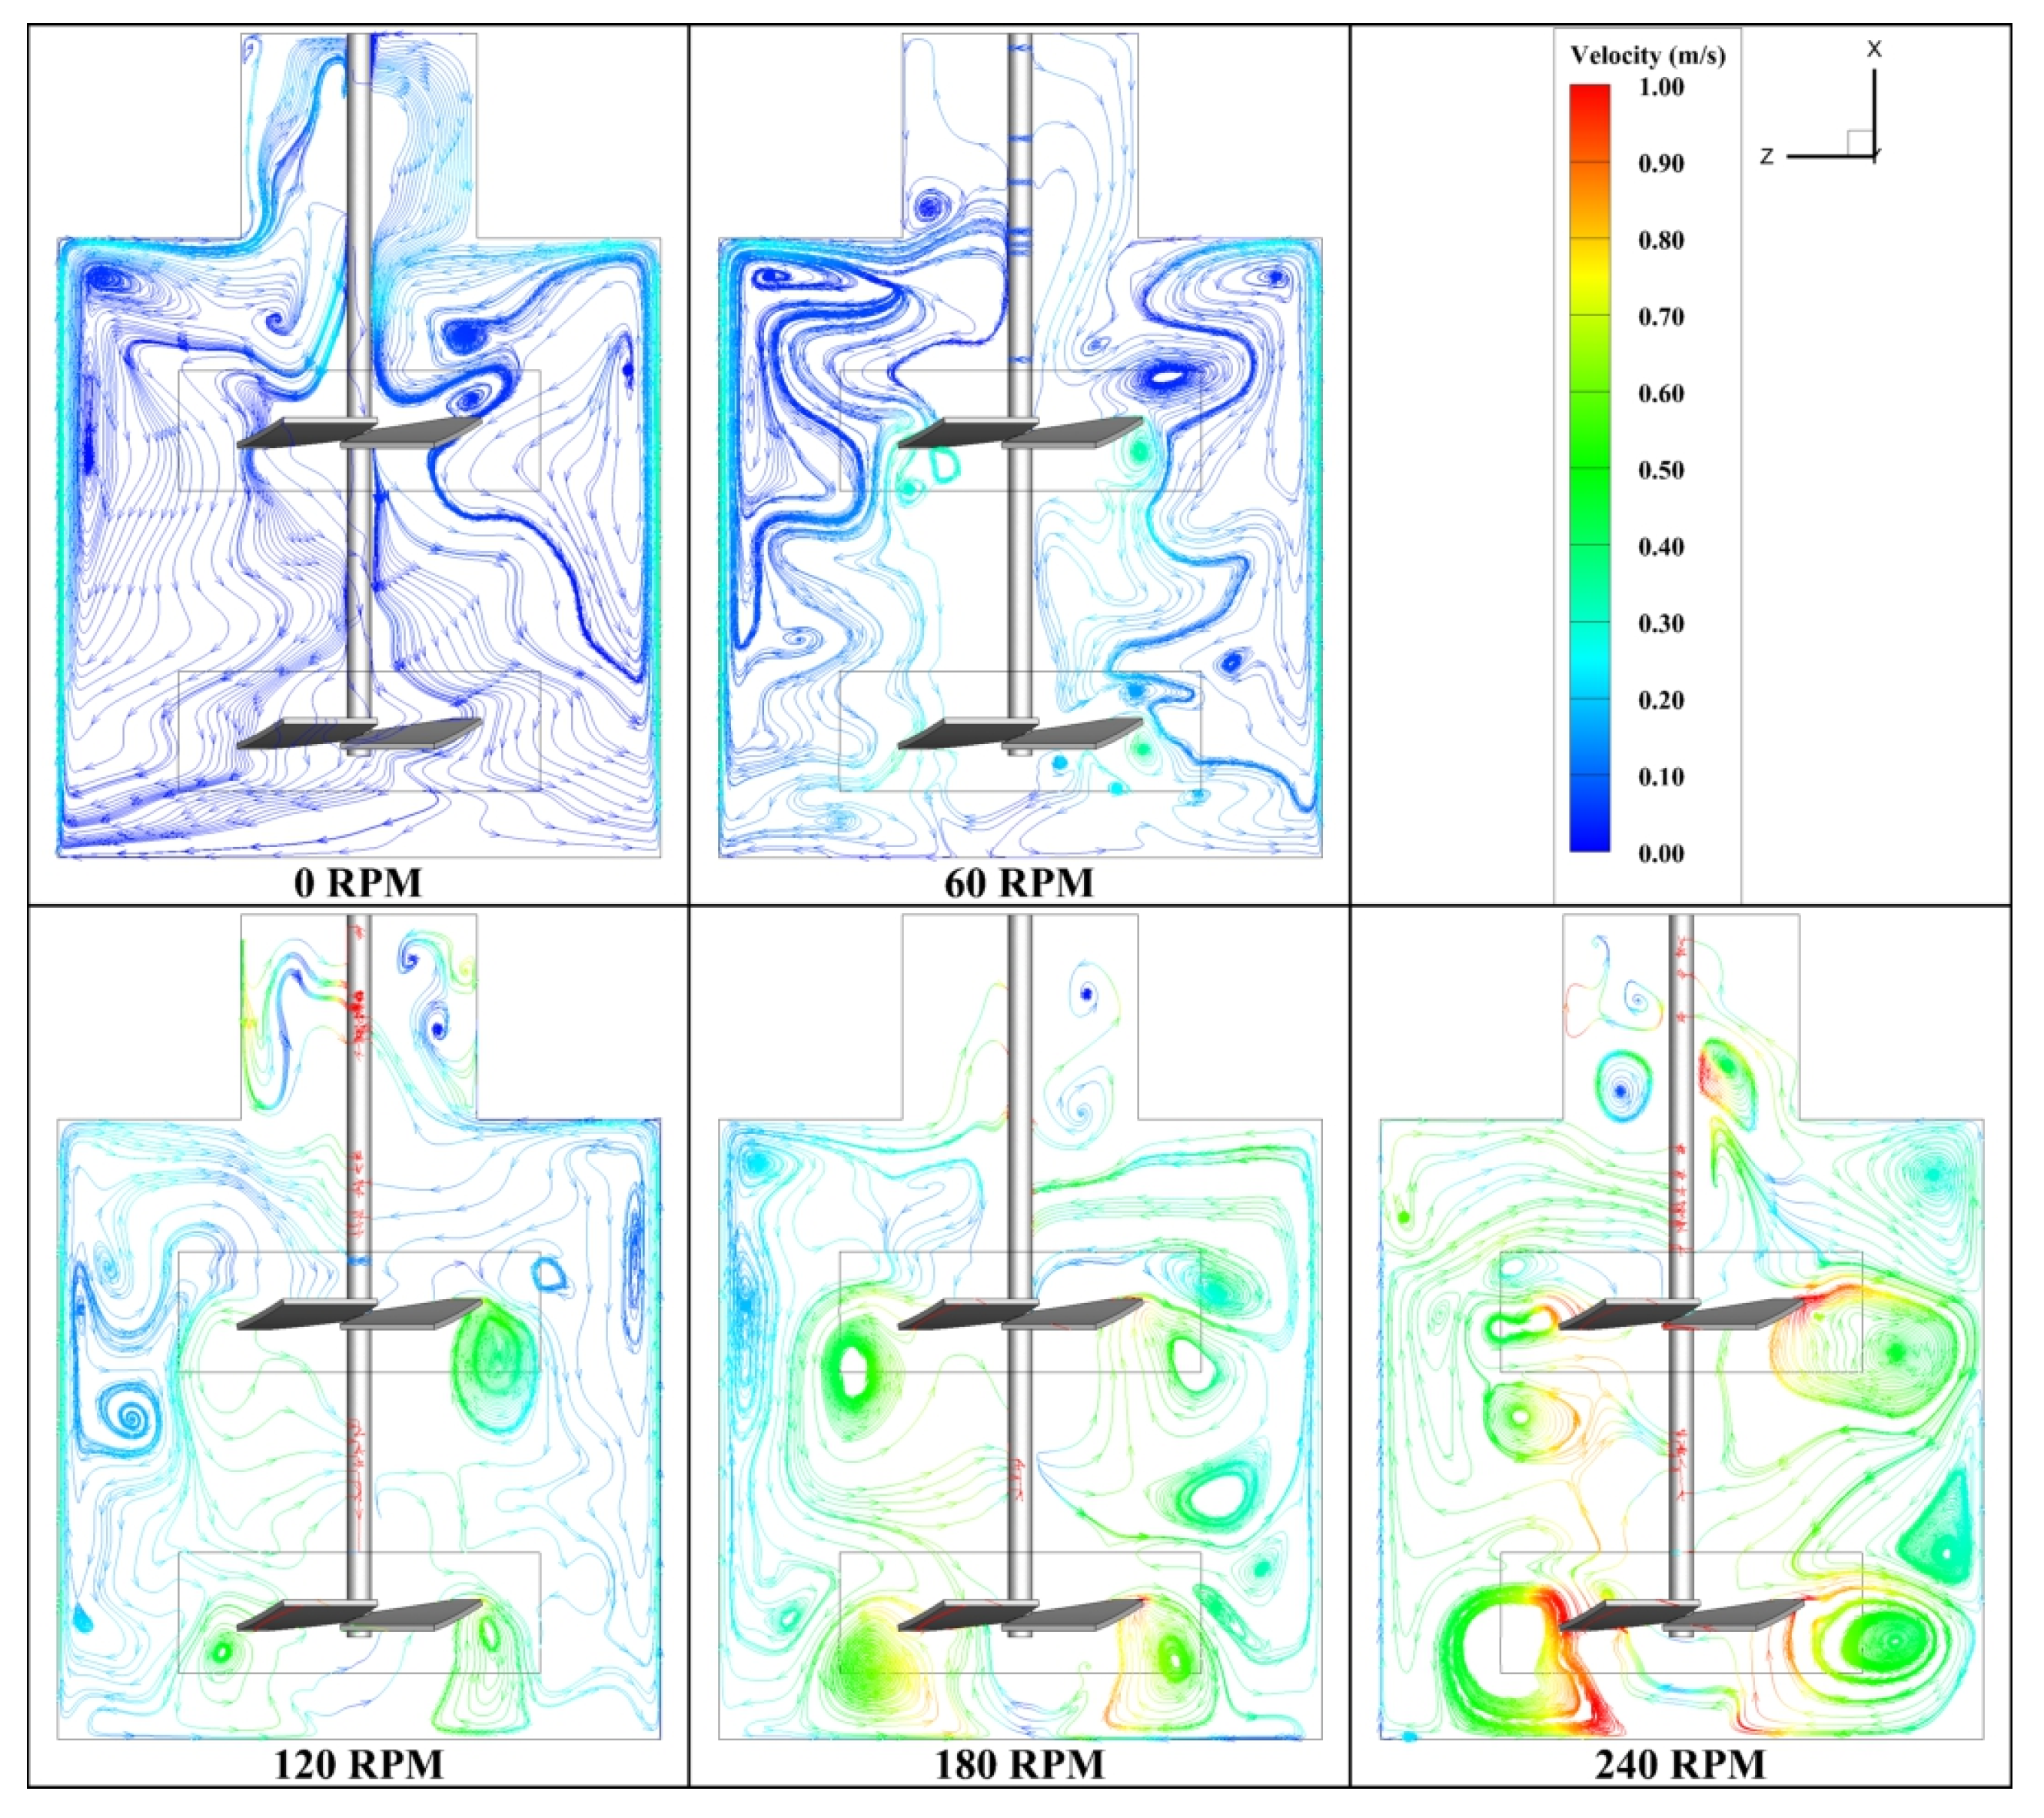
Figure 18: Streamline distribution in the furnace.
Fig. 19 shows the streamline distribution of the cross section at the two impellers, increasing the impeller speed provides tangential velocity and the velocity field spreads around from the vicinity of the impeller. However, when the impeller speed is 0 RPM, the natural convection also produces a certain amount of swirling, and in the vicinity of the upper impeller, small-scale vortices are generated. Increasing the impeller rotational speed primarily yields greater tangential velocity, with the vortex developing solely around the impeller.
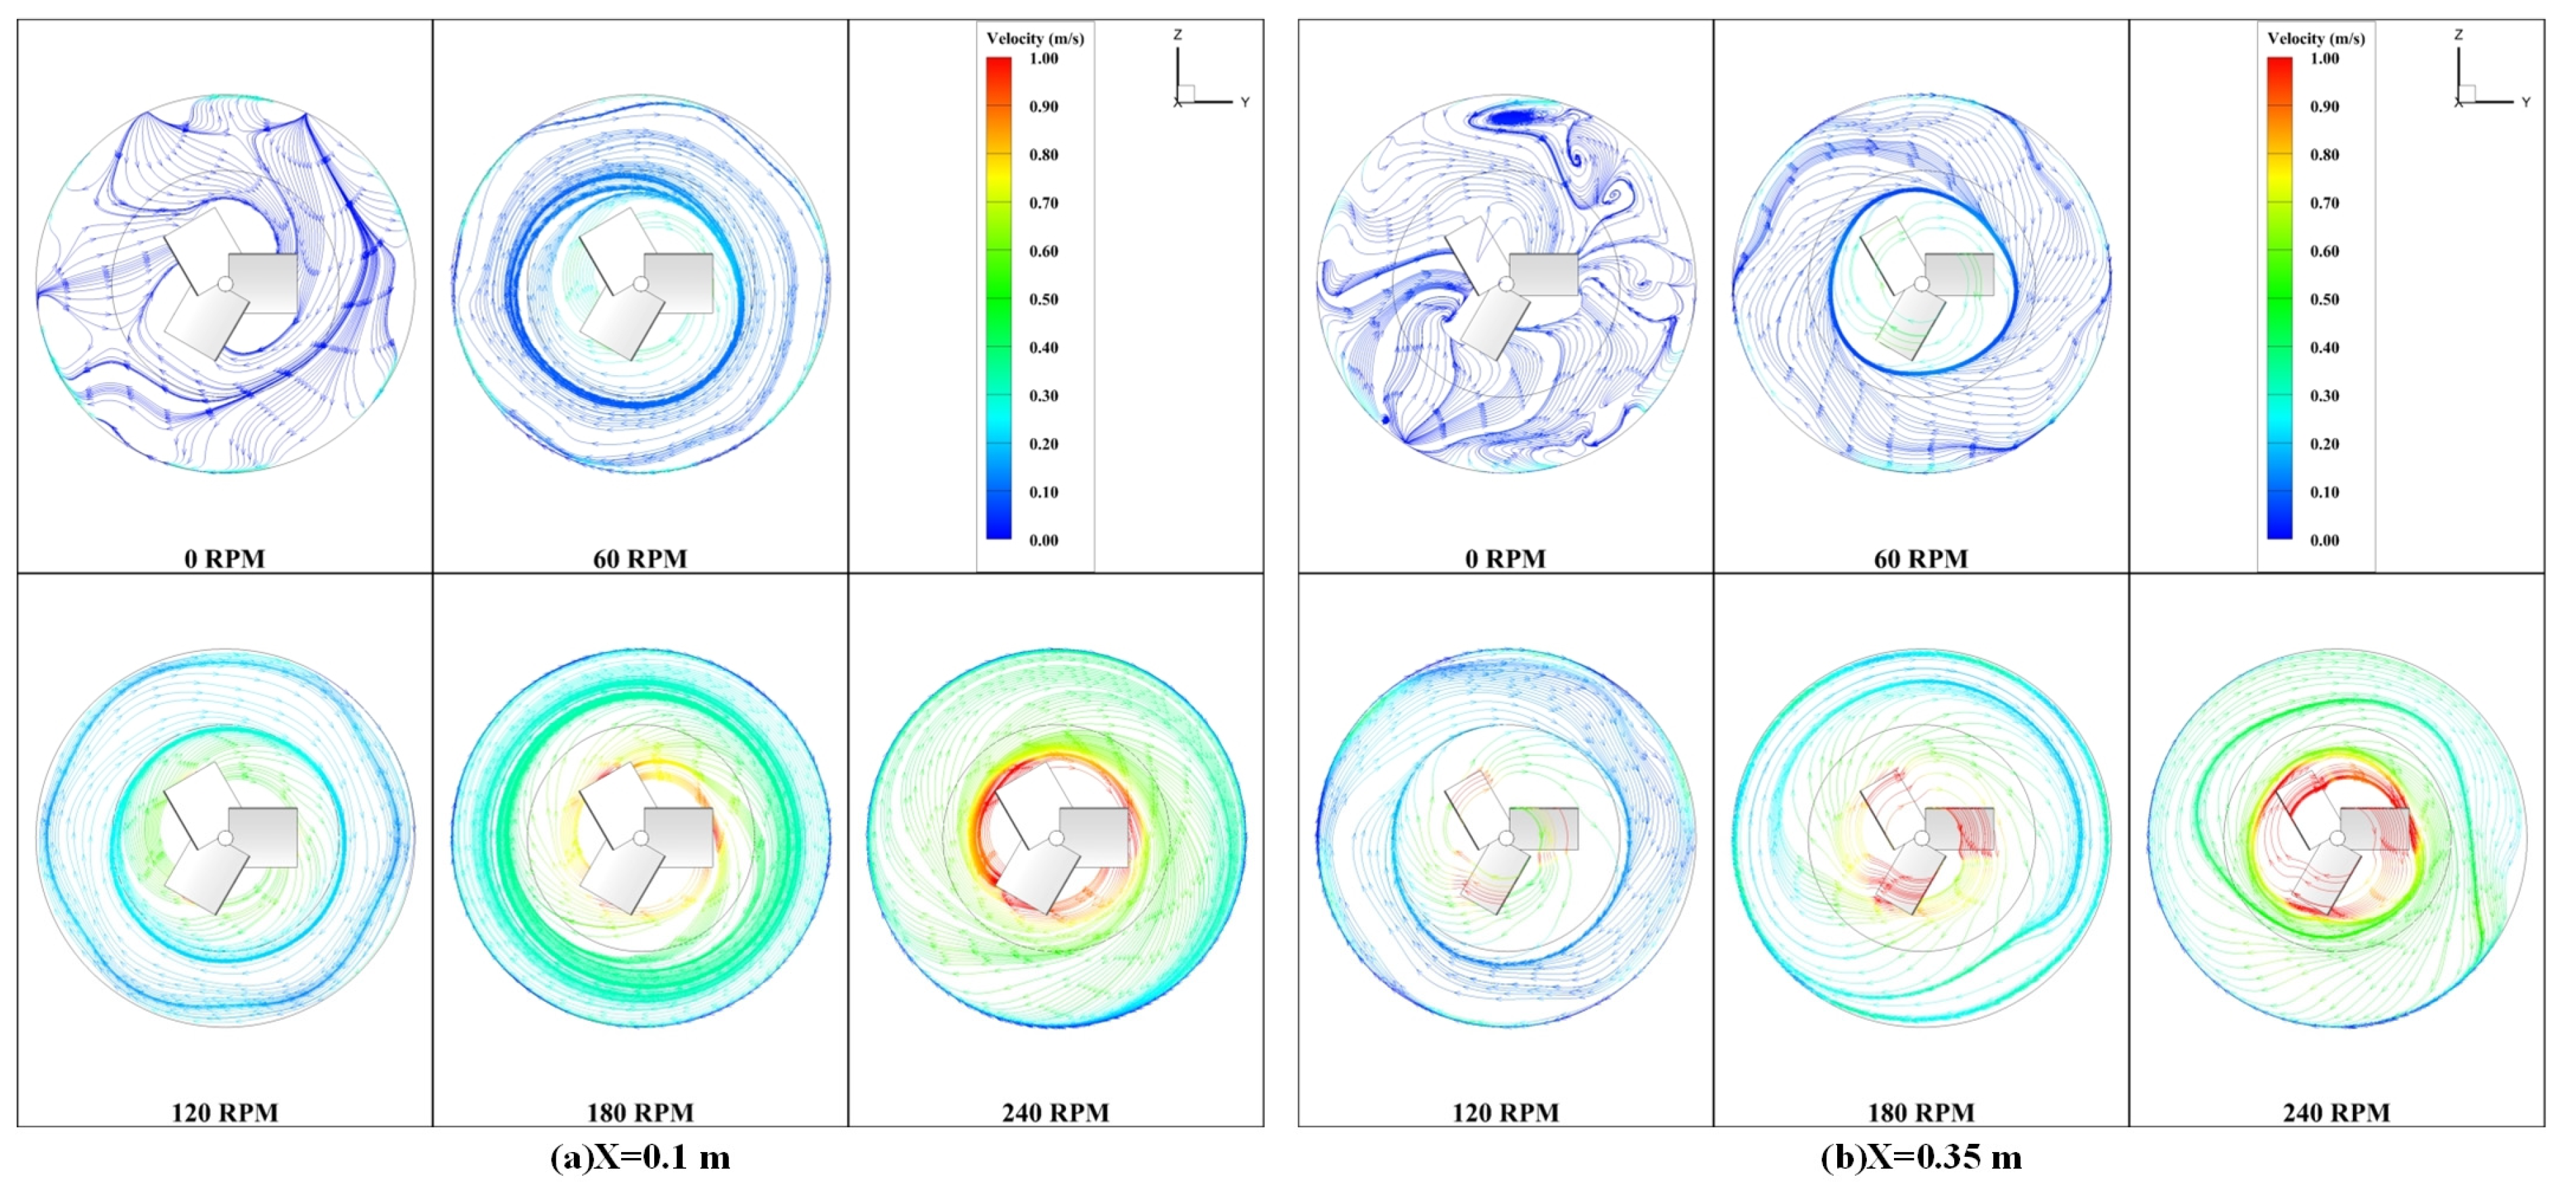
Figure 19: Streamlines at the impeller position. (a) Axial position X = 0.1 m; (b) Axial position X = 0.35 m.
As demonstrated in the preceding analysis, it is evident that the integration of the impeller has resulted in substantial enhancements in the temperature field, velocity field, and vortex within the furnace. During the actual pyrolysis process, these enhancements will, to a certain extent, reduce the furnace’s energy dissipation into the environment, thereby achieving higher heating efficiency. On the other hand, the increased intensity of the vortex will enhance the mixing of the reactants. During pyrolysis, this will directly improve the distribution and quality of the pyrolysis products.
The swirl number is a key dimensionless parameter in rotating flow models, characterising the relative strength of rotational and axial motion within the flow field. It directly influences flow structure, turbulence characteristics, heat transfer efficiency, and temperature uniformity, serving as a vital tool for analysing and optimising rotating flow systems [26,27]. Therefore, to characterise the vortex motion patterns throughout the fluid flow field, a dimensionless parameter known as the swirl number (S) is introduced. The equation for the calculation of the swirl number is as follows [28,29]:
The Cartesian coordinate system used by Fluent is converted to a polar coordinate system, and the conversion of the coordinates is performed using the formulae. ux and uθ are the axial and tangential velocities, and Fluent provides the calculation of tangential and axial velocities in the x-axis.
Fig. 20 illustrates the axial vorticity distribution during 30 s of furnace heating. At 0 RPM, natural convection generates a degree of swirling throughout the axial position. When the impeller speed is below 180 RPM, an increase in rotational speed paradoxically reduces the swirl density within the furnace, corresponding to the tangential streamline distribution at the impeller position shown in Fig. 19. The generated swirls form exclusively around the impeller, and at low fluid velocities, substantial swirl intensity cannot be achieved. At this stage, the swirls density in the upper furnace section remains strong. This is attributable to the presence of irregular, small-scale vortices distributed throughout the upper furnace, corresponding to the streamline distribution within the furnace depicted in Fig. 18. When the rotational speed increases to 240 RPM, the axial swirl intensity intensifies, with significant changes occurring in the vicinity of the impeller. This occurs because at 240 RPM, the vortex velocity is substantially higher, generating high-intensity turbulence within the furnace. Considering the combined effects of the velocity and temperature fields on heat transfer within the furnace, alongside factors such as reactant mixing and energy dissipation during actual pyrolysis processes, it can be preliminarily concluded that the optimum impeller rotational speed is 240 RPM.
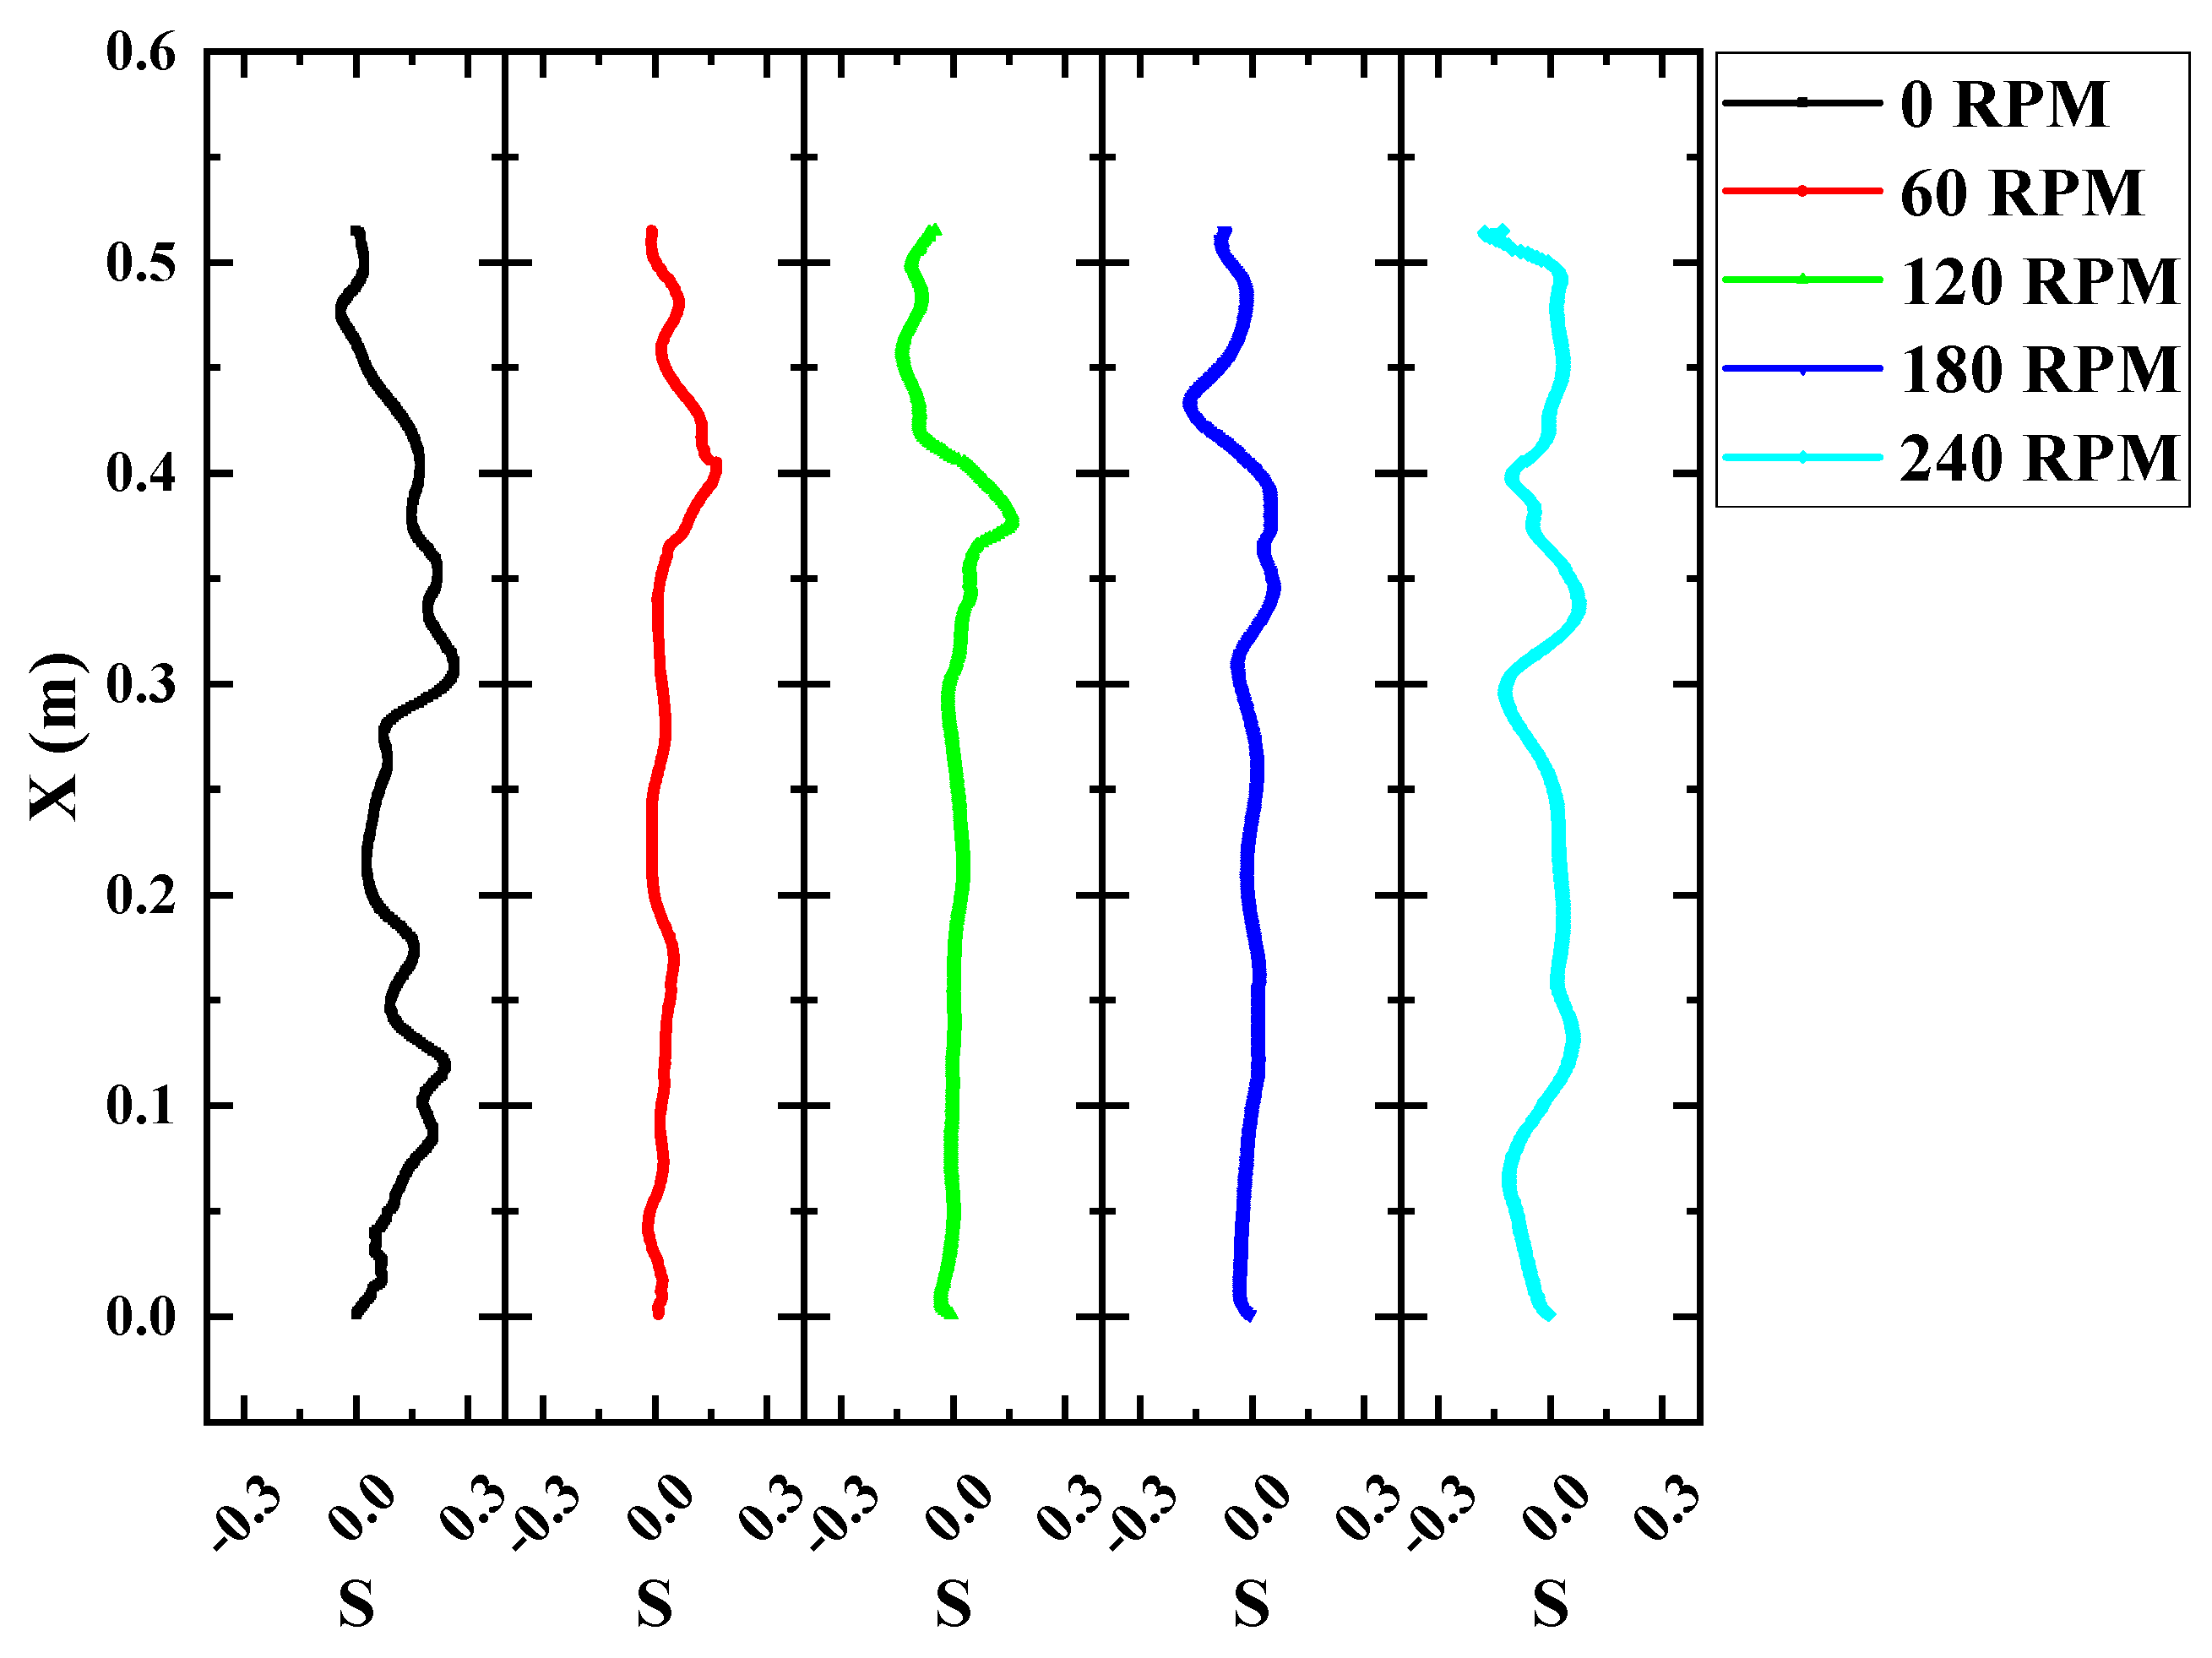
Figure 20: Distribution of axial spin number at different rotational speeds at 30 s.
In the current work, numerical investigations have been carried out for the increase of impeller rotation in the confined space of a heating furnace, and the results of simulations and experiments on the temperature rise characteristics of the fluid are in agreement. The simulation results explain the effect of impeller rotation on the heating heat transfer enhancement in the furnace.
- (1)The forced convection generated by the impeller rotation effectively intensifies the heat exchange between the fluid in the furnace chamber and the heated wall. After 30 s of heating, the forced convection significantly improved the uniformity of the heat flux distribution on the heated wall, thereby notably enhancing the local heat transfer at the wall surface. An impeller speed of 240 RPM achieved the optimal enhancement in heat transfer rate due to the forced convection effect. Compared to a stationary impeller, the average heat transfer coefficient throughout the heating process increased by approximately 50%.
- (2)The heat transfer enhancement due to impeller rotation primarily manifests in the intensification of thermal mixing within the fluid. During the initial heating stage, compared to a stationary impeller, the involvement of a rotating impeller strengthened the decreasing trend of the average heat flux curve at the heated wall. As the heat transfer process approached a steady state, the heating time required for the average heat flux at the heated wall to decrease to the same level was significantly reduced at an impeller speed of 240 RPM. Furthermore, at the same heating time, the heat flux was approximately 50 W/m2 lower compared to other scenarios. An impeller speed of 240 RPM enhances fluid thermal mixing, leading to a faster attainment of the target temperature.
- (3)Impeller rotation effectively mitigates thermal stratification within the furnace, significantly improving the uniformity of the internal temperature field. Under natural convection conditions, the average axial temperature difference within the furnace could reach about 200 K. Increasing the impeller speed reduced this axial temperature difference, with higher speeds resulting in smaller differences. However, at low speeds (60 RPM), the forced convection effect had minimal impact on the axial temperature distribution trend at two corresponding impeller locations (X = 0.1 m and X = 0.35 m). When the impeller speed reached 240 RPM, the local average axial temperature difference decreased significantly, the overall axial temperature difference was reduced to below 50 K, and the fluid in the furnace chamber achieved the most uniform temperature distribution state in approximately 80 s.
- (4)The increased turbulent kinetic energy and swirl effect induced by high impeller speeds significantly enhance heat transfer. At an impeller speed of 240 RPM, both the flow field intensity and turbulent kinetic energy within the furnace were markedly enhanced and more uniformly distributed. The vortex effect generated by the impeller weakens the thermal boundary layer on the heated wall, promotes fluid mixing within the furnace, and leads to significant heat transfer enhancement. When the impeller speed reaches 240 RPM, the swirl effect generated by the impeller provides the most significant improvement in the uniformity of the flow field and temperature within the furnace. In the actual pyrolysis process, increased swirl intensity would also enhance the mixing of reactants, which could further improve the distribution and quality of the pyrolysis products.
Acknowledgement:
Funding Statement: This work was supported by the National Natural Science Foundation of China (Grant No. 52166004) and the Yunnan Fundamental Research Projects (Grant No. 202501AS070131).
Author Contributions: Hongyun Bai: Survey, methodology, data organization, validation, writing—original manuscript. Wenbo Shi: Investigation. Jianxin Xu: Supervision, writing—review and editing. Xiaowei Ma: Supervision, writing—review and editing. Jun Ma: Methodology. Shaoyin Zhu: data organization. Hua Wang: supervision, guidance. All authors reviewed and approved the final version of the manuscript.
Availability of Data and Materials: The datasets generated and analyzed during the current study are not publicly available due to confidentiality request by the party providing the data but are available from the corresponding author on reasonable request.
Ethics Approval: Not applicable.
Conflicts of Interest: The authors declare no conflicts of interest.
Nomenclature
| The area of the heated surface (m2) | |
| Area of the heated surface in the x-direction (m2) | |
| Specific heat capacity (J/(kg·K)) | |
| Characteristic length (m) | |
| Gravitational acceleration (m/s2) | |
| Gravitational acceleration component in the i-direction (m/s2) | |
| Generation of turbulence kinetic energy due to mean velocity gradients | |
| Generation of turbulence kinetic energy due to buoyancy | |
| Transient heat transfer coefficient (W/(m2·K)) | |
| Thermal conductivity (W/(m·K)) | |
| kt | Turbulent kinetic energy (m2/s2) |
| Characteristic length (m) | |
| Rotational speed (rev/min) | |
| Number of points | |
| Pressure (Pa) | |
| Prandtl number | |
| Turbulent Prandtl number | |
| Radial coordinate | |
| Radius (m) | |
| RPM | Impeller rotational speed (rev/min) |
| Re | Reynolds number |
| Gr | Grashof number |
| Ra | Rayleigh number |
| Swirl number | |
| User-defined source term for | |
| User-defined source term for | |
| Time (t) | |
| Static temperature (K) | |
| TKE | Turbulent kinetic energy (m2/s2) |
| Ti | Measurement value of the i-th data point (K) |
| Arithmetic mean of all measured values (K) | |
| Reference temperature (K) | |
| Tave | Average temperature (K) |
| Wall temperature (K) | |
| Ambient temperature (K) | |
| Velocity components in the i and j directions (m/s) | |
| Axial velocity (m/s) | |
| Tangential velocity (m/s) | |
| Volume (m3) | |
| Spatial coordinates | |
| X | Axial position (m) |
| Contribution of fluctuating dilatation in compressible turbulence to the overall dissipation rate | |
| Inverse effective Prandtl number for | |
| Inverse effective Prandtl number for | |
| Thermal expansion coefficient (1/K) | |
| Turbulent dissipation rate (m2/s3) | |
| Thermal conductivity (W/(m·K)) | |
| Dynamic viscosity (Pa·s)) | |
| Turbulent viscosity (Pa·s) | |
| Effective viscosity (Pa·s) | |
| Kinematic viscosity (m2/s) | |
| Density (kg/m3) | |
| Standard deviation of temperature | |
| Turbulent Prandtl number for | |
| Turbulent Prandtl number for | |
| Model constants for the RNG k-ε model | |
| Direction components | |
| Turbulent | |
| ave | Average |
| Wall | |
| Ambient or free-stream | |
| Axial direction | |
| Tangential direction |
References
1. van Ditzhuijzen G , Staalman D , Koorn A . Identification and model predictive control of a slab reheating furnace. In: Proceedings of the International Conference on Control Applications; 2002 Sep 18–20; Glasgow, UK. p. 361– 6. doi:10.1109/CCA.2002.1040213. [Google Scholar] [CrossRef]
2. Ramana Rao MV , Plehiers PM , Froment GF . The coupled simulation of heat transfer and reaction in a pyrolysis furnace. Chem Eng Sci. 1988; 43( 6): 1223– 9. doi:10.1016/0009-2509(88)85093-0. [Google Scholar] [CrossRef]
3. Xu F , Wang Q , Wu C . Reactive force-field simulation of the effect of heating rate on pyrolysis behavior of lignite. Korean J Chem Eng. 2022; 39( 3): 576– 85. doi:10.1007/s11814-021-0981-3. [Google Scholar] [CrossRef]
4. Rahmani M , Martinez DM . Convection driven by a nonuniform radiative internal heat source in a cavity: Example of medical isotope production in liquid targets. Int J Heat Mass Transf. 2024; 231: 125872. doi:10.1016/j.ijheatmasstransfer.2024.125872. [Google Scholar] [CrossRef]
5. Hossain R , Hasan MJ , Azad AK , Rahman MM . Numerical study of low Reynolds number effect on MHD mixed convection using CNT-oil nanofluid with radiation. Results Eng. 2022; 14: 100446. doi:10.1016/j.rineng.2022.100446. [Google Scholar] [CrossRef]
6. Miroshnichenko IV , Sheremet MA . Turbulent free convection and thermal radiation in an air-filled cabinet with partition on the bottom wall. Axioms. 2023; 12( 2): 213. doi:10.3390/axioms12020213. [Google Scholar] [CrossRef]
7. Moghaddam HA , Tkachenko S , Reizes J , Yeoh GH , Timchenko V . Les of humid air natural convection in cavity with conducting walls. Comput Thermal Scien. 2024; 16( 3): 39– 53. doi:10.1615/computthermalscien.2023049329. [Google Scholar] [CrossRef]
8. Ashouri A , Mazaheri K . Effects of burner configuration modification on CH4-H2 fueled industrial steam cracking furnaces: Heat transfer, pollutant emission, and furnace performance. Energy. 2025; 335: 138023. doi:10.1016/j.energy.2025.138023. [Google Scholar] [CrossRef]
9. Zhao X , Meng L , Ma J , Wang R , Tian C , Lian H , et al. Numerical simulation of combustion, flow, and heat transfer process of an oilfield heating furnace under different production conditions. Energy Sci Eng. 2022; 10( 3): 1009– 25. doi:10.1002/ese3.1041. [Google Scholar] [CrossRef]
10. Lu Z , Li X , Tang Z . Natural gas combustion furnaces with air and flue gas mixing: Numerical study and industrial application. Case Stud Therm Eng. 2025; 73: 106638. doi:10.1016/j.csite.2025.106638. [Google Scholar] [CrossRef]
11. He XY , Wen ZN , Zhai C , Zhu YZ , Nie YX , Mei Y . Fluid flow characteristics and coal gasification performance under various injection patterns in a Shell gasifier. Chem Eng Sci. 2025; 309: 121471. doi:10.1016/j.ces.2025.121471. [Google Scholar] [CrossRef]
12. Yepes HA , Obando JE , Amell AA . The effect of syngas addition on flameless natural gas combustion in a regenerative furnace. Energy. 2022; 252( C): 124008. doi:10.1016/j.energy.2022.124008. [Google Scholar] [CrossRef]
13. Zhang T , Li MJ , Bi LS . The study of heat transfer characteristics and a real-time synergistic control method on reheating furnace based on physical field regulation. Energy. 2025; 317: 134694. doi:10.1016/j.energy.2025.134694. [Google Scholar] [CrossRef]
14. Wu W , Zhang M , Wang Y , Zhao L , Dong H , Zhang J . Optimization of a pyrolysis furnace using multi-jet arrays through numerical and machine learning techniques. Int J Heat Mass Transf. 2023; 214: 124426. doi:10.1016/j.ijheatmasstransfer.2023.124426. [Google Scholar] [CrossRef]
15. Chen XJ , Yang C , Kong JX , Wang FL , Jin ZJ , Qian JY . Steam-side heat transfer analysis in spirally corrugated tube for grate furnace superheater. Case Stud Therm Eng. 2023; 50: 103443. doi:10.1016/j.csite.2023.103443. [Google Scholar] [CrossRef]
16. Panjkovic V , Gloss R . Fast dynamic heat and mass balance model of walking beam reheat furnace with two-dimensional slab temperature profile. Ironmak Steelmak. 2012; 39( 3): 190– 209. doi:10.1179/1743281211y.0000000081. [Google Scholar] [CrossRef]
17. Yang Z , Cheng D , Su B , Ji C , Huang J , Li H , et al. Study on the optimization of temperature uniformity in the oven under the forced convection mode. Sci Rep. 2023; 13( 1): 12486. doi:10.1038/s41598-023-39317-w. [Google Scholar] [CrossRef]
18. Moffat RJ . Describing the uncertainties in experimental results. Exp Therm Fluid Sci. 1988; 1( 1): 3– 17. doi:10.1016/0894-1777(88)90043-X. [Google Scholar] [CrossRef]
19. Cengel YA , Ghajar AJ . Heat and mass transfer, fundamentals and applications. 4th ed. New York, NY, USA: McGraw-Hill; 2011. [Google Scholar]
20. Wang K , Yu J . Mixing equipment. Beijing, China: Chemical Industry Press Inc.; 2003. p. 57– 65. (In Chinese). [Google Scholar]
21. Tao WQ . Numerical heat transfer. 2nd ed. Xi’an, China: Xi'an Jiaotong University Press; 2001. (In Chinese). [Google Scholar]
22. Chtourou W , Ammar M , Driss Z , Abid M . Effect of the turbulence models on Rushton turbine generated flow in a stirred vessel. Open Eng. 2011; 1( 4): 380– 9. doi:10.2478/s13531-011-0039-0. [Google Scholar] [CrossRef]
23. ANSYS Inc . Fluent theory guide. Canonsburg, PA, USA: ANSYS Inc.; 2018. [Google Scholar]
24. Khapre A , Munshi B . Numerical investigation of hydrodynamic behavior of shear thinning fluids in stirred tank. J Inst Chem Eng. 2015; 56: 16– 27. doi:10.1016/j.jtice.2015.04.003. [Google Scholar] [CrossRef]
25. Li D , Chen W . Effects of impeller types on gas-liquid mixing and oxygen mass transfer in aerated stirred reactors. Process Saf Environ Prot. 2022; 158: 360– 73. doi:10.1016/j.psep.2021.12.019. [Google Scholar] [CrossRef]
26. Ahmed ZU , Al-Abdeli YM . Temperature uniformity, correlations and the flow field in swirling impinging jets. J Therm Sci. 2023; 32( 2): 662– 79. doi:10.1007/s11630-023-1740-z. [Google Scholar] [CrossRef]
27. Paolillo G , Greco CS , Astarita T , Cardone G . Effects of the swirl number, Reynolds number and nozzle-to-plate distance on impingement heat transfer from swirling jets. Int J Heat Mass Transf. 2022; 197: 123284. doi:10.1016/j.ijheatmasstransfer.2022.123284. [Google Scholar] [CrossRef]
28. Sheen HJ , Chen WJ , Jeng SY , Huang TL . Correlation of swirl number for a radial-type swirl generator. Exp Therm Fluid Sci. 1996; 12( 4): 444– 51. doi:10.1016/0894-1777(95)00135-2. [Google Scholar] [CrossRef]
29. Rocha AD , Bannwart AC , Ganzarolli MM . Numerical and experimental study of an axially induced swirling pipe flow. Int J Heat Fluid Flow. 2015; 53: 81– 90. doi:10.1016/j.ijheatfluidflow.2015.02.003. [Google Scholar] [CrossRef]
Cite This Article
 Copyright © 2026 The Author(s). Published by Tech Science Press.
This work is licensed under a Creative Commons Attribution 4.0 International License , which permits unrestricted use, distribution, and reproduction in any medium, provided the original work is properly cited.
 Downloads
 Citation Tools