
 Submit a Paper
 Propose a Special lssue
 Open Access
ARTICLE

Modeling Liquid Loading Behavior in Coalbed Methane Gathering Pipelines
1 Petroleum Engineering School, Southwest Petroleum University, Chengdu, China
2 PetroChina Coalbed Methane Co., Ltd. Hancheng Branch, Xi’an, China
* Corresponding Authors: Ting He. Email: ,
Fluid Dynamics & Materials Processing 2026, 22(2), 5 https://doi.org/10.32604/fdmp.2026.077227
Received 04 December 2025; Accepted 09 February 2026; Issue published 04 March 2026
 View Full Text
 Download PDF
Abstract
With the maturation of coalbed methane (CBM) exploitation and the transition into the late stages of dewatering and gas production, liquid loading in gathering pipelines has emerged as a major constraint on productivity and operational stability. Based on real-time field data and gas–liquid physicochemical analyses, this study elucidates the mechanisms governing liquid loading formation under varying temperature, pressure, and water saturation conditions. An HYSYS model is employed to determine the water dew point, while the Turner model is used to evaluate the critical conditions for liquid holdup. The results indicate that gas water saturation exerts the dominant influence on liquid loading risk, followed by pressure, whereas temperature plays a comparatively minor role. When water saturation exceeds 2% and the operating temperature falls below the dew point, condensation-driven liquid loading increases sharply. To further characterize the spatial distribution of liquid accumulation, a steady-state OLGA model of a DN100 gathering pipeline network is developed to examine the effects of pipe diameter, water saturation, and soil temperature. The simulations show that larger pipe diameters and higher water saturation significantly aggravate liquid holdup, while elevated soil temperature mitigates liquid accumulation. Moreover, the liquid holdup ratio is found to correlate closely with flow regime transitions, confirming its suitability as a key indicator of liquid loading risk. Based on these findings, optimization strategies for pipeline design and operation are proposed. To mitigate liquid loading, the gathering pipeline velocity should be maintained above the critical value of 1.63 m/s, and the gas water content should be strictly controlled below 2%. Under operating conditions representative of the Hancheng block, it is recommended to reduce the pipeline diameter from DN130 to DN100 to enhance self-cleaning capacity. In addition, thermal insulation should be applied during winter operation to maintain the pipe wall temperature above 10°C, thereby suppressing condensation-induced liquid accumulation.Keywords
As global exploitation of Coalbed Methane (CBM) advances, many medium-shallow reservoirs have now entered their fifteenth year of continuous development, and most production wells have transitioned into the late-stage dewatering and gas-production period. With declining reservoir pressure and reduced permeability, well productivity has gradually decreased, and the wellhead casing pressure has become comparable to the operating pressure of surface gathering systems. This convergence of pressures poses serious operational challenges, especially in areas where large gathering radii result in long, high-pressure trunk lines that limit well deliverability. The issue is further exacerbated in winter, when low ambient temperatures promote condensation of water vapor within pipelines, resulting in liquid loading—the accumulation of condensed and formation water that impedes gas flow and reduces production efficiency. Field monitoring during the winter of 2024 revealed that liquid-loaded pipeline sections exhibited pressure fluctuations between 0.02 and 0.12 MPa, corresponding to an estimated daily gas production loss of approximately 3 000 m3/d. Temperature reduction drives the phase change of vapor to liquid water, thereby increasing liquid holdup, reducing gas transport capacity, and compromising well productivity.
Unlike conventional high-pressure dry-gas transmission pipelines, late-stage CBM gathering networks operate with a limited pressure margin because declining reservoir pressure makes the wellhead pressure comparable to the surface operating pressure, reducing gas momentum and increasing susceptibility to velocity deficiency and liquid retention. Moreover, CBM streams are inherently water-rich, and winter soil cooling can drive the flow toward or below the water dew point, so formation water supply and in-line condensation jointly elevate liquid inventory and trigger the pressure/production fluctuations observed in field operation. In addition, medium–shallow CBM gathering systems are typically multi-branch networks embedded in shallow soil, where terrain-induced pooling, coal-fines disturbances, and strong coupling between production strategy and network hydraulics further differentiate their flow-assurance behavior from conventional gas pipelines.
The phenomenon of liquid loading in gas wells and pipelines has long been recognized and is described using gas–liquid two-phase flow theory. The thermodynamic foundation was laid by the In gas–liquid multiphase flow systems, the hydrodynamics of gas-driven liquid displacement in uphill pipeline sections provides direct insight into the dynamic processes governing liquid removal and re-entrainment [1]. Accurate description of gas properties and phase behavior is essential for such analyses, for which real-gas equations of state, including the Soave–Redlich–Kwong (SRK) formulation, are widely adopted to account for non-ideal gas behavior under practical operating conditions [2]. In addition, thermal effects may influence multiphase transport in wells and pipelines; thus, wellbore heat-transfer modeling and its engineering applications provide a methodological basis for coupling heat transfer with multiphase-flow analysis [3].
Liquid loading fundamentally arises when the gas-phase momentum becomes insufficient to continuously transport liquid, leading to liquid accumulation and flow instability. To address this mechanism, Chen et al. developed a predictive model for liquid loading in deviated gas wells, highlighting the sensitivity of liquid accumulation to inclination angle and gas–liquid interaction [4]. Subsequently, Pagou et al. proposed a liquid-film-based model capable of predicting and identifying liquid loading in both vertical and inclined gas wells, emphasizing the dominant role of wall film behavior under certain flow regimes [5]. Extending the analysis across spatial scales, Liu et al. linked core-scale transient liquid accumulation to coupled field-scale simulations, thereby strengthening the connection between mechanistic understanding and field diagnostics [6]. At the review level, He et al. systematically evaluated critical liquid-loading correlations for unconventional gas reservoirs and demonstrated their limited applicability in horizontal and highly deviated wells, providing guidance for model selection and applicability boundaries [7]. To improve prediction accuracy under low-pressure conditions, Fadairo introduced a droplet-kinetics-based modification of classical critical-velocity correlations, reflecting a shift from purely empirical criteria toward dynamic mechanistic descriptions [8].
The influence of pipeline geometry and terrain complexity has also received increasing attention. Mandal et al. investigated the effects of pipeline undulation on gas–liquid two-phase flow, revealing that geometric fluctuations significantly alter flow patterns and liquid-carrying capacity [9]. Focusing on inclined and deviated configurations, Belfroid et al. examined the onset and dynamic behavior of liquid loading, demonstrating that inclination angle plays a decisive role in flow-regime transitions and liquid holdup [10]. Experimental and modeling studies by Rastogi and Fan further characterized the onset of liquid accumulation, providing experimental evidence for critical conditions and transient responses [11]. Beyond mechanistic modeling, data-driven approaches have been explored: Abhulimen et al. developed a software-based predictive framework for liquid loading [12], while Hong applied machine-learning techniques to forecast liquid accumulation in gas pipelines, offering an alternative route for rapid diagnosis under complex operating conditions [13].
To enhance physical interpretability, Wang et al. proposed a new mechanistic model for predicting liquid loading in inclined natural gas wells, explicitly accounting for force balance and flow-regime evolution [14]. Vieira et al. further improved inclined-pipe liquid-loading predictions by incorporating non-uniform liquid wall films, thereby extending model applicability to more realistic flow conditions [15]. For unconventional gas systems, Tang et al. analyzed pressure characteristics and production performance of liquid-loaded horizontal wells, illustrating how liquid accumulation directly affects well productivity and pressure behavior [16].
In coalbed methane (CBM) systems, liquid loading is closely coupled with production strategy and gathering-network operation. Sun et al. introduced a composite drainage–gas production synergy technology to mitigate severe liquid loading in deep CBM wells [17]. Wang investigated the timeliness of CBM workover operations for effective deliquification control, providing a decision-oriented perspective for field implementation [18]. Cao et al. developed a multiphase-flow modeling and optimization framework for variable gas–liquid flow regimes, reflecting an integrated approach combining modeling, optimization, and operational control [19]. From a reservoir–wellbore coupling perspective, Yan et al. examined fluid–solid coupling characteristics during CBM extraction, offering mechanistic explanations for permeability evolution and flow-path alteration [20]. Quan et al. conducted combined physical experiments and numerical simulations to clarify the effects of depressurization rate on CBM production and fluid migration [21], while Zhao et al. established a predictive framework for liquid accumulation in shale gas pipelines, utilizing numerical simulations to identify high-risk zones under complex terrain conditions [22].
At the level of condensation and liquid accumulation mechanisms in gas transport systems, Filippov and Petukhov conducted a combined experimental and theoretical investigation on reflux condensation in inclined small-diameter tubes, providing fundamental insights into film condensation behavior under non-horizontal flow conditions, which are directly relevant to liquid holdup and drainage mechanisms in gas pipelines [23]. In pipeline-scale multiphase flow dynamics, Wu et al. experimentally investigated the slugging characteristics of gas–liquid flow in horizontal pipes, offering detailed observations of slug formation, propagation, and hydrodynamic instability that are highly applicable to CBM gathering and transmission systems operating under high water-cut conditions [24]. From the perspective of liquid accumulation and transport in long-distance pipelines, Mirshamsi and Rafeey analyzed the dynamic behavior of liquid slugs in gas pipelines using numerical simulation, revealing the key roles of operational parameters and transient flow evolution in liquid holdup development [25]. Focusing on liquid-loading onset in CBM gathering pipelines, Ma et al. proposed a predictive model for the critical liquid-carrying gas velocity under high gas–liquid ratio conditions, providing a practical criterion for identifying liquid-loading risks in medium–shallow CBM gathering networks [26]. In addition, Schouten et al. investigated condensation phenomena in gas transmission pipelines containing hydrogen–natural gas mixtures, clarifying the phase behavior and condensation characteristics of multicomponent gas systems under varying thermodynamic conditions, which offers important implications for condensation-induced liquid accumulation in low-pressure gas pipelines [27].
To enhance the reliability of production forecasts, studies have shifted toward systematic optimization and uncertainty analysis frameworks. Parida and Sinha Ray [28] utilized reservoir simulation and uncertainty analysis to identify controlling parameters for CBM development, establishing a methodological framework for coupling multiphase flow behavior with optimization strategies. Such an approach supports our objective of quantifying the inherent uncertainties in pipeline liquid loading and optimizing gathering system designs to ensure operational stability in mature CBM blocks. Abdul-Majeed and Al-Mashat proposed a comprehensive mechanistic model for two-phase slug flow in vertical and inclined sections, emphasizing the prediction of liquid holdup and phase velocities. Their approach provides critical theoretical support for characterizing the hydrodynamic stability and liquid retention in inclined segments of complex CBM gathering networks [29]. Increasing attention has been directed toward the unique challenges of low-pressure gas gathering systems. Abdul-Majeed et al. developed an empirical model to predict slug-to-pseudo-slug transition in air–water upward two-phase flow, offering valuable insights into flow regime transitions that are particularly relevant for understanding liquid-loading behavior in low-pressure gathering pipelines [30].
Despite extensive studies on liquid loading, most existing work focuses on vertical wellbore unloading or generic gas–liquid transport, while the mature low-pressure CBM gathering context—characterized by weak gas momentum, high water availability, and strong winter cooling—remains insufficiently mechanized in a pipeline-scale framework. The novelty of this study lies in two aspects. First, we adapt the critical-velocity concept to late-stage, low-pressure CBM conditions by implementing a modified Turner-type formulation. Second, we establish a coupled thermodynamic–hydrodynamic workflow that directly integrates HYSYS-generated, composition-specific property tables into OLGA, enabling saturation and condensation effects to be represented more realistically than constant-property assumptions.
2 Methodology of Liquid Loading Mechanism Analysis
2.1 Liquid Loading Mechanism Investigation Methodology
- (1)Produced Gas Water Dew Point Calculation
Water dew point serves as the critical indicator determining whether moisture in the gas phase will condense. Fundamentally, it is defined as the temperature at which the partial pressure of water vapor equals the saturated vapor pressure at a given system pressure. For engineering applications, the Antoine equation is commonly employed to estimate the dew point temperature, and its expression is presented in Eq. (1):
- (2)Produced Gas Liquid-Carrying Capacity Calculation
The theory of the critical liquid-carrying velocity coupled with a minimum pressure drop verification model in liquid film mechanics was introduced to assess the liquid-carrying capacity of produced gas by comparing the theoretical critical flow velocity with the actual gas flow velocity. The calculation formulas are shown in Eqs. (2) and (3).
In addition to the film mechanics model, the classical Turner droplet model is adapted to characterize the liquid loading onset in low-pressure CBM systems. To account for the lower kinetic energy and smaller droplet sizes in medium-shallow CBM pipelines, a modified Turner correlation is employed in Eq. (4):
2.2 Numerical Simulation Methodology for Liquid Loading
The OLGA software, jointly developed by SINTEF and IFE, stands as one of the earliest dynamic multiphase flow simulators. Based on flow characteristics, the software categorizes multiphase flow into four distinct flow regimes: stratified flow, annular flow, slug flow, and bubble flow. The simulation calculations are executed by integrating the fluid property tables generated by the PVTsim fluid property simulation software. The model equations are solved using the Eulerian method with a Lagrangian slug tracking scheme. Following correction against experimental data, the software demonstrates high accuracy in predicting key calculated parameters, including temperature and pressure profiles.
Utilizing the Two-Fluid Model framework, OLGA establishes distinct mass conservation equations for the gas phase, dispersed liquid droplets, and the continuous liquid film; two momentum conservation equations are defined for the gas-liquid mixture and the liquid film; and one energy conservation equation is applied to the overall system. As shown in Eqs. (5)–(7).
- (1)Mass Conservation Equations
For the Gas Phase:
For the Liquid Film near the pipe wall:
For the Liquid Droplets near the gas phase:
- (2)Momentum Conservation Equations
For the Gas Phase and Dispersed Droplets As shown in Eq. (8):
For the Liquid Film. As shown in Eq. (9):
- (3)Energy Conservation Equation
For the Overall Gas-Liquid Mixture. As shown in Eq. (10):
To ensure the accuracy of the multiphase flow simulation, a coupled thermodynamic-hydrodynamic workflow was established between HYSYS and OLGA. Initially, HYSYS was employed to perform flash calculations and determine the water dew point based on the field-measured gas composition. The phase behavior data and fluid physical properties (such as density, viscosity, and surface tension) generated by HYSYS under varying pressure and temperature conditions were exported as a standardized fluid property table (.tab file). This table served as the foundational input for OLGA, enabling the simulator to accurately predict the onset of water condensation and the subsequent liquid loading behavior within the pipeline. This integration ensures that the transient flow characteristics captured in OLGA are strictly consistent with the thermodynamic saturation states defined by HYSYS.
2.3 Model Validation and Benchmarking
Two-phase CFD simulations are subject to significant inherent uncertainties, with drag coefficient correlations varying by ±50%, interfacial area models by ±40%, and turbulence models by ±20–30% in literature. Consequently, the total uncertainty for such models can reach ±60–100%. To ensure the reliability of the core OLGA CFD results and move beyond an unrealistic precision, a formal validation against the benchmark Taitel-Dukler (1976) mechanistic model was performed.
The validation case was configured as a horizontal pipe under equilibrium stratified flow conditions. To ensure reproducibility and transparency, the specific closure relations and physical parameters used within the OLGA environment were documented to align with the theoretical basis of the benchmark. Since Coal Bed Methane (CBM) gathering conditions primarily involve turbulent flow in both phases, the friction factors and coefficients were set according to the standard values utilized in the mechanistic model, as detailed in Table 1.
Table 1: Documented closure relations and parameters used in OLGA validation.
| Parameter | Model/Formula | Source Citation | Value Used |
|---|---|---|---|
| Liquid friction factor (fL) | Taitel & Dukler (1976) | ||
| Gas friction factor (fG) | Taitel & Dukler (1976) | ||
| Interfacial friction (fi) | Smooth interface assumption | Gazley (1949); Taitel-Dukler | Applicable for stratified flow |
The validation involved calculating the dimensionless liquid level
The OLGA predicted holdup values were compared against the theoretical curves provided in Taitel-Dukler study.
The results demonstrate that the OLGA model maintains an error margin within the expected 15–25% range. Detailed parameters regarding this comparison are provided in Table 2.
Table 2: Comparison of OLGA predicted holdup vs. Taitel-Dukler (1976) theory.
| Martinelli Parameter (X) | Theoretical | OLGA Predicted | Relative Error (%) |
|---|---|---|---|
| 0.1 (Low Holdup) | ~0.20 | 0.24 | +20% |
| 1.0 (Intermediate) | ~0.50 | 0.58 | +16% |
| 10.0 (High Holdup) | ~0.85 | 1.02 | +20% |
3 Numerical Methodology and Thermodynamic Analysis
3.1 Pipeline and Operational Parameters
The DN130 pipeline was selected as the subject of this study. The parameters for the DN130 mainline are provided in Table 3, and the parameters for the branch lines are detailed in Table 4. For thermal boundary conditions, the ambient temperature was set, referencing, to the average soil temperature 7.5°C at the pipeline burial depth.
Table 3: DN130 mainline basic parameters.
| Nominal Diameter (mm) | Pipe Outer Diameter (mm) | Wall Thi-ckness (m) | Pipe Roughness (mm) | Average External Wall Heat Tr-ansfer Coefficient (W/(m2·°C)) | Burial Depth (m) |
|---|---|---|---|---|---|
| DN130 | 127 | 14 | 0.03 | 0.38 | 1 |
Table 4: DN130 gathering branch line data.
| Pipeline Name | Start Point | End Point | Pipe Specification (mm) | Length (m) |
|---|---|---|---|---|
| 8-05 Gathering Branch Line | 8-05 | Mainline Valve StationB | Φ127 × 14 | 1400 |
| 8-07 Gathering Branch Line | 8-07 | Mainline Valve StationC | Φ127 × 14 | 266 |
| 8-12 Gathering Branch Line | 8-12 | Mainline Valve StationC | Φ127 × 14 | 500 |
3.2 Pipeline Discretization and Meshing
The Discretize geometry function was utilized to perform automated spatial discretization of the pipeline network. To mitigate any adverse computational effects stemming from the grid resolution, the length ratio between adjacent pipe segments was rigorously set to unity 1.
Three individual OLGA models were developed for the Han 8-12, Han 8-07, and Han 8-05 pipeline segments to accurately represent the multiphase flow behavior along the transportation system. Each model was configured according to its specific geometry and operational characteristics—including length, inner diameter, inclination, and wall roughness—while the elevation profiles were derived from actual field topography to capture gravitational and liquid-accumulation effects. Boundary conditions were defined using measured inlet flow rate, pressure, and temperature, with outlet pressure constrained by downstream operating conditions. Fluid properties and gas–liquid ratios were specified based on laboratory and PVT data. Transient simulations were subsequently conducted to evaluate the liquid holdup distribution under various operating conditions. as shown in Fig. 1, Fig. 2 and Fig. 3.
To enhance the resolution of branch-level liquid accumulation and flow behaviour, we modelled the Han 8-12, Han 8-07 and Han 8-05 lines separately in the numerical implementation and performed parametric sensitivity analyses for each branch. Importantly, this “separate modelling” does not imply that the system is physically independent. In reality, the three branches form a parallel gathering network that merges into a common trunk line and is constrained by a fixed outlet pressure at the station. Under this boundary condition, the branches are coupled through the shared downstream pressure constraint: changes in the flow rate or phase state in any branch alter its pressure losses and junction inflow conditions, which, in turn, can modify the available pressure drop and driving force for flow in the other branches. Accordingly, our modelling strategy maintains a consistent outlet-pressure constraint to reflect network coupling, while enabling high-resolution characterisation of the mechanisms governing liquid loading within individual branches.
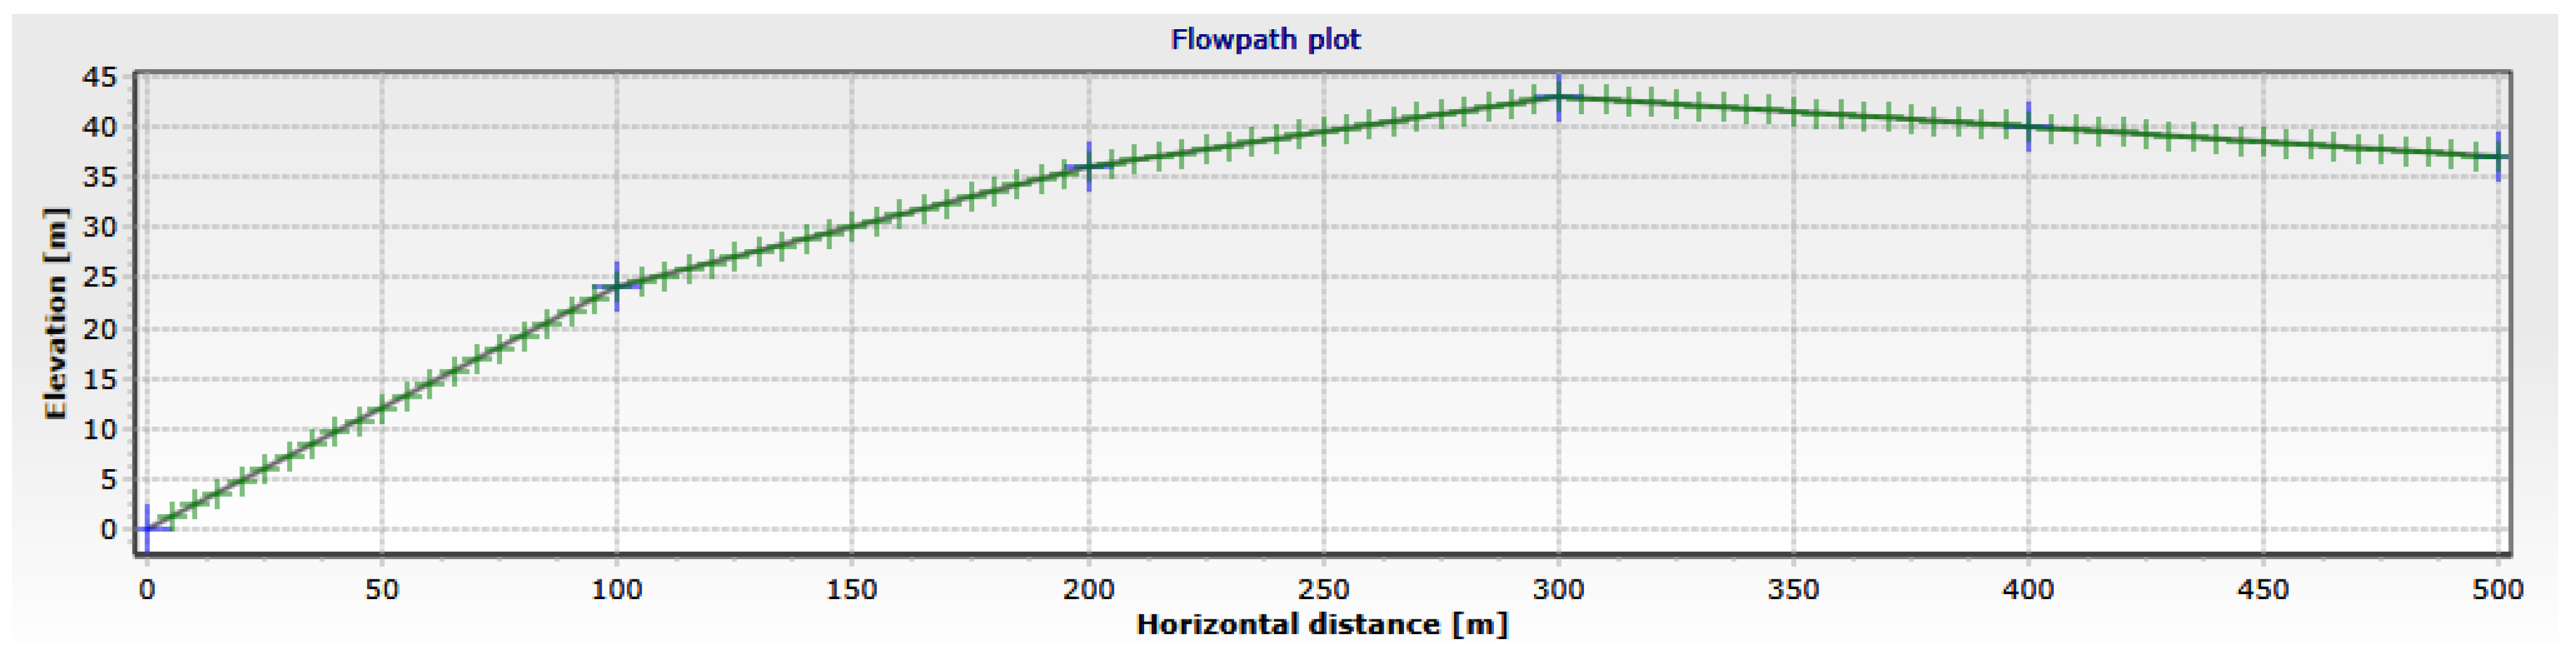
Figure 1: Schematic of the 8-12 gathering branch line.
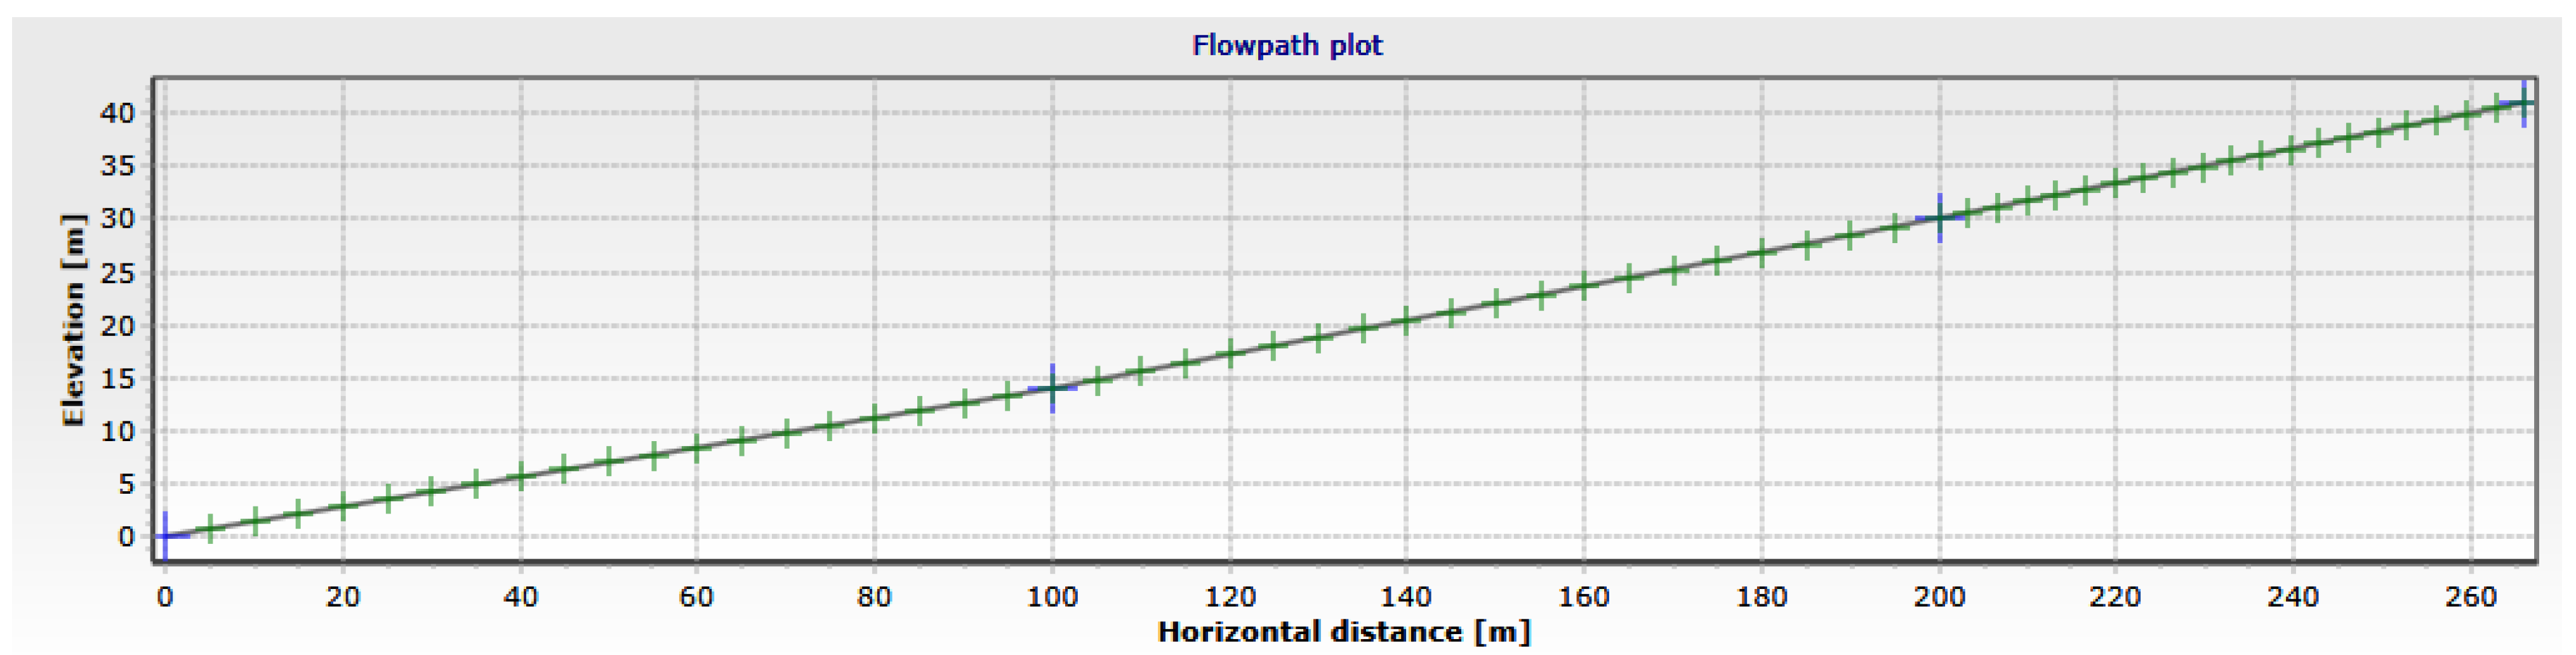
Figure 2: Schematic of the 8-07 gathering branch line.
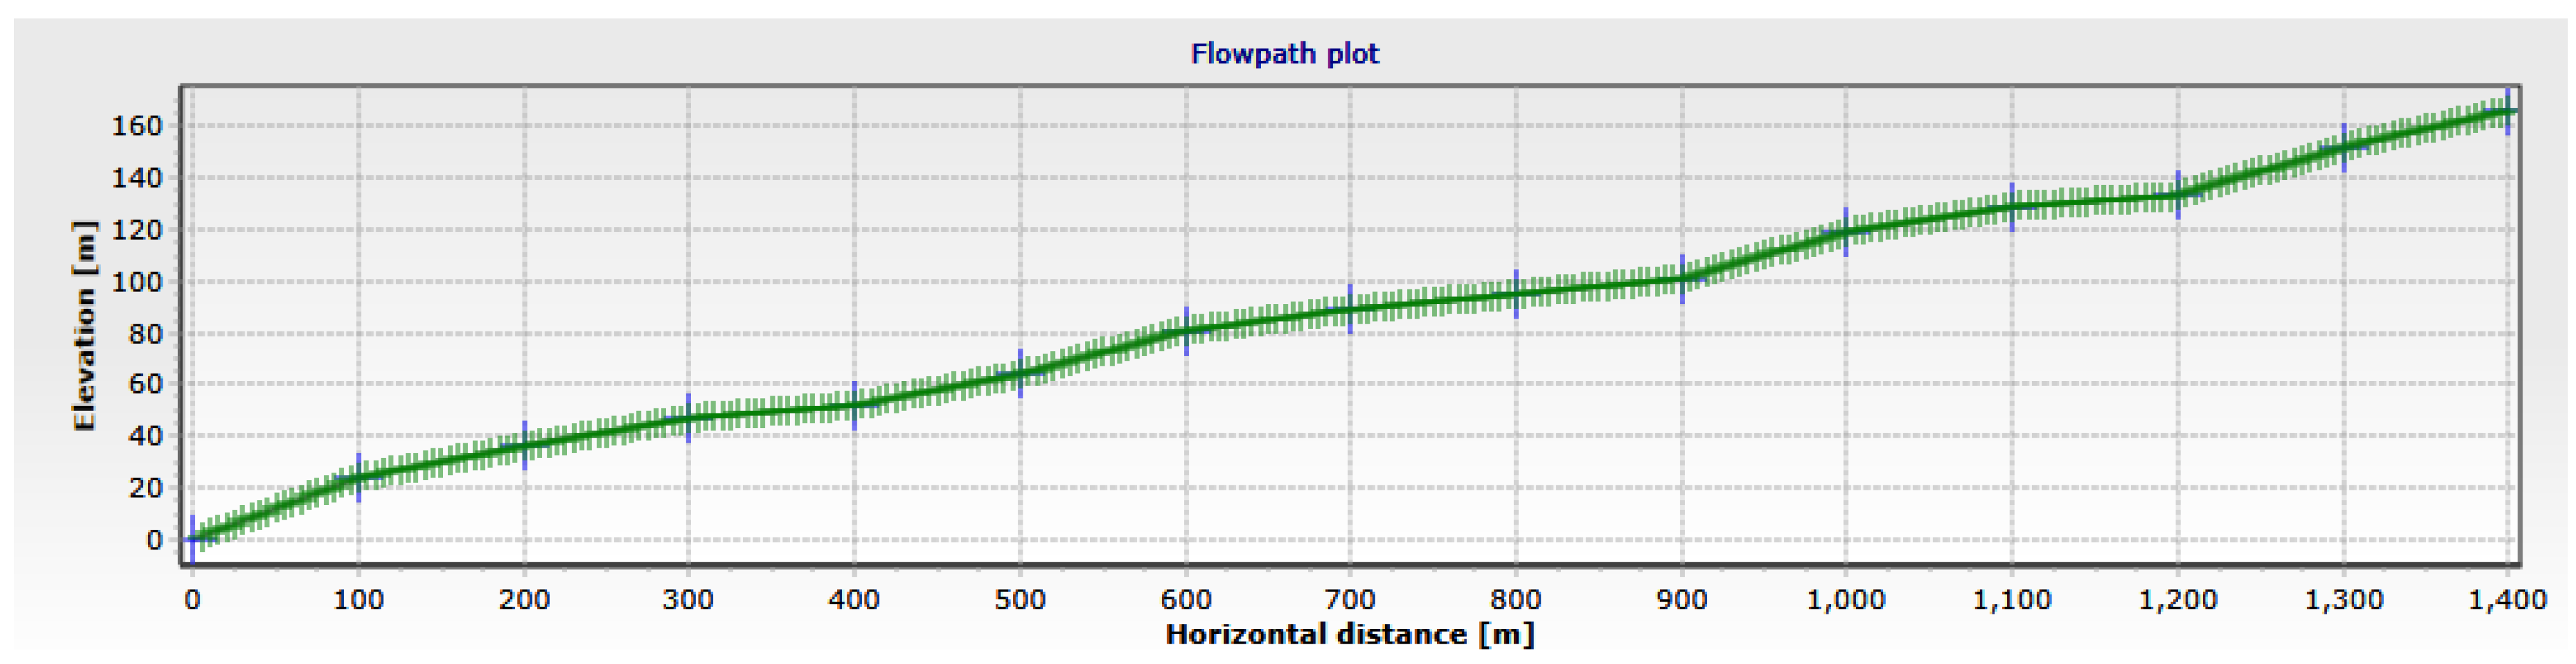
Figure 3: Schematic of the 8-05 gathering branch line.
Based on the actual operating conditions of the pipeline network, the flow rates for each inlet are specified in Table 5. The outlet pressure at Outlet A is set to 0.1 MPa, and it is assumed that all gas sources share the same water cut.
Table 5: DN130 gathering branch line inlet data.
| Inlet Node | Volumetric Flow Rate (m3/h) | Inlet Temperature (°C) |
|---|---|---|
| 8-05 | 295 | 9 |
| 8-07 | 46 | 9.5 |
| 8-12 | 583 | 10 |
3.5 Water Saturation and Water Cut
To avoid ambiguity in the thermodynamic analysis, the terms “water saturation” and “water cut” are explicitly defined as follows:
Water Saturation (S): Represents the phase equilibrium state, defined as the ratio of the partial pressure of water vapor (Pw) to the saturation pressure (Psat) at a given temperature (T):
Water Cut (w): Refers to the mass-based engineering proportion of water within the total gas-water mixture:
The conversion between these two parameters is calculated using the following relationship:
4.1 Produced Gas Water Dew Point Calculation
Based on typical coalbed methane (CBM) characteristics, the CBM gas composition used in this study was set with reference to. The detailed gas composition parameters are presented in Table 6. Nitrogen 2.42%, being an inert component, does not contribute to combustion but may influence the storage capacity and transport characteristics of the CBM reservoir.
Table 6: Coalbed methane (CBM) gas composition.
| Methane | Ethane | Oxygen | Nitrogen | Carbon Dioxide | Helium |
|---|---|---|---|---|---|
| 97.11% | 0.16% | 0.16% | 2.42% | 0.12% | 0.03% |
Methane 97.11% constitutes the predominant component, clearly characterizing the Coalbed Methane (CBM) as a high-quality combustible gas. The minor concentrations of Ethane 0.16% and Carbon Dioxide 0.12% suggest a negligible impact on the overall bulk gas thermodynamic properties. The minimal Oxygen 0.16% content implies low oxygen involvement within the system, effectively precluding the risk of hyper-oxidation in the gathering process. The trace amount of Helium 0.03% plays a predominantly diluting role. Collectively, the gas stream is highly methane-centric with low concentrations of non-hydrocarbons, confirming its classification as a pipeline-quality natural gas suitable for practical large-scale applications.
Concurrently, field investigation yielded the temperature and pressure data for the three production wells: Han 8-05, Han 8-12, and Han 8-07. The detailed operational data are presented in Table 7.
Table 7: Production well temperature and pressure data.
| Well Designation | Temperature (°C) | Pressure (MPa) |
|---|---|---|
| Han 8-05 | 21 | 0.120 |
| Han 8-07 | 21 | 0.105 |
| Han 8-12 | 20 | 0.113 |
From a thermal perspective, the temperatures across the three well sites exhibit minimal variation, consistently remaining around 21°C. Consequently, temperature fluctuations are deemed to have a comparatively marginal influence on the gas saturation vapor pressure and subsequent liquid phase behavior. Pressure, however, constitutes a more critical factor in governing liquid Loading initiation. At the Han 8-05 well site, the pressure is highest 0.120 MPa, suggesting that the gas stream is potentially closer to its saturation or supersaturation state under these conditions, thereby accelerating the condensation and loading of liquids. The Han 8-07 well, conversely, records the lowest pressure 0.105 MPa. This reduced pressure may lead to a lower water vapor partial pressure, resulting in a relatively lower probability of liquid Loading formation; however, the influence of other variables must still be assessed.
The Han 8-12 well operates at an intermediate pressure of 0.113 MPa, falling between the conditions of the other two sites.
Integrating the previously established gas composition data, the high Methane content 97.11% implies a low inherent condensation temperature for the bulk gas, typically necessitating either lower temperatures or higher pressures for liquid dropout to occur. Well sites characterized by elevated pressures (e.g., Han 8-05) inherently face a greater risk of liquid Loading due to the resulting higher gas density and consequently elevated water vapor partial pressure.
The water dew point of the gas in the pipeline was calculated under actual operating conditions, utilizing the previously defined pipeline specifications and gas composition. To precisely ascertain the phase state of water within the produced gas, a thermodynamic water dew point calculation was performed to estimate the critical temperatures for the 8-05, 8-07, and 8-12 branch lines, respectively.
To this end, the water dew point of the CBM fluid within the pipeline was determined through a combination of experimental validation and numerical calculation under various operating conditions. The resulting calculated values are summarized in Table 6.
In Table 8, the observed constant dew point of 19.85°C across the temperature range of 20–26°C is due to the fixed gas composition and operating pressure, which dictates a unique equilibrium dew point regardless of the superheated gas temperature.
The water dew point temperature serves as the pivotal criterion for assessing the potential for liquid condensation within CBM pipeline operations. Under the investigated conditions of a 2% water cut and a 0.114 MPa system pressure, the water dew point remains stable around 20°C, demonstrating minimal sensitivity to temperature variations but being primarily controlled by the gas composition and system pressure. When the gas temperature exceeds the water dew point, the water vapor remains in a non-saturated (superheated) state, ensuring the pipeline remains dry; Conversely, should the temperature fall below the dew point, water vapor undergoes spontaneous condensation, converting to liquid water and consequently elevating the risk of liquid Loading. Under cold winter conditions, the tendency for condensation is exacerbated as the pipeline temperature drops below the dew point. This leads to the rapid conversion of vapor to liquid water, resulting in the accelerated loading of liquid phase within the pipeline and a significantly heightened liquid Loading risk. The final calculated results are presented in Table 9.
Regarding Table 10, while literature and field data indicate that typical CBM water cuts range from 0.5% to 2%, we included a hypothetical 10% water cut scenario solely for stress-testing the simulation and conducting a broad-spectrum sensitivity analysis. This high-value scenario helps characterize the system’s response to extreme, albeit rare, liquid loading surges.
Table 8: Water dew point results under varying temperature conditions.
| Water Cut | Temperature | Pressure (KPa) | Water Dew Point (°C) |
|---|---|---|---|
| 2 | 20 | 114 | 19.85 |
| 2 | 21 | 114 | 19.85 |
| 2 | 22 | 114 | 19.85 |
| 2 | 23 | 114 | 19.85 |
| 2 | 24 | 114 | 19.85 |
| 2 | 2 | 114 | 19.85 |
| 2 | 3 | 114 | 19.85 |
| 2 | 4 | 114 | 19.85 |
| 2 | 5 | 114 | 19.85 |
| 2 | 6 | 114 | 19.85 |
Table 9: Water dew point results under varying pressure conditions.
| Water Cut | Temperature | Pressure (KPa) | Water Dew Point (°C) |
|---|---|---|---|
| 2 | 20 | 105 | 18.54 |
| 2 | 20 | 110 | 19.28 |
| 2 | 20 | 115 | 19.99 |
| 2 | 20 | 120 | 20.66 |
| 2 | 20 | 125 | 21.32 |
This study conducted an in-depth analysis of the impact of operating pressure on the water dew point temperature within the CBM pipeline. Under standardized conditions of a 2% water cut and a 20°C gas temperature, variations in the water dew point were investigated across a pressure range of 0.105 MPa to 0.125 MPa. The results indicate that as pressure increases, the water dew point temperature gradually rises. However, the overall variation remains within 5°C, suggesting that the influence of pressure on the dew point is relatively limited. As shown in Table 10.
Table 10: Water dew point results under varying water cut conditions.
| Water Cut | Temperature | Pressure (KPa) | Water Dew Point (°C) (Winter) |
|---|---|---|---|
| 3 | 20 | 114 | 26.5 |
| 4 | 20 | 114 | 31.43 |
| 5 | 20 | 114 | 35.39 |
| 6 | 20 | 114 | 38.72 |
| 7 | 20 | 114 | 41.59 |
| 8 | 20 | 114 | 44.13 |
| 9 | 20 | 114 | 46.41 |
| 10 | 20 | 114 | 48.48 |
| 3 | 4 | 114 | 26.5 |
| 4 | 4 | 114 | 31.43 |
| 5 | 4 | 114 | 35.39 |
| 6 | 4 | 114 | 38.72 |
| 7 | 4 | 114 | 41.59 |
| 8 | 4 | 114 | 44.13 |
| 9 | 4 | 114 | 46.41 |
| 10 | 4 | 114 | 48.48 |
A comparative analysis of the calculated water dew point against seasonal pipeline temperatures revealed a critical threshold: when the initial water cut surpasses 2%, the internal gas temperature consistently falls below the curve. This thermodynamic imbalance signals a pronounced phase change within the pipeline, where lower temperatures correlate with a more intensive phase transition process, leading to accelerated loading of liquid water. In relative terms, the influence of gas temperature and system pressure on the calculated water dew point is marginal compared to the far more significant impact exerted by the water cut.
The overall sensitivity analysis unequivocally demonstrated that the water dew point is most sensitive to variations in water cut, followed by system pressure, while the effect of temperature on the water dew point value itself is negligible. Specifically, increasing the initial water cut of the produced gas results in a substantial elevation of the water dew point. Conversely, an increase in pressure yields only a slight corresponding increase in the water dew point value. Crucially, although temperature minimally affects the calculated water dew point, the differential between the actual pipeline temperature and the dew point ultimately dictates the severity of condensation. In regions with notable seasonal variability, the increased Thermal differential during cold winter conditions results in more severe condensation-induced liquid Loading. Therefore, rigorous control over the gas water cut and optimization of the system pressure emerge as key preventative measures for mitigating pipeline liquid Loading, with particular emphasis required during winter operational periods.
4.2 Calculation of Produced Gas Liquid-Carrying Capacity
To thoroughly investigate the liquid-carrying capacity of produced gas within the CBM pipeline, the Turner Model was employed. Liquid removal efficiency, or the capacity to carry liquid water under varying operating conditions, was assessed by comparing the calculated theoretical critical velocity with the actual gas velocity. Based on field data, the actual flow rates and velocities for the three wells (Han 8-05, Han 8-07, and Han 8-12) are presented in Table 11. The data shows that the actual velocity of Han 8-07 is significantly lower than that of Han 8-05 and Han 8-12. This deficiency in gas velocity for Han 8-07 indicates an insufficient capacity to effectively carry liquid water, making this well highly susceptible to liquid Loading issues.
Table 11: Field data for actual gas velocity and flow rate.
| Well ID | Actual Flow Rate (m3/h) | Actual Velocity (m/s) | Pipe Diameter (mm) |
|---|---|---|---|
| Han 8-05 | 245 | 8.68 | 100 |
| Han 8-07 | 46 | 1.63 | 100 |
| Han 8-12 | 583 | 20.6 | 100 |
The calculated actual velocity for Han 8-07 demonstrates a significant disparity compared to Han 8-05 and Han 8-12. This critically low actual velocity is insufficient to maintain the effective lift of fine liquid droplets (small molecules). The resulting lack of kinetic energy facilitates liquid loading at pipeline sag points (low-lying areas) and sections compromised by wall defects. To quantitatively investigate the liquid-carrying capacity within the CBM pipeline, calculations were performed using a modified Turner simulation, with the resulting critical velocity profiles presented in Fig. 4.
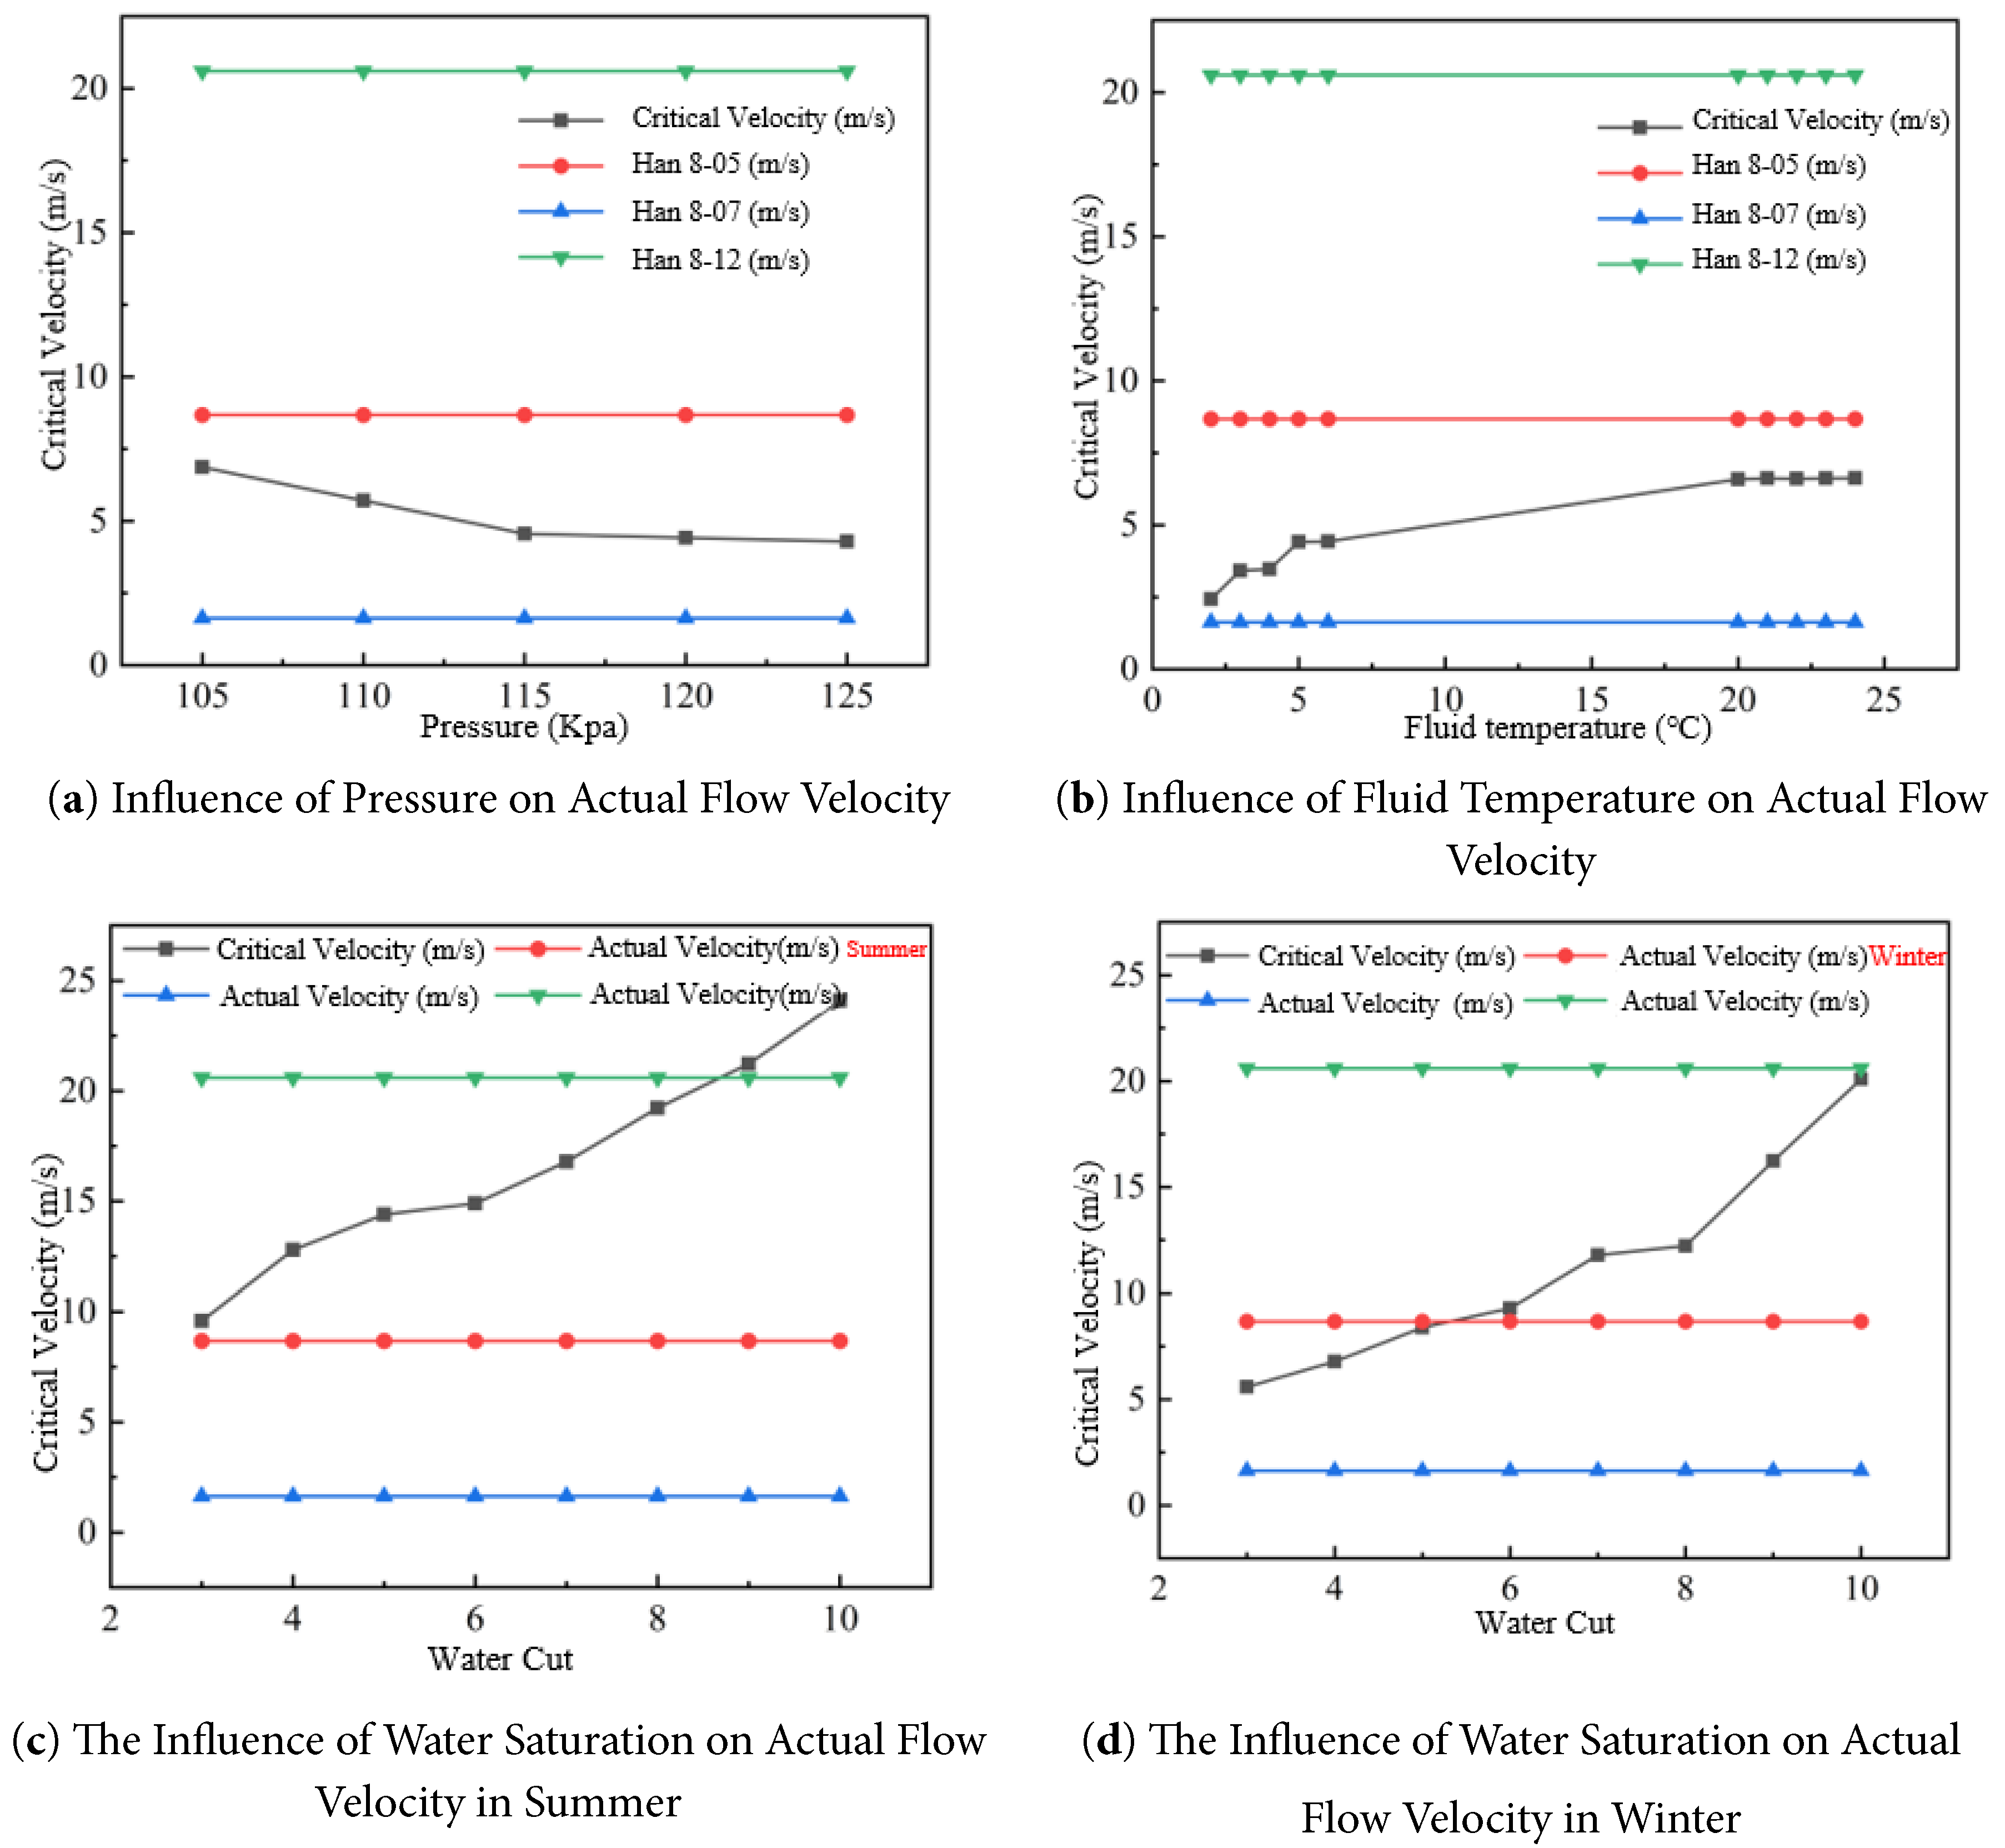
Figure 4: Variation of theoretical critical velocity under various operating conditions.
Fig. 4 presents a sensitivity analysis detailing the influence of temperature, pressure, and water cut on the liquid-carrying capacity within the CBM pipeline. Specifically, elevated temperatures decrease the gas density, enabling the gas stream to carry liquid at a lower critical, thereby mitigating liquid loading risk. Conversely, lower temperatures increase gas density, necessitating a higher critical velocity and consequently heightening the risk of Loading. An increase in system pressure generally enhances the liquid-carrying performance of the gas stream, resulting in a reduction of the critical velocity and helping to avert liquid Loading. However, increasing the water cut significantly impedes liquid removal efficiency, causing a pronounced rise in the critical velocity. Particularly under high water cut conditions, the actual gas flow is often insufficient to carry the liquid, substantially escalating the Loading risk.
Liquid loading in gathering pipelines is governed by the competition between (i) the liquid supply into the line (formation water and/or condensation once the gas temperature falls below the water dew point) and (ii) the hydrodynamic removal capacity of the gas stream to mobilize and transport liquid as droplets/films. A convenient physical interpretation is to relate loading propensity to two coupled indicators: the thermal driving force for condensation, expressed qualitatively by the sign and magnitude of
4.3 Time-Dependent Development of Liquid Loading
To investigate the influence of simulation time on liquid accumulation, the Han 8-12 gathering pipeline with a pipe diameter of 100 mm was selected as a representative case. A 100 h transient simulation was performed to examine the temporal evolution of the total accumulated liquid volume in the pipeline.
The relationship between ACCLIQBR and operating time is shown in Fig. 5, from which it can be observed that the accumulated liquid volume gradually approaches a stable level after approximately 72 h of operation. This indicates that the dominant liquid loading development process is effectively captured within this time window.
Therefore, in order to balance computational efficiency and numerical accuracy, a simulation duration of 72 h was adopted for the subsequent transient analyses.
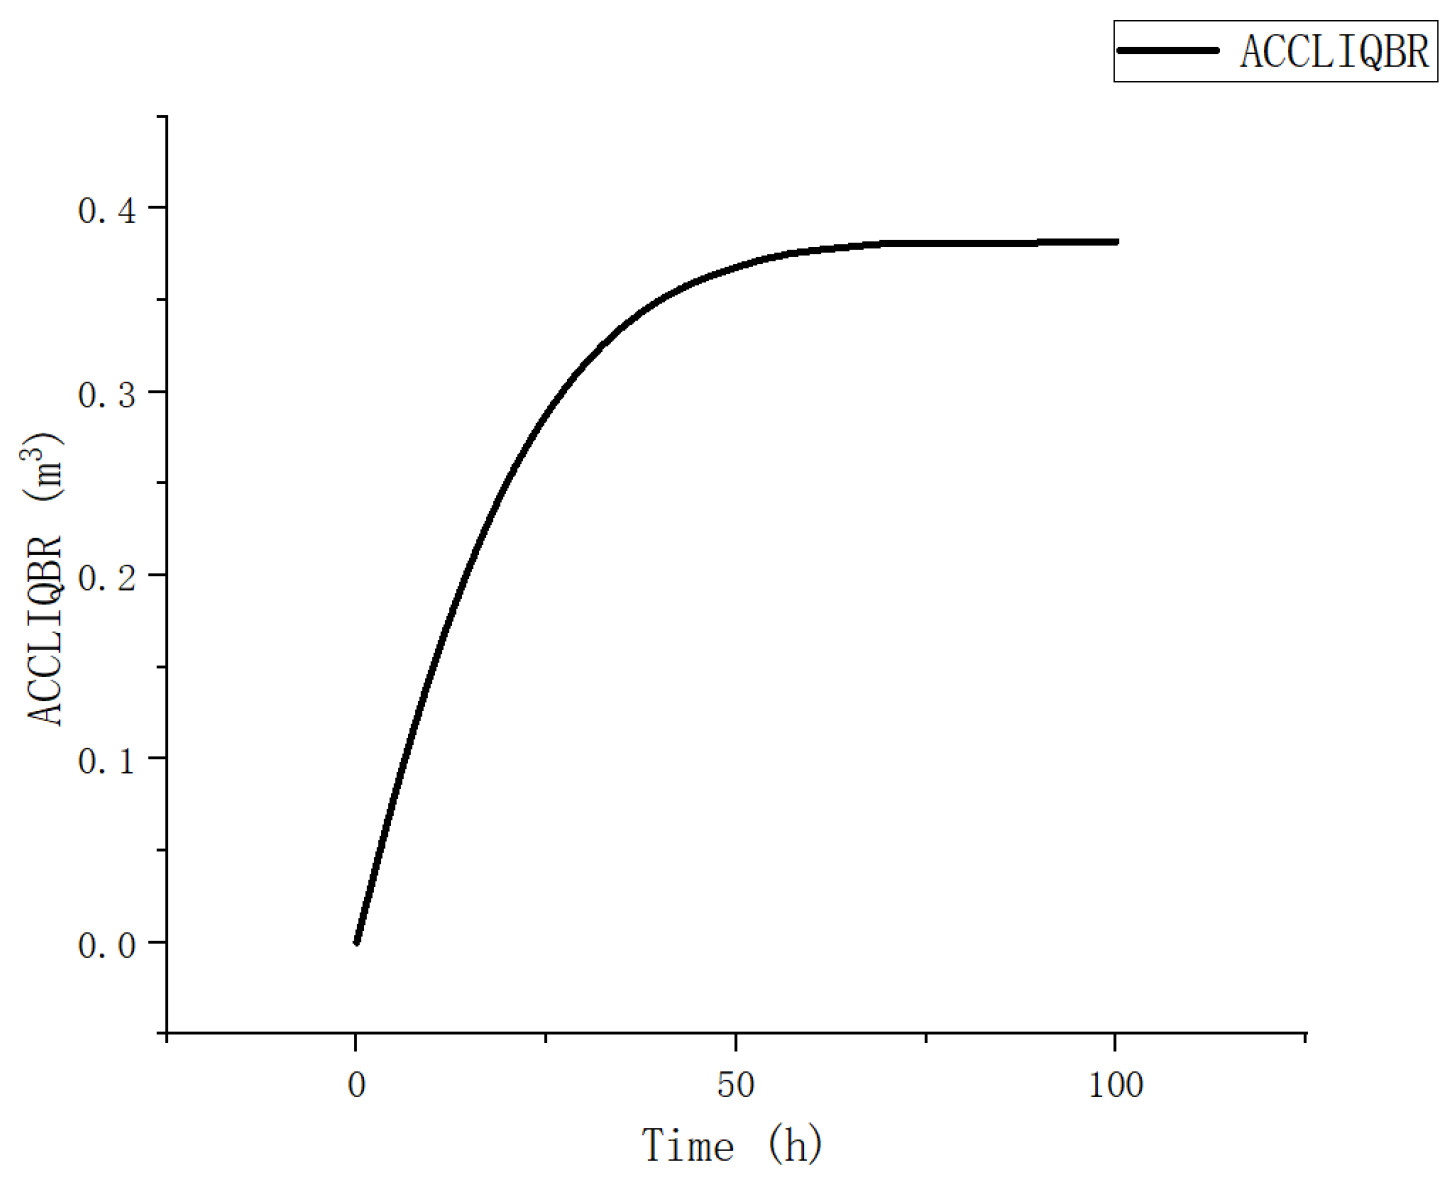
Figure 5: Temporal evolution of accumulated liquid volume (ACCLIQBR) in the Han 8-12 gathering pipeline.
4.4 Effect of Different Pipe Diameters on Pipeline Liquid Loading
The simulation model was constructed using the established parameters, with the only variation being the pipe diameter, selecting 90 mm, 100 mm, and 110 mm as the objects of study.
Under the condition of 1% water cut, the accumulated liquid volume (ACCLIQBR) for all three pipelines increases as the pipe diameter increases (Fig. 5). The ACCLIQBR for the Han 8-12 pipeline at 90, 100, and 110 mm diameters was 0.202 m3 (6.35% liquid holdup), 0.386 m3 (9.83%), and 0.480 m3 (10.10%), respectively. For Han 8-07, the liquid loading was 0.202 m3 (11.94%), 0.726 m3 (34.77%), and 1.037 m3 (41.02%). For the Han 8-05 pipeline, the values were 1.023 m3 (11.45%), 1.485 m3 (13.73%), and 2.152 m3 (16.17%).
Fig. 6 compares the total accumulated liquid volume (ACCLIQBR) for the Han 8-12, Han 8-07, and Han 8-05 pipelines across the three diameters (90 mm, 100 mm, and 110 mm).
The positive dependence of ACCLIQBR on pipe diameter can be explained by the velocity–shear mechanism. For a given inlet mass flow rate, enlarging the diameter increases the cross-sectional area and therefore reduces the superficial gas velocity and the interfacial shear stress available to entrain and re-entrain liquid films. Once shear becomes marginal, liquid tends to stratify, the liquid film thickens, and local undulations/sags more readily trap liquid, leading to a higher time-averaged holdup and accumulated volume. In addition, a larger diameter increases the characteristic liquid storage capacity per unit length, so that for comparable drainage events the same “slug removal” yields a smaller fractional depletion of the stored liquid. These mechanisms together rationalize the monotonic increase in accumulated liquid with diameter observed across all three branches.
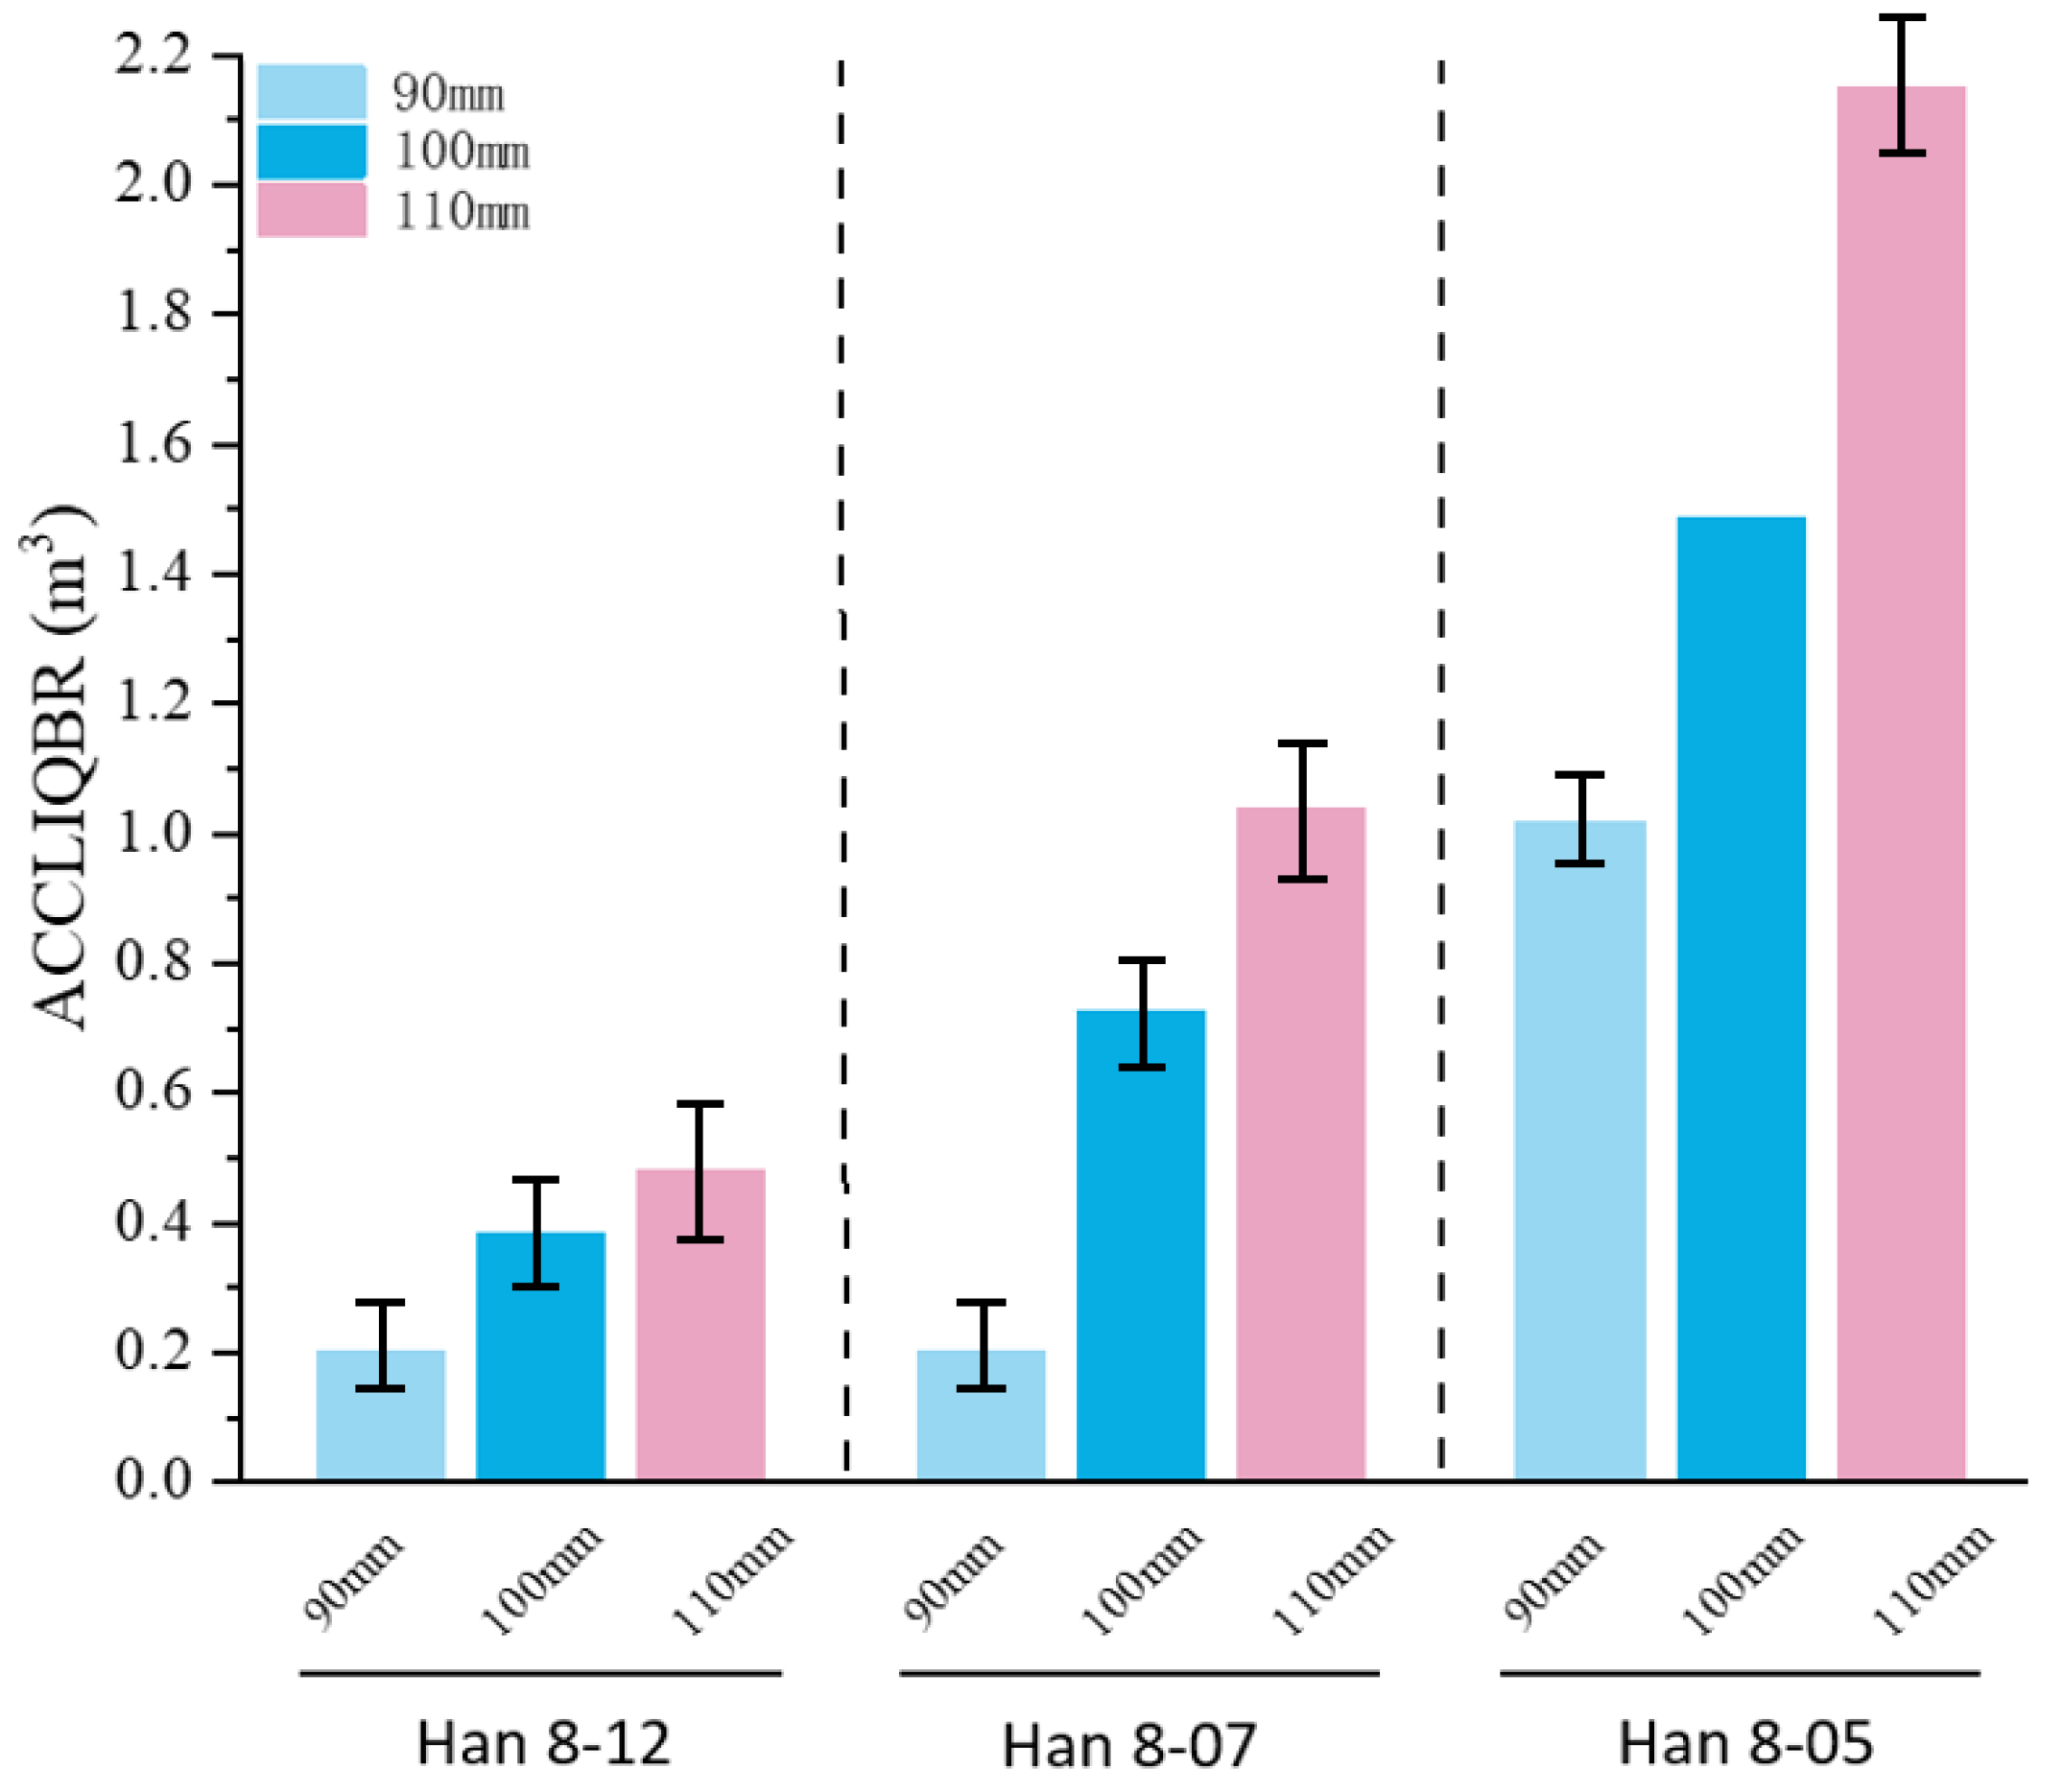
Figure 6: Influence of pipe diameter on liquid loading in the gas gathering trunk line (Error bars represent a ±20% uncertainty band based on Taitel-Dukler mechanistic model validation.).
4.5 Effect of Varying Water Cut
With all other parameters held constant, the simulation solely varied the gas water cut, selecting 0.5%, 1.0%, 1.5%, and 2.0% as the subject conditions.
The effect of water cut on liquid loading across the pipelines is illustrated in Fig. 7. For the Han 8-12 pipeline, the water cut showed no significant influence on loading volume, except at the 0.5% level. However, in the other pipelines, the liquid loading volume displayed a gradual increasing trend as the CBM water cut was raised.
Liquid loading in the Han 8-07 pipeline was noticeably higher than in Han 8-12, and the loading in the Han 8-05 pipeline was significantly higher than in Han 8-07. This discrepancy is attributed to the substantial differences in mass flow rates: Han 8-12 operates at 426.7 kg/h, while Han 8-07’s flow rate is significantly lower at 33.7 kg/h. This lower flow rate results in a drastic reduction in gas velocity within the Han 8-07 pipeline, making it highly prone to water loading. Furthermore, the pipeline length is a key factor: Han 8-12 (500 m) and Han 8-07 (266 m) are shorter than Han 8-05 (1400 m), which explains why the Han 8-05 pipeline exhibits the highest liquid loading volume.
Mechanistically, increasing water cut raises the liquid supply rate and promotes a thicker wall film and more frequent liquid bridging at low points, thereby pushing the flow towards intermittent/slug-like behaviour and increasing the time-averaged holdup. The markedly different sensitivities among branches can be interpreted by their hydraulic self-cleaning margin. Han 8-12 operates at a much higher gas transport capacity (high
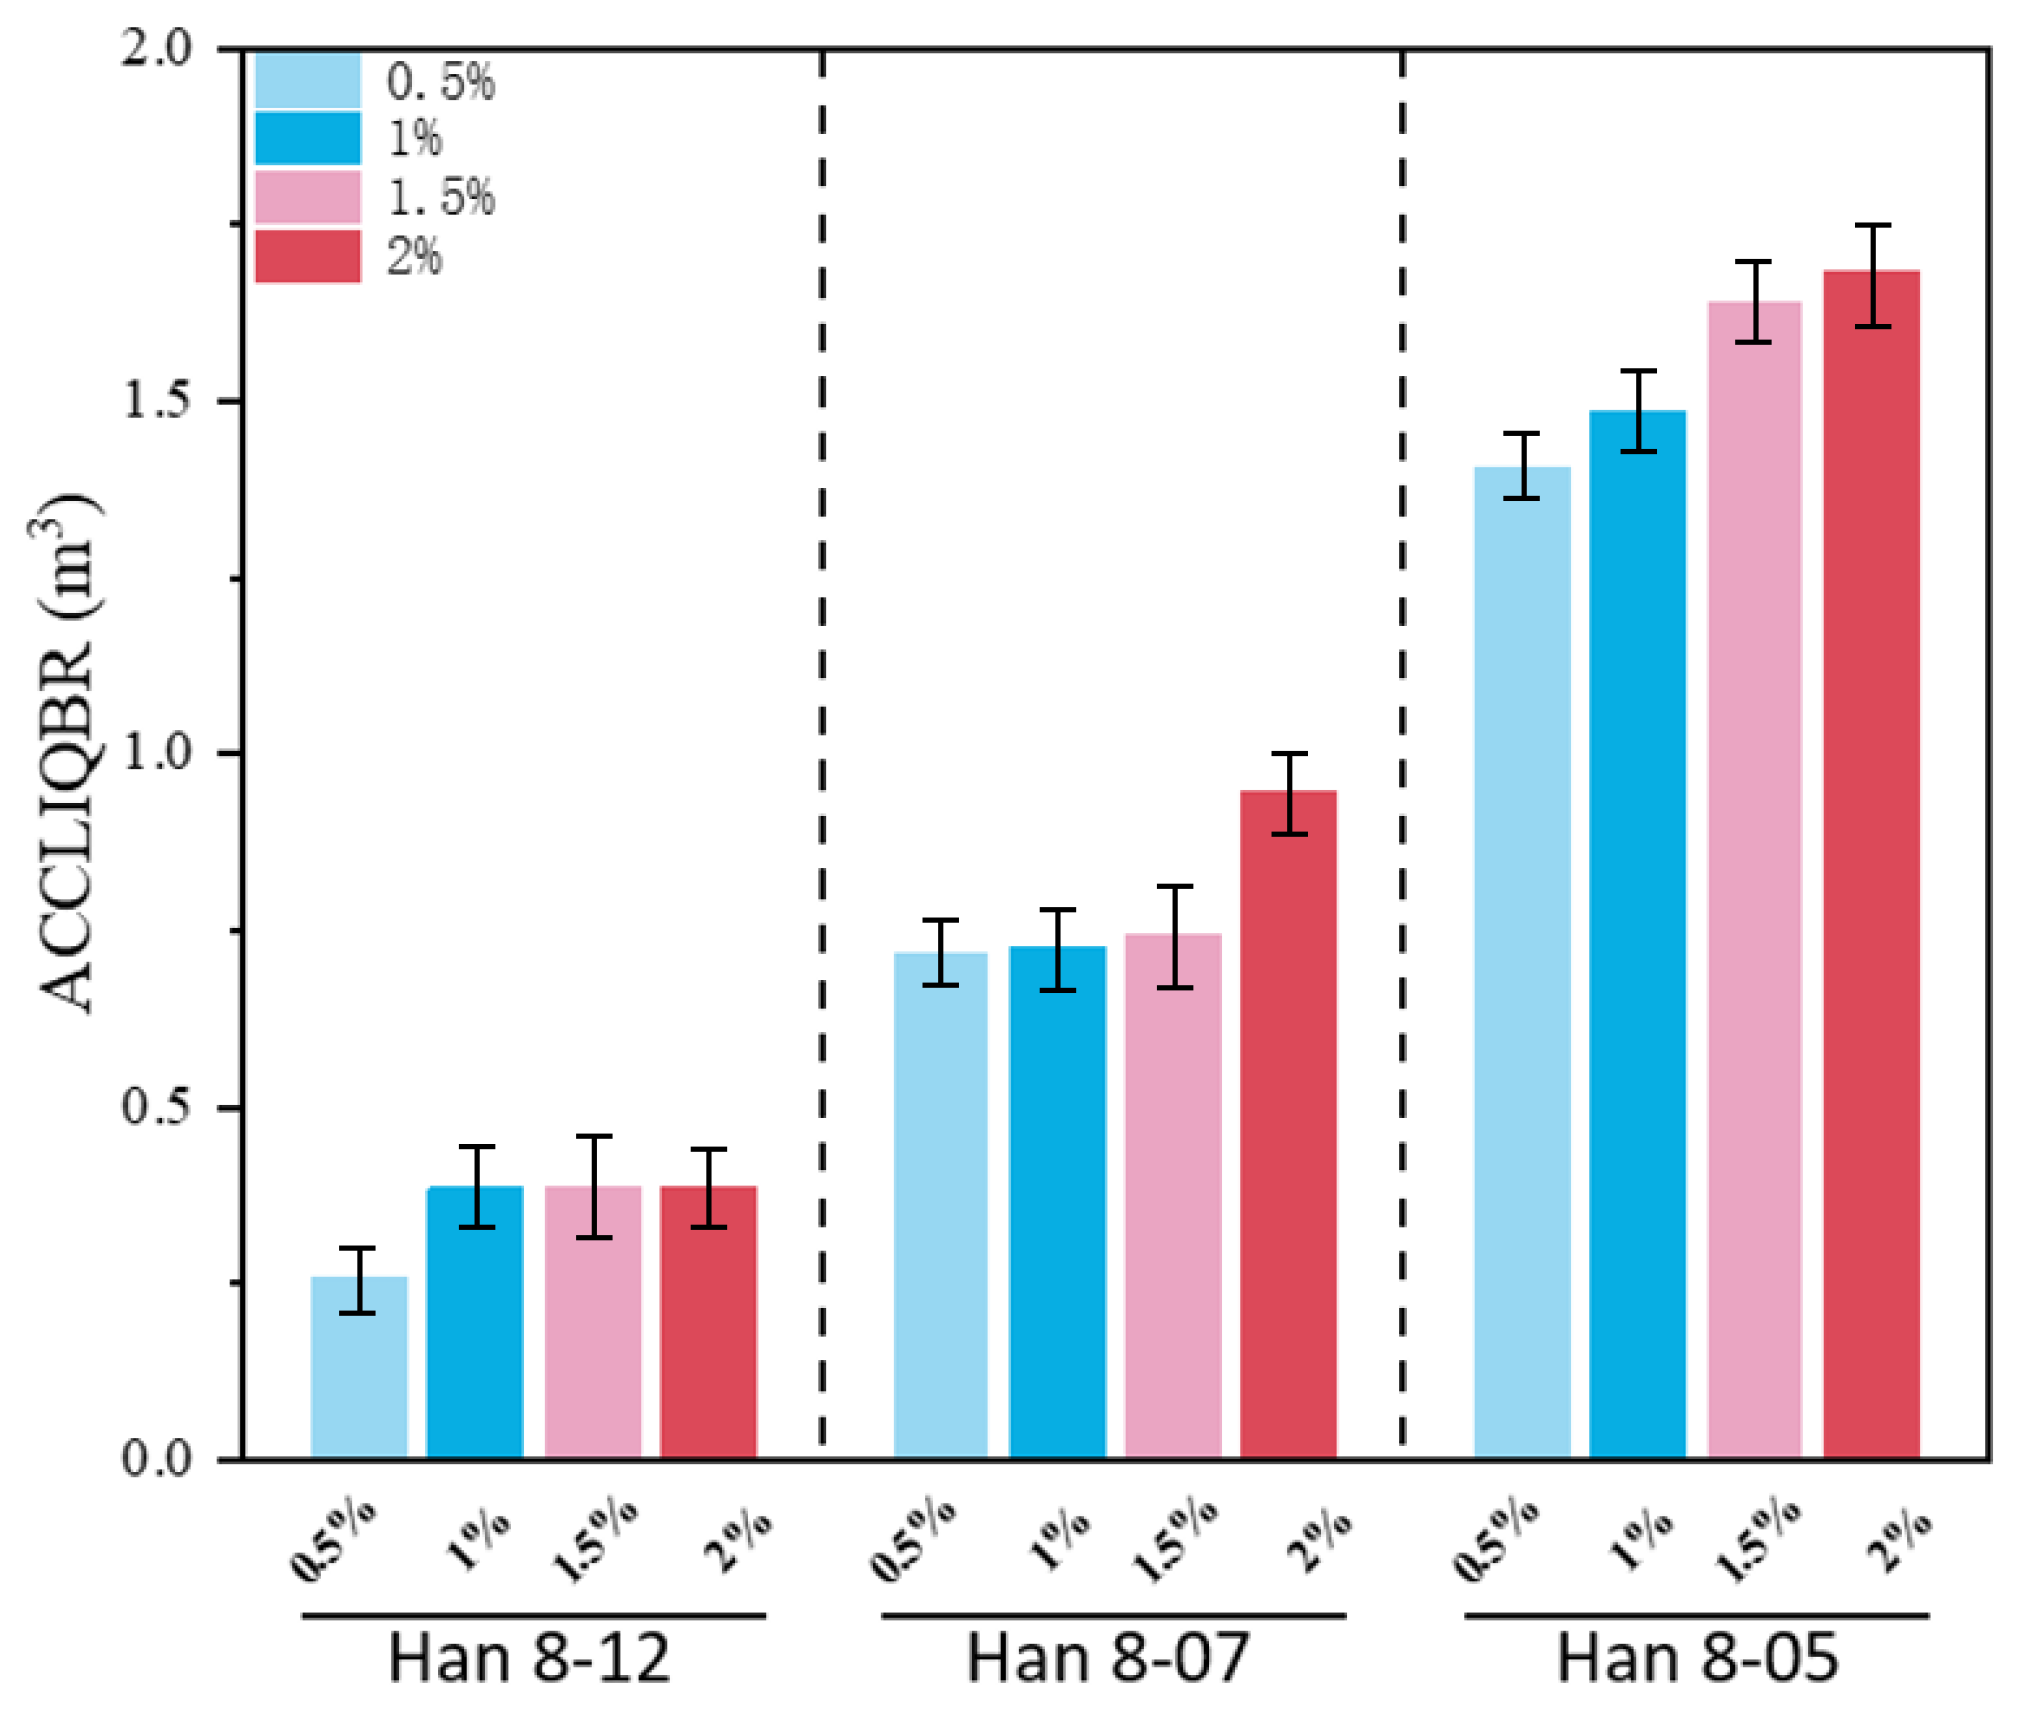
Figure 7: Influence of coalbed methane water cut on liquid loading volume across different pipelines.
4.6 Effect of Varying Soil Temperature
With all other parameters held constant, the soil temperature was varied, selecting specific values of −2°C, 6°C, 13°C, 20°C as the simulation parameters.
The influence of soil temperature on liquid loading across the pipelines is presented in Fig. 8. For the Han 8-12 pipeline, variations in soil temperature showed no significant effect on the accumulated liquid volume. Conversely, the other pipelines consistently demonstrated an overall declining trend in liquid loading as the soil temperature increased. The influence of the thermal factor on liquid loading was particularly conspicuous in the Han 8-05 pipeline. The extended length of this pipeline prolongs the duration over which the gas stream interacts thermally with the soil, rendering the liquid loading behavior significantly more susceptible to external temperature fluctuations. Therefore, the impact of temperature variation in the Han 8-05 pipeline is a critical factor requiring meticulous consideration.
The soil-temperature effect reflects a coupled thermo-hydrodynamic mechanism: colder surroundings cool the gas towards the burial-temperature equilibrium, increasing the likelihood and extent of crossing below the water dew point and thus converting vapour-phase water into an additional liquid supply. Once condensation occurs, the increased liquid inventory must be removed by gas shear; if the hydraulic margin is limited, condensation rapidly translates into higher holdup and accumulation. The pronounced sensitivity of Han 8-05 is therefore expected because its longer length provides a larger effective heat-exchange opportunity (longer thermal contact time and larger cumulative UA), allowing the gas temperature to approach the soil temperature more closely and for longer, thereby generating more condensation and more opportunities for terrain-induced pooling. In contrast, the short length and strong throughflow of Han 8-12 reduce thermal equilibration and maintain a larger self-cleaning margin, making its accumulated liquid volume comparatively insensitive to soil temperature within the studied range.
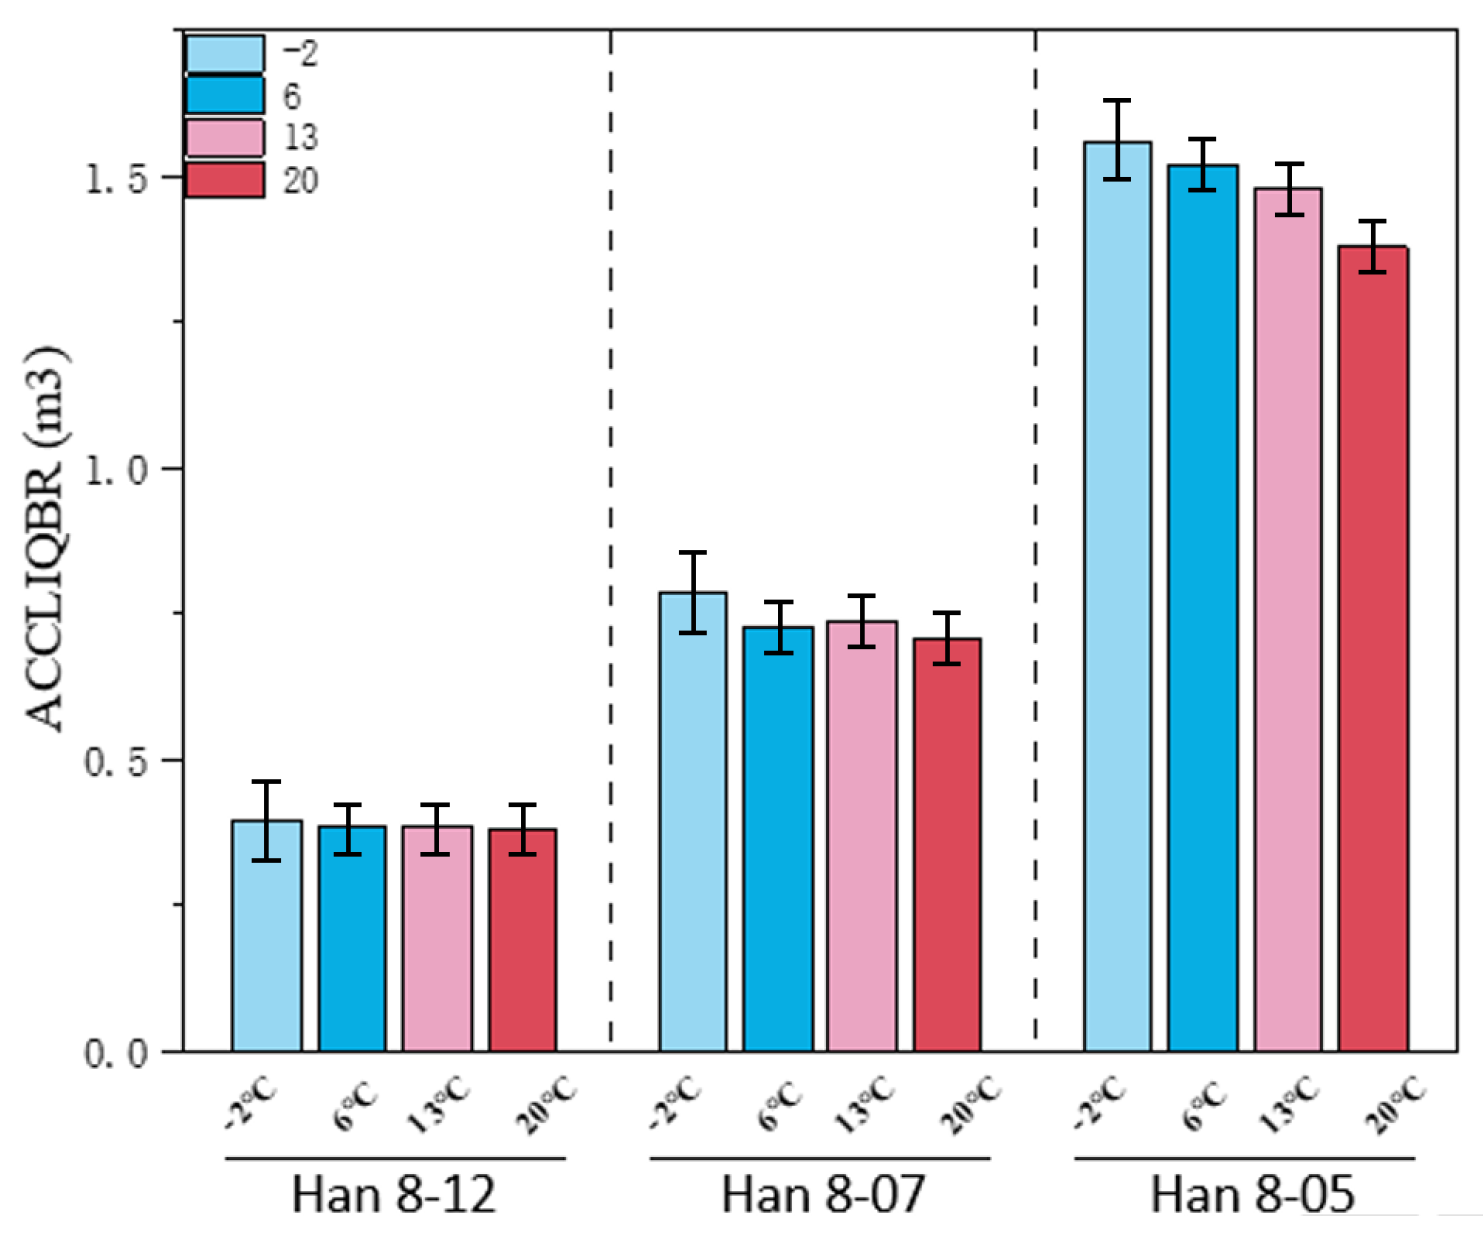
Figure 8: Influence of soil temperature on liquid loading volume across different pipelines.
4.7 Quantitative Correlation between Liquid Holdup and Operational Performance
To quantify the impact of liquid loading, a correlation analysis was performed between the simulated liquid holdup ratio (
For the Hancheng block, the regression yields
4.8 Integrity Coupling under Liquid Loading
Liquid loading in CBM gathering pipelines is not only a hydraulic phenomenon but can also couple with long-term integrity processes. Elevated liquid holdup sustains a continuous aqueous phase as wall films and low-point pools, which can act as an electrolyte and promote internal corrosion. In CBM service, dissolved CO2 (and potentially trace O2) can increase corrosivity; corrosion/scale growth then increases internal roughness and modifies near-wall hydrodynamics, raising frictional losses and weakening shear-driven liquid re-entrainment. This feedback can reinforce liquid retention and exacerbate pressure drop over time.
Liquid retention may also be amplified by emulsion and dispersed-phase effects. Organic matter and formation fines (e.g., coal fines) can stabilise gas–water dispersions, increasing apparent viscosity and slowing film drainage, thereby extending liquid residence time and promoting thicker films and pooling under low-momentum conditions. From a flow-assurance perspective, this implies that clean-water assumptions may overestimate removal capacity in fine-laden or emulsifying regimes, making holdup-based risk indicators and velocity margins more conservative but operationally relevant.
Finally, while typical CBM streams are methane-dominant, mixed-hydrocarbon scenarios may introduce additional deposition or organic fouling risks that effectively reduce diameter and increase roughness, further amplifying both liquid loading propensity and pressure losses. These integrity-coupled processes are discussed here as operational implications rather than being explicitly modelled in the present OLGA framework, and they motivate coordinated mitigation and monitoring alongside the hydraulic and thermal strategies proposed in this study.
This study leveraged correlation and numerical analysis to elucidate the critical factors governing liquid Loading in gathering pipelines. Collectively, pipe diameter, water cut, and soil temperature exhibit a significant relationship with both the accumulated liquid volume and the gas phase velocity. Furthermore, variations in liquid holdup across different pipelines display both general system commonalities and distinctive case-specific anomalies.
Regarding Liquid Loading Volume, both the pipe diameter and water cut are positively correlated, indicating that an increase in either parameter exacerbates liquid loading. Conversely, the soil temperature exhibits a negative correlation, with rising temperatures effectively mitigating the volume of accumulated liquid. Analyzing Gas Phase Velocity, both pipe diameter and water cut are negatively correlated, confirming that larger diameters or higher water cuts inhibit efficient gas transport. The soil temperature, however, is positively correlated with Gas Phase Velocity, demonstrating that increased thermal input promotes gas transmission. Flow regime simulation results establish a high degree of consistency between flow pattern transitions and liquid holdup ratio, thus validating the latter as a robust indicator for predicting liquid loading status. Moreover, the flow regimes for all pipelines, excluding Han 8-05, were accurately described by the predictive model, affirming its substantial engineering applicability.
Specific Pipeline Dynamics: The Han 8-12 pipeline exhibited a sharp drop in liquid holdup at the 301 m mark under most conditions, moving to 200 m at the 90 mm diameter and 0.5% water cut scenario. The Han 8-07 pipeline generally showed this decline at 215 m, advancing to 75 m at 90 mm diameter; critically, at a 2% water cut, the pipeline maintained a persistently high holdup state throughout its entire length. Conversely, the Han 8-05 pipeline displayed pronounced flow instability, with liquid holdup frequently fluctuating and exhibiting “spike” phenomena within the 380 m to 1100 m segment, lacking a predictable decline location.
Flow regime simulation results establish a high degree of consistency between flow pattern transitions and liquid holdup ratio. Quantitatively, a liquid holdup ratio of 20% is identified as the early-warning threshold, beyond which gas production loss increases by approximately 750 m3/d per 10% holdup increment, and pressure fluctuations exceed the field-tolerable limit of 0.02 MPa.
The dynamic OLGA model utilized in this study more effectively captures the transient flow regime transitions and terrain-induced liquid pooling. The high liquid holdup predicted in high-risk segments shows strong consistency with field observations of flow instability in the Hancheng block. This comparison not only validates the reliability of the numerical methodology but also highlights the practical significance of dynamic simulation for flow assurance in late-stage CBM gathering systems.
In conclusion, this research systematically identified the multi-factor mechanisms influencing liquid loading and gas flow, clarified the characteristic liquid holdup behavior of various pipelines, and established a predictive foundation and theoretical basis for pipeline design optimization and operational flow assurance.
Acknowledgement:
Funding Statement: This work was supported by PetroChina Coalbed Methane Co., Ltd. Hancheng Branch (Xi’an, China), which provided both the research funding for this study and the Article Processing Charge (APC) for its publication.
Author Contributions: The authors confirm contribution to the paper as follows: study conception and design: Liqiong Chen, Ting He, Hongwei Rao; data collection: Yonghong Deng, Ming Yang, Hongwei Rao; analysis and interpretation of results: Shengguang Li, Changhui Zhou, Yangyang Huang; draft manuscript preparation: Chong Di, Zizheng Kong, Xicheng Gao. All authors reviewed and approved the final version of the manuscript.
Availability of Data and Materials: The data used in this study contain commercially sensitive information and are therefore not publicly available. Access to anonymized or processed data may be granted by the corresponding author upon reasonable request.
Ethics Approval: Not applicable.
Conflicts of Interest: The authors declare no conflicts of interest.
References
1. Liu H , Chen J , Tao J , Li N , Duan J , Chen Y . Gas-liquid hydrodynamics during liquid displacement by gas in up-hill pipeline. Processes. 2024; 12( 2): 394. doi:10.3390/pr12020394. [Google Scholar] [CrossRef]
2. Soave G . Equilibrium constants from a modified Redlich-Kwong equation of state. Chem Eng Sci. 1972; 27( 6): 1197– 203. doi:10.1016/0009-2509(72)80096-4. [Google Scholar] [CrossRef]
3. Hasan AR , Kabir CS . Wellbore heat-transfer modeling and applications. J Petrol Sci Eng. 2012; 86: 127– 36. doi:10.1016/j.petrol.2012.03.021. [Google Scholar] [CrossRef]
4. Chen D , Yao Y , Fu G , Meng H , Xie S . A new model for predicting liquid loading in deviated gas wells. J Nat Gas Sci Eng. 2016; 34: 178– 84. doi:10.1016/j.jngse.2016.06.063. [Google Scholar] [CrossRef]
5. Landjobo Pagou A , Wu X , Zhu Z , Peng L . Liquid film model for prediction and identification of liquid loading in vertical and inclined gas wells. J Petrol Sci Eng. 2020; 188: 106896. doi:10.1016/j.petrol.2019.106896. [Google Scholar] [CrossRef]
6. Liu X , Falcone G , Teodoriu C . Liquid loading in gas wells: From core-scale transient measurements to coupled field-scale simulations. J Petrol Sci Eng. 2017; 157: 1056– 66. doi:10.1016/j.petrol.2017.08.025. [Google Scholar] [CrossRef]
7. He F , Huang X , Yang Y , Bu C , Xing H , Pu L , et al. Review on critical liquid loading models and their application in deep unconventional gas reservoirs. Front Energy Res. 2024; 12: 1407384. doi:10.3389/fenrg.2024.1407384. [Google Scholar] [CrossRef]
8. Fadairo A , Olugbenga F , Sylvia NC . A new model for predicting liquid loading in a gas well. J Nat Gas Sci Eng. 2015; 26: 1530– 41. doi:10.1016/j.jngse.2014.09.003. [Google Scholar] [CrossRef]
9. Mandal TK , Bhuyan MK , Das G , Das PK . Effect of undulation on gas–liquid two-phase flow through a horizontal pipeline. Chem Eng Res Des. 2008; 86( 3): 269– 78. doi:10.1016/j.cherd.2007.11.014. [Google Scholar] [CrossRef]
10. Belfroid S , Schiferli W , Alberts G , Veeken CAM . Predicting onset and dynamic behaviour of liquid loading in gas wells. In: Proceedings of the SPE Annual Technical Conference and Exhibition; 2008 Sep 21–24; Denver, CO, USA. doi:10.2118/115567-MS. [Google Scholar] [CrossRef]
11. Rastogi A , Fan Y . Experimental and modeling study of onset of liquid accumulation. J Nat Gas Sci Eng. 2020; 73: 103064. doi:10.1016/j.jngse.2019.103064. [Google Scholar] [CrossRef]
12. Abhulimen KE , Abhulimen KE , Oladipupo AD . Modelling of liquid loading in gas wells using a software-based approach. J Petrol Explor Prod Technol. 2023; 13( 1): 1– 17. doi:10.1007/s13202-022-01525-x. [Google Scholar] [CrossRef]
13. Hong BY , Liu SN , Li XP , Fan D , Ji SP , Chen SH , et al. A liquid loading prediction method of gas pipeline based on machine learning. Petrol Sci. 2022; 19( 6): 3004– 15. doi:10.1016/j.petsci.2022.05.002. [Google Scholar] [CrossRef]
14. Wang W , Zhang X , Wei Y , Li Y , Zhang L , Chen J , et al. A new mechanistic model to predict liquid loading in inclined natural gas wells. Geoenergy Sci Eng. 2024; 241: 213163. doi:10.1016/j.geoen.2024.213163. [Google Scholar] [CrossRef]
15. Vieira C , Stanko M , Oplt T . An improved model for predicting liquid loading onset in inclined pipes with non-uniform liquid wall films. J Nat Gas Sci Eng. 2021; 91: 103902. doi:10.1016/j.jngse.2021.103902. [Google Scholar] [CrossRef]
16. Tang H , Sun Z , He Y , Chai Z , Hasan AR , Killough J . Investigating the pressure characteristics and production performance of liquid-loaded horizontal wells in unconventional gas reservoirs. J Petrol Sci Eng. 2019; 176: 456– 65. doi:10.1016/j.petrol.2019.01.072. [Google Scholar] [CrossRef]
17. Sun L , Li D , Qi W , Hao L , Tang A , Yang L , et al. Application of composite drainage and gas production synergy technology in deep coalbed methane wells: A case study of the jishen 15A platform. Processes. 2025; 13( 5): 1457. doi:10.3390/pr13051457. [Google Scholar] [CrossRef]
18. Wang Q . Timeliness analysis of coalbed methane workover for reducing damage to coal reservoirs. ACS Omega. 2022; 7( 8): 6956– 62. doi:10.1021/acsomega.1c06644. [Google Scholar] [CrossRef]
19. Cao Y , Wu G , Li Z , Yu J , Zou M . Multiphase flow modeling and optimization design method of dual gas lift for liquid unloading in dual-gas co-production wells. Front Earth Sci. 2025; 13: 1650747. doi:10.3389/feart.2025.1650747. [Google Scholar] [CrossRef]
20. Yan L , Wen H , Jin Y , Guo J , Liu Y , Fan S . Fluid-solid coupling characteristics of methane-containing coal during borehole extraction of coalbed: Numerical modeling and experimental research. ACS Omega. 2023; 8( 51): 49334– 46. doi:10.1021/acsomega.3c07852. [Google Scholar] [CrossRef]
21. Quan F , Wei C , Feng S , Hu Y . Physical experiment and numerical simulation of the depressurization rate for coalbed methane production. ACS Omega. 2020; 5( 35): 22661– 73. doi:10.1021/acsomega.0c03439. [Google Scholar] [CrossRef]
22. Zhao WD , Fang LP , Xie ZQ , Zhou X . Prediction of liquid accumulation in a shale gas pipeline. Sci Rep. 2026; 16( 1): 1– 15. doi:10.1038/s41598-026-37157-y. [Google Scholar] [CrossRef]
23. Filippov S , Petukhov B . Experimental and theoretical study of reflux condensation in inclined small-diameter tubes. Int J Heat Mass Transf. 2004; 47( 19–20): 4031– 43. doi:10.1016/j.ijheatmasstransfer.2004.06.005. [Google Scholar] [CrossRef]
24. Wu X , Wang Z , Dong L , Xin Y , Cao H . Experimental study on the slugging characteristics of gas-liquid slug flow in horizontal pipes. ACS Omega. 2022; 7( 25): 21643– 53. doi:10.1021/acsomega.2c01516. [Google Scholar] [CrossRef]
25. Mirshamsi M , Rafeeyan M . Dynamic analysis and simulation of long pig in gas pipeline. J Nat Gas Sci Eng. 2015; 23: 294– 303. doi:10.1016/j.jngse.2015.02.004. [Google Scholar] [CrossRef]
26. Ma R , Ma T , Kang J , Yang K , Li L , Wang L . Prediction model of critical liquid-carrying gas velocity for high gas-to-liquid ratio gathering pipelines. J Pipeline Sci Eng. 2023; 3( 1): 100093. doi:10.1016/j.jpse.2022.100093. [Google Scholar] [CrossRef]
27. Schouten J , Janssenvanrosmalen R , Michels J . Condensation in gas transmission pipelines. Int J Hydrogen Energy. 2005; 30( 6): 661– 8. doi:10.1016/j.ijhydene.2004.10.010. [Google Scholar] [CrossRef]
28. Parida BP , Sinharay R . Sweet spots in coal bed methane (CBM): Major controlling parameters identification through reservoir modeling, simulation, and uncertainty analysis to De-risk field development. J Nat Gas Geosci. 2025; 10( 5): 343– 59. doi:10.1016/j.jnggs.2025.09.002. [Google Scholar] [CrossRef]
29. Abdul-Majeed GH , Al-Mashat AM . A mechanistic model for vertical and inclined two-phase slug flow. J Pet Sci Eng. 2000; 27( 1–2): 59– 67. doi:10.1016/S0920-4105(00)00047-4. [Google Scholar] [CrossRef]
30. Abdul-Majeed G , Al-Sarkhi A , Mohmmed AO , Hamoudi MR . An empirical approach for predicting slug to pseudo-slug transition of air/water upward two-phase flow. Exp Comput Multiph Flow. 2024; 6( 2): 154– 69. doi:10.1007/s42757-023-0170-1. [Google Scholar] [CrossRef]
Cite This Article
 Copyright © 2026 The Author(s). Published by Tech Science Press.
This work is licensed under a Creative Commons Attribution 4.0 International License , which permits unrestricted use, distribution, and reproduction in any medium, provided the original work is properly cited.
 Downloads
 Citation Tools