
 Submit a Paper
 Propose a Special lssue
 Open Access
ARTICLE

Enhancement of Gas–Liquid Mixing in Side-Blown Smelting via Sinusoidal Pulsed Swirling Injection
1 State Key Laboratory of Complex Nonferrous Metal Resources Clean Utilization, School of Metallurgical and Energy Engineering, Kunming University of Science and Technology, Kunming, China
2 Department of Energy and Power Engineering, School of Metallurgical and Energy Engineering, Kunming University of Science and Technology, Kunming, China
3 Yunnan Key Laboratory of Clean Energy and Energy Storage Technology, School of Metallurgical and Energy Engineering, Kunming University of Science and Technology, Kunming, China
4 The School of Energy and Power Engineering, Chongqing University, Chongqing, China
* Corresponding Author: Xiaohui Zhang. Email:
Fluid Dynamics & Materials Processing 2026, 22(3), 5 https://doi.org/10.32604/fdmp.2026.076426
Received 20 November 2025; Accepted 06 March 2026; Issue published 31 March 2026
 View Full Text
 Download PDF
Abstract
To overcome the limited mixing efficiency associated with conventional steady-state side blowing in molten pool smelting, this study proposes a gas injection strategy that combines a swirl lance configuration with sinusoidal pulsed blowing. Using a volume-of-fluid (VOF) multiphase flow framework coupled with the Realizable k–ε turbulence model, the performance of constant-velocity blowing is systematically compared with sinusoidal pulsed blowing over a range of amplitudes (5, 10, and 15 m/s) and frequencies (0.5, 1, and 2 Hz). The results demonstrate that sinusoidal pulsed blowing markedly enhances gas–liquid mixing within the melt pool relative to constant-speed injection. Mixing efficiency increases with blowing amplitude, while its dependence on pulse frequency is nonlinear. Within the investigated parameter space, the optimal configuration, an amplitude of 15 m/s and a frequency of 1 Hz, raises the average gas volume fraction by 8%, reduces the mixing dead-zone area by 81%, and expands the active mixing region by 25%. Overall, the imposed sinusoidal pulsing promotes bubble breakup beneath the free surface, leading to more complete bubble collapse, intensified turbulent agitation, and, ultimately, improved gas–liquid mixing.Graphic Abstract
Keywords
Bath smelting technology is the core process of modern pyrometallurgy. It is classified into three types—top-blown, bottom-blown, and side-blown—based on the gas injection position [1]. Among them, side-blown technology is widely used in nonferrous metal smelting due to its significant advantages such as high efficiency, strong raw material adaptability, and environmental friendliness [2,3,4,5,6]. In this technology, reaction gas is injected into the molten bath as a high-velocity jet through sidewall lances. The physical kinetic energy of the jet and the chemical energy released from gas-liquid-solid reactions together induce intense agitation of the melt [7,8]. The multiphase flow behavior in the molten bath determines the mixing efficiency of the smelting process. Therefore, in-depth revelation and optimization of its hydrodynamic characteristics are crucial for improving side-blown smelting technology.
To investigate flow field characteristics within side-blown melting furnaces, the academic community primarily employs experimental method and numerical simulation. Experimental approaches are represented by physical simulations using scaled water models, which reproduce flow patterns by ensuring similarity in key dimensionless numbers [9]. Numerical simulation methods center on computational fluid dynamics (CFD) modeling, which resolves governing equations to capture full-scale flow field details [10,11]. The advantage of experimental methods lies in their ability to provide direct, realistic observation of gas-liquid flow phenomena within the melt pool. Numerical simulations, however, enable rapid modeling of diverse operating conditions, allowing extraction of critical parameters such as velocity and turbulent kinetic energy at any point within the melt pool, thereby facilitating in-depth analysis of flow field micro-characteristics. In terms of experimental research, Chanouian et al. [12,13,14] investigated the effects of furnace inclination angle, liquid level height, and gas flow rate on gas-liquid mixing time and gas penetration depth. The results indicated that penetration depth is unrelated to the furnace tilt angle, while mixing time and gas flow velocity are dependent on the furnace geometry. On this basis, Xiao et al. [15] proposed a mixing energy evaluation method to comprehensively analyze the influence of operating parameters on the flow field, and pointed out that the effective mixing zone is related to buoyancy. To further achieve universal prediction, Ma et al. [16] derived a dimensionless gas penetration depth formula with modified Froude number, Reynolds number, and other key parameters by means of dimensional analysis and the Buckingham pi theorem.
In terms of numerical simulation, numerous scholars have conducted research on factors including lance velocity, installation angle, number of lances, and lance immersion depth [17,18]. Based on the velocity distribution characteristics inside the furnace, the flow field can be divided into five regions: high-velocity zone, strong circulation zone, weak circulation zone, gas separation zone, and stagnant zone. Among these regions, the mixing intensity of the weak circulation zone is critical to improving mixing efficiency, which can be enhanced by adjusting the lance arrangement or increasing the injection velocity, The inclined spraying method achieves the best strengthening effect in the weak circulation zone [19]. Yang et al. [20] performed an orthogonal analysis of various operating factors, and the results indicated that lance diameter is the primary factor affecting the flow field characteristics in the molten bath, while the influence of lance spacing is relatively weak. Regarding slag splashing, Zou et al. [21] discovered that increasing the lance immersion depth or molten bath depth can reduce slag splashing. However, excessively high injection velocity tends to cause slag splashing and shorten the furnace service life. In addition, Hu et al. [22] proposed a predictive formula for bubble characteristic velocity based on the Weber number and Reynolds number from the perspective of bubble dynamic behavior, providing a basis for explaining the flow phenomena inside the furnace. Abbassi et al. [23] investigated the effects on the shape change of bubbles during their ascent, and found that high-viscosity solutions play an important role in the shape variation of bubbles. In contrast, in low-viscosity solutions, the bubble shape is mainly influenced by surface tension and inertial force.
The aforementioned studies have provided an important basis for the improvement of side-blown smelting processes. However, they predominantly focus on traditional steady-state jet modes, which aim to enhance mixing by optimizing geometric or operational parameters of continuous jets. To further enhance mixing intensity, scholars have proposed changing the jet mode, among which swirl lances and pulsed injection show great potential. Compared with straight-flow lances, swirl lances are equipped with guide vanes or spiral channels internally to generate three-dimensional rotating jets. This design can effectively increase the gas-liquid contact area and enhance turbulence intensity, thereby achieving better gas-liquid mixing and mass transfer effects under the same energy consumption [24,25,26,27,28]. Rout et al. [29,30] generated swirling jets by adjusting the angle of side-blown lances, such a more three-dimensional vortex configuration enhances the heat transfer efficiency by around 30%, confirming their enhancement effect on heat and mass transfer as well as mixing processes. Based on the similarity principle, Xiao et al. [31] established a water model of a side-blown smelting furnace and found that the bubble morphology generated by swirl lances is more stable, and the jet trajectory is more inclined to the middle of the molten bath, which helps to improve mixing uniformity.
Pulsed injection technology converts continuous gas flow into unsteady momentum input with specific frequency and waveform [32,33]. It can effectively break the steady-state flow field structure, thereby enhancing heat transfer, mass transfer, and reaction processes [34,35]. Currently, scholars have conducted relevant research in top-blown and bottom-blown processes. The results show that compared with gas injection at a fixed velocity, pulsed injection can better suppress slag splashing, reduce stirring dead zones, increase gas penetration depth, and improve melt flow velocity. Among various pulse waveforms, sinusoidal pulsation features continuous and smooth velocity changes. It can not only effectively introduce intense disturbance but also avoid severe impact and equipment vibration caused by sudden velocity changes, thus demonstrating significant advantages in mixing efficiency and operational stability [36,37,38].
The aforementioned research provides critical theoretical support for multiphase flow mixing in side-blown molten pools. However, several knowledge gaps remain. First, although swirl nozzles demonstrate enhanced mixing advantages under conventional steady side-blowing, it remains unclear whether they can further improve gas-liquid mixing efficiency under pulsed conditions. Second, while pulsed injection technology has shown significant effectiveness in top-blown and bottom-blown processes, its application research in side-blown furnaces remains insufficient. Horizontal gas injection in side-blown processes agitates the melt pool, contrasting sharply with vertical injection in top/bottom-blown systems. This fundamental difference in injection geometry and flow field structure raises questions about the applicability and effectiveness of pulse optimization strategies and theories developed for top/bottom-blown systems in side-blown melt pools. To address these gaps, this study establishes a two-phase flow numerical model for swirl-type side-blown furnaces. It focuses on investigating the effects of the amplitude, frequency parameters of sinusoidal pulsed injection, and constant-velocity injection mode on the flow characteristics of the molten bath when using swirl lances. The aim is to identify the injection scheme that maximizes gas-liquid mixing efficiency within the studied parameter range.
2 Model Establishment and Validation
2.1 Model Simplification and Assumptions
This study focuses on the gas-liquid two-phase flow behavior during the side-blown furnace smelting process. Air is used as the injection gas and water as the molten material, as there is a significant body of research on air-water systems in the metallurgical side-blowing field, facilitating result verification. Furthermore, to reduce unnecessary research content and computational load, the following assumptions are made for the physical model:
- (1)Processes such as feeding and slag discharge in actual production are ignored, and the liquid surface is static in the initial state.
- (2)The effects of chemical reactions and temperature field changes are not considered.
- (3)The fluid is incompressible and viscous.
2.2 Establishment of the Physical Model
The physical model adopted in this study is derived from Reference [39], with dimensions of 1.20 m × 1.68 m × 1.715 m and a geometric similarity ratio of 1:2 relative to the original model. Two pairs of swirl lances are included in the computational domain. These lances are symmetrically arranged with a height of 0.55 m. The top surface of the furnace is defined as the outlet boundary. The boundary represents the atmospheric environment connected to the furnace chamber. Fig. 1 shows the schematic diagram of the model in this study.
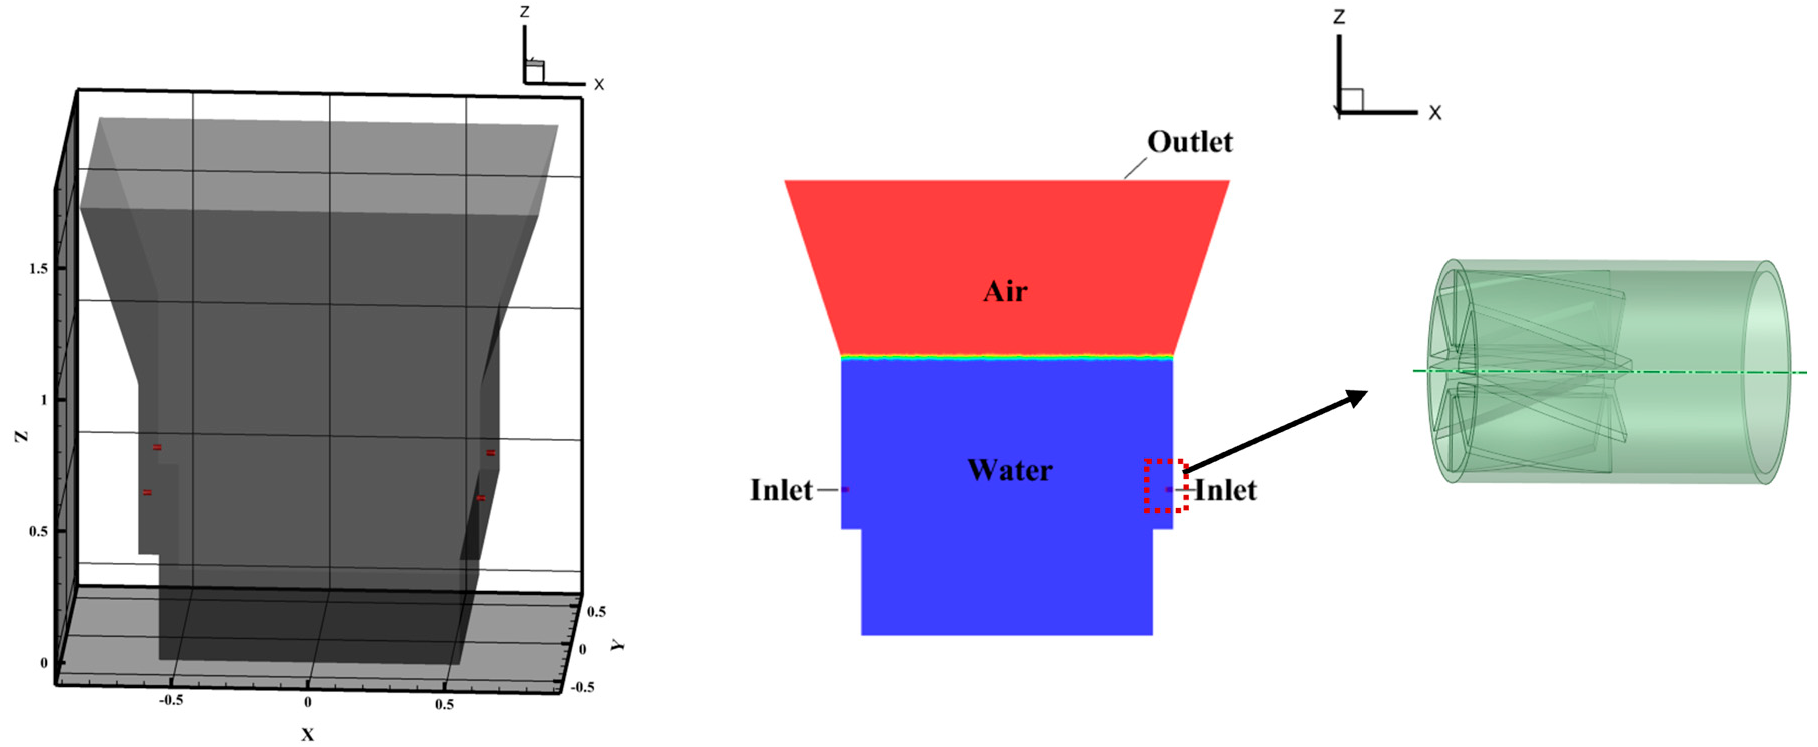
Figure 1: Physical model of the side-blown furnace.
The injection velocity calculated in this study via the modified Froude number similarity criterion is 70 m/s. The formula is as follows:
To ensure that the model exhibits similar flow characteristics to the prototype, the following conditions must be satisfied:
Table 1 lists the relevant parameters of the side-blown furnace.
Table 1: Dimensional parameters and material parameters of the model.
| Parameter | Value |
|---|---|
| Liquid level height | 1.05 m |
| Lance diameter | 0.019 m |
| Lance height | 0.55 m |
| Gas density | 1.225 kg/m3 |
| Gas viscosity | 1.789 × 10⁻⁵ kg/(m·s) |
| Liquid density | 998.2 kg/m3 |
| Liquid viscosity | 1.003 × 10⁻³ kg/(m·s) |
2.3 Setup of Computational Conditions
This study uses the numerical simulation software ANSYS-FLUENT to solve the established unsteady model. The PISO algorithm is adopted for pressure-velocity coupling. The computational domain is discretized using the PRESTO! scheme for pressure, the Geo-Reconstruct scheme is employed for interface reconstruction, and the second-order upwind scheme is selected for the momentum equation and turbulent kinetic energy equation. This study employs the Continuous Surface Force (CSF) model. The surface tension coefficient σ is 0.072 N/m. Proposed by Brackbill et al. [40], this model’s core principle involves distributing the surface tension at the gas-liquid interface as a volumetric force continuously across the computational grid near the interface, thereby enabling a continuous solution for surface tension. The calculation formula can be referenced in Eq. (7).
During transient VOF multiphase flow computations, computational stability and convergence can be regulated by the Courant number. Eq. (3) is the formula for calculating the Courant number.
The initial time step is set to 0.00001 s, at which point the Courant number is 0.3–0.5. After several iterations, the simulation gradually stabilizes (approximately 0.5 s). The time step is then adjusted to 0.0001 s to ensure computational efficiency, maintaining a Courant number between 1 and 2.
Boundary conditions encompass velocity inlet, pressure outlet, and wall boundaries. Aligned with the micro-negative pressure operating parameters in industrial production, the outlet is configured with a gauge pressure of −10 Pa, which is maintained time-independent throughout the simulation to ensure a stable driving force for gas discharge. For the velocity inlet, key turbulence parameters are specified as follows: a fixed turbulence intensity of 5%, a turbulent viscosity ratio of 10, and a corresponding turbulent Reynolds number of 6322. All furnace walls and lance walls are set as non-slip insulated walls, and the near-wall region is treated using the standard wall function to accurately capture the flow characteristics in the wall-bounded region.
This study investigates the effect of varying frequencies and amplitudes of sinusoidal variable-speed jet blowing on gas-liquid flow mixing efficiency. The simulated schemes are divided into constant velocity inlet and sinusoidal pulse velocity inlet. The constant velocity is 70 m/s (case 1). The sine wave variable velocity formula is expressed as Eq. (4): where vg is the instantaneous velocity of the gas at the inlet boundary. All sine pulse schemes have the same
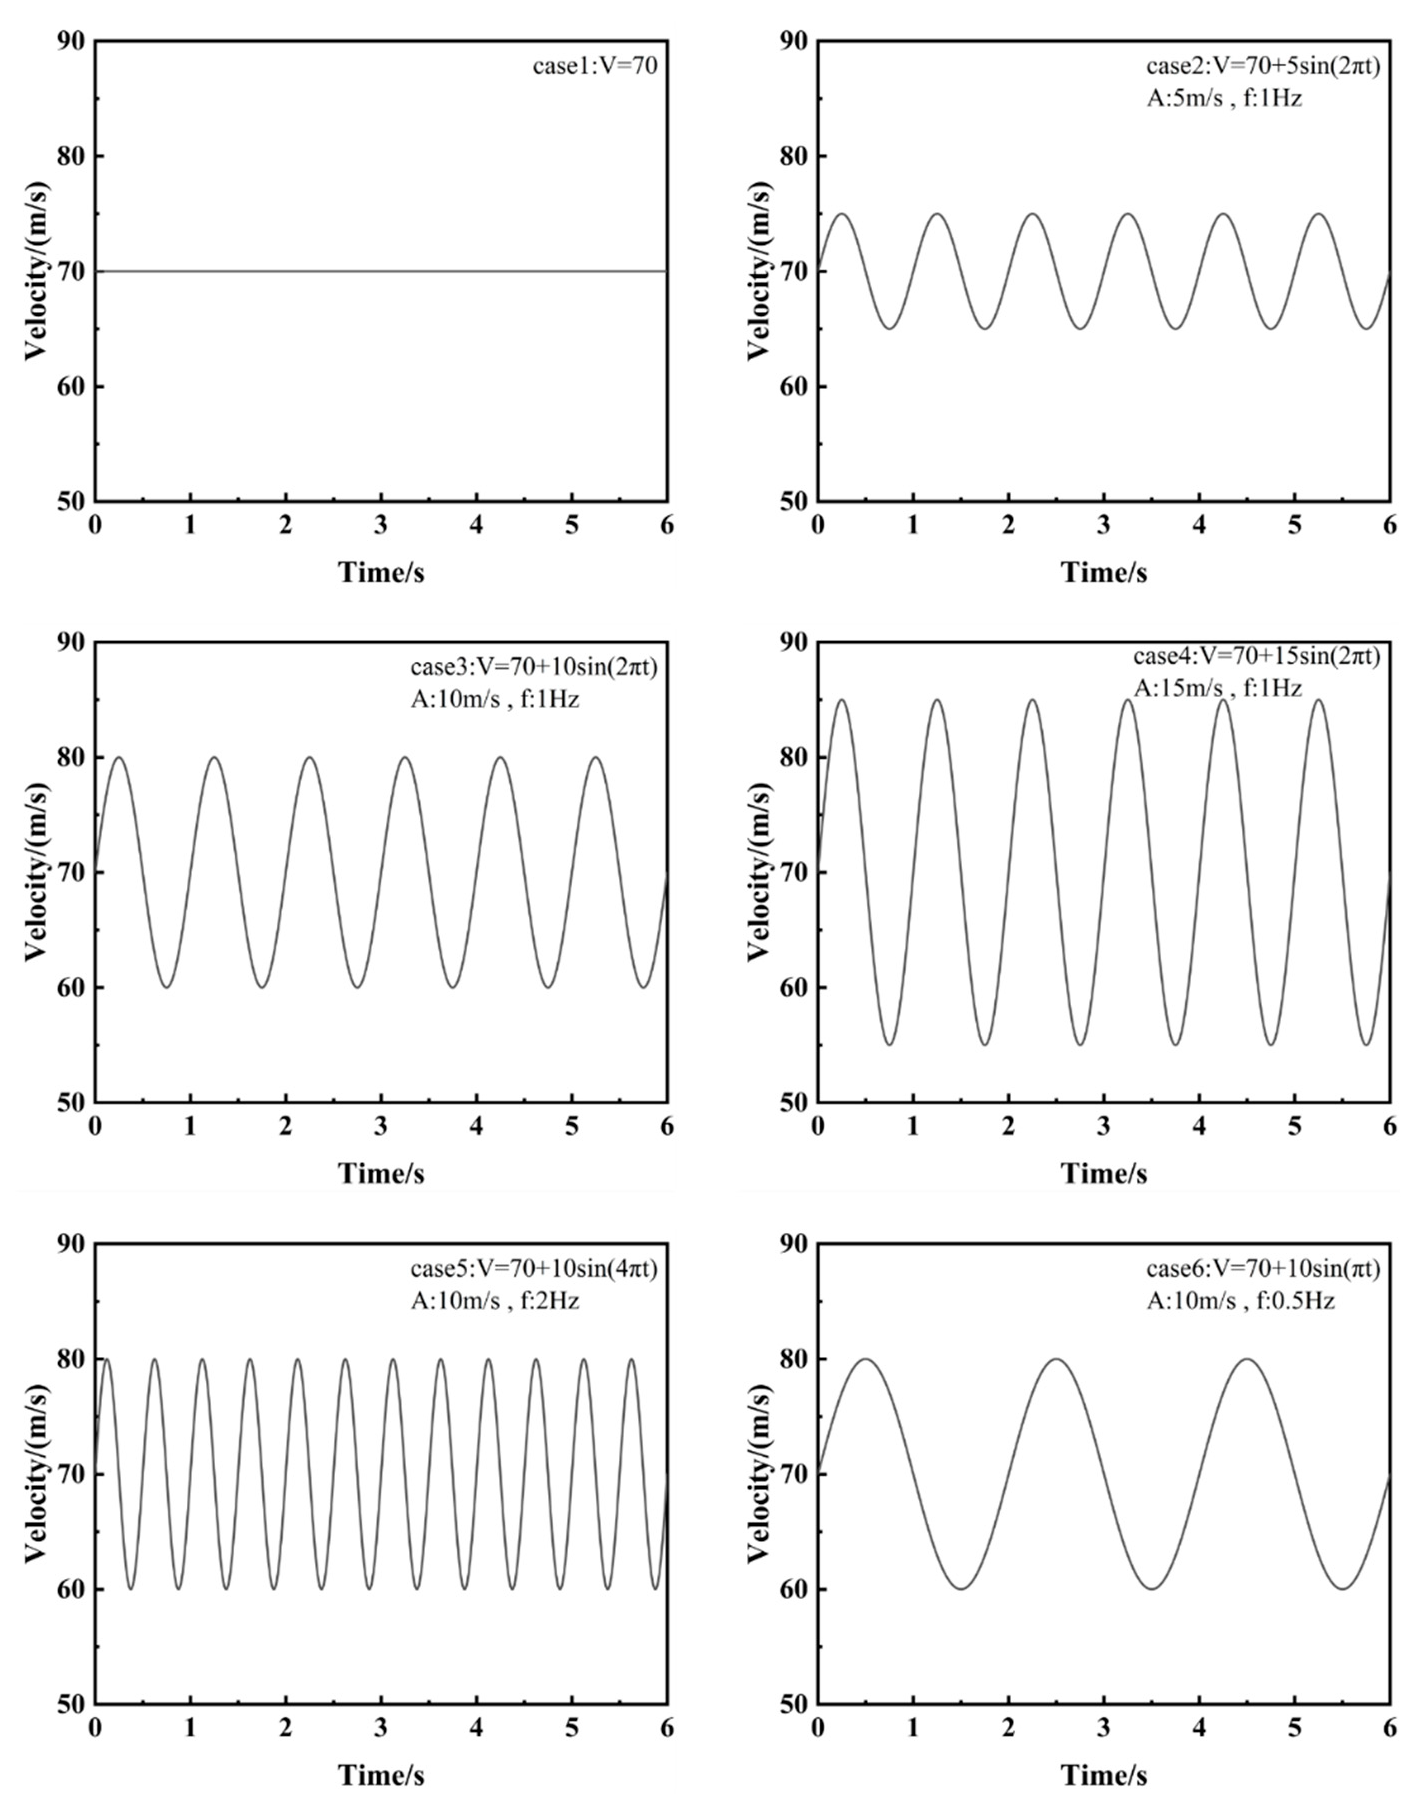
Figure 2: Schematic diagram of injection velocity variation for different cases.
All simulations in this study are performed on a workstation equipped with 2*Intel E5-2680 v3 12C. The computational cost for each simulation case are summarized in Table 2:
Table 2: Calculation Settings and Time Consumption for Simulation Cases.
| Simulation Case | Number of CPU Cores Used | Simulated Physical Time | Total Computational Time |
|---|---|---|---|
| case 1: V = 70 | 48 | 6 s | 242 h |
| case 2: V = 70 + 5sin(2πt) | 48 | 6 s | 252 h |
| case 3: V = 70 + 10sin(2πt) | 48 | 6 s | 260 h |
| case 4: V = 70 + 15sin(2πt) | 48 | 6 s | 266 h |
| case 5: V = 70 + 10sin(4πt) | 48 | 6 s | 248 h |
| case 6: V = 70 + 10sin(πt) | 48 | 6 s | 272 h |
The Volume of Fluid (VOF) model is a surface-tracking method under a fixed Eulerian grid. It determines the position of the phase interface by solving the volume fraction of each phase in every grid cell. All phases share a common velocity field, and the physical properties are weighted by the volume fractions. Within each computational cell of the flow field, the volume fraction of each fluid component is recorded. This model exhibits strong pertinence to fluid flow trajectories and the flow characteristics of stratified interfaces [22,41,42]. Furthermore, when coupled with an appropriate turbulence model, the VOF model can effectively capture the interplay between the swirl induced by the tangential shear of the side-blown jet and the gas-liquid interface. Therefore, the VOF model is adopted in this study. The basic equations followed in the solution process include the continuity equation and the momentum conservation equation.
Continuity equation:
For the q-th phase
Momentum conservation equation:
Among them,
The Realizable k-ε model is a two-equation model used to describe turbulent flow in Computational Fluid Dynamics (CFD). Based on the Standard k-ε model, it adds a new formula for turbulent viscosity, and derives a modified transport equation for dissipation rate using an accurate transport equation for vorticity fluctuations. This model can more precisely capture the vortex structures generated by swirling flow, the range of recirculation zones, as well as the transfer and dissipation of turbulent energy [20,43]. Consequently, the Realizable k-ε model is particularly well-suited for capturing the intricate vortex dynamics and turbulent mixing processes in a swirling, pulsating gas-liquid bath, making it the appropriate choice for achieving higher fidelity in our comparative analysis of mixing performance. The transport equations of
Among them,
2.5.1 Grid Independence Validation
Grid independence verification is a core step in CFD. Its purpose is to ensure that the calculation results are not excessively affected by the computational grid, thereby confirming that the numerical solution is convergent and reliable. The model adopts a combined mesh division mode combining hexahedrons and polyhedrons. Considering that the fluid velocity gradient is large and the flow is relatively complex near the lance and in the main gas-liquid reaction area, grid refinement is performed at the lance and the middle part of the furnace body, as shown in Fig. 3.
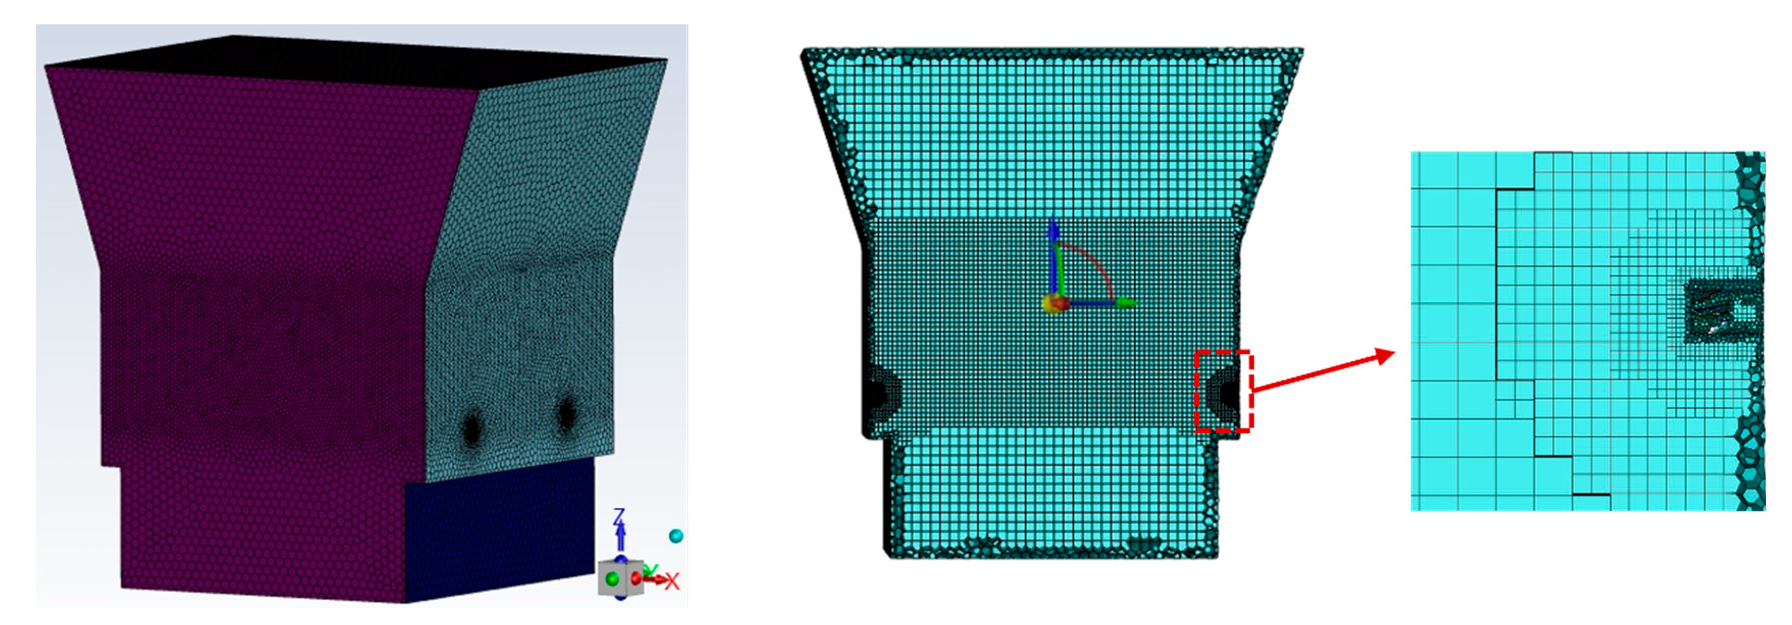
Figure 3: Schematic diagram of mesh division and refined mesh regions.
In the refined mesh region at the middle of the furnace, four sets of mesh systems with different sizes were established, corresponding to 1.5 × 10⁵, 3 × 10⁵, 4 × 10⁵ and 6 × 10⁵ cells, respectively. During the calculation process, all four grid sets employed identical mathematical models and boundary conditions, with an inlet velocity set at 70 m/s. The average flow velocity in the liquid phase region and average gas volume fraction are monitored within 4 s (as shown in Fig. 4a,b). The trends across the four grid schemes were generally consistent, though the error was relatively large for the 1.5 × 10⁵ and 3 × 10⁵ grid sizes. The variation curves for the 4 × 10⁵ and 6 × 10⁵ grid sizes were closer. Therefore, considering both accuracy and computational cost, the 4 × 10⁵ grid size scheme is ultimately selected for this study.
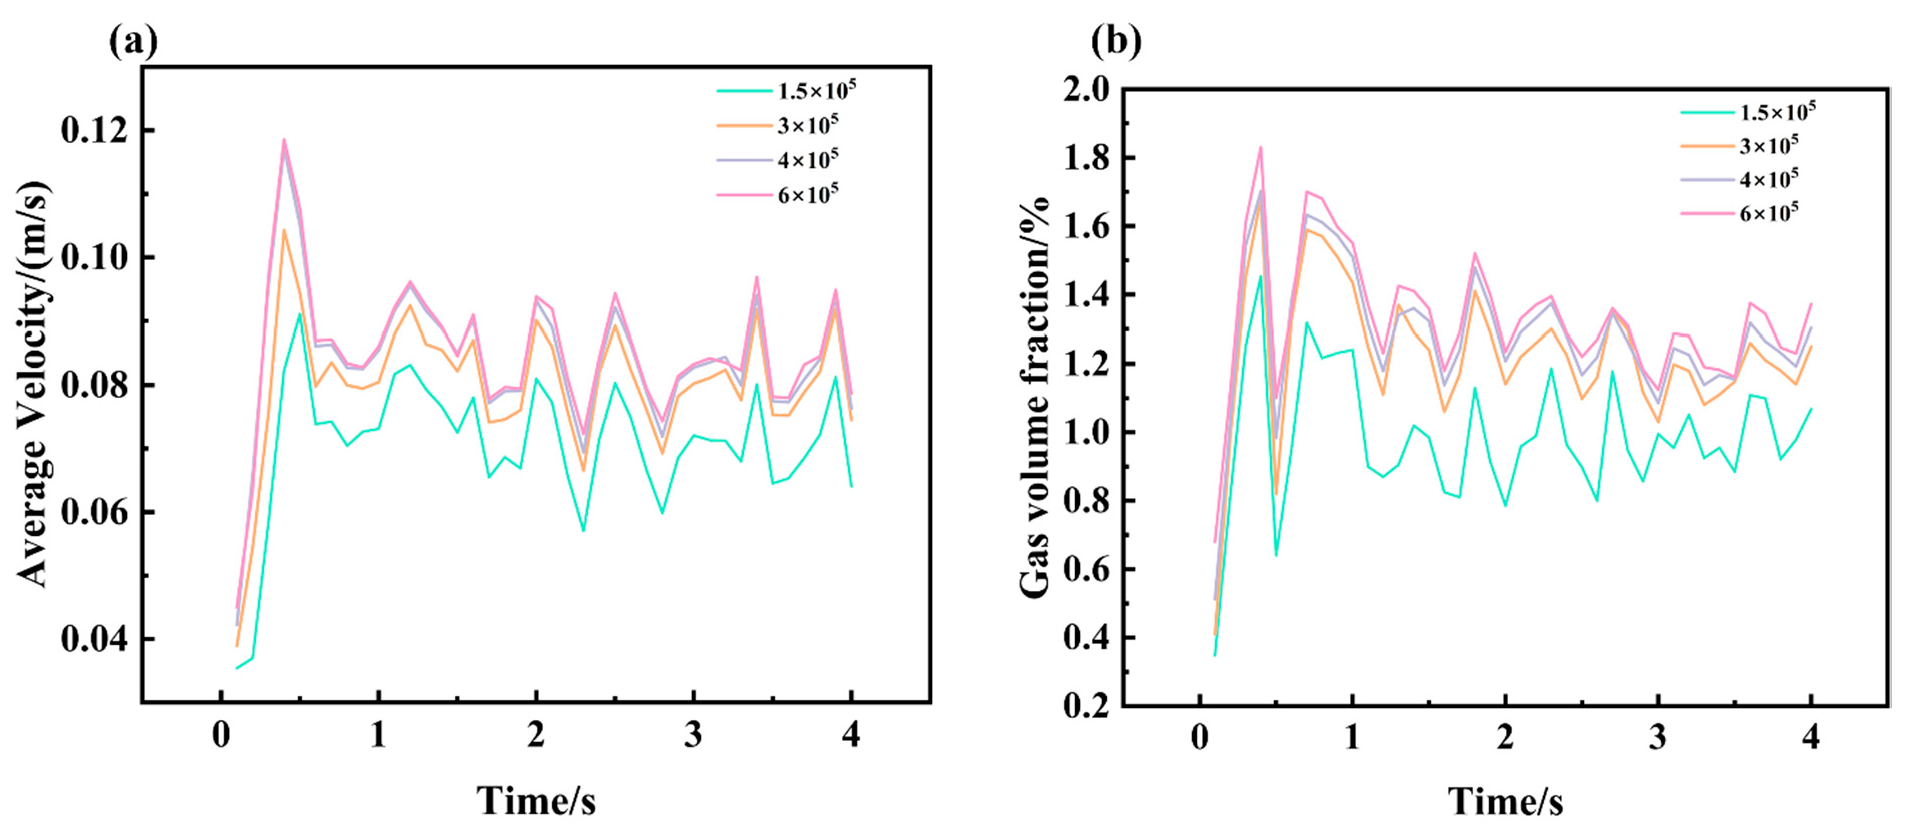
Figure 4: Grid independence validation (a) Average Velocity in the Liquid Phase Region over time for four types of grids; (b) Variation of gas volume fraction over time for four types of grids.
2.5.2 Validation of the Mathematical Model
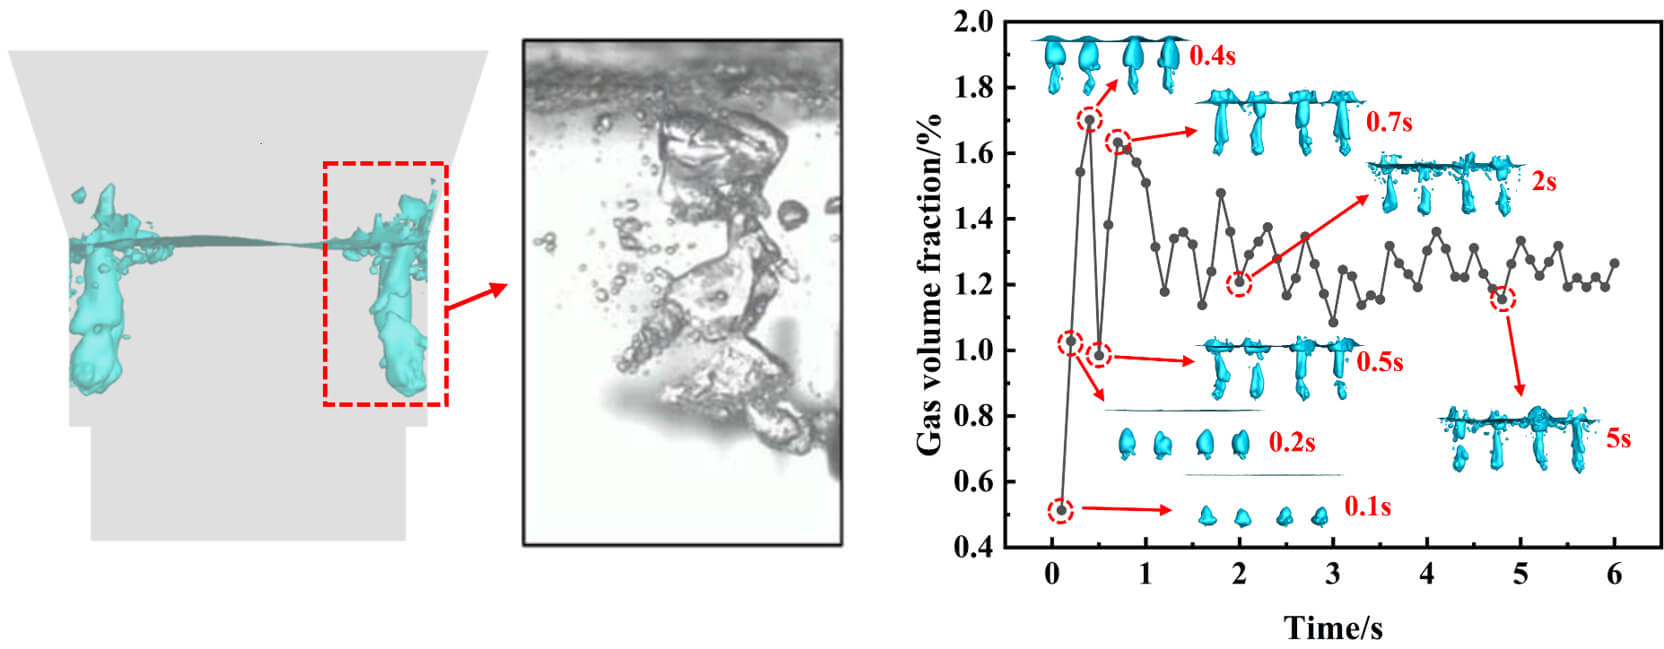
Since the original literature used a straight-tube lance, to verify the validity of the mathematical model established in this study, a straight-flow lance is designed for injection using the same scheme as employed in this study. Fig. 5 shows a morphological comparison of bubbles at several typical moments during the simulation (Fig. 5a,c,e) and experimental (Fig. 5b,d,f) process. The results indicate that the bubble morphology and movement trends during the stages of bubble generation, ascent, and rupture are almost consistent with those in the original literature [39].
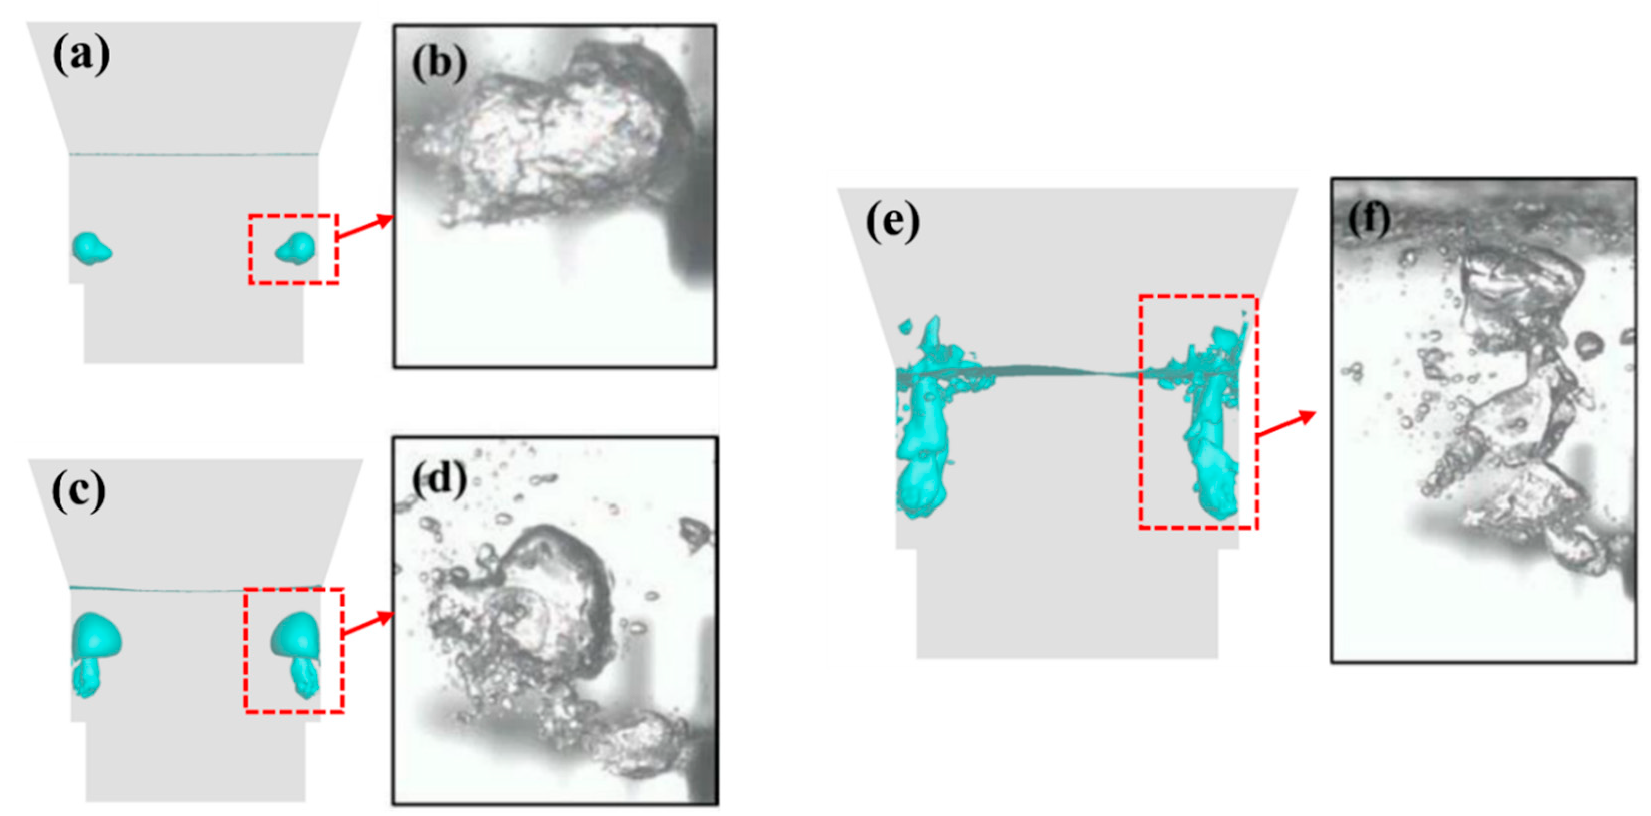
Figure 5: Comparison of simulation results (a,c,e) and experiment results [39] (b,d,f) of gas generation, rise, and rupture during side blowing gas-liquid injection.
Additionally, the dimensionless distance serves as another crucial basis for verifying the accuracy of the side-blown furnace gas injection model, with its expression shown below:
According to relevant gas-liquid two-phase side blow experiments [44], during the gas-liquid two-phase side blow process, when the axial velocity essentially disappears, the corresponding dimensionless distance for side blow is 10–20. In this simulation result, when the dimensionless distance reaches 13.2, the forward velocity along the nozzle axis essentially disappears, consistent with the experimental conclusion.
In transient CFD simulations, the initial solution of the flow field often fails to reflect the true physical state. When boundary conditions are abruptly applied, the flow field undergoes an initial transient phase, exhibiting flow structures significantly different from the eventual periodic steady state. Therefore, to ensure statistical analysis is based on genuine, stable physical processes, data from the dynamically stable flow field must be selected for analysis [37,45]. As demonstrated by the monitoring of gas volume fraction and instantaneous velocity in liquid regions (Fig. 6 and Fig. 7), the initial transient effects in all cases substantially decayed after 2 s, with the flow field entering a dynamically stable state. Additionally, we find that the statistical results within the 2–5 s and 3–6 s subintervals are largely consistent with those from the 2–6 s interval, confirming that selecting the 2–6 s interval for statistical analysis is appropriate.
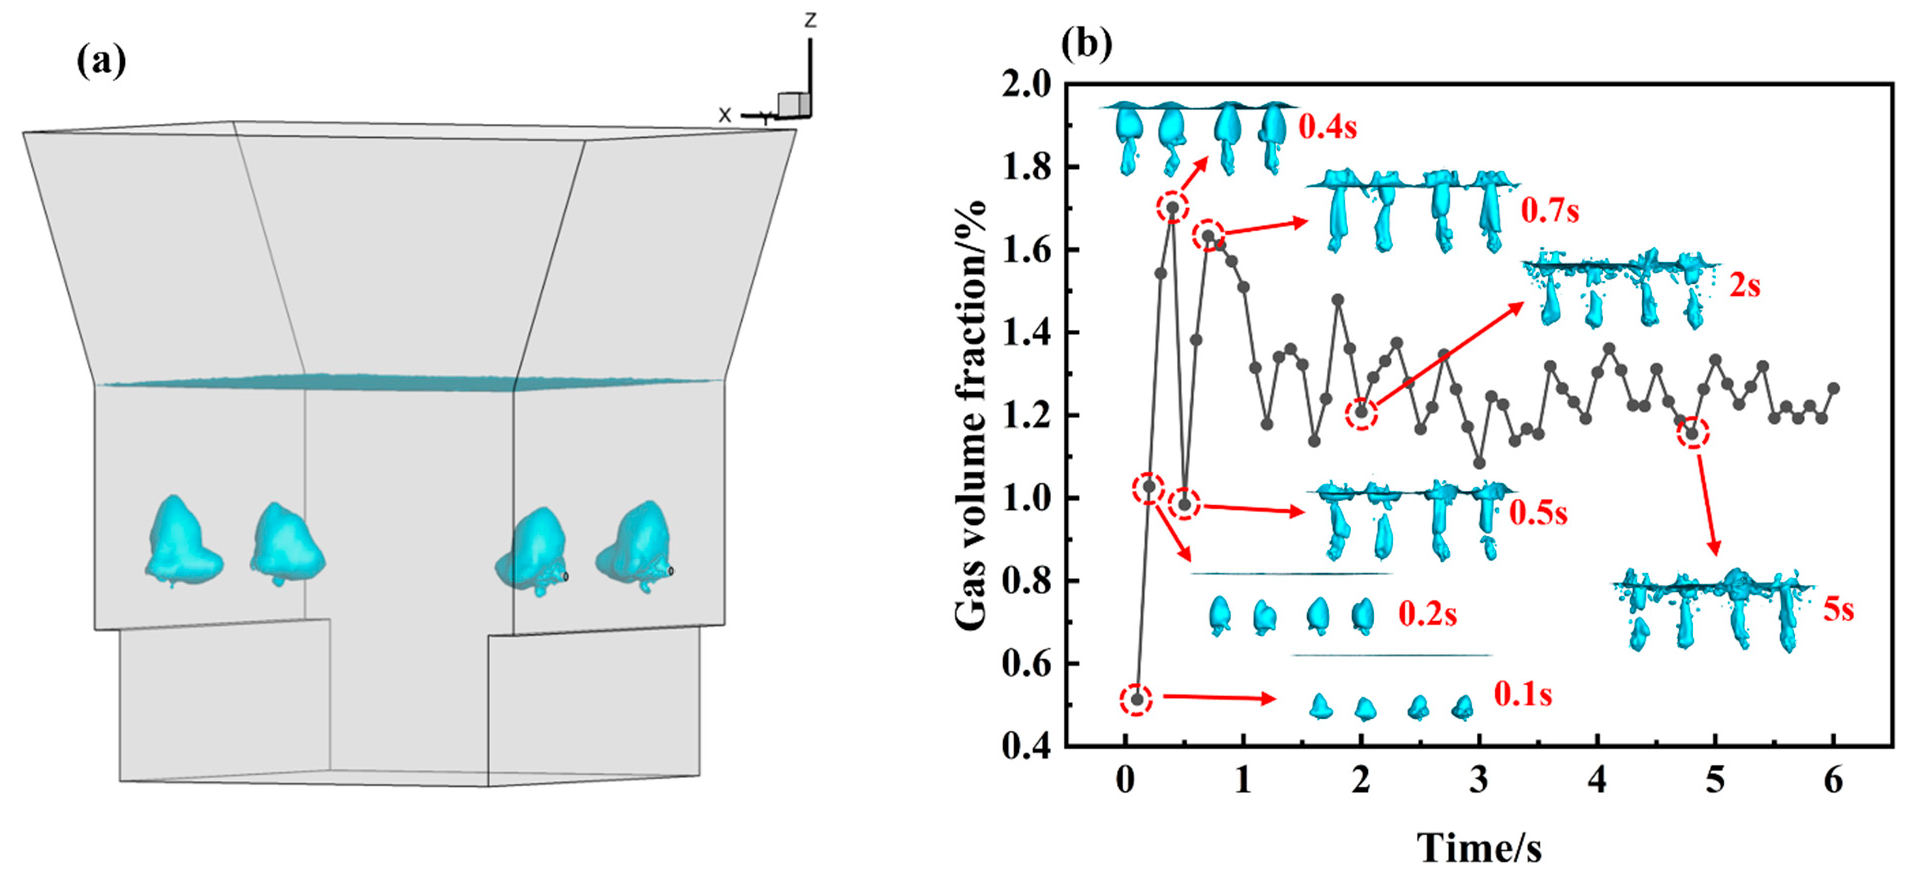
Figure 6: (a) Schematic Diagram of Gas-Phase Distribution; (b) Variation of gas volume fraction over time under constant-velocity condition.
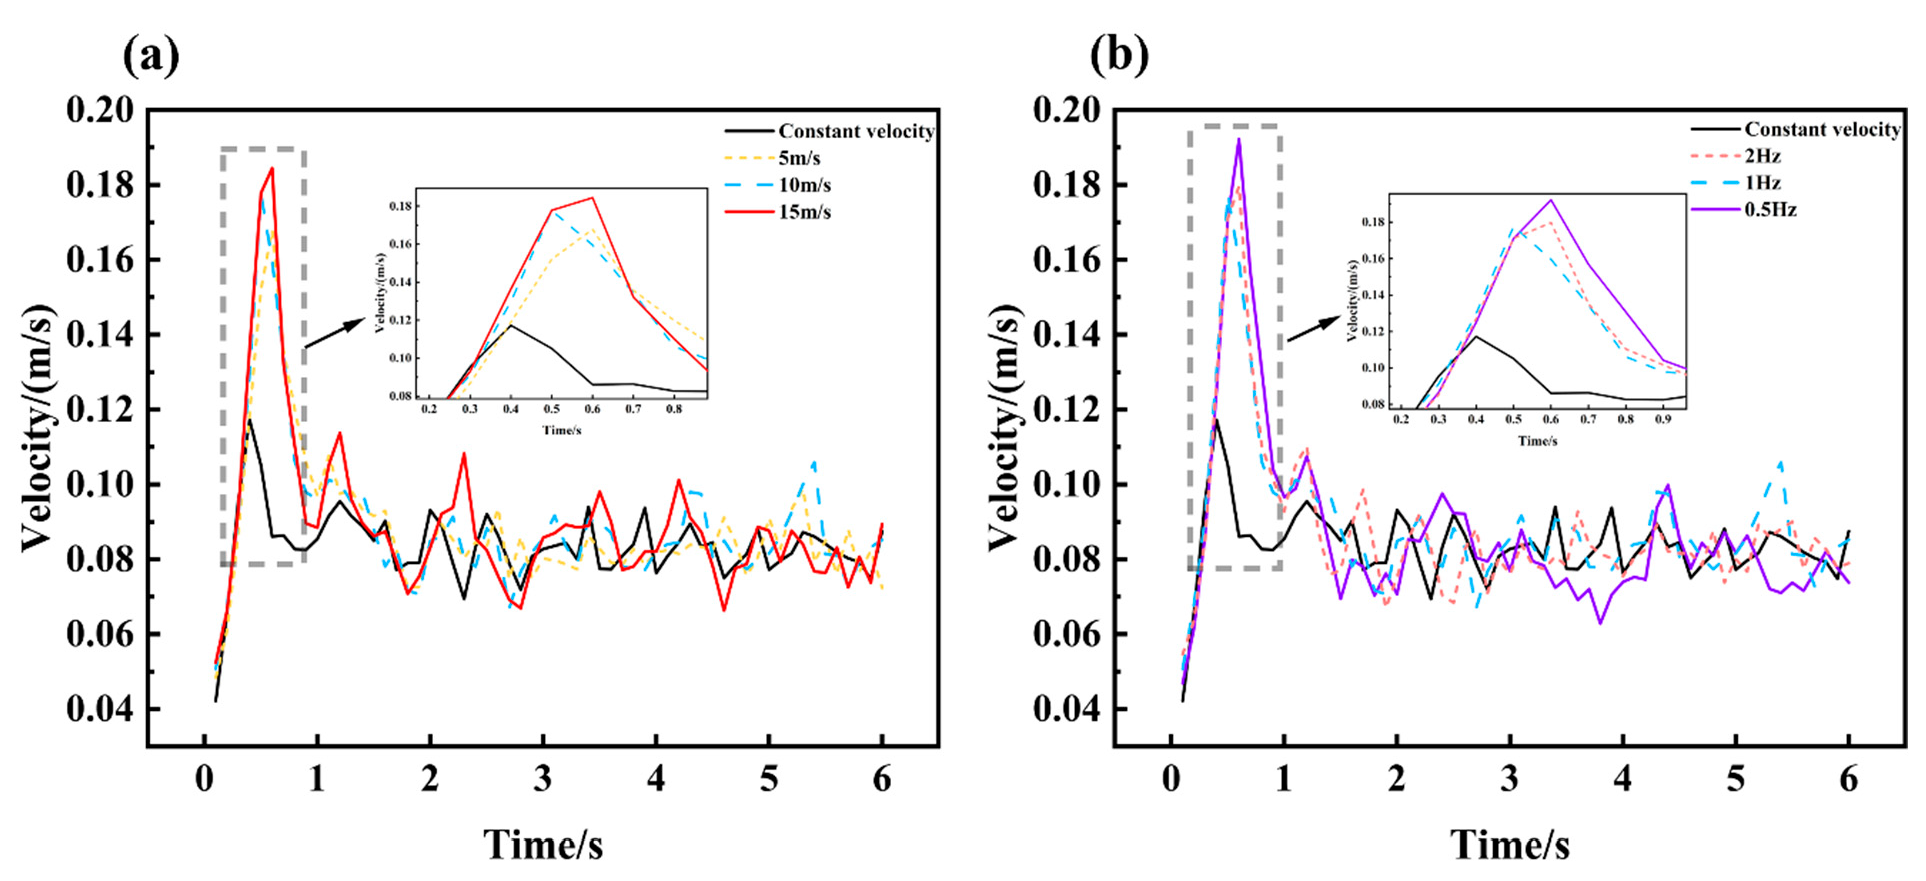
Figure 7: Average Velocity in the Liquid Phase Region over time under different methods: (a) Effect of amplitude; (b) Effect of frequency.
3.1 Gas Phase Distribution Characteristics
During the smelting process, the gas phase distribution exerts a decisive influence on reaction efficiency, mass/heat transfer, and melt flow. To quantitatively analyze the characteristics of gas phase distribution, this section investigates the gas volume fraction, gas penetration depth, and liquid splashing caused by gas agitation under different modes.
Gas volume fraction refers to the proportion of gas phase volume in the liquid phase region inside the furnace. Fig. 6a shows a schematic diagram of the gas phase distribution within the furnace. Fig. 6b presents the transient changes in gas volume fraction during the constant-rate mode and displays the gas phase distribution at multiple time points. During the side-blowing gas injection process, bubbles mainly undergo three stages: nucleation, coalescence, and rupture. At 0.1 s, the gas exists in the form of small bubble clusters without forming a continuous jet, resulting in minimal disturbance to the liquid and the lowest gas volume fraction in the molten bath. At 0.2 s, driven by buoyancy, the bubbles start to rise, then coalesce and grow into relatively continuous gas columns. At this point, the disturbance range of the liquid expands, the gas volume fraction increases significantly, and the vertical distance is obviously larger than the bubble penetration depth. At 0.4 s, the top of the bubbles contacts the liquid surface, forming a mushroom-like shape, and the gas volume fraction in the furnace reaches its maximum. After the first bubble detaches from the liquid surface, it causes splashing above the liquid surface, leading to a sharp drop in the furnace’s gas volume fraction. Subsequently, the bubble shape changes from mushroom-like to discontinuous columnar, and the gas volume fraction rises rapidly again (0.7 s). As the injection proceeds, the flow of the molten bath stabilizes, the gas phase further disperses and breaks into more small bubbles with a wider diffusion range. The gas volume fraction fluctuates within the range of 1.2%–1.4%, indicating that the gas phase distribution has entered a state of dynamic equilibrium.
The regional average values at all time points within 2–6 s are time-averaged to obtain the time-averaged gas volume fraction. The time-averaged values of gas volume fraction from different methods are compared, as shown in Fig. 8. The time-averaged gas volume fraction for the constant-velocity method is 1.24%. As the amplitude increases, the average gas volume fraction rises: the average values for amplitudes of 5 m/s, 10 m/s, and 15 m/s are 1.28%, 1.31%, and 1.34%, respectively. The scheme with an amplitude of 15 m/s achieves the highest growth rate, reaching 8%. Among the schemes with different frequencies, 1 Hz is the optimal frequency, which increases the time-averaged gas volume fraction by 5.6% compared with that of constant-velocity injection.
Figure 8: Time-averaged values of gas volume fraction under different methods.
The increase in gas volume fraction within the melt pool, to a certain extent, signifies an expansion of the contact area between gas and melt. However, in actual production, bubbles rising through the melt experience significant disturbance from the melt and, influenced by the flow field, readily coalesce into large gas clusters. Under these conditions, while the overall gas content in the melt may be high, its spatial distribution within the furnace is often uneven. Therefore, gas volume fraction alone cannot serve as the sole criterion for evaluating gas-liquid mixing effectiveness in side-blown furnaces.
Gas penetration depth is defined as the maximum horizontal distance that a gas jet can attain along the injection axis before its axial momentum is fully dissipated by the melt’s resistance. A larger penetration depth results in better agitation of the bath center, which in turn promotes the circulation of the entire bath and enhances the gas-liquid mixing effect. Fig. 9 illustrates the distribution of the gas jet within the molten bath. The variable d represents the gas penetration depth.
Fig. 10 presents the time-averaged values of penetration depth for different methods. All sinusoidal pulse schemes increase the gas penetration depth. The average penetration depth of the constant-velocity scheme is 0.1147 m. For the three schemes with amplitudes ranging from 5 m/s to 15 m/s, their average penetration depths increase by 0.97%, 2.22%, and 2.12%, respectively. Among the three schemes with different frequencies, the one with a frequency of 1 Hz achieves the largest penetration depth.
Figure 9: Gas Distribution Diagram (d represents the maximum horizontal penetration depth of the gas flow).
Figure 10: Time-averaged values of gas penetration depth under different methods.
In side-blown bath smelting, fluctuations in the liquid surface cause splashing. The splashed liquid falls back into the bath due to gravity, and this process facilitates heat and mass transfer reactions within the bath. However, excessively severe liquid splashing scours the furnace roof, which significantly impacts the service life of the refractory materials lining the furnace. The degree of splashing is characterized by the proportion of liquid in the gas-phase region at the furnace roof. Fig. 11 shows the time-averaged value of liquid splash content. Consistent with the above characteristics, the splash amount increases with the amplitude and has a non-linear relationship with the frequency, reaching its maximum at 1 Hz. The liquid splash content of all sinusoidal pulse schemes is higher than that of the constant-velocity method. This is because the gas flow of the sinusoidal pulse has a greater impact on liquid flow, leading to more intense fluid movement in the bath.
Figure 11: Time-averaged values of liquid splash content under different methods.
Fig. 12 presents the liquid splash diagram for the scheme with an amplitude of 15 m/s, the volume fraction of liquid is 0.9. It can be observed that the splash height is far lower than the furnace roof height. Combined with the variation laws of gas volume fraction and gas penetration depth, the sinusoidal pulse method demonstrates the potential to enhance stirring performance without exacerbating the risk of roof damage from liquid splashing.
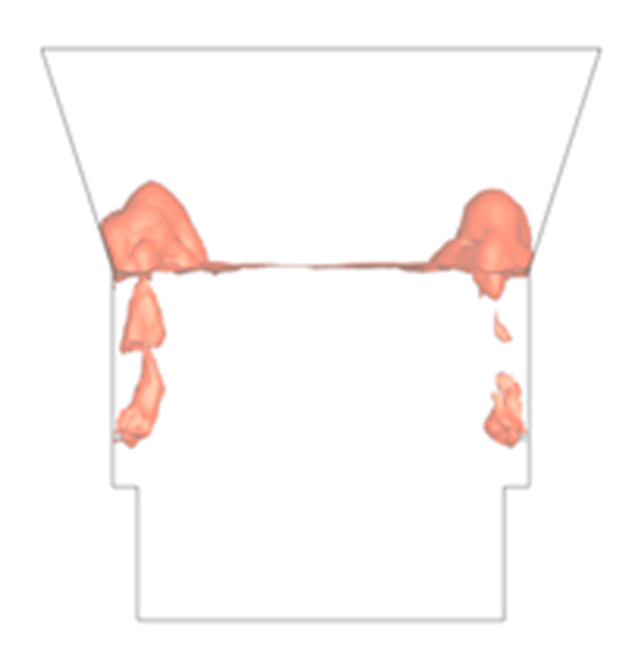
Figure 12: Liquid Splash Diagram for the case with an Amplitude of 15 m/s.
3.2 Gas-Liquid Flow and Mixing Characteristics
Gas-liquid flow and mixing characteristics are core factors determining the reaction efficiency and energy consumption of side-blown smelting furnaces. Flow field velocity and turbulent kinetic energy serve as key quantitative indicators, whose distribution characteristics directly reflect the intrinsic mechanisms of momentum transfer and energy dissipation within the molten bath. This section investigates the velocity and turbulent kinetic energy of the flow field, aiming to accurately identify stirring dead zones and develop effective schemes for improving mixing efficiency. Similarly, to ensure the accuracy of the statistical results, the statistical data for the time-averaged plots in this section are all selected from the stage after the flow field reaches dynamic stability, with a specific time range of 2–6 s.
The instantaneous average velocity refers to the velocity of the liquid phase region at different moments. Fig. 7 illustrates the transient variation of the instantaneous average velocity in the liquid phase region of the side-blown furnace under different blowing velocity cases. The sampling interval is 0.1 s. The velocity of each case first increases to its peak, then gradually decreases, and finally fluctuates within a certain range. This phenomenon occurs because the initial flow field is in a static state. When the side-blown gas is injected from the nozzle at a relatively high velocity, a high-pressure region with concentrated energy forms near the nozzle, allowing the jet to maintain its initial blowing velocity and extend forward for a certain distance. As the gas flow progresses, the liquid in the molten bath is gradually agitated, increasing the resistance acting on the gas flow and thus reducing its velocity. Over time, the flow field structure stabilizes gradually, and the jet’s kinetic energy reaches a relative balance with the internal resistance of the molten bath, bringing the flow field into a dynamically stable stage. In the initial stage, the peak values of the instantaneous average velocity in the liquid phase region for all sinusoidal pulse schemes are higher than those of the constant-velocity injection. This is because the inlet velocity of the sinusoidal pulse is in the growth phase. The velocity curve of the constant-velocity injection exhibits a relatively small fluctuation amplitude after reaching the peak, with an overall tendency toward stability. In contrast, the sinusoidal pulse schemes not only have higher peak values but also show larger amplitudes in the subsequent fluctuation stage, with more significant upward and downward variations in velocity. Such intense fluctuations originate from the intermittent momentum impact of the pulsed power input, which induces stronger turbulent disturbances in the liquid-phase flow field, thereby manifesting as more severe velocity fluctuations. However, it is observed from Fig. 7b that the low-velocity frequency of the scheme with a 0.5 Hz is significantly prolonged. Therefore, the instantaneous velocities within the 2–6 s interval are averaged to further quantify the disturbance effects of different methods on the liquid.
As shown in Fig. 13, the average velocity of the constant-velocity injection method is 0.0825 m/s. For the sinusoidal pulse schemes with amplitudes of 5 m/s, 10 m/s, and 15 m/s, their average velocities are 0.0828 m/s, 0.0843 m/s, and 0.0845 m/s, respectively, with a maximum increase of 2.4%. A larger amplitude indicates more intense velocity variation of the fluid within one period, along with stronger disturbance energy in the flow field. This enhances the fluid’s shear effect and turbulent vortices, which in turn increases the time-averaged velocity and strengthens gas-liquid mixing. However, at frequencies of 2 Hz and 0.5 Hz, the average velocity remains relatively low. This phenomenon reveals a resonant relationship between the frequency of velocity changes and the flow field. Excessively high pulse frequencies result in insufficient response time for the flow field. Conversely, excessively low pulse frequencies fail to sustain sustained strong perturbations.
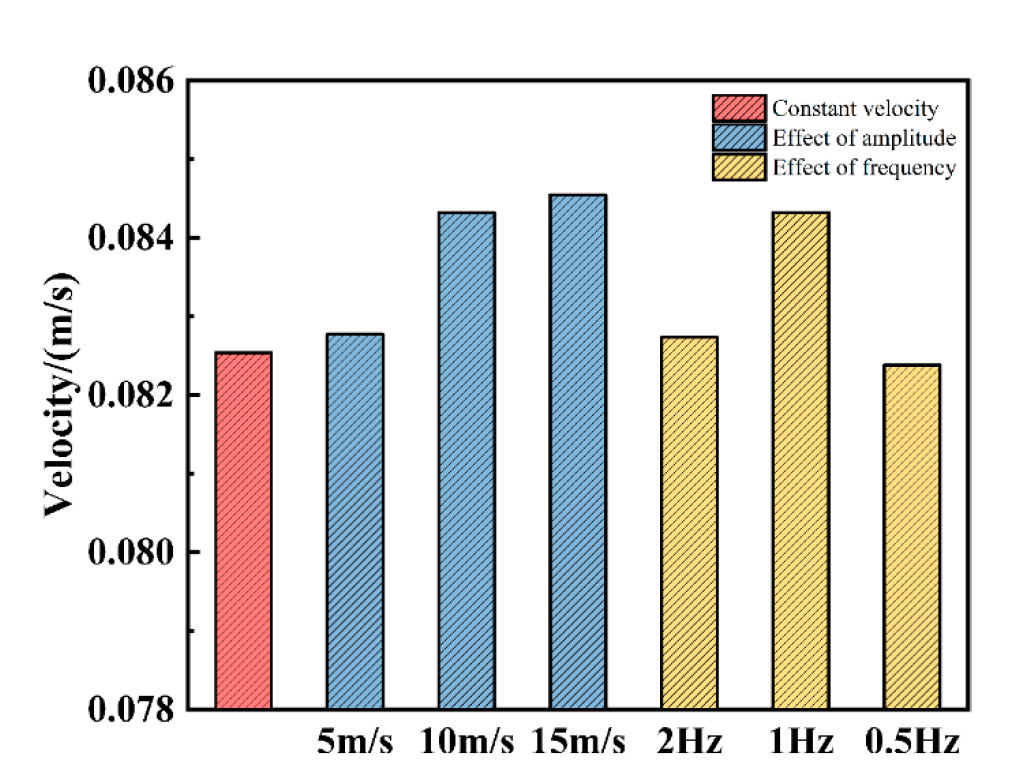
Figure 13: Time-averaged velocity in the liquid phase region under different methods.
3.2.2 Turbulent Kinetic Energy
In the bath of a side-blown furnace, the kinetic energy input mainly relies on gas jets agitating the bath. Turbulent energy propagates from the main region stirred by jet bubbles to more distant areas along with flow field movement and bubble flow diffusion, thereby agitating the melt.
To understand the distribution of turbulent energy in the core reaction zone of the side-blown furnace, five planes with an interval of 0.125 m were selected for analysis, ranging from the liquid surface (Z1) to the lance cross-section (Z5), as shown in Fig. 14. Fig. 15 presents the turbulent kinetic energy distribution of constant-velocity injection and sinusoidal pulse injection (Case 5) across different sections. High turbulent kinetic energy zones are mainly concentrated near the lance and on both sides of the bath. This is the region where gas jet impact and liquid agitation are most intense, with the most significant energy dissipation and momentum transfer. From the Z5 plane to the Z1 plane, the agitation range gradually expands toward the center of the bath. However, the high turbulent kinetic energy zones on both sides of the nozzle in the constant-velocity method are dispersed and locally concentrated, and there are large mixing dead zones in the center of the bath across sections at different heights, which is unfavorable for uniform mixing of the entire bath. Through periodic velocity fluctuations, sinusoidal pulse injection enhances the unsteady disturbance of the flow field. Turbulent energy can be effectively transmitted to the center of the bath, bringing about a more consistent spread of turbulent kinetic energy.
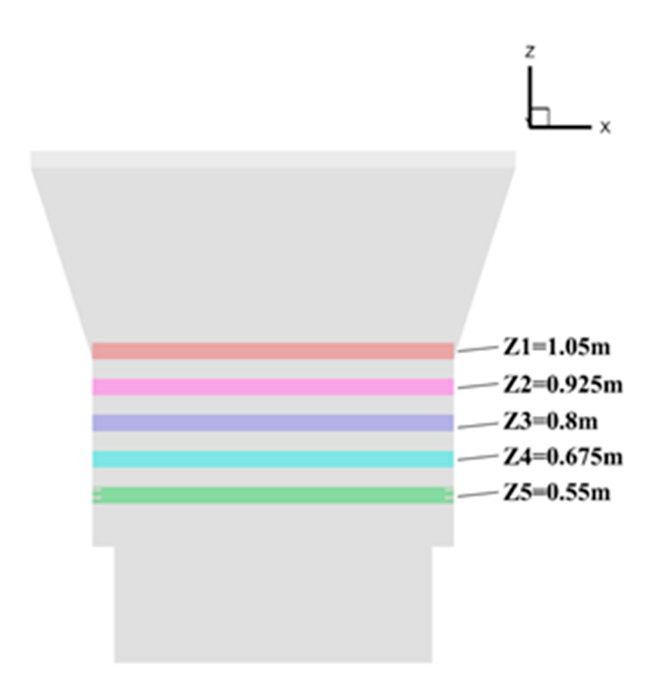
Figure 14: Schematic diagram of characteristic planes at different positions along the z-axis.
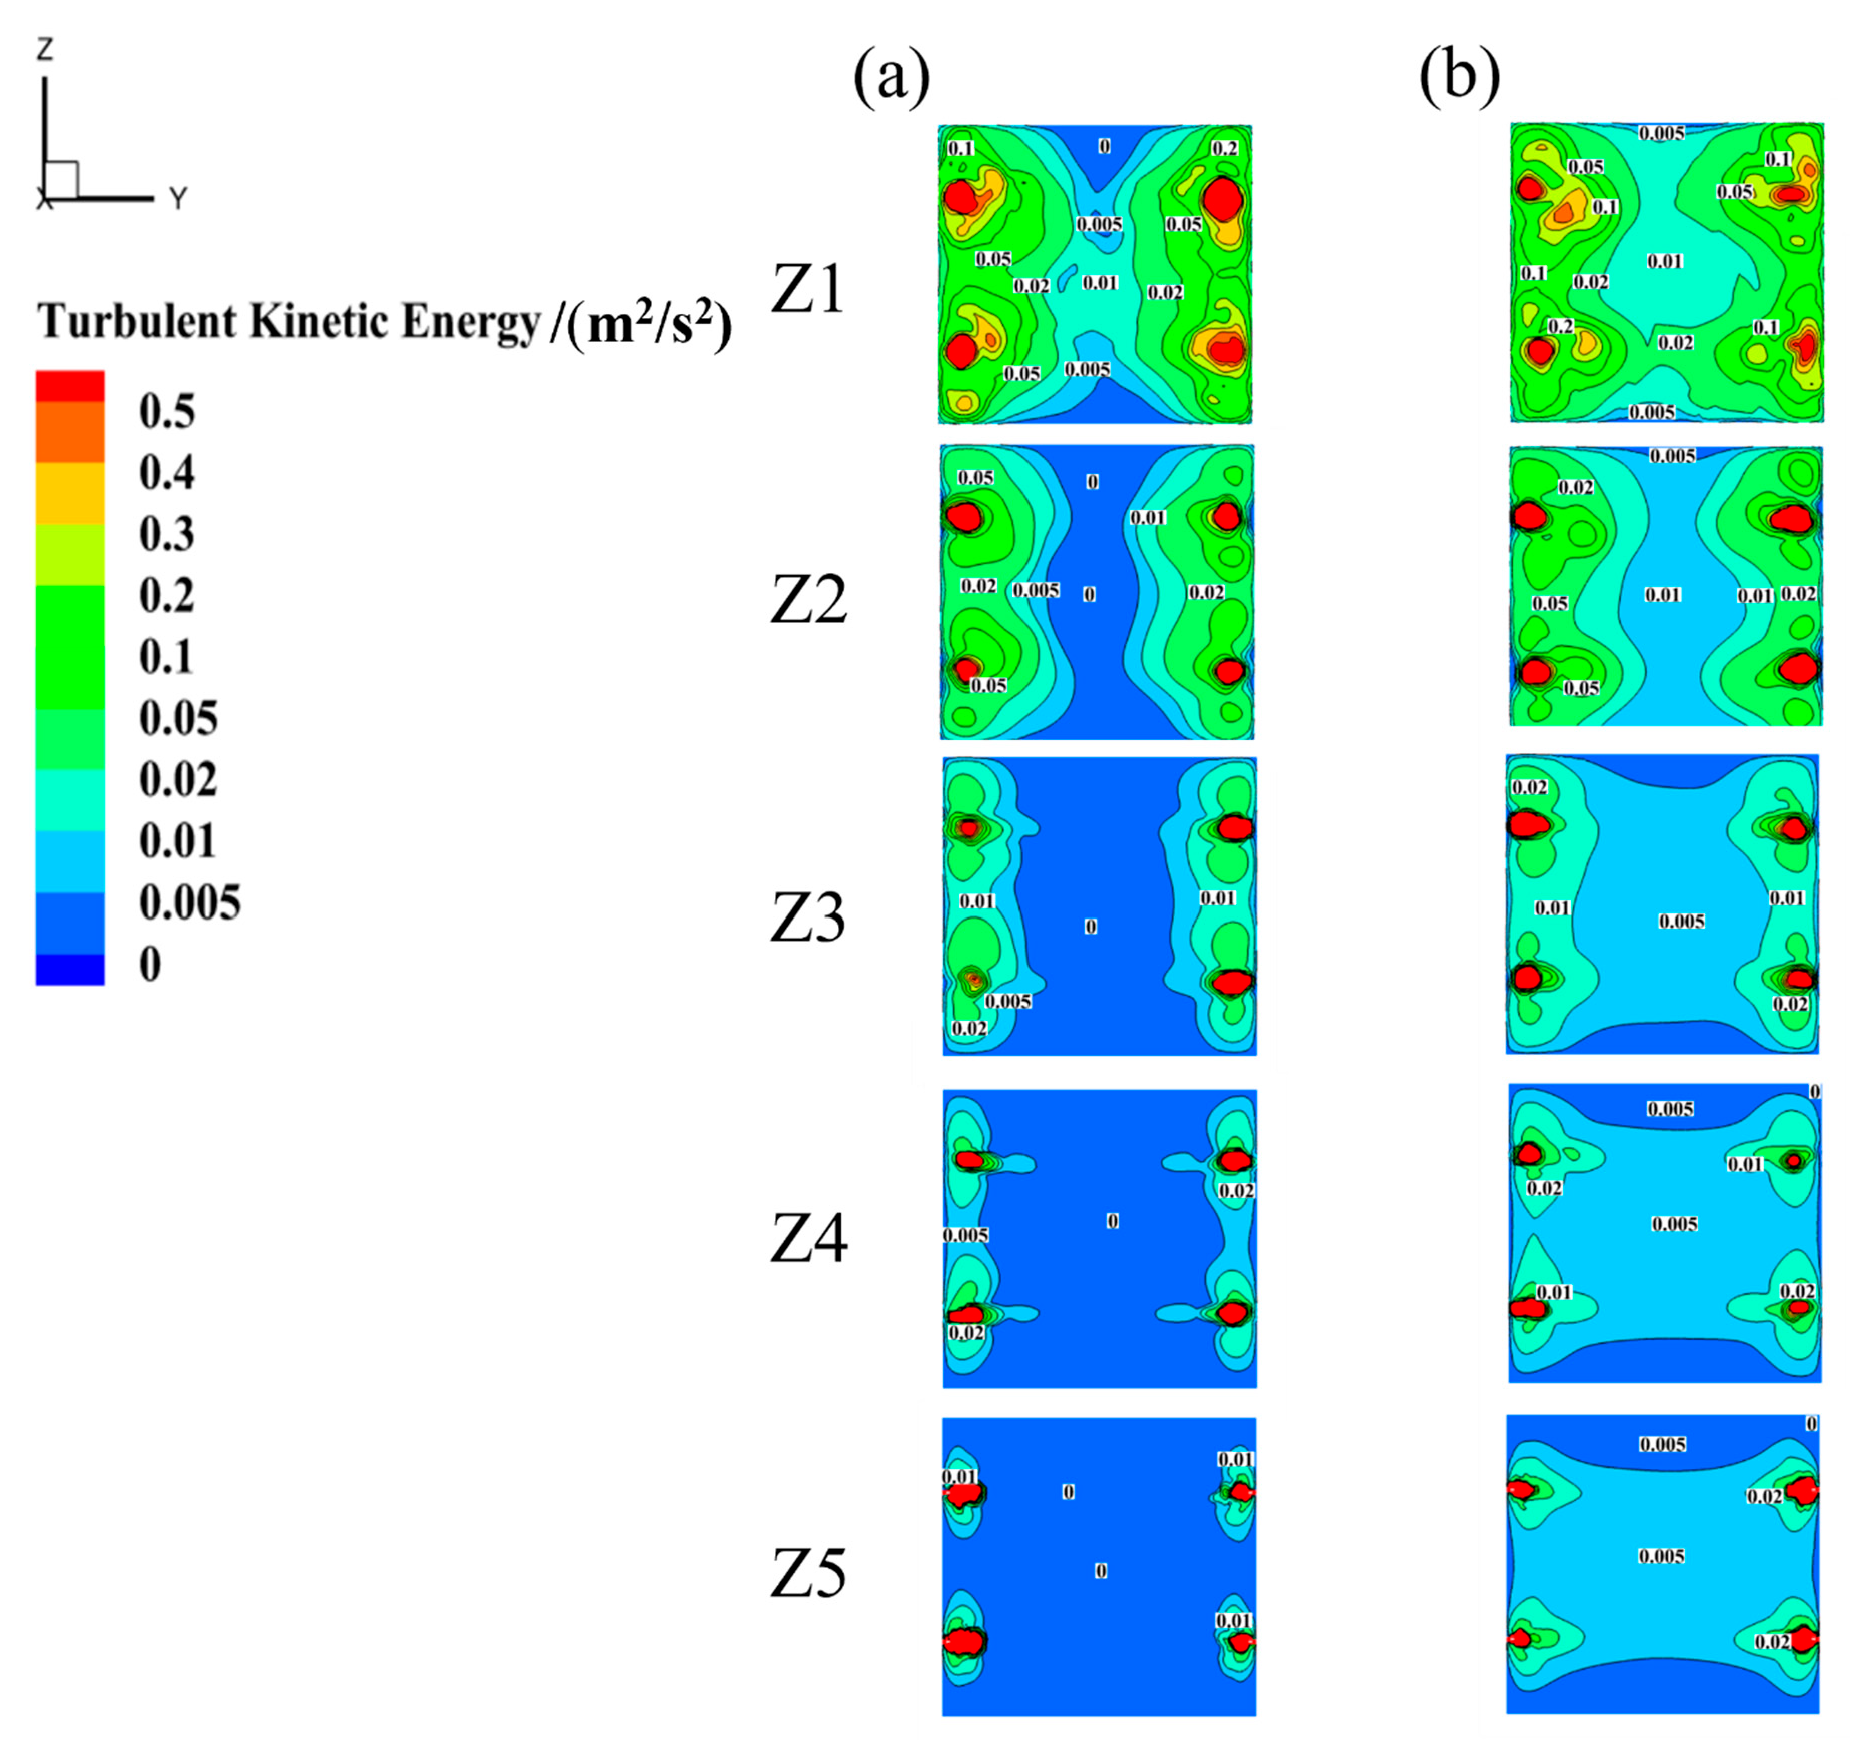
Figure 15: Distribution of turbulent kinetic energy on different characteristic planes: (a) Constant-velocity; (b) Sinusoidal pulse velocity.
Based on the TKE contour distribution in Fig. 15, regions with turbulent kinetic energy below 0.005 m2/s2 are classified as mixing dead zones, while those above 0.05 m2/s2 are defined as mixing active zones. This is because the central regions of all five cross-sections in constant-velocity injection (Fig. 15a) exhibit near-zero TKE, while sinusoidal pulsation (Fig. 15b) elevates these central TKE to 0.005 m2/s2, making this value a physical boundary between negligible and initiated mixing. The 0.05 m2/s2 threshold identifies core high-agitation zones around the jet impact region, where TKE is an order of magnitude higher. To quantify the difference in mixing performance between the two injection methods, the distribution areas of the dead zones and active zones were calculated, as shown in Fig. 16. Compared with the constant-velocity method, the sinusoidal pulse method significantly reduces the formation of mixing dead zones and expands the effective range of mixing active zones through periodic flow field disturbance, resulting in better overall mixing performance. Specifically, from the Z1 to Z5 planes, the reduction rate of mixing dead zone area for the sinusoidal pulse method ranges from 72% to 92.9%, and the increase rate of mixing active zone area ranges from 2.3% to 18%. When 0.01 m2/s2 and 0.1 m2/s2 are tested as distinguishing thresholds, the results remain unchanged.
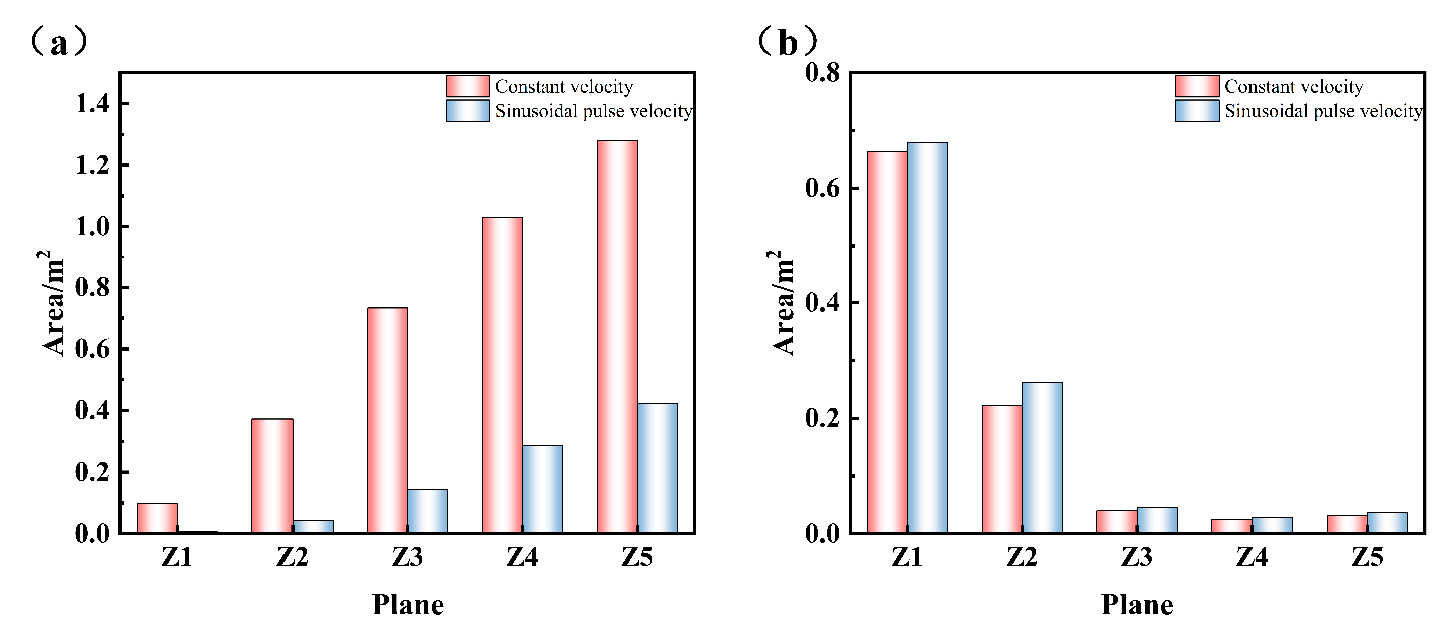
Figure 16: Area distribution of (a) Mixing dead zones and (b) Mixing active zones for constant-velocity and sinusoidal pulse velocity.
The Z3 plane is selected to analyze the turbulent kinetic energy distribution regions of the sinusoidal pulse method under different parameters. As shown in Table 3, the scheme with an amplitude of 15 m/s has a smaller mixing dead zone and a larger mixing active zone. Compared with the constant-velocity method, the dead zone is reduced by 81% and the active zone is increased by 25%. As presented in Table 4, the sinusoidal pulse scheme with a frequency of 1 Hz has a smaller mixing dead zone (80% reduction compared with the constant-velocity method) and a 20% increase in the mixing active zone. Additionally, the area of its mixing active zone differs by only 0.002 m2 from that of the scheme with a frequency of 2 Hz. Therefore, it can be concluded that the sinusoidal pulse parameter combination of 15 m/s amplitude and 1 Hz frequency achieves the most uniform and sufficient stirring of the bath, making it the optimal pulse parameter combination for improving the mixing performance of the side-blown furnace in this study.
Table 3: Mixing zone areas of pulse mode with different amplitudes and constant-velocity mode.
| Amplitude (m/s) | Area of Mixing Dead Zone (m2) | Area of Mixing Active Zone (m2) |
|---|---|---|
| Constant-Velocity | 0.730 | 0.039 |
| 5 | 0.166 | 0.046 |
| 10 | 0.143 | 0.047 |
| 15 | 0.139 | 0.045 |
Table 4: Mixing zone areas of pulse mode with different frequencies and constant-velocity mode.
| Frequencies (Hz) | Area of Mixing Dead Zone (m2) | Area of Mixing Active Zone (m2) |
|---|---|---|
| Constant-Velocity | 0.730 | 0.039 |
| 2 | 0.163 | 0.049 |
| 1 | 0.143 | 0.047 |
| 0.5 | 0.178 | 0.041 |
3.3 Analysis of the Mechanism of Sine Pulse-Enhanced Mixing
The research findings presented in Section 3.1 and Section 3.2 above indicate that sinusoidal pulsed injection optimizes the gas phase distribution in the molten pool and enhances gas-liquid flow mixing. Starting from two core physical processes—bubble breakup behavior and gas-liquid contact interface evolution—this section selects the sinusoidal pulsed scheme with an amplitude of 15 m/s and the constant-velocity scheme for analysis, aiming to reveal the underlying enhancement mechanism.
Fig. 17 shows the bubble distribution diagrams of the two methods within the 5th period. Under constant-velocity injection, the jet energy remains constant. After bubbles form, they are mainly subjected to buoyancy and viscous resistance. During the ascent process, bubbles have sufficient time to coalesce and grow, maintaining a relatively stable morphology. The gas encapsulated inside is not easy to escape. Therefore, large-scale and concentrated breakup of bubbles only occurs when they rise to the vicinity of the liquid surface. In contrast, under sinusoidal pulsed injection, the bubble breakup area exists not only near the liquid surface but also has some small bubbles distributed below the liquid surface. This change produces a decisive enhancement effect. The breakup of bubbles in the molten pool is an instantaneous and intense energy release process, during which the surface energy of bubbles is converted into the kinetic energy of the surrounding liquid. In the flow field, this process is directly manifested as an increase in turbulent kinetic energy. This also confirms the results in Fig. 14: under sinusoidal pulsed injection, the turbulent kinetic energy in the middle of the molten pool is higher and more widely distributed.
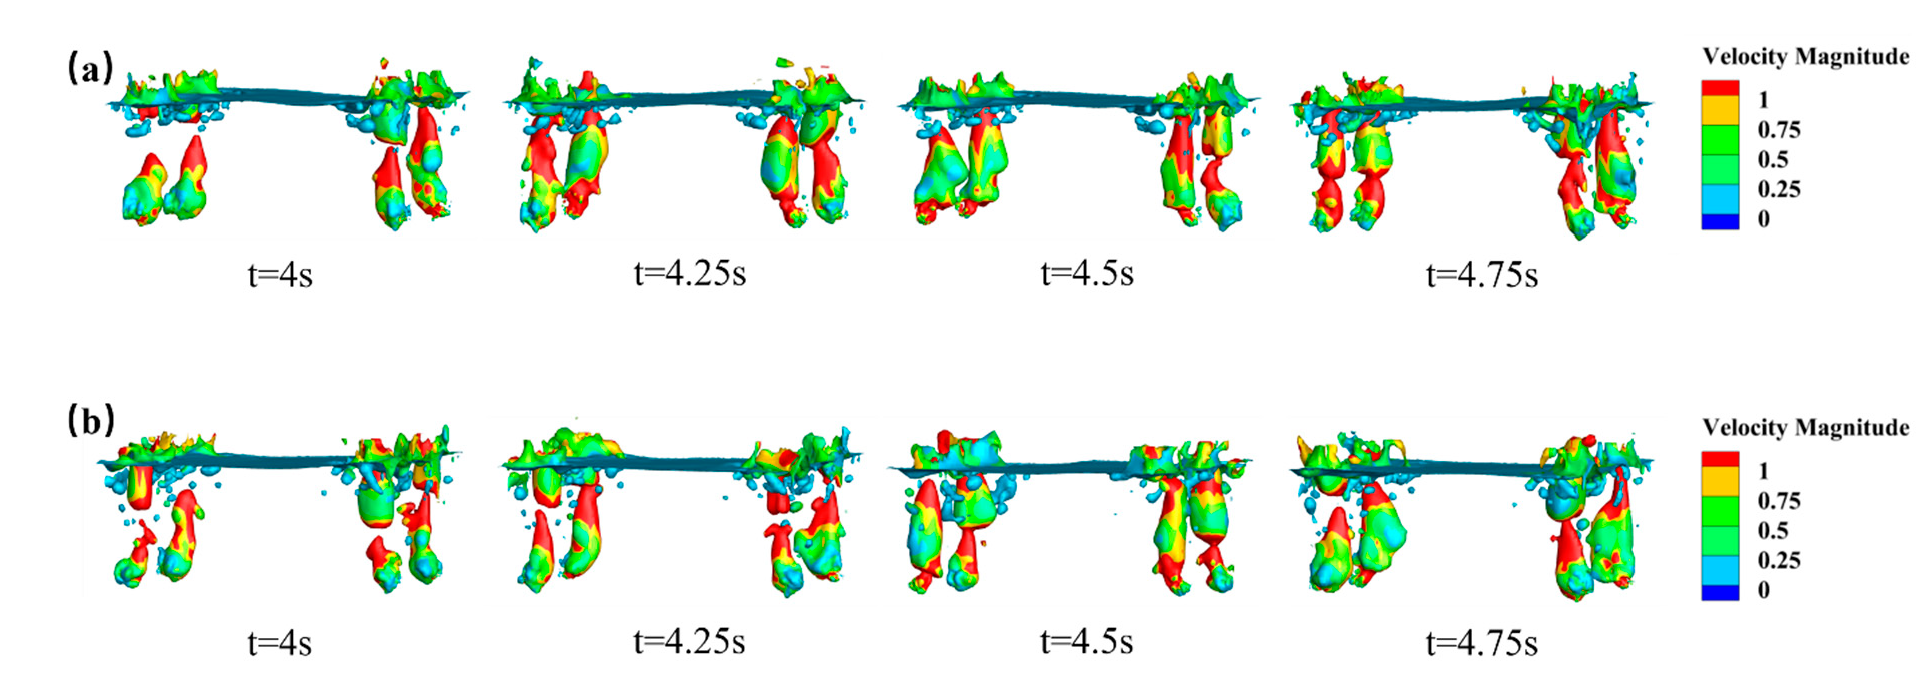
Figure 17: Bubble distribution of different methods: (a) Constant-velocity; (b) Sinusoidal pulse velocity, A = 15 m/s, f = 1 Hz.
Based on the volume fraction gradient method, the gas-liquid contact area is calculated by integrating the interface area across all computational cells that contain gas-liquid interfaces [46]. Fig. 18 shows the variation of gas-liquid contact area during the 5th period for the two methods. Notably, when the sampling time is extended to 2–6 s the recalculated time-averaged gas-liquid contact areas are 2.36 m2 (constant velocity) and 2.43 m2 (sinusoidal pulse), confirming the statistical stability of the results. Due to the continuous rupture and regeneration of bubbles under the action of sinusoidal pulsation, the gas-liquid contact area is always maintained at a relatively high level. Particularly in the time period of 4.4–4.6 s the peak value of the contact area exceeds 2.5 m2, which is significantly higher than the peak value of the constant-velocity injection during the same period. The average value increases from 2.33 m2 to 2.41 m2, with a growth rate of 3.4%. This indicates that the sinusoidal pulsating injection provides a more sufficient interaction interface for the gas-liquid two phases, thereby improving the mixing efficiency. In summary, sinusoidal pulsed injection realizes the strengthening from micro- to macro-scale by changing the bubble breakage behavior. The downward movement of the bubble breakage position promotes the distribution of the gas phase in the middle of the molten pool, enhancing the turbulent disturbance in the deep part of the molten pool. The continuous breakage process significantly increases the gas-liquid contact area, strengthening the mixing effect between the gas-liquid two phases. The combined action of these two aspects ultimately achieves the synergistic strengthening effect of optimizing the gas-phase distribution in the molten pool and improving the uniformity of gas-liquid mixing.
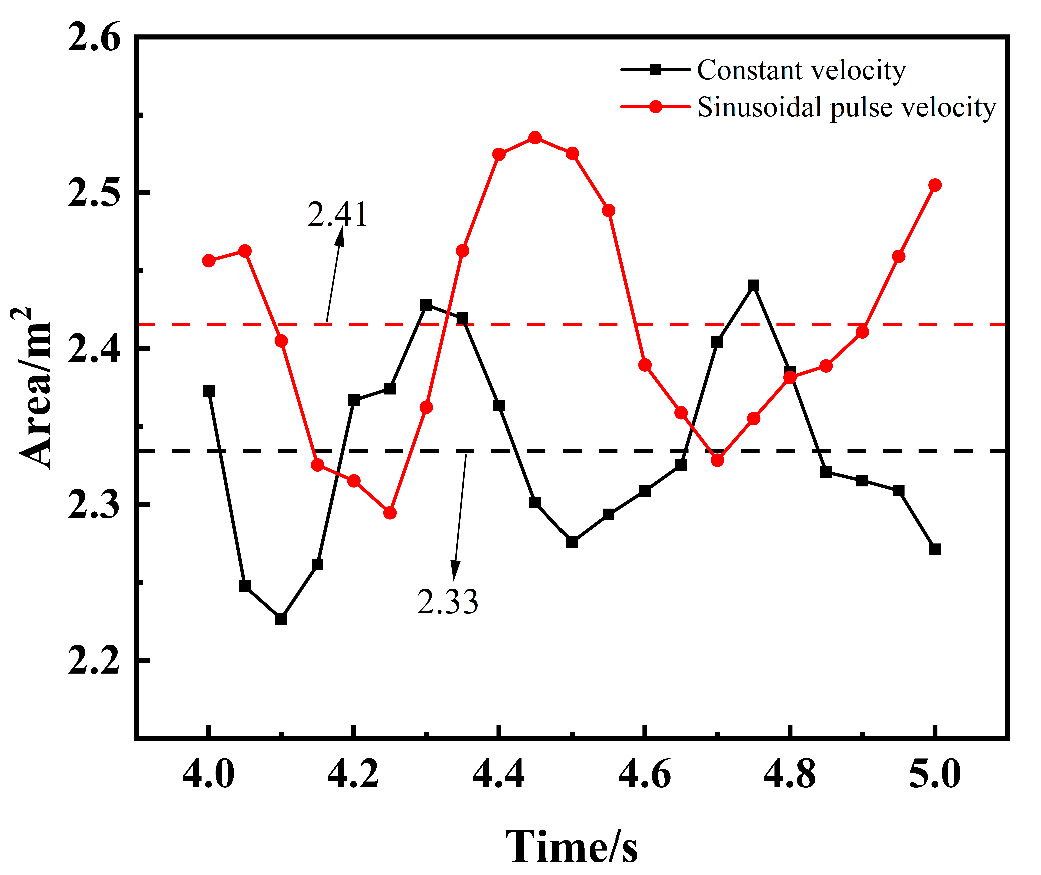
Figure 18: Gas-liquid contact area of different methods.
This study numerically investigated the mixing enhancement effect of sinusoidal pulsating injection in a swirling side-blown bath smelting process. By systematically comparing constant-velocity injection with sinusoidal pulsed injection schemes under various amplitudes (5 m/s, 10 m/s, 15 m/s) and frequencies (0.5 Hz, 1 Hz, 2 Hz), the following key conclusions are drawn:
- (1)Sinusoidal pulsation significantly improves gas dispersion and distribution in the molten bath. Under the optimal pulsation parameters of 15 m/s amplitude and 1 Hz frequency, the time-averaged gas volume fraction increases by 8%, while the gas penetration depth rises by 2.12%. Importantly, the liquid splashing remains within a safe range, indicating enhanced stirring without exacerbating roof erosion risks.
- (2)Pulsed injection promotes turbulence and reduces mixing dead zones. The unsteady disturbance induced by sinusoidal pulsation intensifies turbulent agitation and enhances momentum transfer throughout the bath. With the optimal parameters, the time-averaged liquid velocity increases by 2.4%, the mixing dead zone area decreases by 81%, and the mixing active zone expands by 25%, leading to more uniform mixing.
- (3)Amplitude and frequency exhibit distinct influences on mixing performance. While mixing enhancement is positively correlated with pulsation amplitude, frequency shows a nonlinear relationship with an optimal value. Among the tested schemes, the combination of 15 m/s amplitude and 1 Hz frequency yields the most effective flow field mixing.
- (4)The enhancement mechanism is attributed to altered bubble dynamics. Sinusoidal pulsation promotes bubble breakup below the free liquid surface, thereby releasing energy directly into the deeper bath region. This continuous breakup–regeneration process increases the average gas–liquid contact area from 2.33 m2 to 2.41 m2 and enhances bubble dispersion, fundamentally improving interphase mixing efficiency.
The sinusoidal pulsation strategy proposed in this study demonstrates considerable potential for industrial implementation in side-blown smelting processes. In practice, sinusoidal flow modulation can be achieved by integrating programmable flow control valves or pulse-capable gas supply systems upstream of the swirl lances. Future research should prioritize pilot-scale validation, thermochemical-coupled modeling, and parameter optimization tailored to specific melt properties to facilitate industrial translation.
Acknowledgement:
Funding Statement: Supported by Yunnan Fundamental Research Projects (202301AT070469, 202301AT070275); Supported by Yunnan Provincial Integrated Special Fund for Key Laboratories (Integrated for Provincial and Municipal Levels) (No. 202302AN360004).
Author Contributions: The authors confirm contribution to the paper as follows: study conception and design, data collection, analysis and interpretation of results, draft manuscript preparation: Yi Yang; conceptualization, resources, writing—review & editing, funding acquisition: Xiaohui Zhang; supervision: Yutang Zhao, Minghao Xu, Hua Wang. All authors reviewed and approved the final version of the manuscript.
Availability of Data and Materials: The data that support the findings of this study are available from the corresponding author upon reasonable request.
Ethics Approval: Not applicable.
Conflicts of Interest: The authors declare no conflicts of interest.
References
1. Amano S , Sato S , Takahashi Y , Kikuchi N . Effect of top and bottom blowing conditions on spitting in converter. Eng Rep. 2021; 3( 12): e12406. doi:10.1002/eng2.12406. [Google Scholar] [CrossRef]
2. Zhou A , Zhang L , Zhou Y , Li Y , Wu X , Xia L , et al. Co-smelting process of Pb concentrate and Zn leaching residues with oxygen-rich side blowing furnaces: industrial application and material balance. JOM. 2023; 75( 12): 5833– 46. doi:10.1007/s11837-023-06192-9. [Google Scholar] [CrossRef]
3. Amaro-Villeda AM , Ramirez-Argaez MA , Conejo AN . Effect of slag properties on mixing phenomena in gas-stirred ladles by physical modeling. ISIJ Int. 2014; 54( 1): 1– 8. doi:10.2355/isijinternational.54.1. [Google Scholar] [CrossRef]
4. Coursol P , MacKey PJ , Kapusta JPT , Valencia NC . Energy consumption in copper smelting: a new Asian horse in the race. JOM. 2015; 67( 5): 1066– 74. doi:10.1007/s11837-015-1380-1. [Google Scholar] [CrossRef]
5. Pérez-Tello M , Parra-Sánchez VR , Sánchez-Corrales VM , Gómez-Álvarez A , Brown-Bojórquez F , Parra-Figueroa RA , et al. Evolution of size and chemical composition of copper concentrate particles oxidized under simulated flash smelting conditions. Metall Mater Trans B. 2018; 49( 2): 627– 43. doi:10.1007/s11663-018-1183-1. [Google Scholar] [CrossRef]
6. Chen L , Hao Z , Yang T , Liu W , Zhang D , Zhang L , et al. A comparison study of the oxygen-rich side blow furnace and the oxygen-rich bottom blow furnace for liquid high lead slag reduction. JOM. 2015; 67( 5): 1123– 9. doi:10.1007/s11837-015-1375-y. [Google Scholar] [CrossRef]
7. Iguchi M , Kodani S , Tokunaga H . Bubble and liquid flow characteristics during horizontal cold gas injection into a water bath. Steel Res. 2000; 71( 11): 435– 41. doi:10.1002/srin.200005712. [Google Scholar] [CrossRef]
8. Li M , Feng Y , Chen X . Thermodynamic simulation model of copper side-blown smelting process. Metals. 2024; 14( 8): 840. doi:10.3390/met14080840. [Google Scholar] [CrossRef]
9. Harby K , Chiva S , Muñoz-Cobo JL . An experimental investigation on the characteristics of submerged horizontal gas jets in liquid ambient. Exp Therm Fluid Sci. 2014; 53: 26– 39. doi:10.1016/j.expthermflusci.2013.10.009. [Google Scholar] [CrossRef]
10. Hurtado-Cruz JP , Carvajal-Meza MA , Pérez-Cortés SA , Jarufe-Troncoso JA , Vargas-Norambuena JP . Ventilation modeling of cavern with CFD. Min Metall Explor. 2024; 41( 6): 3801– 9. doi:10.1007/s42461-024-01122-y. [Google Scholar] [CrossRef]
11. Simmons SC , Lubitz WD . Analysis of internal fluid motion in an Archimedes screw using computational fluid mechanics. J Hydraul Res. 2021; 59( 6): 932– 46. doi:10.1080/00221686.2020.1844813. [Google Scholar] [CrossRef]
12. Chanouian S , Ahlin B , Tilliander A , Ersson M . Inclination effect on mixing time in a gas–stirred side–blown converter. Steel Res Int. 2021; 92( 10): 2100044. doi:10.1002/srin.202100044. [Google Scholar] [CrossRef]
13. Bölke K , Ersson M , Ni P , Swartling M , Jönsson PG . Physical modeling study on the mixing in the new IronArc process. Steel Res Int. 2018; 89( 7): 1700555. doi:10.1002/srin.201700555. [Google Scholar] [CrossRef]
14. Ternstedt P , Tilliander A , Jönsson PG , Iguchi M . Mixing time in a side-blown converter. ISIJ Int. 2010; 50( 5): 663– 7. doi:10.2355/isijinternational.50.663. [Google Scholar] [CrossRef]
15. Xiao Y , Wang J , Lu T , Liu F , Lv C , Zhao H . An experimental study on gas–liquid flow and mixing behavior in a copper side-blown smelting furnace. Metall Mater Trans B. 2023; 54( 2): 756– 64. doi:10.1007/s11663-023-02723-6. [Google Scholar] [CrossRef]
16. Ma J , Zhou P , Cheng W , Song Y , Shi P . Dimensional analysis and experimental study of gas penetration depth model for submerged side-blown equipment. Exp Therm Fluid Sci. 2016; 75: 220– 7. doi:10.1016/j.expthermflusci.2016.01.017. [Google Scholar] [CrossRef]
17. Long P , Chen Z , Song YP . Computational fluid dynamics modeling of multiphase flows in a side-blown furnace: effects of air injection and nozzle submerged depth. Processes. 2024; 12( 7): 1373. doi:10.3390/pr12071373. [Google Scholar] [CrossRef]
18. Bian Z , Chen D , Sun L , Wang L , Zhao H , Zhen Y , et al. Numerical simulation and optimization analysis of primary air injection mode in oxygen-rich side-blown bath smelting furnace. J Sustain Metall. 2023; 9( 2): 871– 83. doi:10.1007/s40831-023-00699-w. [Google Scholar] [CrossRef]
19. Li X , Liu Y , Wang D , Zhang T . Emulsification and flow characteristics in copper oxygen-rich side-blown bath smelting process. Metals. 2020; 10( 11): 1520. doi:10.3390/met10111520. [Google Scholar] [CrossRef]
20. Yang B , Liu W , Jiao F , Zhang L , Qin W , Jiang S . Numerical simulation and application of an oxygen-enriched side-blown smelting furnace for the treatment of electroplating sludge. Sustainability. 2023; 15( 13): 10721. doi:10.3390/su151310721. [Google Scholar] [CrossRef]
21. Zou Q , Hu J , Yang S , Wang H , Deng G . Investigation of the splashing characteristics of lead slag in side-blown bath melting process. Energies. 2023; 16( 2): 1007. doi:10.3390/en16021007. [Google Scholar] [CrossRef]
22. Hu J , Yang S , Wang H . VOF study of mesoscale bubble flow dynamics in the side-blown gas–liquid two-phase reactor. Chem Eng J. 2024; 480: 147983. doi:10.1016/j.cej.2023.147983. [Google Scholar] [CrossRef]
23. Abbassi W , Besbes S , El Hajem M , Ben Aissia H , Champagne JY , Jay J . Influence of operating conditions and liquid phase viscosity with volume of fluid method on bubble formation process. Eur J Mech Fluids. 2017; 65: 284– 98. doi:10.1016/j.euromechflu.2017.04.001. [Google Scholar] [CrossRef]
24. Ahmed ZU , Al-Abdeli YM , Guzzomi FG . Heat transfer characteristics of swirling and non-swirling impinging turbulent jets. Int J Heat Mass Transf. 2016; 102: 991– 1003. doi:10.1016/j.ijheatmasstransfer.2016.06.037. [Google Scholar] [CrossRef]
25. Parveen Banu J , Mani A . Numerical studies on ejector with swirl generator. Int J Therm Sci. 2019; 137: 589– 600. doi:10.1016/j.ijthermalsci.2018.11.033. [Google Scholar] [CrossRef]
26. Zhao Y , Zhang X , Tong X , Yu X , Luo J , Fu Y , et al. Research on the mixing characteristics of the bottom blowing molten pool based on flow characteristics and mixing uniformity. Phys Fluids. 2024; 36( 2): 025166. doi:10.1063/5.0188687. [Google Scholar] [CrossRef]
27. Obiso D , Reuter M , Richter A . CFD investigations of bath dynamics in a pilot-scale TSL furnace. Metall Mater Trans B. 2021; 52( 5): 3064– 77. doi:10.1007/s11663-021-02233-3. [Google Scholar] [CrossRef]
28. Huda N , Naser J , Brooks G , Reuter MA , Matusewicz RW . CFD modeling of swirl and nonswirl gas injections into liquid baths using top submerged lances. Metall Mater Trans B. 2010; 41( 1): 35– 50. doi:10.1007/s11663-009-9316-1. [Google Scholar] [CrossRef]
29. Rout BK , Singh OP , Mazumdar D . Swirling flows in side blowing reactors and possible advantages. Trans Indian Inst Met. 2015; 68( 5): 669– 73. doi:10.1007/s12666-014-0499-z. [Google Scholar] [CrossRef]
30. Zhu S , Zhao Q , Liu Y , Li X , Zhang T . Local bubble characteristics in a side-blown vortex smelting reduction reactor. Metall Mater Trans B. 2022; 53( 4): 2303– 20. doi:10.1007/s11663-022-02530-5. [Google Scholar] [CrossRef]
31. Xiao Y , Liu Y , Zhang T , Li X , Wang K . Water model experiments on the gas flow stability of swirl nozzles in a copper side-blown smelting furnace. Metall Mater Trans B. 2025; 56( 4): 3440– 53. doi:10.1007/s11663-025-03564-1. [Google Scholar] [CrossRef]
32. Kannan T , Arulmurugan B , Manikandan M . Evaluation of metallurgical and mechanical properties in dissimilar welding of Monel 400 and Hastelloy C-2000 using single and double pulse gas metal arc welding techniques. J Adhes Sci Technol. 2025; 39( 18): 2847– 75. doi:10.1080/01694243.2025.2522185. [Google Scholar] [CrossRef]
33. Noël F , Serra CA , Le Calvé S . Design of a novel axial gas pulses micromixer and simulations of its mixing abilities via computational fluid dynamics. Micromachines. 2019; 10( 3): 205. doi:10.3390/mi10030205. [Google Scholar] [CrossRef]
34. Shen J , Zhao Y , Han G . Design on optimization of argon bottom blowing of molten steel ladle. Procedia Eng. 2011; 16: 284– 90. doi:10.1016/j.proeng.2011.08.1085. [Google Scholar] [CrossRef]
35. Jackson R , Wang Z , Gursul I . Control of upswept afterbody vortices using continuous and pulsed blowing. J Aircr. 2020; 57( 1): 76– 92. doi:10.2514/1.C035639. [Google Scholar] [CrossRef]
36. Tan F , Cao H , Lin G , Li Z , Gao L , Li F , et al. Mathematical modeling of the fluid hydrodynamics and refining effects in a gas-stirred ladle with pulsed bottom blowing. Metall Mater Trans B. 2024; 55( 6): 4624– 33. doi:10.1007/s11663-024-03244-6. [Google Scholar] [CrossRef]
37. Wan Z , Yang S , Kong D , Li D , Hu J , Wang H . Numerical investigation of sinusoidal pulsating gas intake to intensify the gas-slag momentum transfer in the top-blown smelting furnace. Int J Miner Metall Mater. 2024; 31( 2): 301– 14. doi:10.1007/s12613-023-2705-7. [Google Scholar] [CrossRef]
38. Li W , Wang S , Xu J , Hu J , Wang H , Zhai Y , et al. Numerical investigation of the enhanced stirring characteristics of a multi-lance top-blowing continuous converting furnace for lance arrangement and variable-velocity blowing. Energies. 2023; 16( 5): 2412. doi:10.3390/en16052412. [Google Scholar] [CrossRef]
39. Li D , Kong D , Xiang C , Wu X , Yang S . Numerical study on the effect of slag deflector plates in bidirectional convection of copper slag within a large side-blown molten pool smelting furnace. World Nonferrous Met. 2024; 14: 1– 4. (In Chinese). [Google Scholar]
40. Brackbill JU , Kothe DB , Zemach C . A continuum method for modeling surface tension. J Comput Phys. 1992; 100( 2): 335– 54. doi:10.1016/0021-9991(92)90240-Y. [Google Scholar] [CrossRef]
41. Li L , Gu Z , Xu W , Tan Y , Fan X , Tan D . Mixing mass transfer mechanism and dynamic control of gas-liquid-solid multiphase flow based on VOF-DEM coupling. Energy. 2023; 272: 127015. doi:10.1016/j.energy.2023.127015. [Google Scholar] [CrossRef]
42. Mulbah C , Kang C , Mao N , Zhang W , Shaikh AR , Teng S . A review of VOF methods for simulating bubble dynamics. Prog Nucl Energy. 2022; 154: 104478. doi:10.1016/j.pnucene.2022.104478. [Google Scholar] [CrossRef]
43. Liu YT , Yang TZ , Chen Z , Zhu ZY , Zhang L , Huang Q . Experiment and numerical simulation of two-phase flow in oxygen enriched side-blown furnace. Trans Nonferrous Met Soc China. 2020; 30( 1): 249– 58. doi:10.1016/S1003-6326(19)65196-4. [Google Scholar] [CrossRef]
44. Xiao Y , Lu T , Zhou Y , Su Q , Mu L , Wei T , et al. Computational fluid dynamics study on enhanced circulation flow in a side-blown copper smelting furnace. JOM. 2021; 73( 9): 2724– 32. doi:10.1007/s11837-021-04800-0. [Google Scholar] [CrossRef]
45. Vinuesa R , Prus C , Schlatter P , Nagib HM . Convergence of numerical simulations of turbulent wall-bounded flows and mean cross-flow structure of rectangular ducts. Meccanica. 2016; 51( 12): 3025– 42. doi:10.1007/s11012-016-0558-0. [Google Scholar] [CrossRef]
46. Shah YG , Jackson AC , Tsouris C , Finney CEA , Panagakos G . Multiphase computational fluid dynamics modeling of reacting flows in absorption columns for carbon capture. Digit Chem Eng. 2025; 16: 100252. doi:10.1016/j.dche.2025.100252. [Google Scholar] [CrossRef]
Cite This Article
 Copyright © 2026 The Author(s). Published by Tech Science Press.
This work is licensed under a Creative Commons Attribution 4.0 International License , which permits unrestricted use, distribution, and reproduction in any medium, provided the original work is properly cited.
 Downloads
 Citation Tools