
 Login
Login Register
 Submit a Paper
 Propose a Special lssue
 Open Access
ARTICLE
Numerical Investigation of Cavitation-Induced Flow Dynamics and Pressure Fluctuations in a Pump-Turbine
1 School of Intelligent Manufacturing and Vehicle Engineering, Guang’an Vocational & Technical College, Guang’an, China
2 School of Civil and Architectural Engineering, Guizhou University of Engineering Science, Bijie, China
* Corresponding Author: Jianwu He. Email:
Fluid Dynamics & Materials Processing 2026, 22(9), 9 https://doi.org/10.32604/fdmp.2026.086616
Received 07 June 2026; Accepted 04 September 2026; Issue published 28 September 2026
 View Full Text
 Download PDF
Abstract
This study investigates the influence of the cavitation coefficient on the internal flow field and pressure fluctuation characteristics of a pump-turbine using numerical simulations validated against experimental measurements. The validated model is then used to analyze hydraulic performance and cavitation-induced flow behavior over a range of cavitation conditions. The results show that cavitation first develops on the suction side of the runner blades near the outlet and progressively reduces hydraulic efficiency as it intensifies. The flow field within the runner is primarily governed by rotor-stator interactions between the runner and guide vanes, resulting in pronounced fluctuations of the flow variables. As the cavitation coefficient decreases, the vapor volume fraction increases, the flow becomes increasingly unstable, and pressure fluctuations at the blade-passing frequency (BPF) in the vaneless region become more pronounced. Under severe cavitation conditions, secondary backflow develops along the outer side of the elbow, while the amplitude of low-frequency pressure fluctuations associated with vortical structures in the draft tube increases significantly, compromising the operational stability of the unit.Keywords
With the continuous growth of energy demand and the increasing penetration of variable renewable energy, hydropower, particularly pumped-storage hydropower, is playing an increasingly important role in grid balancing and flexible operation [1]. Meanwhile, pumped-storage units are being developed toward higher heads, larger capacities, and higher rotational speeds; together with frequent load regulation, these trends make operational stability increasingly critical [2]. During off-design and transient operation, cavitation may coexist with complex vortex structures, including eccentric draft-tube vortex ropes in reversible pump-turbines [3], cavitating channel vortices within Francis runner passages as the guide-vane opening changes [4], and cavitating vortex ropes accompanied by water-column separation during load-rejection transients [5]. Cavitation can also develop near the leading and trailing edges of runner blades [6]. These phenomena can reduce hydraulic performance, increase energy dissipation, and induce pressure pulsations, vibration, noise, and material erosion [7,8,9]. Therefore, reliable prediction and detailed characterization of cavitating flow are essential for maintaining the efficient and stable operation of pump-turbine units.
Cavitation performance has become a key criterion for evaluating large hydraulic machinery, and recent studies have examined cavitating flows from the perspectives of flow mechanisms, operating stability, energy loss, and design improvement. Shen et al. [10] investigated the coupling between tailwater vortices and cavitation during pump-as-turbine operation. Dahal and Trivedi [11] quantified the effects of runner blade number on inter-blade vortices, hydraulic losses, and pressure fluctuations, while Remache et al. [12] reviewed CFD-based and multi-objective strategies for impeller design. Lv et al. [13] characterized pump-mode cavitation in a variable-speed pump-turbine, and Zhao et al. [14] experimentally identified pressure-fluctuation and vibration signatures associated with hump instability. Wang et al. [15] investigated cavitation-induced acoustic responses in centrifugal pumps, while Dai et al. [16] analyzed the influence of unsteady flow structures on vortex evolution and pressure fluctuations. Wang et al. [17] and Iqbal et al. [18] used entropy-production or thermodynamic analyses to quantify energy losses caused by cavitating or gas-liquid multiphase flows in pump and pump-as-turbine systems. Dönmez et al. [19] showed that optimizing blade inlet and wrap angles can improve impeller cavitation performance, and Nasir et al. [20] summarized geometry-based approaches for improving pump-as-turbine hydraulic performance. Pang et al. [21] demonstrated that J-grooves can suppress cavitating vortex ropes in pump-turbines. Singh and Hashmi [22] reviewed the effects of pressure asymmetry, cavitation, and off-design flow on impeller forces, while Lu et al. [23] reported that intensified cavitation under low-flow pump conditions increases vortex complexity and entropy generation, thereby reducing efficiency.
Currently, one of the important objectives in the hydraulic design of pump-turbines is to further expand the stable operating range while ensuring energy performance, with cavitation performance being a critical criterion. Although previous studies have provided valuable insights into cavitation characteristics of pump-turbines, the coupling mechanism between cavitation evolution, internal flow deterioration, and pressure fluctuation response remains unclear, especially under high-head conditions with strong rotor-stator interaction and complex unsteady flow structures. Therefore, this study aims to investigate the cavitation-induced flow instability mechanism by establishing a two-phase flow model. The interactions among cavitation development, turbulence evolution, hydraulic force variation, and pressure fluctuation characteristics are systematically analyzed, providing new insights into the influence mechanism of cavitation on the operational stability of pump-turbines.
2 Numerical Simulation Methodology
2.1 Geometric Configuration and Grid Generation
The full-passage geometric configuration of the model pump-turbine is presented in Fig. 1. The main overflow components include five parts: spiral casing, stay vanes, guide vanes, impeller and draft tube.
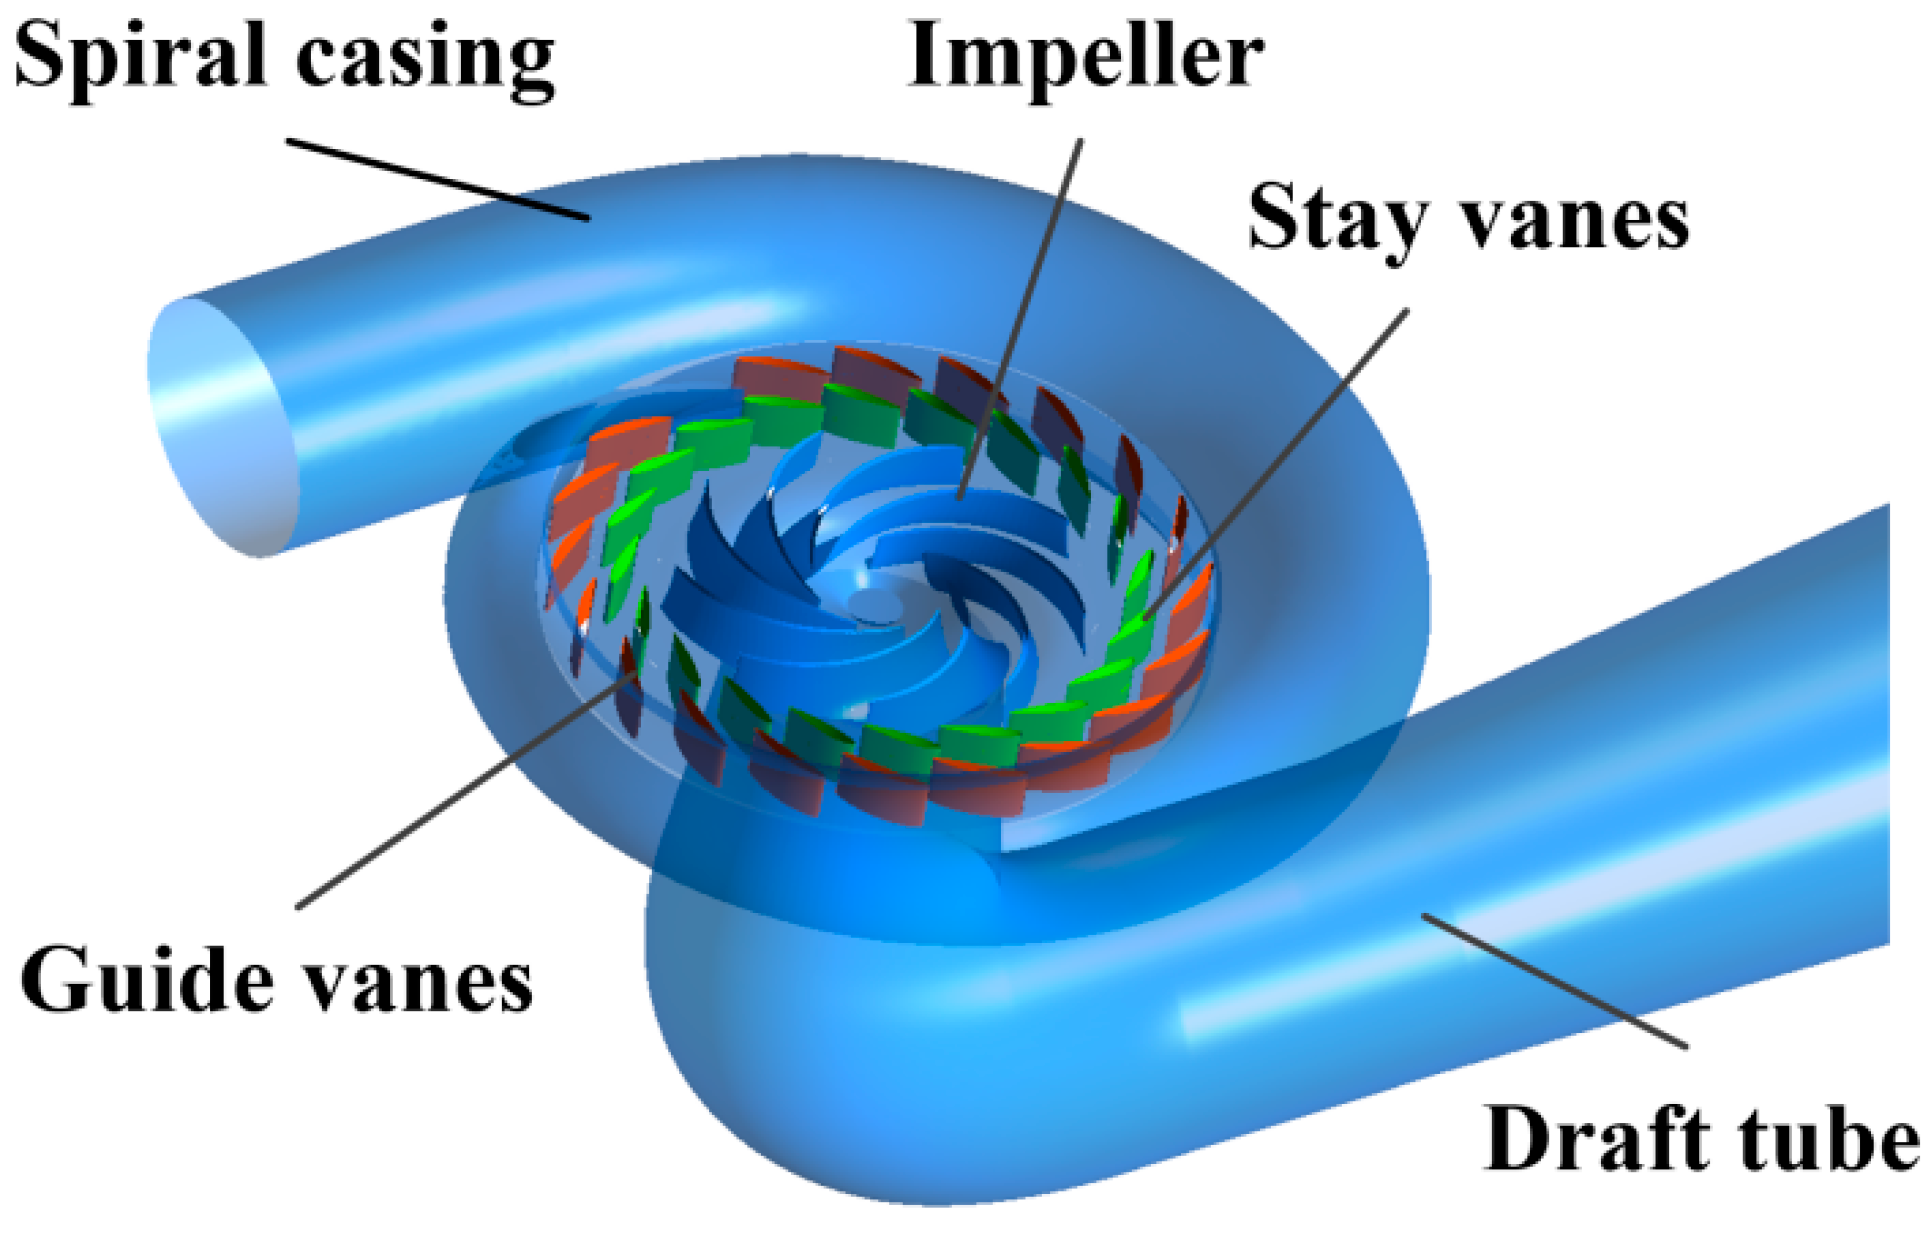
Figure 1: The full-passage geometric configuration of the model pump-turbine.
For the prototype unit operating in turbine mode, the rated net head (Hp) is 190 m, with a high head condition (Hh) of 203 m. The rated rotating speed (np) is 250 r/min, the specific speed (ns) is 149.34, and the prototype-to-model scale ratio (λ) is 10.967. Numerical calculations were performed at the specified operating point, where the unit flow rate and unit rotating speed were Q11 = 0.890 and n11 = 57.73, respectively. The detailed geometric specifications of the model unit are presented in Table 1.
The full flow passage of the pump-turbine was partitioned into four independent computational regions: the spiral casing-stay vane zone, guide vane zone, impeller zone, and draft tube zone. The computational domain was discretized using a hybrid mesh scheme. Considering the complex geometric features near the tongue region, unstructured grids with superior adaptability to intricate boundaries were employed for the spiral casing and stay vanes sections, while high-quality structured grids were implemented in other regions. On the premise of ensuring the reliability of the computational results, the grid count was reduced as much as possible to minimize computational time. The total number of grid cells and the number of grid nodes were respectively determined to be 5,611,608 and 4,006,784. The schematic view of the grid division is provided in Fig. 2.
Table 1: Geometric specifications of the model unit.
| Parameters | Value |
|---|---|
| Inlet diameter of the impeller D1 (mm) | 473.5 |
| Outlet diameter of the impeller D2 (mm) | 300 |
| Impeller blade count Zb | 9 |
| Stay vane blade count Zc | 20 |
| Guide vane blade count Z0 | 20 |
| Guide vane height b0 (mm) | 66.72 |
| Wrap angle of spiral casing φ0 (°) | 343 |
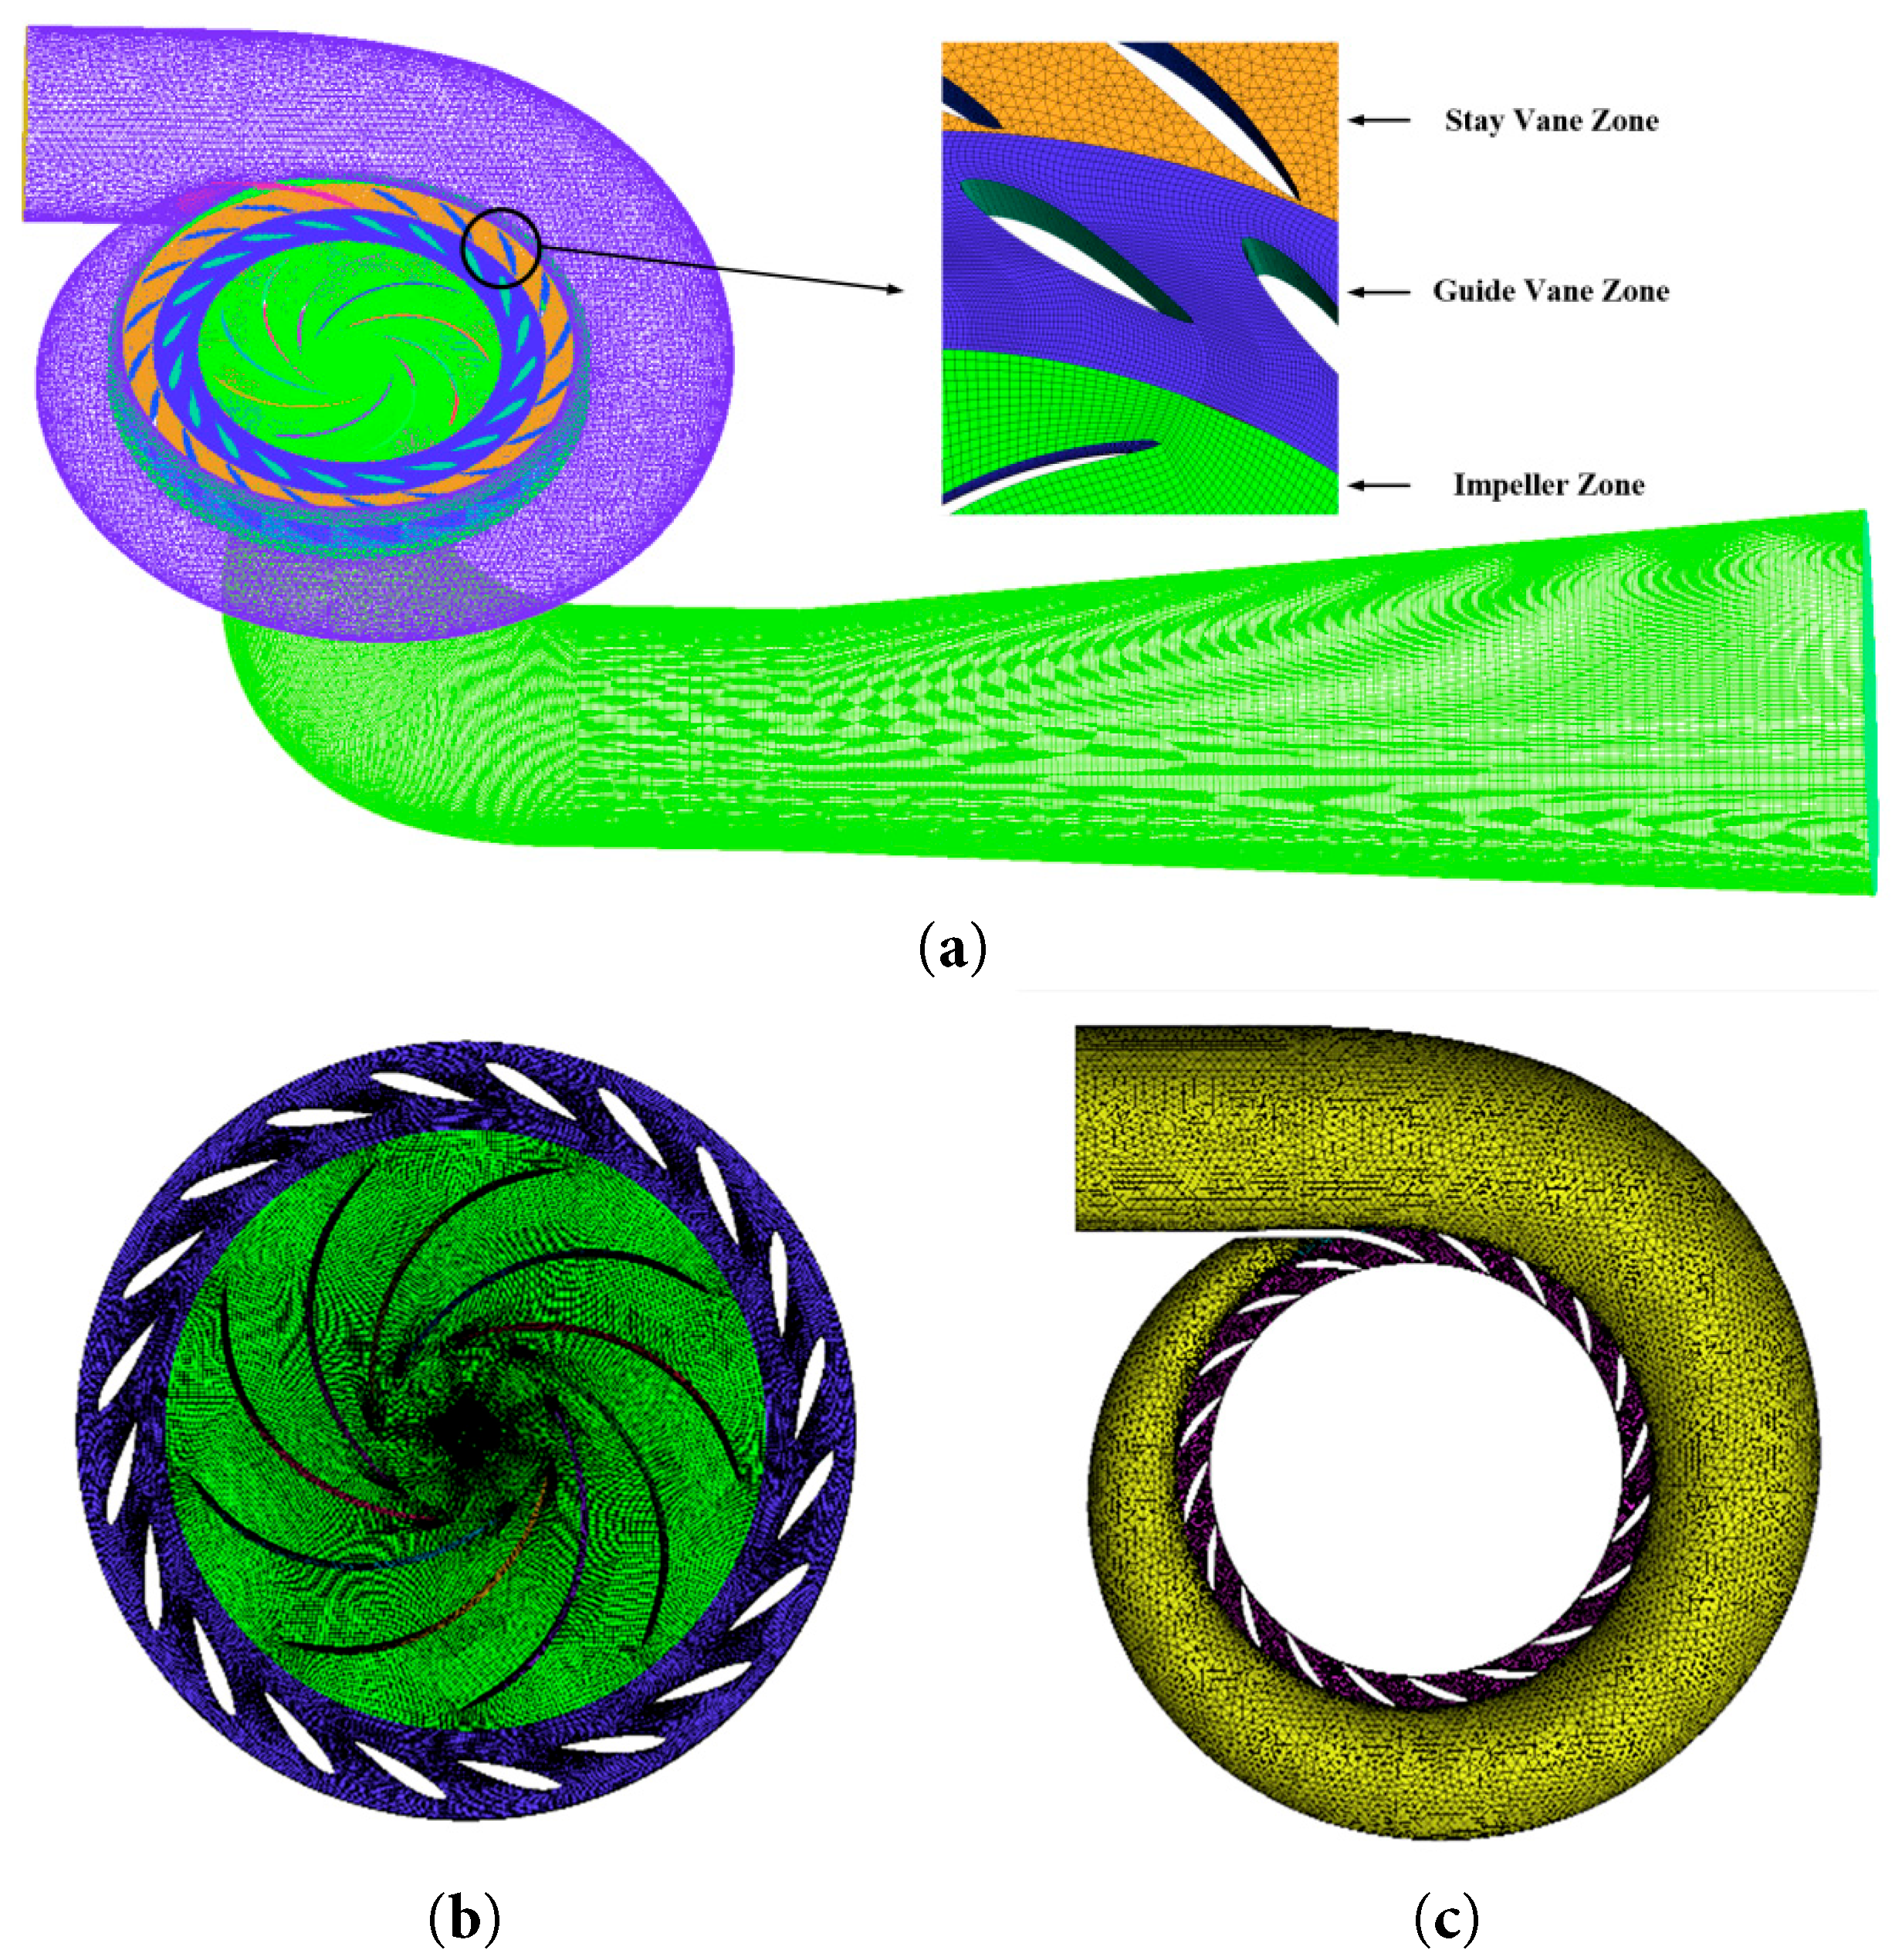
Figure 2: The schematic view of grid division: (a) whole flow passage, (b) impeller-guide vane, (c) spiral casing-stay vane.
To verify the rationality of the mesh generation strategy and evaluate the influence of mesh resolution on the computational accuracy, seven sets of full-flow computational meshes for the model pump-turbine were generated using different mesh scales. Steady-state numerical simulations were performed under the specified operating condition, and the hydraulic efficiency was selected as the evaluation indicator for mesh independence analysis. The validation results are presented in Fig. 3. When the number of mesh elements exceeds 5 million, the variation in the calculated efficiency becomes negligible with further mesh refinement and gradually approaches a stable value. This indicates that increasing the mesh number beyond this level has a limited impact on the simulation results, and the solution is nearly independent of the mesh resolution. Considering both computational accuracy and efficiency, an appropriate mesh size was selected to ensure reliable numerical results while reducing computational cost. Finally, a full-flow computational mesh containing 5,611,608 elements was adopted for the subsequent simulations.
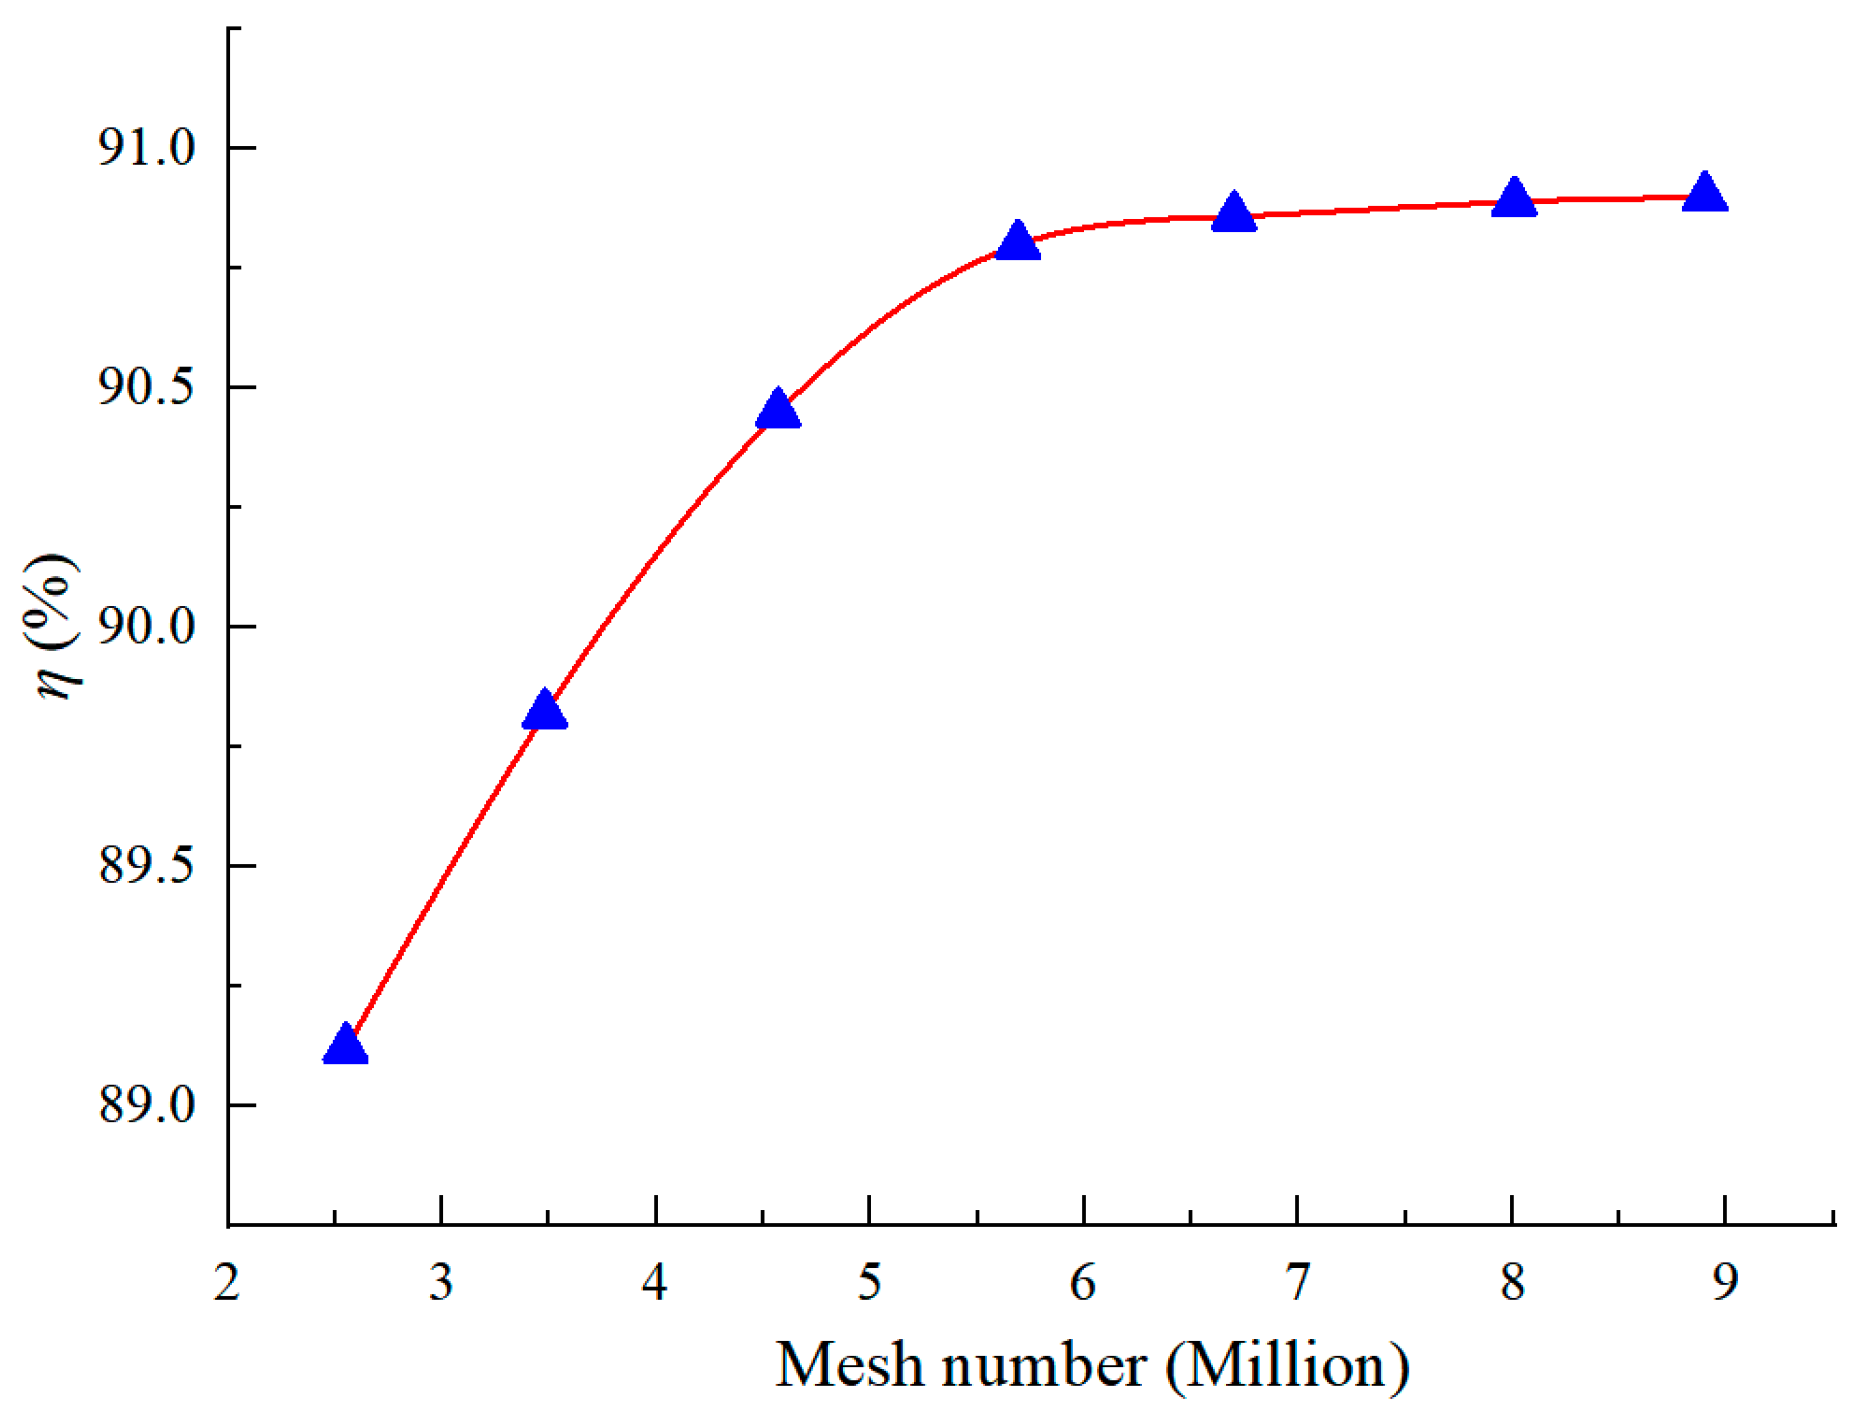
Figure 3: Mesh independence verification.
Local mesh refinement was performed on the wall surfaces of the main hydraulic components, and the distributions of Y+ on the main flow passage components are shown in Fig. 4. The Y+ values on the surfaces of the main hydraulic components, including the runner, guide vanes, stay vanes, spiral casing, and draft tube, are maintained within an appropriate range. The minimum Y+ value is close to 0.5, while the local maximum value is below 9, with the majority of the surface-averaged Y+ values distributed around 2. Such a near-wall resolution ensures that the boundary layer characteristics can be adequately captured by the SST k-ω turbulence model. Moreover, the automatic wall treatment approach adopted in the numerical solver enables adaptive treatment of the near-wall region according to local flow conditions. Therefore, the present mesh configuration provides sufficient accuracy for the SST k-ω turbulence model and establishes a reliable numerical foundation.
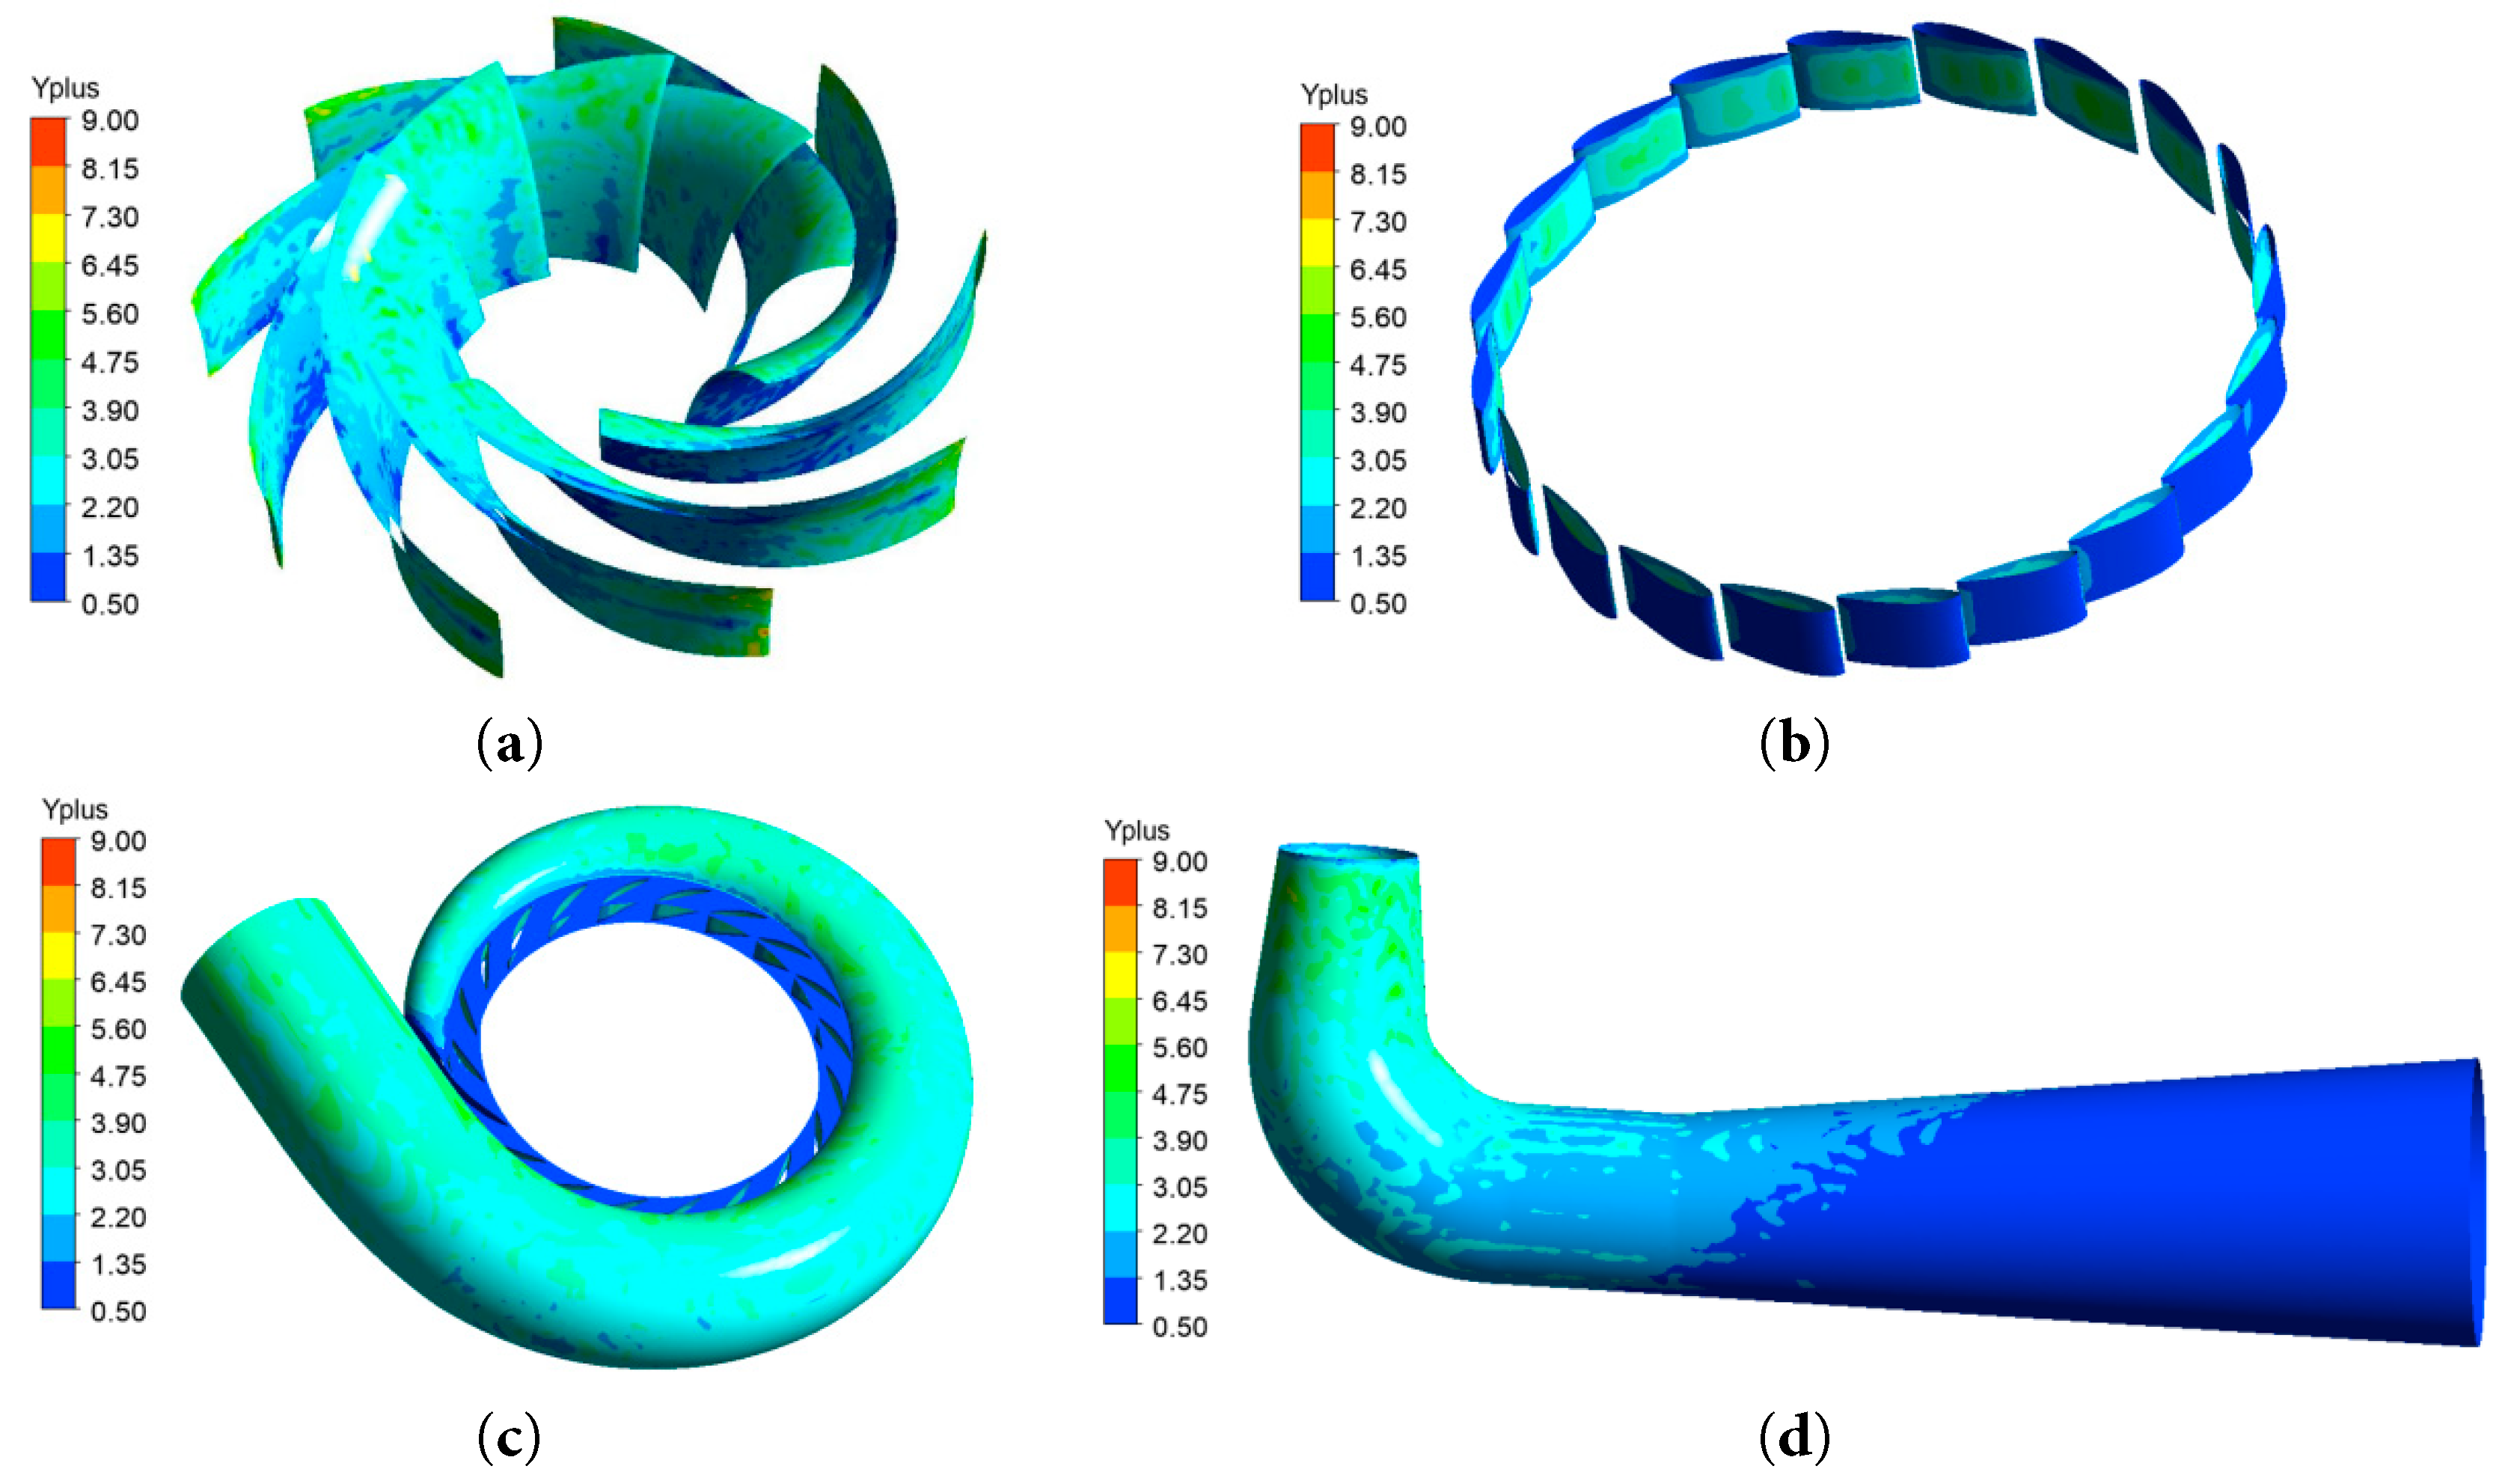
Figure 4: The near-wall Y+ distribution: (a) Impeller, (b) Guide vane, (c) Spiral casing-stay vane, (d) draft tube.
2.2 Model Selection and Parameter Setting
Cavitating flow can be regarded as a homogeneous liquid-vapor two-phase flow, where both phases share identical velocity and pressure fields while satisfying the no-slip condition at their interface [24,25]. The governing equations include the continuity equation and momentum equation of the mixture phase. The equations for the liquid-vapor mixture are given as:
The mixture density and viscosity are calculated based on the vapor volume fraction:
To capture the phase transition between liquid and vapor phases, the Zwart-Gerber-Belamri (ZGB) cavitation model [26] was adopted. This model describes cavitation evolution by solving the vapor transport equation:
In the ZGB model, the mass transfer rate is determined according to the difference between local pressure and vapor saturation pressure.
The Shear Stress Transport (SST) k-ω turbulence model has been adopted for this simulation due to its ability to predict turbulent shear stress transport and its superior performance in flows characterized by adverse pressure gradients. Therefore, this model was selected to simulate the complex cavitation flow within the unit. The transport equations governing the turbulent kinetic energy (k) and the specific dissipation rate (ω) are presented by Eqs. (8) and (9), respectively.
The SST k-ω turbulence model was adopted because of its capability to accurately predict near-wall flow, adverse pressure gradients, and flow separation in hydraulic machinery [27]. The Zwart-Gerber-Belamri cavitation model was selected for its robustness and computational efficiency in simulating liquid-vapor mass transfer, and has been successfully applied to predict cavitation inception and development in hydraulic machinery [28]. Therefore, the combination of these two models provides a reliable and efficient approach for simulating cavitating flows in the present high-head pump-turbine.
The computational model was configured with a total pressure boundary condition at the inlet of the spiral casing, while a static pressure condition was imposed at the outlet of the draft tube. The total pressure difference between the inlet and outlet was maintained at 293,770 Pa, corresponding to the test head (Hm) of 30 m. The cavitation coefficient of the device was calculated according to Eq. (10).
Based on the suction head and the elevation of the draft-tube outlet, the corresponding outlet pressure was determined from the pressure at the downstream water surface. While maintaining a constant head condition, the cavitation coefficient of the device was progressively reduced by continuously decreasing the pressure value at the outlet of draft tube. The rotor-stator interface was defined as an interface type, and the sliding mesh model was employed to realize the flow field data transmission of rotating and static interference. The procedure of numerical simulation was initiated with steady-state single-phase simulations, whose converged results were used as initial conditions for subsequent unsteady simulations of cavitating flow by utilizing the Zwart cavitation model. The SIMPLEC algorithm was adopted as the pressure-velocity coupling scheme, with second-order upwind discretization schemes applied for numerical discretization schemes. The time step Δt for the unsteady calculation is 1.5812 × 10⁻⁴ s (i.e., 1/360 T, where T = 0.05693 s), with a residual of 10−5 as the convergence criterion for iterative calculation. The experimental data were employed for validating the numerical model, whereas flow and performance analysis were performed based on the validated CFD simulation.
2.3 Validation of Numerical Method
Based on model experimental data (test head: 30 m), nine operating conditions were selected for numerical simulation. Fig. 5 presents a contrast between the simulated cavitation performance curve and experimental measurements, where σ represents the cavitation coefficient and η denotes hydraulic efficiency. The CFD-predicted cavitation performance curve matches well with the experimental results, with the relative error less than 3%, meeting the required computational accuracy and validating the reliability of the numerical approach.
In the present study, the cavitation coefficient corresponding to a 0.5% decrease in hydraulic efficiency was taken as the critical cavitation coefficient, yielding a value of σc = 0.079. When the cavitation coefficient is high, no cavitation occurs within the unit, and the energy characteristics are almost unaffected, with the hydraulic efficiency remaining largely unchanged. When 0.079 < σ < 0.12, cavitation begins to occur in the flow channel, causing gradual flow instability and a slow efficiency decrease with reducing σ. When σ ≤ 0.079, the degree of cavitation intensifies, where vapor blockage in the flow channel significantly reduces both flow rate and output power, leading to rapid efficiency deterioration with the decrease of the cavitation coefficient.
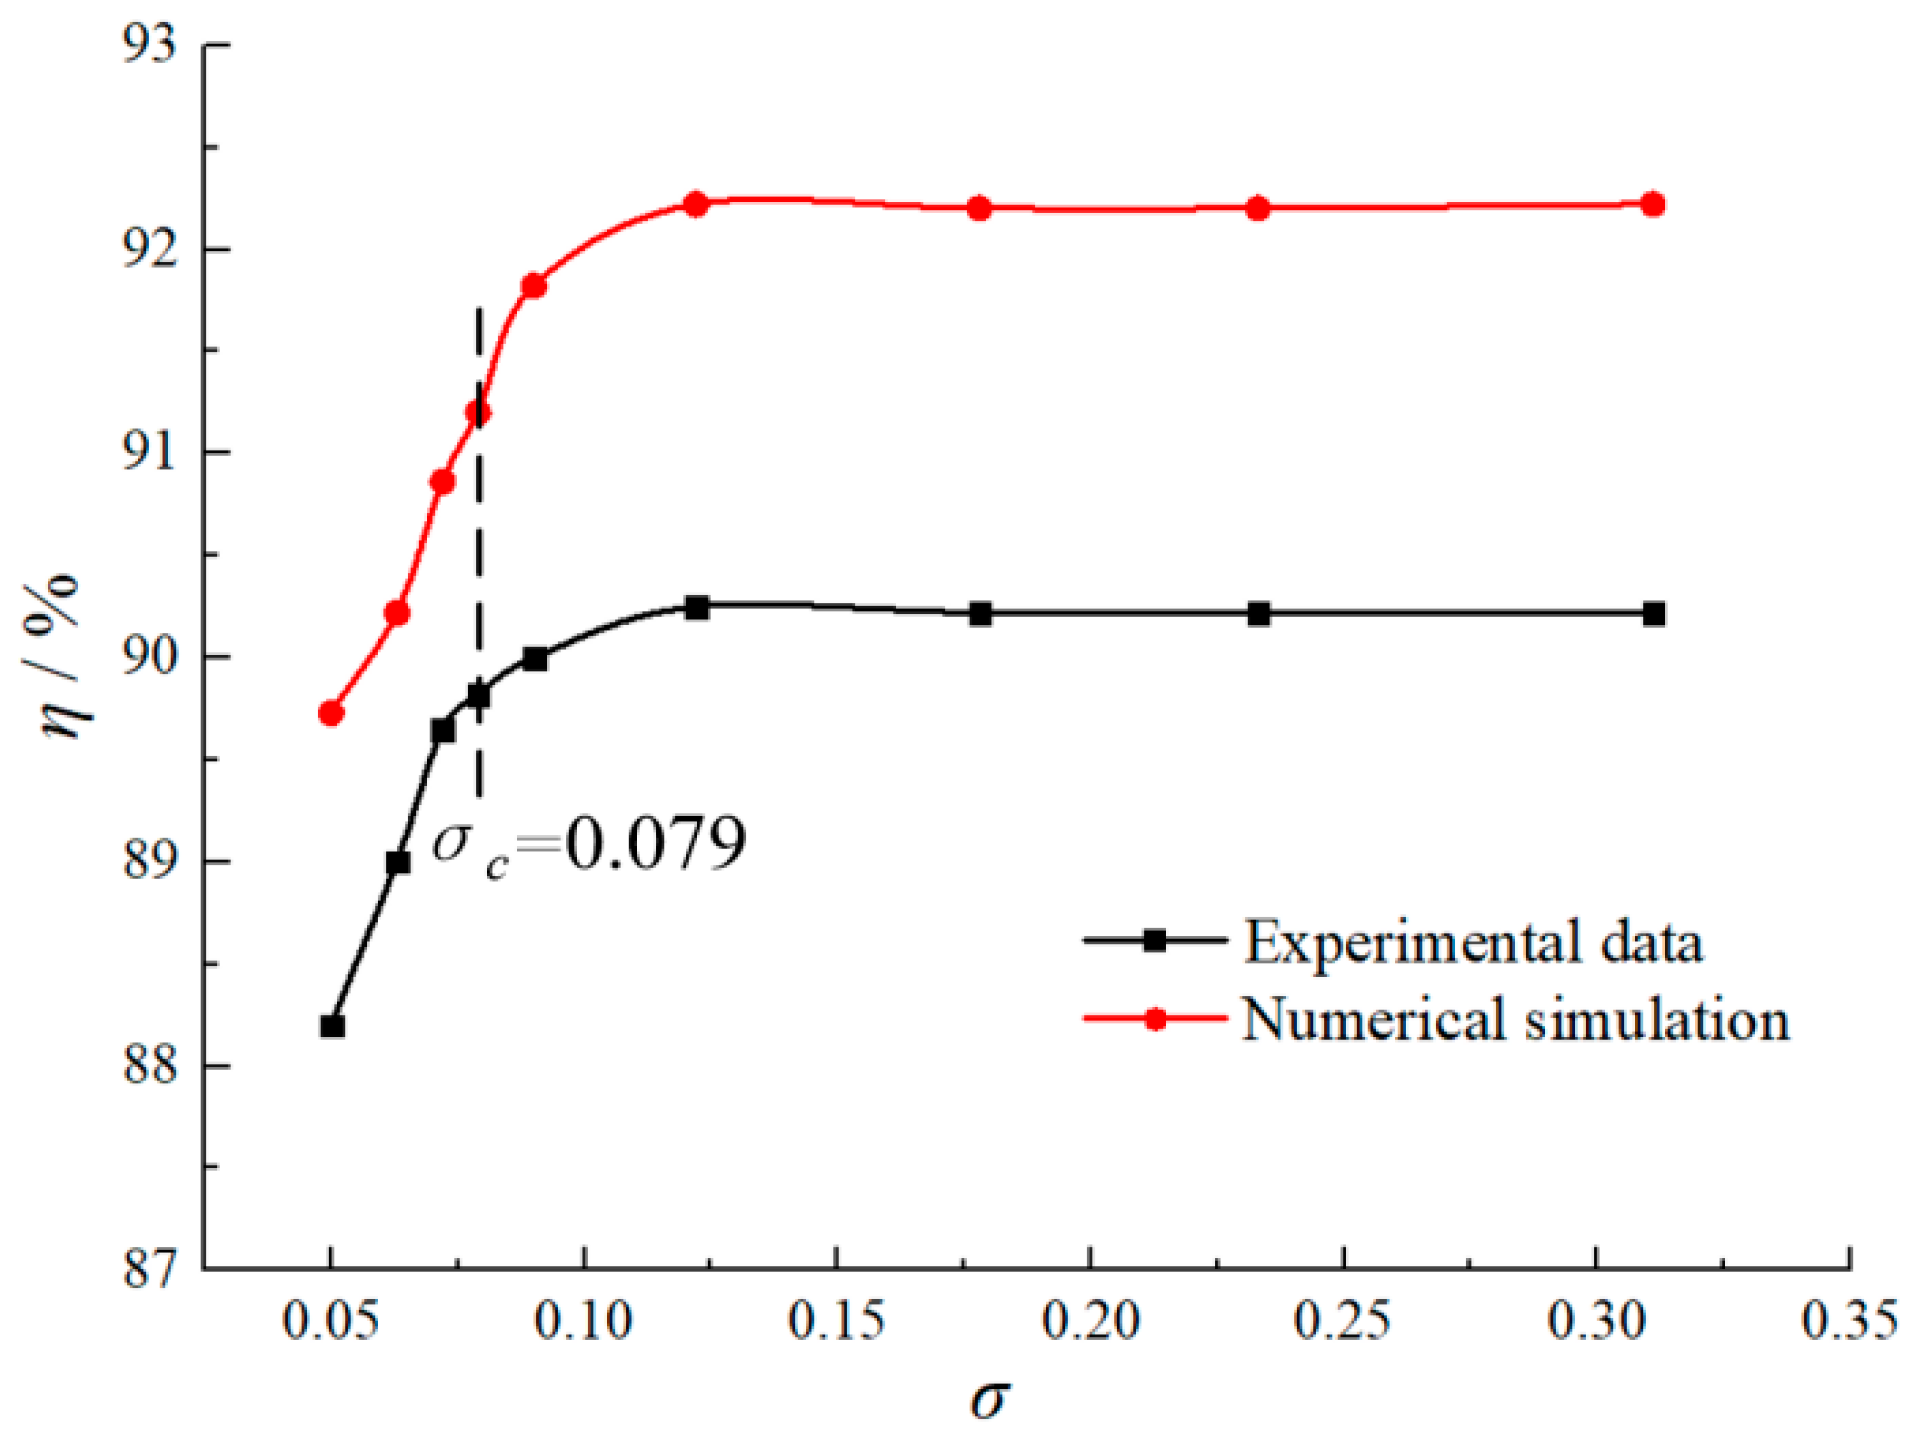
Figure 5: Efficiency curves under different cavitation coefficients.
3.1 Flow Field in the Guide Vane and Impeller Zone
3.1.1 Pressure Load on the Blade Surface
To investigate the pressure load distribution on the blade surface when cavitation occurs, three spanwise sections at 0.1, 0.5, and 0.9 of the blade height were selected and designated as 0.1 lspan, 0.5 lspan, and 0.9 lspan, respectively. Here, lspan represents the dimensionless distance from the upper crown to lower band of the impeller, ranging from 0 to 1. Fig. 6 presents the pressure distribution along the pressure and suction sides of the blade under different cavitation coefficients.
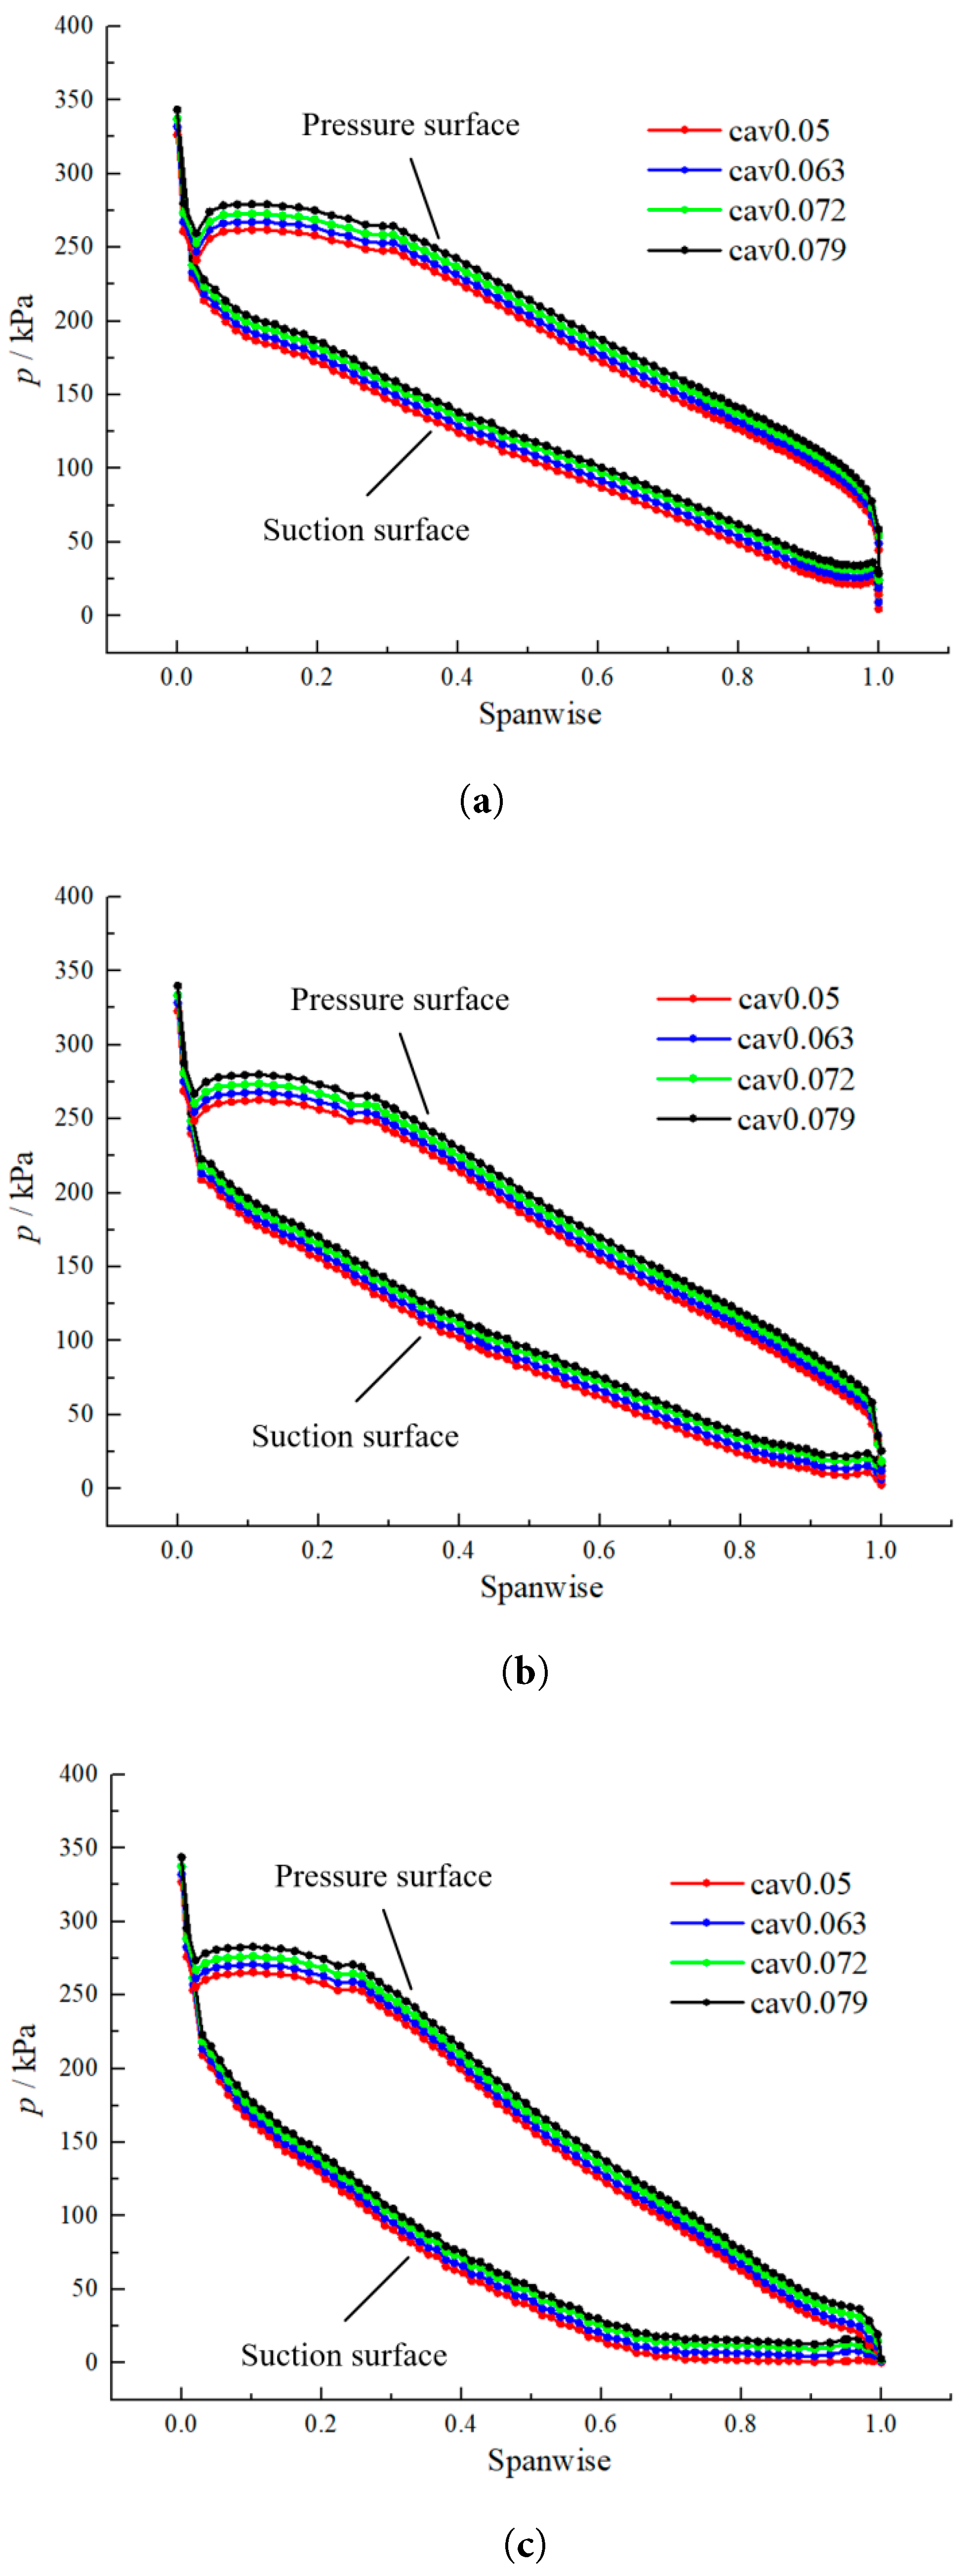
Figure 6: Blade-load distribution curves under different cavitation coefficients: (a) 0.1 lspan, (b) 0.5 lspan, (c) 0.9 lspan.
The horizontal coordinate indicates the relative position along the streamline direction of the spanwise section, while the vertical axis denotes the pressure load distribution on the blade surface. Under different cavitation coefficients, the pressure generally decreases progressively from the inlet toward the outlet due to the work performed by the fluid passing through the impeller, demonstrating a reasonable pressure distribution trend. The outflow from the guide vane impacts the blade at the impeller inlet, causing significant pressure fluctuation in this region. As the cavitation coefficient progressively decreases, the pressure on both the pressure side and suction side correspondingly diminishes. This phenomenon occurs because the reduced pressure at the outlet of the draft tube causes an overall decline in the average pressure throughout the flow channel.
3.1.2 The Force Exerted on the Impeller
The inherent inability to achieve complete hydraulic uniformity and equilibrium during practical pump operation results in persistent, multidirectional forces acting on the impeller. The axial force primarily arises from pressure asymmetry between the upper crown and lower band of the impeller, forming an axial resultant force. Radial forces occur when the axisymmetric distribution of hydraulic pressure around the impeller is disrupted, subjecting the shaft to alternating stresses and causing directional deflection. As critical contributors to vibration, both axial and radial forces can adversely affect the unit’s operational safety and stability.
Table 2 lists the axial and radial forces on the impeller under different cavitation coefficients. When σ = 0.316 (i.e., in a non-cavitation state), the forces exerted on the impeller are minimal. Conversely, when σ = 0.05 (i.e., in a severe cavitation state), the forces reach their maximum. As the cavitation coefficient decreases, the pressure in the draft tube progressively declines, leading to increased axial resultant thrust while maintaining a consistent direction toward the impeller outlet. Meanwhile, intensified cavitation causes increasingly chaotic flow patterns in the channel, inducing significant pressure fluctuations that amplify radial forces and a slight change in their directions. These findings demonstrate that deteriorating cavitation conditions exacerbate hydraulic instability and substantially influence the forces acting on the impeller.
Table 2: The axial force and radial forces of the impeller under different cavitation coefficients.
| Operating Condition | Frx/N | Fry/N | Fr/N | Fa/N |
|---|---|---|---|---|
| σ = 0.316 | −30.88 | −60.56 | 67.98 | −14,470.46 |
| σ = 0.079 | −21.91 | −75.41 | 78.53 | −17,036.35 |
| σ = 0.072 | −19.56 | −78.84 | 81.23 | −17,465.77 |
| σ = 0.063 | −29.93 | −81.01 | 86.36 | −18,124.03 |
| σ = 0.05 | −25.62 | −87.89 | 91.55 | −18,962.59 |
3.1.3 Inter-Blade Vapor Volume Fraction
Fig. 7 illustrates the vapor volume fraction distribution between impeller blades at the 0.9 lspan surface (close to the upper crown) under different cavitation coefficients. At σ = 0.316, no obvious vapor structures are observed within the flow passage of the impeller, serving as a reference condition for studying cavitation inception and development. When σ decreases to 0.079, due to local pressure reduction, cavitation first occurs at the exit position of blade suction surface and remains attached to the trailing edges of the blades. With further reduction of σ, the vapor volume fraction gradually increases, and the cavitation region expands on both suction surface and pressure surface, resulting in the connection and growth of vapor structures within the blade passage. When σ decreases to 0.05, severe cavitation develops, with vapor structures occupying a large portion of the outlet region of the inter-blade passage. When σ decreases from 0.063 to 0.05, the vapor volume increases by nearly 1.5 times, indicating that cavitation develops rapidly after reaching a certain cavitation stage. The increase in vapor volume corresponds to stronger blockage effects and deterioration of hydraulic performance.
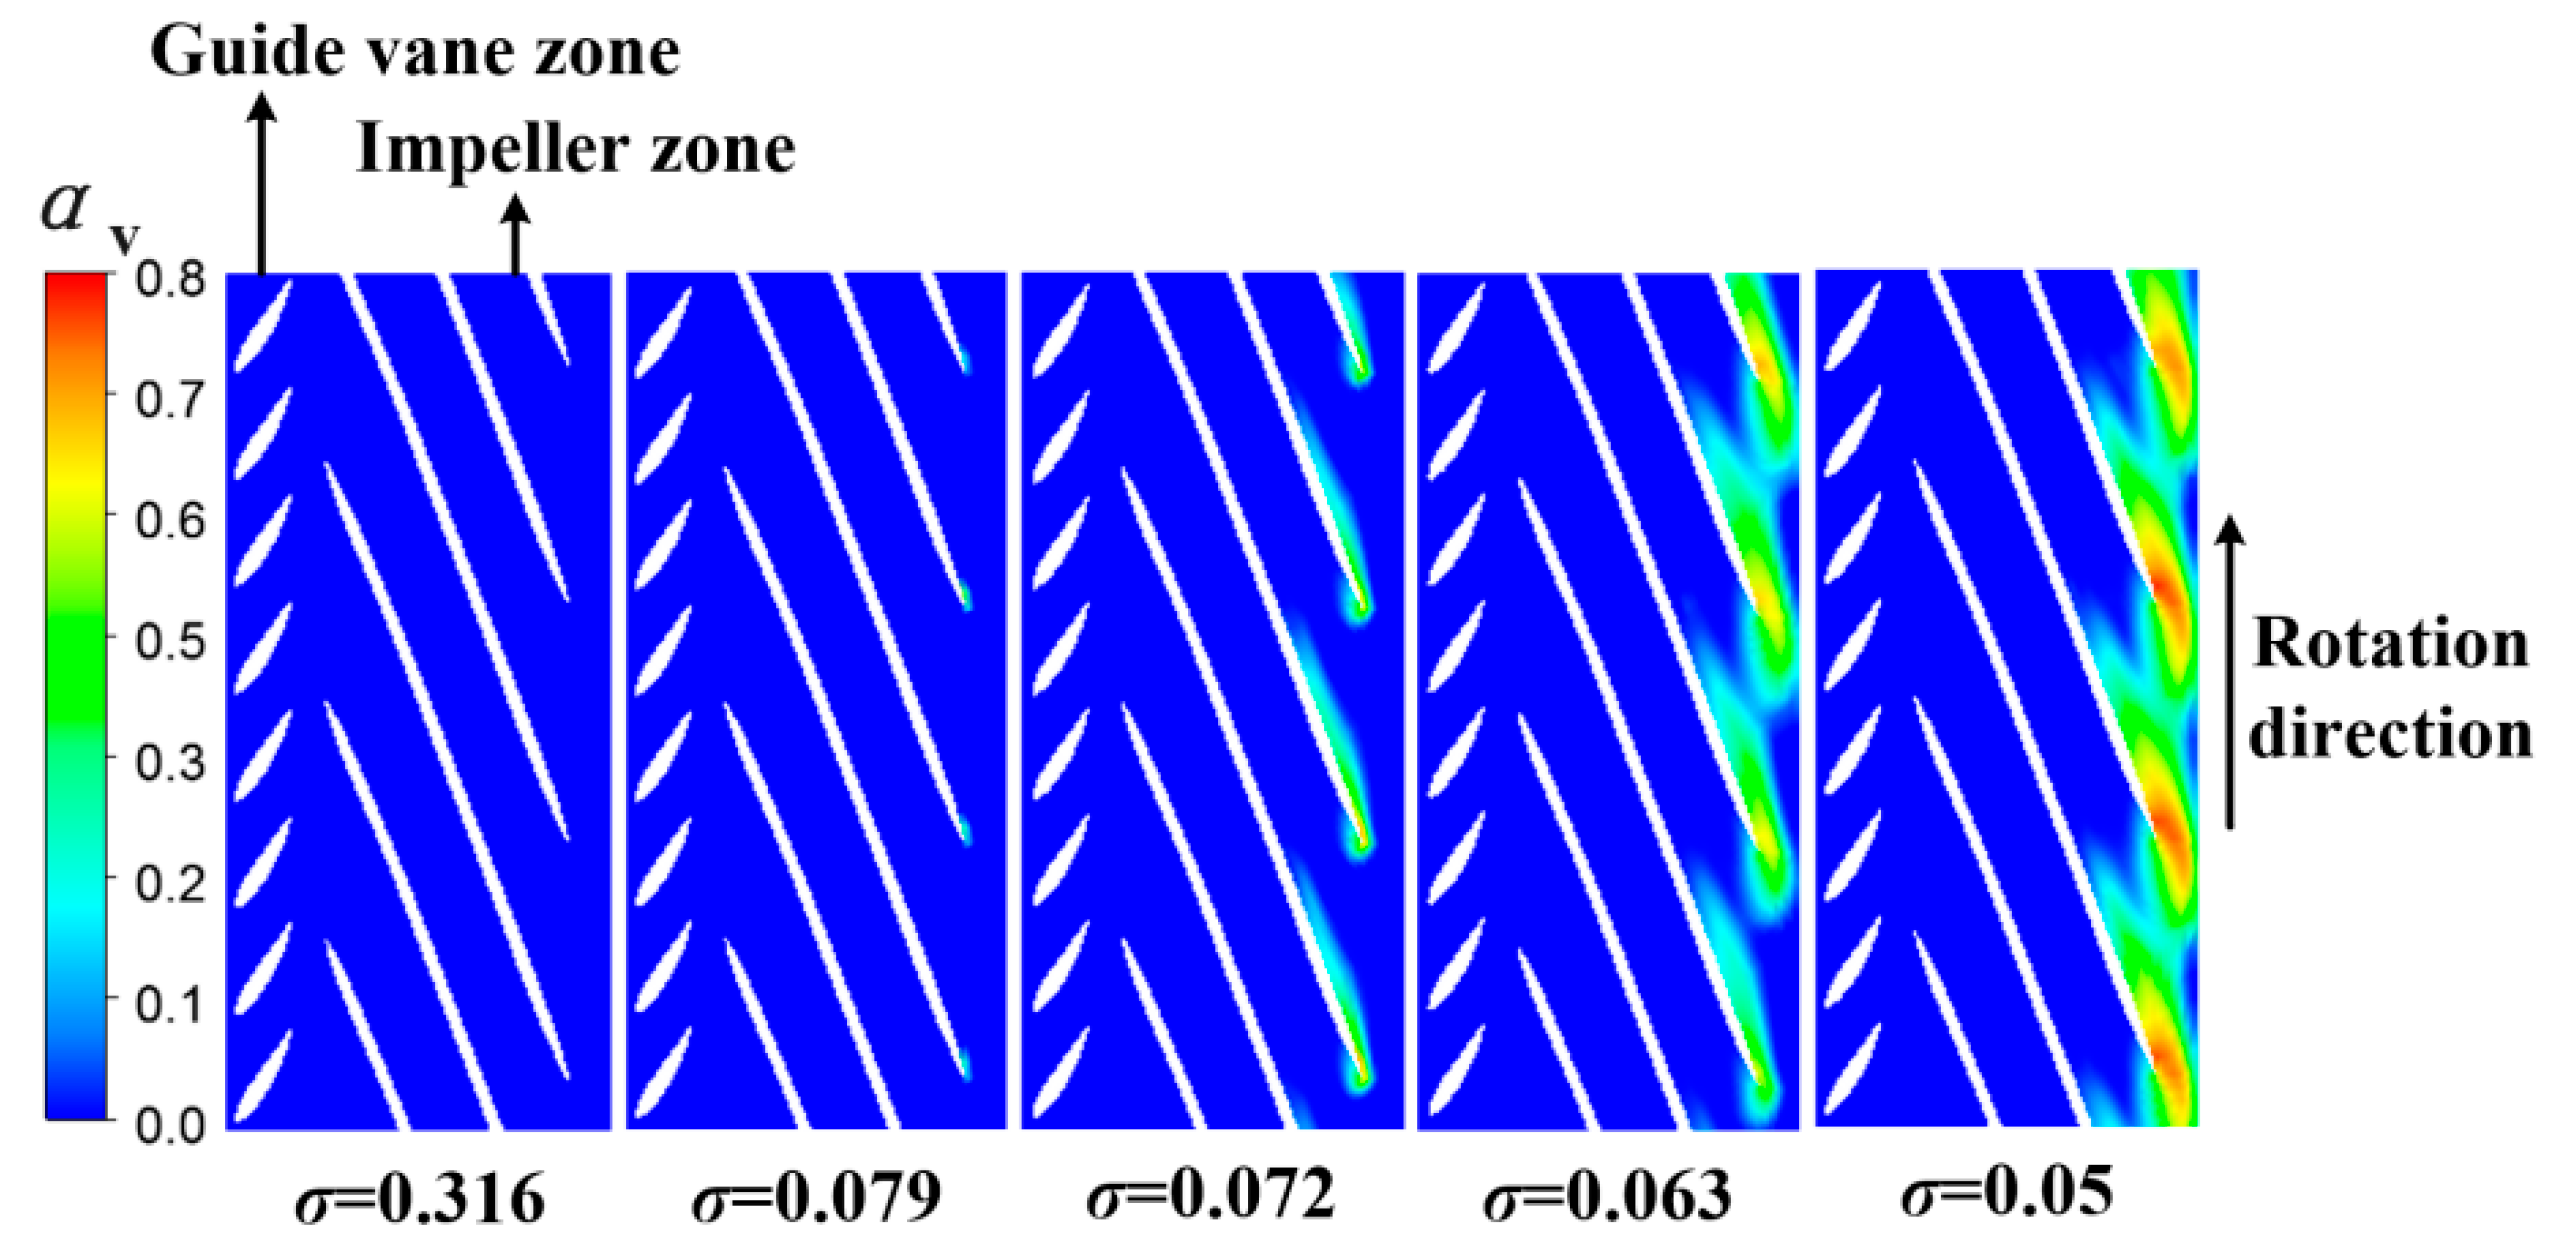
Figure 7: Vapor volume fraction in blade-to-blade view under different cavitation coefficients.
3.1.4 Turbulent Kinetic Energy
Turbulent kinetic energy (TKE) primarily originates from the time-averaged flow, and provides energy to the turbulence via the action of the Reynolds shear stress, reflecting the motion state of the turbulence. Fig. 8 displays the turbulent kinetic energy distribution for the middle cross-section (Z = 0 mm section) of guide vane and impeller channel under different cavitation coefficients. It can be observed that TKE gradually decreases along the flow direction from the inlet of the guide vane, followed by a sudden increase near the outlet of impeller. The strong flow interaction and complex secondary flow structures are accompanied by enhanced flow instability, making the region more prone to higher turbulence intensity. Owing to the disturbance effect, the flow at the outlet of impeller tends toward an unstable state. As the cavitation coefficient decreases, the TKE continuously increases, indicating that the intensification of cavitation promotes more vigorous turbulent motion in both the guide vane and runner regions. This increase is attributed not only to the development of cavitation itself but also to the enhanced flow separation and the unsteady interactions between the liquid and vapor phases. Furthermore, the collapse of vapor structures induces strong local disturbances, which further enhance turbulence production and consequently lead to increased hydraulic energy losses.
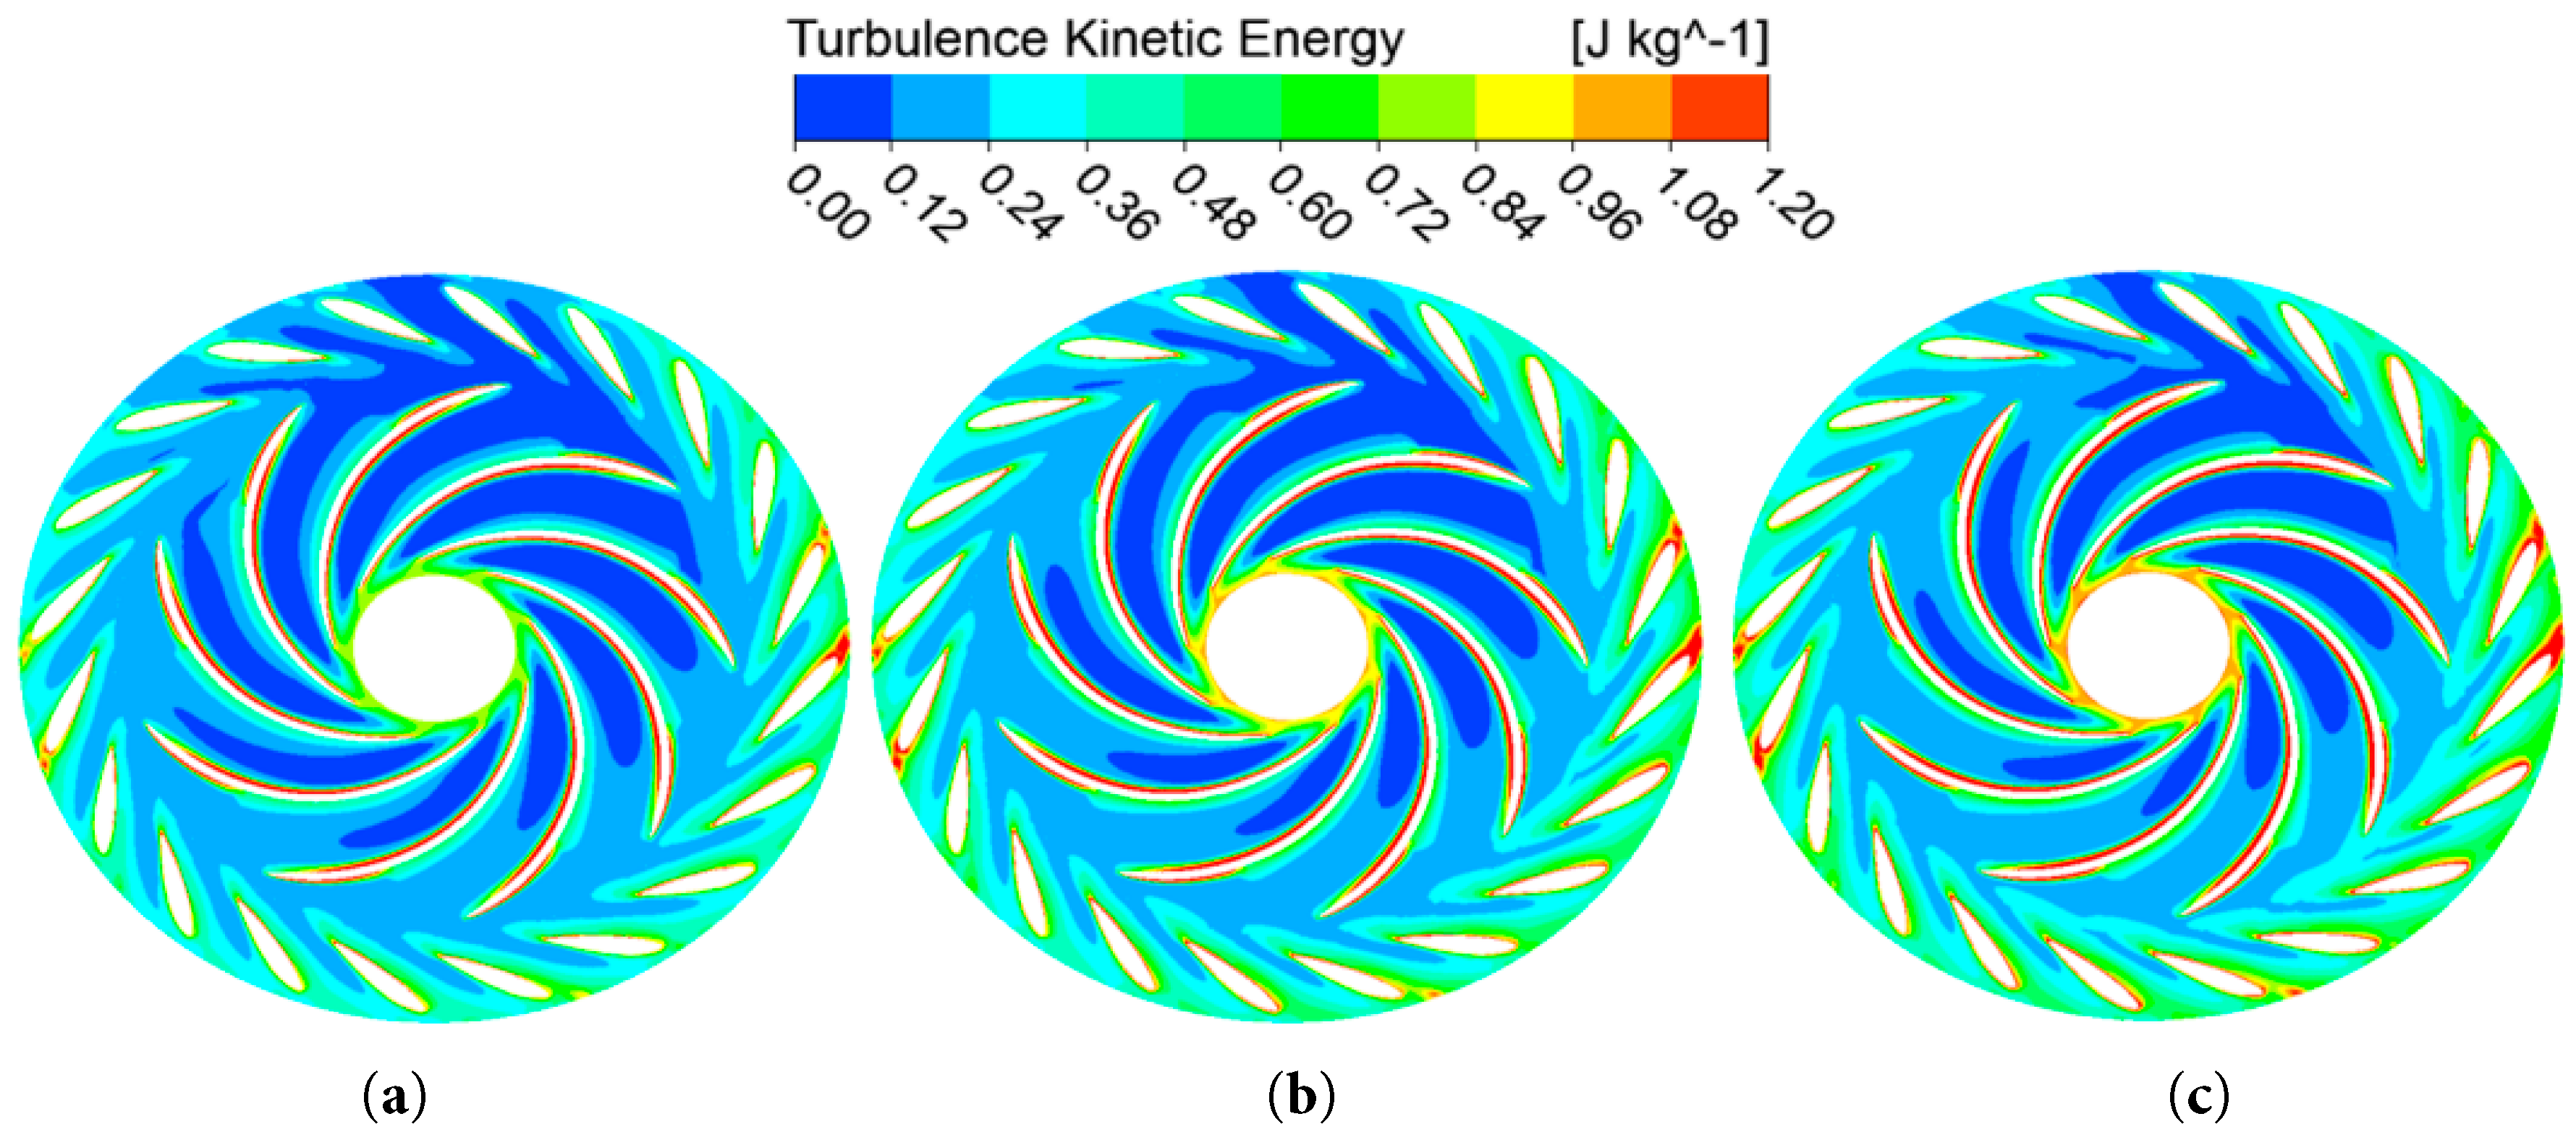
Figure 8: Turbulent kinetic energy distribution of the guide vane and impeller at the Z = 0 mm cross-section: (a) σ = 0.316, (b) σ = 0.079, (c) σ = 0.05.
3.2 Flow Field in the Draft Tube Zone
Fig. 9 presents the pressure distribution contours for cross-section at Y = 0 mm in the draft tube zone under different cavitation coefficients. The pressure around the inlet wall of draft tube is relatively low. This is attributed to the cavitation bubbles generated near the lower band at the impeller outlet, where local pressure drops below the vaporization pressure of 3540 Pa, causing a subsequent decline in the surrounding pressure. The pressure distribution within the draft tube is suboptimal and exhibits poor axial symmetry, indicating that the flow state moving downstream within the draft tube under cavitation conditions is unstable. Since the cavitation coefficient is reduced by decreasing the draft tube outlet pressure, the overall pressure level in the flow passage is inevitably affected. However, the local pressure redistribution is also influenced by cavitation-induced disturbance, including vapor generation and flow instability. Therefore, the pressure variation in the draft tube results from the combined effects of outlet pressure reduction and cavitation development.
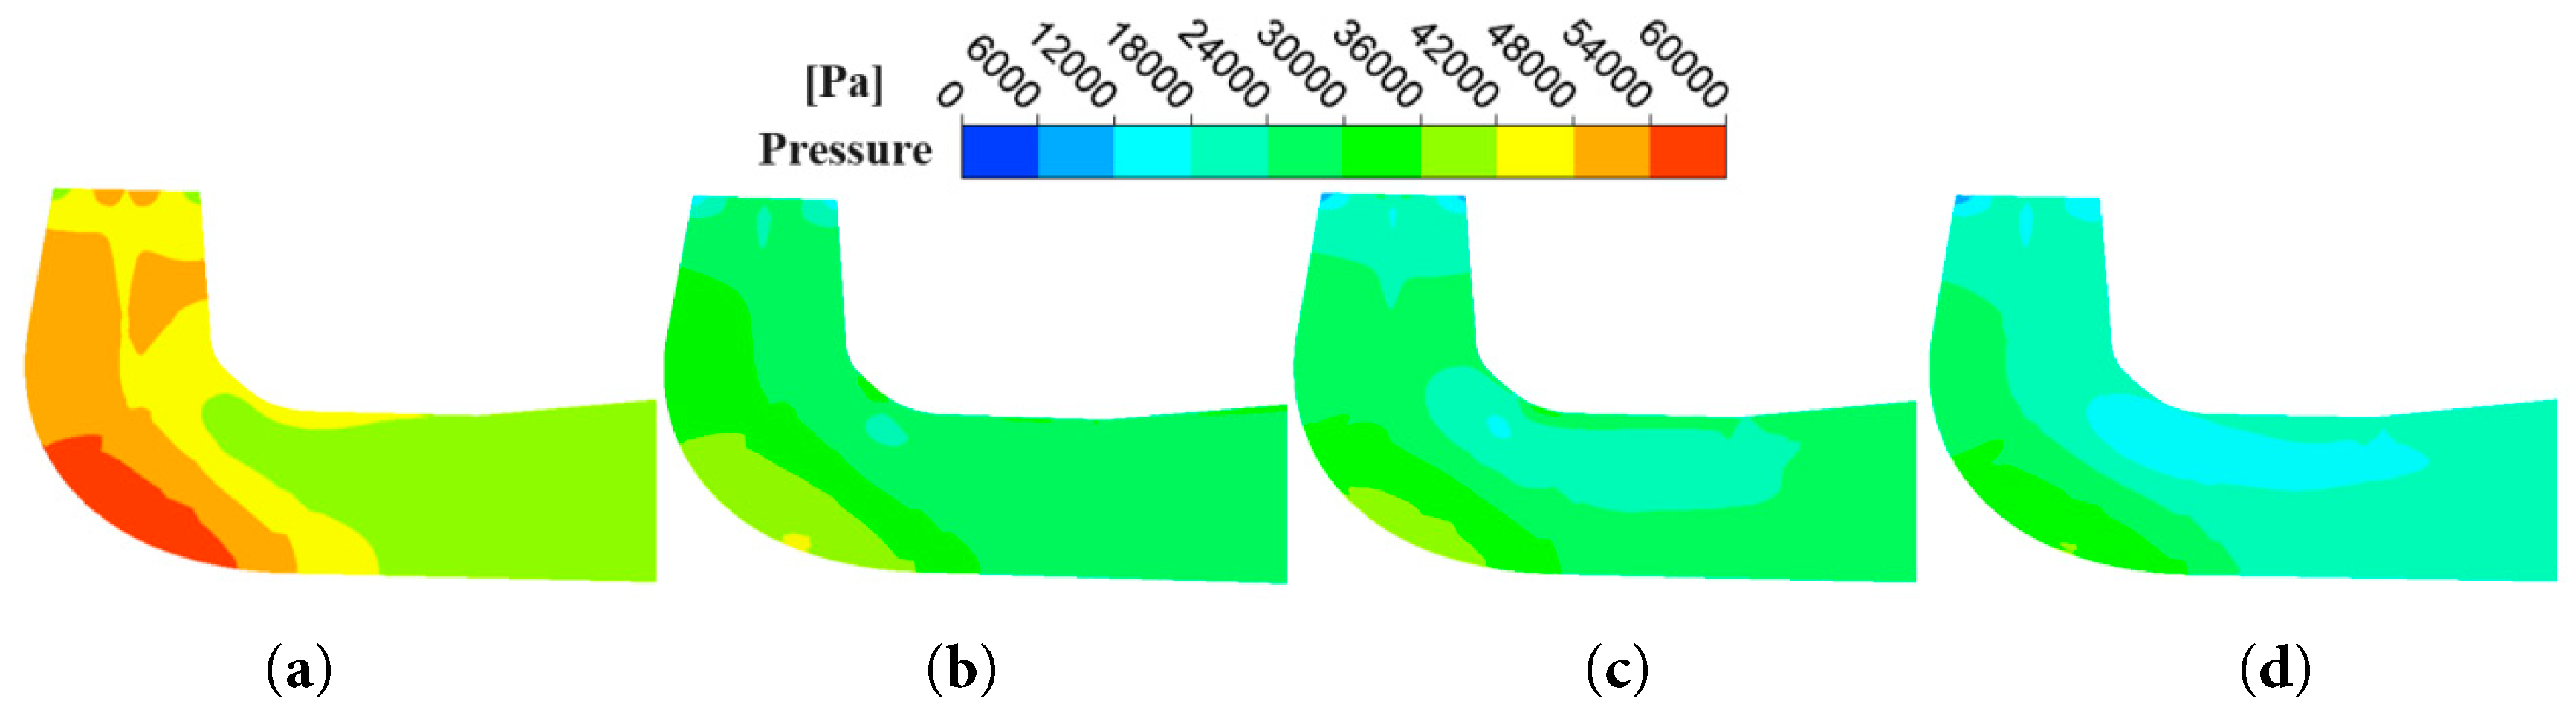
Figure 9: Pressure distribution in the draft tube at Y = 0 mm cross-section under different cavitation coefficients: (a) σ = 0.079, (b) σ = 0.072, (c) σ = 0.063, (d) σ = 0.05.
Fig. 10 presents the streamline distribution in the draft tube under different cavitation coefficients. The streamlines at the inlet of draft tube are relatively uniform, without showing flow characteristics similar to cavitation vortex ropes. As the flow continues to move downstream along the flow direction, the flow pattern gradually becomes more disordered. Part of the flow spirals downward in a helical pattern, and during this process, it easily impinges on the wall, triggering intense pressure fluctuation. This indicates that the occurrence and development of cavitation adversely affect the stability of the flow system. As the cavitation coefficient decreases, the flow condition in the flow channel gradually deteriorates. When σ decreases to 0.063, secondary backflow appears near the outer side of the elbow. With a further decrease in σ, the backflow area expands, which obstructs the forward movement of part of the water flow. At this point, the mutual impingement of water flows results in more severe pressure fluctuation amplitudes in the draft tube.
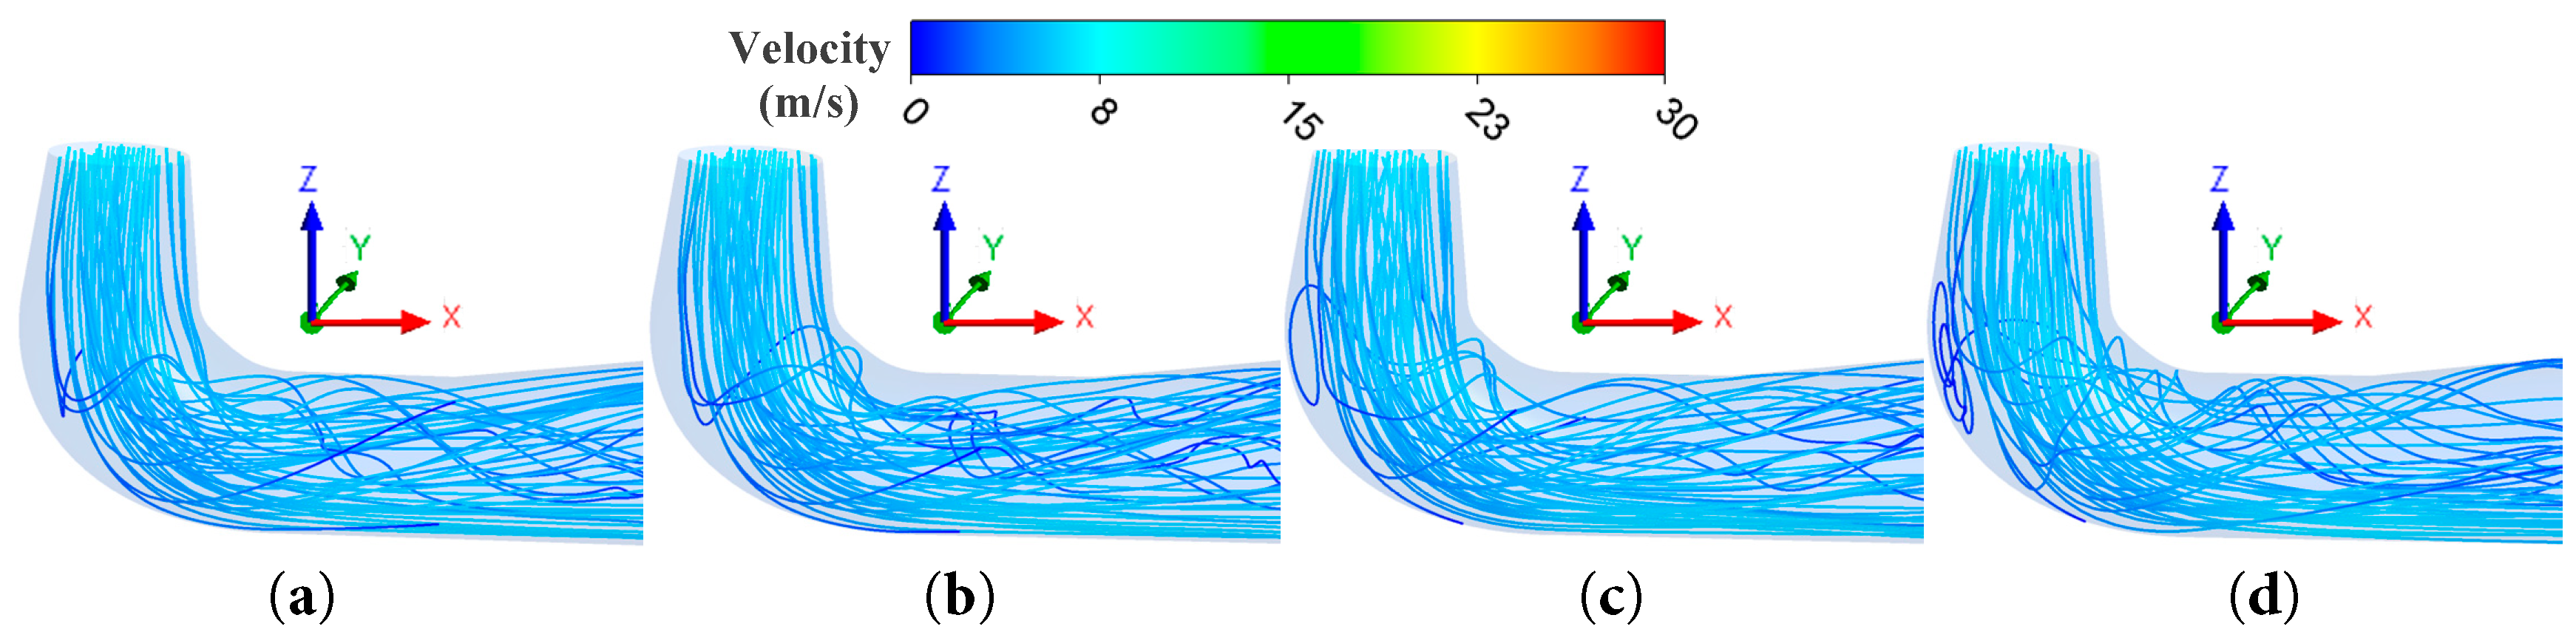
Figure 10: Streamline distribution in the draft tube under different cavitation coefficients: (a) σ = 0.079, (b) σ = 0.072, (c) σ = 0.063, (d) σ = 0.05.
3.3 Pressure Fluctuation Analysis
3.3.1 Monitoring Point and Relative Amplitude
To comprehensively analyze the characteristics of pressure fluctuation throughout the whole flow channel, eight pressure monitoring points (P1-P8) were strategically positioned along the flow direction. These include locations at the inlet of spiral casing, the zone behind the guide vane and in front of the impeller, the upstream section at the upper cone of draft tube, and the inner and outer sides of the elbow pipe. The specific positions of each monitoring point are illustrated in Fig. 11. The schematic diagram of pressure monitoring points is presented on the middle cross-section of the flow passages. Except for P7 and P8, which are arranged on the pipe wall, all other monitoring points are located inside the flow passage. Specifically, P1 and P6 are placed at the center of the cross-sections of the spiral casing and draft tube, respectively. The pressure fluctuation signals were recorded after the flow field reached a statistically stable state to ensure the reliability of the frequency-domain analysis. The sampling frequency was set to 6324 Hz, and the pressure data were collected continuously for 10 rotational cycles, corresponding to a total sampling duration of 0.5693 s. The FFT analysis was performed using 3600 sampling points, resulting in a frequency resolution of 1.76 Hz.
During an unsteady simulation, the time-dependent static pressure data at each monitoring point were recorded. Spectral analysis of these data was subsequently performed using ORIGIN software. A dimensionless parameter, termed the relative amplitude, was introduced to quantify the intensity of static pressure fluctuation at each monitoring point.
The pressure signals were processed using a 97% confidence level criterion, and the peak-to-peak value of the pressure fluctuation signal was extracted and normalized by the total head. The corresponding expression of the relative amplitude is given in Eq. (11).
In the equation,
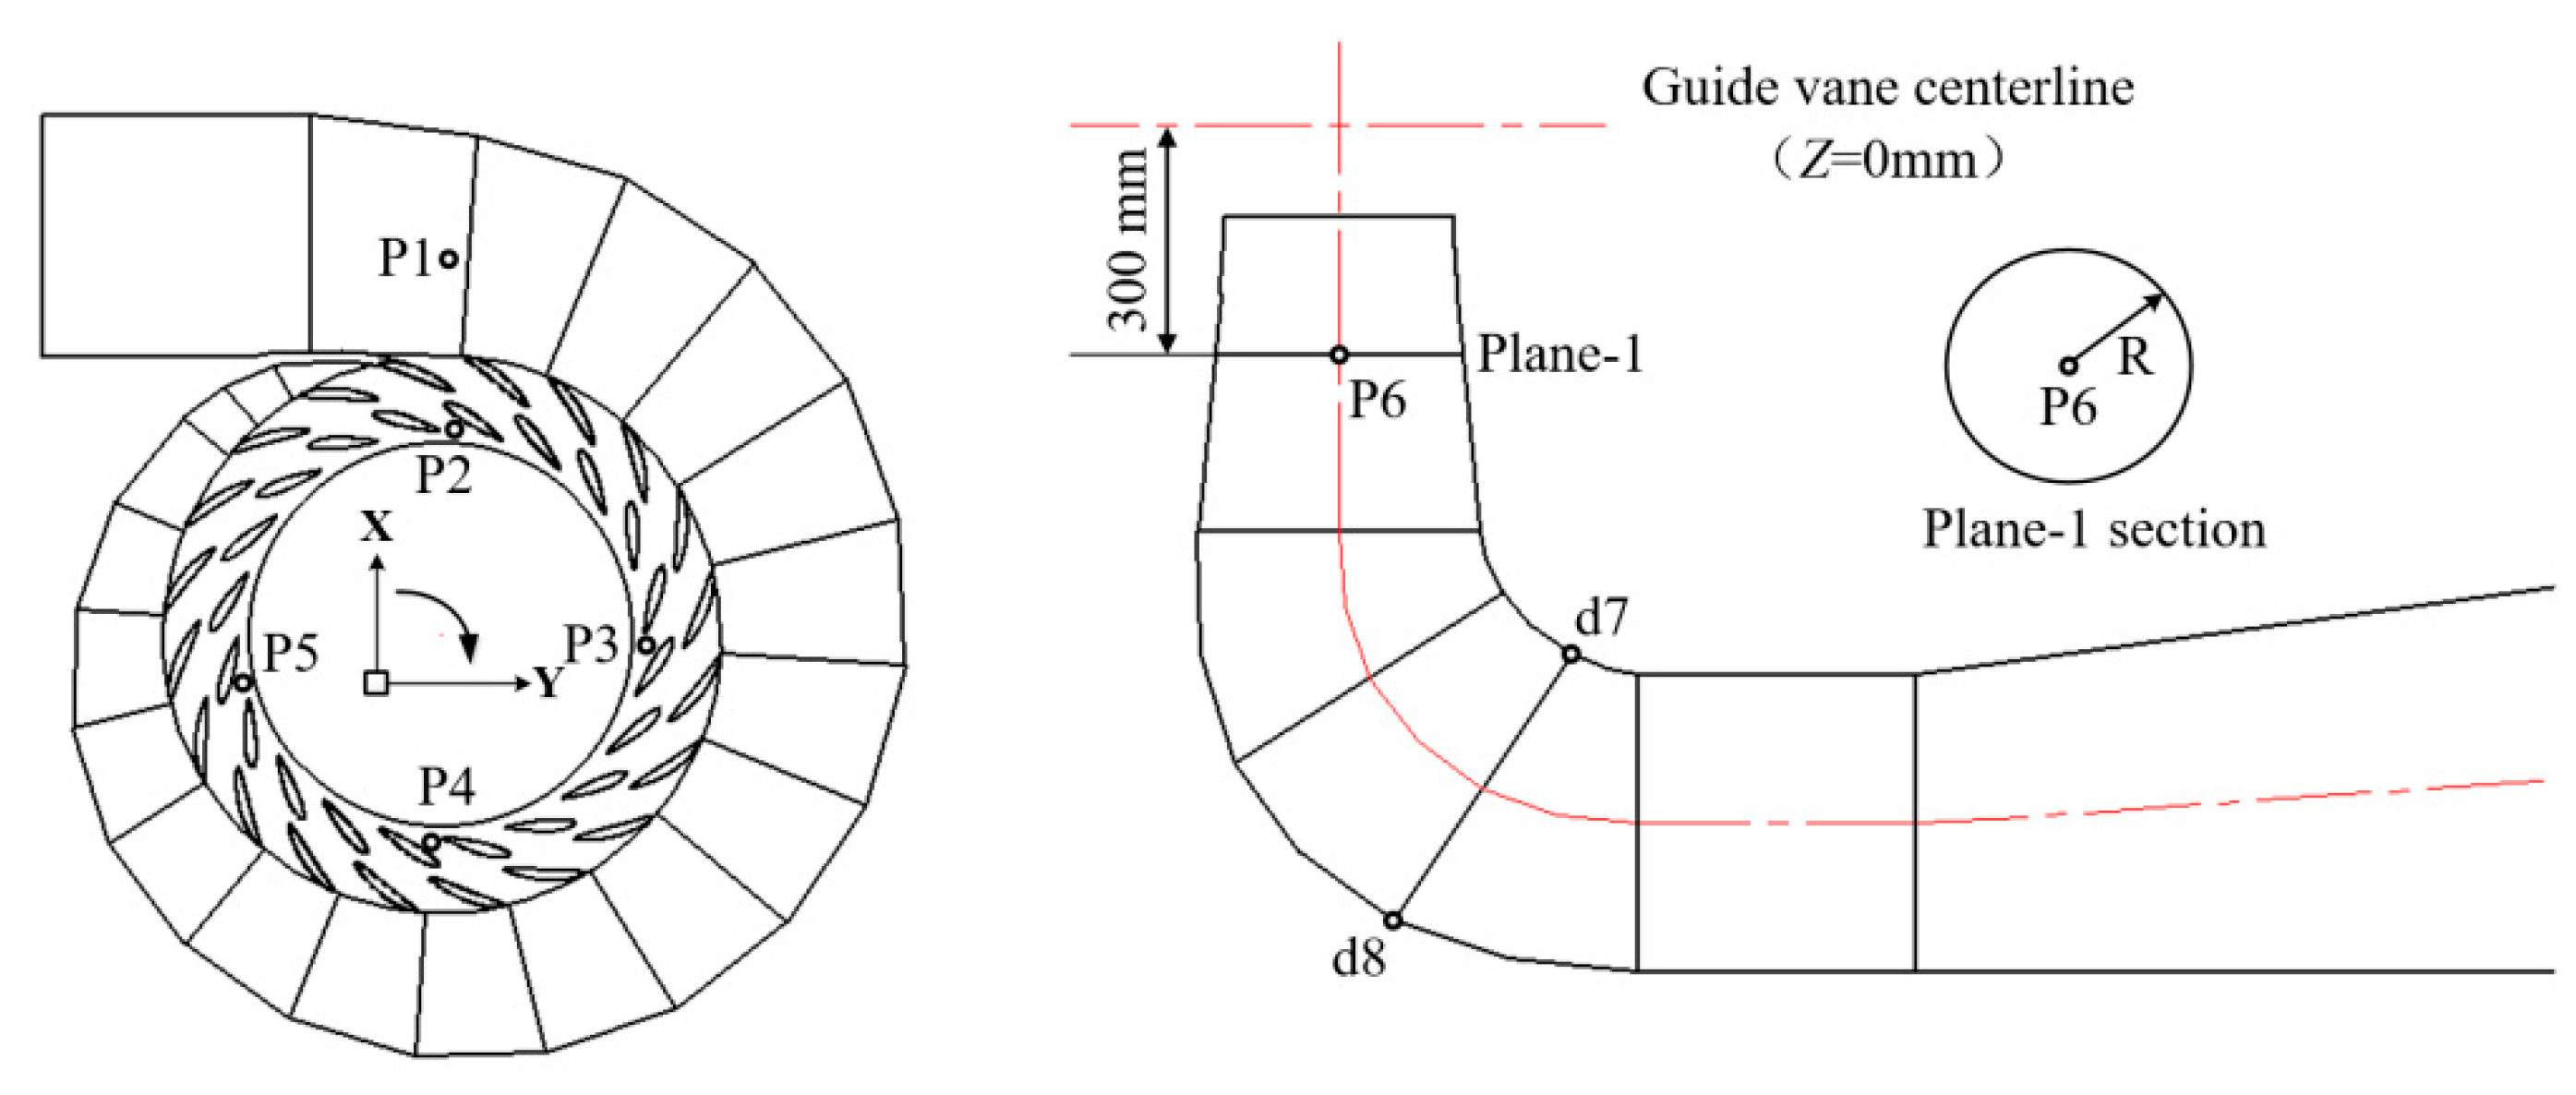
Figure 11: Schematic of the positions of monitoring points P1-P8.
Fig. 12 presents a comparison of the relative amplitudes obtained from experimental measurements and numerical simulation at the monitoring points of different hydraulic components. The variation trend of pressure fluctuation along the flow direction predicted by the CFD simulation is generally consistent with the experimental results. The maximum and minimum relative amplitudes occur at the zone behind the guide vane and in front of the impeller, and in the spiral casing, respectively. To quantitatively evaluate the reliability of the numerical predictions, the dimensionless relative error δ was introduced, which is defined as follows:
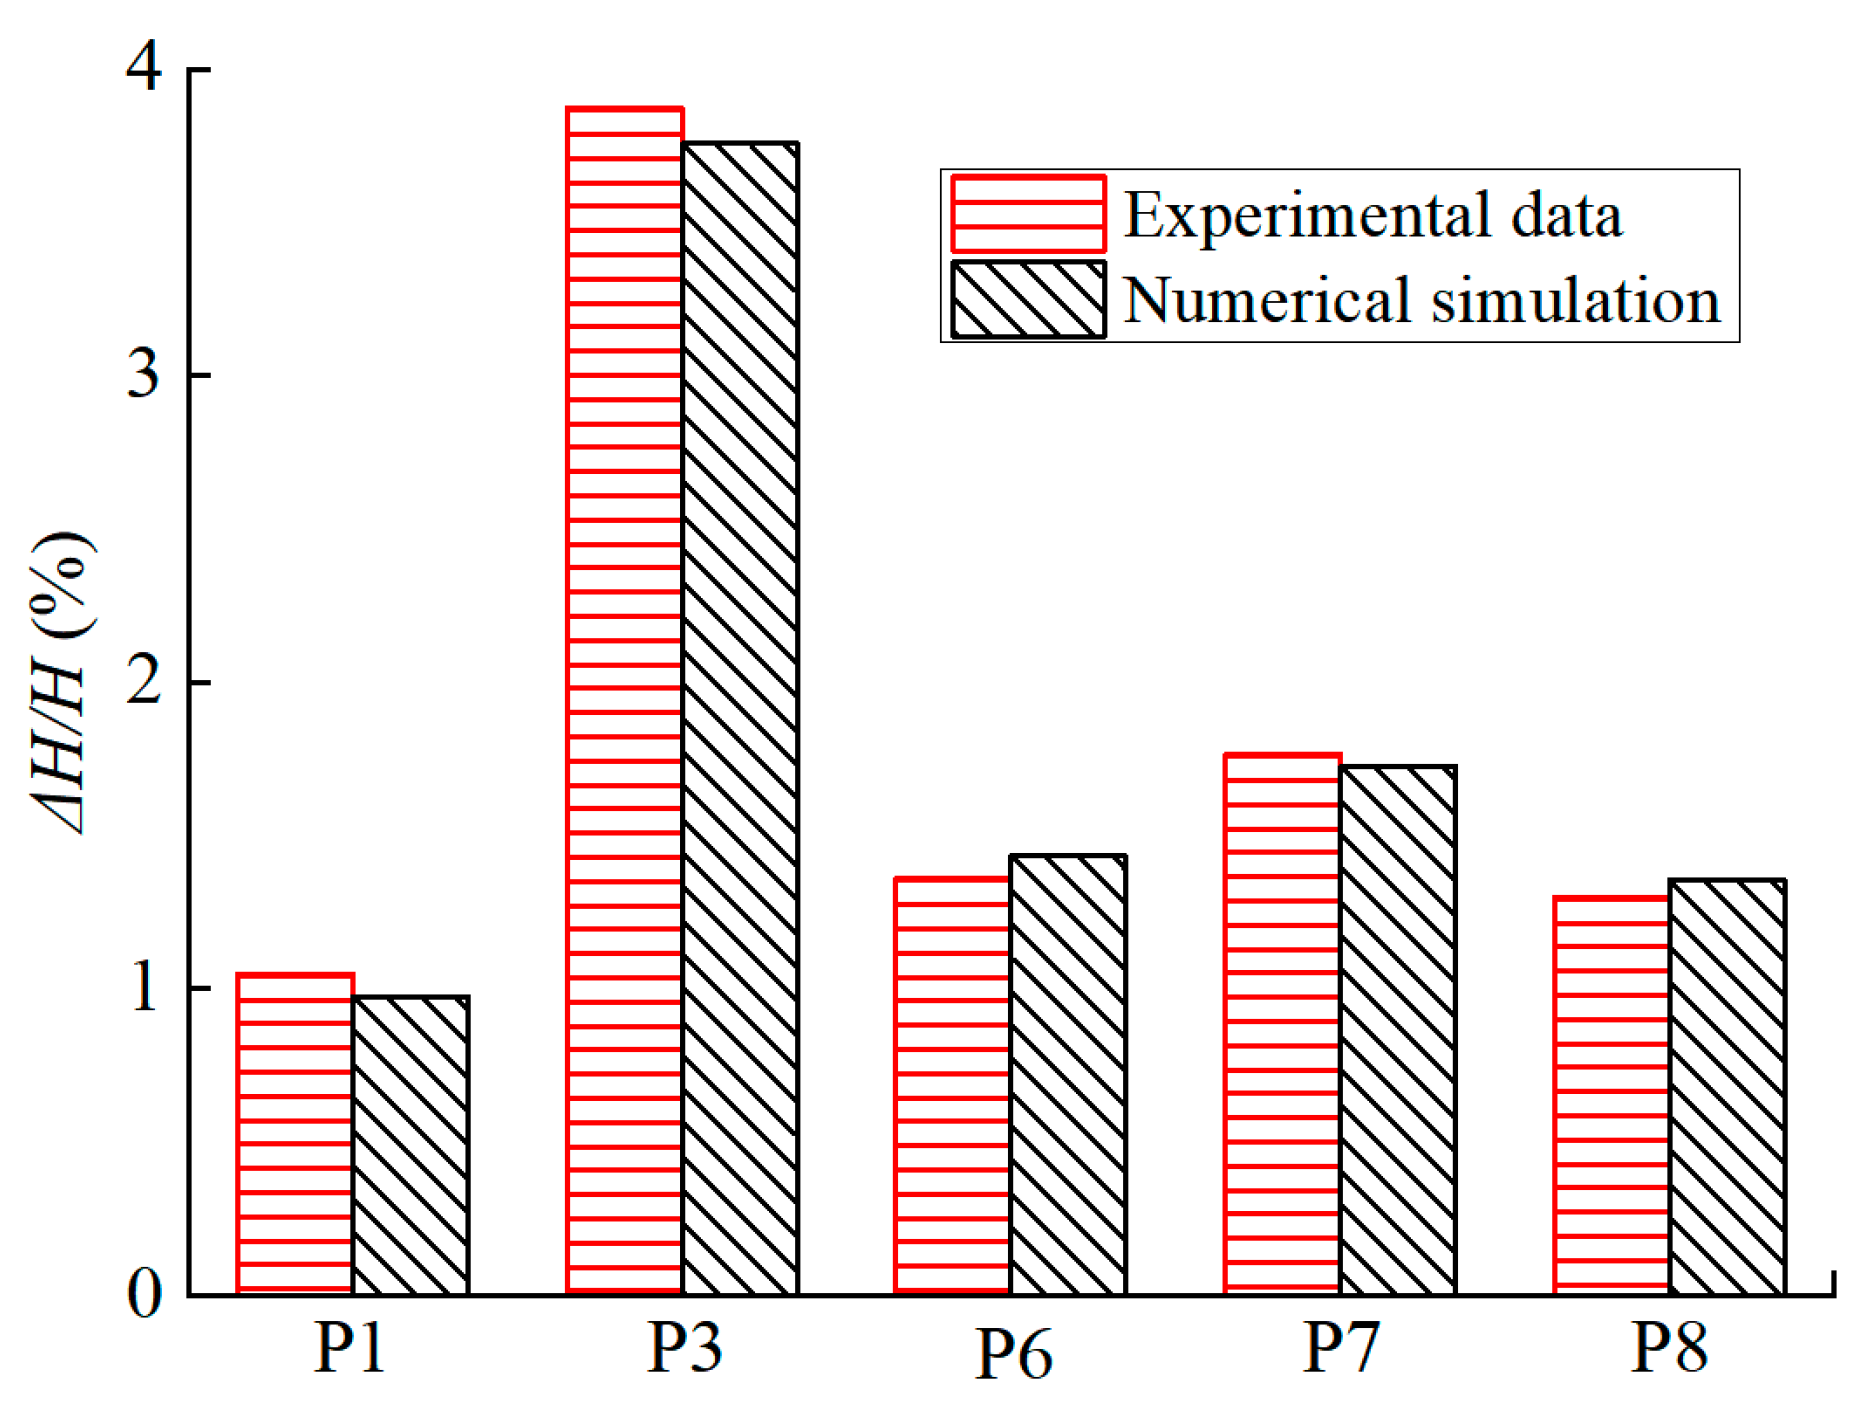
Figure 12: Comparison of the measured and numerically predicted relative amplitude.
Fig. 13 shows the relative amplitudes of pressure fluctuation at monitoring points P1-P8. It can be seen that the maximum values of ∆H/H occur at points P2-P5, located behind the guide vane and in front of the impeller. This phenomenon is attributed to the rotating impeller cutting through the wake flow close to the outlet of guide vane, which causes flow disturbance and intense pressure fluctuation. The next highest amplitudes are observed at the inner side at the elbow section of draft tube. This is due to the dramatic transition in flow direction in the elbow section, leading to water impact against the wall and the formation of vortices. Furthermore, the non-axial flow at the impeller outlet creates a swirling flow in the draft tube, which can develop into a spiral vortex rope under severe conditions. This results in flow instability and significant fluctuation, explaining the relatively large ∆H/H value at monitoring point P6 in the upstream of cone pipe. In contrast, the amplitudes at the inlet of spiral casing (P1) and the outer side of the elbow pipe (P8) are comparatively lower, as these locations are less affected by rotor-stator interference.
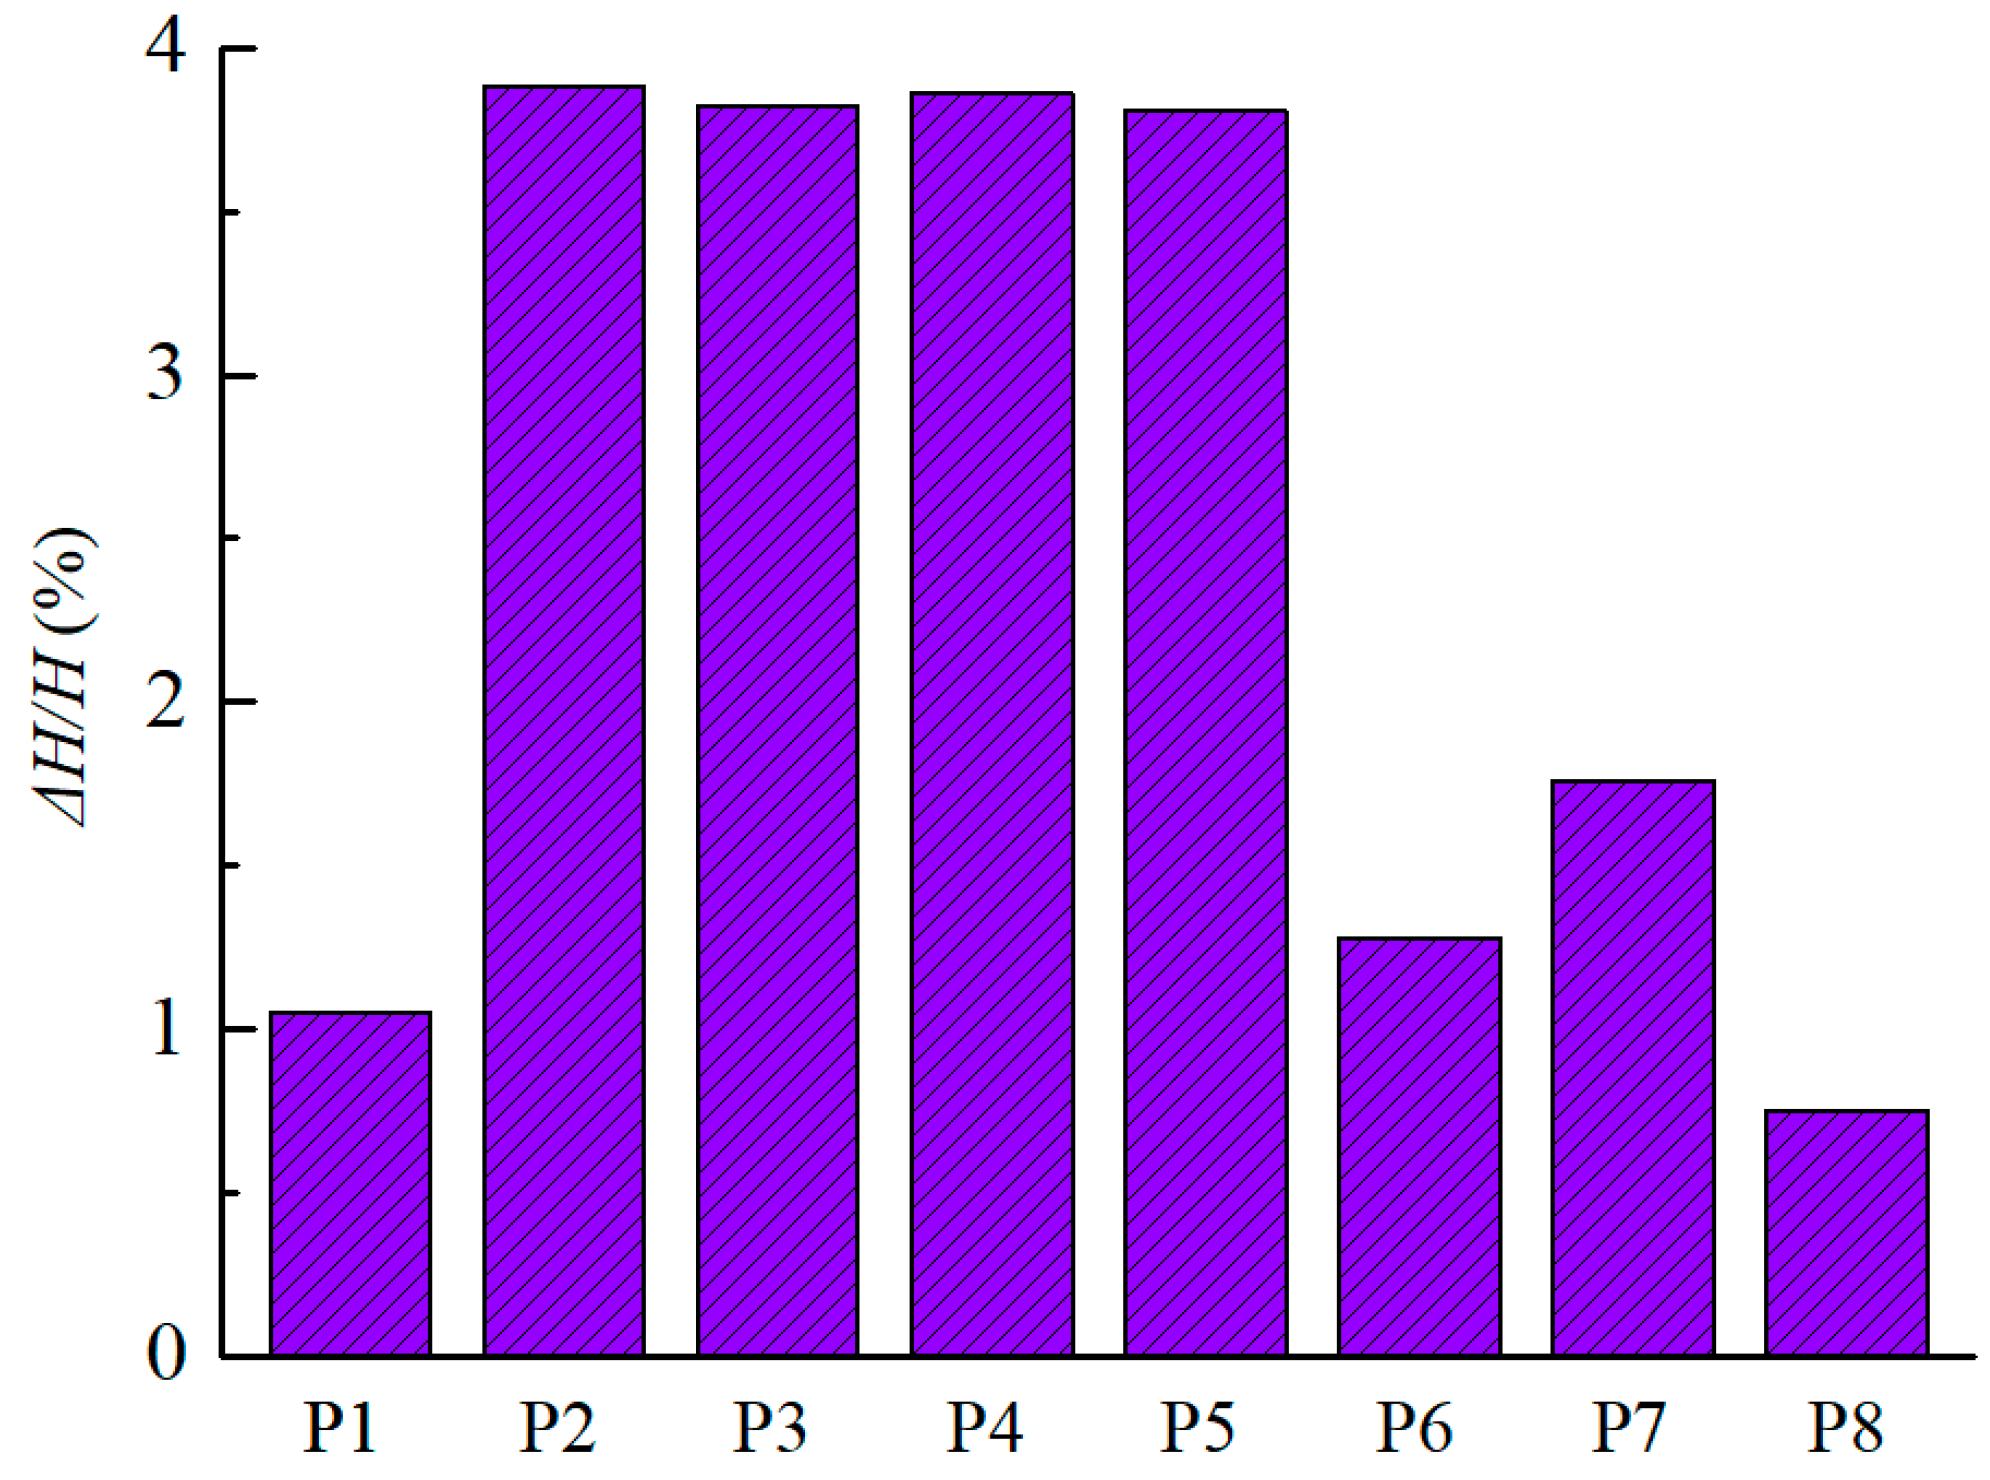
Figure 13: The relative amplitude of pressure fluctuation at monitoring points P1–P8.
Since large pressure fluctuations were observed in the vaneless region, and vortex structures in the draft-tube cone are closely associated with low-frequency pressure fluctuations [3,21], monitoring points P3 and P6 were selected for detailed analysis. Fig. 14 presents the time- and frequency-domain results at P3, Fig. 15 compares the frequency spectra at P3 under different cavitation coefficients, and Fig. 16 presents the frequency spectra at P6, where the runner rotational frequency fn equals 18.12 Hz.
3.3.2 The Vaneless Zone behind the Guide Vane and in Front of the Impeller
Taking the pressure fluctuation of monitoring point P3 at σ = 0.079 as an example, the time-domain and frequency-domain characteristics in the vaneless zone are analyzed during a stable period. As depicted in Fig. 14, the time-domain spectrum of monitoring point P3, located in the vaneless zone behind the guide vane and in front of the impeller, exhibits distinct periodic variations. This phenomenon is attributed to the rotor-stator interaction between the rotating impeller and the stationary guide vane, which affects the vaneless zone. The impeller blades periodically cut through the water flow at the outlet of the guide vane, resulting in unsteady flow within the impeller. Consequently, the number of pressure peaks and valleys occurring within a cycle is related to the number of impeller blades. This is attributed to the periodic rotor-stator interaction, where each blade passing through the guide vane wake generates a pressure disturbance. Therefore, the dominant fluctuation frequency corresponds to the blade passing frequency, fBPF = Zbfn, where Zb is the impeller blade count. Through analysis, it was obtained that the predominant frequency of pressure pulsation in the vaneless zone behind the guide vane is blade passing frequency (BPF), which is approximately 9 times the impeller rotating frequency (9 fn), and the corresponding amplitude reaches 8.08 kPa. Additionally, harmonic components such as 18 fn, 27 fn, 36 fn, 45 fn, and 54 fn are also present in this region, but their amplitudes are relatively small compared to the BPF, showing a decreasing trend in sequence. This frequency-amplitude relationship of pressure fluctuation in the zone behind the guide vane and in front of the impeller indicates that the rotor-stator interaction between the impeller blade and the guide vane has a significant influence on the internal flow field. Furthermore, the impeller rotating frequency (fn) is also observed in this zone, suggesting that pressure fluctuation is caused by the rotation of the unit’s main shaft. Each rotation of the impeller induces periodic changes in pressure, with an amplitude of approximately 1 kPa.
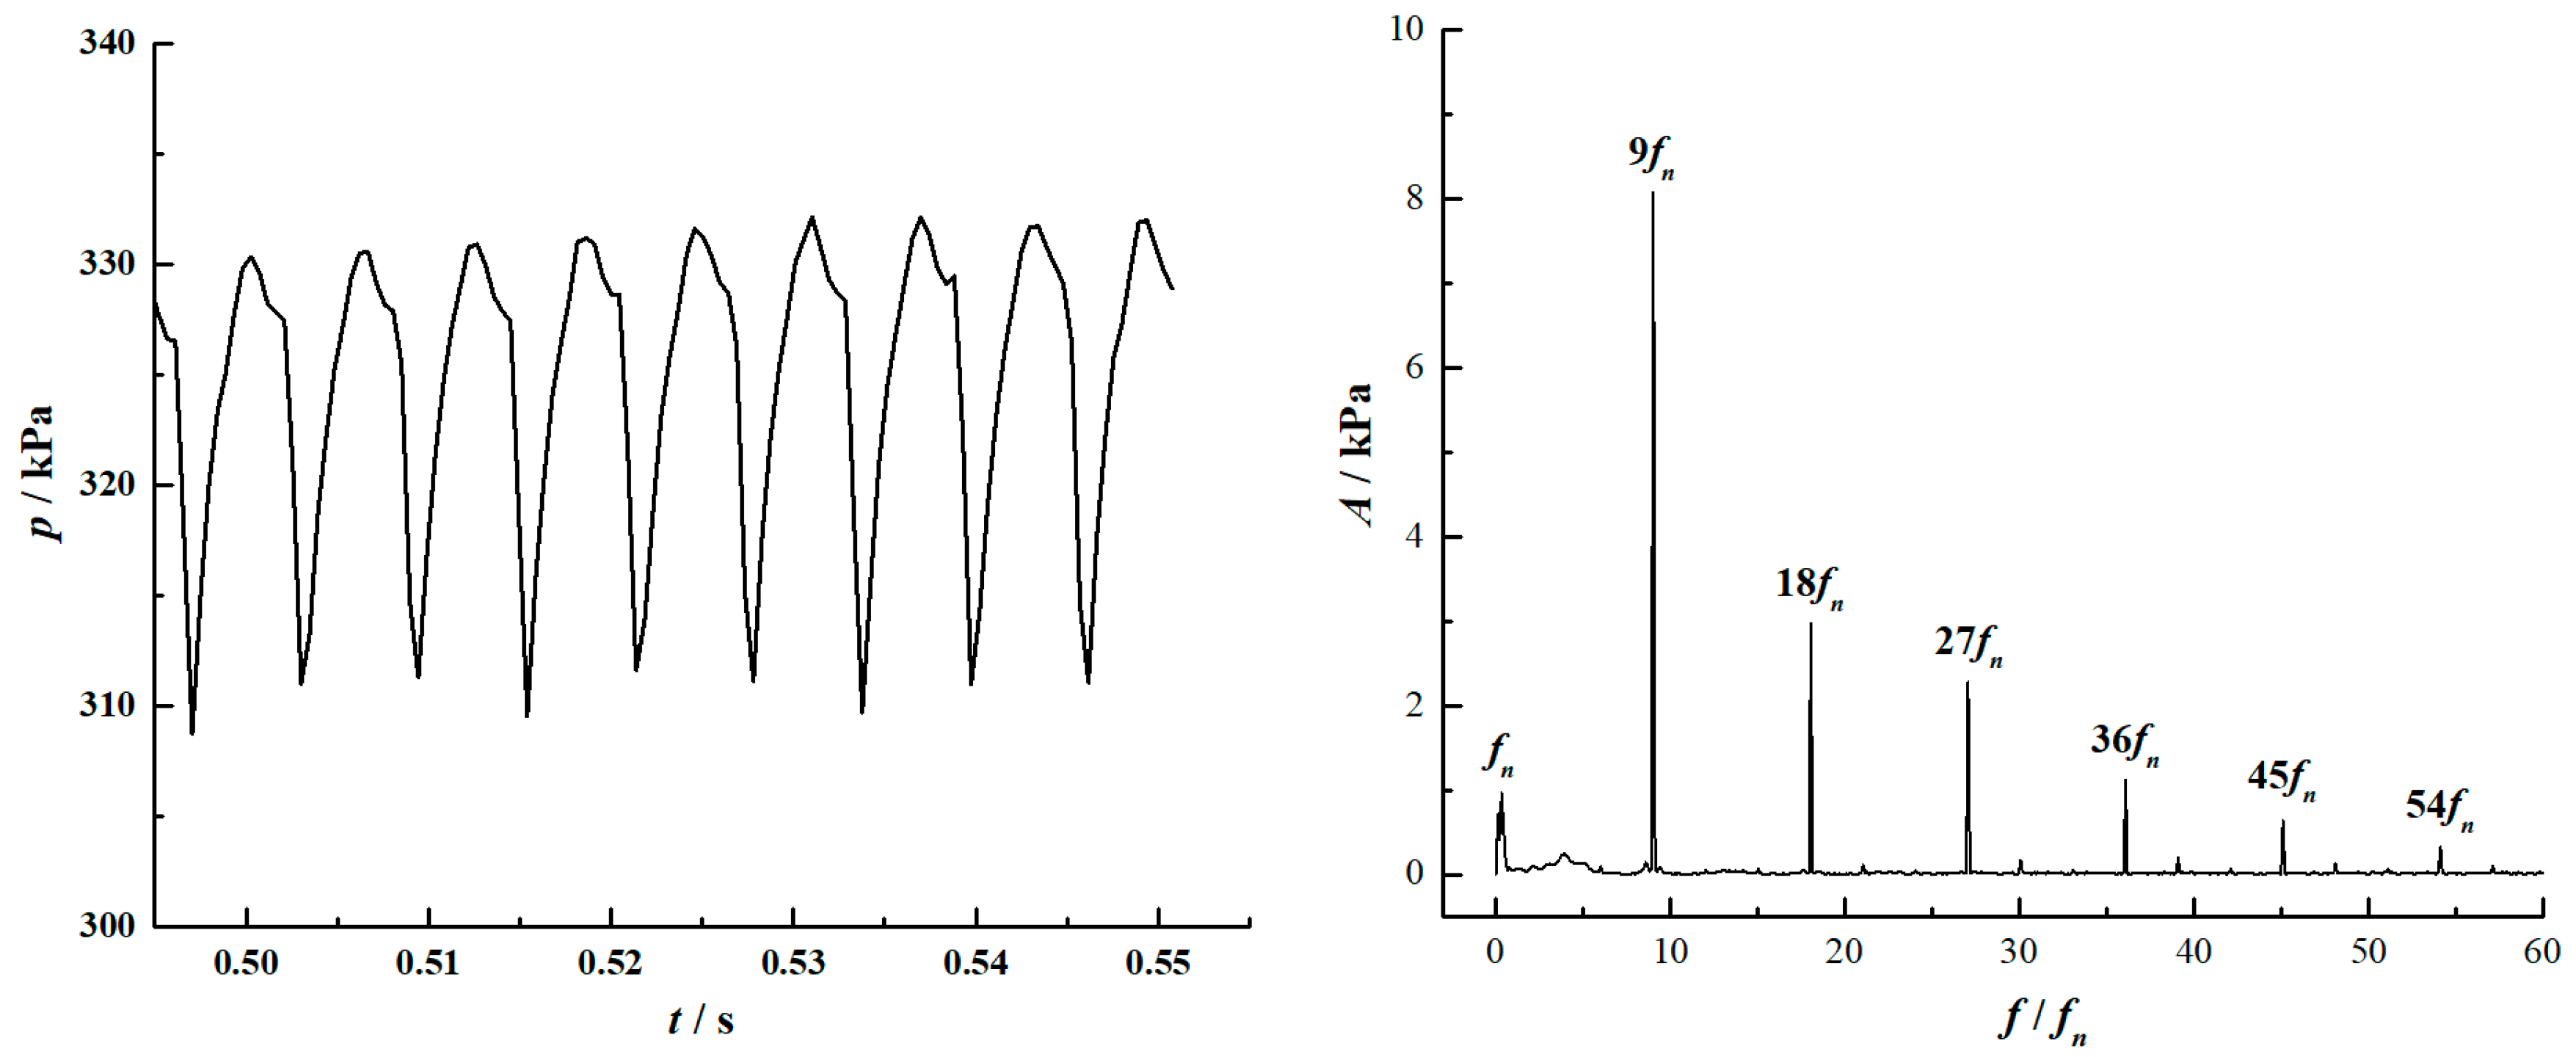
Figure 14: The time domain (left) and frequency domain (right) at monitoring point P3.
To investigate the influence of the cavitation coefficient on pressure fluctuations in the vaneless region between the guide vane outlet and the runner inlet, Fig. 15 presents the frequency spectra of monitoring point P3 under different cavitation coefficients. The pressure fluctuation is dominated by the runner rotational frequency (fn), the blade passing frequency (BPF, 9 fn), and their harmonics, indicating that the frequency distribution remains essentially unchanged with decreasing cavitation coefficient. The dominant peak located at the blade passing frequency and its harmonics provides direct evidence of rotor-stator interaction. However, as the cavitation coefficient decreases, the amplitudes of the characteristic frequencies increase progressively. This enhancement is attributed to the development of cavitation, during which the growth and collapse of vapor structures introduce additional pressure disturbances and intensify hydraulic instability within the runner. These disturbances propagate upstream into the vaneless region, resulting in progressively stronger pressure pulsation. Therefore, the pressure fluctuation characteristics in the vaneless region are jointly governed by rotor–stator interaction and cavitation evolution.
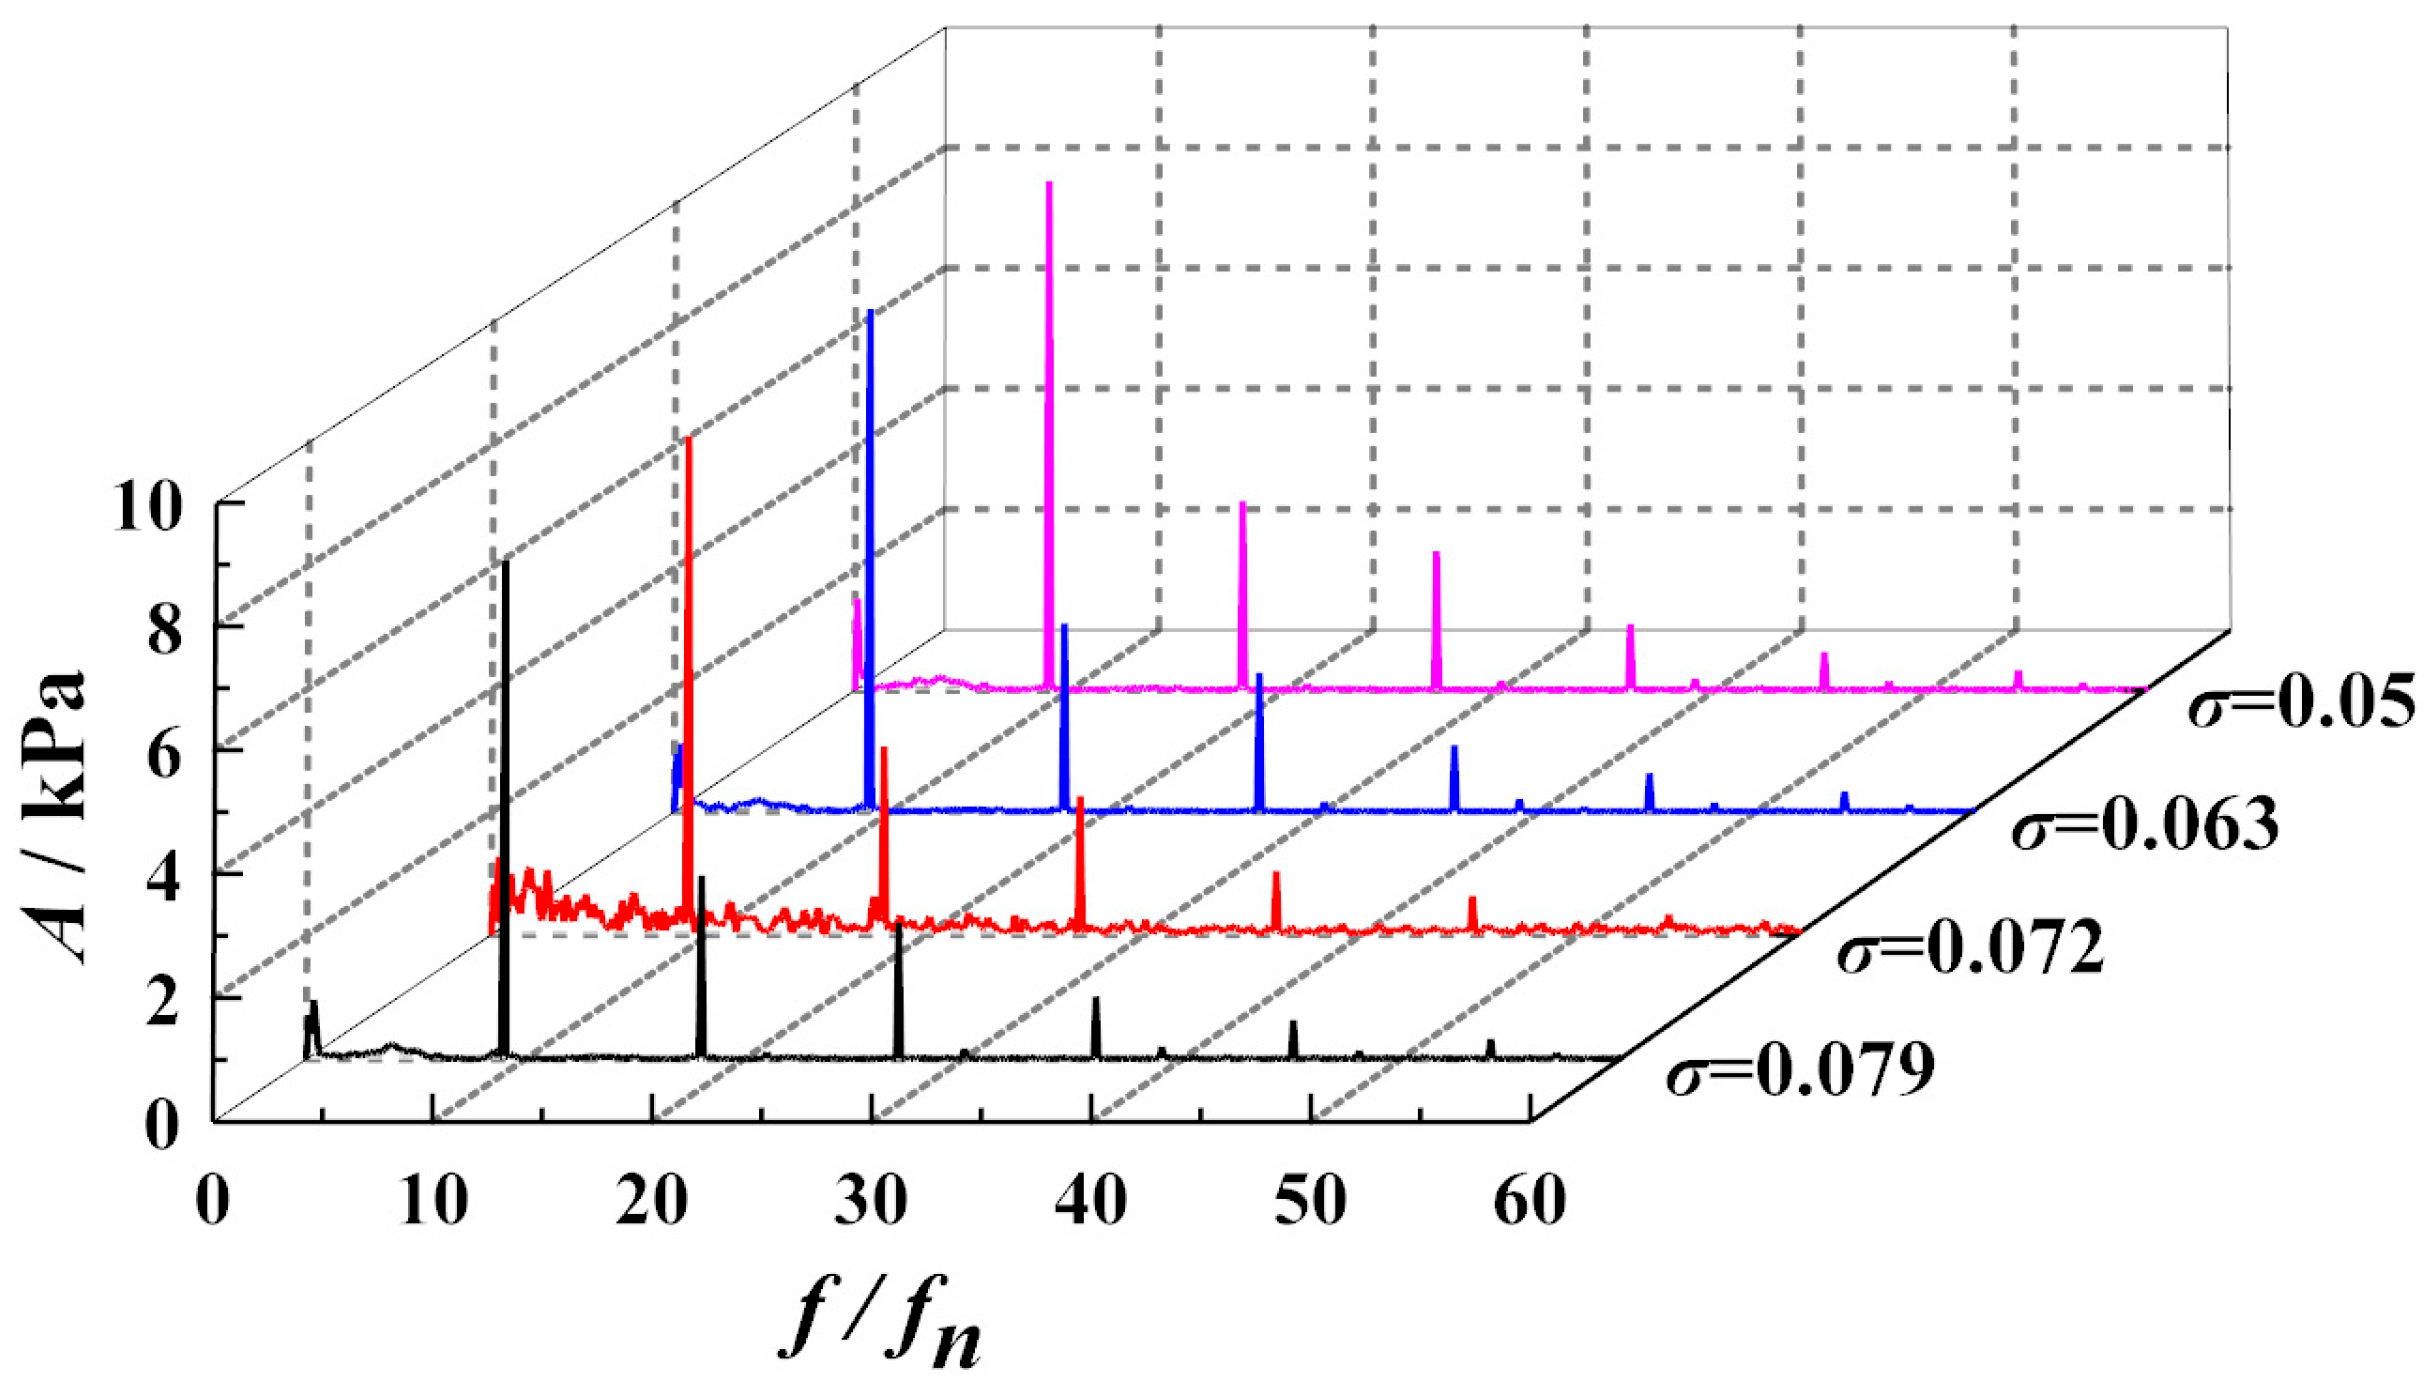
Figure 15: The frequency domain at monitoring point P3 under different cavitation coefficients.
The frequency-amplitude distribution characteristics at monitoring point P6 located at the inlet of draft tube are shown in Fig. 16. Under various cavitation coefficients, the pressure fluctuation at point P6 is dominated by low-frequency components, with no obvious frequency distribution characteristics, and the overall trend exhibits instability. As the cavitation coefficient decreases, the amplitude of pressure fluctuation at point P6 also grows larger. Referring to the previously mentioned pressure and streamline distribution diagrams, when σ = 0.079, the helical vortex at the outlet of impeller does not fully develop toward the inlet position of draft tube, resulting in relatively minor flow disturbance at point P6. When σ = 0.072, the proximity of P6 to the spiral vortex causes more complex flow phenomena in its vicinity, increasing local flow instability and enhancing pressure fluctuation. When the σ value continues to decrease, the flow state within the channel gradually deteriorates, the area of secondary flow in the draft tube expands, and the amplitude of pressure fluctuation also grows larger. When σ = 0.05, i.e., the cavitation coefficient of the device is extremely low, the amplitude reaches its maximum, corresponding to the most severe mutual impingement of water flow within the draft tube zone.
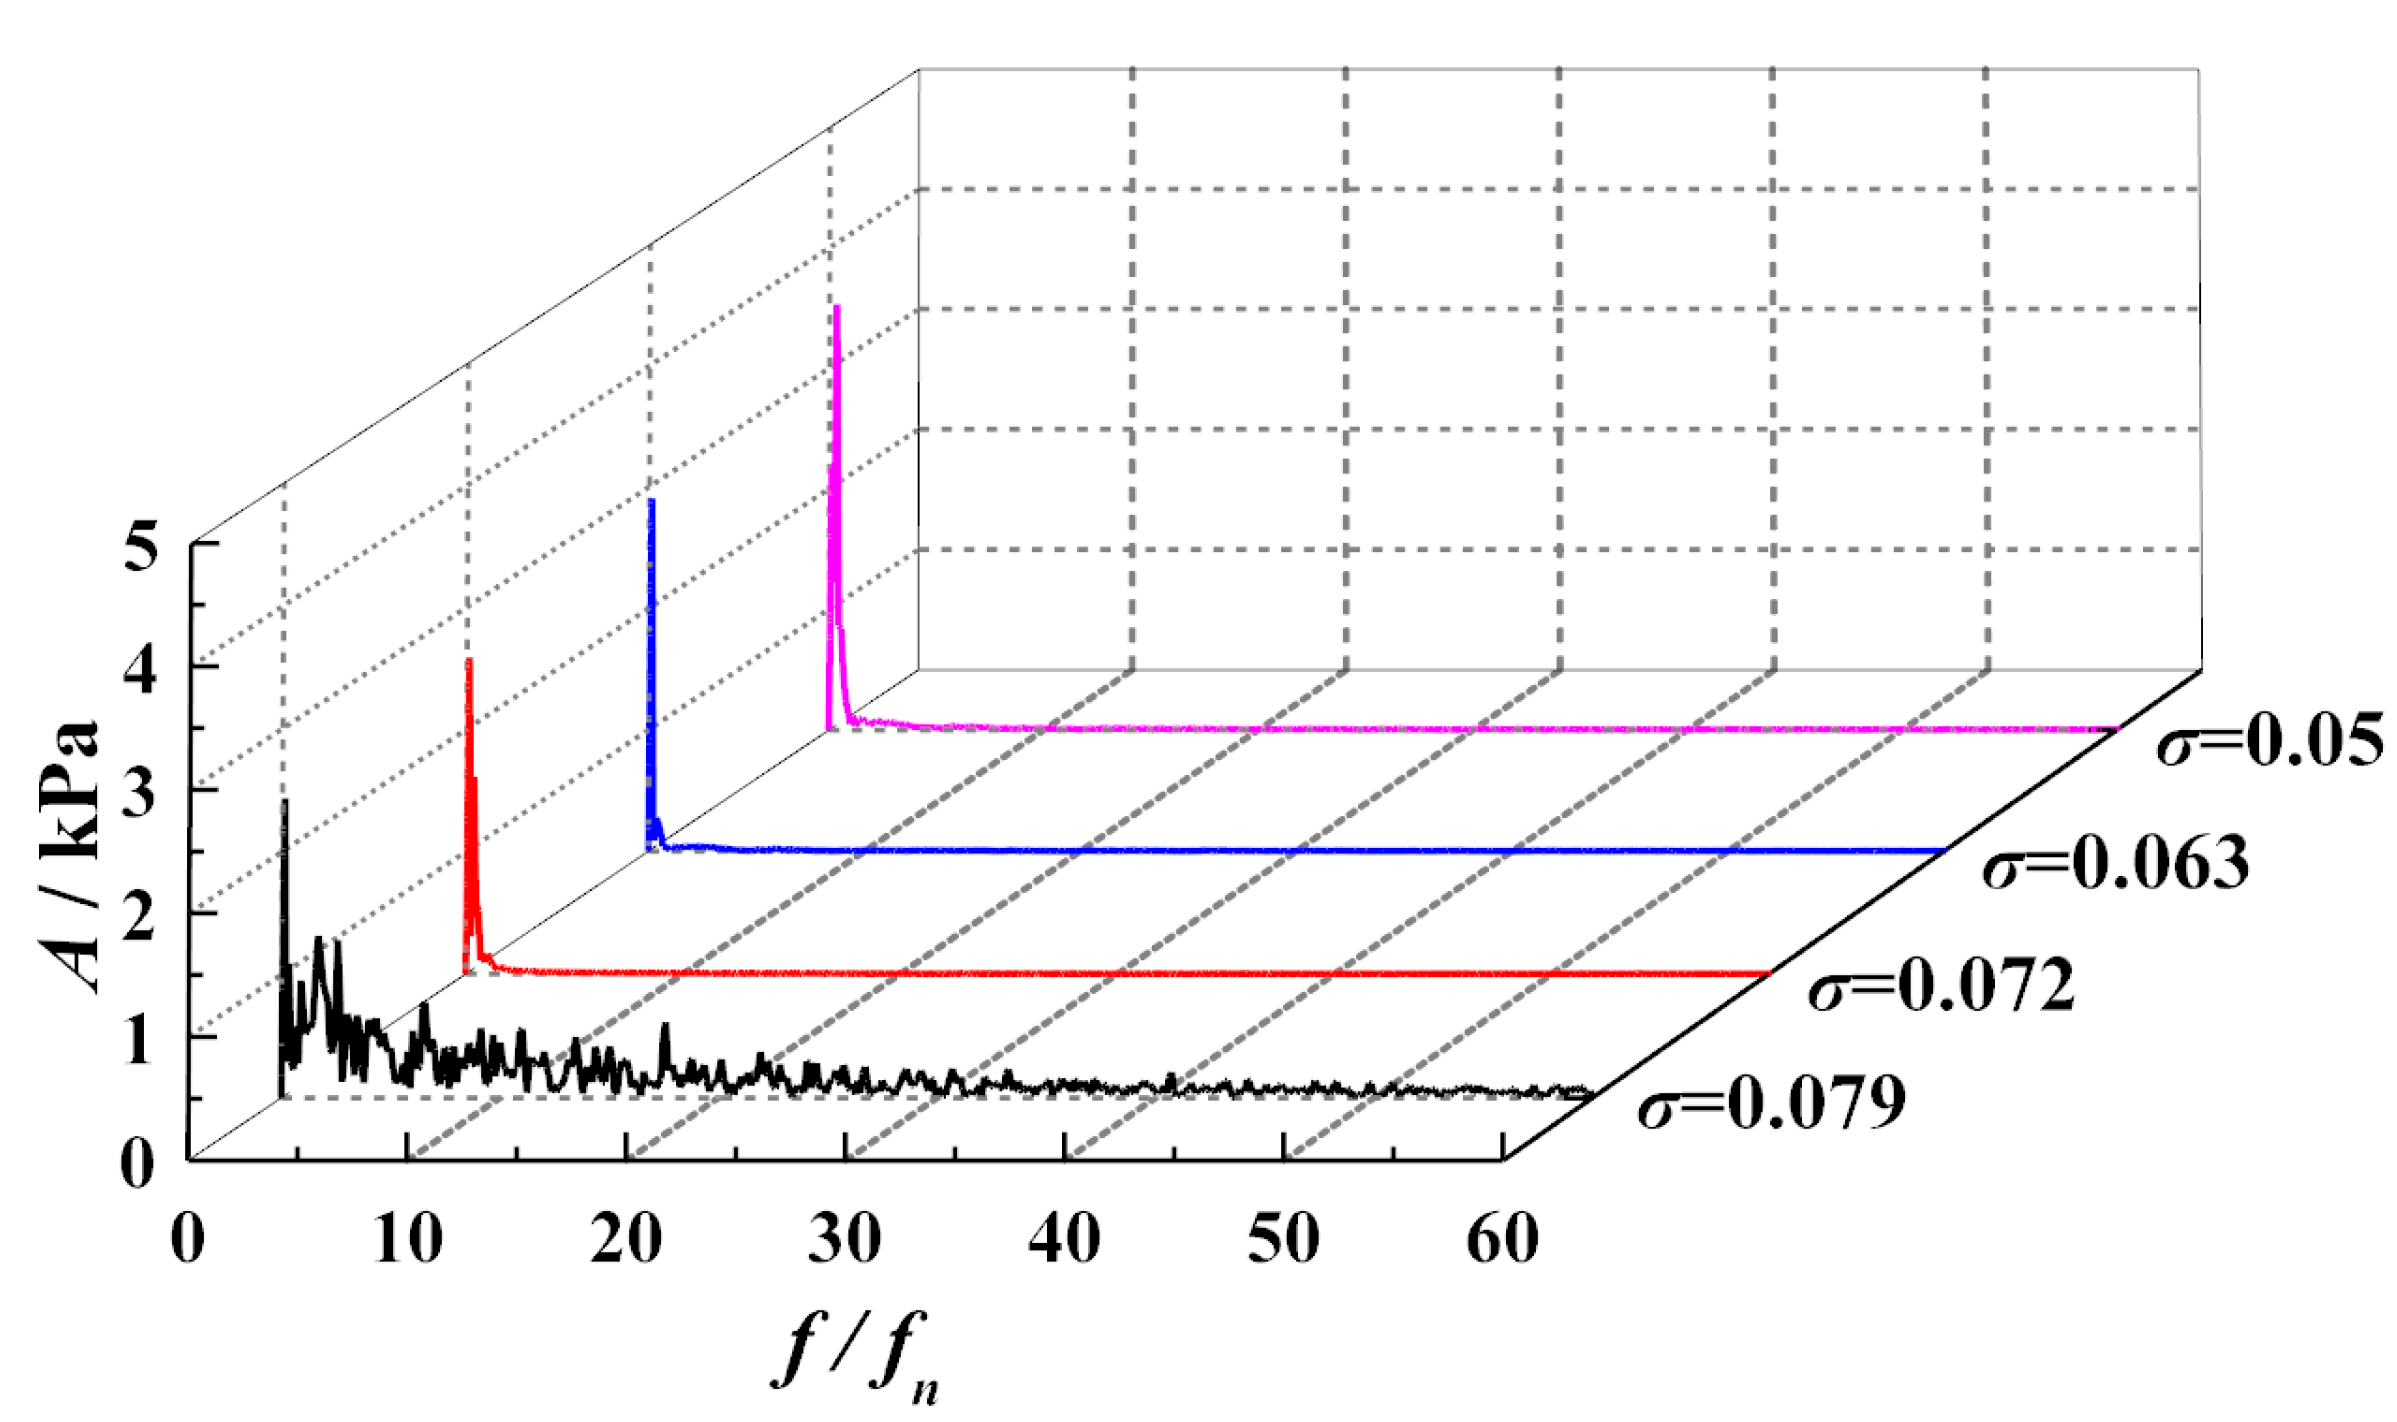
Figure 16: The frequency domain at monitoring point P6 under different cavitation coefficients.
This paper numerically simulated the unsteady flows within the whole flow channel of a model pump-turbine, investigated the hydraulic performance and internal flow fields under different cavitation coefficients, and revealed the complex cavitation characteristics in the hydraulic unit under high head condition. The key conclusions are as follows:
- (1)The CFD-predicted cavitation performance agrees well with the experimental results, with a relative error below 3%, validating the reliability of the numerical method. Before cavitation inception, the hydraulic efficiency remains nearly unchanged, whereas developed cavitation causes efficiency degradation due to vapor-induced flow blockage, increased hydraulic losses, and flow deterioration.
- (2)Cavitation inception occurs on the suction surface of impeller blade close to the upper crown. The internal flow field is affected by unsteady flow phenomena, including secondary flow development and cavitation evolution. As the cavitation coefficient decreases, the cavitation region gradually expands from the hub toward the shroud. Turbulent flow within the impeller also intensifies, leading to increased axial and radial forces acting on the impeller.
- (3)Cavitation causes uneven pressure distribution, disrupting the flow state of the water, causing part of the flow to move downstream in a spiral motion. As cavitation severity increases, secondary backflow emerges on the outer side of the elbow, which adversely affects the safe and stable operation of the unit.
- (4)In the vaneless zone, the dominant frequency of pressure fluctuation is observed at blade passing frequency (9 fn), indicating the contribution of periodic rotor-stator interaction. The low-frequency component around the rotating frequency of the main shaft is primarily induced by the rotational effect of the impeller. The frequency composition remains unchanged with variations in the cavitation coefficient, while the amplitude of pressure fluctuation gradually increases as the cavitation coefficient decreases.
- (5)Pressure fluctuations in the draft tube are mainly induced by vortex structures in the cone pipe section. The corresponding amplitude generally increases as the cavitation coefficient decreases. When σ = 0.05, an extremely low cavitation coefficient, the mutual impingement of water flow within the draft tube becomes most severe, leading to a significant increase in amplitude, highlighting the importance of cavitation control for maintaining hydraulic stability.
Acknowledgement:
Funding Statement: This research was supported by Guizhou Provincial Basic Research Program (Natural Science) “Study on the Influence Mechanism of J-Groove Control Technology on the Hydraulic Performance of Axial Flow Pumps” (No. QN (2025) 273) and Guang’an Vocational & Technical College Scientific Research Project (No. GAZYKY-2025A02).
Author Contributions: The authors confirm contribution to the paper as follows: study conception and acquisition of experimental data: Chao Liu; data analysis and draft manuscript preparation: Jianwu He; manuscript revision: Chao Liu and Jianwu He. All authors reviewed and approved the final version of the manuscript.
Availability of Data and Materials: The data that support the findings of this study are available from the corresponding author upon reasonable request.
Ethics Approval: Not applicable.
Conflicts of Interest: The authors declare no conflicts of interest.
Nomenclature
| D1 | Inlet diameter of the impeller, mm |
| D2 | Outlet diameter of the impeller, mm |
| Fa | Axial force, N |
| Fr | Radial force, N |
| Frx | Radial force in x-direction, N |
| Fry | Radial force in y-direction, N |
| H | Head, m |
| Hh | High head, m |
| Hp | Rated net head, m |
| n | Rotating speed, r/min |
| np | Rated rotating speed, r/min |
| ns | Specific speed |
| n11 | Unit rotating speed |
| Q11 | Unit flow rate |
| Zb | Impeller blade count |
| Zc | Stay vane blade count |
| Z0 | Guide vane blade count |
| b0 | Guide vane height, mm |
| φ0 | Wrap angle of spiral casing |
| λ | Prototype-to-model scale ratio |
| fn | Runner rotational frequency |
| fBPF | blade-passing frequency |
| ∆H/H | Relative amplitude |
| Pi | Pressure value at time i |
| Area-integrated pressure value | |
| δ | Relative error, % |
| XCAL | Relative amplitude obtained from numerical simulation |
| XEXP | Relative amplitude obtained from experimental measurements |
| Greek Symbols | |
| η | Hydraulic efficiency |
| σ | Cavitation coefficient |
| σc | Critical cavitation coefficient |
| ρ | Fluid density, kg/m3 |
| μ | Molecular viscosity coefficient, Pa·s |
| ω | Specific dissipation rate, s−1 |
| Abbreviations | |
| BPF | Blade Passing Frequency |
| CFD | Computational Fluid Dynamics |
| SST | Shear Stress Transport (Turbulence model) |
| SIMPLEC | Semi-Implicit Method for Pressure-Linked Equations Consistent |
| FFT | Fast Fourier Transform |
| TKE | Turbulent Kinetic Energy |
References
1. Vagnoni E , Gezer D , Anagnostopoulos I , Cavazzini G , Doujak E , Hočevar M , et al. The new role of sustainable hydropower in flexible energy systems and its technical evolution through innovation and digitalization. Renew Energy. 2024; 230: 120832. doi:10.1016/j.renene.2024.120832. [Google Scholar] [CrossRef]
2. Zhang X , Li H , Shen J , Zhou J . Research on selection of different speed units for super high water head and large capicity pumped storage power station. IOP Conf Ser Earth Environ Sci. 2022; 1037( 1): 012041. doi:10.1088/1755-1315/1037/1/012041. [Google Scholar] [CrossRef]
3. Rode BR , Kumar A . Effects of Vortex rope formation in draft tube of reversible pump-turbine—A review. J Energy Storage. 2024; 99: 113250. doi:10.1016/j.est.2024.113250. [Google Scholar] [CrossRef]
4. Pang J , Yao B , Liu X , Li J , Xiao M , Jiang D , et al. Influence of guide vane opening on channel Vortex and pressure pulsation in Francis turbine runners. Phys Fluids. 2024; 36( 4): 043325. doi:10.1063/5.0206925. [Google Scholar] [CrossRef]
5. He X , Yang J , Yang J , Hu J , Peng T . Experimental study of cavitating Vortex rope and water column separation in a pump turbine. Phys Fluids. 2022; 34( 4): 044101. doi:10.1063/5.0086509. [Google Scholar] [CrossRef]
6. Nguyen DA , Hong SL , Kim JH . Advanced technologies for improving hydraulic performance and flow characteristics in hydroturbines: A comprehensive review. Eng Appl Comput Fluid Mech. 2025; 19( 1): 2556449. doi:10.1080/19942060.2025.2556449. [Google Scholar] [CrossRef]
7. Abu Shahzer M , Nguyen DA , Kim JH . A comprehensive investigation of hydraulic performance and internal flow characteristics of Francis turbine model at part load cavitating flow for various turbulence models. Eng Appl Comput Fluid Mech. 2025; 19( 1): 2538811. doi:10.1080/19942060.2025.2538811. [Google Scholar] [CrossRef]
8. Mohammadizadeh SM , Dalfré Filho JG . Experimental analysis of cavitation erosion: Parameter sensitivity and testing protocols. Coatings. 2024; 14( 10): 1288. doi:10.3390/COATINGS14101288. [Google Scholar] [CrossRef]
9. Kadivar E , Kumar P . A review of hydrodynamic cavitation passive and active control methods in marine engineering applications. Symmetry. 2025; 17( 11): 1782. doi:10.3390/sym17111782. [Google Scholar] [CrossRef]
10. Shen J , Jia X , Cheng L , Jiao W , Zhang B , Pavesi G . Investigation into the coupling mechanism of tailwater Vortex dynamics and cavitation during pump-as-turbine operations. Phys Fluids. 2025; 37( 10): 105147. doi:10.1063/5.0287323. [Google Scholar] [CrossRef]
11. Dahal D , Trivedi C . Effect of runner blade numbers on inter blade vortices of Francis turbine under best efficiency loading. IOP Conf Ser Earth Environ Sci. 2025; 1483( 1): 012025. doi:10.1088/1755-1315/1483/1/012025. [Google Scholar] [CrossRef]
12. Remache A , Pérez-Sánchez M , Hidalgo VH , Ramos HM . Hybrid optimization approaches for impeller design in turbomachinery: Methods, metrics, and design strategies. Water. 2025; 17( 13): 1976. doi:10.3390/w17131976. [Google Scholar] [CrossRef]
13. Lv Y , Li S , Wang Z , Zhou L . Study on pump mode cavitation characteristic of variable speed pump turbine. Phys Fluids. 2023; 35( 6): 065111. doi:10.1063/5.0154131. [Google Scholar] [CrossRef]
14. Zhao NN , Feng JJ , Luo XQ , Zhu GJ , Wu GK . Experimental investigation on characteristics of pressure fluctuation and vibration under hump instability of a pump-turbine. Phys Fluids. 2025; 37( 7): 075210. doi:10.1063/5.0280179. [Google Scholar] [CrossRef]
15. Wang D , Ma W , Zhao W , Cao R , Yang Y . Experimental acoustic analysis of cavitation in a centrifugal pump. Fluid Dyn Mater Process. 2025; 21( 4): 877– 90. doi:10.32604/fdmp.2024.055220. [Google Scholar] [CrossRef]
16. Dai J , Mou J , Liu T . Influence of tip clearance on unsteady flow in automobile engine pump. Fluid Dyn Mater Process. 2020; 16( 2): 161– 79. doi:10.32604/fdmp.2020.06613. [Google Scholar] [CrossRef]
17. Wang C , Zhang Y , Yuan Z , Liu Z . Evaluating of the effect of the cavitation-Vortex interaction on the energy conversion in a two-stage LNG cryogenic submerged pump. Proc Inst Mech Eng Part A J Power Energy. 2023; 237( 1): 98– 114. doi:10.1177/09576509221107719. [Google Scholar] [CrossRef]
18. Iqbal S , Si Q , Ali A , Yuan X , SeifGhith E , Tlija M , et al. Thermodynamic analysis of hydraulic losses in ultra-low specific speed PAT under multiphase conditions. AIP Adv. 2025; 15( 11): 115025. doi:10.1063/5.0292805. [Google Scholar] [CrossRef]
19. Dönmez AH , Yumurtaci Z , Kavurmacioğlu L . Cavitation performance enhancement of a centrifugal pump impeller based on taguchi’s orthogonal optimization. Arab J Sci Eng. 2025; 50( 17): 13869– 85. doi:10.1007/s13369-024-09579-1. [Google Scholar] [CrossRef]
20. Nasir A , Dribssa E , Girma M . The pump as a turbine: A review on performance prediction, performance improvement, and economic analysis. Heliyon. 2024; 10( 4): e26084. doi:10.1016/j.heliyon.2024.e26084. [Google Scholar] [CrossRef]
21. Pang S , Zhu B , Shen Y , Chen Z . Study on suppression of cavitating Vortex rope on pump-turbines by J-groove. Appl Energy. 2024; 360: 122843. doi:10.1016/j.apenergy.2024.122843. [Google Scholar] [CrossRef]
22. Singh J , Hashmi AW . Review on fluid forces and their action on centrifugal pump impeller. Int J Interact Des Manuf Ijidem. 2025; 19( 3): 1611– 31. doi:10.1007/s12008-024-02109-1. [Google Scholar] [CrossRef]
23. Lu J , Li J , Zhang C , Zhou Y , He Y . Research on the cavitation characteristics of pump turbines based on mode decomposition. Processes. 2025; 13( 3): 732. doi:10.3390/pr13030732. [Google Scholar] [CrossRef]
24. Wang H , Zhou D , Yu A , Guo J . Analysis of cavitation-induced unsteady flow conditions in francis turbines under high-load conditions. Processes. 2024; 12( 1): 72. doi:10.3390/pr12010072. [Google Scholar] [CrossRef]
25. Evangelisti A , Agati G , Borello D , Mazzotta L , Capobianchi P , Venturini P . Numerical prediction of cavitation for a horizontal axis tidal turbine. Flow Turbul Combust. 2025; 114( 3): 887– 912. doi:10.1007/s10494-024-00615-6. [Google Scholar] [CrossRef]
26. Zwart PJ , Gerber AG , Belamri T . A two-phase flow model for predicting cavitation dynamics. In: Proceedings of the 5th International Conference on Multiphase Flow; 2004 May 30–Jun 4; Yokohama, Japan. [Google Scholar]
27. Dehghan AA , Shojaeefard MH . Experimental and numerical optimization of a centrifugal pump volute and its effect on head and hydraulic efficiency at the best efficiency point. Proc Inst Mech Eng Part C J Mech Eng Sci. 2022; 236( 9): 4577– 98. doi:10.1177/09544062211056019. [Google Scholar] [CrossRef]
28. Dehghan AA , Shojaeefard MH , Roshanaei M . Exploring a new criterion to determine the onset of cavitation in centrifugal pumps from energy-saving standpoint; experimental and numerical investigation. Energy. 2024; 293: 130681. doi:10.1016/j.energy.2024.130681. [Google Scholar] [CrossRef]
Cite This Article
 Copyright © 2026 The Author(s). Published by Tech Science Press.
This work is licensed under a Creative Commons Attribution 4.0 International License , which permits unrestricted use, distribution, and reproduction in any medium, provided the original work is properly cited.
 Downloads
 Citation Tools
