
 Login
Login Register
 Submit a Paper
 Propose a Special lssue
 Open Access
ARTICLE
A Multi-Mechanism Numerical Framework for Shale Gas Transport and Frac-Hit-Induced Inter-Well Interference in Infill Horizontal Well Development
1 Shale Gas Research Institute, PetroChina Southwest Oil & Gasfield Company, Chengdu, China
2 Sichuan Key Laboratory of Shale Gas Evaluation and Exploitation, Chengdu, China
3 Sichuan Shale Gas Exploration and Development Co., Ltd., Luzhou, China
4 State Key Laboratory of Deep Oil and Gas, China University of Petroleum (East China), Qingdao, China
5 School of Petroleum Engineering, China University of Petroleum (East China), Qingdao, China
* Corresponding Author: Wenfeng Yu. Email:
(This article belongs to the Special Issue: Fluid and Thermal Dynamics in the Development of Unconventional Resources IV)
Fluid Dynamics & Materials Processing 2026, 22(9), 12 https://doi.org/10.32604/fdmp.2026.087207
Received 11 June 2026; Accepted 08 September 2026; Issue published 28 September 2026
 View Full Text
 Download PDF
Abstract
This study develops a multi-mechanism numerical simulation framework for shale gas reservoirs to quantify the coupled effects of gas transport mechanisms, stress sensitivity, and inter-well interference during infill horizontal well development. The model is formulated within the Embedded Discrete Fracture Model (EDFM) and incorporates gas adsorption/desorption, diffusion, and matrix stress sensitivity, with the governing equations discretized and solved using the finite volume method. Sensitivity analyses show that stress sensitivity is a dominant control on productivity, as increasing effective stress causes pore and fracture contraction and closure, substantially reducing gas production. A stress sensitivity coefficient of 0.04, for example, reduces cumulative gas production by approximately 30%. The contribution of diffusion decreases sharply with increasing matrix permeability and becomes negligible when matrix permeability exceeds approximately 0.1 mD (1 × 10⁻⁴ μm2). Adsorbed gas contributes primarily during the late stage of production under substantial pressure depletion, accounting for approximately 7% of total cumulative production. Building on these transport insights, the framework is further applied to quantify inter-well interference, with particular emphasis on frac-hit effects arising from hydraulic fracture interactions between parent and infill wells. Direct frac-hit interference caused by hydraulic fracture intersection produces stronger and more rapid productivity degradation than matrix-mediated pressure communication, resulting in a sustained decline in parent-well production. The adverse effect intensifies as the number of hydraulic fractures connecting the parent and child wells increases. Finally, correlations among Estimated Ultimate Recovery (EUR), recovery factor, and well spacing are established to quantify the impact of frac-hit-induced interference on development performance.Keywords
The advancements in horizontal drilling and hydraulic fracturing technologies have significantly enhanced shale gas production, drawing immense attention to shale gas resources [1]. Unlike conventional reservoirs, shale gas reservoirs possess characteristics such as ultra-low permeability, low porosity, and complex migration mechanisms [2]. Shale porosity primarily comprises micro-nano pores, showcasing diverse existence states dominated by free gas and adsorbed gas, thereby resulting in significant disparities in migration mechanisms compared to conventional gas reservoirs [3,4]. Darcy’s Law does not accurately describe migration within multiscale pores and fractures. Numerous studies have demonstrated that gas transport in shale nanopores involves multiple mechanisms, including viscous flow, Knudsen diffusion, and surface diffusion, and neglecting these mechanisms can lead to significant underestimation of shale gas productivity [5]. Furthermore, shale gas reservoirs, upon development through hydraulic fracturing, form large-scale hydraulic fractures, indicating the multiscale nature of the pore and fissure system, as illustrated in Fig. 1. Consequently, both single continuous medium models and discrete fracture models exhibit certain limitations [6].
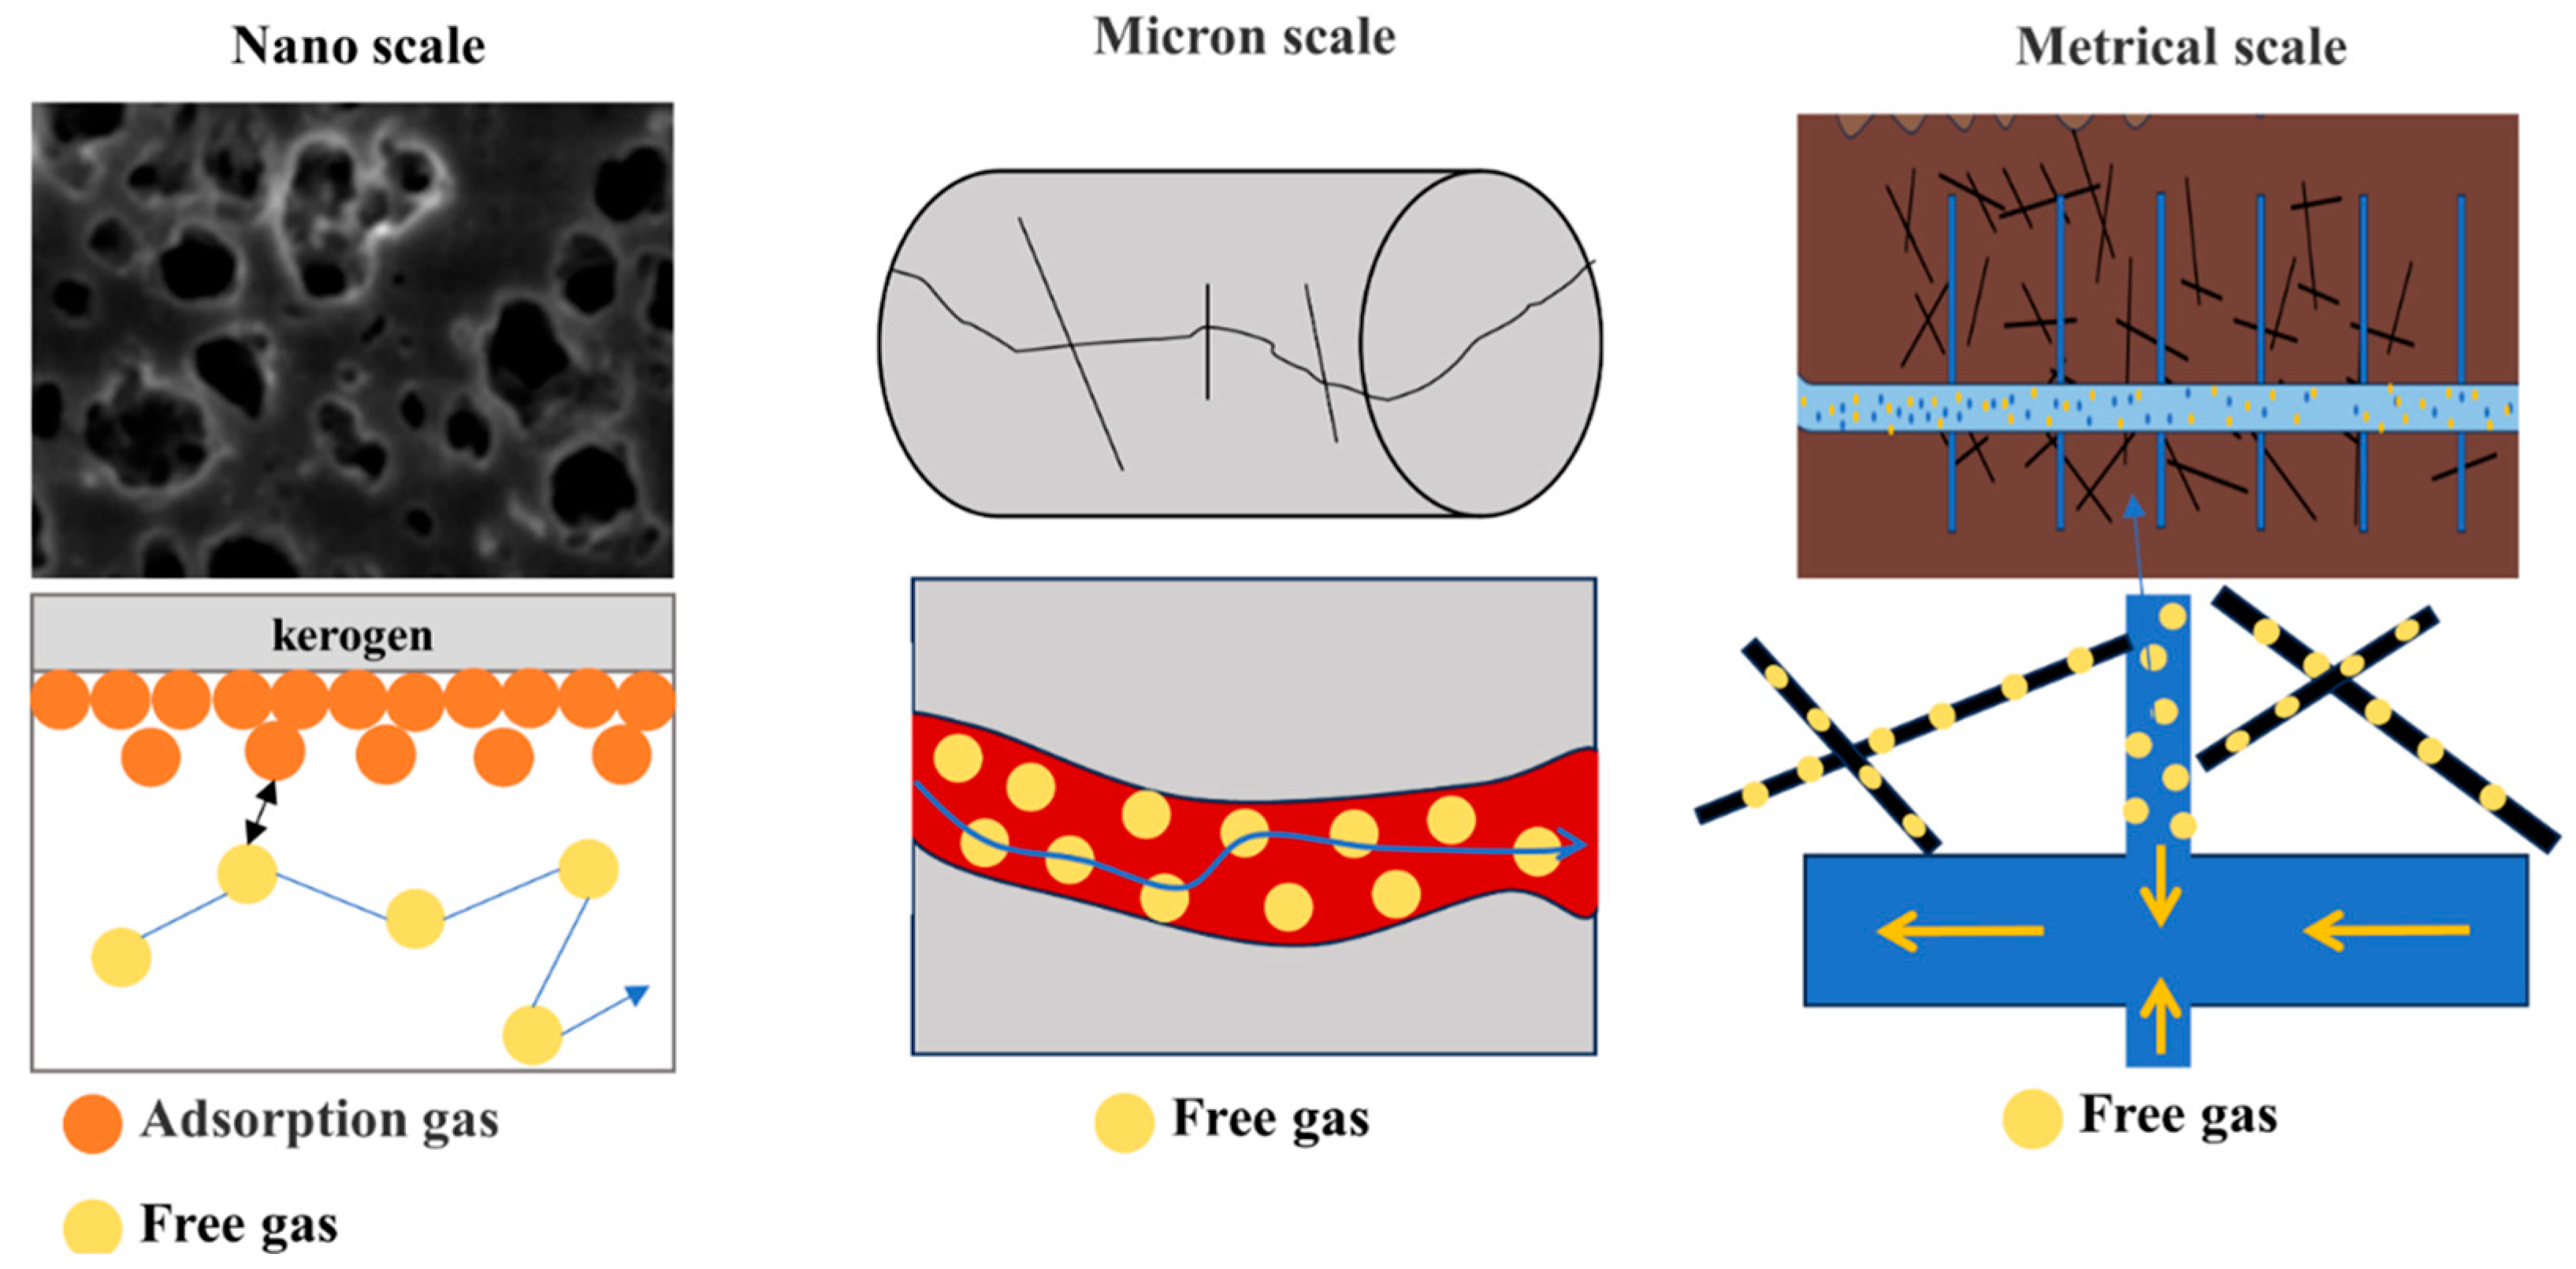
Figure 1: Multi-scale pore and fracture diagram of shale gas reservoir.
Compared to other rock types, shale harbors a higher proportion of clay minerals, rendering it more compressible. Furthermore, the development of bedding and cleavage in shale gas reservoirs exacerbates its response to effective stress, leading to heightened sensitivity compared to other rock types [7,8,9]. In recent years, researchers have focused on understanding the migration mechanisms of shale formations, including phenomena like gas desorption, stress sensitivity and Knudsen diffusion [10,11,12,13,14]. However, the majority of current reservoir numerical simulation models neglect to comprehensively consider the aforementioned key mechanisms.
The reservoir addressed in this study is a deep marine shale gas play in China, and its conditions differ appreciably from the shallow to medium-depth plays on which most published simulation studies are based. North American plays such as the Barnett, Marcellus and Eagle Ford are generally buried between about 1500 and 3500 m and produced under formation pressures below roughly 50 MPa, and the marine shale plays developed earlier in China are for the most part shallower than 3500 m. The target reservoir of the present study, by contrast, is buried deeper than 3500 m and is strongly overpressured, with a formation pressure of about 70.7 MPa and a formation temperature of about 432.5 K (Table 1) [15]. The greater burial depth brings a higher effective stress, a larger in-situ stress contrast and a higher reservoir temperature, which together produce three particular challenges: the matrix and the propped fractures are far more stress sensitive, so productivity decline is more severe; a larger share of the gas in place is adsorbed and is released only in the late, strongly depleted stage; and the massive stimulation required to create economic fracture networks at such depths markedly increases the risk of casing deformation and of frac hits between wells of the same pad [16,17]. Conclusions transferred directly from shallow shale plays are therefore unreliable for deep shale gas development, and these features define the geological significance of the multi-mechanism modelling framework established in this work. The specific block and stratigraphic interval are not disclosed here for confidentiality reasons, but all reservoir, fluid and fracture parameters used in this study are those of the actual reservoir and are summarised in Table 1.
Dual porosity models [18] and discrete fracture models [19,20,21] are commonly used to simulate mass transfer processes from fractures to the matrix. In addressing the intricacies of grid partitioning, Lee et al. devised an Embedded Discrete Fracture Model (EDFM) [22]. The EDFM seamlessly incorporates complex fractures directly into structured grids, eliminating the necessity for intricate, unstructured fracture grids. Consequently, it reduces computational complexity and offers significant technical advantages in predicting the productivity of fractured wells. The accurate and efficient evaluation and simulation of shale gas reservoirs face considerable challenges due to the complex gas migration mechanisms and the computation of mass flux between fractures and the matrix [23]. This paper thoroughly examines the micro-scale migration mechanisms within shale gas reservoirs. It adopts an embedded discrete model to describe the mass flux exchange between the matrix and hydraulic fractures, establishes a mathematical model for two-phase gas-water flow in shale gas reservoirs, and utilizes finite volume methods for discretization and solution. Furthermore, it analyzes the effects of different migration mechanisms on productivity, thereby offering theoretical support for the efficient development of shale gas reservoirs.
In order to maximize reservoir recovery and optimize shale gas extraction, infill drilling has become a common practice in shale gas fields. However, when infill wells are placed in close proximity to pre-existing parent wells, a critical concern arises regarding inter-well interference, which may exert significant adverse effects on well productivity [24]. Among the various forms of inter-well interference, frac hits have emerged as one of the most prominent and detrimental phenomena encountered in infill drilling operations. Frac hits specifically refer to the scenarios in which hydraulic fractures propagated from an infill (child) well directly intercept or communicate with the hydraulic fractures, stimulated reservoir volume (SRV), or pressure-depleted regions of a pre-existing parent well, thereby causing abrupt pressure responses, fluid invasion, production losses, and even wellbore damage in the parent well. Consequently, a comprehensive understanding of the mechanisms governing frac hits and the broader inter-well interference is essential for optimizing infill well design, mitigating production losses, and ensuring the long-term economic viability of shale gas development. In field practice, frac hits have become one of the most costly problems in the multi-well pad development of deep shale gas. Statistics reported for the deep shale gas blocks of the southern Sichuan Basin show that, before dedicated prevention and control measures were introduced, more than half of the infill stimulation operations produced a detectable frac hit in the neighbouring parent wells, and the affected parent wells frequently experienced an abrupt pressure surge, an influx of fracturing fluid and proppant, a sharp reduction or even a complete loss of gas rate, and in severe cases casing deformation requiring costly workover [16]. Because deep shale gas wells are expensive and infill drilling is at present the principal means of raising recovery in already developed blocks, quantifying when, and to what extent, a frac hit turns from a transient production benefit into a persistent production loss is a prerequisite for deciding infill-well spacing, stimulation intensity and fracturing sequence.
Several studies have documented the occurrence of frac-hit and inter-well interference phenomena in shale gas reservoirs. Microseismic monitoring data indicate that, when well spacing is small, hydraulic fractures generated by adjacent wells can establish direct hydraulic communication, particularly within regions where pressure depletion has developed around the parent well [25]. Interference mechanisms have been further classified into four categories: matrix-mediated interference, hydraulic fracture interference (i.e., frac hits in a narrow sense), SRV interference, and combined hydraulic fracture–SRV interference [26]. Each type of interference imposes varying degrees of impact on shale gas well productivity. In addition, reservoir and fracture properties play a pivotal role in governing the production and recovery responses associated with different interference modes.
Presently, two main techniques are employed to analyze the impact of well interference in shale gas wells: analytical models and numerical simulations. Analytical models utilize Rate Transient Analysis (RTA) and Pressure Transient Analysis (PTA) techniques but are limited in addressing the issue of infill drilling with varying production start times [27]. On the other hand, numerical simulations are extensively utilized due to their capability to handle complex problems such as discrete fractures, nonlinearity, and heterogeneity. However, many studies assume simultaneous production start times for all wells, which may not accurately reflect real-world conditions [28]. Fang et al. attempted to address this limitation, but their model did not account for the complex transport mechanisms in shale nanopores. Nevertheless, their model did not simultaneously incorporate all relevant nanopore transport mechanisms—such as Knudsen diffusion, gas desorption, and stress-sensitive permeability—within a unified simulation framework, leaving a critical gap in the accurate prediction of well interference under realistic shale gas conditions [29]. Building upon Fang et al.’s research, this study aims to investigate the problem of well interference using the shale gas numerical simulation model developed herein [30,31,32,33].
In summary, although significant progress has been made in understanding shale gas transport mechanisms and developing numerical simulation methods, current studies still exhibit certain limitations. On the one hand, most simulation models tend to focus on a single or a partial set of physical mechanisms, failing to comprehensively integrate multiscale transport mechanisms within a unified framework. On the other hand, regarding inter-well interference in infill horizontal well development, existing studies mostly assume simultaneous production start times for all wells or fail to fully account for the profound impact of microscopic nanopore transport mechanisms on interference intensity and production dynamics. This limitation restricts the accuracy of predicting the long-term positive and negative effects of infill well fracturing on adjacent parent wells.
To bridge these research gaps, this paper develops a numerical simulation model for shale gas reservoirs that couples multiscale transport mechanisms with inter-well interference analysis. The primary innovation of this study lies in introducing an apparent porosity model to characterize the volumetric contribution of the adsorbed phase, combining it with modified Fick’s law and an exponential stress sensitivity model, and achieving an efficient coupled solution of complex fracture networks and multi-mechanism matrix flow within the EDFM framework. The overall design logic follows a systematic pathway: mathematical characterization of microscale transport mechanisms, establishment of a matrix/fracture mathematical model, implementation of numerical algorithms based on the finite volume method, validation through field production history matching, and ultimately, quantitative investigation of inter-well interference patterns and well spacing optimization. The findings of this study not only clarify the relative impact of different transport mechanisms on productivity but also provide a scientific basis for designing rational infill drilling strategies and determining the optimal well spacing in shale gas fields by quantifying inter-well interference intensity. Specifically, the main contributions of this work are threefold. (1) A unified EDFM-based simulation framework is established in which an apparent-porosity description of the adsorbed phase, a modified Fick’s law for nanopore diffusion and an exponential stress-sensitivity law are solved simultaneously with two-phase gas–water flow, so that the relative weight of the three transport mechanisms can be compared quantitatively within one model rather than in isolation. (2) Matrix-mediated interference and direct hydraulic-fracture communication are separated explicitly inside the same history-matched model, and two characteristic times, T1 and T2, are proposed to quantify the transition of a frac hit from a transient production benefit to a persistent production loss, together with the dependence of these times on the number of connected fractures. (3) The resulting interference intensity is mapped onto EUR and recovery degree as a function of well spacing, providing a quantitative basis for infill-well spacing optimisation and frac-hit mitigation in deep shale gas reservoirs.
Shale gas reservoirs are characterized by micro- and nano-scale pore structures, in which gas transport involves three key mechanisms beyond conventional Darcy flow: adsorption/desorption, diffusion, and stress-sensitive permeability.
Adsorption/Desorption:
Shale gas exists in both free and adsorbed states within matrix pores. The adsorbed gas content is described by the classical Langmuir isothermal equation [34]:
Shale reservoirs contain abundant organic matter pores with large specific surface areas, making diffusion a critical gas transport mechanism. In these ultra-low permeability formations, hydrodynamic dispersion is dominated by molecular diffusion. When a concentration gradient exists within the kerogen, dissolved gas diffuses from the organic matter into the pore network, as illustrated in Fig. 2.
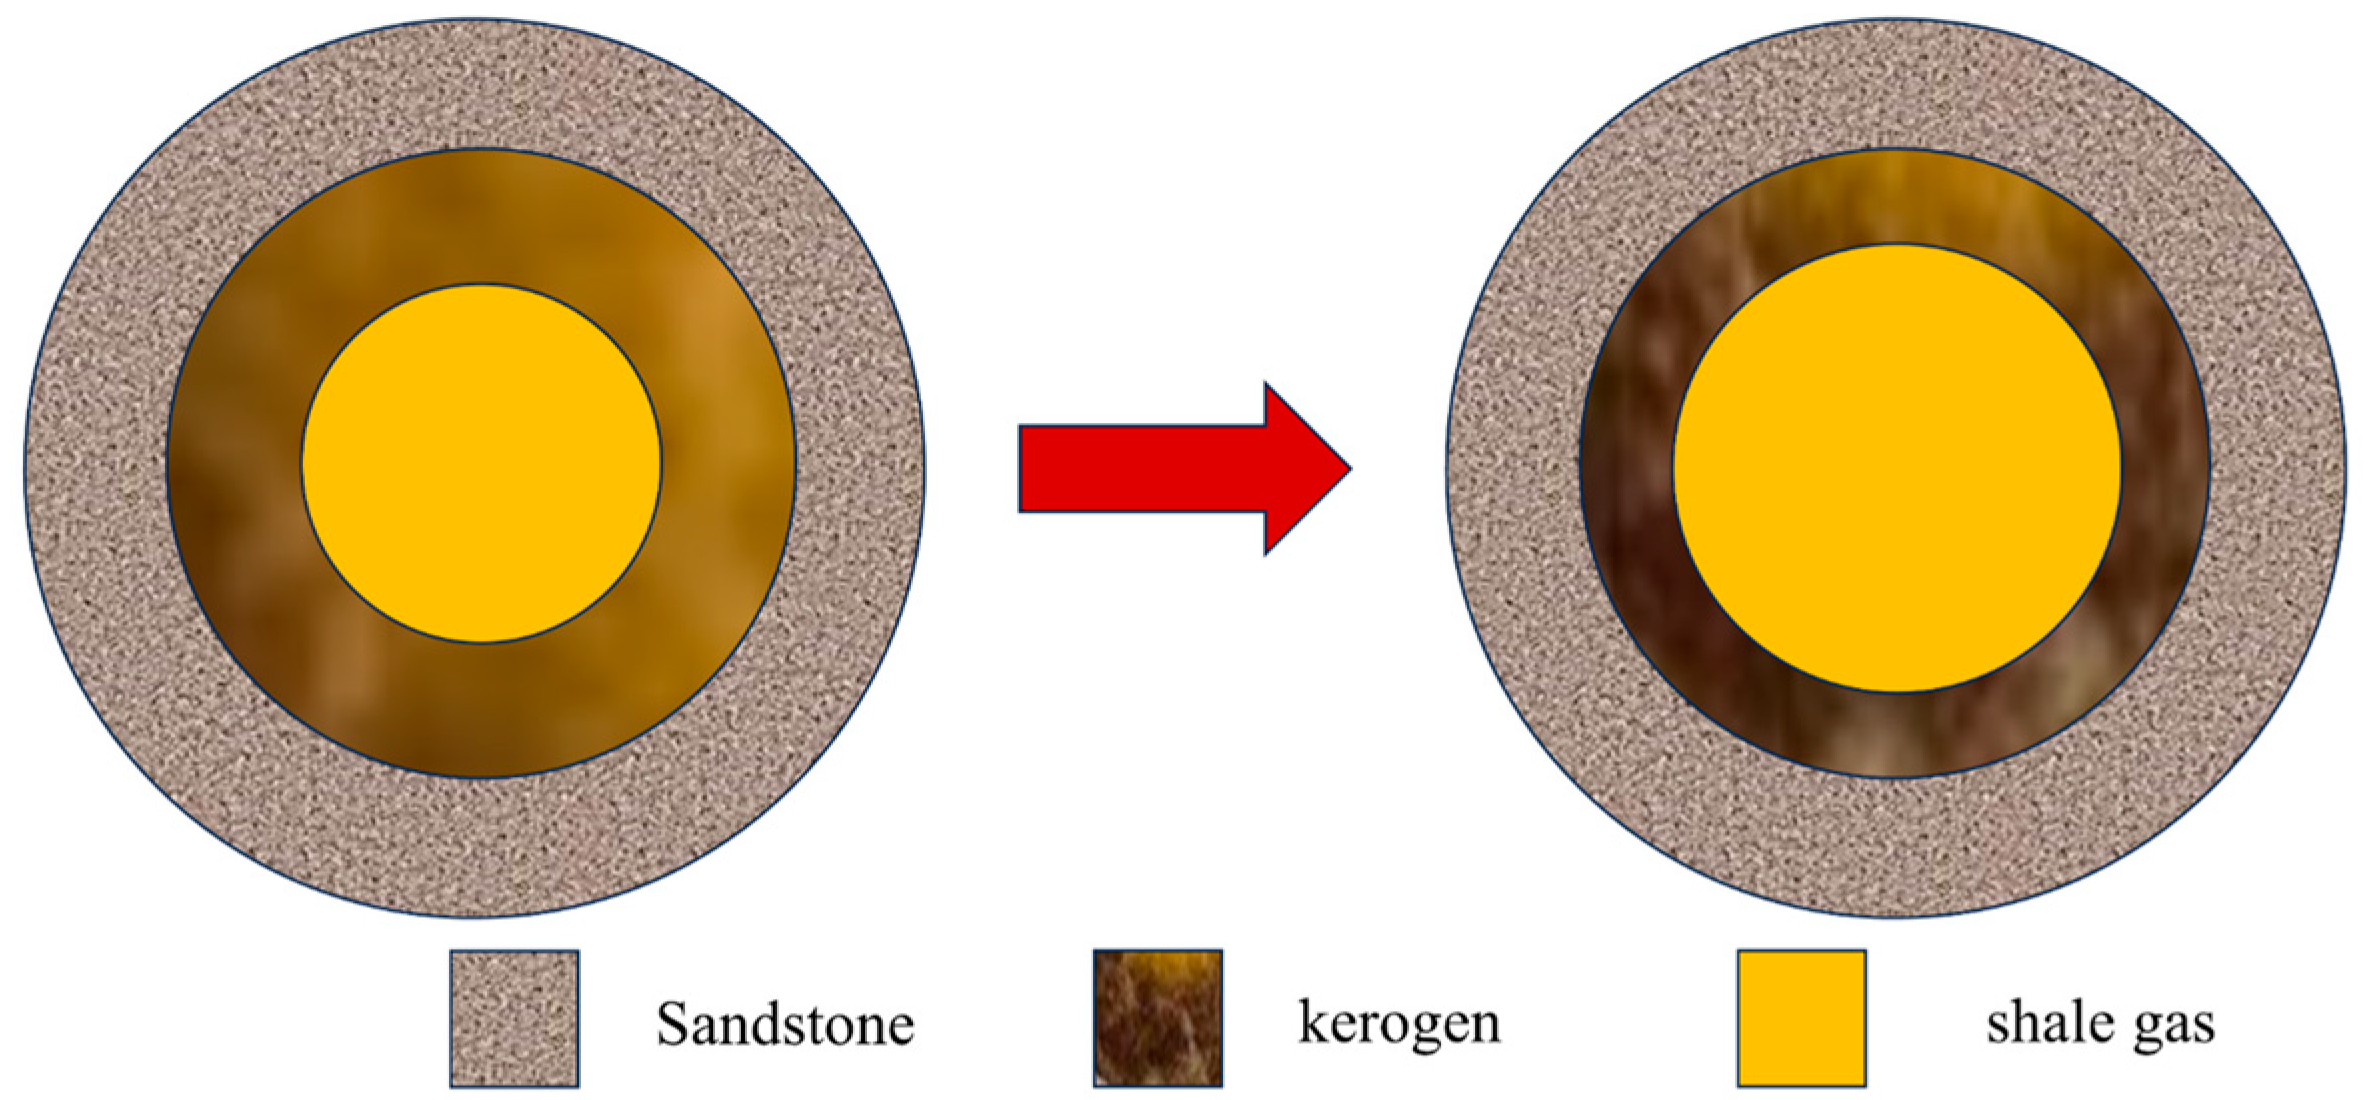
Figure 2: Shale gas reservoir diffusion mechanism diagram.
In shale gas reservoirs with extremely low matrix permeability, diffusion flux constitutes a significant portion of the total mass flux. Fick’s law [35] is employed to describe this concentration-gradient-driven transport:
In a porous media system, the diffusion coefficient
It is worth clarifying why the porosity, saturation and tortuosity corrections in Eq. (3) are indispensable for shale nanopores. Classical Fick’s law, Eq. (2), describes diffusion in a free, unobstructed medium, whereas in shale only a small fraction of the bulk volume is available for transport and that fraction is further shared between the gas and the water phase. Multiplying the free-medium diffusion coefficient by the porosity therefore converts a flux referenced to the bulk rock volume into a flux referenced to the pore volume that is actually accessible, whereas multiplying by the phase saturation restricts the transport to that part of the pore space genuinely occupied by the diffusing phase; without this term the diffusive contribution of the gas phase would be overestimated in water-bearing intervals. The tortuosity correction accounts for the fact that shale nanopores are neither straight nor uniformly connected: gas molecules migrating from the kerogen into the connected pore network must follow strongly convoluted paths whose true length is roughly two to three times the apparent distance (2.54 in this study, see Table 1), so that the effective concentration gradient along the real flow path is correspondingly smaller than the macroscopic gradient. Because organic-matter-hosted nanopores dominate the storage space of deep shale, omitting these three corrections would yield an effective diffusion coefficient that is up to an order of magnitude too large, and hence an over-prediction of the matrix contribution to productivity.
Stress Sensitivity:
Pedrosa et al. [38] performed stress sensitivity experiments on shale cores and discovered that the stress sensitivity coefficients of these cores were all less than 1. In 2018, stress sensitivity experiments on fractured shale cores were performed by Zhu et al. [39] using a variable pore pressure experimental method. They correlated the permeability data obtained from experiments with effective stress data and determined that exponential fitting yielded a satisfactory degree of fit. Archer et al. [40] conducted stress sensitivity experiments across a wide stress range, revealing that the stress sensitivity variation of shale cores followed an exponential model. Duan et al. [41] selected shale in the Sichuan Basin of China for experiments. They investigated the sensitivity of matrix, micro-crack, and artificial fracture permeability to internal stress using core testing methods. Additionally, they compared the fitting and correction of natural fracture permeability using exponential models, the Gangi model [42], and the Walsh model with experimental results.
This study was carried out using shale cores sourced from China to test stress sensitivity. The permeability variation curve of the shale cores with effective stress was obtained, and the experimental results were fitted and compared using the Gangi model, power-law model, and exponential model. As shown in Fig. 3, it was determined that the exponential model yielded the most accurate fit to the experimental data. Eq. (4) illustrates the expression for the exponential model.
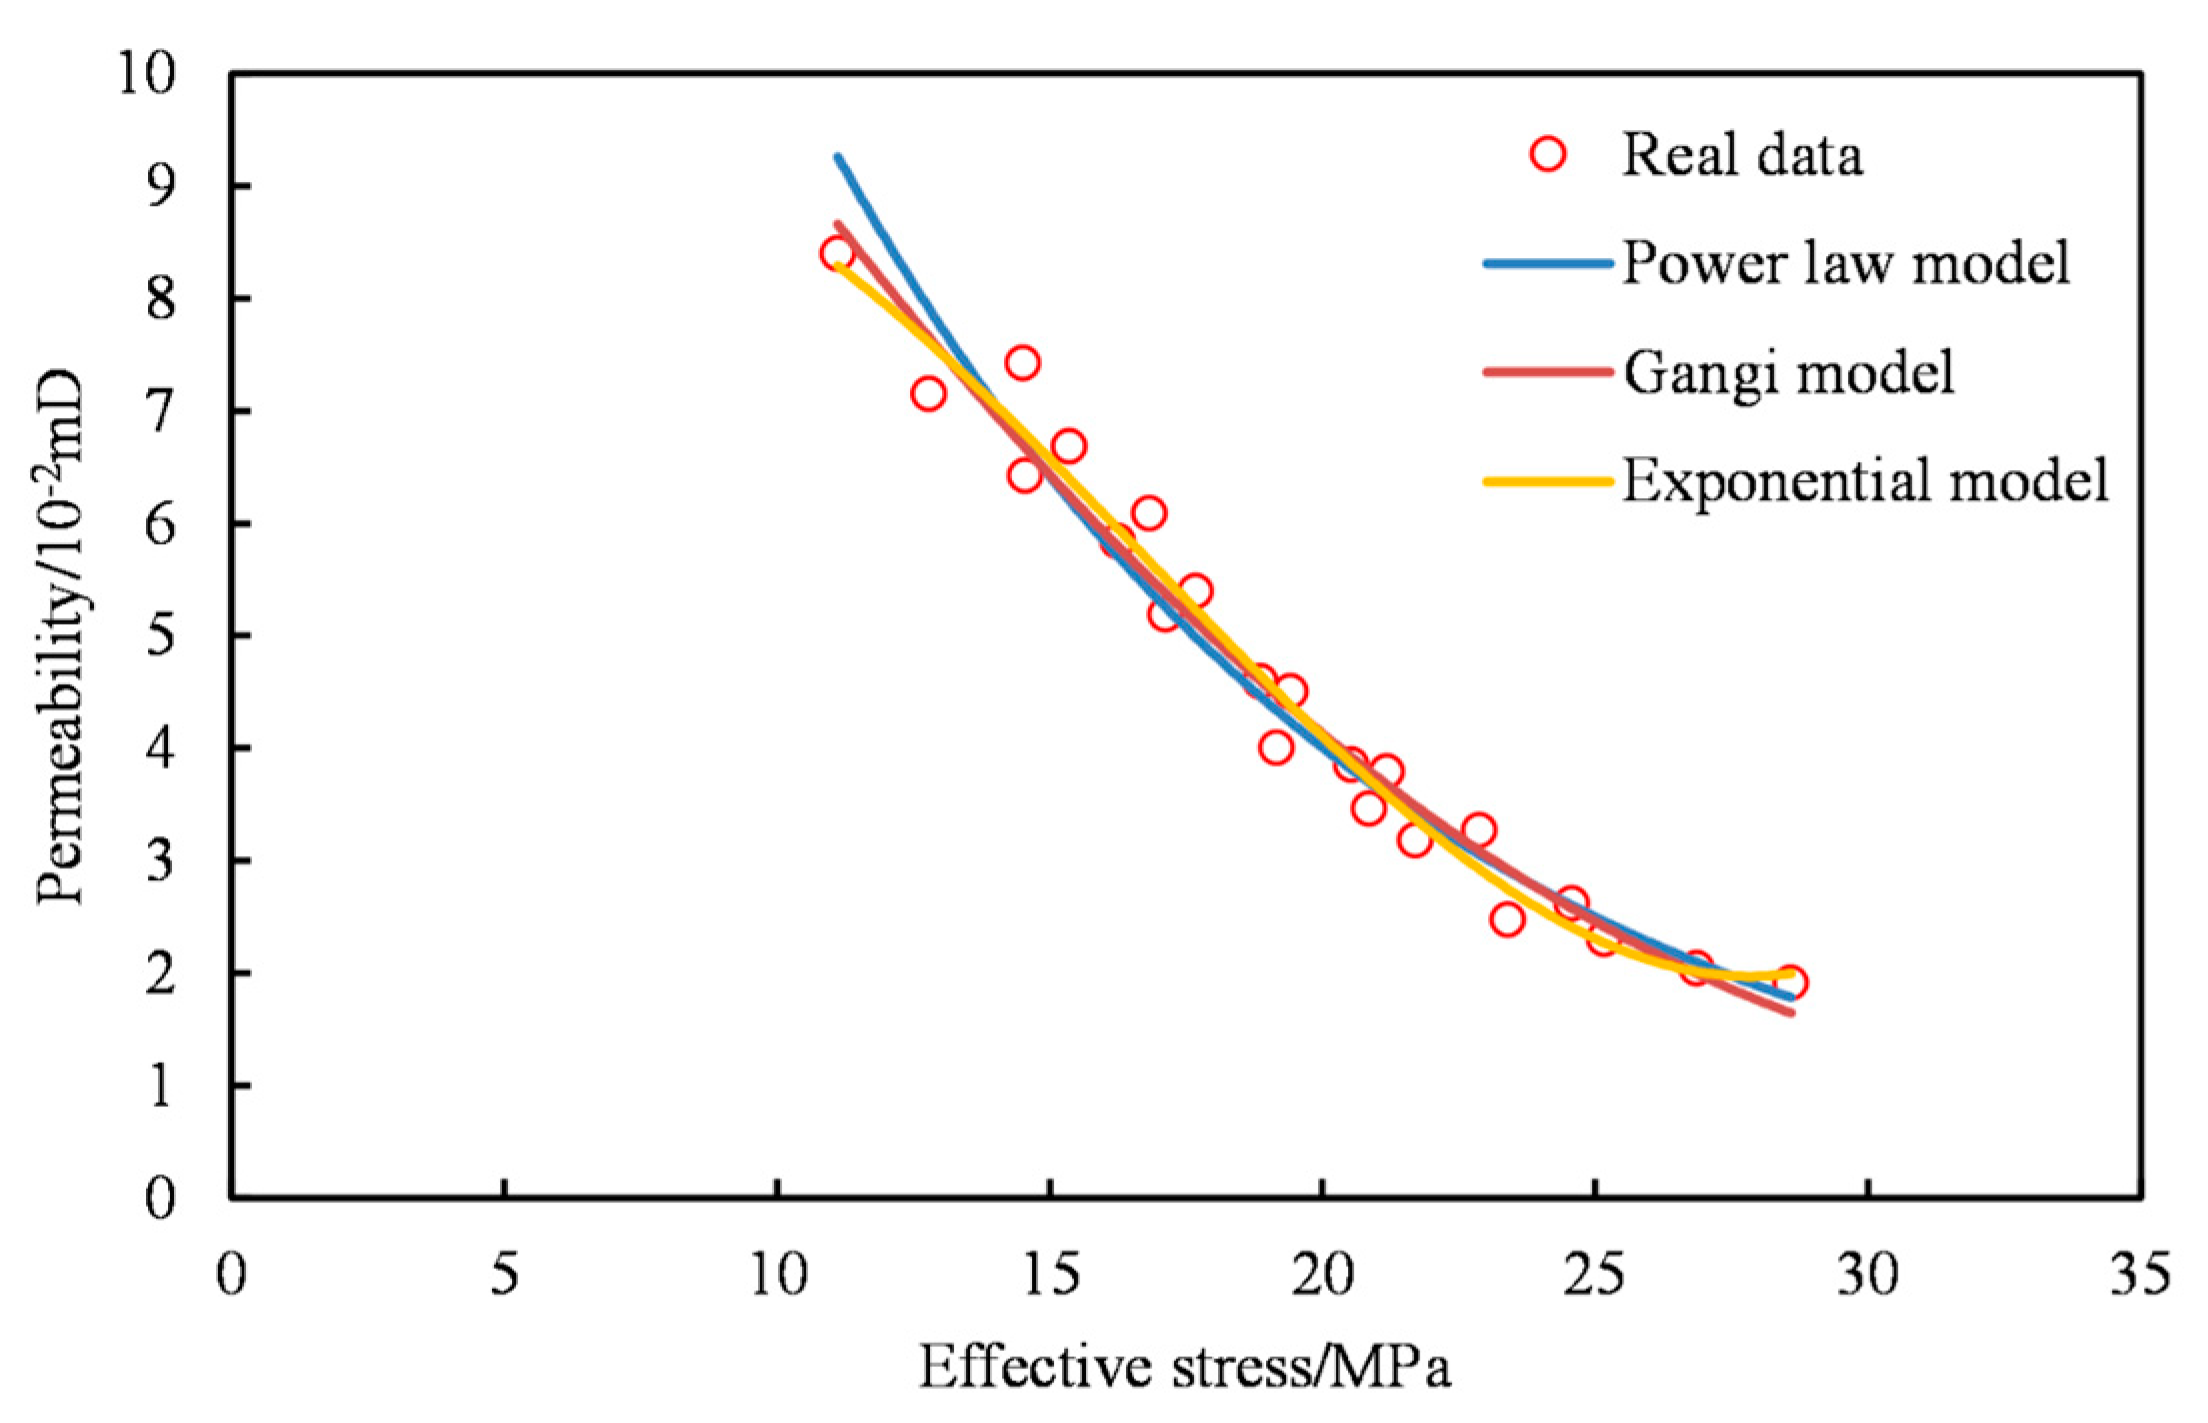
Figure 3: The fitting effect of different stress sensitivity characterization models.
2.2 Numerical Model Considering Complex Transport Mechanism
2.2.1 Apparent Porosity Model Considering Adsorption
During the production process, gas molecules undergo simultaneous adsorption and desorption as pressure changes. Additionally, influenced by chemical potential energy, gas molecules migrate along the streamline direction. Studies suggest that in shale gas reservoirs, gas molecules at the organic matter pore walls undergo single-layer adsorption. It is assumed that both free gas and adsorbed gas in shale gas reservoirs adhere to the Langmuir adsorption equation in both the original state and during production, as illustrated in Eq. (1).
When considering single-layer adsorption, the thickness of the adsorption layer is denoted by
The calculation of the number of adsorbed gas molecules per unit area is represented by Eq. (6).
Therefore, the concentration of adsorbed gas under different pressures can be expressed as shown in Eq. (7).
The volume of organic matter pores can be classified into two states based on the presence of gas: the volume occupied by free gas (free gas porosity) and the volume occupied by adsorbed gas (adsorbed gas porosity), as depicted in Fig. 4. Due to substantial variations in gas concentration across different regions, the inherent porosity in shale can’t be used to figure out how much oil and gas are in the ground. Sheng et al. [43] introduced the concept of apparent porosity: converting the volume occupied by adsorbed gas into the volume occupied by gas when its concentration equals that of free gas. The sum of the adsorbed gas porosity and the free gas porosity at this volume is defined as the apparent porosity. Through apparent porosity, gas reserves at different pore pressures, as well as the remaining amounts of free gas and adsorbed gas, can be directly estimated. The formula for calculating total gas reserves in pores is presented in Eq. (8).
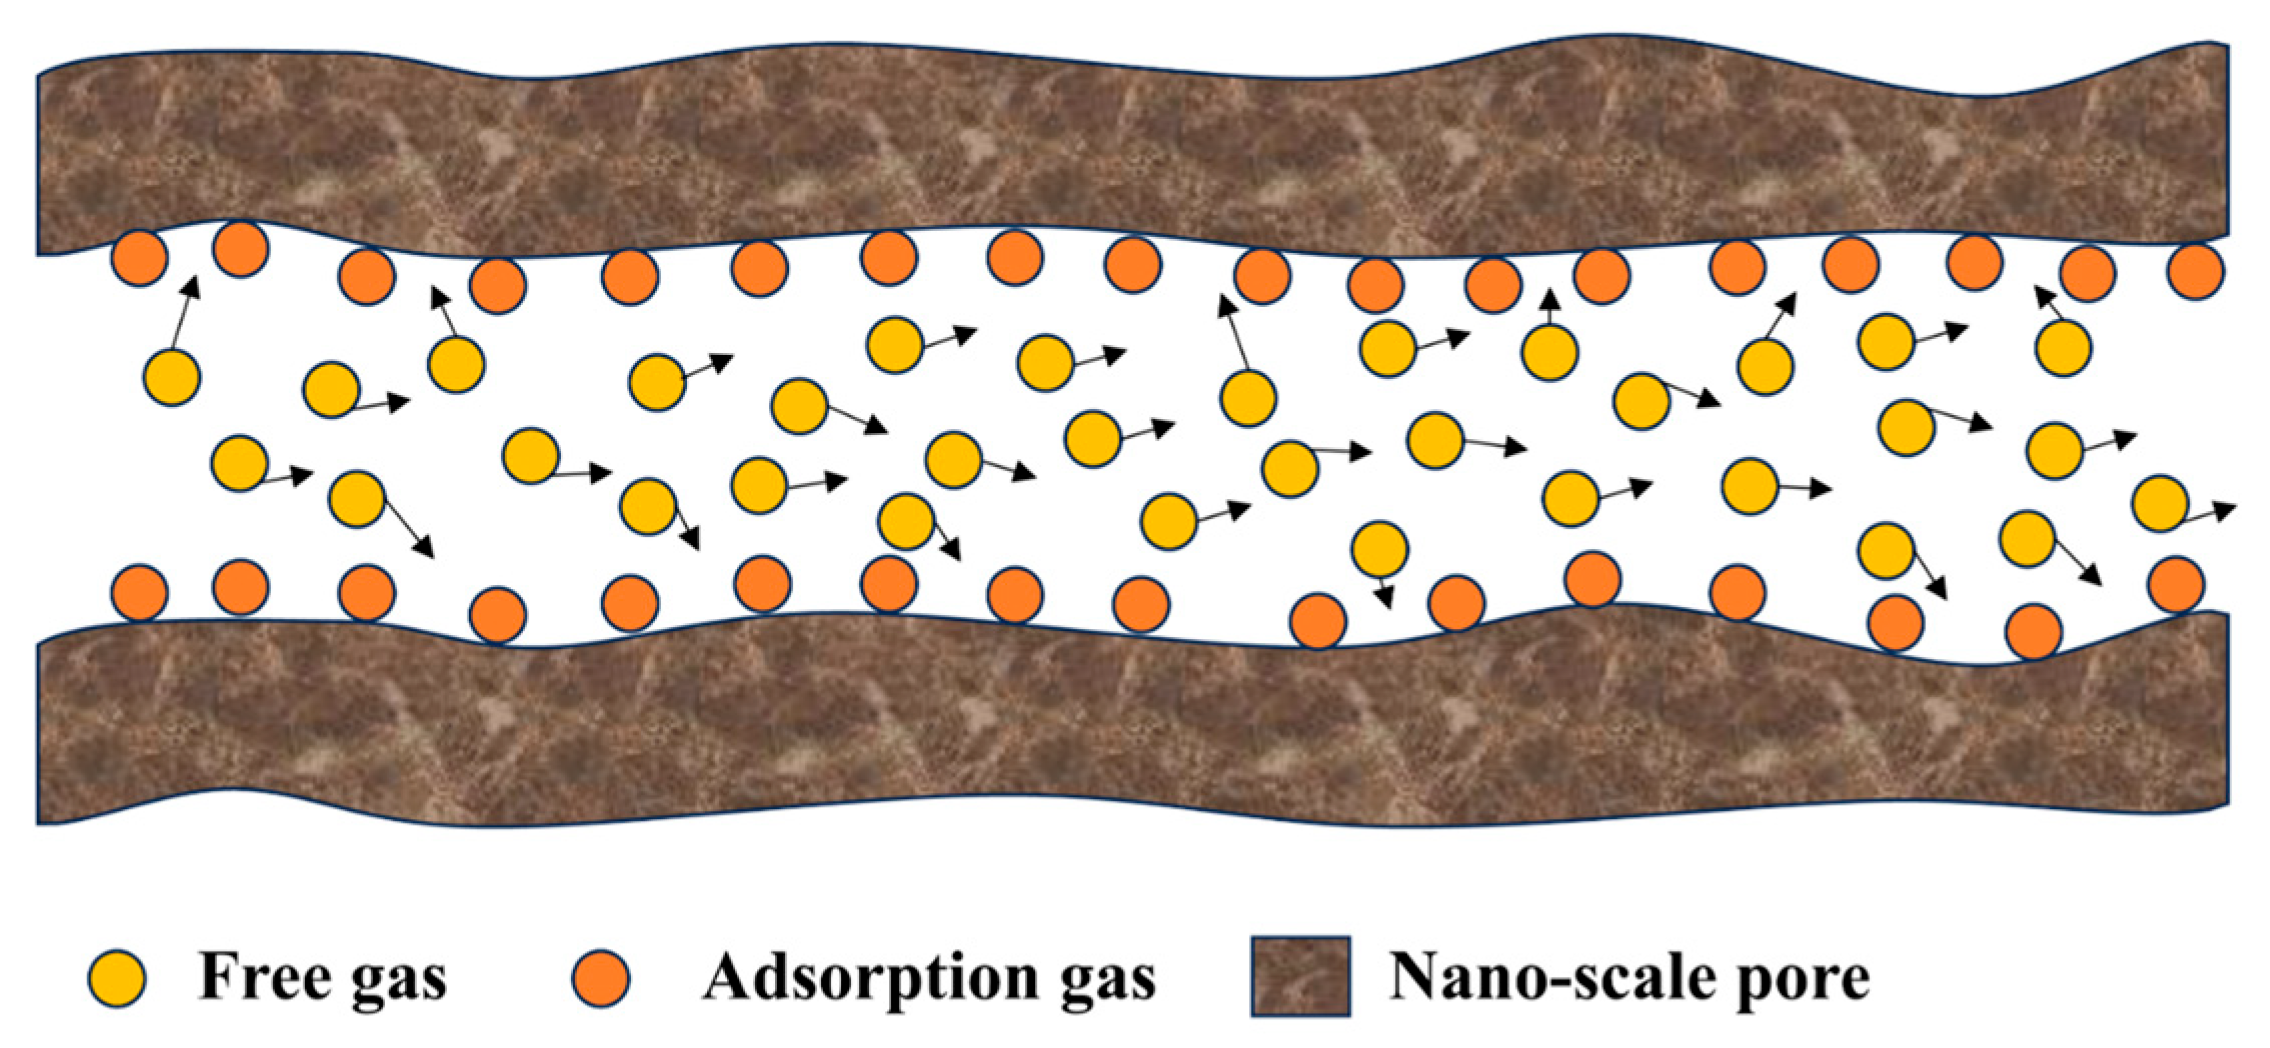
Figure 4: Schematic diagram of adsorbed gas and free gas.
Taking circular pores as an example, porosity is defined as the ratio of the pore volume to the volume of the core sample, as expressed in Eq. (9).
In the formula,
The calculation methods for free gas porosity and adsorbed gas porosity are given by Eqs. (10) and (11), respectively.
Finally, the apparent porosity is obtained by substituting Eqs. (7), (10) and (11) into Eq. (8).
To characterize the diffusion of shale gas within the pores, Fick’s law is employed, as depicted in Eq. (3). Furthermore, the high stress sensitivity of shale gas reservoirs is represented using an exponential equation, as expressed in Eq. (4). The adsorption of shale gas is modeled using the apparent porosity model, as detailed in Section 2.2.1. These mathematical characterization models are then integrated into the fundamental mathematical flow model. With the reservoir boundary closed, the mathematical model for the two-phase gas-water flow in shale gas reservoirs is established for the shale matrix, as illustrated in Eqs. (12) and (13).
2.2.3 Hydraulic Fracture Flow Model
Assuming gas adheres to Darcy’s law within artificial fractures, the impact of adsorption, desorption, and diffusion of shale gas within hydraulic fractures is relatively minimal due to their extensive scale. Strong stress sensitivity characteristics are the primary focus. Consequently, the mathematical model for the two-phase gas-water flow within artificial fractures is expressed as Eqs. (21) and (22).
2.3 Numerical Model Solution and Verification
2.3.1 Numerical Discretization and Solution
The finite volume method not only addresses the challenges associated with complex boundaries but also ensures local mass conservation. As a result, the finite volume method offers distinct advantages in discretization algorithms for numerical simulations of reservoirs. In this study, the finite volume numerical method is utilized to discretize the mathematical model of fluid flow in shale gas reservoirs. Implicit backward differencing is employed to discretize the time terms. The discretized equations for the two-phase gas-water flow in the matrix are provided as Eqs. (26) and (27).
In the formula:
Likewise, utilizing the finite volume method to discretize the mathematical model of fluid flow within fractures, the discretized equations for the two-phase gas-water flow within the fractures are expressed as Eqs. (32) and (33).
To solve the model, the NonlinearSolver provided in the MRST (MATLAB Reservoir Simulation Toolbox) is employed. The nonlinear Jacobian matrix is computed using automatic differentiation. For detailed computational methods, please consult the MRST guidebook authored by Lie et al. [44]. With this approach, we have developed the numerical simulation model for shale gas considering various microscale transport mechanisms.
As depicted in Fig. 5a, the EDFM incorporates the concept of double continuum fracture modeling, introducing flow coupling terms to link the solutions between the matrix and fractures. Consequently, the matrix grid may not necessarily align with the fracture faces. As illustrated in Fig. 5b, three types of non-neighboring connections (NNC) are present in the EDFM formulation: (1) fracture-matrix, (2) fracture-fracture, and (3) fracture-well. The general NNC model is represented by Eqs. (34) and (35).
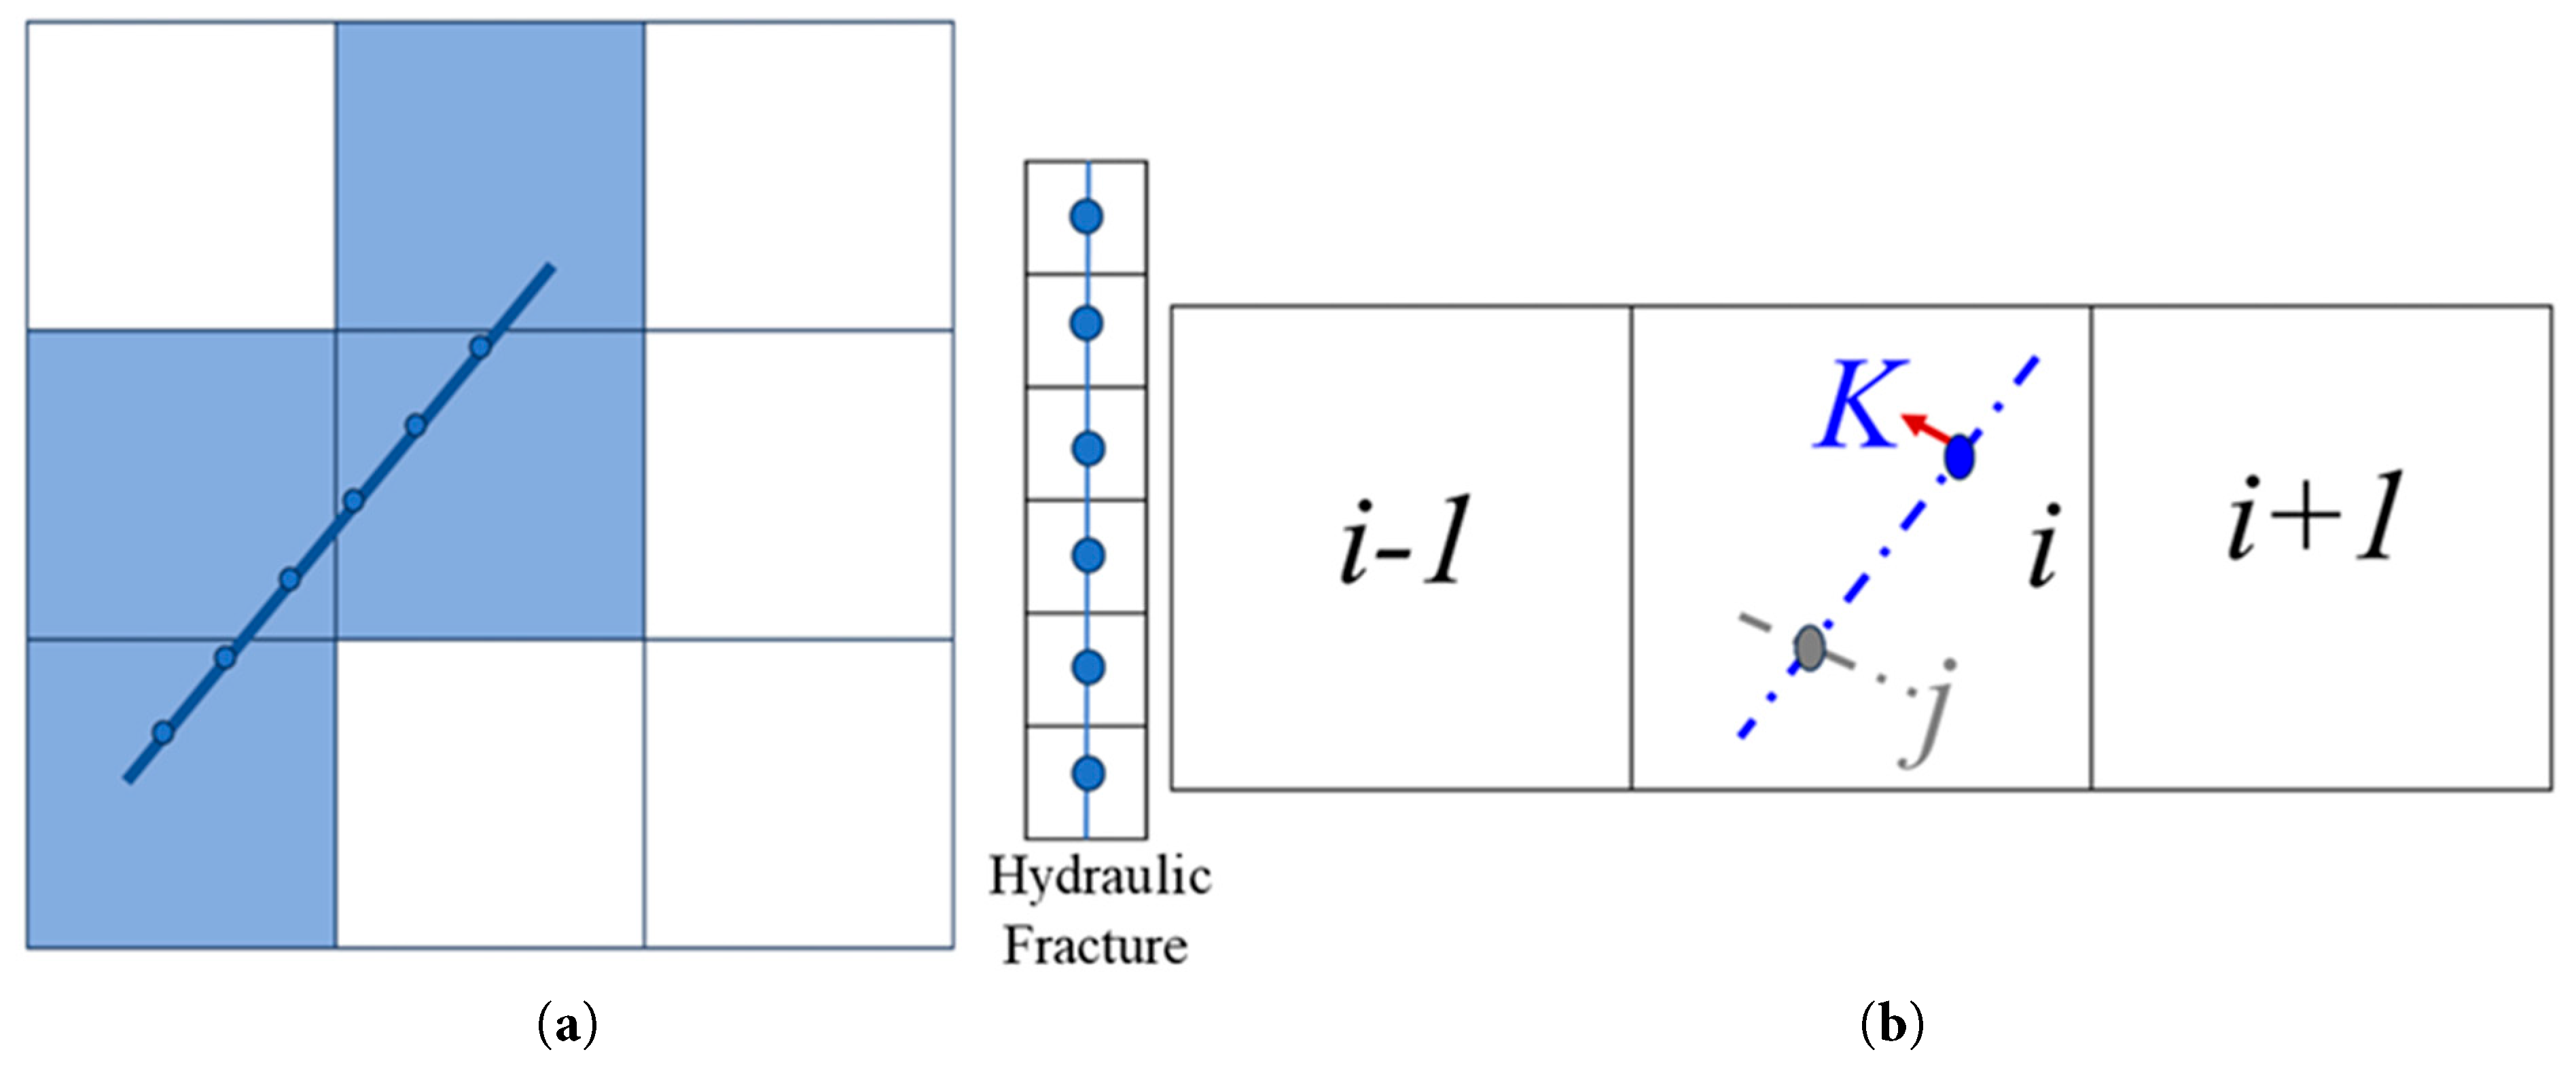
Figure 5: Embedded discrete fracture model (EDFM) and diagram illustrating three non-neighboring connections. (a) Embedded discrete fracture model; (b) Fracture-matrix/fracture/well NNCs [45].
Fracture-matrix NNC: Fracture-matrix conductivity
Fracture-Fracture NNC: The calculation of the conductivity between intersecting fractures is given by:
Fracture-Well NNC: If the well intersects with the fracture unit, the effective wellbore index WI and the equivalent radius re can be expressed as:
To validate the accuracy of the numerical simulation model for shale gas reservoirs, considering various transport mechanisms established in this study, historical matching is performed using a typical horizontal well in a Chinese shale gas field. The basic fracture and reservoir parameters are outlined in Table 1.
Table 1: Reservoir and fluid data of the shale gas field.
| Parameter | Physical Unit | Value |
|---|---|---|
| Porosity | % | 3.09 |
| Water saturation | % | 30 |
| Permeability | 10−3 μm2 | 0.08058 |
| Tortuosity | \ | 2.54 |
| Temperature | K | 432.5 |
| Pressure | MPa | 70.7 |
| Composite compressibility | MPa−1 | 0.0005 |
| Viscosity | mPa·s | 0.0195 |
| Molecular mass | Kg/mol | 0.016 |
| Fracture width | m | 0.003 |
| Fracture porosity | % | 0.3 |
| Reservoir size | m | 1200 × 200 × 60 |
| Model grid | \ | 60 × 20 × 4 |
| Well radius | m | 0.1 |
All parameters listed in Table 1 were taken from the field database of the target block rather than from generic literature values. Porosity, permeability, water saturation, composite compressibility and tortuosity are the values adopted in the reservoir evaluation of the studied well; formation pressure and formation temperature are the measured downhole data of the same well; reservoir size, grid extent and well geometry follow the actual well pattern and completion design; and fracture width and fracture porosity were taken from the fracturing design and the post-fracturing evaluation of the well. The stress-sensitivity coefficient used in Eq. (4) was obtained by fitting the stress-sensitivity experiments on shale cores presented in Fig. 3. Because tortuosity, fracture width and fracture porosity cannot be determined uniquely under in-situ conditions, these three quantities were further refined within narrow physically admissible ranges during the production history matching shown in Fig. 6, so that the parameter set reported here is consistent both with the field data and with the observed dynamic production response.
Based on these parameters, the simulated daily gas production was compared against the field historical data. As illustrated in Fig. 6, the simulation results exhibit a highly satisfactory match with the actual production profile, successfully capturing both the rapid initial production peak and the subsequent long-term decline trend. This strong correlation underscores the model’s capability to accurately reflect the complex transport mechanisms governing well performance.
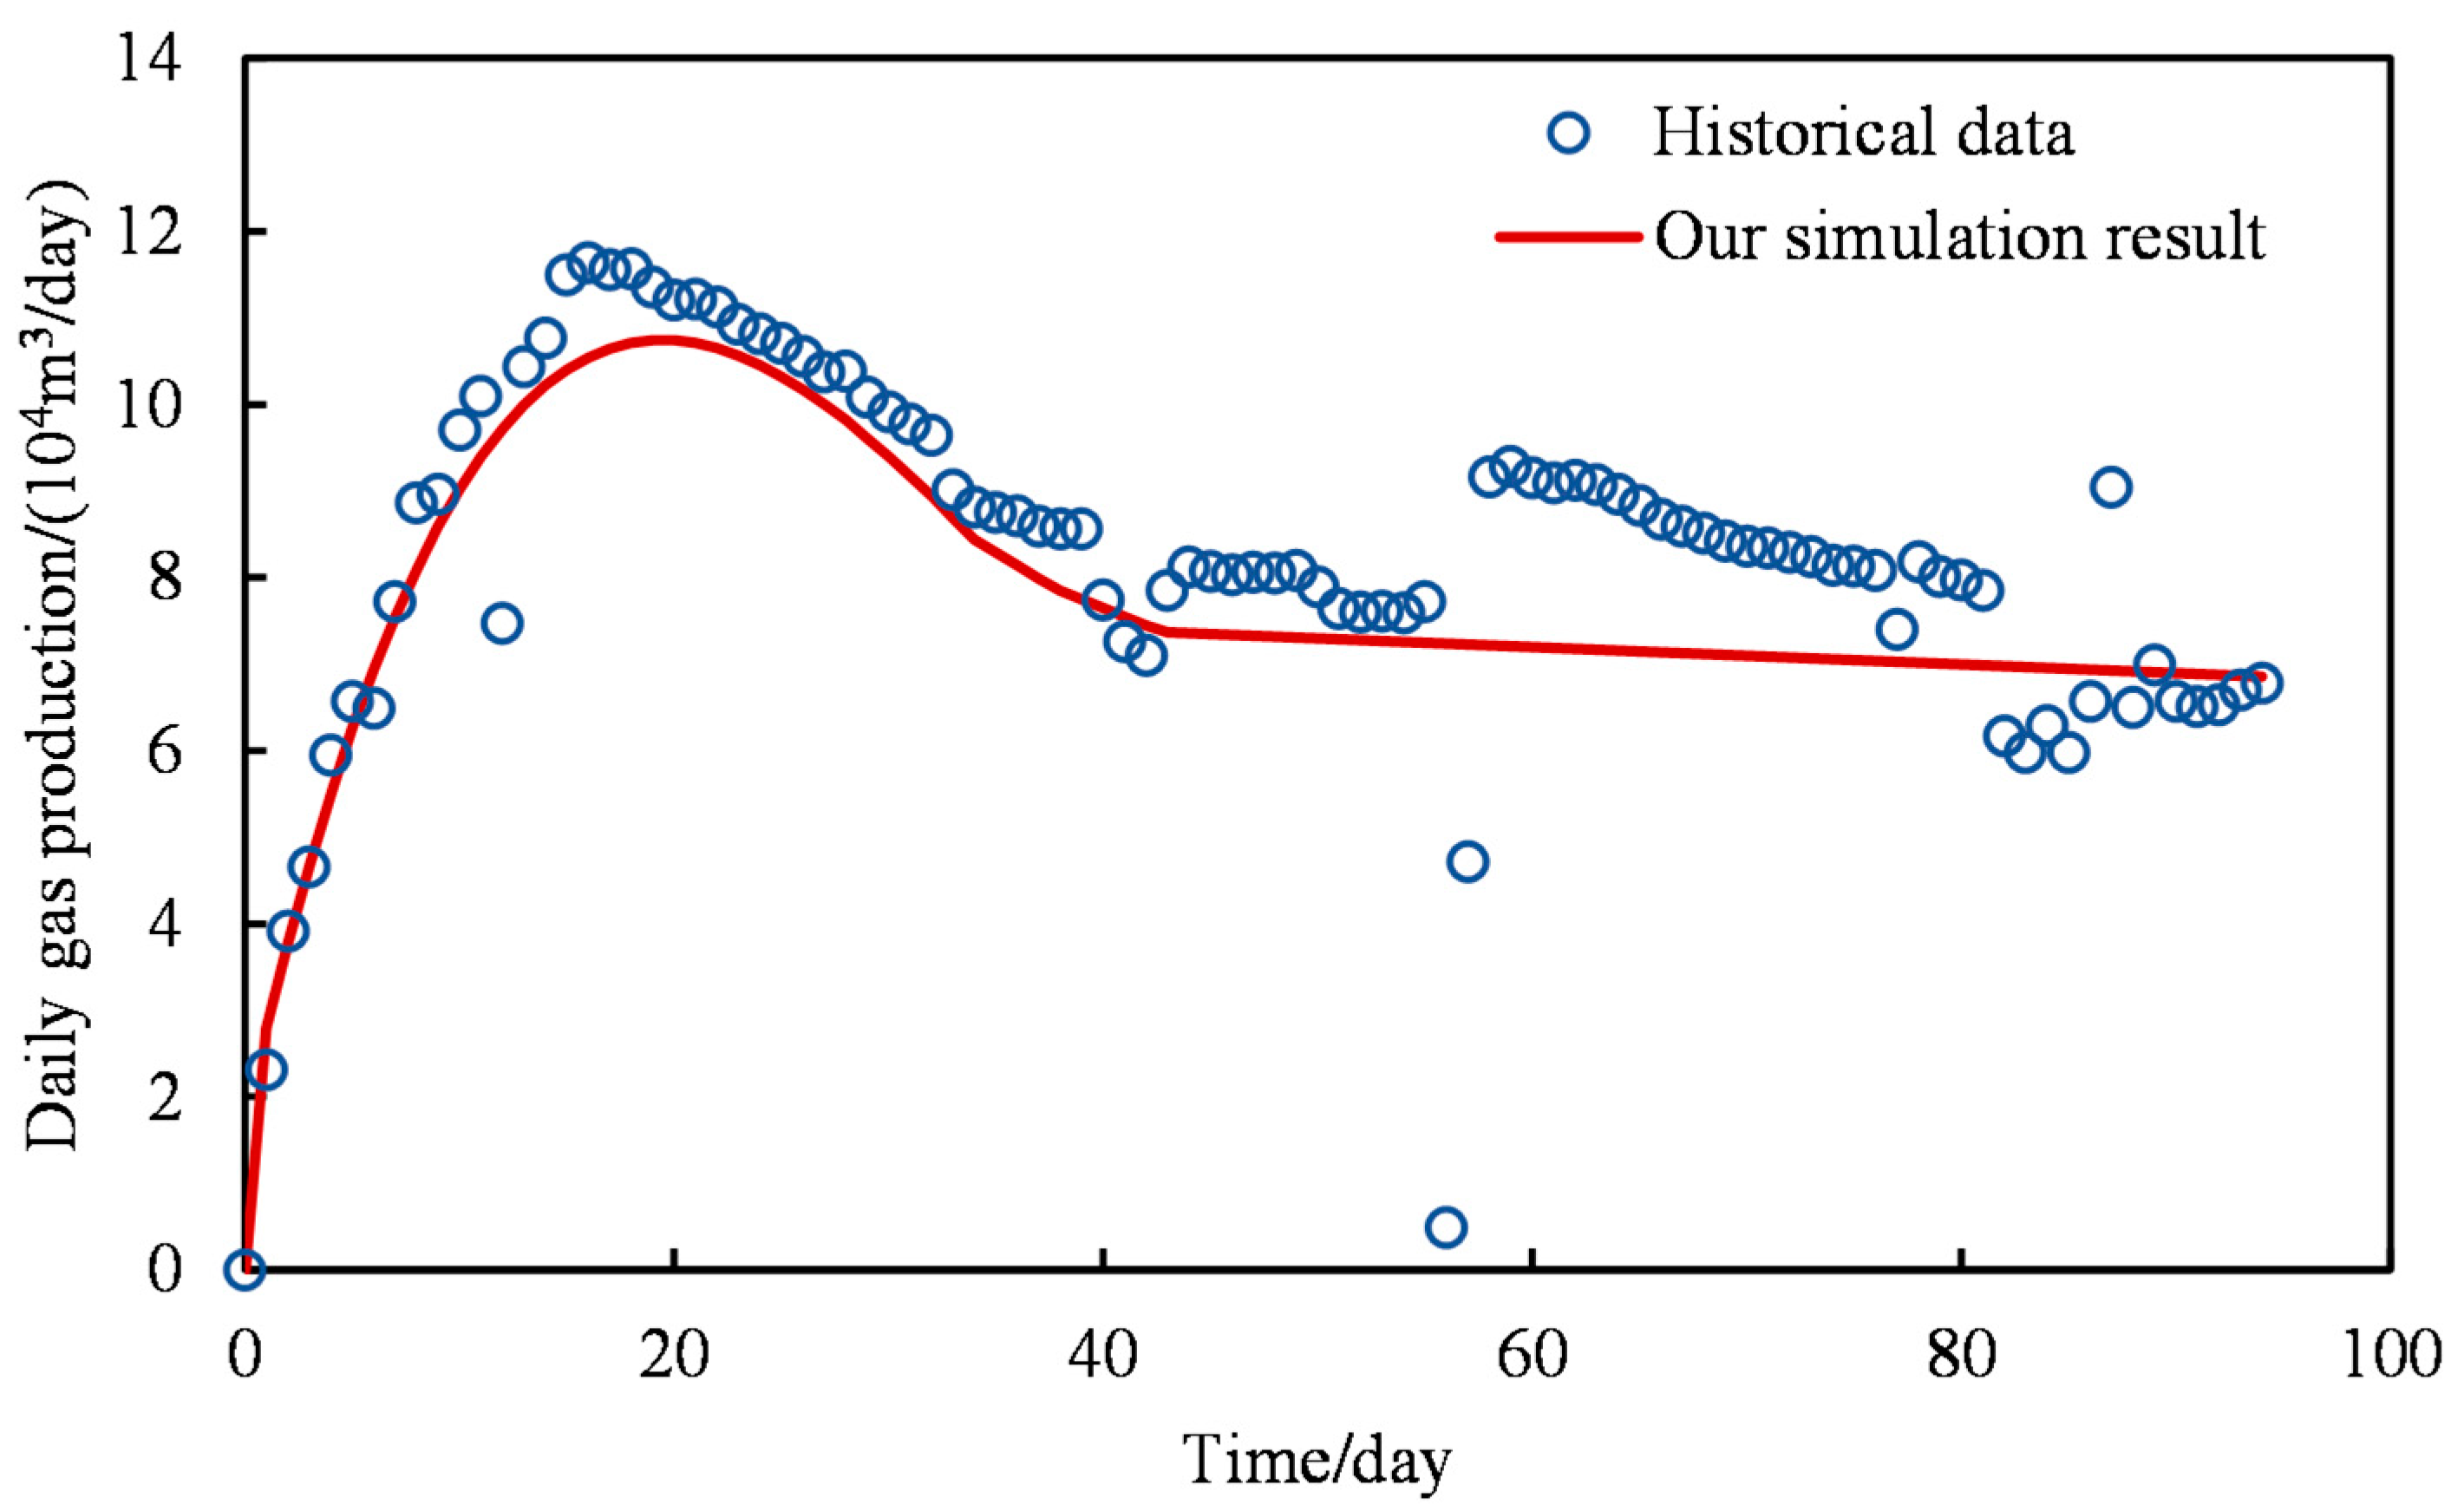
Figure 6: Historical fitting curve.
To further elucidate the macroscopic flow dynamics and the impact of the fracture network during depletion, the spatial distributions of reservoir pressure and water saturation were extracted from the matched model, as depicted in Fig. 7.
Fig. 7a illustrates the pressure field after a period of production. A distinct, continuous pressure depletion zone forms around the hydraulic fractures, highlighting the dominant role of the SRV in draining the matrix. Correspondingly, Fig. 7b demonstrates the water saturation field, where gas desorption and expansion alter the two-phase flow dynamics, leading to local variations in water saturation near the fracture faces. These spatial field results not only verify the physical rationality of the EDFM framework but also provide a solid foundation for the subsequent analysis of inter-well interference.
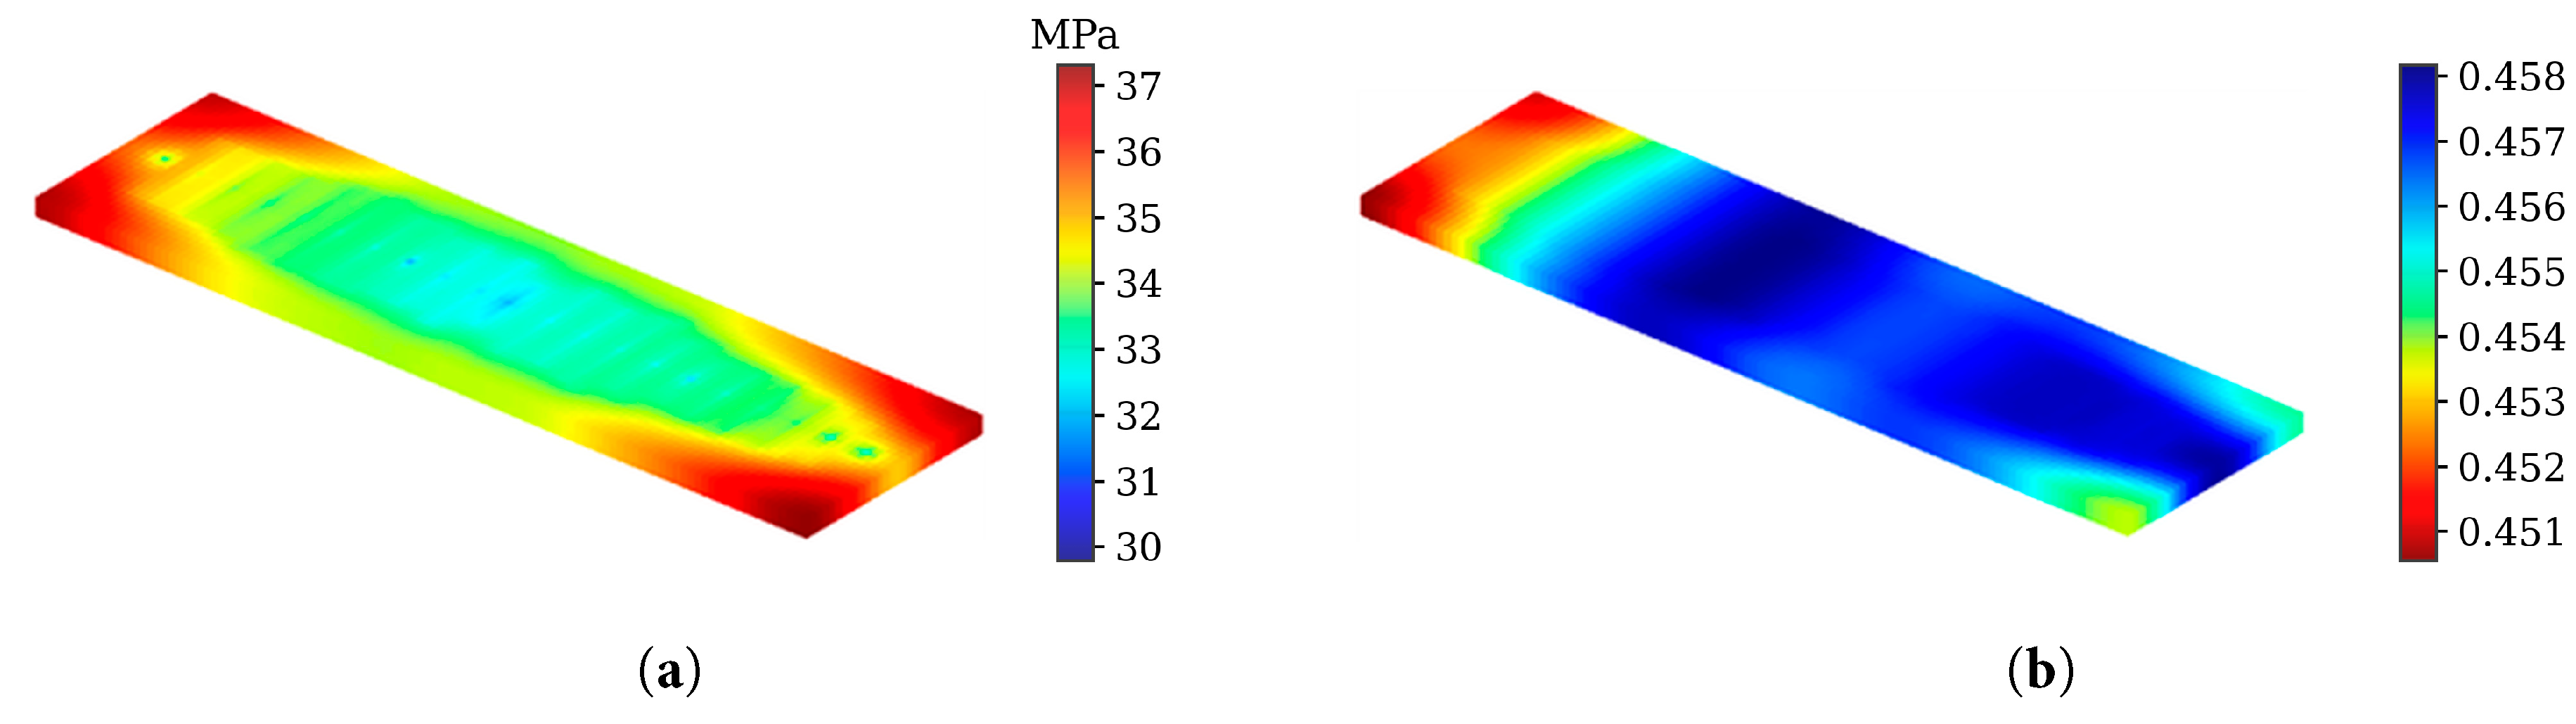
Figure 7: Pressure and saturation field. (a) Pressure; (b) Water saturation.
Based on the aforementioned model, numerical simulation studies are conducted on segmented fractured horizontal wells in closed shale gas reservoirs.
3.1 Shale Gas Transport Mechanisms
To analyze the impact of different transport modes on production capacity, the production capacity of shale gas is assessed under the influence of three distinct mechanisms: shale gas adsorption, shale gas diffusion, and shale stress sensitivity.
To investigate the variation of shale gas production capacity under different stress sensitivity coefficients, changes in shale gas production capacity are calculated for stress sensitivity coefficients of 0.01–0.04, based on the actual fitting results obtained from shale core experiments. The specific results are depicted in Fig. 8.
Fig. 8 illustrates the variation in cumulative gas production under different stress sensitivity coefficients. The results indicate that as the stress sensitivity coefficient increases, the cumulative gas production from the shale gas reservoir gradually decreases. When the stress sensitivity coefficient reaches 0.04, the cumulative gas production decreases by approximately 30%. This reduction can be attributed to the increased stress sensitivity coefficient, resulting in stronger stress sensitivity in shale formations. Consequently, fractures and pores in the reservoir contract or even close under effective stress, leading to reduced permeability and porosity in the reservoir and subsequently decreased gas production from the shale gas reservoir.
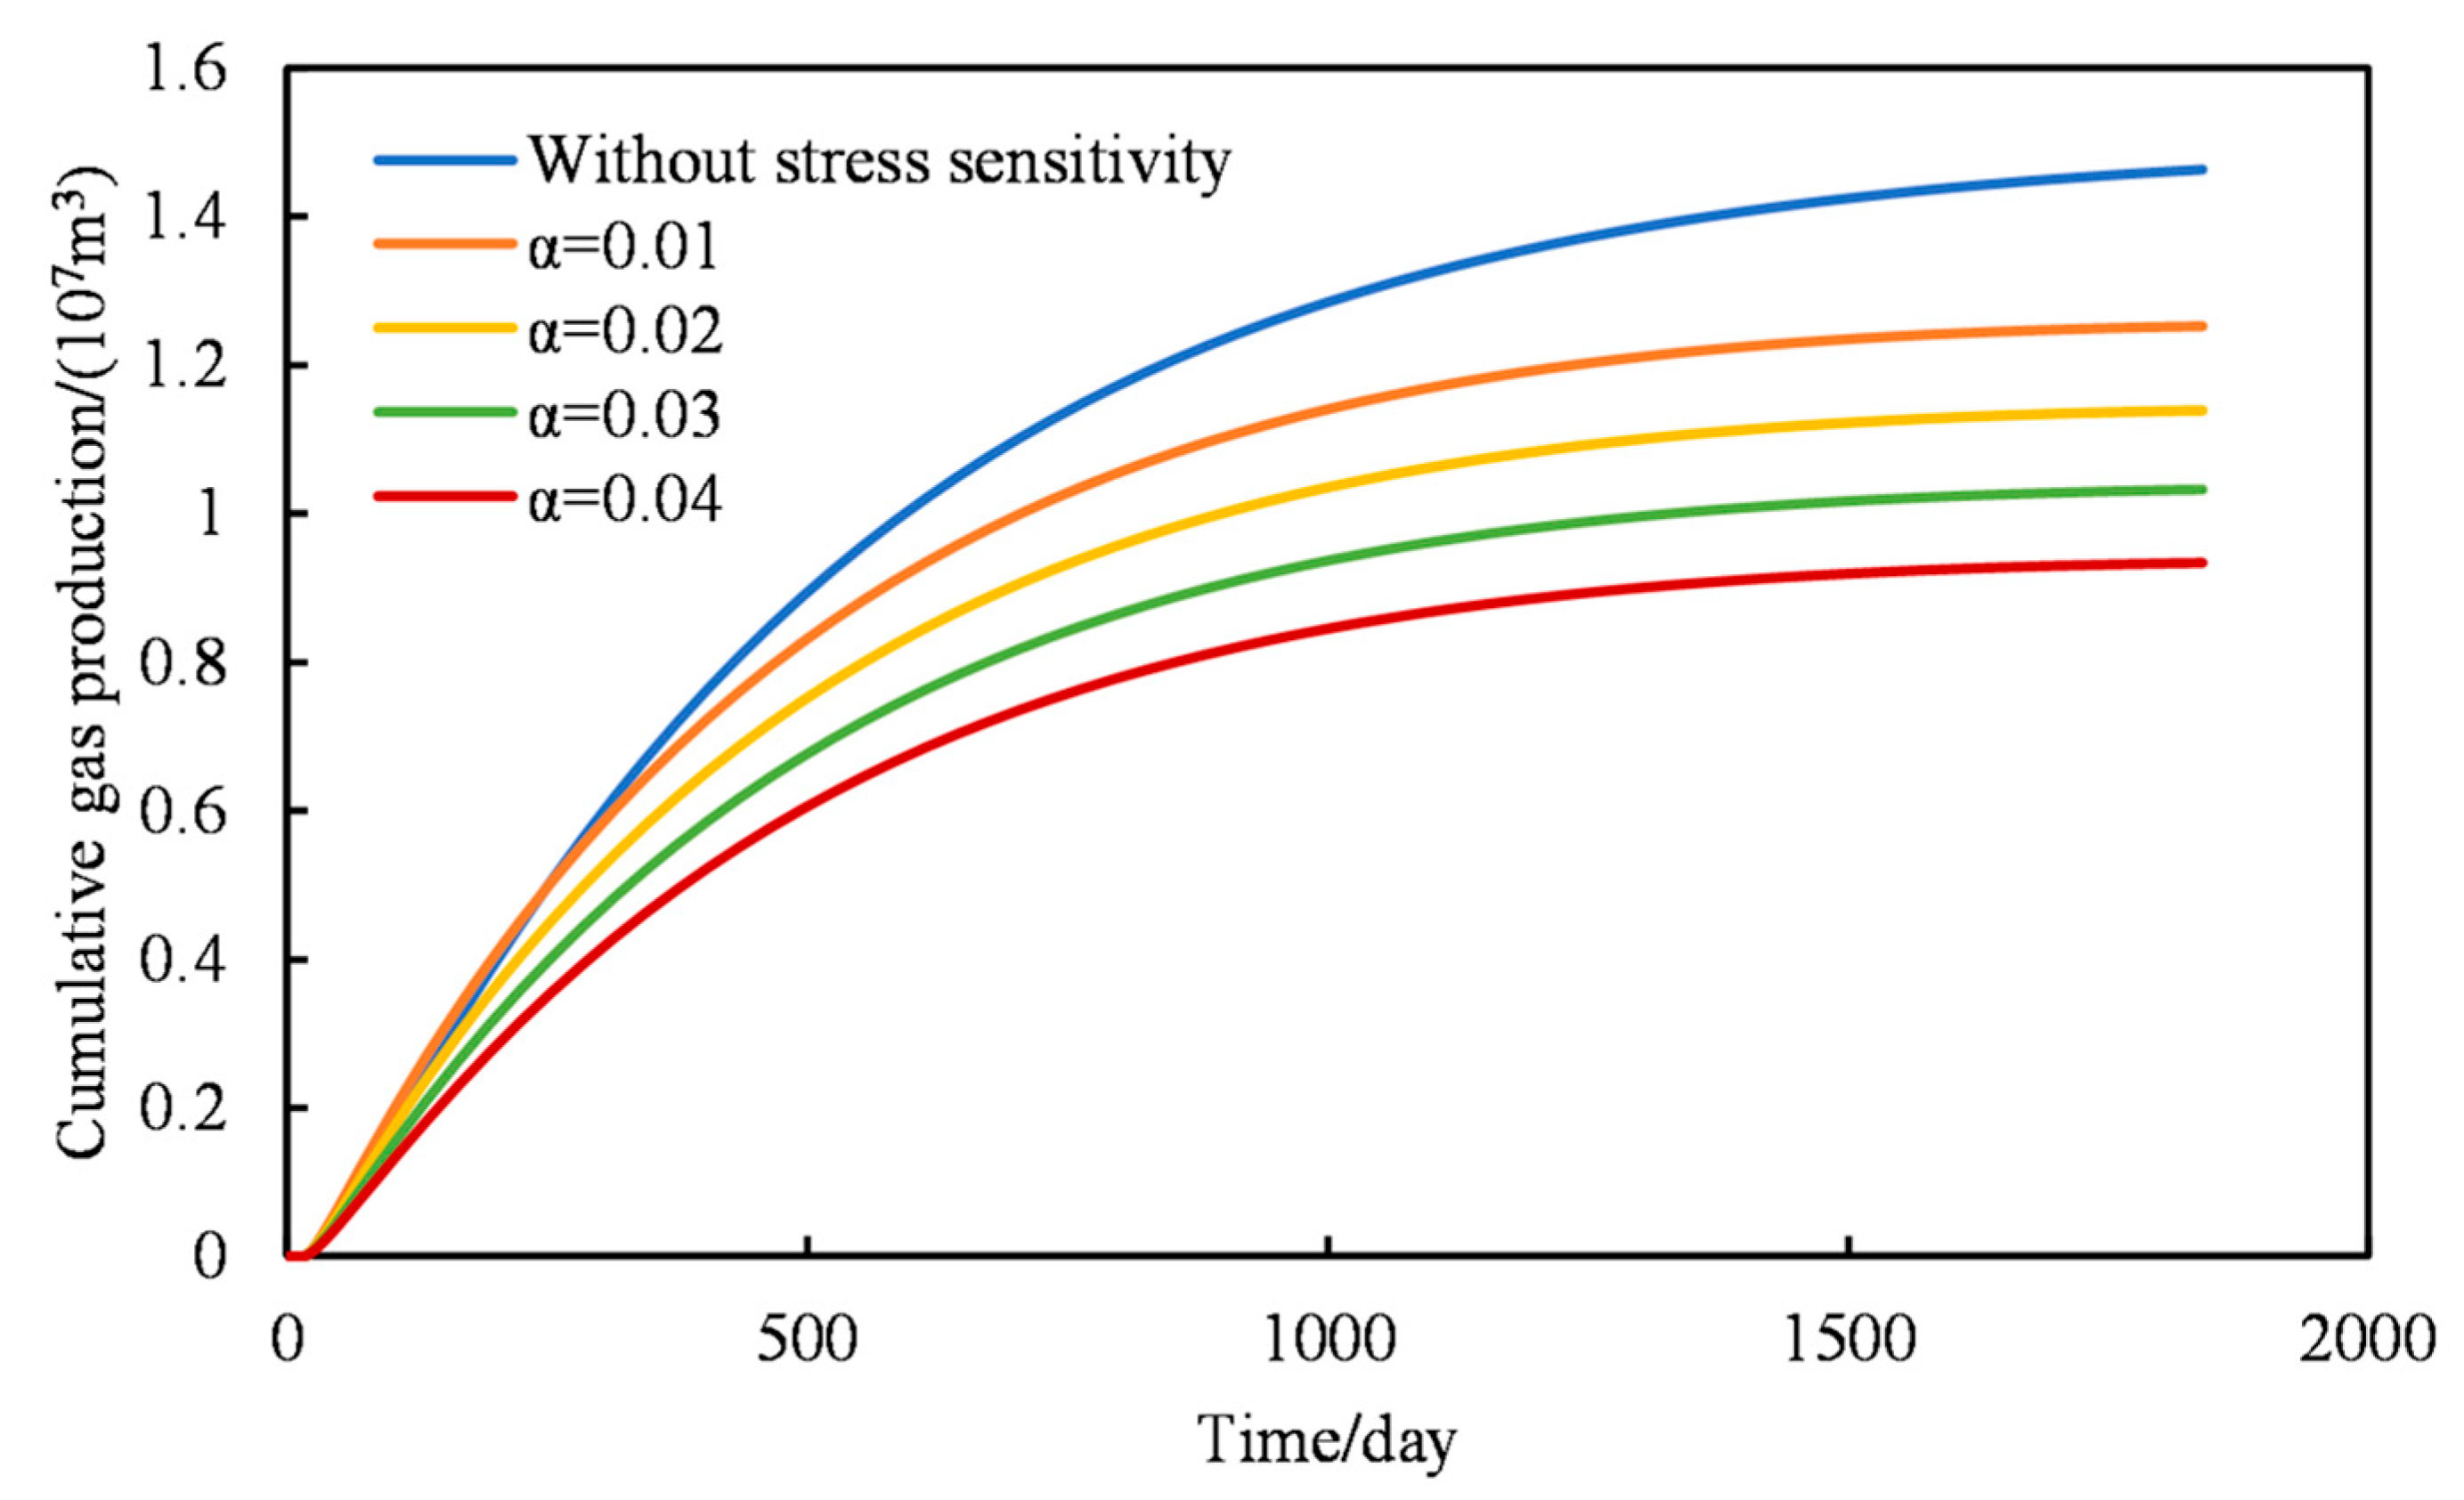
Figure 8: Shale gas productivity curves for various stress sensitivity coefficients.
To investigate the variation of shale gas production under different diffusion coefficients, changes in shale gas production capacity are calculated for diffusion coefficients of 1.5–3 × 10⁻⁷ m2/s. The specific results are depicted in Fig. 9a.
Fig. 9a illustrates the variation in cumulative gas production under different diffusion coefficients when the matrix permeability is 0.008 mD. The results indicate that as the diffusion coefficient increases, the cumulative gas production from the shale gas reservoir gradually increases. When the diffusion coefficient reaches 3 × 10⁻⁷ m2/s, the cumulative gas production increases by approximately 15%. This increase can be attributed to the faster diffusion of shale gas dissolved in kerogen into the matrix pores as the diffusion coefficient increases, leading to an increase in shale gas production.
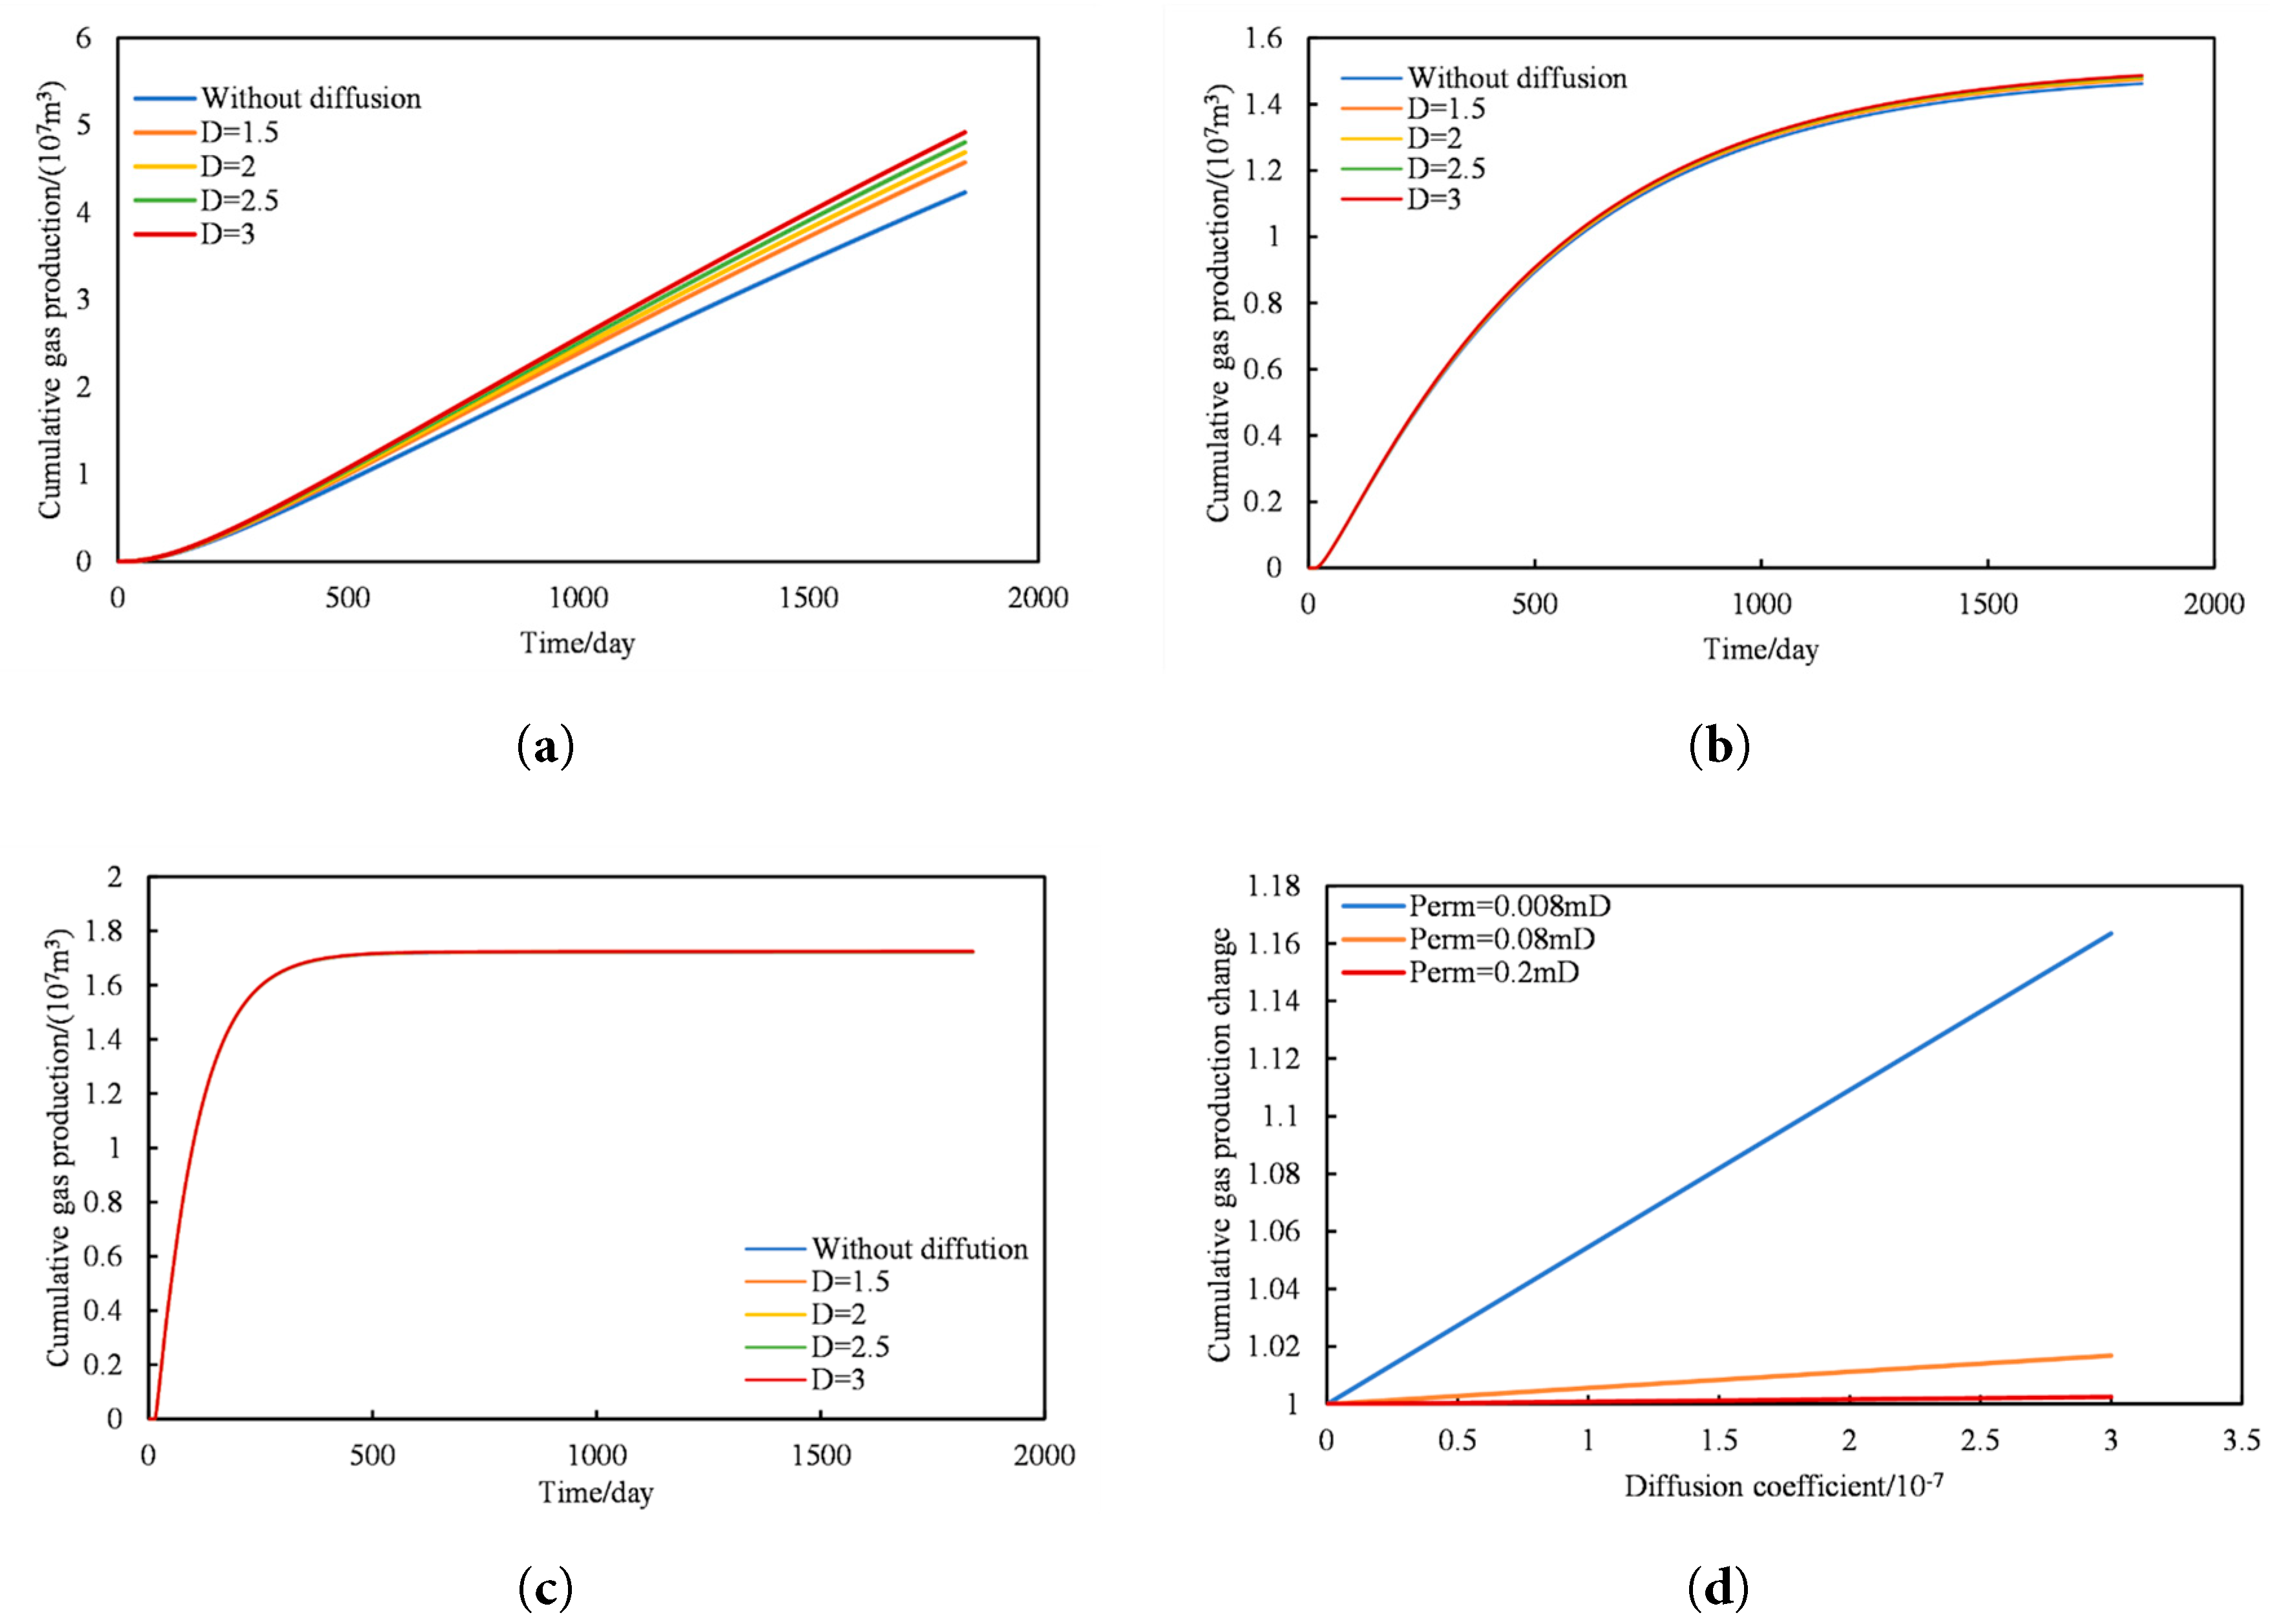
Figure 9: Analysis of the influence of diffusion on shale gas productivity under varying matrix permeability. (a) m = 0.008 mD; (b) m = 0.08 mD; (c) m = 0.2 mD; (d) comparison.
Simultaneously comparing and analyzing the cumulative gas production of shale gas reservoirs with matrix permeabilities of 0.08 mD and 0.2 mD is shown in Fig. 9b,c, respectively. Indeed, it is evident that as the matrix permeability increases, the impact of diffusion on gas production diminishes.
Fig. 9d presents a comparative analysis of the cumulative gas production of shale gas reservoirs under different matrix permeabilities with varying diffusion coefficients. From Fig. 9d, it can be intuitively observed that within the same range of diffusion coefficient variation (1.5–3 × 10⁻⁷ m2/s), lower matrix permeability leads to a greater impact of shale gas diffusion on shale gas production. Compared with the reference case of a diffusion coefficient of 1.5 × 10⁻⁷ m2/s, increasing the diffusion coefficient to 3 × 10⁻⁷ m2/s raises the cumulative gas production by approximately 16.3% when the matrix permeability is 0.008 mD, whereas at a matrix permeability of 0.2 mD the cumulative gas production changes by only about 0.2%.
Fig. 10 illustrates the influence of adsorption on shale gas production. The findings reveal that adsorbed gas accounts for approximately 7% of the total gas production from shale gas reservoirs. The reason for this limited contribution is that the Langmuir isotherm is almost flat in the high-pressure range: as long as the reservoir pressure remains high, a large pressure drop releases only a small amount of adsorbed gas, so desorption is essentially suppressed during the early and middle production stages. Consequently, as depicted in Fig. 10, it is evident that during the later stages of shale gas production, the contribution of adsorbed gas to production gradually increases as reservoir pressure decreases.
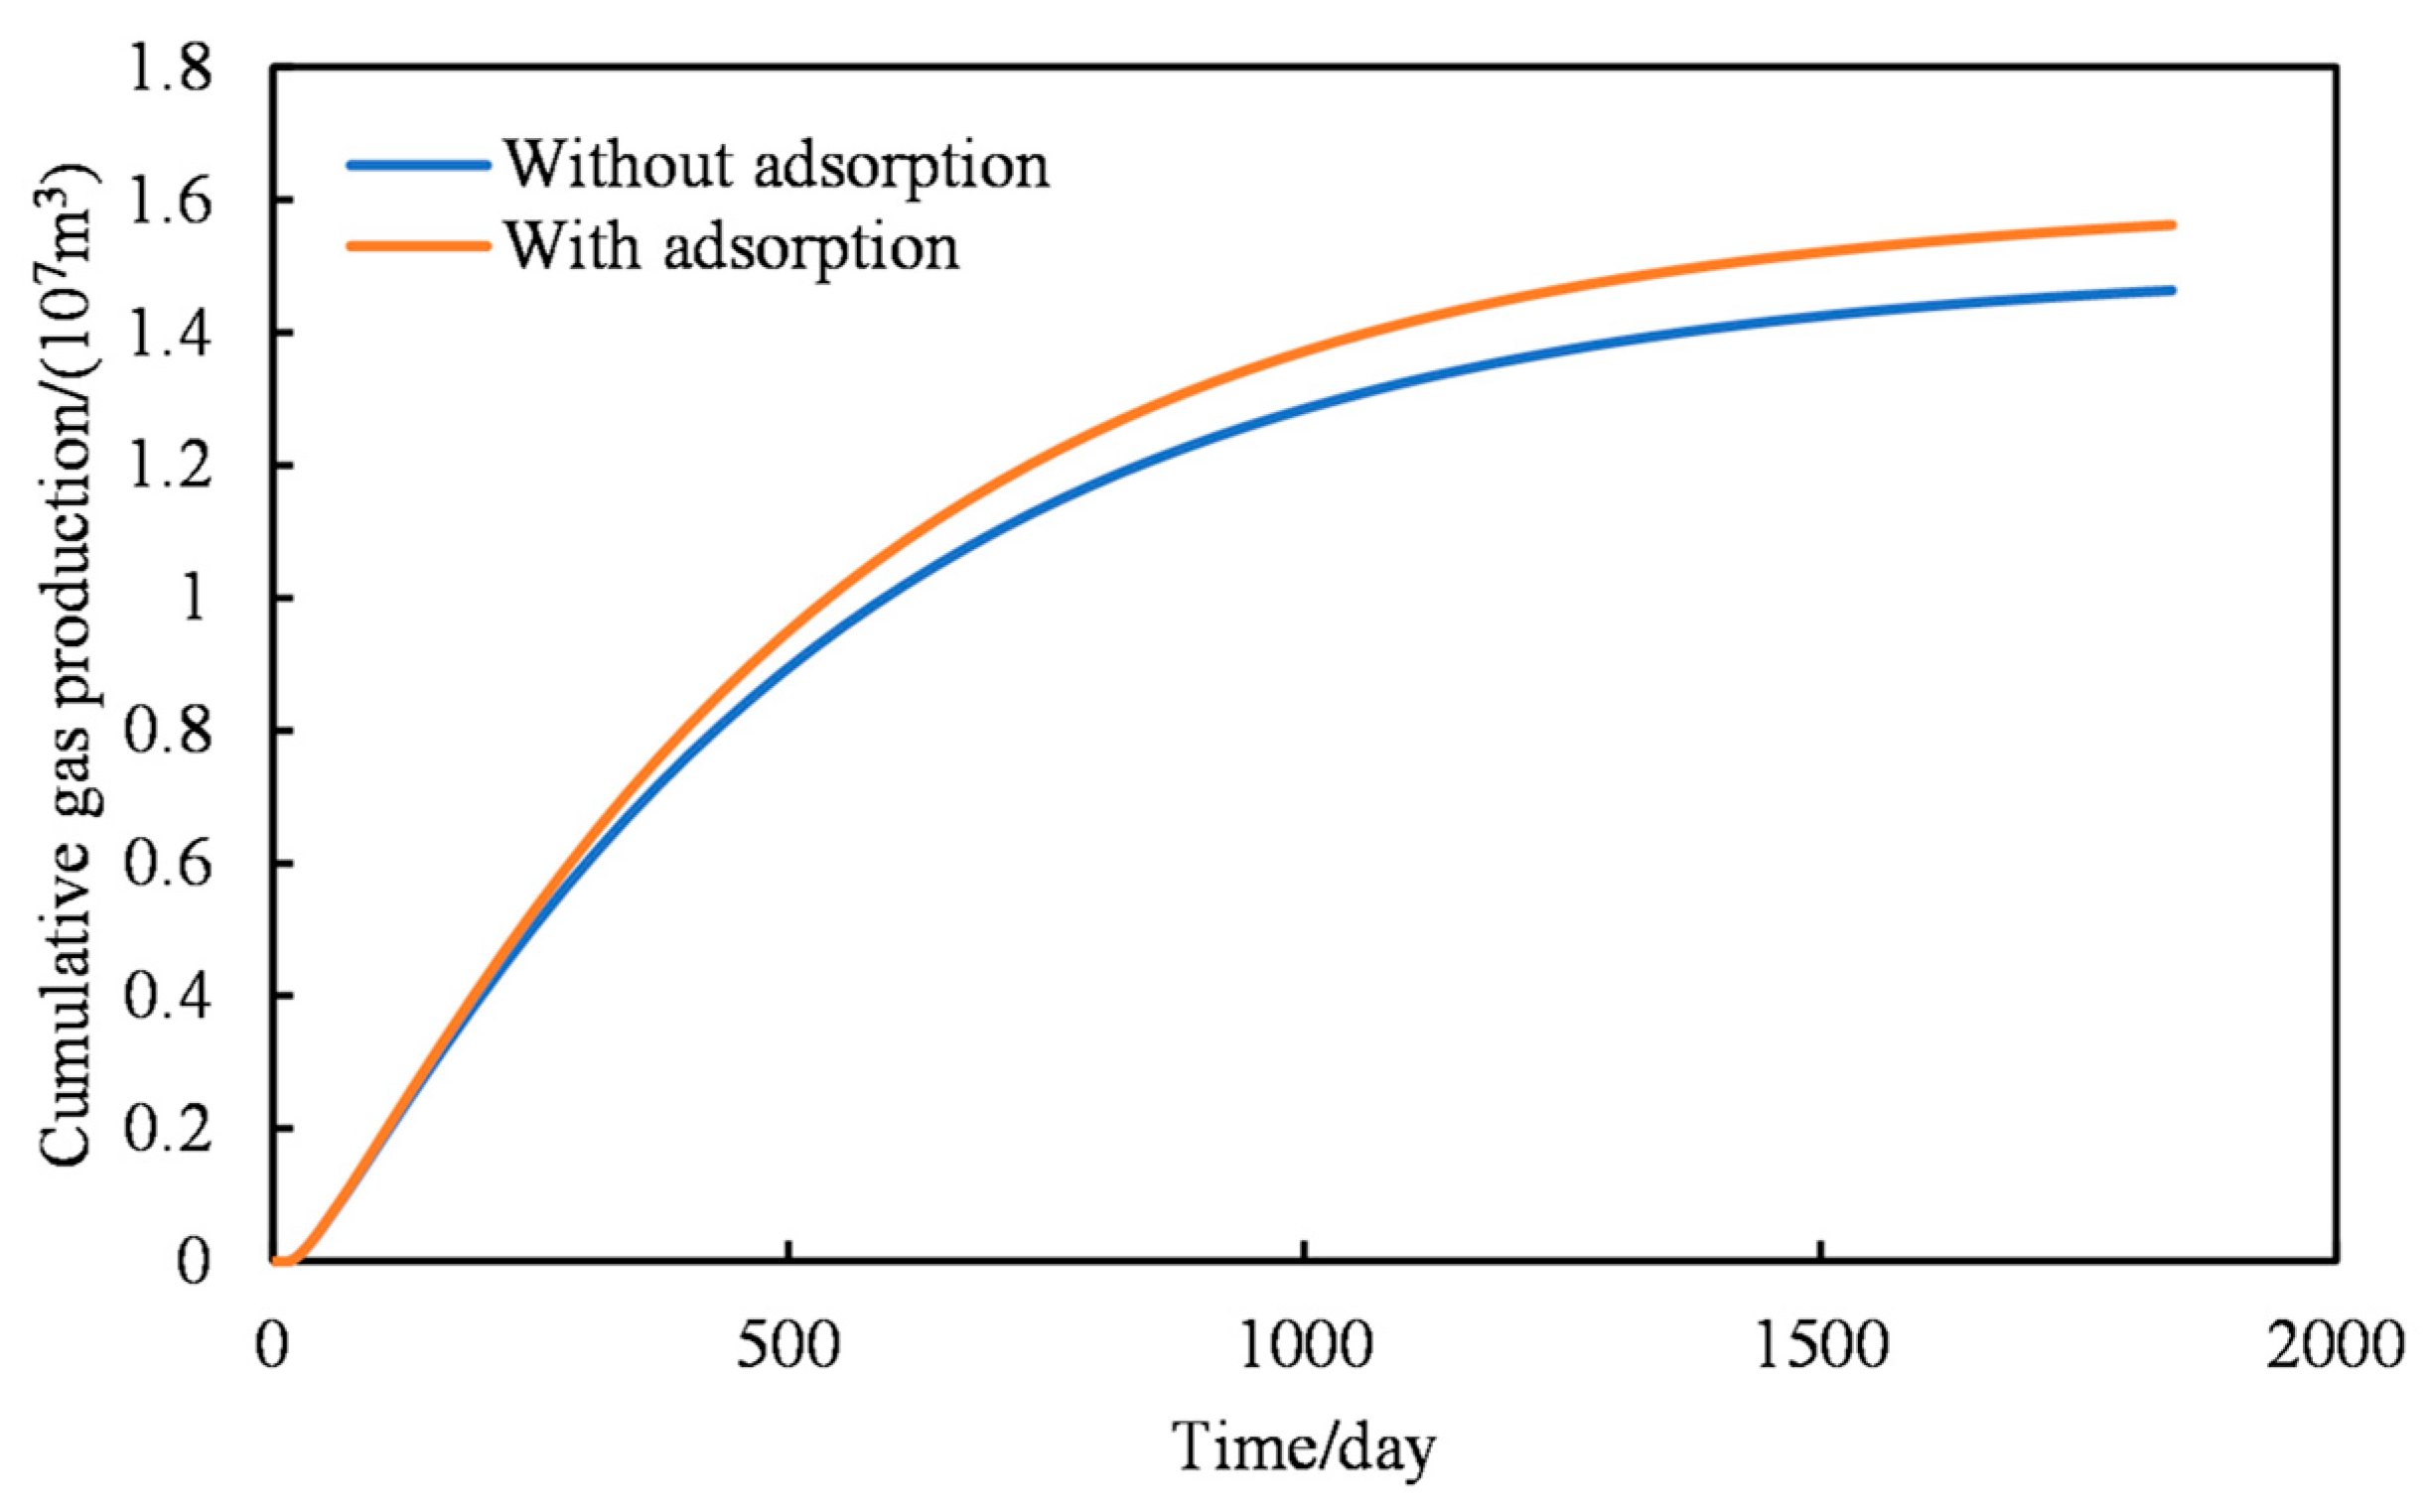
Figure 10: Effect of adsorption on shale gas productivity.
3.2 Frac-Hit Mechanisms and Inter-Well Interference Types
This study focuses on investigating the two primary mechanisms underlying frac-hit phenomena and inter-well interference: (1) indirect interference through matrix-mediated pressure communication, and (2) direct frac-hit interference through hydraulic fracture intersection between the parent well and the infill well. When the well spacing is sufficiently large, the inter-well pressure differential is moderate, or the scale of hydraulic stimulation is limited, direct hydraulic connectivity between two wells within the same or adjacent pads is unlikely to develop. As depicted in Fig. 11a, the hydraulic connectivity between the two fractured horizontal wells is restricted under such conditions. In these scenarios, inter-well interference is primarily manifested as pressure interference, wherein the bottom hole pressure (BHP) of the parent well is gradually influenced by the production activities of the infill well through the matrix. In contrast, when the well spacing is small and the scale of hydraulic stimulation is substantial, direct frac-hit interference between adjacent wells becomes far more likely, as illustrated in Fig. 11b. Production from the parent well tends to induce localized pressure depletion in the surrounding reservoir, which in turn promotes the asymmetric propagation of hydraulic fractures from newly stimulated infill wells toward the depleted region of the parent well, ultimately resulting in direct frac-hit events [46]. It should be emphasised that these two mechanisms are physically distinct rather than two intensities of the same process, and this distinction is one of the central messages of the present work. Matrix-mediated interference is a diffusive, pressure-driven process: the disturbance travels through the ultra-low-permeability matrix, so its arrival is delayed by months, its amplitude is governed by matrix permeability and inter-well distance, and it amounts to a competition between the two wells for the same drainage volume, with no mass exchange of fracturing fluid. Direct frac-hit interference, by contrast, is a conductive process: once the hydraulic fractures of the infill well intersect the fracture network of the parent well, a high-conductivity pathway is created, the pressure pulse and the fracturing fluid reach the parent well within hours to days, the amplitude is governed by the number and conductivity of the connected fractures rather than by matrix properties, and the invading liquid additionally impairs the gas-phase relative permeability inside the parent-well fractures. The two mechanisms therefore differ in propagation velocity, in controlling parameters and in reversibility, and they are simulated separately below [47].
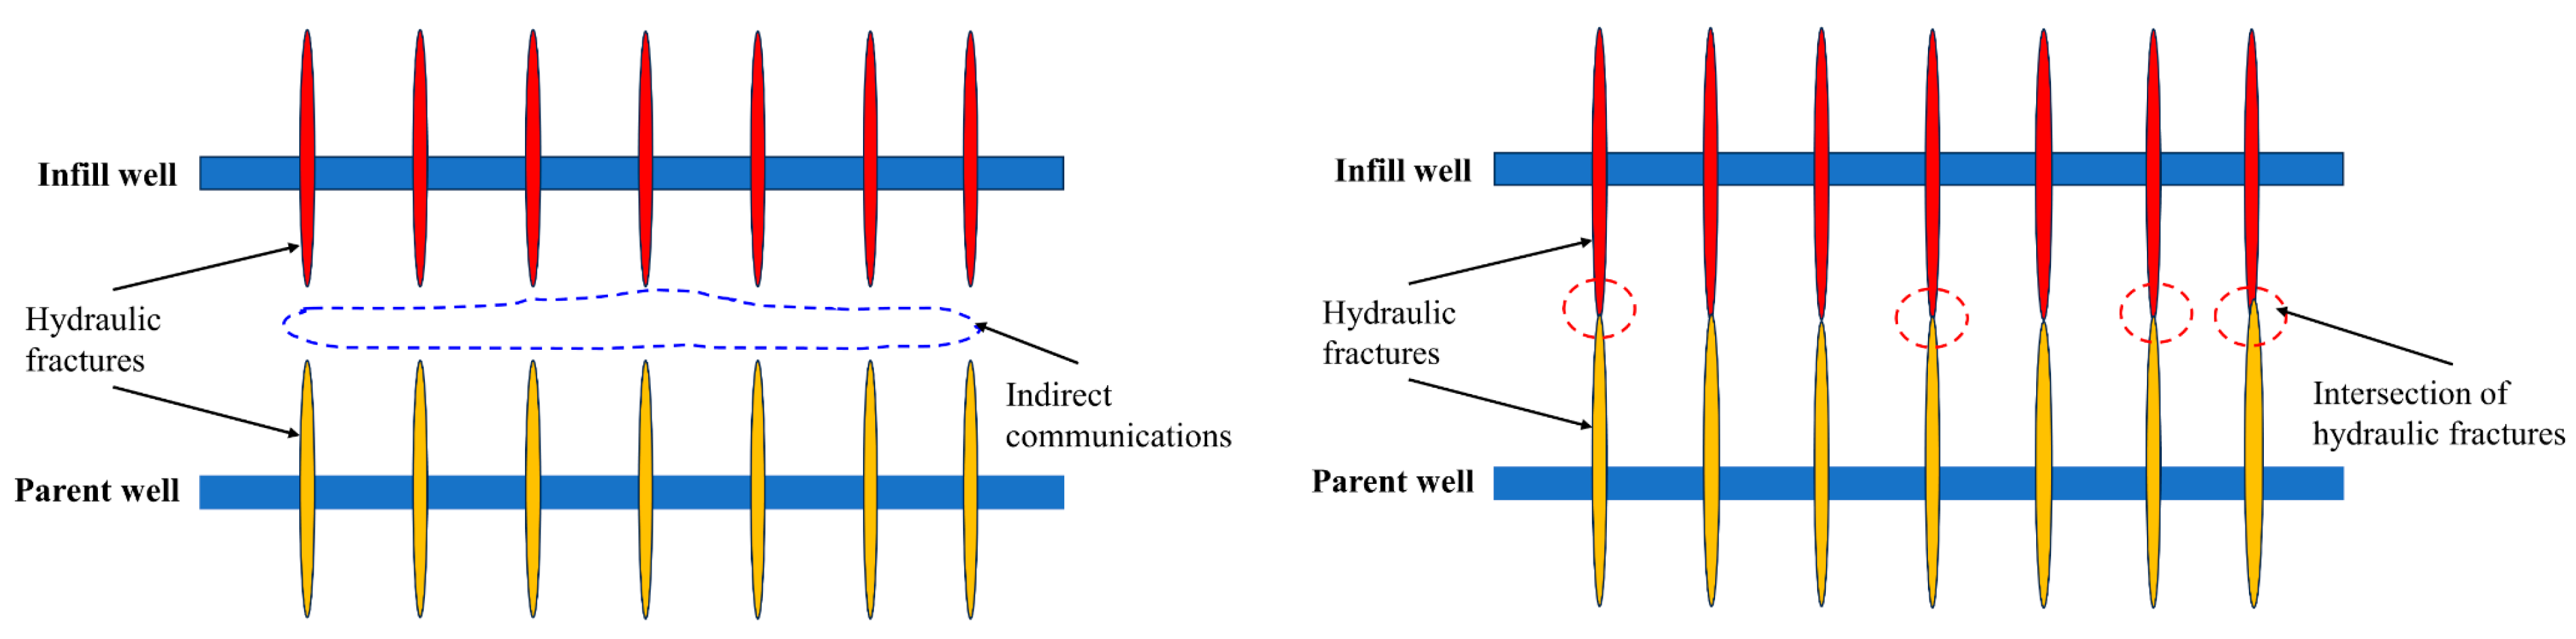
Figure 11: Schematic diagram of two types of inter-well interference. (a) Indirect communication; (b) Direct communication.
Numerical simulations were conducted to analyze the inter-well interference behavior between infill wells and parent wells under the two frac-hit mechanisms described above. The results are presented in Fig. 12. Fig. 12a illustrates that, when direct frac-hit communication occurs through intersecting hydraulic fractures, the daily gas production of the parent well at 145 days post-fracturing returns to the level observed at the same time prior to infill-well stimulation. Subsequently, the negative impact of frac-hit-induced interference becomes dominant, and this time point is defined as T1. After 317.2 days post-fracturing, the cumulative production loss caused by the negative interference compensates for the earlier positive contribution, beyond which the cumulative gas production of the parent well continuously falls below the pre-fracturing baseline. This time point is defined as T2. During the period prior to T1, the productivity of the parent well is markedly enhanced, suggesting a transient positive stimulation effect imposed by the infill well. However, once the production duration exceeds T2, the productivity of the parent well falls below that of the no-frac-hit baseline scenario, indicating a pronounced long-term negative impact induced by the frac hit.
Fig. 12b demonstrates that, when interference occurs through matrix-mediated pressure communication, T1 is extended to 281.7 days. Compared with the direct frac-hit case, matrix-mediated interference exhibits a more prolonged positive effect and a much weaker negative impact. Therefore, the intensity of inter-well interference associated with matrix-mediated communication is significantly lower than that of direct frac-hit interference. This is because, once the parent and infill wells are directly connected through intersecting hydraulic fractures, the fracturing fluid injected into the infill well, together with the associated pressure pulse, can rapidly propagate to the parent well, thereby disturbing its production performance. Accordingly, during the design and execution of infill well fracturing operations, it is of paramount importance to prevent hydraulic fractures from extending into and intersecting with the existing fracture network of the parent well, in order to suppress frac-hit-induced inter-well interference to the greatest extent possible.
Beyond their descriptive role, T1 and T2 provide two indicators that can be used directly in field operations. T1 marks the end of the transient production gain and therefore defines the window within which the parent well can still benefit from the pressure recharge supplied by infill-well fracturing; scheduling the shut-in, flowback and rate-restoration programme of the parent well inside this window allows the temporary energy supplement to be captured before the interference turns negative. T2 marks the moment at which the cumulative loss cancels the earlier gain and thus constitutes the economic threshold of a frac hit: if the expected remaining producing life of the parent well is shorter than T2, the frac hit is on balance tolerable, whereas a remaining life appreciably longer than T2 indicates that mitigation is required before the infill well is stimulated. Because both time points shorten as the number of connected fractures increases, as shown in Section 3.3, they may also be used inversely: an unusually early T1 observed in the field is a diagnostic signal that a strong multi-fracture hydraulic connection has been created, and that measures such as reducing the fluid volume of the stages nearest to the parent well, applying temporary plugging and diversion, or re-pressurising the parent well before stimulation should be adopted [16,47].
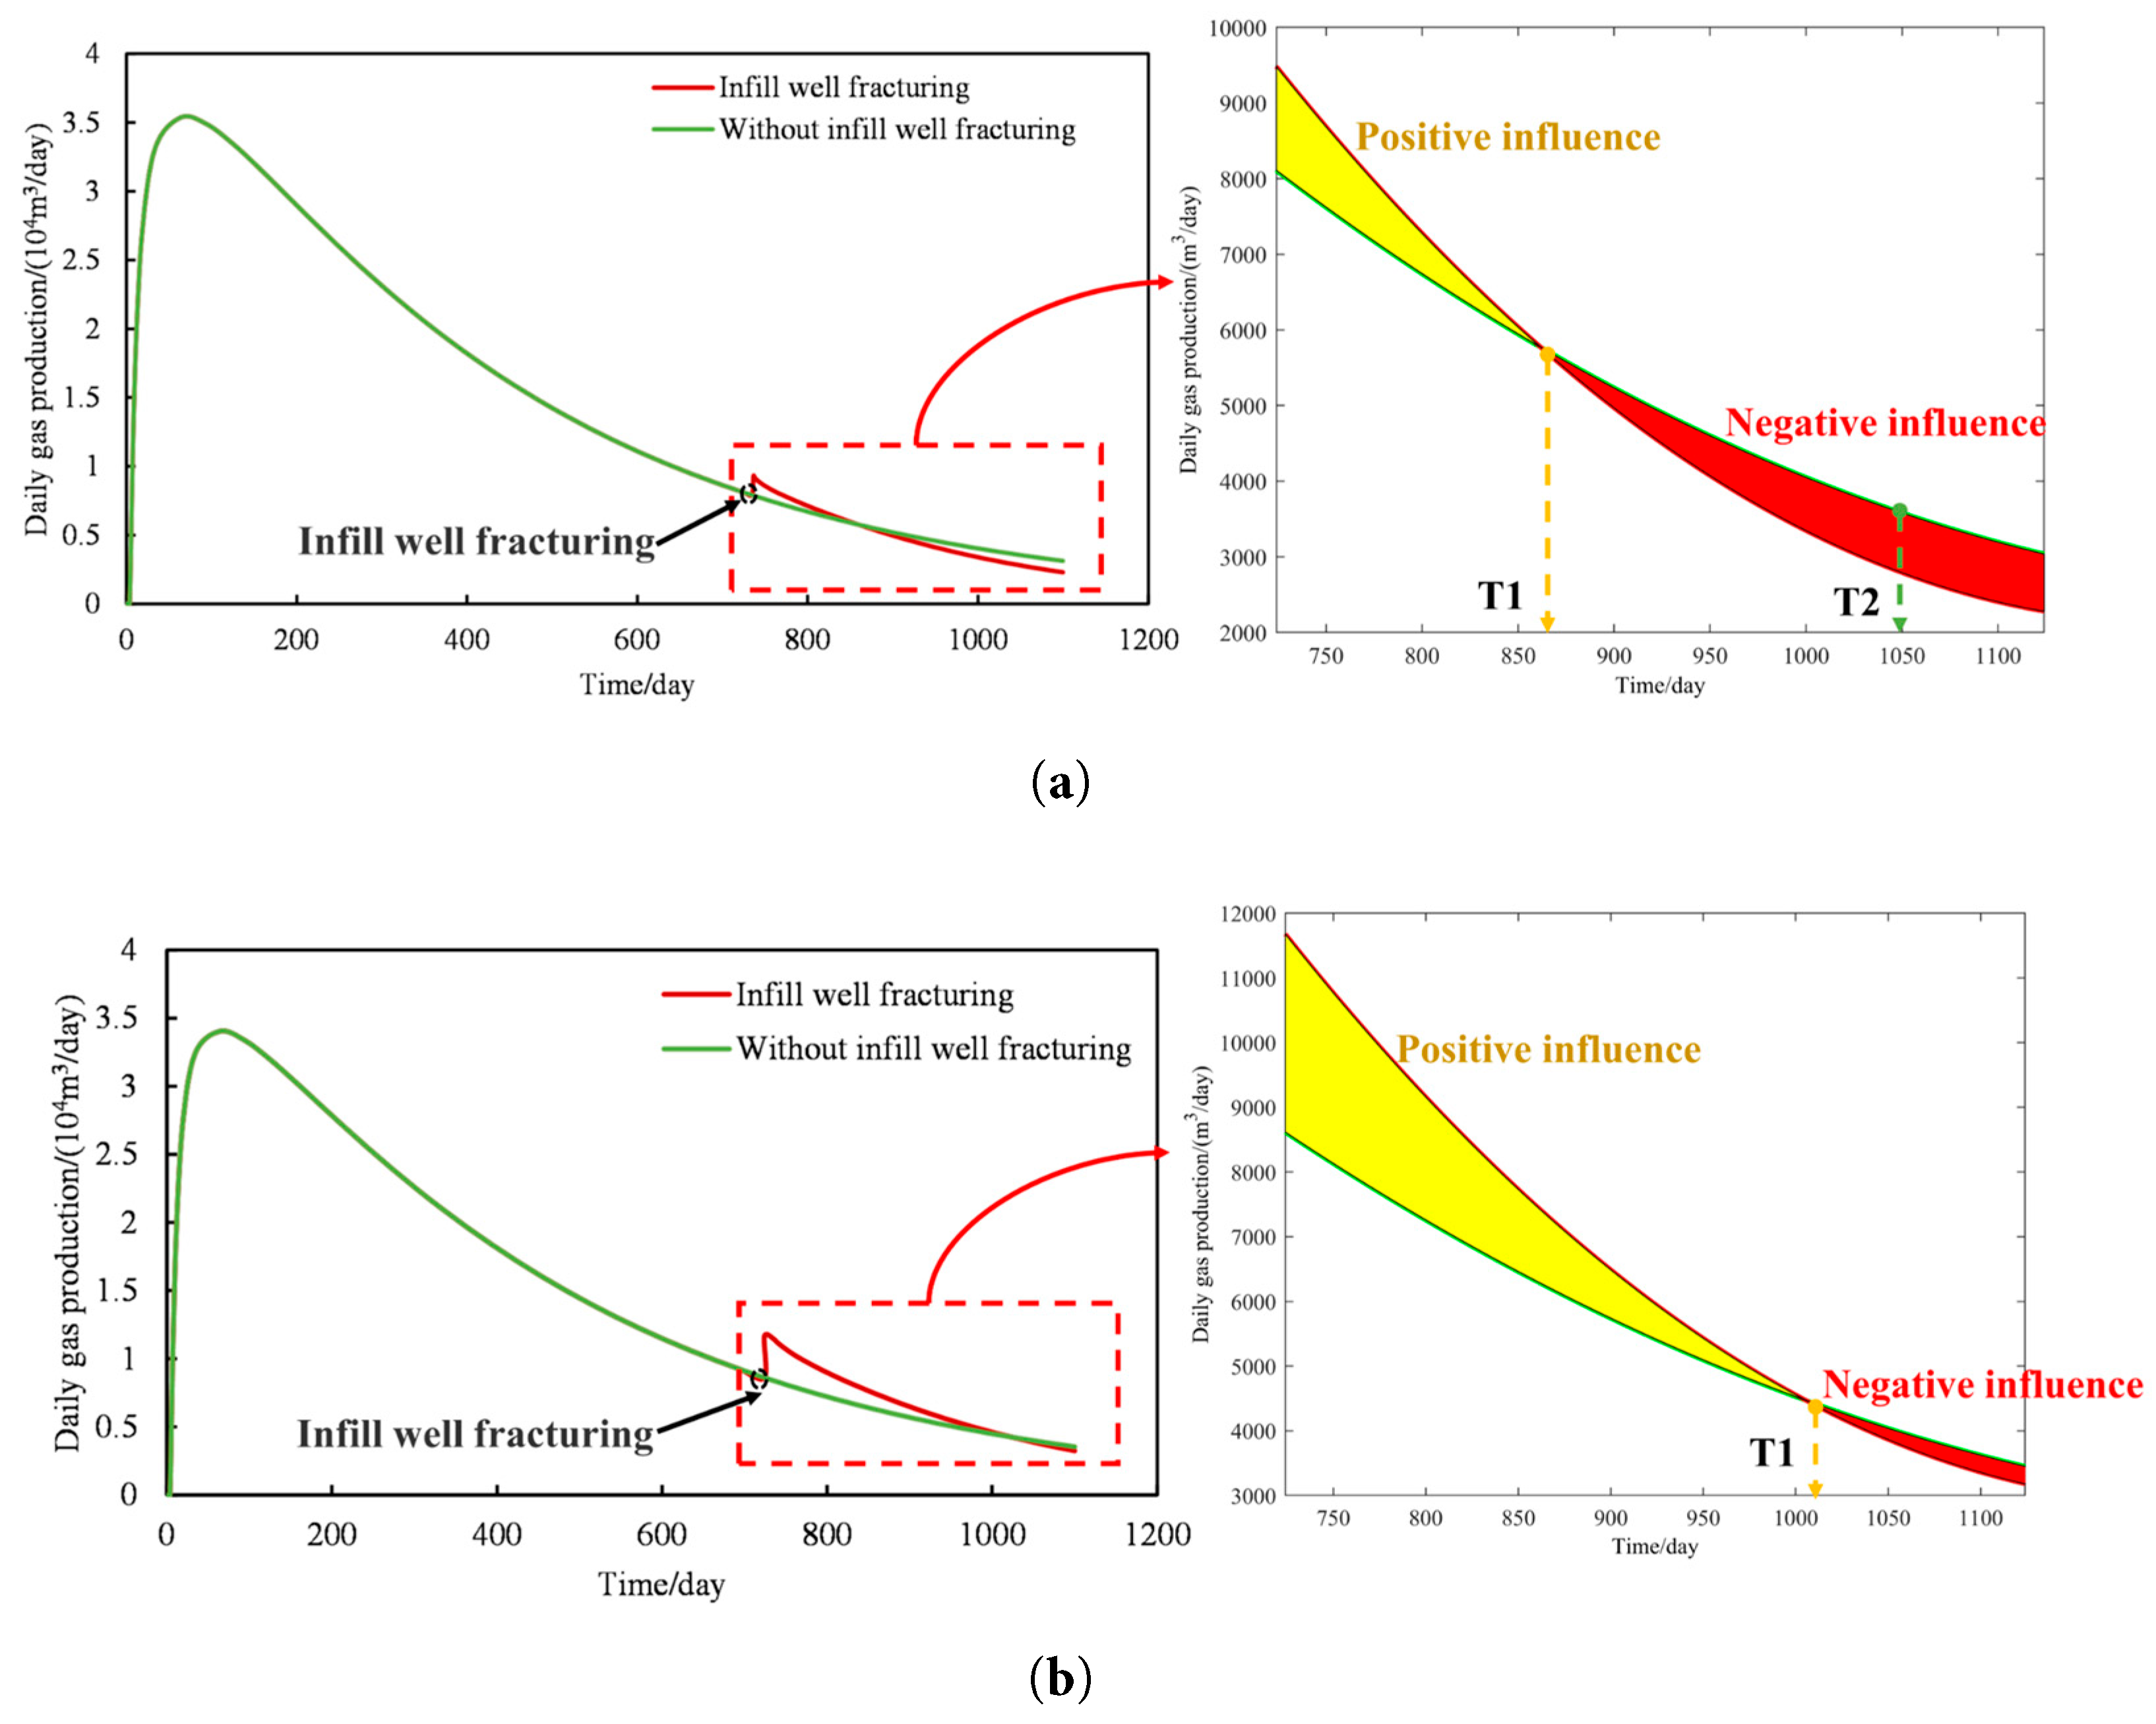
Figure 12: The influence of different interference modes on the gas production of the parent well. (a) Fracture communication; (b) Matrix communication.
3.3 Effect of Frac-Hit Intensity: Number of Connected Fractures
Fig. 13 illustrates the variation of frac-hit-induced inter-well interference intensity for the parent well under different numbers of connected (i.e., frac-hit) fractures, specifically 5, 10, 15, and 20. As the number of frac-hit fractures increases, both T1 and T2 exhibit a consistent decreasing trend. This observation indicates that, as more hydraulic fractures from the infill well successfully intercept the parent well following stimulation, the transient positive effect imposed on the parent well becomes progressively weaker, whereas the long-term negative impact is markedly intensified. This phenomenon arises because the increased number of frac-hit pathways facilitates the rapid propagation of fracturing fluid and pressure disturbances from the infill well to the parent well under the existing inter-well pressure differential, thereby aggravating the deterioration of the overall productivity of the parent well.
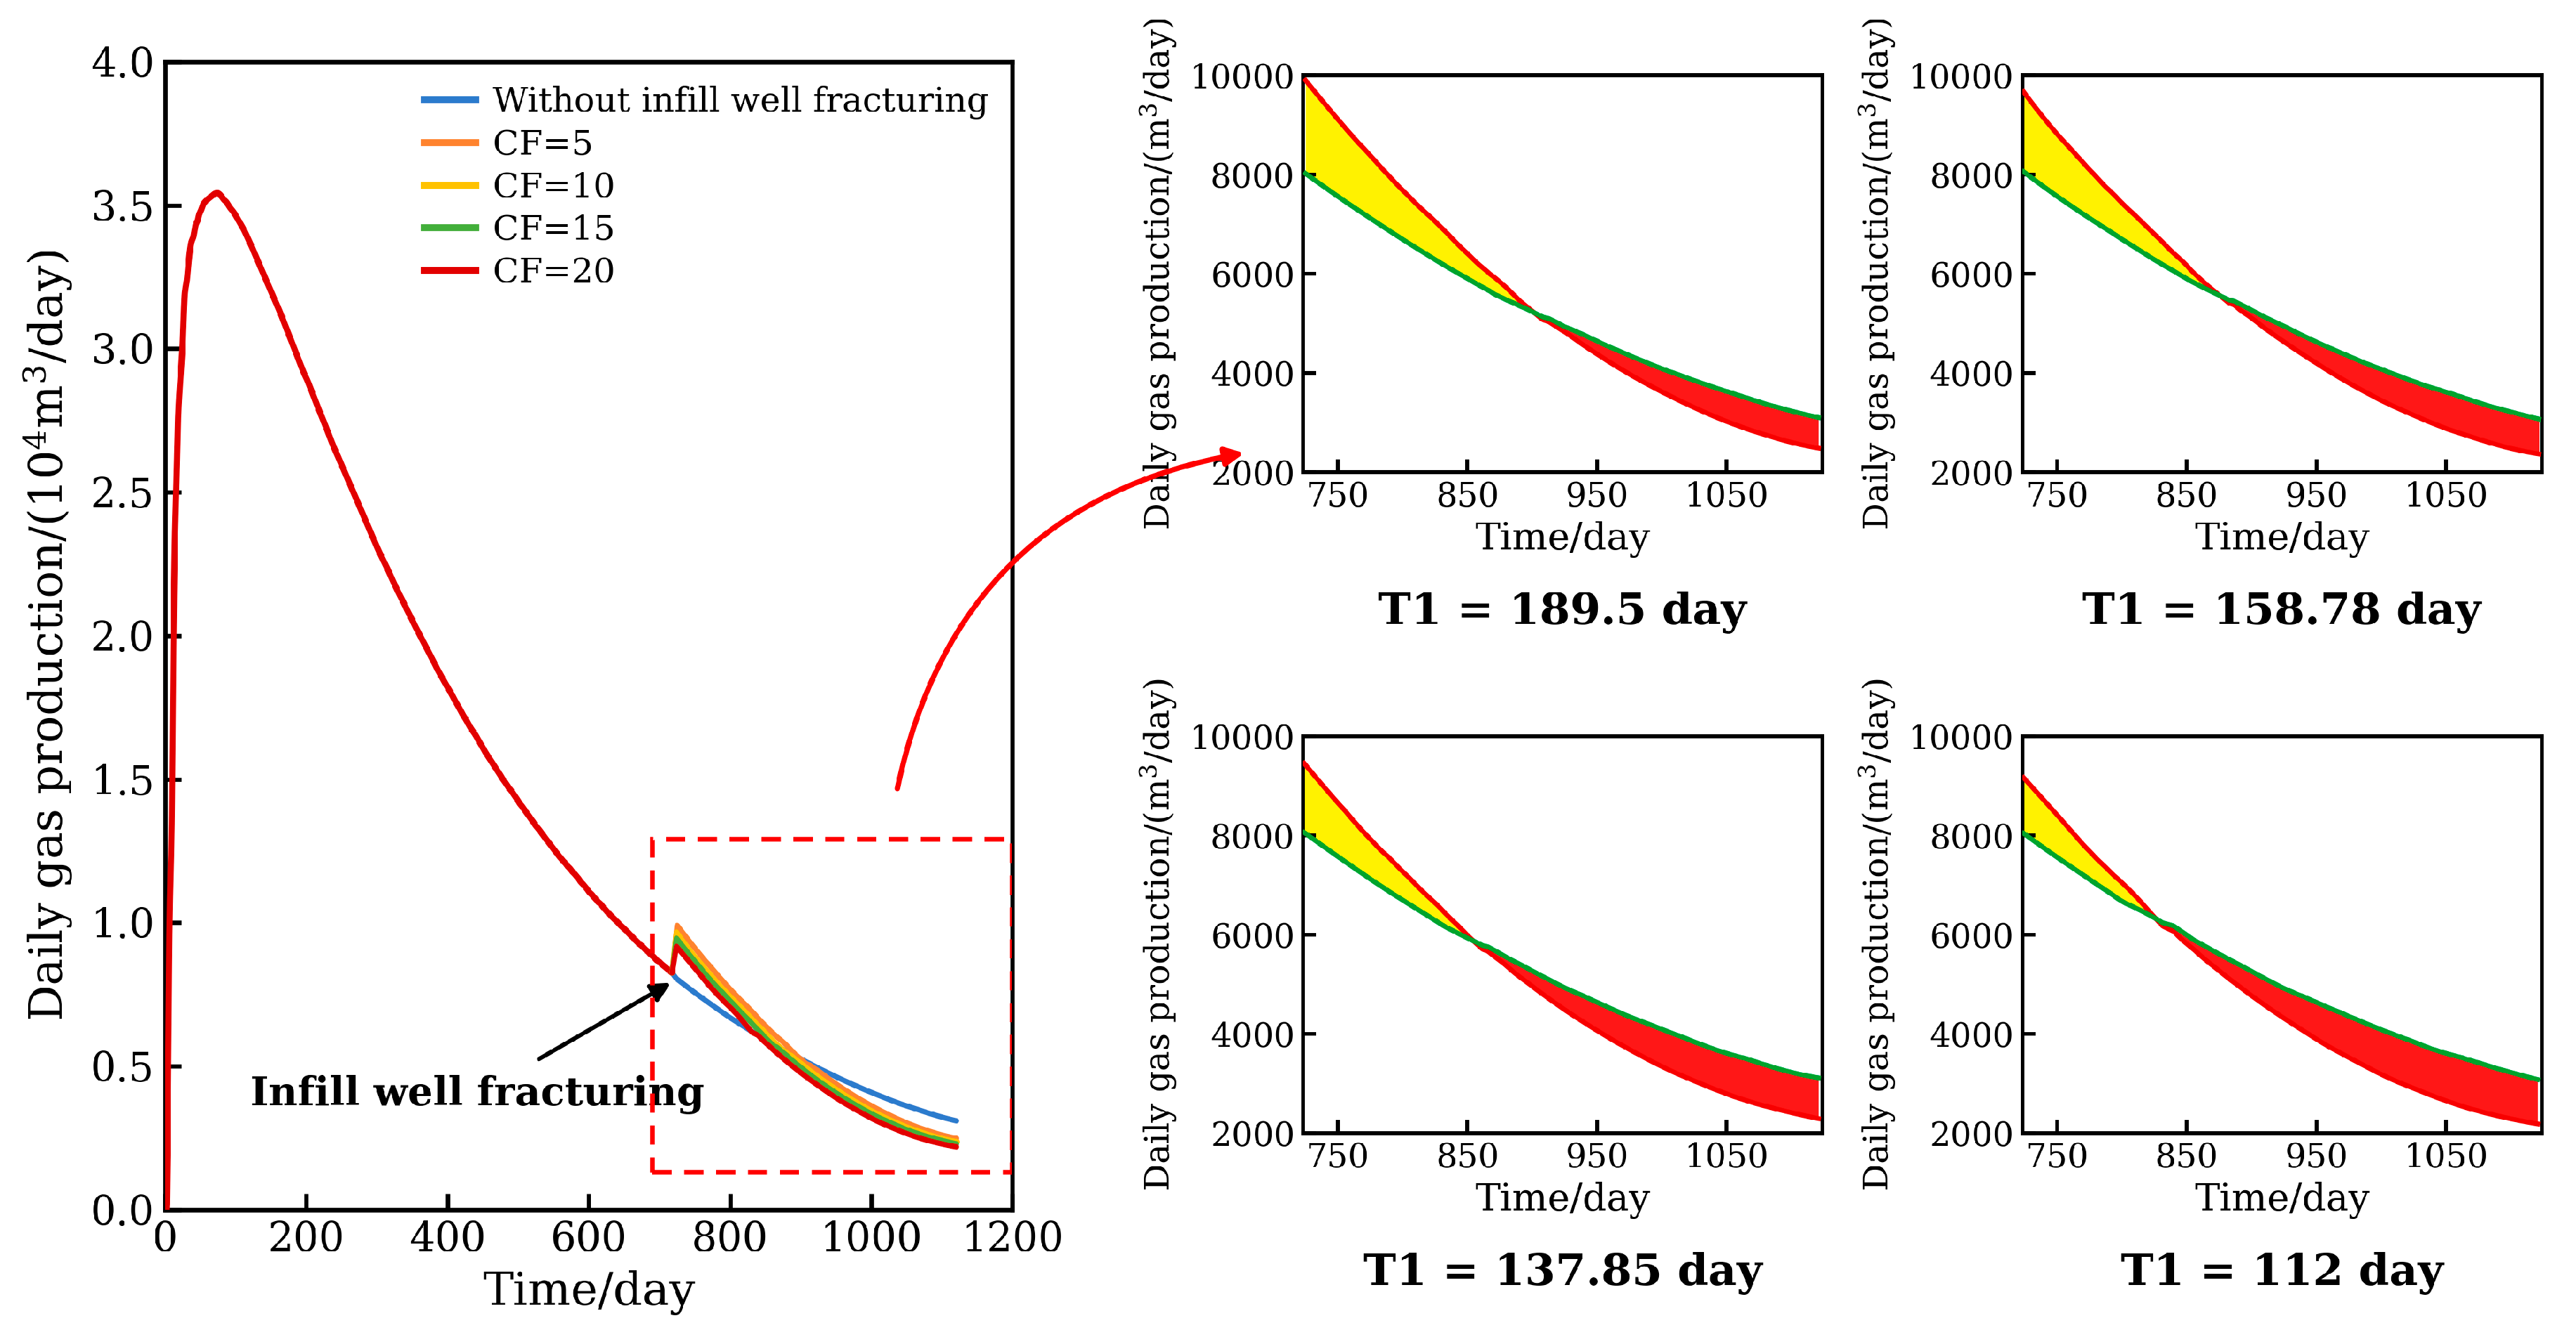
Figure 13: The change of inter-well interference degree under different fracture numbers.
Analyzing the impact of inter-well interference on the Estimated Ultimate Recovery (EUR) of gas wells for various well spacings ranging from 300 m to 500 m aids in determining the optimal well spacing for the well group. From Fig. 14, it is evident that as the well spacing increases, the influence of inter-well interference on the EUR of a single well significantly diminishes. At a certain distance, in this model, approximately 450 m, the effect of inter-well interference on the EUR becomes negligible [48,49]. As the well spacing increases, the influence of inter-well interference gradually diminishes, leading to a gradual rise in EUR. However, the rate of increase in single-well EUR and the recovery rate both steadily decrease. A turning point is observed in the distribution relationship between EUR and well spacing, as well as recovery rate and well spacing. The effect of inter-well interference on EUR and recovery rate follows a nonlinear pattern of change, indicating the presence of an optimal well spacing. Therefore, in the design of well spacing, if the spacing is excessively large, despite the higher single-well EUR, the recovery rate of reservoir geological reserves decreases, resulting in resource wastage. Conversely, if the spacing is too small, although the recovery rate of reservoir geological reserves increases, the single-well EUR decreases, leading to inferior economic benefits. Hence, when optimizing horizontal well spacing, it is crucial to consider the influence of inter-well interference on both the EUR of gas wells and the recovery rate of reservoir geological reserves, aiming to maximize both indicators [50]. Based on this analysis, the model in this study determines the optimal well spacing to be 409 m. It should be noted that the spacing identified above follows from a purely production-based criterion, namely the trade-off between single-well EUR and reservoir recovery degree. In practice the spacing that maximises the recovery indicators does not necessarily maximise project value, because drilling and stimulation costs, gas price and discount rate also enter the decision. A rigorous economic screening therefore calls for a break-even-point type analysis in which capital and operating expenditures are evaluated jointly with technical performance, in the same spirit as the technical and economic assessment frameworks developed for other natural gas processes [51,52]. Comparable studies on shale gas well-spacing optimisation that couple interference simulation with a net-present-value model have likewise shown that the economically optimal spacing may be somewhat smaller than the technically optimal one [53,54]. Adding such an economic module to the present framework is left for future work.
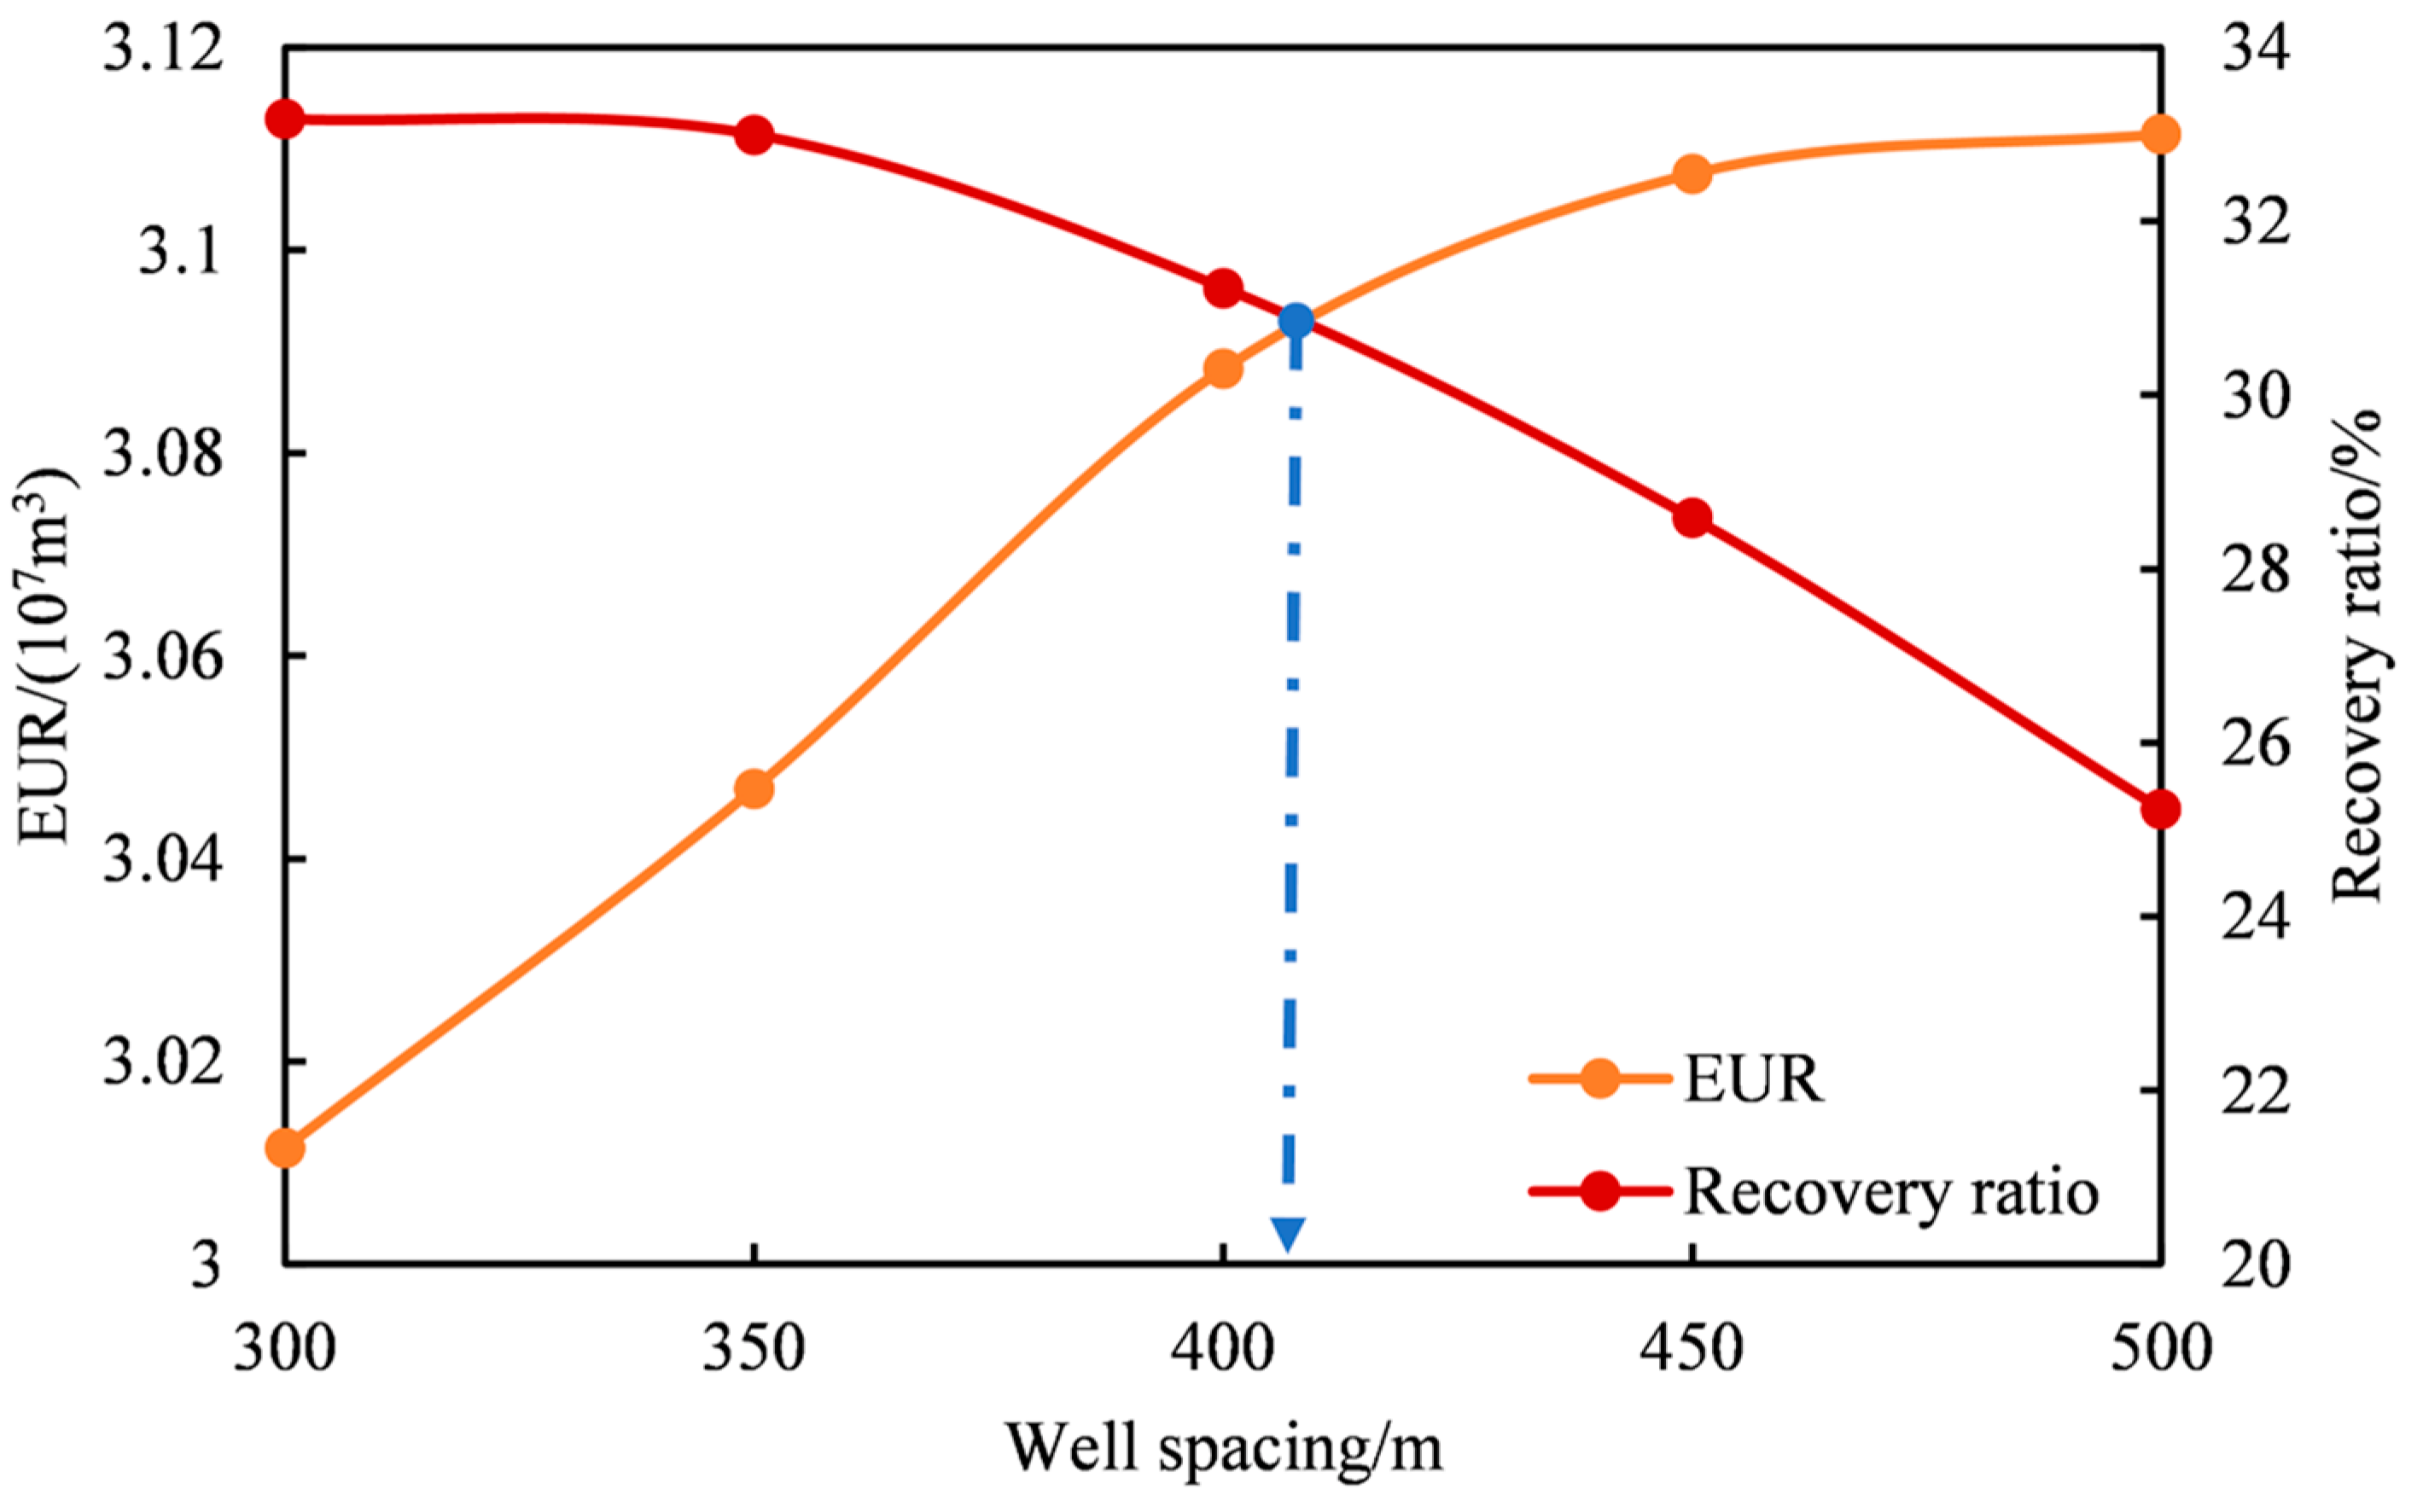
Figure 14: The curve of EUR and recovery with different well spacing.
In view of the seepage characteristics of the multi-scale pore-fracture system in shale gas reservoirs, a numerical simulation model for shale gas reservoirs coupled with gas adsorption-desorption, diffusion, and bedrock stress sensitivity effects is established in this study. The model adopts the EDFM to achieve efficient characterization of complex fractures, and completes the discretization and solution of the model based on the finite volume method. The reliability and field applicability of the model are verified through history matching with production data of on-site shale gas horizontal wells.
The three core transport mechanisms of shale gas reservoirs, namely stress sensitivity, diffusion, and adsorption, have differentiated impacts on gas well productivity. An increase in the stress sensitivity coefficient will aggravate the shrinkage and closure of reservoir pores and fractures, resulting in a significant reduction in the cumulative gas production of gas wells, with a cumulative production drop of approximately 30% when the coefficient reaches 0.04. The enhancement effect of diffusion on productivity diminishes sharply with the increase of matrix permeability, and the diffusion effect can be neglected once the matrix permeability is higher than approximately 0.1 mD (1 × 10⁻⁴ μm2). The contribution of adsorbed gas to productivity gradually increases with the decline of reservoir pressure in the late stage of development.
The frac-hit patterns and fracture connectivity characteristics of shale gas reservoirs directly determine the long-term development performance of gas wells. Compared with matrix-mediated interference, direct frac-hit interference, in which hydraulic fractures of the infill well intersect those of the parent well, exhibits a substantially shorter positive-effect duration, with the negative interference becoming dominant as early as 145 days after infill well fracturing. Moreover, the adverse impact of frac hits intensifies with the increasing number of connected (frac-hit) fractures, leading to continuous productivity losses in both the parent and child wells. These findings emphasize that effective control of fracture propagation geometry and avoidance of direct hydraulic intersection with parent wells are crucial measures for mitigating frac-hit damage in shale gas field development.
From an engineering standpoint these results translate into three practical recommendations for infill-well design and frac-hit mitigation in deep shale gas fields. First, the stimulation scale of the infill-well stages facing the parent well should be reduced and temporary plugging, diversion or limited-entry designs should be applied, so that fracture propagation towards the depleted region of the parent well is suppressed and direct hydraulic intersection is avoided [55]. Second, the parent well should be re-pressurised, or its drawdown reduced, before the infill well is stimulated, in order to lower the inter-well pressure differential that drives asymmetric fracture growth and fracturing-fluid invasion. Third, the timing of infill-well fracturing and of the subsequent production restoration of the parent well should be planned against the characteristic times T1 and T2 identified in Section 3.2, so that the transient positive effect is captured while the long-term negative effect is contained [16,47].
Quantitative optimization of horizontal well spacing in shale gas reservoirs can be achieved based on the distribution relationship between EUR, recovery degree and well spacing. With the increase of well spacing, the impact of inter-well interference on single-well EUR gradually weakens, while the growth rate of single-well EUR and reservoir recovery degree continues to slow down, presenting an inflection point of optimal well spacing. Comprehensively considering the reservoir resource recovery efficiency and development economic benefits, the optimal horizontal well spacing for the target shale gas reservoir is determined to be 409 m in this study.
Several limitations of the present work should nevertheless be acknowledged. First, the hydraulic fractures are represented as planar, bi-wing, vertically uniform features of constant width, and neither the natural fracture network nor the complex induced fracture morphology around the parent well is modelled explicitly, so the geometrical complexity of a real stimulated reservoir volume is simplified. Second, the two-phase gas–water formulation neglects capillary-pressure hysteresis and the water-blocking damage caused by fracturing-fluid invasion after a frac hit, which may lead to an underestimation of the negative interference. Third, stress sensitivity is introduced through an empirical exponential permeability relation rather than through fully coupled geomechanics, so the depletion-induced stress reorientation that governs asymmetric fracture propagation is prescribed rather than predicted [46]. Finally, the model is calibrated against a single well group, so the optimal spacing of 409 m should be regarded as block specific rather than universal. Future work will accordingly focus on three directions: coupling the present multi-mechanism model with a geomechanical fracture-propagation model so that depletion-induced stress evolution and frac-hit geometry are predicted rather than imposed; incorporating fracturing-fluid invasion and water-blocking damage into the two-phase formulation and validating the extended model against post-frac-hit flowback and pressure data; and extending the analysis to multi-well, multi-layer pads coupled with an economic evaluation module, so that well spacing, stimulation intensity and infill timing can be optimised simultaneously [51,52].
Acknowledgement:
Funding Statement: This work was supported by the Oil & Gas Major Project of China (No. 2023ZZ28-05).
Author Contributions: The authors confirm contribution to the paper as follows: Conceptualization, Yi Song and Wendong Wang; methodology, Yi Song, Cheng Shen and Yuxuan Deng; software, Yi Song and Yuxuan Deng; validation, Yi Song, Junfeng Li and Yuxuan Deng; formal analysis, Cheng Shen; investigation, Yi Song, Cheng Shen, Bo Zeng and Junfeng Li; resources, Junfeng Li, Bo Zeng, Yubo Wang and Wenfeng Yu; data curation, Cheng Shen, Yubo Wang and Junfeng Li; writing—original draft preparation, Yi Song and Cheng Shen; writing—review and editing, Yuxuan Deng and Wendong Wang; supervision, Wenfeng Yu and Wendong Wang; project administration, Wenfeng Yu and Wendong Wang; funding acquisition, Wenfeng Yu and Wendong Wang. All authors reviewed and approved the final version of the manuscript.
Availability of Data and Materials: The data that support the findings of this study are available from the Corresponding Author, [Wenfeng Yu], upon reasonable request.
Ethics Approval: Not applicable.
Conflicts of Interest: The authors declare no conflicts of interest.
References
1. Bowker KA . Barnett shale gas production, fort worth basin: Issues and discussion. AAPG Bull. 2007; 91( 4): 523– 33. doi:10.1306/06190606018. [Google Scholar] [CrossRef]
2. Akkutlu IY , Efendiev Y , Vasilyeva M , Wang Y . Multiscale model reduction for shale gas transport in poroelastic fractured media. J Comput Phys. 2018; 353: 356– 76. doi:10.1016/j.jcp.2017.10.023. [Google Scholar] [CrossRef]
3. Wei MQ , Duan YG , Fang QT , Wang RH , Yu BM , Yu CX . Current research situation of porosity & permeability characteristics and seepage mechanism of shale gas reservoir. Reserv Eval Dev. 2011; 1( 4): 73– 7. (In Chinese). [Google Scholar]
4. Loucks RG , Reed RM , Ruppel SC , Jarvie DM . Morphology, genesis, and distribution of nanometer-scale pores in siliceous mudstones of the Mississippian Barnett Shale. J Sediment Res. 2009; 79( 12): 848– 61. doi:10.2110/jsr.2009.092. [Google Scholar] [CrossRef]
5. Wang FP . Unique properties of gas shale and their influence on fluid flow and production. In: Proceedings of the 2nd International Shale Resource Technology Symposium in China; 2010 Nov 13–14; Beijing, China. (In Chinese). [Google Scholar]
6. Berre I , Doster F , Keilegavlen E . Flow in fractured porous media: A review of conceptual models and discretization approaches. Transp Porous Medium. 2019; 130( 1): 215– 36. doi:10.1007/s11242-018-1171-6. [Google Scholar] [CrossRef]
7. Javadpour F , Fisher D , Unsworth M . Nanoscale gas flow in shale gas sediments. J Can Petrol Technol. 2007; 46( 10): 55– 61. doi:10.2118/07-10-06. [Google Scholar] [CrossRef]
8. Chalmers GRL , Ross DJK , Bustin RM . Geological controls on matrix permeability of devonian gas shales in the Horn River and Liard basins, northeastern British Columbia, Canada. Int J Coal Geol. 2012; 103: 120– 31. doi:10.1016/j.coal.2012.05.006. [Google Scholar] [CrossRef]
9. Deng Y , Su Y , Wang W , Li H , Liu Y , Jia F , et al. Multi-scale fracture characterization framework of shale reservoirs with high-density bedding fractures. In: Proceedings of the International Geomechanics Conference; 2025 Nov 18–20; Al Khobar, Saudi Arabia. doi:10.56952/igs-2025-0335. [Google Scholar] [CrossRef]
10. Wang FP , Reed RM , John A , Katherine G . Pore networks and fluid flow in gas shales. In: Proceedings of the SPE Annual Technical Conference and Exhibition; 2009 Oct 4–7; New Orleans, Louisiana. Richardson, TX, USA: Society of Petroleum Engineers; 2009. doi:10.2118/124253-ms. [Google Scholar] [CrossRef]
11. Civan F . Effective correlation of apparent gas permeability in tight porous media. Transp Porous Medium. 2010; 82( 2): 375– 84. doi:10.1007/s11242-009-9432-z. [Google Scholar] [CrossRef]
12. Sakhaee-Pour A , Bryant SL . Gas permeability of shale. SPE Reserv Eval Eng. 2012; 15( 4): 401– 9. doi:10.2118/146944-pa. [Google Scholar] [CrossRef]
13. Yucel Akkutlu I , Fathi E . Multiscale gas transport in shales with local kerogen heterogeneities. SPE J. 2012; 17( 4): 1002– 11. doi:10.2118/146422-pa. [Google Scholar] [CrossRef]
14. Wu K , Chen Z , Li X , Guo C , Wei M . A model for multiple transport mechanisms through nanopores of shale gas reservoirs with real gas effect–adsorption-mechanic coupling. Int J Heat Mass Transf. 2016; 93: 408– 26. doi:10.1016/j.ijheatmasstransfer.2015.10.003. [Google Scholar] [CrossRef]
15. Yin J , Wei L , Sun S , Shi Z , Dong D , Gao Z . Overpressure generation and evolution in deep Longmaxi Formation Shale Reservoir in southern Sichuan Basin: Influences on pore development. Energies. 2023; 16( 6): 2533. doi:10.3390/en16062533. [Google Scholar] [CrossRef]
16. Zeng J , Wang Y , Chen K , Wang J , Qin M , Guo J , et al. Lessons learned from specified fracturing design for pilot deep shale gas wells with high risk of fracture hits and casing deformation: A successful story in the southern Sichuan Basin. In: Proceedings of the SPE Conference at Oman Petroleum & Energy Show; 2024 Apr 22–24; Muscat, Oman. Richardson, TX, USA: Society of Petroleum Engineers; 2024. doi:10.2118/218760-ms. [Google Scholar] [CrossRef]
17. Han L , Li X , Liu Z , Duan G , Wan Y , Guo X , et al. Influencing factors and prevention measures of casing deformation in deep shale gas wells in Luzhou block, southern Sichuan Basin, SW China. Petrol Explor Dev. 2023; 50( 4): 979– 88. doi:10.1016/S1876-3804(23)60443-4. [Google Scholar] [CrossRef]
18. Warren JE , Root PJ . The behavior of naturally fractured reservoirs. Soc Petrol Eng J. 1963; 3( 3): 245– 55. doi:10.2118/426-pa. [Google Scholar] [CrossRef]
19. Karimi-Fard M , Durlofsky LJ , Aziz K . An efficient discrete-fracture model applicable for general-purpose reservoir simulators. SPE J. 2004; 9( 2): 227– 36. doi:10.2118/88812-pa. [Google Scholar] [CrossRef]
20. Hoteit H , Firoozabadi A . Multicomponent fluid flow by discontinuous Galerkin and mixed methods in unfractured and fractured media. Water Resour Res. 2005; 41( 11): W11412. doi:10.1029/2005WR004339. [Google Scholar] [CrossRef]
21. Hajibeygi H , Karvounis D , Jenny P . A hierarchical fracture model for the iterative multiscale finite volume method. J Comput Phys. 2011; 230( 24): 8729– 43. doi:10.1016/j.jcp.2011.08.021. [Google Scholar] [CrossRef]
22. Lee SH , Lough MF , Jensen CL . Hierarchical modeling of flow in naturally fractured formations with multiple length scales. Water Resour Res. 2001; 37( 3): 443– 55. doi:10.1029/2000WR900340. [Google Scholar] [CrossRef]
23. Karimi-Fard M , Durlofsky LJ . A general gridding, discretization, and coarsening methodology for modeling flow in porous formations with discrete geological features. Adv Water Resour. 2016; 96: 354– 72. doi:10.1016/j.advwatres.2016.07.019. [Google Scholar] [CrossRef]
24. Malpani R , Sinha S , Charry L , Sinosic B , Clark B , Gakhar K . Improving hydrocarbon recovery of horizontal shale wells through refracturing. In: Proceedings of the SPE/CSUR Unconventional Resources Conference; 2015 Oct 20–22; Calgary, AL, Canada. Richardson, TX, USA: Society of Petroleum Engineers; 2015. doi:10.2118/175920-ms. [Google Scholar] [CrossRef]
25. Ejofodomi EA , Baihly JD , Silva F . Using a calibrated 3D fracturing simulator to optimize completions of future wells in the Eagle Ford Shale. In: Unconventional Resources Technology Conference; 2015 Jul 20–22; San Antonio, TX, USA. Richardson, TX, USA: Society of Petroleum Engineers; 2015. p. 632– 56. doi:10.2118/178680-ms. [Google Scholar] [CrossRef]
26. Zhang Q . Well interference analysis of shale gas wells based on embedded discrete fracture model. Geofluids. 2022; 2022( 1): 1795369. doi:10.1155/2022/1795369. [Google Scholar] [CrossRef]
27. Wu Y , Cheng L , Ma L , Huang S , Fang S , Killough J , et al. A transient two-phase flow model for production prediction of tight gas wells with fracturing fluid-induced formation damage. J Petrol Sci Eng. 2021; 199: 108351. doi:10.1016/j.petrol.2021.108351. [Google Scholar] [CrossRef]
28. Liu H , Rao X , Xiong H . Evaluation of CO2 sequestration capacity in complex-boundary-shape shale gas reservoirs using projection-based embedded discrete fracture model (pEDFM). Fuel. 2020; 277: 118201. doi:10.1016/j.fuel.2020.118201. [Google Scholar] [CrossRef]
29. Fang S , Xiong H , Wang B , Ma L , Rao X , Wu Y . The influence of infill well-caused fracture interference on shale gas production and recovery: A comprehensive numerical simulation study. In: Proceedings of the 2021 Asia Pacific Unconventional Resources Technology Conference; 2021 Nov 16–18; Online. doi:10.15530/ap-urtec-2021-208382. [Google Scholar] [CrossRef]
30. Fang S , Wu Y , Dai C , Ma L , Liu H . A semianalytical model for analyzing the infill well-caused fracture interference from shale gas reservoirs. Geofluids. 2021; 2021( 1): 1877778. doi:10.1155/2021/1877778. [Google Scholar] [CrossRef]
31. Zhao YL , Feng HY , Bu CZ , Zhou LS , Wu JF , Zhang LH , et al. Interwell interference model of horizontal wells in shale gas reservoirs based on multi-connected boundary element method. Petrol Sci. 2024; 21( 6): 4278– 97. doi:10.1016/j.petsci.2024.08.009. [Google Scholar] [CrossRef]
32. Liang Y , Cheng Y , Han Z , Yan C . Numerical simulation analysis on production evolution laws in shale reservoirs considering a horizontal well interwell interference effect. Energy Fuels. 2024; 38( 5): 4076– 90. doi:10.1021/acs.energyfuels.3c04951. [Google Scholar] [CrossRef]
33. Deng Y , Wang W , Su Y , Sun S , Zhuang X . An unsupervised machine learning based double sweet spots classification and evaluation method for tight reservoirs. J Energy Resour Technol. 2023; 145( 7): 072602. doi:10.1115/1.4056727. [Google Scholar] [CrossRef]
34. Langmuir I . The adsorption of gases on plane surfaces of glass, Mica and platinum. J Am Chem Soc. 1918; 40( 9): 1361– 403. doi:10.1021/ja02242a004. [Google Scholar] [CrossRef]
35. Moridis GJ , Blasingame TA , Freeman CM . Analysis of mechanisms of flow in fractured tight-gas and shale-gas reservoirs. In: Proceedings of the SPE Latin American and Caribbean Petroleum Engineering Conference; 2010 Dec 1–3; Lima, Peru. Richardson, TX, USA: Society of Petroleum Engineers; 2010. doi:10.2118/139250-ms. [Google Scholar] [CrossRef]
36. Li S . Study of oil flow mechanisms in shale reservoirs [ dissertation]. Calgary, AB, Canada: University of Calgary; 2020. [Google Scholar]
37. Lake L , Johns RT , Rossen WR , Pope GA . Fundamentals of Enhanced Oil Recovery. Richardson, TX, USA: Society of Petroleum Engineers (SPE); 2014. doi:10.2118/9781613993286. [Google Scholar] [CrossRef]
38. Pedrosa OA Jr . Pressure transient response in stress-sensitive formations. In: Proceedings of the SPE California Regional Meeting; 1986 Apr 2–4; Oakland, CA, USA. Richardson, TX, USA: Society of Petroleum Engineers; 1986. doi:10.2118/15115-ms. [Google Scholar] [CrossRef]
39. Zhu PX , Zhong JW . Experimental study on stress sensitivity of fractured shale reservoir. Petrochem Ind Technol. 2018; 25( 10): 146+175. (In Chinese). [Google Scholar]
40. Archer R . Impact of stress sensitive permeability on production data analysis. In: Proceedings of the SPE Unconventional Reservoirs Conference; 2008 Feb 10–12; Keystone, CO, USA. Richardson, TX, USA: Society of Petroleum Engineers; 2008. doi:10.2118/114166-ms. [Google Scholar] [CrossRef]
41. Duan XG , An WG , Hu ZM , Gao SS , Chang J , Liu HX . Experimental study on fracture stress sensitivity of Silurian Longmaxi shale formation, Sichuan Basin. Nat Gas Geosci. 2017; 28( 9): 1416– 24. (In Chinese). [Google Scholar]
42. Gangi AF . Variation of whole and fractured porous rock permeability with confining pressure. Int J Rock Mech Min Sci Geomech Abstr. 1978; 15( 5): 249– 57. doi:10.1016/0148-9062(78)90957-9. [Google Scholar] [CrossRef]
43. Sheng GL . Porosity and permeability characterization and flow simulation of shale gas reservoirs at different scales [ dissertation]. Qingdao, China: China University of Petroleum (East China); 2022. (In Chinese). [Google Scholar]
44. Lie KA . An introduction to reservoir simulation using MATLAB/GNU octave: User guide for the MATLAB reservoir simulation toolbox (MRST). Cambridge, UK: Cambridge University Press; 2019. doi:10.1017/9781108591416. [Google Scholar] [CrossRef]
45. Wang B . MRST-shale: An open-source framework for generic numerical modeling of unconventional shale and tight gas reservoirs. 2020. Reprinted in: Geosciences. 2021;11(2):106. doi:10.3390/geosciences11020106. [Google Scholar] [CrossRef]
46. Wang Q , Wang Y , Wang R , Zhao J , Hu Y , Zhao J . Evolution law of stress induced by pressure depletion in fractured shale reservoirs: Implications for subsequent refracturing and infill well development. Petroleum. 2025; 11( 1): 71– 83. doi:10.1016/j.petlm.2024.04.001. [Google Scholar] [CrossRef]
47. Masouleh SF , Kumar D , Ghassemi A . Three-dimensional geomechanical modeling and analysis of refracturing and “frac-hits” in unconventional reservoirs. Energies. 2020; 13( 20): 5352. doi:10.3390/en13205352. [Google Scholar] [CrossRef]
48. Li Q , Wu J , Chang C , Yang H , Liu C , Yu W , et al. The application of integrated assisted history matching and embedded discrete fracture model workflow for well spacing optimization in shale gas reservoirs with complex natural fractures. Geofluids. 2021; 2021: 6676739. doi:10.1155/2021/6676739. [Google Scholar] [CrossRef]
49. He Y , He Z , Tang Y , Xu Y , Xu J , Li J , et al. Interwell fracturing interference evaluation in shale gas reservoirs. Geoenergy Sci Eng. 2023; 231: 212337. doi:10.1016/j.geoen.2023.212337. [Google Scholar] [CrossRef]
50. Chen X , Xiao Y , Jiang P , Xia H , Fan H , Lei T . Optimization of Jiyang depression block X shale condensate reservoir well spacing based on geology–engineering integration. Nat Gas Ind B. 2024; 11( 4): 368– 84. doi:10.1016/j.ngib.2024.08.005. [Google Scholar] [CrossRef]
51. Cao Y , Mohammadian M , Pirouzfar V , Su CH , Khan A . Break Even Point analysis of liquefied natural gas process and optimization of its refrigeration cycles with technical and economic considerations. Energy. 2021; 237: 121643. doi:10.1016/j.energy.2021.121643. [Google Scholar] [CrossRef]
52. Gao X , Yang S , Zhang Y , He B , Wang M , Hu J , et al. Integrated modeling and economic assessment of hydrogen storage with wellbore-reservoir-thermo-hydro-mechanical-diffusion coupling. Energy. 2026; 353: 141065. doi:10.1016/j.energy.2026.141065. [Google Scholar] [CrossRef]
53. Chen J , Wei Y , Wang J , Yu W , Qi Y , Wu J , et al. Inter-well interference and well spacing optimization for shale gas reservoirs. J Nat Gas Geosci. 2021; 6( 5): 301– 12. doi:10.1016/j.jnggs.2021.09.001. [Google Scholar] [CrossRef]
54. Xu J , Xu Y , Wang Y , Tang Y . Multi-well pressure interference and gas channeling control in W shale gas reservoir based on numerical simulation. Energies. 2023; 16( 1): 261. doi:10.3390/en16010261. [Google Scholar] [CrossRef]
55. Deng Y , Wang W , Su Y , Zhuang X , Jia M , Jia F . Physics-constrained deep clustering for integrated reservoir classification and differential fracturing design in shale formations. Int J Coal Sci Technol. 2026; 13( 1): 68. doi:10.1007/s40789-026-00906-5. [Google Scholar] [CrossRef]
Cite This Article
 Copyright © 2026 The Author(s). Published by Tech Science Press.
This work is licensed under a Creative Commons Attribution 4.0 International License , which permits unrestricted use, distribution, and reproduction in any medium, provided the original work is properly cited.
 Downloads
 Citation Tools
