
 Submit a Paper
 Propose a Special lssue
 Open Access
ARTICLE
Heat and Humidity Transport Analysis Inside a Special Underground Building
1 China Northwest Architecture Design and Research Institute, Co., Ltd., Xi’an, 710018, China
2
School of Human Settlements and Civil Engineering, Xi’an Jiaotong University, Xi’an, 710049, China
3 Lund University, Lund, 22100, Sweden
* Corresponding Authors: Jie Xue. Email: ; Bengt Sundén. Email:
Frontiers in Heat and Mass Transfer 2023, 21, 47-63. https://doi.org/10.32604/fhmt.2023.045134
Received 18 August 2023; Accepted 05 October 2023; Issue published 30 November 2023
 View Full Text
 Download PDF
Abstract
The calculation of heat and humidity load serves as the cornerstone of Heating, Ventilation, and Air Conditioning (HVAC) design. Nevertheless, as the heat and humidity load characteristics of underground structures differ substantially from those of above-ground structures, it is a challenge to derive their accurate calculation procedure through engineering experience. Therefore, it is particularly important to carry out quantitative research on heat and humidity load. This study used Design Builder software to study the influence of the design state point of air conditioning in underground buildings on energy consumption. The study showed that compared with the single design temperature of 18°C, setting the temperature of 16°C in winter and 22°C in summer could reduce energy consumption by about 59%. And the hourly heat load, cooling load and humidity load in one year are simulated and calculated so as to quantitatively analyze the characteristics of the load. This provides a database for selecting suitable HVAC equipment. It is further emphasized that dehumidification is the key to HVAC design of underground structures, which provides a reference for similar engineering designs.Keywords
Nomenclature
| HVAC | Heating, Ventilation, and Air Conditioning |
| CFD | CFD |
| e.g. | |
| tτ | cooling load temperature/°C |
| δ | location correction factor/°C |
| K | heat transfer coefficient of window glass/W·m−2·°C−1 |
| a | correction coefficient of window frame |
| Xg | structural correction coefficient of the window |
| Xd | location correction coefficient |
| Jwτ | intensity of solar radiation cooling load |
| qi,sol | solar radiation transmission/W·m2 |
| i | heat transfer of surface |
| Ebi | blackbody radiation intensity of wall i/W·m−2 |
| Rsur | surface radiant thermal resistance/m−2 |
| Ji | effective radiation intensity of wall i/W·m−2 |
| σ | Stefan-Boltzmann constant |
| Ti,w | average wall temperature/°C |
| εi | surface emissivity of wall |
| Ai | surface area of wall |
| Xi, j | angle factor |
| qr,i | radiant heat flux |
| W1 | moisture dissipation on the inner surface of the enclosure structure, g/h |
| W2 | humidity brought in by outdoor air, g/h |
| W3 | body moisture dissipation, g/h |
| W4 | amount of artificial moisture dissipation, g/h |
| W5 | free water surface moisture dissipation, g/s |
| F | inner surface area of the enclosure structure, m2 |
| L | untreated air entering the building, m3/h |
| ρ | density of air at a certain temperature, kg/m3 |
| dw | outdoor air moisture content, g/kg |
| dn | indoor air moisture content, g/kg |
| n | number of people in the building |
| w | moisture dissipation per person per hour, g/(h·person) |
| m | dissipative moisture per person per hour |
| υ | the air flow velocity on the evaporation surface |
| Pbq1 | saturated vapor corresponding to the surface temperature of water |
| Pbq2 | partial pressure of the saturated water vapor of air |
| ϕ | relative humidity |
| B0 | standard atmosphere, Pa |
| B | local actual atmospheric pressure, Pa |
There has been a growing focus on the development and utilization of underground spaces in recent years in China [1,2]. Underground buildings exhibit distinct characteristics compared to their above-ground counterparts due to their enclosed nature [3]. These buildings have a reduced cold and heat load in their enclosure structure, which means that ventilation and air conditioning play a more important role [4,5]. As a result, moisture-proofing and dehumidification become crucial considerations [6–8]. The calculation of heat and humidity load is essential for designing Heating, Ventilation, and Air Conditioning (HVAC) systems for underground structures [9]. This calculation has a significant impact on the investment and selection of equipment for the system [10,11], ultimately affecting its operational effectiveness [12]. The study of heat and humidity load calculation for underground buildings [13,14] is of practical importance as it allows for adjustments in HVAC design to accommodate the unique characteristics of these buildings and meet their specific thermal comfort or technological requirements [15,16].
Currently, Wu et al. [17] have established both a physical and mathematical model based upon actual underground building air heat and humidity changes [18]. They presented solutions for this model using MATLAB programming. Likewise, Xiao et al. [19] have utilized the confirmed node equations of the underground building model to create a calculation program using MATLAB [20], while also compiling heat and humidity load software for underground buildings via Visual Studio 2005 [19,21]. Meanwhile, Zhang et al. [22] have measured the temperature and humidity levels of an air defense project and semi-underground library at a university, before performing verification simulations with Airpak. Li et al. [23] have also investigated the thermal and humid conditions of enclosed soil site museums by combining experiments with computational fluid dynamics (CFD). Although other related studies have been conducted utilizing similar methods yet were not included in the present study. All the above studies need to measure the boundary conditions and cannot support the actual calculation of heat and humidity load for complex engineering projects before building design. Therefore, it is also important to measure the boundary conditions to calculate the heat and mass balance of underground buildings.
Minaei et al. [24] established a transient model for the thermal performance of soil-air heat exchangers, and compared the analytical model with experimental results to prove its effectiveness. The results show that after running at a fluid velocity of 5 m/s for 6 and 120 h, the heat diffused to the distance of 10 and 50 cm from the pipeline axis, respectively, and the degree of thermal saturation increased with time. Bisoniya et al. [25] studied the effects of continuous running time and soil thermal conductivity on the thermal performance of different pipelines by CFD method. When the soil thermal conductivity was 0.52, 2 and 4 W/(m·°C), the temperature drop was 15.6°C, 17.0°C and 17.3°C, respectively. Moreover, the thermal conductivity of soil and the operating time of the system have obvious effects on the thickness of soil annulus. Wei et al. [26] established a simulation model of a soil-air heat exchanger system, aiming to reduce the heat demand of buildings through a ground-air heat exchange system. The simulation results are in good agreement with the experimental results. When the wind speed is 2 and 5 m/s, the minimum rise of 6.8°C and the maximum rise of air temperature is 8.2°C. And the air velocity has great influence on the thermal performance of the soil-air heat exchange system. Therefore, the determination of boundary conditions is particularly important and the heat transfer modeling of soil is of great significance for the thermal simulation of buildings.
The thermal and humidity load characteristics of underground buildings are very different from those of above-ground buildings, so it is difficult to accurately determine the thermal and humidity load characteristics based on engineering experience. The present study focuses on a real underground collection building project. In this paper, Design Builder is used to simulate the design, which is a mature commercial software with Energy Plus as the calculation core. The research then outlines detailed simulations and calculations of hourly hot and cold as well as wet loads throughout the year, allowing for a quantitative analysis of building heat and wet loads.
2 Project Overview and Simulation Software
This research project focuses on the design of an underground collection building, which is located in Northwest China (Cold Zone B). The building has a total constructed area of 57,000 square meters and a height of 20.5 m. The structure is divided into two main areas: the North and South. The North storage area consists of four underground layers, while the South cave reservoir features a total underground layer [27,28].
Design Builder is a mature commercial software that utilizes Energy Plus as its computing core [29,30]. In this study, Design Builder is used for Design simulation. Design Builder can simulate complex underground structures well and is relatively mature. Integrated with AutoCAD, it has been widely used in practical engineering. The research focuses on the dynamic energy consumption simulation of buildings, and divides the thermal balance of a room into surface thermal balance and air thermal balance. The calculation is based on the reaction coefficient method of the inner surface temperature of the wall. The software also includes the ability to build underground models and calculate relevant meteorological parameters, using hourly weather data to calculate the energy consumption operation of buildings under real conditions, making it reliable and applicable to current simulations. In addition, self-programming languages such as MATLAB and Visual Studio, as well as fluid computing software such as Airpak and Fluent CFD have their unique advantages for different simulation calculations of building thermal characteristics [31].
The present study utilizes the design drawings of the actual project to develop a 1:1 physical model of the underground collection building using the modeling module inside the Design Builder, as showcased in Fig. 1.
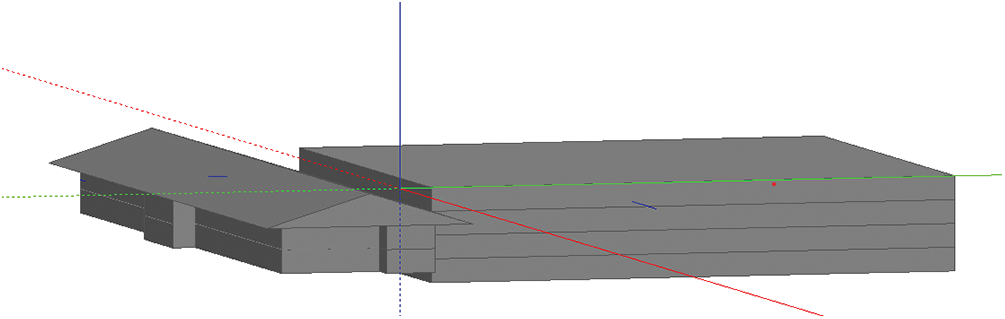
Figure 1: Overall model diagram
As the overall layout of each floor is similar, the second-floor underground is an example to illustrate the building situation. On the north side of the storage area, the XUTING hall in the northernmost part is the core area of the storage area in the middle (numbers 1 to 7 in the figure), and auxiliary rooms such as the computer room or stairs are located on both sides. The South Cavern features an underground floor, with the main area of the cavern (i.e., DK in the image) centrally located alongside stairs on both sides. Fig. 2 portrays the model plan of the second underground floor, excluding non-air-conditioned regions like the machine room, stairwell, and corridor.
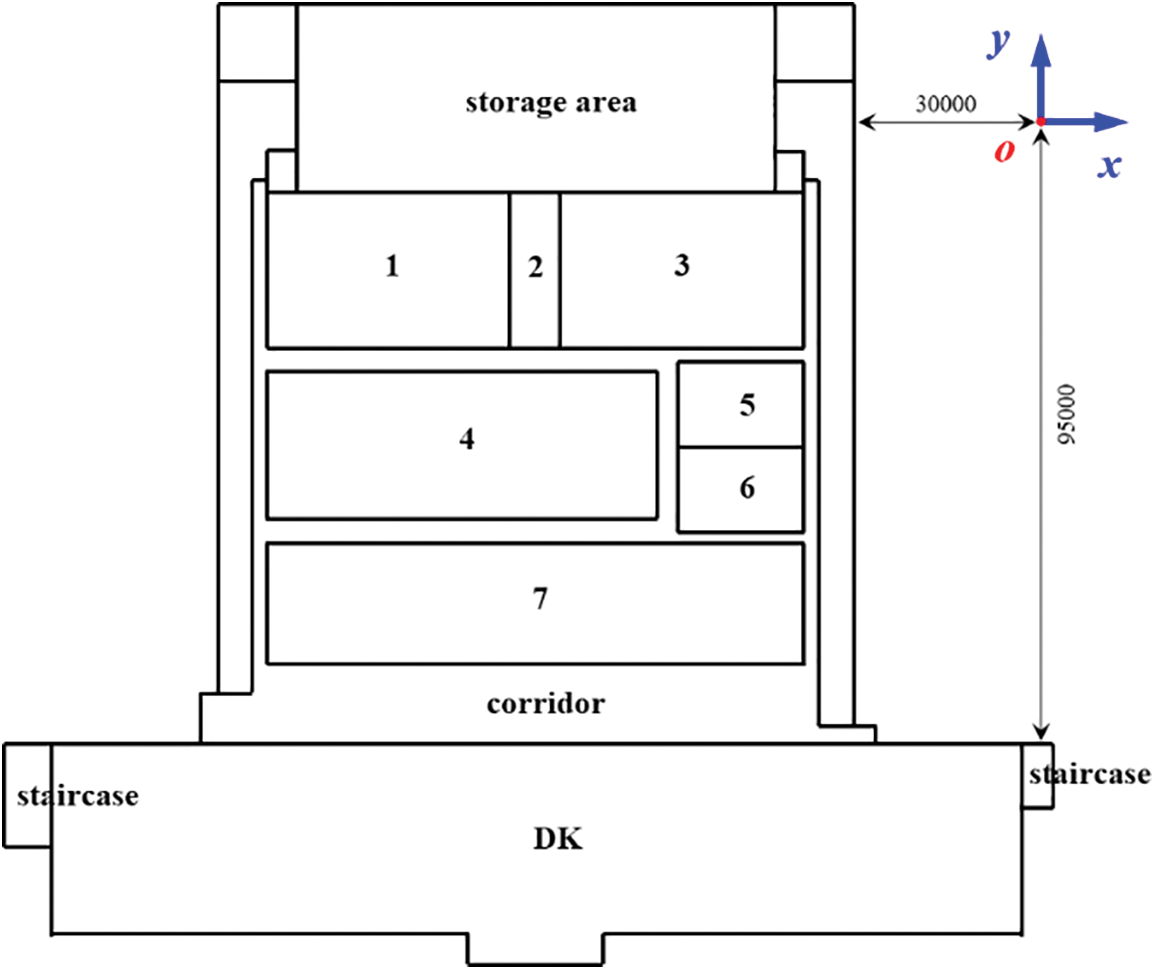
Figure 2: Model of the second floor underground
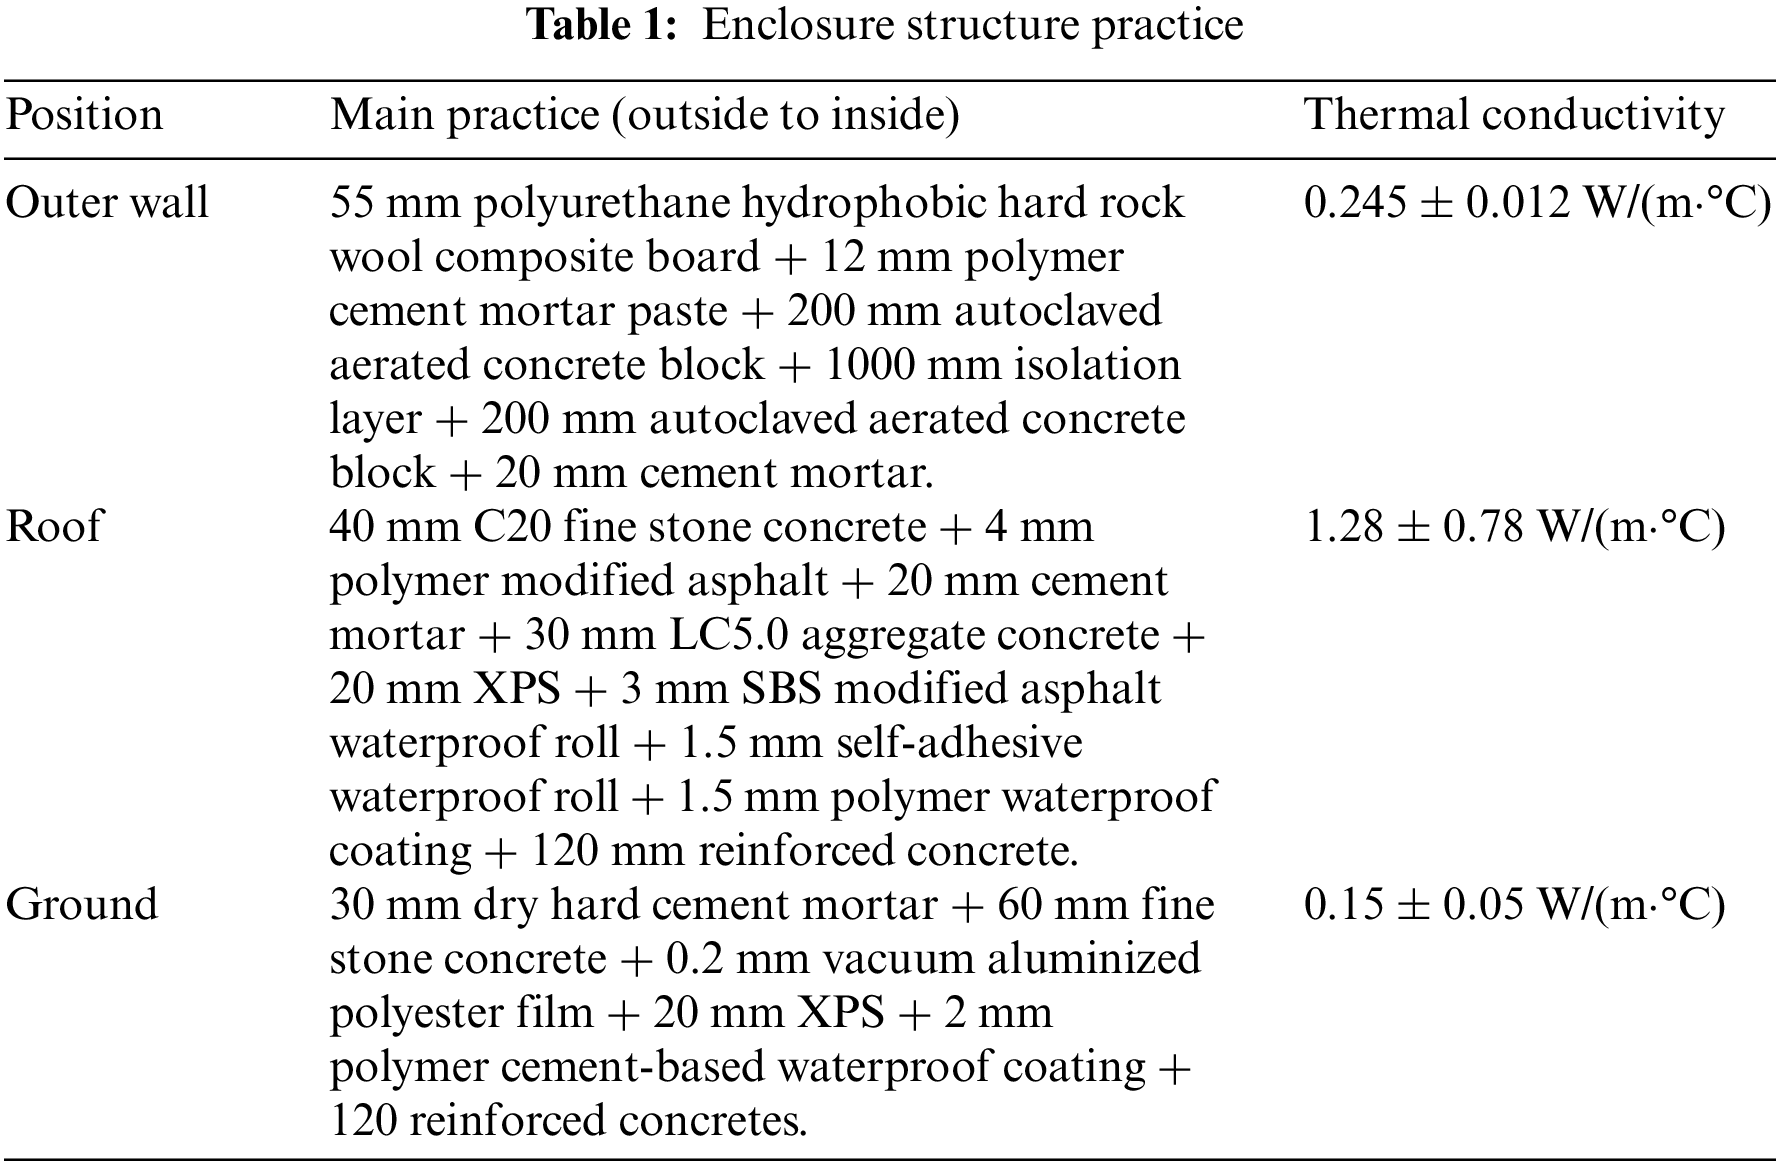
Using the material library in the software, the model envelope structure is built according to the enclosed structure method outlined in architectural design [32,33]. Table 1 depicts the construction strategy of the envelope structure.
3.2.1 Mathematical Model of Heat and Cold Load Calculation
As illustrated in Fig. 3, a standard room is composed of outer walls, outer windows, inner walls, floors, doors, and various enclosing structures. The thermal energy within a typical room is primarily derived from heat transfer through the enclosure structure, solar radiation entering through external windows, heat dissipation from human occupants, heat dissipation from lighting and equipment, and the infiltration of outside air into the room. Simultaneously, the heat load of the room encompasses the fundamental thermal consumption of the enclosure structure, supplementary thermal consumption, and the thermal consumption resulting from the infiltration of cold air through doors and windows, among other contributing factors [34,35].
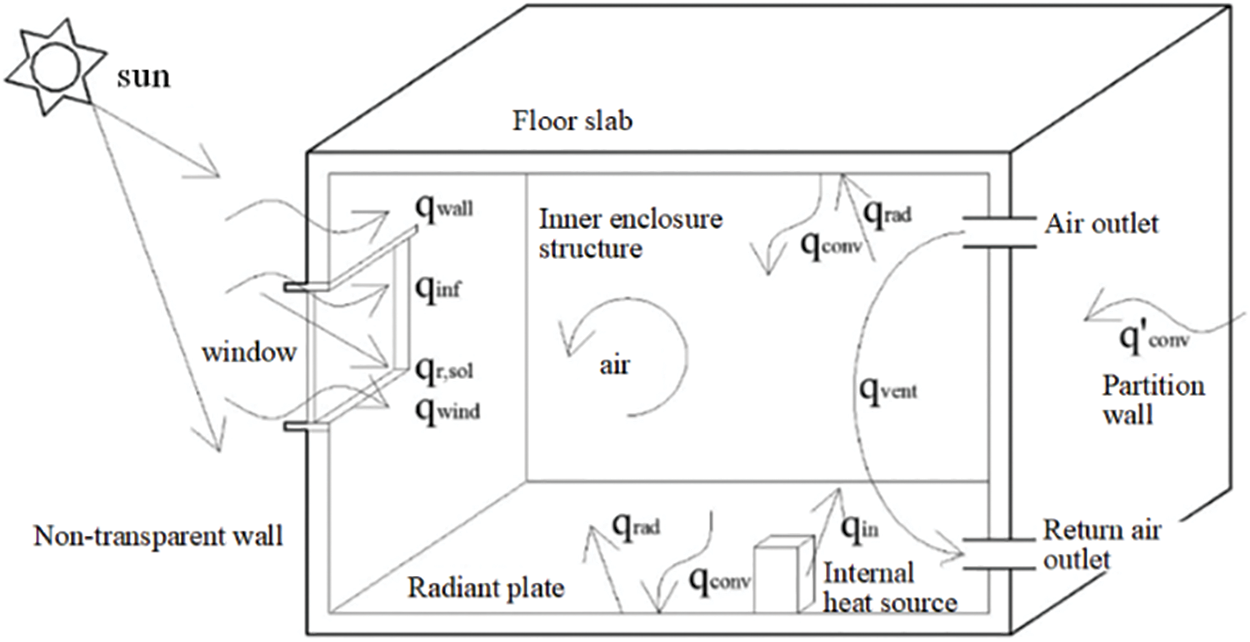
Figure 3: Dynamic heat transfer model of room
Envelope structures can be categorized into three types: 1) light, transparent, and semi-transparent structures including glass-curtain walls, glass doors, and windows; 2) thick, opaque peripheral protection structures such as exterior walls, roofs, and floors; 3) opaque, thick internal maintenance structures like partition walls and floors.
Regarding the first type of lightweight structure, the thermal inertia is minor and can be calculated using the hourly steady-state method. Meanwhile, the cooling load produced by the outer window consists of two components, namely the calculated cooling load (in W) attributed to the external window’s heat transfer due to the temperature difference and the calculated cooling load (in W) caused by solar radiation via the external window.
where tτ denotes the cooling load temperature/°C at the calculation time; δ represents the location correction factor/°C; K defines the heat transfer coefficient of window glass/W·m−2·°C−1; a accounts for the correction coefficient of window frame; Xg determines the structural correction coefficient of the window; Xd is location correction coefficient; Jwτ defines the cooling load intensity of solar radiation through the unshaded window glass at the calculated time.
For the second type of enclosure structure, a heat balance equation is established for the air and inner surface to calculate the heat transmitted into the room by the inner surface, which is composed of the heat transferred by convective heat transfer between the inner wall and air and the heat transferred by radiation with other internal surfaces [36]. For any time t, the subsequent equation can be established as:
where x = δ is the inner surface of the enclosure structure with thickness δ; qi,sol defines the heat transfer of surface i by solar radiation transmission/W·m2.
Concerning the third type of envelope structure, the adiabatic surface of the wall surface is located on the symmetry line of the internal envelope structure, as outlined in Fig. 4, as the adjacent spaces share the same state. If the indoor parameters between adjacent spaces differ, dynamic heat transfer of the outer envelope is employed. The centerline of symmetry, depicted as x = 0, represents an adiabatic condition, and the boundary condition is represented as:
where x = 0 is in the symmetry plane of the inner enclosure structure.
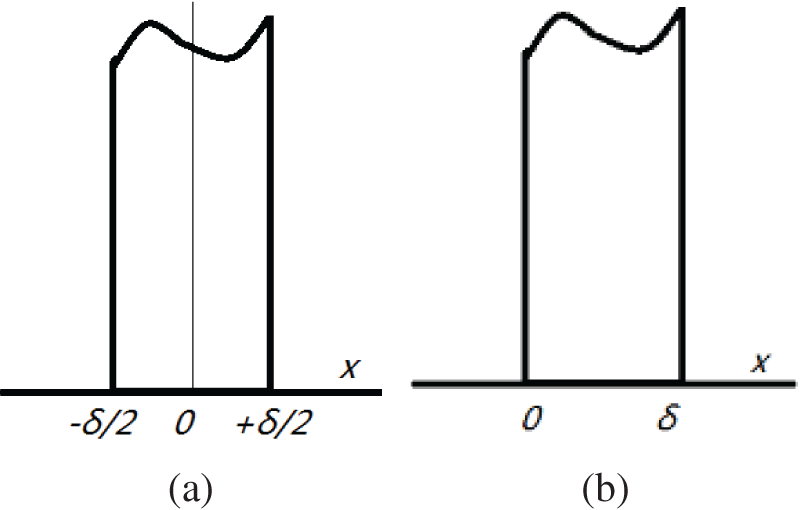
Figure 4: Schematic diagram of internal partition wall structure
Firstly, the radiation model is simplified and reasonable scientific assumptions are made: 1) The inner surface is a homogeneous and flat diffuse surface; 2) Air absorption rate is zero; 3) Assume a uniform distribution of temperature on the inner surface; 4) Treat some inner walls as the same surface.
Based on the above simplifications and assumptions, a multi-wall radiation heat transfer model is established as illustrated in Fig. 5.
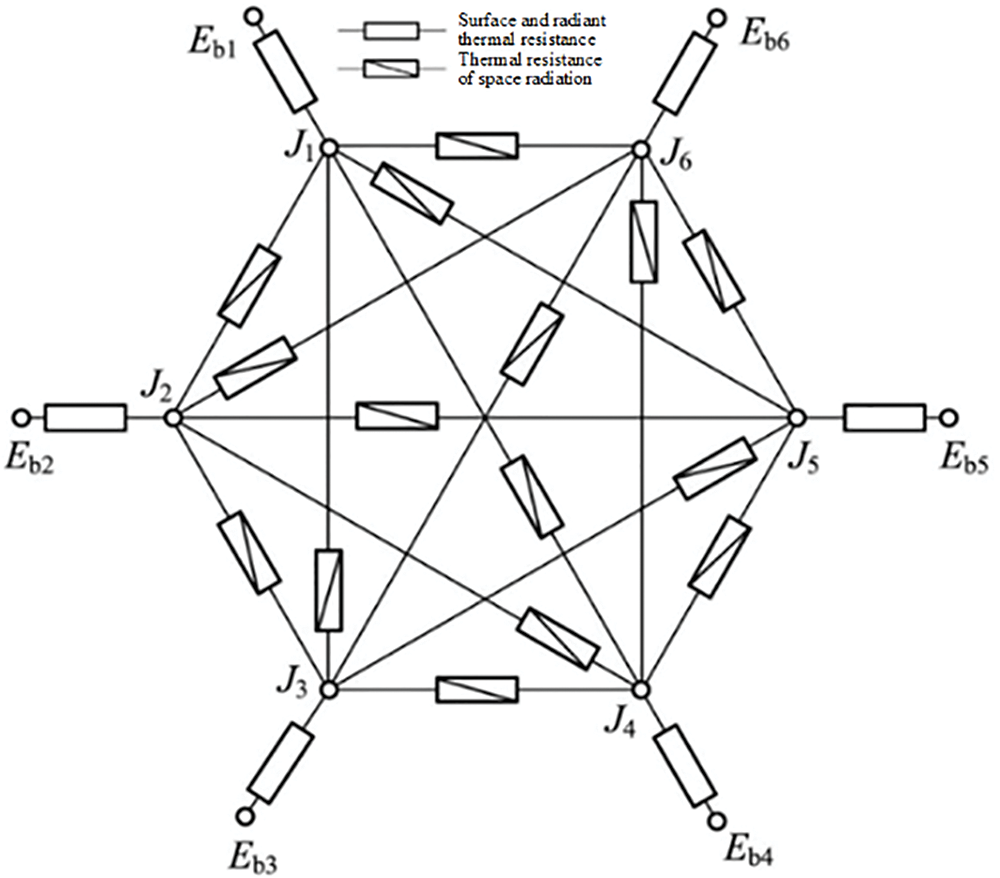
Figure 5: Equivalent radiative heat transfer network on the surface of six gray bodies
The heat balance equation of radiant heat transfer is established for each wall surface, and the heat flow equation for each inner surface is expressed by Eqs. (4) to (6):
where Ebi defines the blackbody radiation intensity of wall i/W·m−2; Rsur accounts for the surface radiant thermal resistance/m−2; Ji determines the effective radiation intensity of wall i/W·m−2; σ is Stefan-Boltzmann constant/5.67 × 10−8 W·m−2·°C−4; Ti,w denotes the average wall temperature/°C; εi is the surface emissivity of wall i; Ai defines the surface area of wall i/m2; Xi, j is the angle factor between wall i and wall j.
Eqs. (4)~(6) are combined to solve the radiant heat flux qr,i, expressed by:
3.2.2 Mathematical Model of Wet Load Calculation
The moisture sources of underground buildings are mainly composed of moisture dissipation of the enclosure structure, moisture conveyed by external air, human body moisture dissipation, artificial moisture dissipation or open water surface moisture dissipation, etc. [37]. Dehumidification of the enclosure structure is related to the construction moisture, groundwater, and wet air outside the coating layer that is directed into the underground building indoors via the enclosure structure.
1) The general moisture dispersion on the inner surface of the envelope structure can be calculated based on the following equation:
where W1 defines the moisture dissipation on the inner surface of the enclosure structure, g/h; F accounts for the inner surface area of the enclosure structure, m2. The unit area moisture dispersion of the inner surface of the w-envelope structure for a general concrete wall lining takes a value in the range of 1~2 [38,39].
2) Moisture brought in by external air:
The moisture brought in by outdoor air can be calculated as follows:
where W2 represents the humidity brought in by outdoor air, g/h; L defines the amount of untreated air entering the building, m3/h; ρ determines the density of air at a certain temperature, kg/m3; dw and dn are the outdoor and indoor air moisture content, g/kg dry air.
3) Human body moisture discharge: human body moisture discharge can be calculated according to the following equation [36]:
where W3 is the body moisture dissipation, g/h; n represents the number of people in the building; w determines the moisture dissipation per person per hour, g/(h·person).
4) Artificial moisture dispersion: it is difficult to accurately calculate this dispersion moisture theoretically. According to the test, when the personnel live and work in the building for 24 h, it can be calculated according to the following equation [40]:
where W4 represents the amount of artificial moisture dissipation, g/h; n determines the number of people in the building; m defines the dissipative moisture per person per hour, which can be 30~40 g/(h·person). The lower limit can be utilized to establish resilient preventive measures, while the upper limit can be employed to assess the effects of imperfect preventive measures.
5) The moisture opening amount on the water or wet surface is determined by the principle of moisture transfer. The evaporation of water occurs when water molecules on the water surface leave the water surface and enter the air. If the air around the open water surface is not saturated, the water will evaporate. The dissipated moisture can be calculated using the subsequent equation [41,42]:
where W5 defines the free water surface moisture dissipation, g/s; F represents the total surface area of water evaporation, m2; υ accounts for the air flow velocity on the evaporation surface, and 0.3 m/s is the recommended value. Pbq2 and Pbq1 are the partial pressure of the saturated water vapor of air and the saturated vapor corresponding to the surface temperature of water, respectively; ϕ determines the relative humidity; B0 is the standard atmosphere, Pa; B defines the local actual atmospheric pressure, Pa; a stands for the evaporation coefficient at different water temperatures, as shown in Table 2.
Energy Plus, the calculation engine of Design Builder, initially determines the response of a unit triangular wave temperature disturbance to the temperature and heat flow pairs of the inner and outer surfaces of the enclosure structure, and subsequently calculates the reaction coefficients of heat absorption, heat release, and heat transfer of the enclosure structure. Then, the outdoor temperature, at any time, is decomposed into superposition of triangular waves. The temperature and heat flux of the envelope surface, at any time, can be obtained by aggregating the response of the envelope to each triangular wave of temperature, utilizing the superposition property of the differential equation of thermal conductivity. The state-space method is the fundamental technique utilized to resolve buildings. The state-space method discretizes the partial differential heat transfer equation of the thick opaque envelope in space but maintains continuity in time. Thus, the heat transfer equation is altered into ordinary differential equations with the temperature of discrete nodes as the variable, allowing for a solution of the ordinary differential equations to determine the heat transfer characteristics of the heat transfer system studied [43].
3.3 Simulation Calculation Condition Setting
According to the specifications of the library architectural design code (JGJ 38-2015), the interior design parameters of the library air conditioning system for rare and rare books are selected as a dry bulb temperature range of 14°C~24°C and a relative humidity range of 45%~60%. In addition, the temperature and humidity of the storage environment of the special collection library should be notably stable, with the temperature change within 24 h not exceeding ±2°C and the relative humidity change not exceeding ±5% [44]. To determine the appropriate design temperature, different design temperatures are selected for simulation calculation and comparison, while the parameters are exhibited in Table 3.
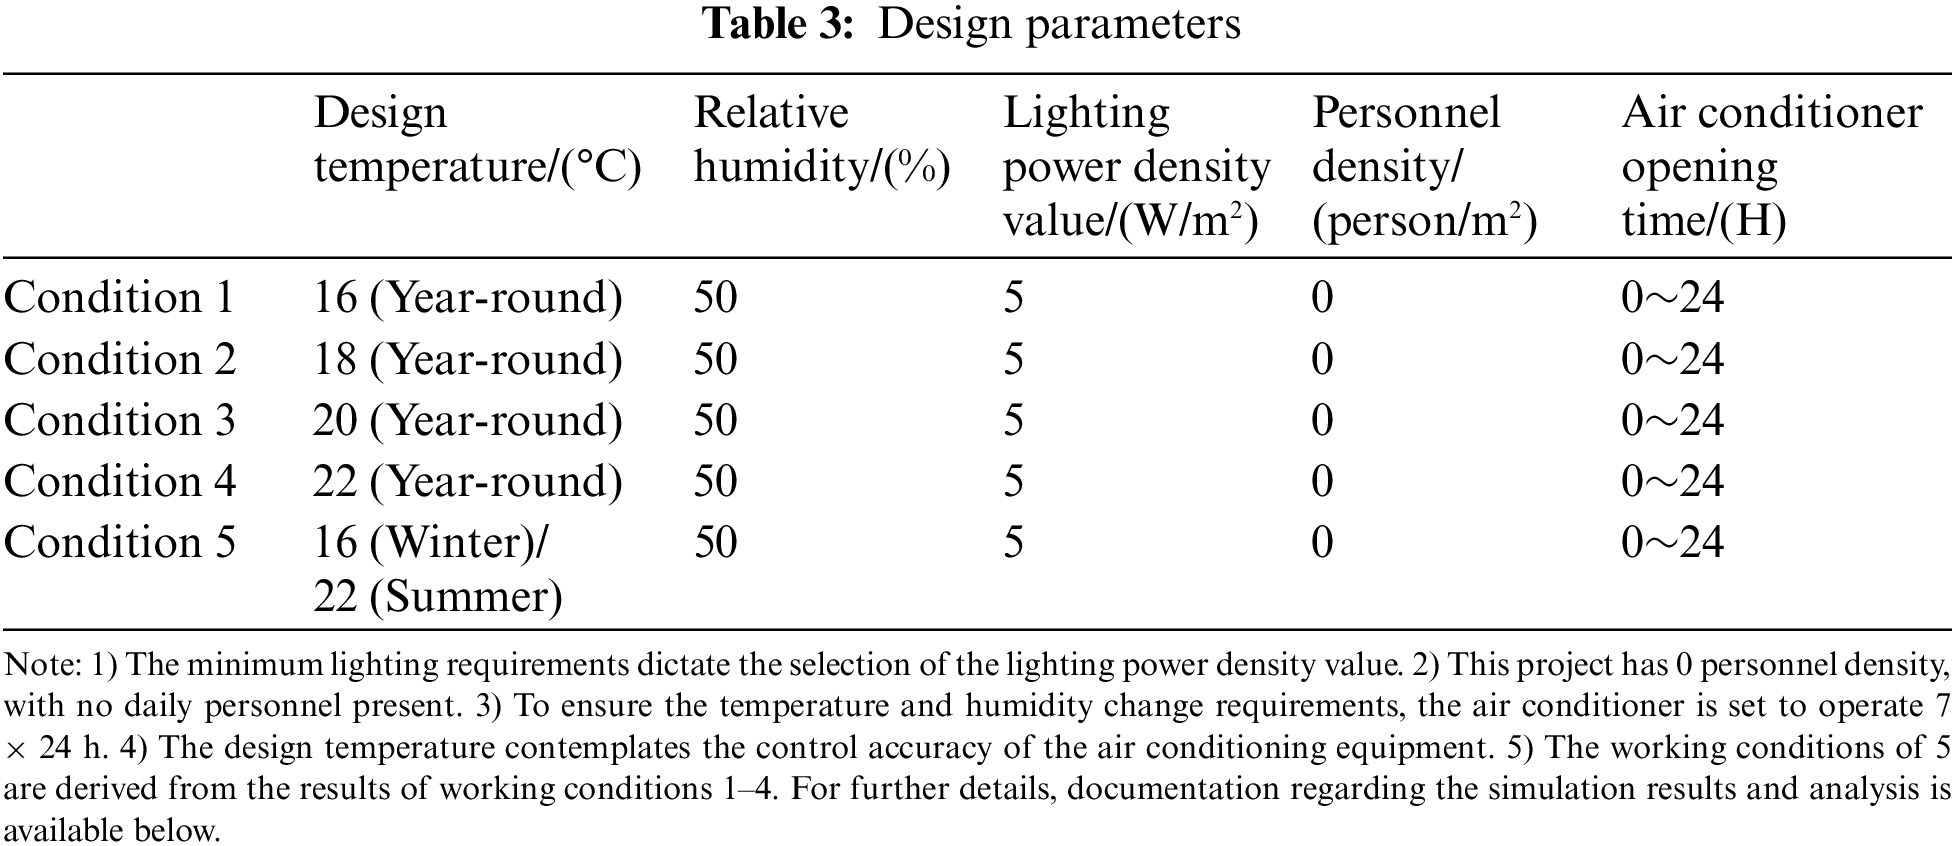
The humidity control model is opened in the software in response to the design requirements of relative humidity change control, with the humidification point set to 45% and the dehumidification point to 55%. No human body moisture, artificial moisture, or open water surface or wet surface moisture is assumed.
The relevant boundary conditions are given as follows:
The heat balance equation of external wall can be expressed as:
where qtcie is thermal conductivity intensity of external wall, W/m2; qlwre is long wave radiation intensity between external wall surface and environment, W/m2; qchte is convective heat transfer intensity between external wall surface and outdoor air, W/m2; qswre is short wave radiation intensity absorbed by the external wall surface, W/m2.
The external wall and internal surface heat balance equation can be expressed as:
where qswr is short wave radiation intensity of equipment such as lights, W/m2; qswri is short wave radiation intensity entering the room from doors and windows, W/m2; qhx is heat flux density from outdoor to indoor through the building envelope, W/m2; qchti is convective heat transfer intensity with indoor air, W/m2; qlwrh is long wave radiation intensity of internal heat sources, W/m2; qlwri is long wave radiation intensity at the inner surface, W/m2.
The indoor air heat balance equation can be expressed as:
where ∑qchti is convective heat transfer between indoor air and external walls, W; Q is the heat load of the room per unit time, W; qsh is convective heat transfer from lighting, human and equipment sensible heat, W; qap is heat of air penetration, W.
4.1 Energy Consumption Results of Different Design Temperatures
The Design Builder software executes the simulation of energy consumption values [45] from 1 to 5 in the working conditions presented in Table 3. The results are demonstrated in Fig. 6. Initially, conditions 1~4 are simulated. The total energy consumption is the aggregation of refrigeration and heating energy consumption. In terms of numerical data, the minimum energy consumption is 110.2 × 10⁵ kWh when the design temperature is 18°C, differing by approximately 10% from the maximum energy consumption of 123.6 × 10⁵ kWh when the design temperature is 22°C. It is evident and comprehensibly shown that refrigeration energy consumption decreases with an increase in the design temperature while heating energy consumption rises with an increase in the design temperature. Further analysis reveals that the specifications require the temperature change within 24 h not to exceed ±2°C. It can be easily inferred that setting a temperature of 16°C in winter and 22°C in summer while ensuring that the daily range is less than ±2°C significantly diminishes the total energy consumption. Therefore, a simulation calculation of the fifth working condition is conducted. In the fifth working condition, the total energy consumption is 45.0 × 10⁵ kWh, with energy consumption reduced by 59% compared to a single design temperature of 18°C, demonstrating a remarkable energy-saving effect. In addition, refrigeration energy consumption is reduced by approximately 75%, while heating energy consumption is reduced by about 44%.
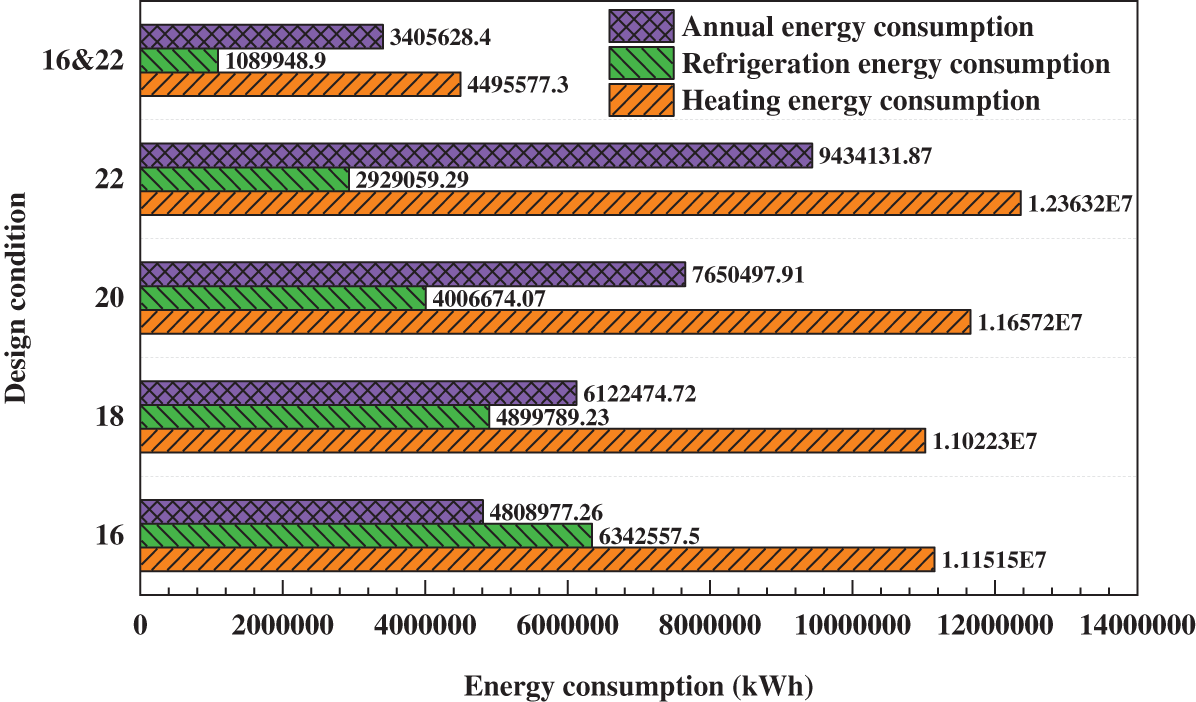
Figure 6: Energy consumption under different design conditions
4.2 Hourly Energy Consumption per Unit Area
Fig. 7 displays the hourly energy consumption per unit area in the 8760 h of the year. At the heating design temperature [46] of 16°C, the average building heat index is approximately 35 W/m2. Conversely, at the refrigeration design temperature of 22°C, the average building cold index is approximately 30 W/m2. It is discernible that the cold and heat index of the underground building is substantially less than that of the above-ground building. Notably, during April and October, heating and cooling requirements occur simultaneously. Therefore, the design must consider the switching and automatic control of the operation of the cold and hot sources.
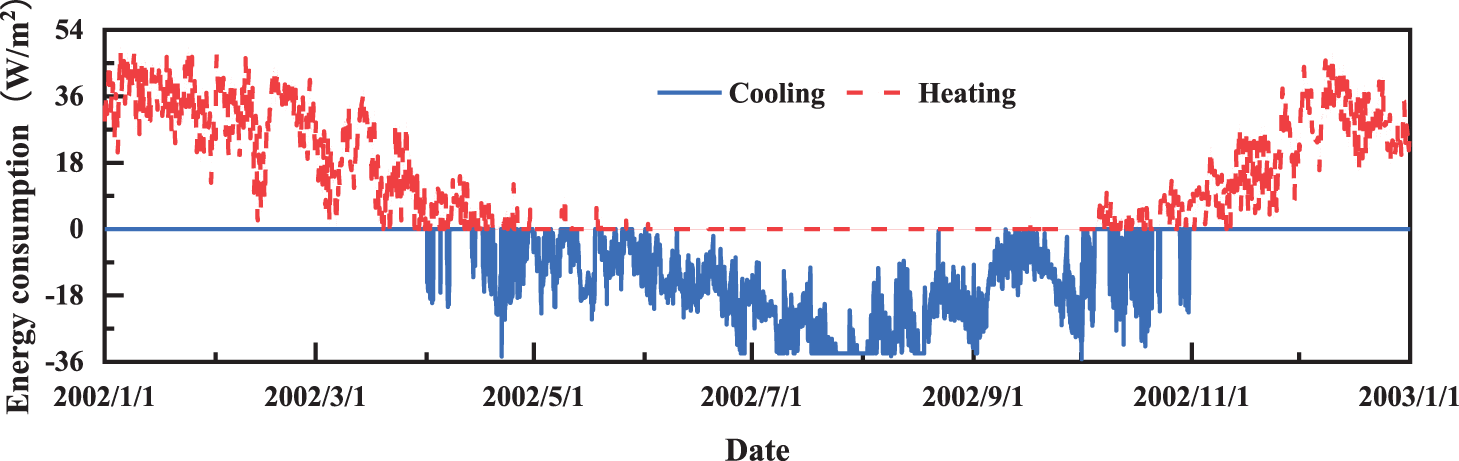
Figure 7: Energy consumption per hour per unit area
4.3 Outdoor Dry Bulb Temperature and Indoor Operating Temperature
Under the conditions specified in Section 4.1 of this article, the outdoor dry bulb temperature and indoor operating temperature for 8760 h in a year are analyzed with a design temperature of 16/22°C, as presented in Fig. 8. The outdoor dry bulb temperature exhibits significant fluctuations, but the room temperature undergoes minimal fluctuation, satisfying the design temperature requirements, and the temperature change within 24 h does not exceed ±2°C. Accordingly, under ideal circumstances, air conditioning can realize indoor temperature control.
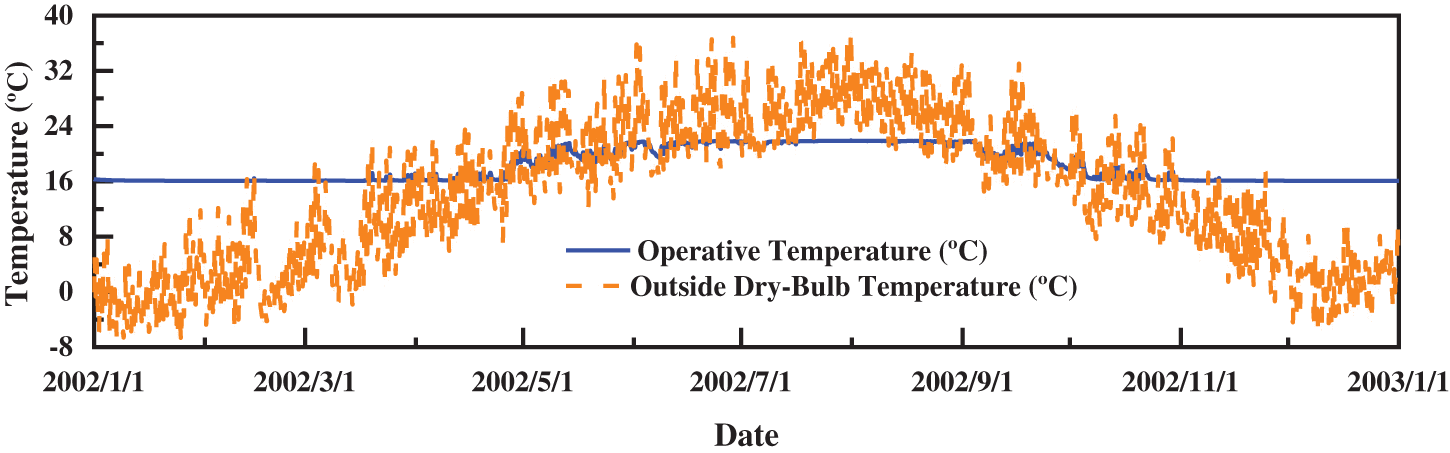
Figure 8: Operative temperature and outside dry-bulb temperature per hour per unit area
Fig. 9 displays the hourly indoor average air temperature and relative humidity [47] throughout the year. The figure shows that humidity can be better controlled in winter under conventional air conditioning. However, in the transition seasons (April and October), the humidity exceeds the set value of 50% ± 5%, even exceeding the specification requirement of 60%. In addition, during summer, particularly from late July to early August, the relative humidity significantly surpasses the norm. Under such circumstances, traditional air conditioners are insufficient to meet the dehumidification requirements, necessitating the procurement of a specialized dehumidification system. The capacity determination of the dehumidification system for HVAC system design is essential. The simulation results indicate that when the annual relative humidity exceeds the design limit of 60%, professional dehumidification equipment must reduce the relative humidity to 50%. The outcome is the dehumidification per unit area, as demonstrated in Fig. 10. As exhibited in Fig. 7, the dehumidification amount per unit area typically ranges within 300 g/h. By implementing a dehumidification system on 1500 square meters of 25 m × 60 m, the dehumidification amount can be essentially maintained below 45 kg/h.
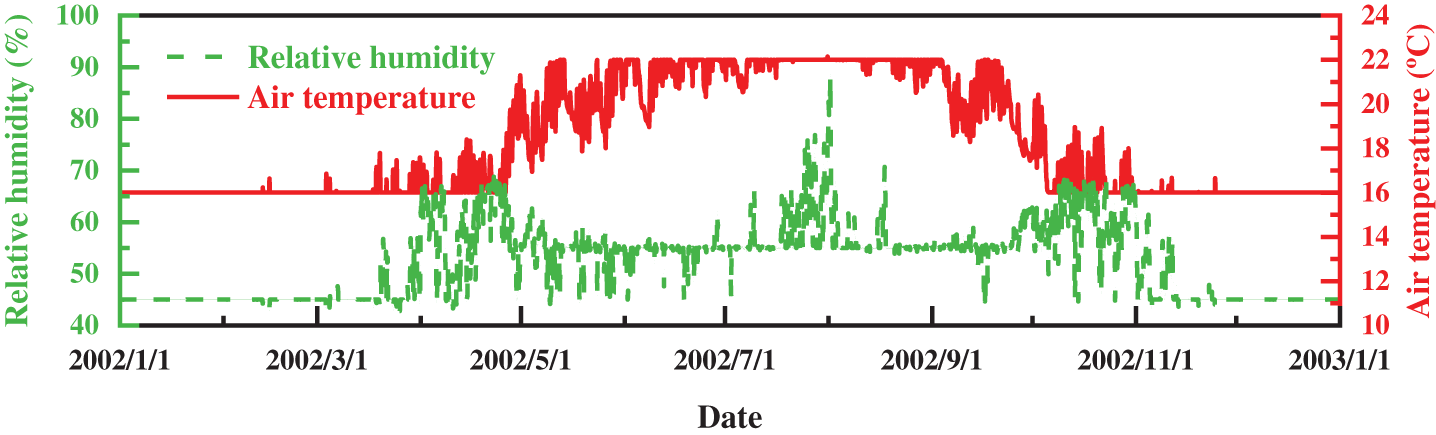
Figure 9: Hourly average indoor air temperature and relative humidity
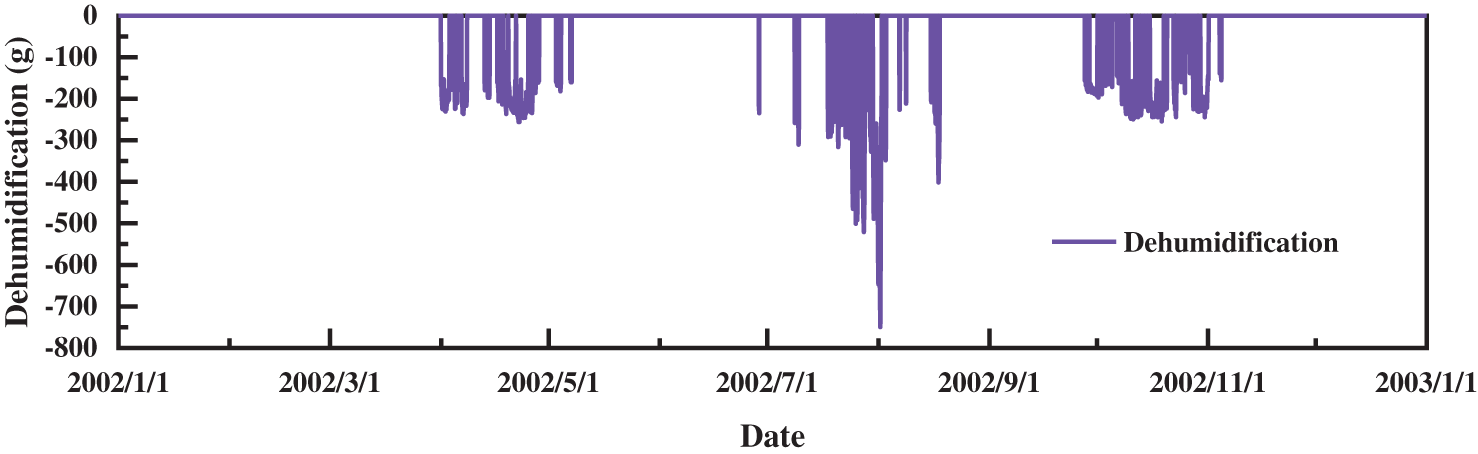
Figure 10: Dehumidification amount per hour per unit area
According to the simulation results, when the annual relative humidity exceeds the design limit by 60%, professional dehumidification equipment reduces the relative humidity to 50%. The result is dehumidification per unit area, as shown in Fig. 10. As can be seen from Fig. 7, the dehumidification amount per unit area is basically within 300 g/h. If a dehumidification system is applied to 1500 square meters of 25 m * 60 m, the dehumidification amount can be basically controlled within 45 kg/h. The formula method calculates typical working conditions, and working parameters are shown in Table 4.
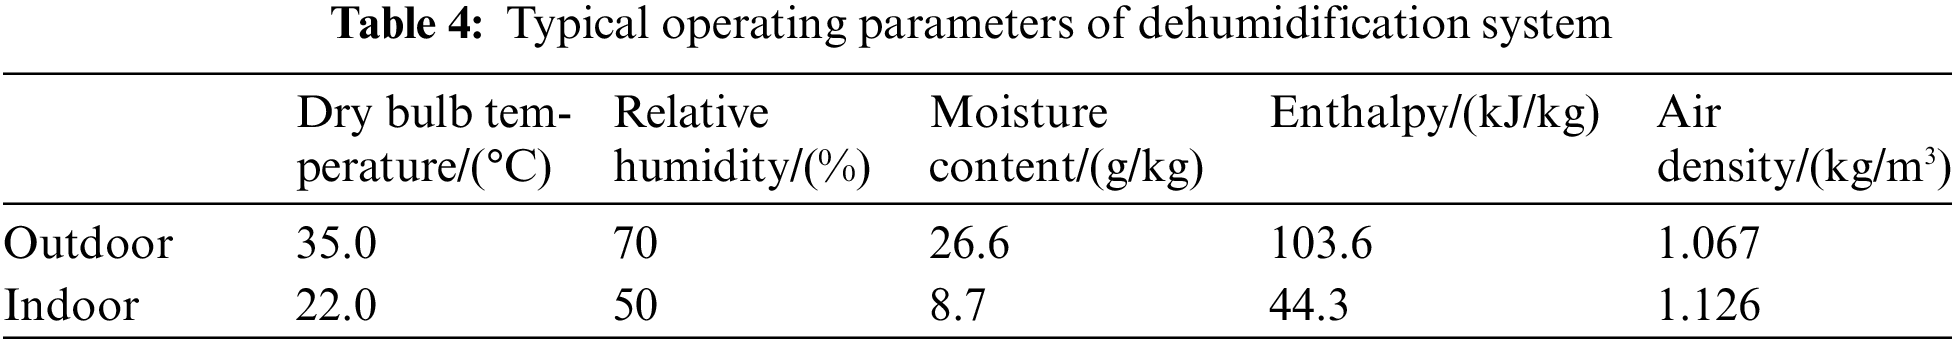
According to the calculation, the overall moisture dissipation through the enclosure structure, where F is 2, is determined. The design circulation air volume of 20000 m3/h, with 6% (L = 1200 m3/h) fresh air to provide micro positive pressure. For this part of the wet load, the air density is 1.126 kg/m3, resulting in an average dehumidification of roughly 34.7 kg/h for 1500 square meters. There is approximately a 23% error between the calculated value and the simulated value, resulting from the difference in coefficient selection caused by the state points’ selection and the method of enclosure structure. If the simulated value is considered the baseline, the excess part can be utilized as surplus to further guarantee humidity control.
This article constitutes an analysis of an actual underground construction project utilizing Design Builder software. The annual energy consumption and hourly heat and humidity loads were simulated and quantitatively analyzed, elucidating the characteristics of heat and humidity load. Through the analysis of the simulation results, the following conclusions can be drawn:
(1) The choice of design state point of air conditioning in underground buildings has a great influence on energy consumption. In this paper, the control variable method is used. Compared with the single design temperature of 18°C, the winter temperature is set to 16°C, and the summer temperature is set to 22°C, which can reduce the energy consumption by about 59%. HVAC design that fully reflects seasonal characteristics can achieve significant energy-saving effects.
(2) Moisture-proof and dehumidification are of great significance for underground construction. Since the surface of underground buildings is in direct contact with high-wet soil, and there is no sunlight exposure, the moisture content of underground buildings is significantly higher than that of above-ground buildings. Moisture resistance and dehumidification have become key and challenging goals in HVAC design for underground buildings.
(3) The cold and heat load of underground buildings is low, and the thermal performance is “warm in winter and cool in summer”. Temperature and solar radiation indirectly affect underground structures due to contact with soil. The ground temperature is influenced by both air and buried depth. Generally speaking, as the depth increases, the ground temperature decreases, and there is a long delay before the constant temperature is reached. Therefore, the thermal load and cooling load of the underground building envelope are lower than that of the ground building.
Acknowledgement: Not applicable.
Funding Statement: This research was funded by the Research Project of China Northwest Architecture Design and Research Institute Co., Ltd., “Simulation of Building Energy Consumption and Airflow Organization in Special Environment” (Grant Number: NB-2020-NT-03).
Author Contributions: The authors confirm contribution to the paper as follows: study conception and design: J. Ai, J. Xue; data collection: X. Huang, B. Sundén; analysis and interpretation of results: J. Ai, X. Huang. P. Wei, X. Yang; draft manuscript preparation: J. Ai, X. Yang, B. Sundén. All authors reviewed the results and approved the final version of the manuscript.
Availability of Data and Materials: No data was used for the research described in the article.
Conflicts of Interest: The authors declare that they have no conflicts of interest to report regarding the present study.
References
1. Zhang, C., Wang, F., Bai, Q. (2021). Underground space utilization of coalmines in China: A review of underground water reservoir construction. Tunnelling and Underground Space Technology, 107(9), 103657. [Google Scholar]
2. Yuan, Y. L., Hu, C. M., Xu, J., Mei, Y., Wang, F. F. et al. (2023). Experimental research on the creep behavior of the interface of compacted loess and high-density polyethylene geogrid. Buildings, 13(5), 1353. [Google Scholar]
3. Hu, G., You, F. (2023). Multi-zone building control with thermal comfort constraints under disjunctive uncertainty using data-driven robust model predictive control. Advances in Applied Energy, 9, 100124. [Google Scholar]
4. Li, X., Qin, L., Li, J. (2023). Research on multiple energy-saving strategies for existing coach stations: A case of the Xi’an area, China. Buildings, 13(5), 1215. [Google Scholar]
5. Liu, X., Geng, X., Huang, K., Feng, G., Zhao, H. et al. (2023). Evaluation of suitability of university ladder classroom environment on humans. Energy and Built Environment, 75(14), 46. [Google Scholar]
6. Zheng, W., Hu, J., Wang, Z., Li, J., Fu, Z. et al. (2021). COVID-19 impact on operation and energy consumption of heating, ventilation and air-conditioning (HVAC) systems. Advances in Applied Energy, 3, 100040. [Google Scholar]
7. Song, S., Long, J., Jiang, H., Ran, B., Yao, L. (2023). Characteristics of office lighting energy consumption and its impact on air conditioning energy consumption. Energy and Built Environment, 51(5), 2100e2110. [Google Scholar]
8. Tafelmeier, S., Pernigotto, G., Gasparella, A. (2017). Annual performance of sensible and total heat recovery in ventilation systems: Humidity control constraints for European climates. Buildings, 7(4), 28. [Google Scholar]
9. Sorooshnia, E., Rahnamayiezekavat, P., Rashidi, M., Sadeghi, M., Samali, B. (2023). Passive intelligent kinetic external dynamic shade design for improving indoor comfort and minimizing energy consumption. Buildings, 13(4), 1090. [Google Scholar]
10. Wesonga, R., Kasedde, H., Kibwami, N., Manga, M. (2023). A comparative analysis of thermal performance, annual energy use, and life cycle costs of low-cost houses made with mud bricks and earthbag wall systems in Sub-Saharan Africa. Energy and Built Environment, 4(1), 13–24. [Google Scholar]
11. Pan, Y., Zhu, M., Lv, Y., Yang, Y., Liang, Y. et al. (2023). Building energy simulation and its application for building performance optimization: A review of methods, tools, and case studies. Advances in Applied Energy, 10(6), 100135. [Google Scholar]
12. Gao, R., Zhang, W., Wang, G., Wang, X. (2023). Experimental research on motion analysis model and trajectory planning of GLT palletizing robot. Buildings, 13(4), 966. [Google Scholar]
13. Yang, S., Gao, H. O., You, F. (2023). Building electrification and carbon emissions: Integrated energy management considering the dynamics of the electricity mix and pricing. Advances in Applied Energy, 10(10), 100141. [Google Scholar]
14. Zhang, K., Prakash, A., Paul, L., Blum, D., Alstone, P. et al. (2022). Model predictive control for demand flexibility: Real-world operation of a commercial building with photovoltaic and battery systems. Advances in Applied Energy, 7(1), 100099. [Google Scholar]
15. Li, J., Zhang, Y., Zhu, Z., Zhu, J., Luo, J. et al. (2024). Thermal comfort in a building with Trombe wall integrated with phase change materials in hot summer and cold winter region without air conditioning. Energy and Built Environment, 5(1), 58–69. [Google Scholar]
16. Bae, Y., Bhattacharya, S., Cui, B., Lee, S., Li, Y. et al. (2021). Sensor impacts on building and HVAC controls: A critical review for building energy performance. Advances in Applied Energy, 4(3), 100068. [Google Scholar]
17. Wu, C., Zhang, X., Li, Y. (2021). Study on influencing factors of thermal and humid environment change in deep buried laboratory during precooling period. Heating Ventilating & Air Conditioning, 49, 76–82. [Google Scholar]
18. Huang, X., Li, F., Xiao, T., Guo, J., Wang, F. et al. (2023). Investigation and optimization of solidification performance of a triplex-tube latent heat thermal energy storage system by rotational mechanism. Applied Energy, 331, 120435. [Google Scholar]
19. Xiao, G., Yao, Y., Jiang, Y. Q. (2010). Research on heat and humidity load calculation software of underground building. Building Science, 26, 48–52. [Google Scholar]
20. Abdalgadir, Y., Qian, H., Zhao, D., Adam, A., Liang, W. (2022). Daily and annual performance analyses of the BIPV/T system in typical cities of Sudan. Energy and Built Environment, 4(5), 516–524. [Google Scholar]
21. Li, H., Wang, Z., Hong, T., Piette, M. A. (2021). Energy flexibility of residential buildings: A systematic review of characterization and quantification methods and applications. Advances in Applied Energy, 3, 100054. [Google Scholar]
22. Zhang, P. F. (2012). Research on heat and humidity environment control of special underground space in Hengyang City (Master Thesis). University of South China, China. [Google Scholar]
23. Li, S. L. (2011). CFD simulation research on thermal and humid environment of enclosed soil site museum (Master Thesis). Xi’an University of Architecture and Technology, China. [Google Scholar]
24. Minaei, A., Safikhani, H. (2021). A new transient analytical model for heat transfer of earth-to-air heat exchangers. Journal of Building Engineering, 33, 101560. [Google Scholar]
25. Bansal, V., Misra, R., Agarwal, G. D., Mathur, J. (2013). Transient effect of soil thermal conductivity and duration of operation on performance of earth air tunnel heat exchanger. Applied Energy, 103(6), 1–11. [Google Scholar]
26. Bisoniya, T. S., Kumar, A., Baredar, P. (2014). Heating potential evaluation of earth-air heat exchanger system for winter season. Journal of Building Physics, 39(3), 242–260. [Google Scholar]
27. Beard, J. L., Wundram, E. C., Loulakis, M. C. (2001). Design-build: Planning through development. 1st Edition. New York: McGraw-Hill Education. [Google Scholar]
28. Wei, M., Lee, S. H., Hong, T., Conlon, B., McKenzie, L. et al. (2021). Approaches to cost-effective near-net zero energy new homes with time-of-use value of energy and battery storage. Advances in Applied Energy, 2, 100018. [Google Scholar]
29. Li, F., Huang, X., Li, Y., Lu, L., Meng, X. et al. (2023). Application and analysis of flip mechanism in the melting process of a triplex-tube latent heat energy storage unit. Energy Reports, 9, 3989–4004. [Google Scholar]
30. Du, Z., Liu, G., Huang, X., Xiao, T., Yang, X. et al. (2023). Numerical studies on a fin-foam composite structure towards improving melting phase change. International Journal of Heat and Mass Transfer, 208, 124076. [Google Scholar]
31. Huang, X., Li, F., Li, Y., Gao, X., Yang, X. et al. (2023). Investigation and optimization on melting performance of a triplex-tube heat storage tank by rotational mechanism. International Journal of Heat and Mass Transfer, 205, 123892. [Google Scholar]
32. Xiao, T., Liu, Z., Lu, L., Han, H., Huang, X. et al. (2023). LSTM-BP neural network analysis on solid-liquid phase change in a multi-channel thermal storage tank. Engineering Analysis with Boundary Elements, 146(11), 226–240. [Google Scholar]
33. Liu, G., Du, Z., Xiao, T., Guo, J., Lu, L. et al. (2022). Design and assessments on a hybrid pin fin-metal foam structure towards enhancing melting heat transfer: An experimental study. International Journal of Thermal Sciences, 182, 107809. [Google Scholar]
34. Lu, Y. (2008). Practical heating and air conditioning design manual. In: HVAC, vol. 152. China: Building Industry Press. [Google Scholar]
35. Huang, X., Li, F., Li, Y., Meng, X., Yang, X. et al. (2023). Optimization of melting performance of a heat storage tank under rotation conditions: Based on taguchi design and response surface method. Energy, 271, 127100. [Google Scholar]
36. Huang, X., Li, F., Lu, L., Li, Z., Yang, X. et al. (2023). Depth optimization of solidification properties of a latent heat energy storage unit under constant rotation mechanism. Energy and Buildings, 290, 113099. [Google Scholar]
37. Li, G. Z. (2002). Moisture and dehumidification of underground works. Shandong Building Materials, 23(6), 45–46. [Google Scholar]
38. Kurnitski, J. (2001). Ground moisture evaporation in crawl spaces. Building and Environment, 36(3), 359–373. [Google Scholar]
39. Design Manual of HVAC for Underground Buildings (1983). Beijing, China: China Architecture and Building Press. [Google Scholar]
40. Lu, Y. K. (1995). Air conditioning design manual. HVAC or ASHRAE Press. [Google Scholar]
41. G, H. L., Geng, S. B. (2002). Wet load calculation of underground building. Heating Ventilating & Air Conditioning, 32, 70–71. [Google Scholar]
42. Huang, X., Yao, S., Yang, X., Sun, X., Zhou, R. et al. (2022). Polarization analysis and optimization of negative electrode nickel foam structure of zinc-nickel single-flow battery. Journal of Energy Storage, 55, 105624. [Google Scholar]
43. Wang, R. F. (2009). Comparative study on thermal model of building energy consumption simulation software (Master Thesis). Beijing University of Technology, China. [Google Scholar]
44. Yan, D., Xie, X., Song, F., Jiang, Y. (2004). Building environment design simulation analysis software, the first part of the building dynamic thermal process model. Heating Ventilating & Air Conditioning, 34, 35–47. [Google Scholar]
45. Pérez-Lombard, L., Ortiz, J., Pout, C. (2008). A review on buildings energy consumption information. Energy and Buildings, 40(3), 394–398. [Google Scholar]
46. Li, Y., Li, B., Liu, C., Su, S., Xiao, H. et al. (2020). Design and experimental investigation of a phase change energy storage air-type solar heat pump heating system. Applied Thermal Engineering, 179, 115506. [Google Scholar]
47. Auler, A., Cássaro, F., da Silva, V., Pires, L. (2020). Evidence that high temperatures and intermediate relative humidity might favor the spread of COVID-19 in tropical climate: A case study for the most affected Brazilian cities. Science of the Total Environment, 729, 139090. [Google Scholar] [PubMed]
Cite This Article
 Copyright © 2023 The Author(s). Published by Tech Science Press.
This work is licensed under a Creative Commons Attribution 4.0 International License , which permits unrestricted use, distribution, and reproduction in any medium, provided the original work is properly cited.
 Downloads
 Citation Tools