
 Submit a Paper
 Propose a Special lssue
 Open Access
ARTICLE

Cross Flow Characteristics and Heat Transfer of Staggered Tubes Bundle: A Numerical Study
Department of Mechanical Engineering, College of Engineering, Mustansiriyah University, Baghdad, Iraq
* Corresponding Author: Husam Rashid Hudear. Email:
Frontiers in Heat and Mass Transfer 2023, 21, 367-383. https://doi.org/10.32604/fhmt.2023.042639
Received 07 June 2023; Accepted 25 July 2023; Issue published 30 November 2023
 View Full Text
 Download PDF
Abstract
This paper presents a numerical emulation study of heat transmission through tube banks in three-dimensions. Staggered configuration is displayed by fluid dynamics using computer programs (CFD) software (ANSYS fluent). The computer model is used to predict the values of the Nusselt number when changing the values of heat flux and longitudinal pitch. The longitudinal pitch (SL/D) of 1.3, 1.8, and 2.4 mm. The transverse pitch (ST/D) of 1.5 mm, and also considered Reynolds numbers 10000, 13000, 17000, and 190000. The staggered configuration of the tube bundle is demonstrated to investigate the impact of this arrangement on the heat transmission rate from the tubes. The gotten results indicate that the rate of heat transmission increases with decreases in the longitudinal spacing (SL). As the longitudinal spacing (SL) increases to about 44% the Nusselt number is slightly decreased by about 9%. The coefficient of heat transmission, Nusselt number, and the heat transmission data obtained from (CFD) Compared to previous research results, there is a decent agreement originating after comparison.Keywords
Nomenclature
| CP | Specific heat (J/Kg.K) |
| Maximum velocity (m/s) | |
| Inlet velocity (m/s) | |
| Diagonal spacing (m) | |
| Number of tubes in column | |
| D | Diameter of tubes (m) |
| Average heat transmission coefficient (W/m2.K) | |
| K | Thermal conductivity (W/m.K) |
| L | Length of tubes (m) |
| N | Number of tubes |
| Average nusselt number | |
| Q | Heat transmission rate (W) |
| Re | Reynolds number |
| Average surface temperature (K) | |
| Longitudinal pitch (m) | |
| Transverse pitch (m) | |
| Outlet air temperature (K) | |
| Inlet air temperature (K) | |
| Log mean temperature (K) | |
| Generation of turbulent kinetic energy due to mean velocity | |
| Generation of turbulent kinetic energy due to buoyancy | |
| Fluctuating dilatation in compressible turbulence to the overall dissipation rate | |
| Represents the inverse of the effective Prandtl number for (k and ε), respectively | |
| The user-defined source term | |
| Turbulent viscocity | |
| j | Heat transfer factor |
| Subscripts | |
| i | Inlet |
| f | Fluid |
| o | Outlet |
| p | Pressure (N/m2) |
| T | Temperature (K) |
| S | Tube surface |
| Greek symbols | |
| ρ | Density (Kg/m2) |
| α | Thermal diffusivity (m2/s) |
| υ | Kinematic viscosity (Pa.s) |
The rate of heat transmission and fluid flow in the bundle of tubes exemplifies several industrial important operations. The bank of tubes is typically used in the cross-flow of heat exchangers. The design relies on empirical relationships between pressure drop with the amount of heat transfer. The heat exchangers and tubes bundle in cross-flow are of large workable interest in several chemical and thermal engineering applications. The bank of tubes uses in several important industrial operations, like thermal power stations, conditioning systems, and heating systems. Several tube designs may be achieved for efficient heat transmission between fluids. Tube bundles are typically coordinated in a staggered or an in-line arrangement [1–5].
Many studies have investigated the improvement of heat transfer through a bundle of tubes. Tahseen et al. [6] studied heat transfer by forced convection on a two-dimension staggered bank of tubes for cross-flow steady-state, incompressible conditions using the FDM procedure across a laminar flow field at the tube banks. The steady heat flux was placed on the surface of the tubes with a tube diameter of 15 mm, and the number of tubes was 10. The ratio of longitudinal pitch to diameter is 1.25, 1.5, and 2. Reynold’s number range is 50 to 250. They discovered that the heat transmission rate increased with a decreased longitudinal pitch. Mangrulkar et al. [7] examined the numerical analysis of friction factor and heat transmission properties to cam-shaped an in-line tube bundle in cross-flow utilizing the ANSYS Fluent code (14.5) computational fluid dynamic (CFD). The Reynold number ranges from 11500 to 42500. The number of tubes was 16 and the diameter was 22.45 mm. The longitudinal and transverse pitch ratios are 1.5, and 1.25, respectively. The numerical simulation results show that the cam-shaped tube banks outperform the circular tubes in terms of thermal performance. Because the friction factor is lowered by 85–89% when compared to circular tubes, heat transmission by friction factor (Nu/f) is boosted by 5 times. Saraireh et al. [8] searched the heat transmission for an in-line and staggered bank of tubes using (CFD) code ANSYS Fluent software. The shape of the tube that was used is oval with a large diameter of 18.5 mm, and a small diameter of 10 mm, and the number of tubes was 16. The longitudinal pitch is 40 mm, and the transverse pitch is 42 mm. The Reynold number changed from 400 to 650. The heat flux varies from 1000 to 3500 W/m². They find that the average value of the Nusselt number increased with increasing the velocity of the fluid and walls heat flux. Refaey et al. [9] studied convective heat transmission from disorderly flow through the staggered banks of tubes and was examined numerically. They used (CFD) program ANSYS Fluent with Reynold number varies from 5000 to 50000. At transverse pitch with ratio (
Inside this investigation, a bank of copper tubes that are submerged in cross-flowing air at room temperature serves as the model system. The purpose of the study is to investigate the heat-transmission enhancement of a 3D tube bundle with various configurations by studying the effects of the tube pitch at different heat fluxes. The sample is employed to forecast the average Nusselt number and the rate of heat transmission caused by convective heat.
The three-dimensional, staggered tube bank problem under study has a tube diameter of 19 mm, a tube length of 270 mm (Table 1), and a longitudinal pitch (SL) of 25, 35, and 45 mm. The transverse pitch is 28 mm. The transport equations of the conservation of energy, continuity, and momentum equations serve as the fully expanded form of 3D coordinates [20–24]. Using three-dimensional formulas in Cartesian vector notation for steady-state incompressible flow fully developed. The physical system that was created for this investigation is shown in Figs. 1a–1d.
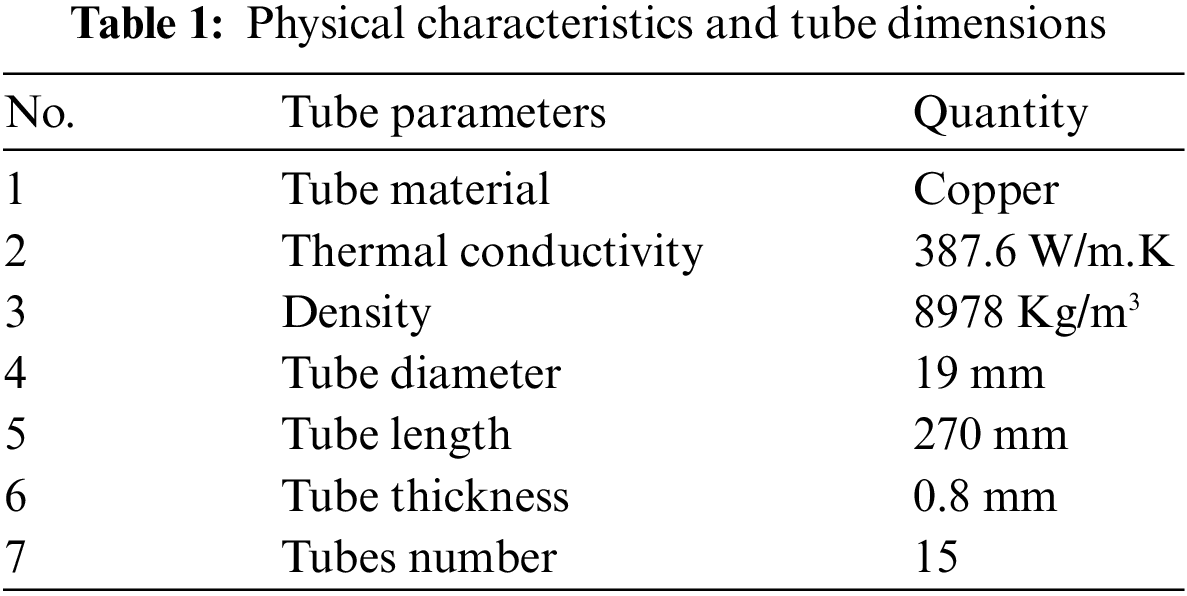
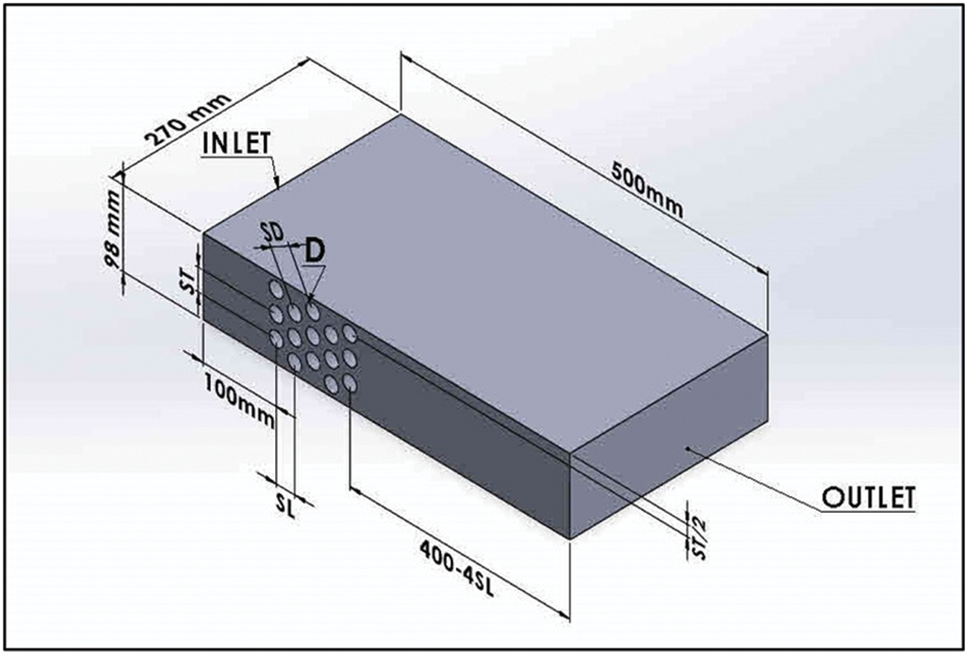
Figure 1a: The distribution of pipes, longitudinal pitch, transverse pitch, and air inlet and outlet
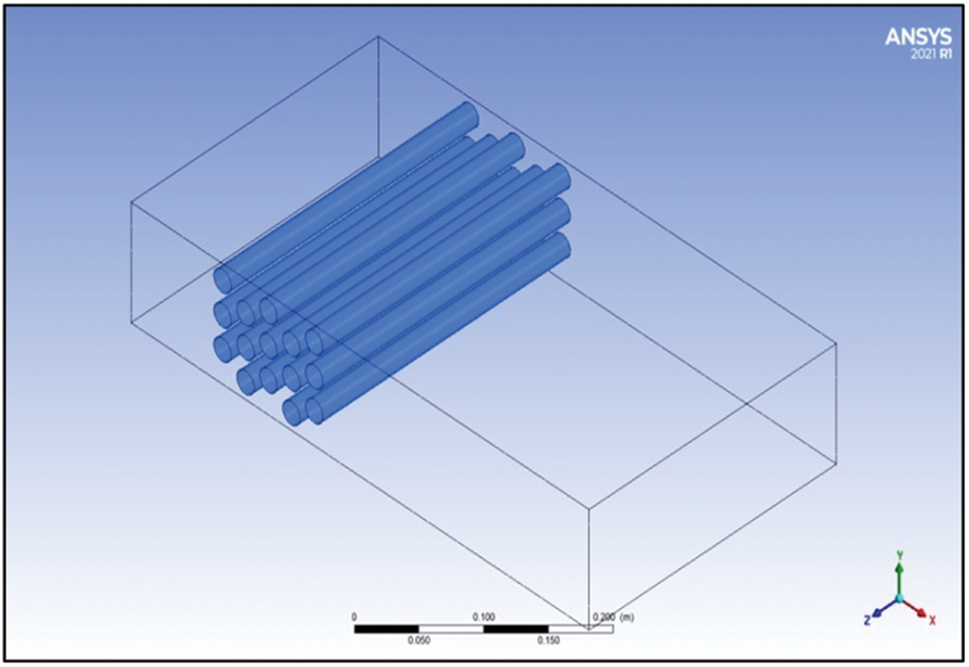
Figure 1b: The three-dimensional distribution of the tube bundle inside the duct with a longitudinal pitch of 25 mm
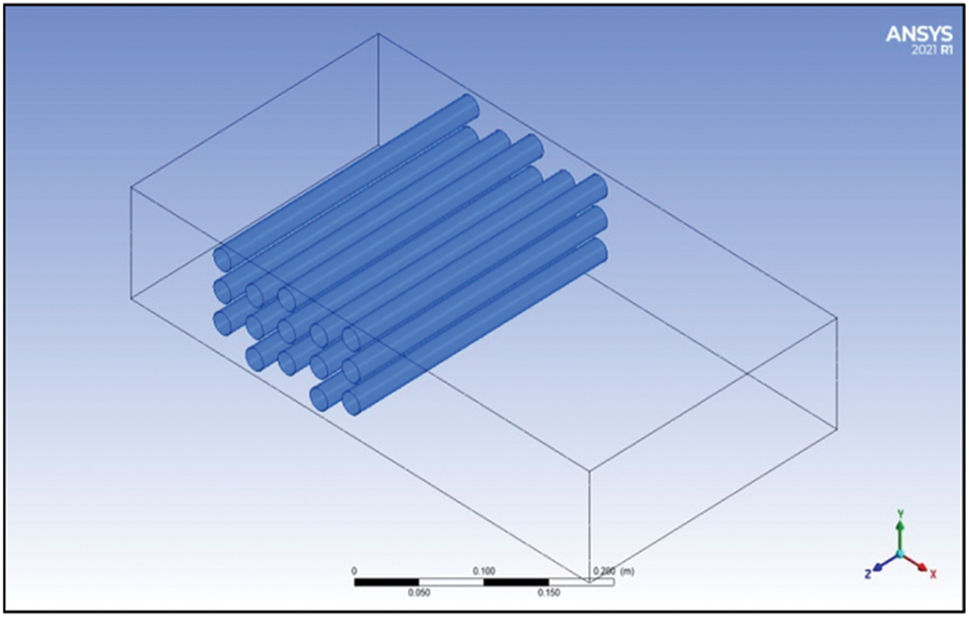
Figure 1c: The three-dimensional distribution of the tube bundle inside the duct with a longitudinal pitch of 35 mm
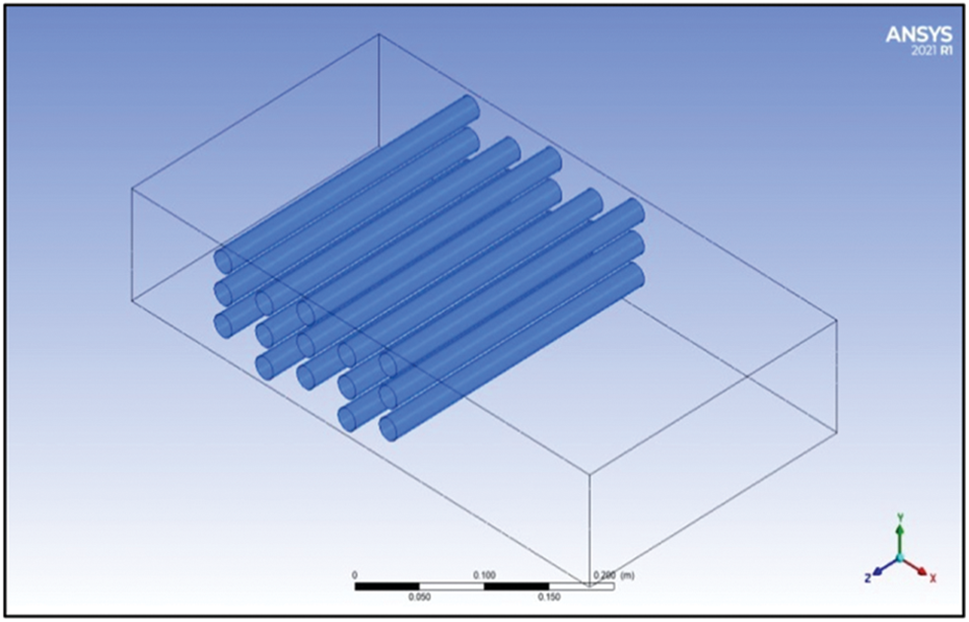
Figure 1d: The three-dimensional distribution of the tube bundle inside the duct with a longitudinal pitch of 45 mm
Energy:
Continuity:
Momentum (Navier-Stoke):
X- direction (u momentum)
Y- direction (v momentum)
Z- direction (w momentum)
The realizable k-ε turbulence model used in the current simulation along the wall of the tubes. The k-ε model is the straightforward and full form of two equations most frequently employed because it may be applied to complex flows that include swirl, flow separation, and secondary flow because of vortex generation. The essential mathematical statements form the basis of the fluid flow analysis solution. The governing equation is modeled by considering the fluid to be incompressible, single phase, fully developed steady state. The k-ε turbulent model is based on the transport equation for the turbulent kinetic energy (k) and the dissipation rate (ε). The equations that control the computer model can be expressed in the Cartesian coordinates as;
Conservation of mass
Conservation of momentum
Conservation of energy
The transport equation for the realizable k-ε model:
Turbulent kinetic energy
Turbulent dissipation rate
where,
A realizable k-ε turbulence sample, calculated at steady-state, implicit formulation, and energy equation is utilized in conjunction with the separable solver in the FLUENT program to tackle this issue. Similar to this, the upwind of the second-order technique is utilized for the density and momentum equation, while a SIMPLE approach is employed for the pressure coupled. In the current research, The governing equations’ accompanying boundary conditions are solved using the Finite Volume Method (FVM) by taking the forced convective flow into account, a three-dimensional (3D) computational model is created listed equations are used to find out the thermal performance of the tube bundle. The following presumptions are taken into account:
a) The fluid flow is assumed in a continuous, steady state and turbulence flow.
b) The velocity is assumed uniform in the inlet.
c) The fluid phase (air) is incompressible.
d) There are no local thermodynamic losses and the effects of radiation are disregarded.
e) At constant temperature, the tube wall was subjected to the no-slip boundary condition.
The following formulas can be used to compute Reynolds number and maximum velocity [25–28]:
The convection heat transfer coefficient is calculated by [29]:
The log-mean temperature can be computed from [30]:
The exit temperature can be valued from [31]:
The total heat transfer rate may be calculated using the equation shown below [31]:
2.2 The Mesh and Boundary Conditions
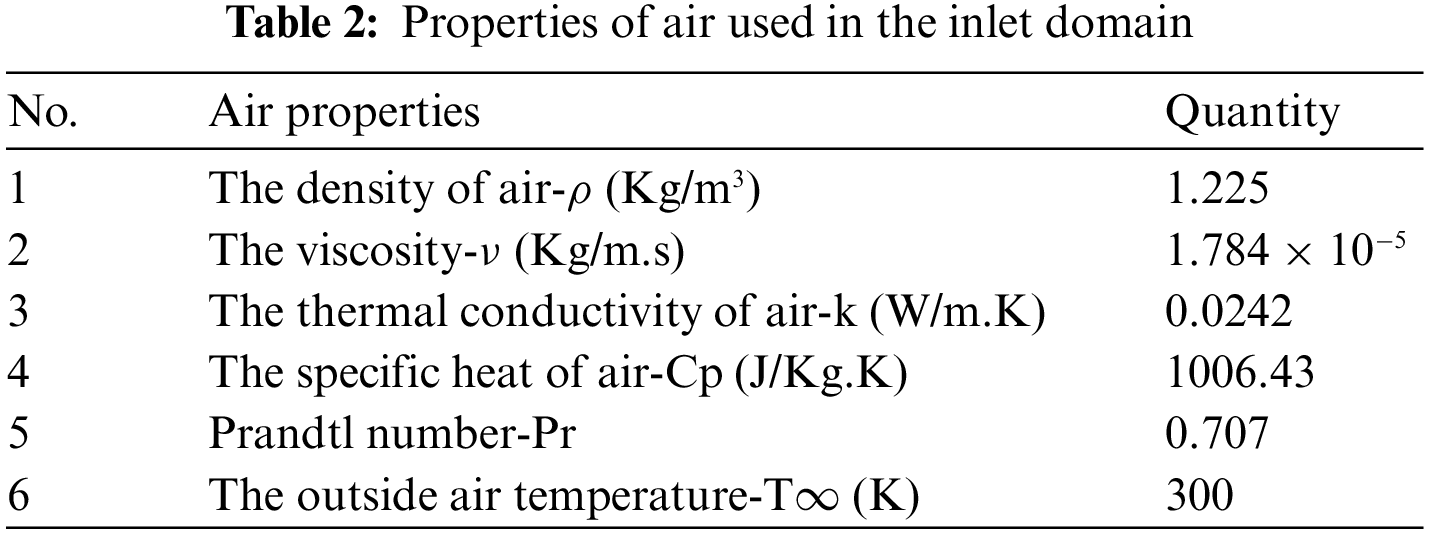
Using cells that are quadrilateral and tetrahedral, the mesh for this issue has been constructed for the domain by keeping the mesh quality at 0.83, and the skewness was 0.66. The non-uniform mesh is produced to enable a more accurate fluid flow. The model contains a fine mesh element with refining the mesh along the tube wall to allow for greater resolution of heat transmission. To fully capture the boundary layer generation over the cylinder, a total of 15 prism layer elements were produced with an initial height of 0.08 mm and a growth rate of 1.1, which is noticeably high. Figs. 2a and 2b separately show the mesh distribution and the arrangement of the mesh around the tubes. The initial conditions in terms of temperature, pressure, and speed of the test section were set to zero. The ambient temperature and pressure were set at 300 K and 101 Kpa, respectively. The inlet, outlet, and tube walls have been designated as the problem’s boundary locations. The inlet receives air at a temperature of 300 K and velocity applied of 0.9, 1.1, 1.4, and 1.7 m/s. The outlet pressure was set the same as the ambient pressure. The heat flux applied on the wall of the tube changed from 1551, 6205, 10858, and 15512 W/m2, respectively. Table 2 displays the air characteristics that were utilized in the inlet section of the model.
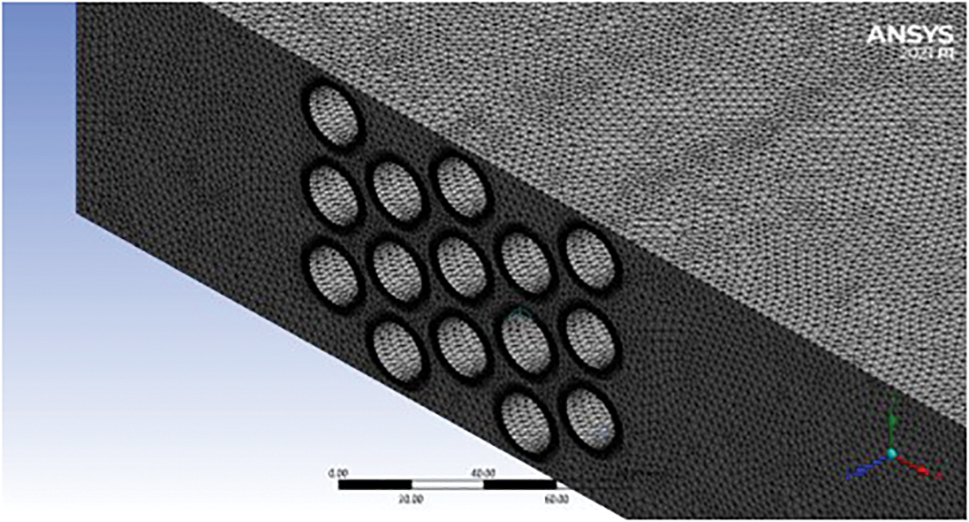
Figure 2a: Shows the mesh distribution
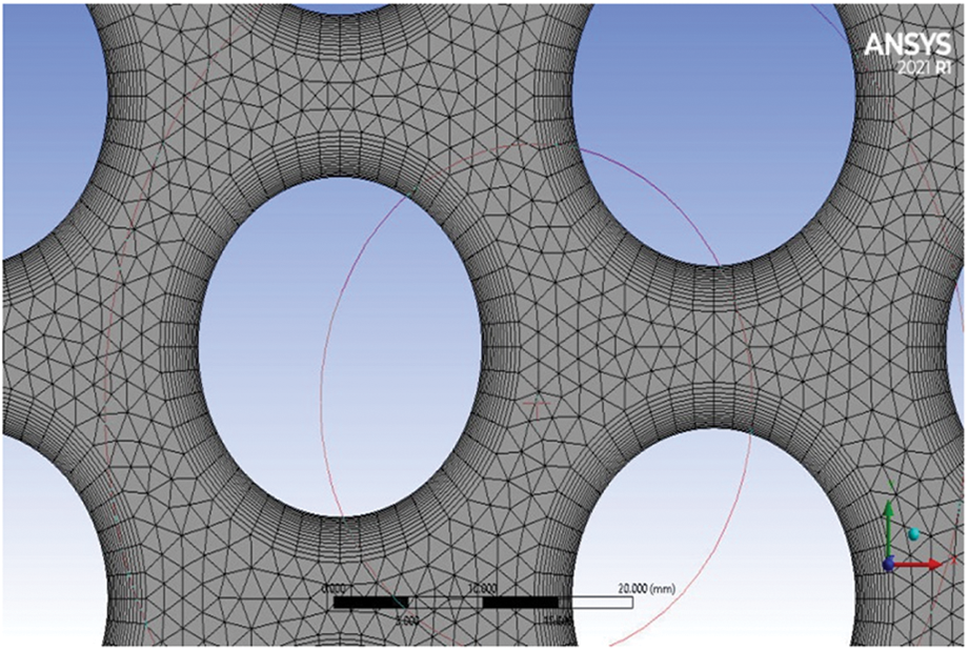
Figure 2b: Shows the arrangement of the mesh around the tubes
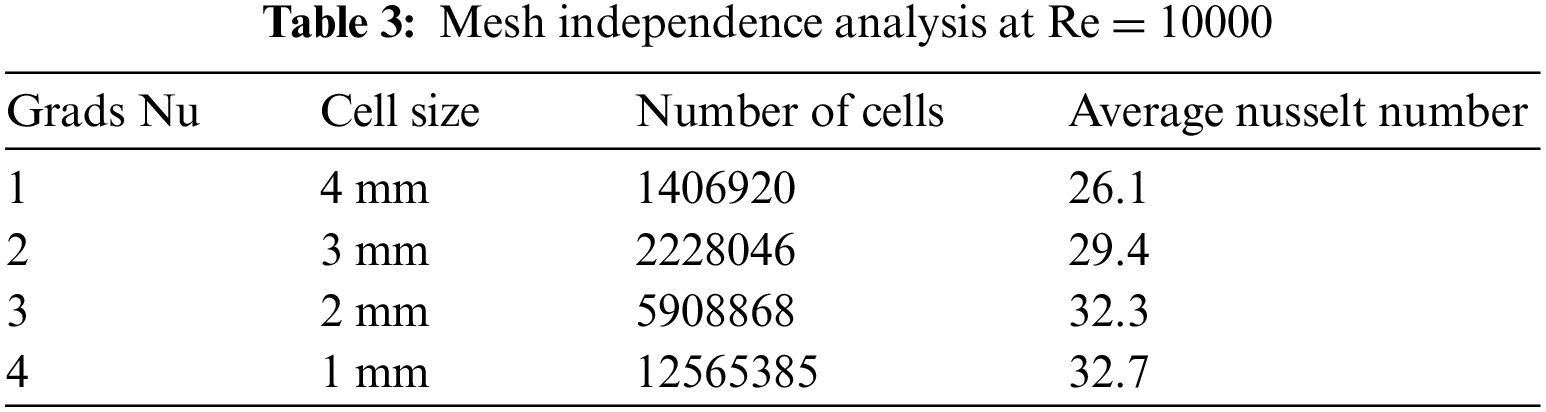
The essential check must be carried out for the minimum number of cells required for grid independence in the event of the numerical simulation grid independence is indispensable for the precision, repeatability, and validity of the numerical methods. Consequently, the four various grid systems comprising 1406920, 2228046, 5908868, and 12565385 of the number of cells were selected. Fig. 3 demonstrates how the grid is dependent on the average Nu for the Re of 10000. The graph shows a little change in the comparable Nu from 5.9 to 12.6 million cells, however, the change after that is not noticeable. Additionally, with the nominal change in the average Nu, the calculation time for the numerical simulation increases significantly. Table 3 provides information about the computational grid utilized in the current numerical simulation. For each grid system, the Nu was analyzed. It has been determined that the variation in the Nu for the most recent grid size, which included 12565385 cells, is not substantial and is on the order of 0.5%. Therefore, a cell size with 5908868 numbers of nodes was chosen for the numerical simulation by taking into account the fluctuation in the Nu as well as the calculation time requirement.
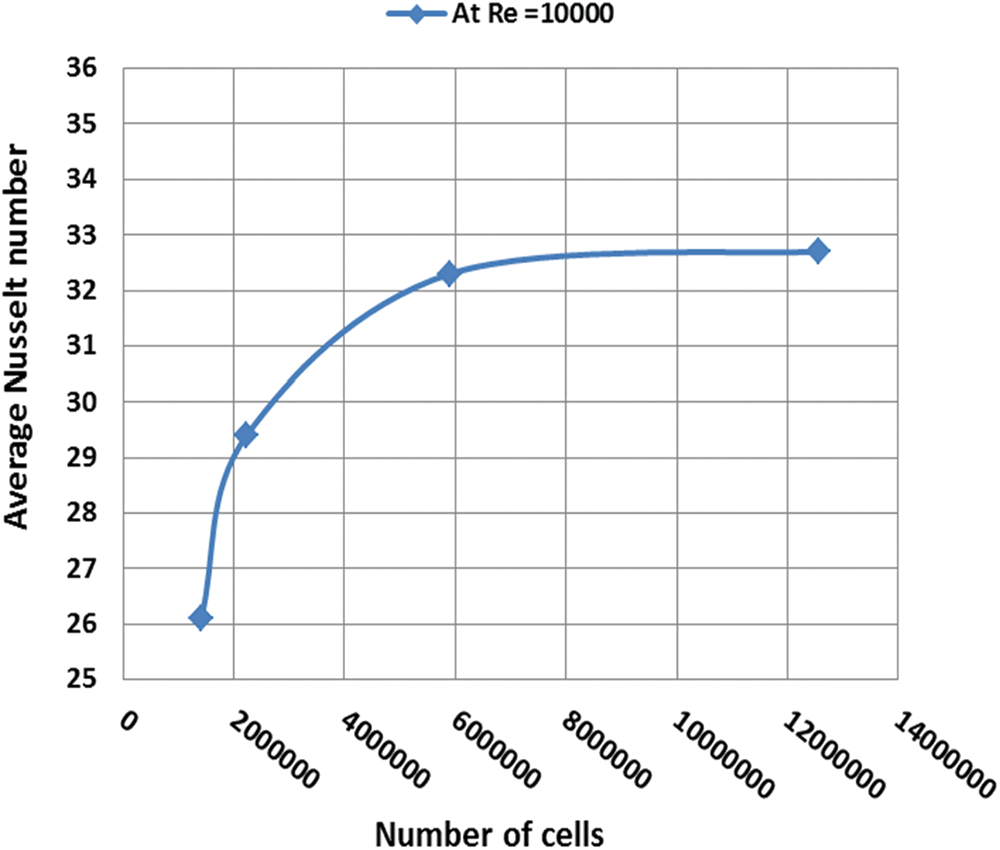
Figure 3: Grid independence
A few of the previously published benchmark issues were compared to the numerical model. It was projected how fluid flowing and heat transmission would occur over a line in staggered orbicular tubes subject to varying wall temperatures and heat flow. Using earlier research to compare the Nusselt number for the completely formed area amidst tubes with varied wall temperatures compares the results of the current study to earlier research by Mangrulkar et al. [7] for an array of oval tubes with an in-line arrangement. The tube diameter is 22.44 mm and the tube length is 22 mm. The longitudinal and transverse pitch ratios of 1.5 mm and 1.25 mm, respectively. The range of the Reynold number is 12000 to 24000. It enables us to see that the current results and the numerical results show perfect agreement with Mangrulkar et al. [7] for the average Circumference of the Nusselt number distribution. Fig. 4 showed compare between the average Nusselt numbers at the range of heat flux 15512 W/m2.
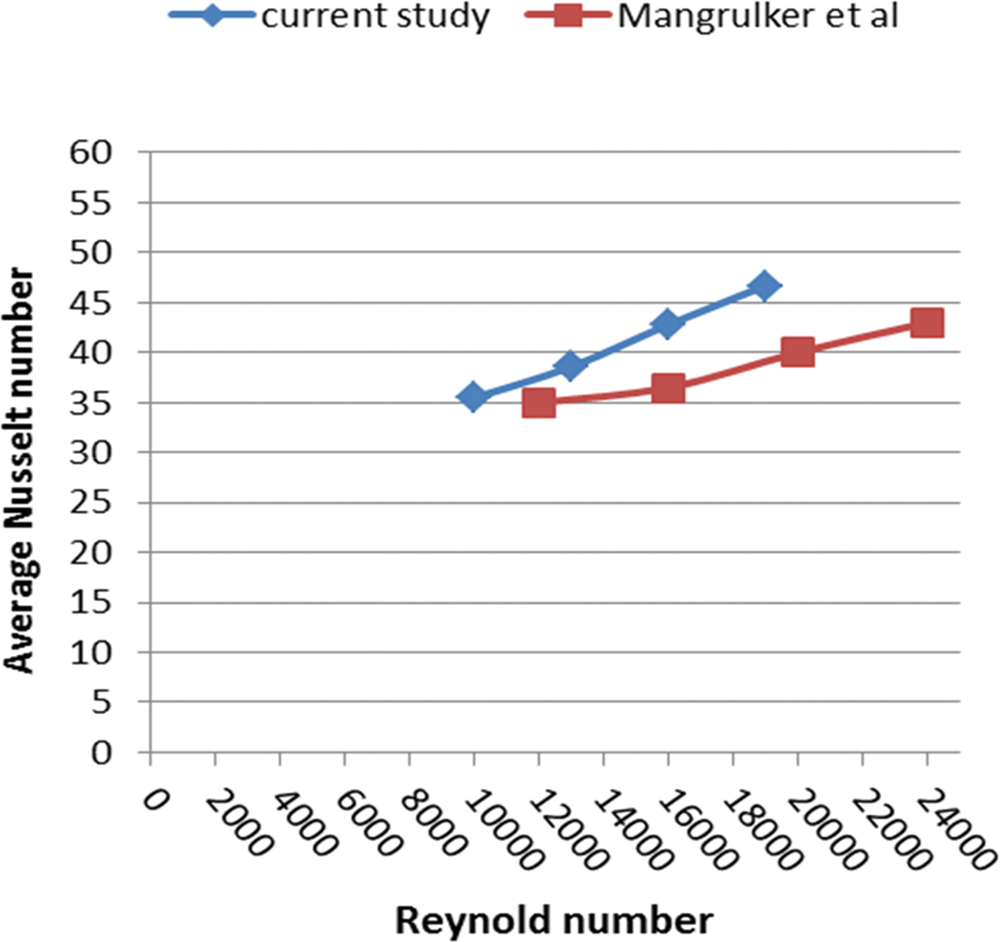
Figure 4: Average Nusselt number change with Reynold number at heat flux 10858 W/m2
A numerical simulation of a 3D tube bundle was performed. Using the FLUENT program can predict the average Nusselt number values for heat fluxes that vary between 1551 and 15512 W/m2. The effect of changing the longitudinal spacing by changing the heat flux was also studied as shown in Fig. 5. The figure demonstrates that a raise in the heat flux on the tube’s surface causes a rise in the average Nusselt number at Reynold number 10000. In addition, the influence of air velocity on the Nusselt number was investigated. The average Nusselt number changes with heat flux at various input air velocities.
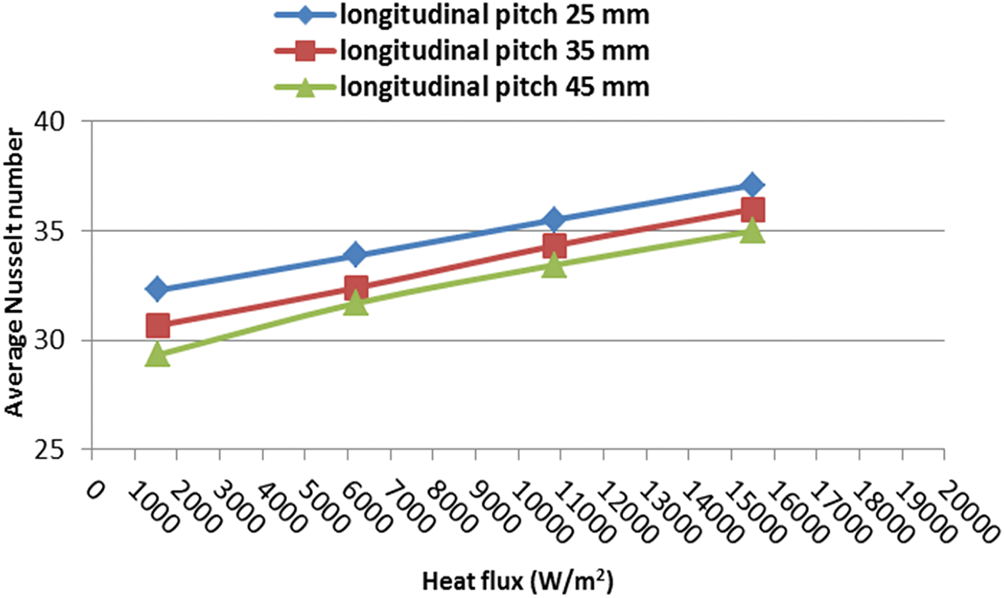
Figure 5: Nusselt number varies with changing heat flux at Reynold number 10000
The best model was chosen for further testing. The model with a longitudinal pitch of 25 mm is the best in terms of the best heat transfer and the highest Nusselt number. The tests are to be conducted to discuss the change of heat transfer of the tube bundle when changing the heat flux at different Reynolds number values. Table 4 indicates the average Nu for the numerical simulation for various Re. Figs. 6 to 9 show provide the average Nusselt number changes with the Reynolds number at different heat fluxes. These plates demonstrate that when the Reynolds Number and surface heat flux increase, the average Nusselt number increases.
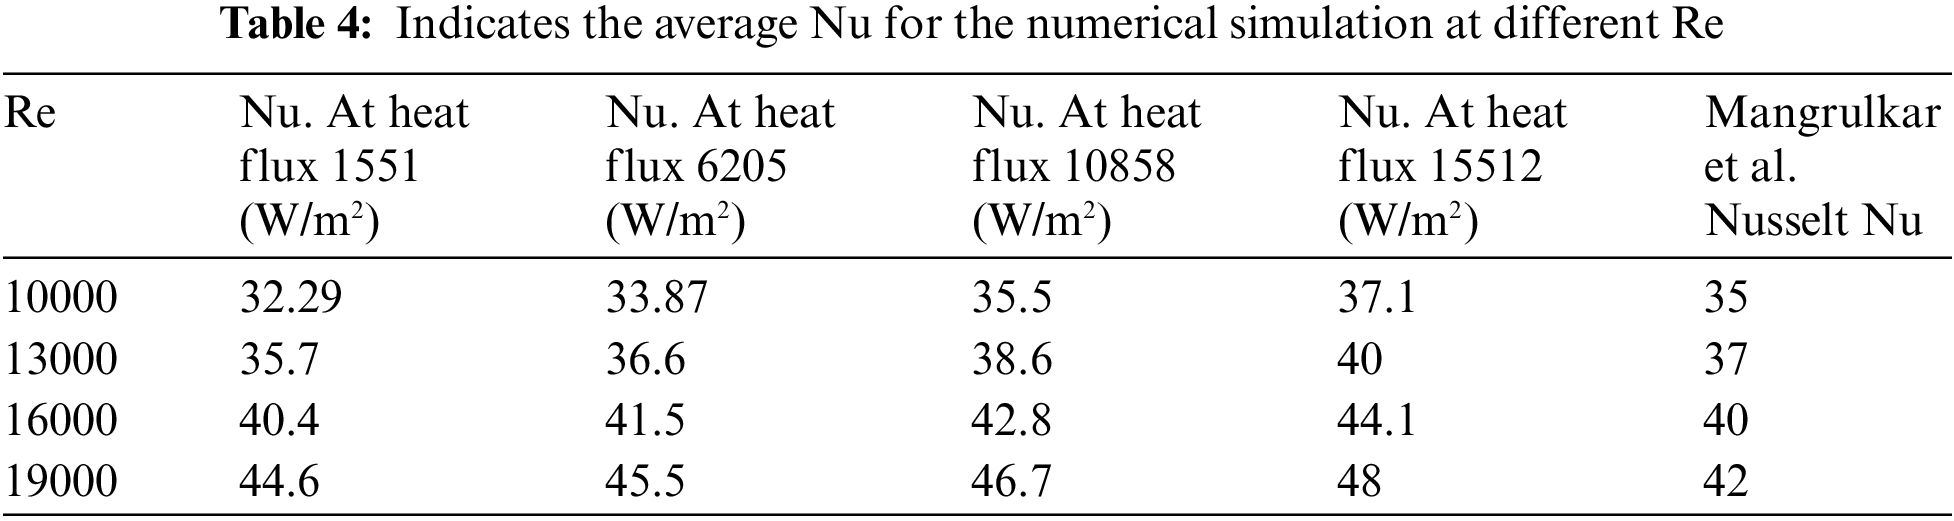
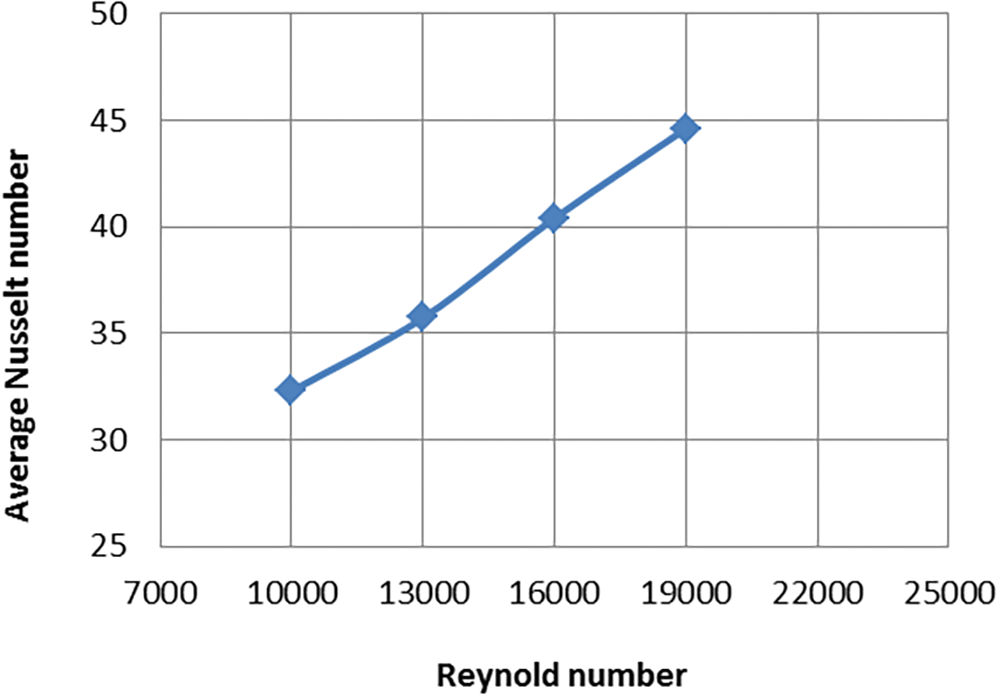
Figure 6: Nusselt number varies with changing Reynolds numbers at longitudinal pitch 25 mm and heat flux 1551 W/m2
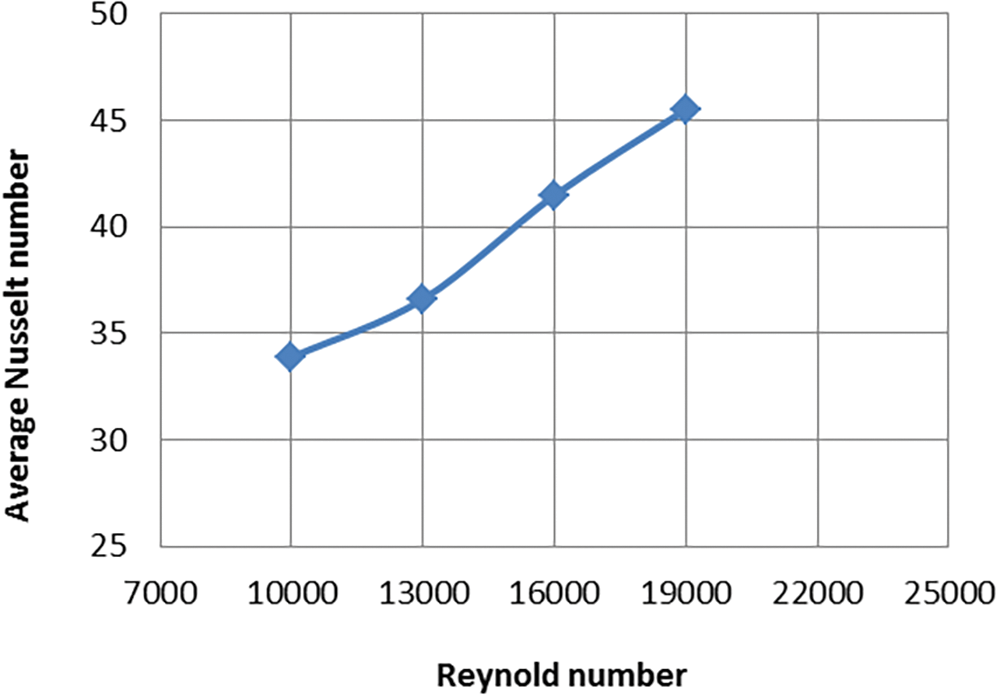
Figure 7: Nusselt number varies with changing Reynolds numbers at longitudinal pitch 25 mm and heat flux 6205 W/m2
Figure 8: Nusselt number varies with changing Reynolds numbers at longitudinal pitch 25 mm and heat flux 10858 W/m2
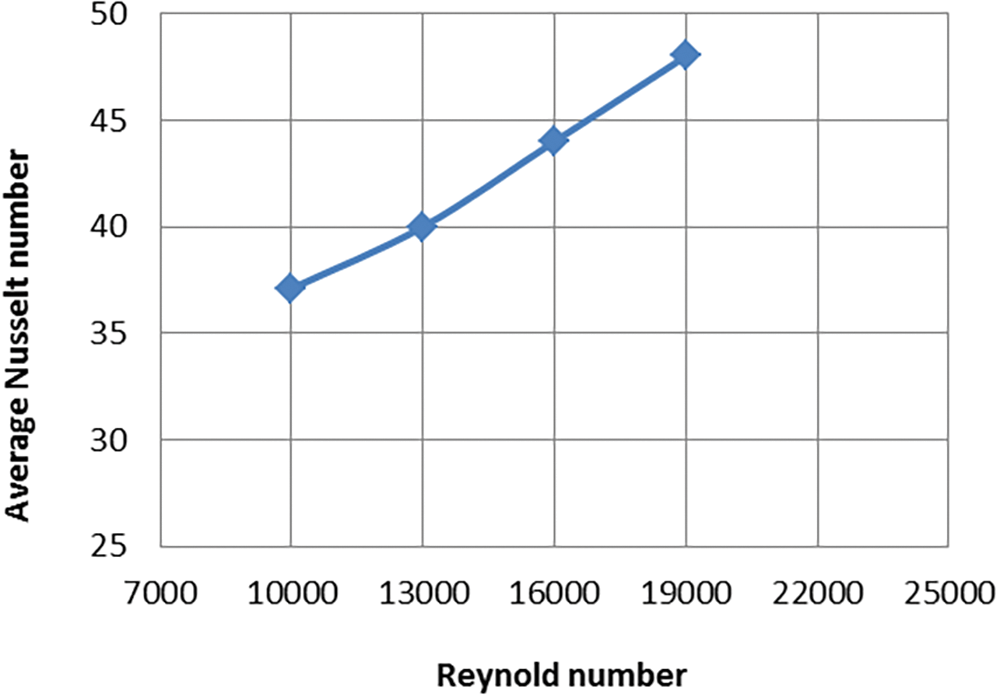
Figure 9: Nusselt number varies with changing Reynolds numbers at longitudinal pitch 25 mm and heat flux 15512 W/m2
Fig. 10 shows the turbulent kinetic energy and flow streamlines for chosen cases with Re = 10,000: (a and b) tube bundle with longitudinal pitch
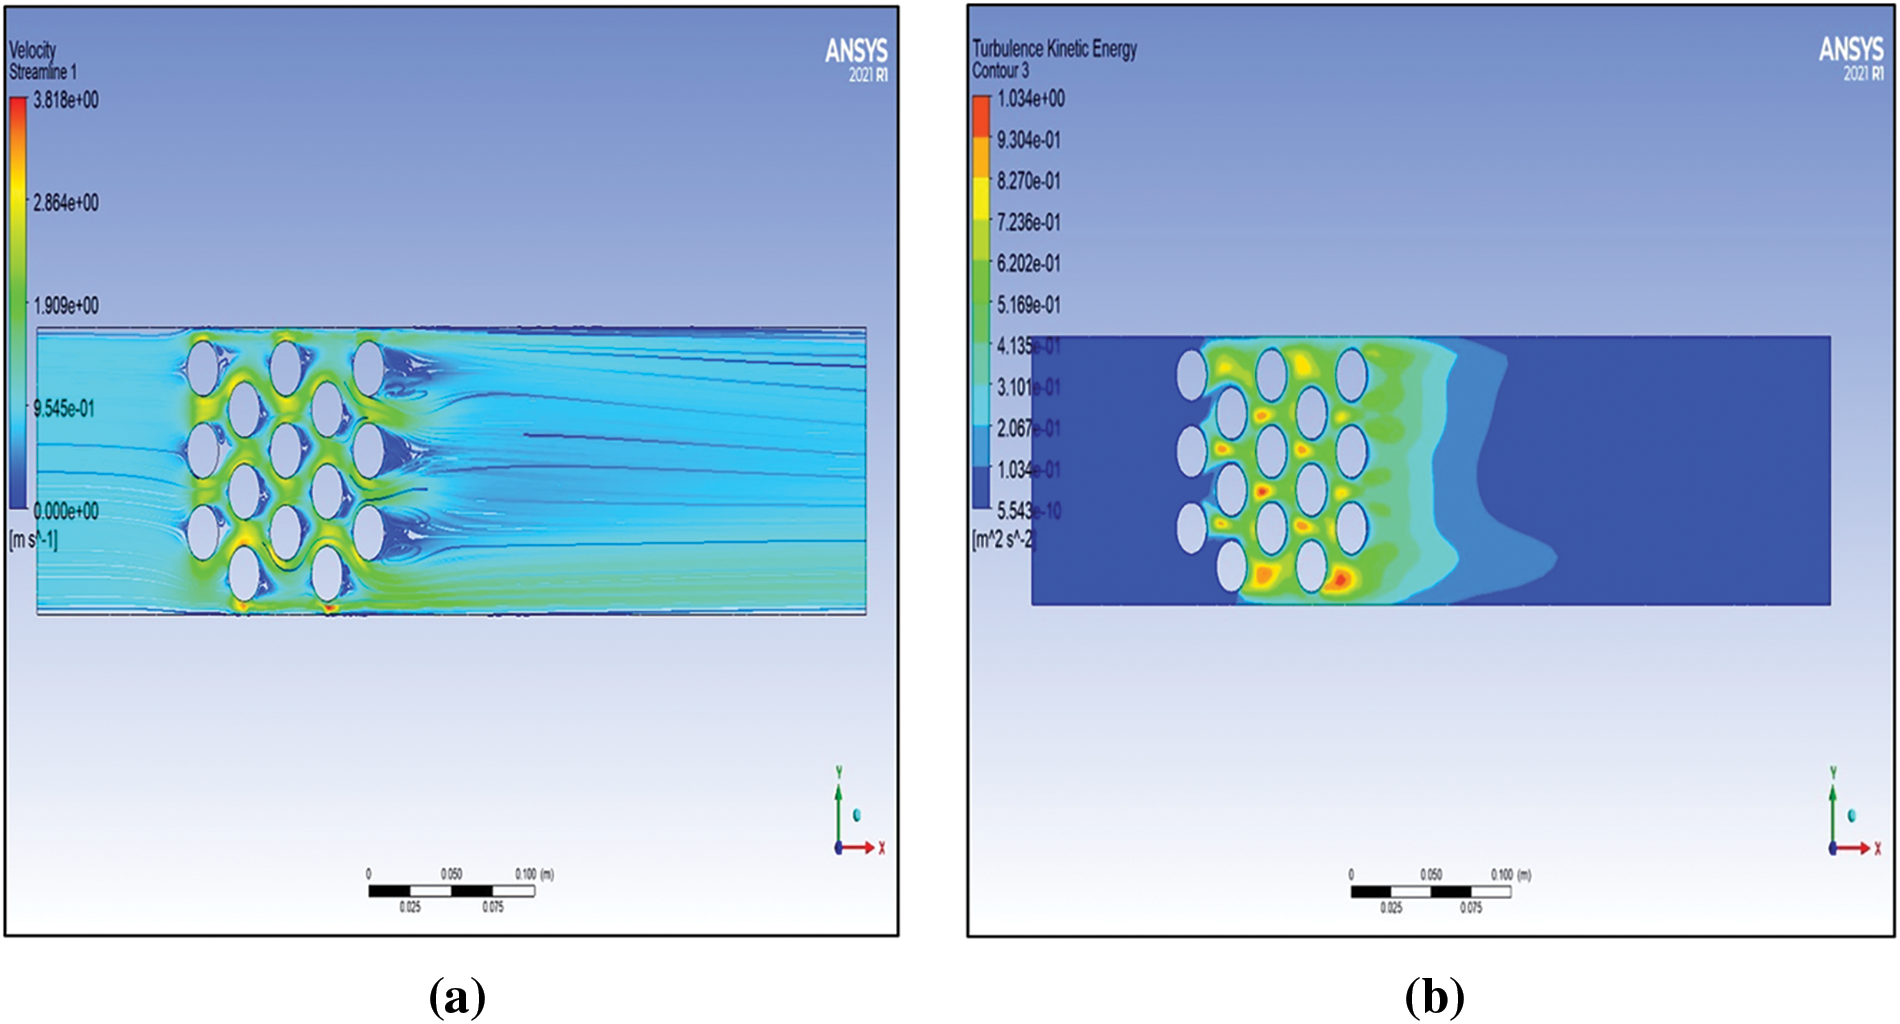
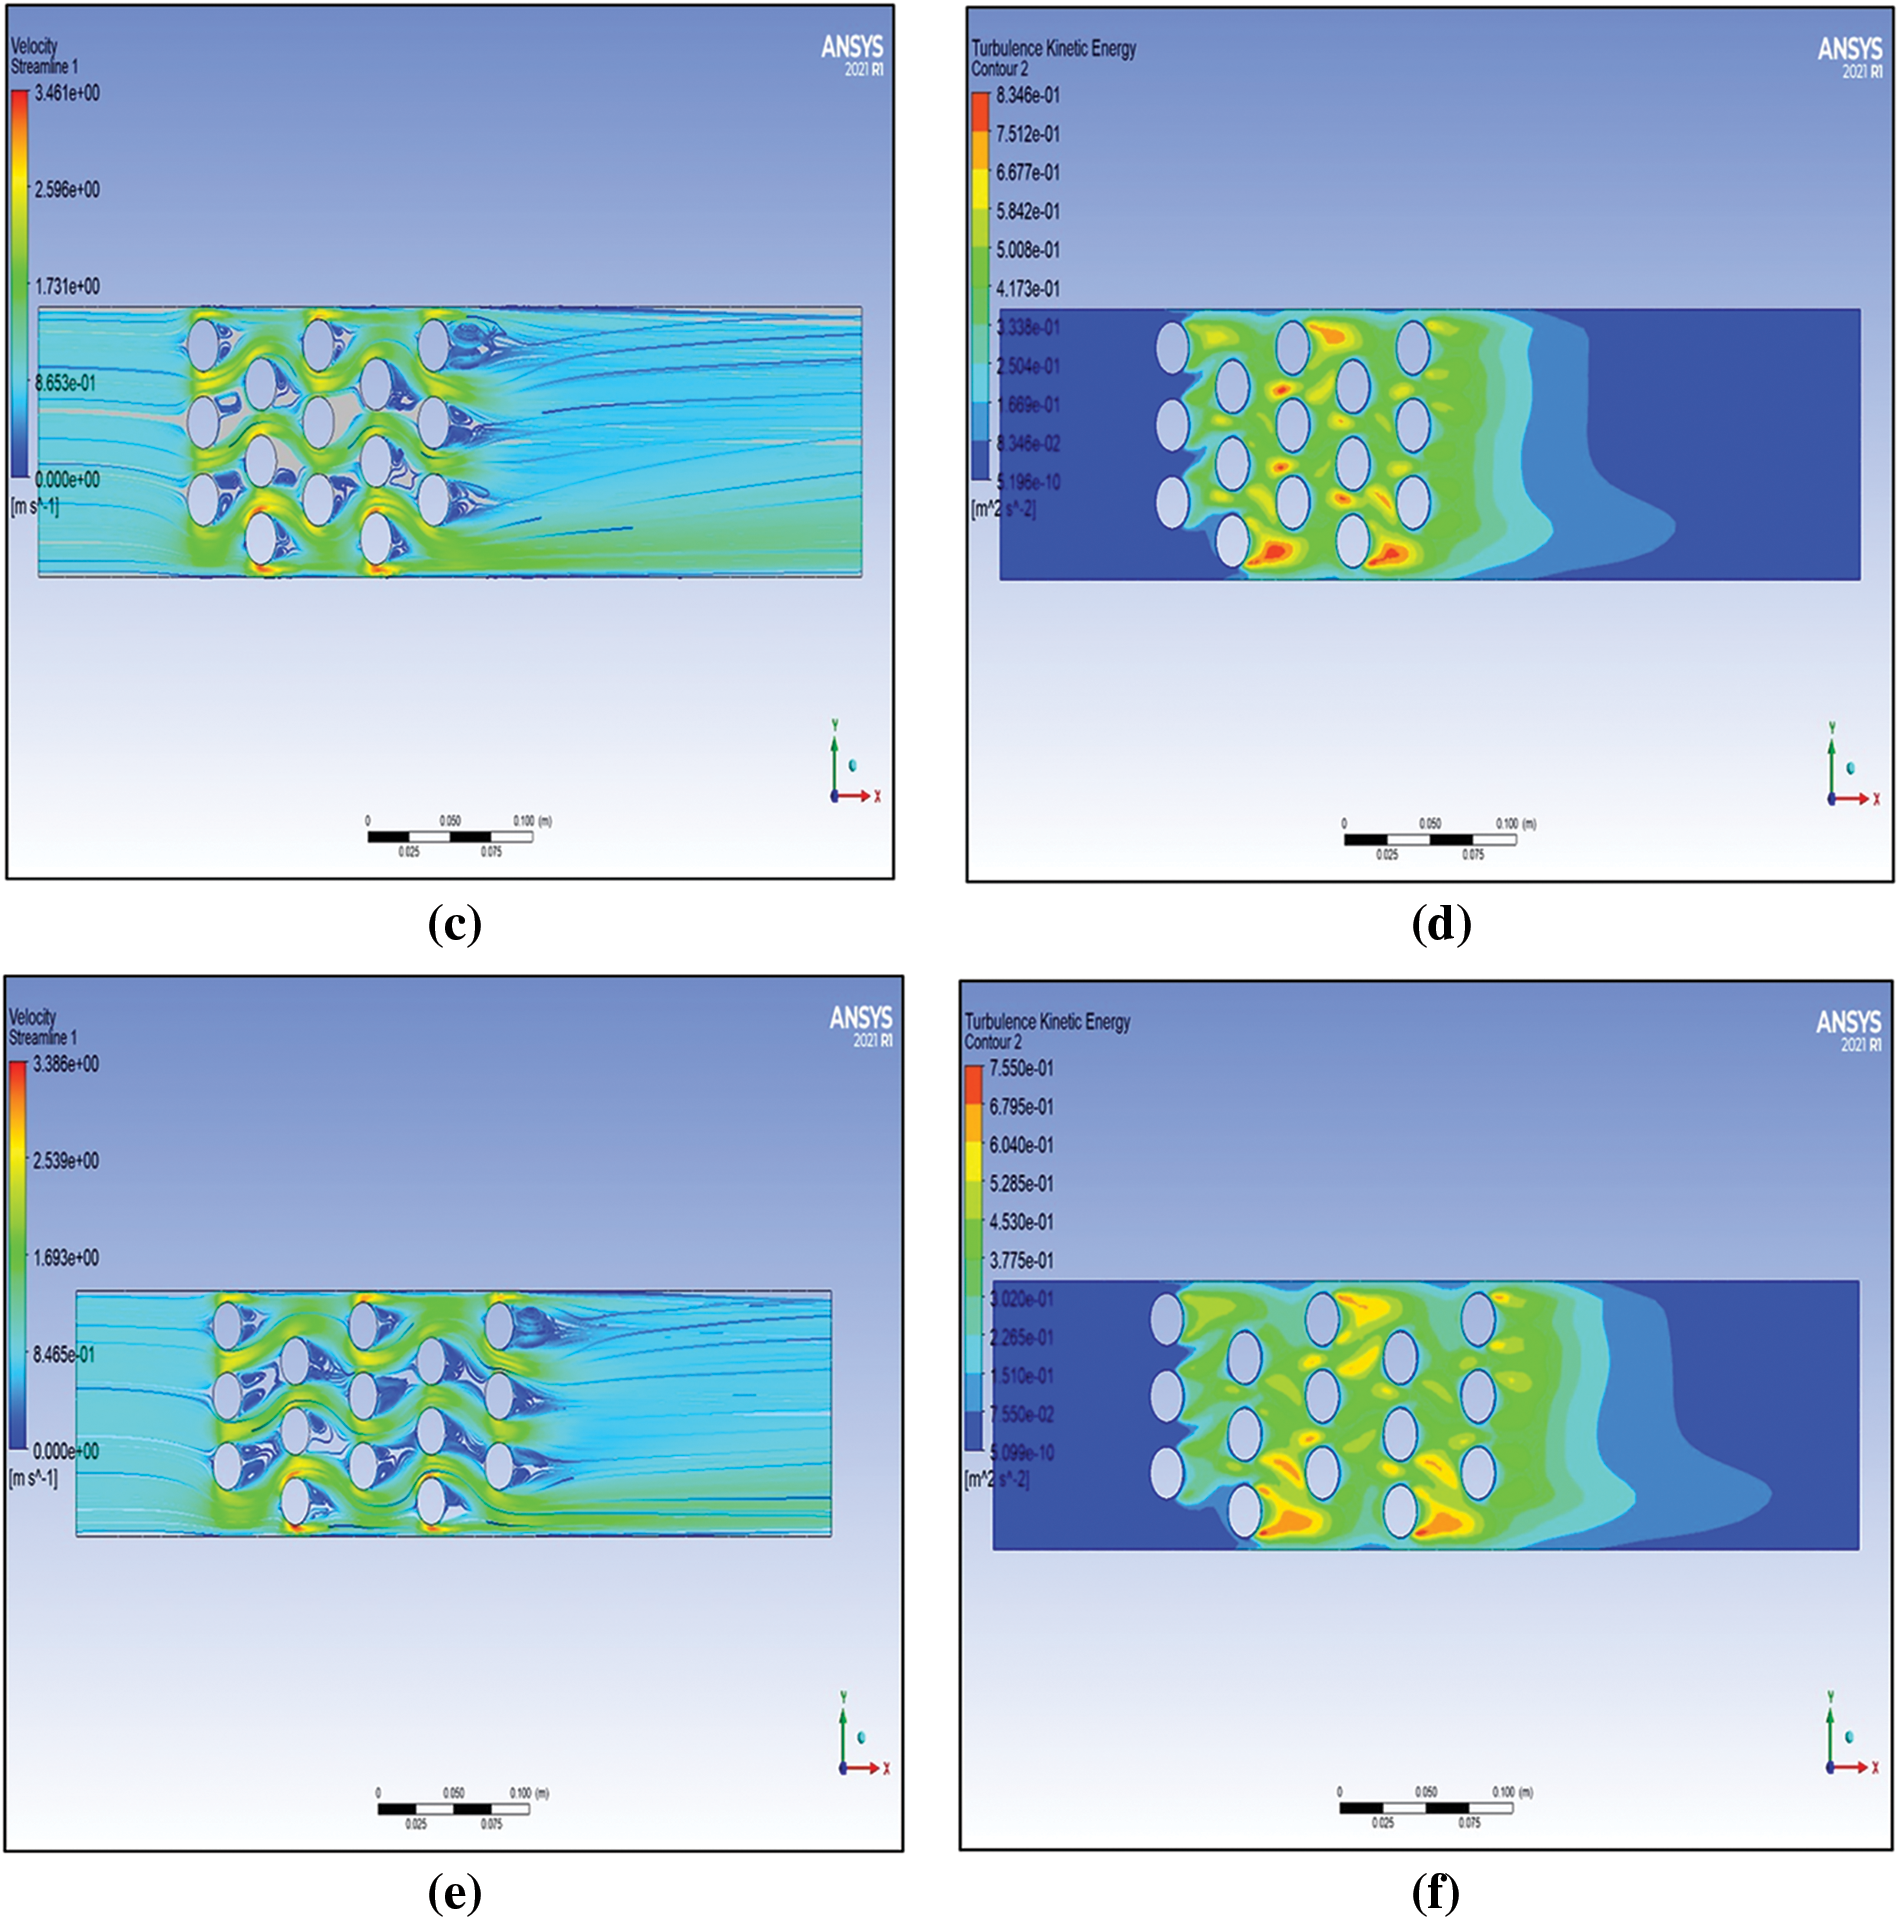
Figure 10: Streamlines and Turbulent Kinetic Energy across the tube banks: (a,b) transverse pitch ST 28 mm, longitudinal pitch
Staggered tube bundles were used in the three-dimensional computational fluid dynamics simulations. The results from the developed model were examined under various operational situations using ANSYS FLUENT. Heat flux and longitudinal pitch effects were investigated. Following are some of the major facets of the current study:
• The tube bundle with a longitudinal pitch of 25 mm provides greater heat transmission characteristics when compared to the tube bundle with a longitudinal pitch of 35 and 45 mm.
• In the tube bundle with a longitudinal pitch of 25 mm, the results indicate that with the heat flux of the tube bundle walls increases by 75% the average Nusselt number increases by 5% when the velocity of air remains constant.
• When heat flux increased by 30% the average Nusselt number increased by 2.7% at constant air velocity
• The average Nusselt number increases by 25% if the Reynolds number is increased from 10,000 to 19,000 when the heat flux is held constant in a tube bundle with a longitudinal pitch of 25 mm.
Acknowledgement: The authors gratefully admit the scientific backing of the Division of Mechanical Engineering at Mustansiriyah University (www.uomustansiriyah.edu.iq), College of Engineering in Iraq.
Funding Statement: The authors received no specific funding for this study.
Author Contributions: The authors confirm contributions to the paper as follows: study conception and design: Husam Rashid Hudear, Saad Najeeb Shehab; data collection: Saad Najeeb Shehab; analysis and interpretation of results: Husam Rashid Hudear, Saad Najeeb Shehab; draft manuscript preparation: Husam Rashid Hudear. Saad Najeeb Shehab. All authors reviewed the results and approved the final version of the manuscript.
Availability of Data and Materials: The data used to support the findings of this study are included within the article.
Conflicts of Interest: The authors declare that they have no conflicts of interest to report regarding the present study.
References
1. Li, X., Wu, X., He, S. (2014). Numerical investigation of the turbulent cross flow and heat transfer in a wall-bounded tube bundle. International Journal of Thermal Sciences, 75(3), 127–139. https://doi.org/10.1016/j.ijthermalsci.2013.08.001 [Google Scholar] [CrossRef]
2. Sahamifar, S., Kowsary, F., Mazlaghani, M. H. (2019). Generalized optimization of cross-flow staggered tube banks using a subscale model. International Communications in Heat and Mass Transfer, 105(5), 46–57. https://doi.org/10.1016/j.icheatmasstransfer.2019.03.004 [Google Scholar] [CrossRef]
3. Ramezanpour, A., Shirvani, H., Rahmani, R., Mirzaee, I. (2005). HT2005-72532. Three-dimensional numerical modeling of the staggered tube bundles turbulent cross FLOW in the duct. Online, Available: http://www.asme.org/about-asme/terms-of-use [Google Scholar]
4. Jang, J. Y., Yang, J. Y. (1998). Experimental and 3-D numerical analysis of the thermal-hydraulic characteristics of elliptic finned-tube heat exchangers. Heat Transfer Engineering, 19(4), 55–67. https://doi.org/10.1080/01457639808939936 [Google Scholar] [CrossRef]
5. Ibrahim, T. A., Gomaa, A. (2009). Thermal performance criteria of the elliptic tube bundle in cross flow. International Journal of Thermal Sciences, 48(11), 2148–2158. https://doi.org/10.1016/j.ijthermalsci.2009.03.011 [Google Scholar] [CrossRef]
6. Tahseen, T. A., Ishak, M., Rahman, M. M. (2011). A numerical study of forced convection heat transfer for staggered tube banks in cross-flow. 1ST International Conference in Mechanical Engineering Research (ICMER), Pahang, Malaysia. [Google Scholar]
7. Mangrulkar, C. K., Dhoble, A. S., Deshmukh, A. R., Mandavgane, S. A. (2017). Numerical investigation of heat transfer and friction factor characteristics from in-line CAM-shaped tube bank in cross flow. Applied Thermal Engineering, 11, 521–538. https://doi.org/10.1016/j.applthermaleng.2016.08.174 [Google Scholar] [CrossRef]
8. Saraireh, M. A., Al-Saraireh, F., Alrwashdeh, S., Saraireh, M. A., Alsaraireh, F. M. et al. (2017). Alrwashdeh, Investigation of heat transfer for staggered and in-line tubes. International Journal of Mechanical Engineering and Technology, 8(11), 476–483. http://www.iaeme.com/IJMET/index.asp476editor [Google Scholar]
9. Refaey, H. A., Sultan, A. M., Moawad, M., Abdelrahman, M. A. (2019). Numerical investigations of the convective heat transfer from turbulent flow over staggered tube bank. Journal of the Institution of Engineers (IndiaSeries C, 100(6), 983–993. https://doi.org/10.1007/s40032-018-0493-z [Google Scholar] [CrossRef]
10. Petinrin, M. O., Towoju, O. A., Ajiboye, S. (2019). Numerical study of the effect of changing tube pitches on heat and flow characteristics from tube bundles in cross flow. Journal of Engineering Sciences, 6(2). https://doi.org/10.21272/jes.2019.6(2) [Google Scholar] [CrossRef]
11. Deeb, R., Sidenkov, D. V. (2021). Numerical analysis of heat transfer and fluid flow around circular and non-circular tubes. Journal of Physics: Conference Series, 2088(1), 012008. https://doi.org/10.1088/1742-6596/2088/1/012008 [Google Scholar] [CrossRef]
12. Tassone, A., Meeusen, J., Serafini, A., Caruso, G. (2021). On the simulation of turbulent heat transfer for low-Pr fluid cross-flow in tube banks. SSRN Electronic Journal, 4(4), 2. https://doi.org/10.2139/ssrn.3969848 [Google Scholar] [CrossRef]
13. Kotšmíd, S., Brodnianská, Z. (2021). Determination of the reference temperature for a convective heat transfer coefficient in a heated tube bank. Applied Sciences, 11(22), 10564. https://doi.org/10.3390/app112210564 [Google Scholar] [CrossRef]
14. Ariansyah, M. N., Diana, L., Satrio, D. (2022). Numerical study the effect of gap ratio on flow characteristics and heat transfer in staggered tube banks. IOP Conference Series: Earth and Environmental Science, 972(1), 012065. https://doi.org/10.1088/1755-1315/972/1/012065 [Google Scholar] [CrossRef]
15. Wang, Y. Q., Jackson, P., Phaneuf, T. J. (2006). Turbulent flow through a staggered tube bank. Journal of Thermophysics and Heat Transfer, 20(4), 738–747. https://doi.org/10.2514/1.18973 [Google Scholar] [CrossRef]
16. Bender, A., Meier, A. M., Vaz, M., Zdanski, P. S. B. (2018). A numerical study of forced convection in a new trapezoidal tube bank arrangement. International Communications in Heat and Mass Transfer, 91, 117–124. https://doi.org/10.1016/j.icheatmasstransfer.2017.12.007 [Google Scholar] [CrossRef]
17. Mu, L., Wang, S., Zhai, Z., Shang, Y., Zhao, C. et al. (2020). Unsteady CFD simulation on ash particle deposition and removal characteristics in tube banks: Focusing on particle diameter, flow velocity, and temperature. Journal of the Energy Institute, 93(4), 1481–1494. https://doi.org/10.1016/j.joei.2020.01.010 [Google Scholar] [CrossRef]
18. Zhang, L. Z., Ouyang, Y. W., Zhang, Z. G., Wang, S. F. (2015). Oblique fluid flow and convective heat transfer across a tube bank under uniform wall heat flux boundary conditions. International Journal of Heat and Mass Transfer, 91, 1259–1272. https://doi.org/10.1016/j.ijheatmasstransfer.2015.08.062 [Google Scholar] [CrossRef]
19. Wang, Y. Q., Jackson, P. L. (2010). Turbulence modeling was applied to flow through a staggered tube bundle. Journal of Thermo Physics and Heat Transfer, 24(3), 534–543. https://doi.org/10.2514/1.44356 [Google Scholar] [CrossRef]
20. Zheng, Z., Yang, W., Cai, Y., Wang, Q., Zeng, G. (2020). Dynamic simulation on ash deposition and heat transfer behavior on a staggered tube bundle under high-temperature conditions. Energy, 190(5), 116390. https://doi.org/10.1016/j.energy.2019.116390 [Google Scholar] [CrossRef]
21. Khan, M. S., Zou, R., Yu, A. (2021). Computational simulation of air-side heat transfer and pressure drop performance in staggered mannered twisted oval tube bundle operating in cross flow. International Journal of Thermal Sciences, 161, 106748. https://doi.org/10.1016/j.ijthermalsci.2020.106748 [Google Scholar] [CrossRef]
22. Jodaei, A., Zamzamian, K. (2017). A Study about performance evaluation criteria of tube banks with various shapes and arrangements using numerical simulation. Journal of Pressure Vessel Technology, Transactions of the ASME, 139(5), 1–9. https://doi.org/10.1115/1.4037637 [Google Scholar] [CrossRef]
23. Omar, H., Alfarawi, S., El-sawi, A., Zeo, M. (2021). Numerical simulation of cross flow in in-line square tube array to estimate the convective heat transfer coefficient. American Journal of Energy Research, 9(2), 84–91. https://doi.org/10.12691/ajer-9-2-2 [Google Scholar] [CrossRef]
24. Shameran, J. S. (2019). Numerical study of the effect of changing tube pitches on heat and flow characteristics from tube bundles in cross flow. Journal of Engineering Sciences, 2, e1–e10. https://doi.org/10.21272/jes.2019.6(2).e1 [Google Scholar] [CrossRef]
25. Deeb, R., Sidenkov, D. V. (2020). Investigation of flow characteristics for drop-shaped tubes bundle using ansys package. 2020 5th International Conference on Information Technologies in Engineering Education (Inforino), Moscow, Russia. https://doi.org/10.1109/Inforino48376.2020.9111775 [Google Scholar] [CrossRef]
26. Zdravistch, F., Fletcher, C. A., Behnia, M. (1995). Numerical laminar and turbulent fluid flow and heat transfer predictions in tube banks. International Journal of Numerical Methods for Heat & Fluid Flow, 5(8), 717–733. https://doi.org/10.1108/EUM0000000004086 [Google Scholar] [CrossRef]
27. Moosavi, A., Ljung, A., Lundström, T. S. (2023). A comparative study on thermo-fluid characteristics of free and wall-bounded cross-flow heat exchangers. Thermal Science and Engineering Progress, 40, 101746. https://doi.org/10.1016/j.tsep.2023.101746 [Google Scholar] [CrossRef]
28. Karali, M. A., Awadh, B., Bin, A. S., Abdelmohimen, M. A. H., Attia, E. et al. (2023). Case studies in thermal engineering effect of surfaces roughness of a staggered tube bank in cross flow with air on heat transfer and pressure drop. Case Studies in Thermal Engineering, 102779. https://doi.org/10.1016/j.csite.2023.102779 [Google Scholar] [CrossRef]
29. Nemati, H., Samivand, S. (2016). Numerical study of flow over annular elliptical finned tube heat exchangers. Arabian Journal for Science and Engineering, 41(11), 4625–4634. https://doi.org/10.1007/s13369-016-2226-z [Google Scholar] [CrossRef]
30. Utomo, B., Widodo, K., Hanifah, S. D. (2017). Numerical analysis on the effect of longitudinal and transversal pitch ratio to the flow and heat transfer characteristic of staggered elliptical tubes-bank. AIP Conference Proceedings, 1778, 030020. https://doi.org/10.1063/1.4965754 [Google Scholar] [CrossRef]
31. Khan, W. A., Culham, J. R., Yovanovich, M. M. (2006). Analytical model for convection heat transfer from tube banks. Journal of Thermophysics and Heat Transfer, 20(4). https://doi.org/10.2514/1.15453 [Google Scholar] [CrossRef]
Cite This Article
 Copyright © 2023 The Author(s). Published by Tech Science Press.
This work is licensed under a Creative Commons Attribution 4.0 International License , which permits unrestricted use, distribution, and reproduction in any medium, provided the original work is properly cited.
 Downloads
 Citation Tools