
 Submit a Paper
 Propose a Special lssue
 Open Access
ARTICLE

Numerical Investigation on Thermal Performance of Two-Phase Immersion Cooling Method for High-Power Electronics
1 College of Petrochemical Engineering, Lanzhou University of Technology, Lanzhou, 730050, China
2 College of Environment and Safety Engineering, Qingdao University of Science and Technology, Qingdao, 266042, China
3 College of Artificial Intelligence, Yango University, Fuzhou, 350015, China
* Corresponding Author: Liqun Zhou. Email:
Frontiers in Heat and Mass Transfer 2024, 22(1), 157-173. https://doi.org/10.32604/fhmt.2023.045135
Received 18 August 2023; Accepted 26 October 2023; Issue published 21 March 2024
 View Full Text
 Download PDF
Abstract
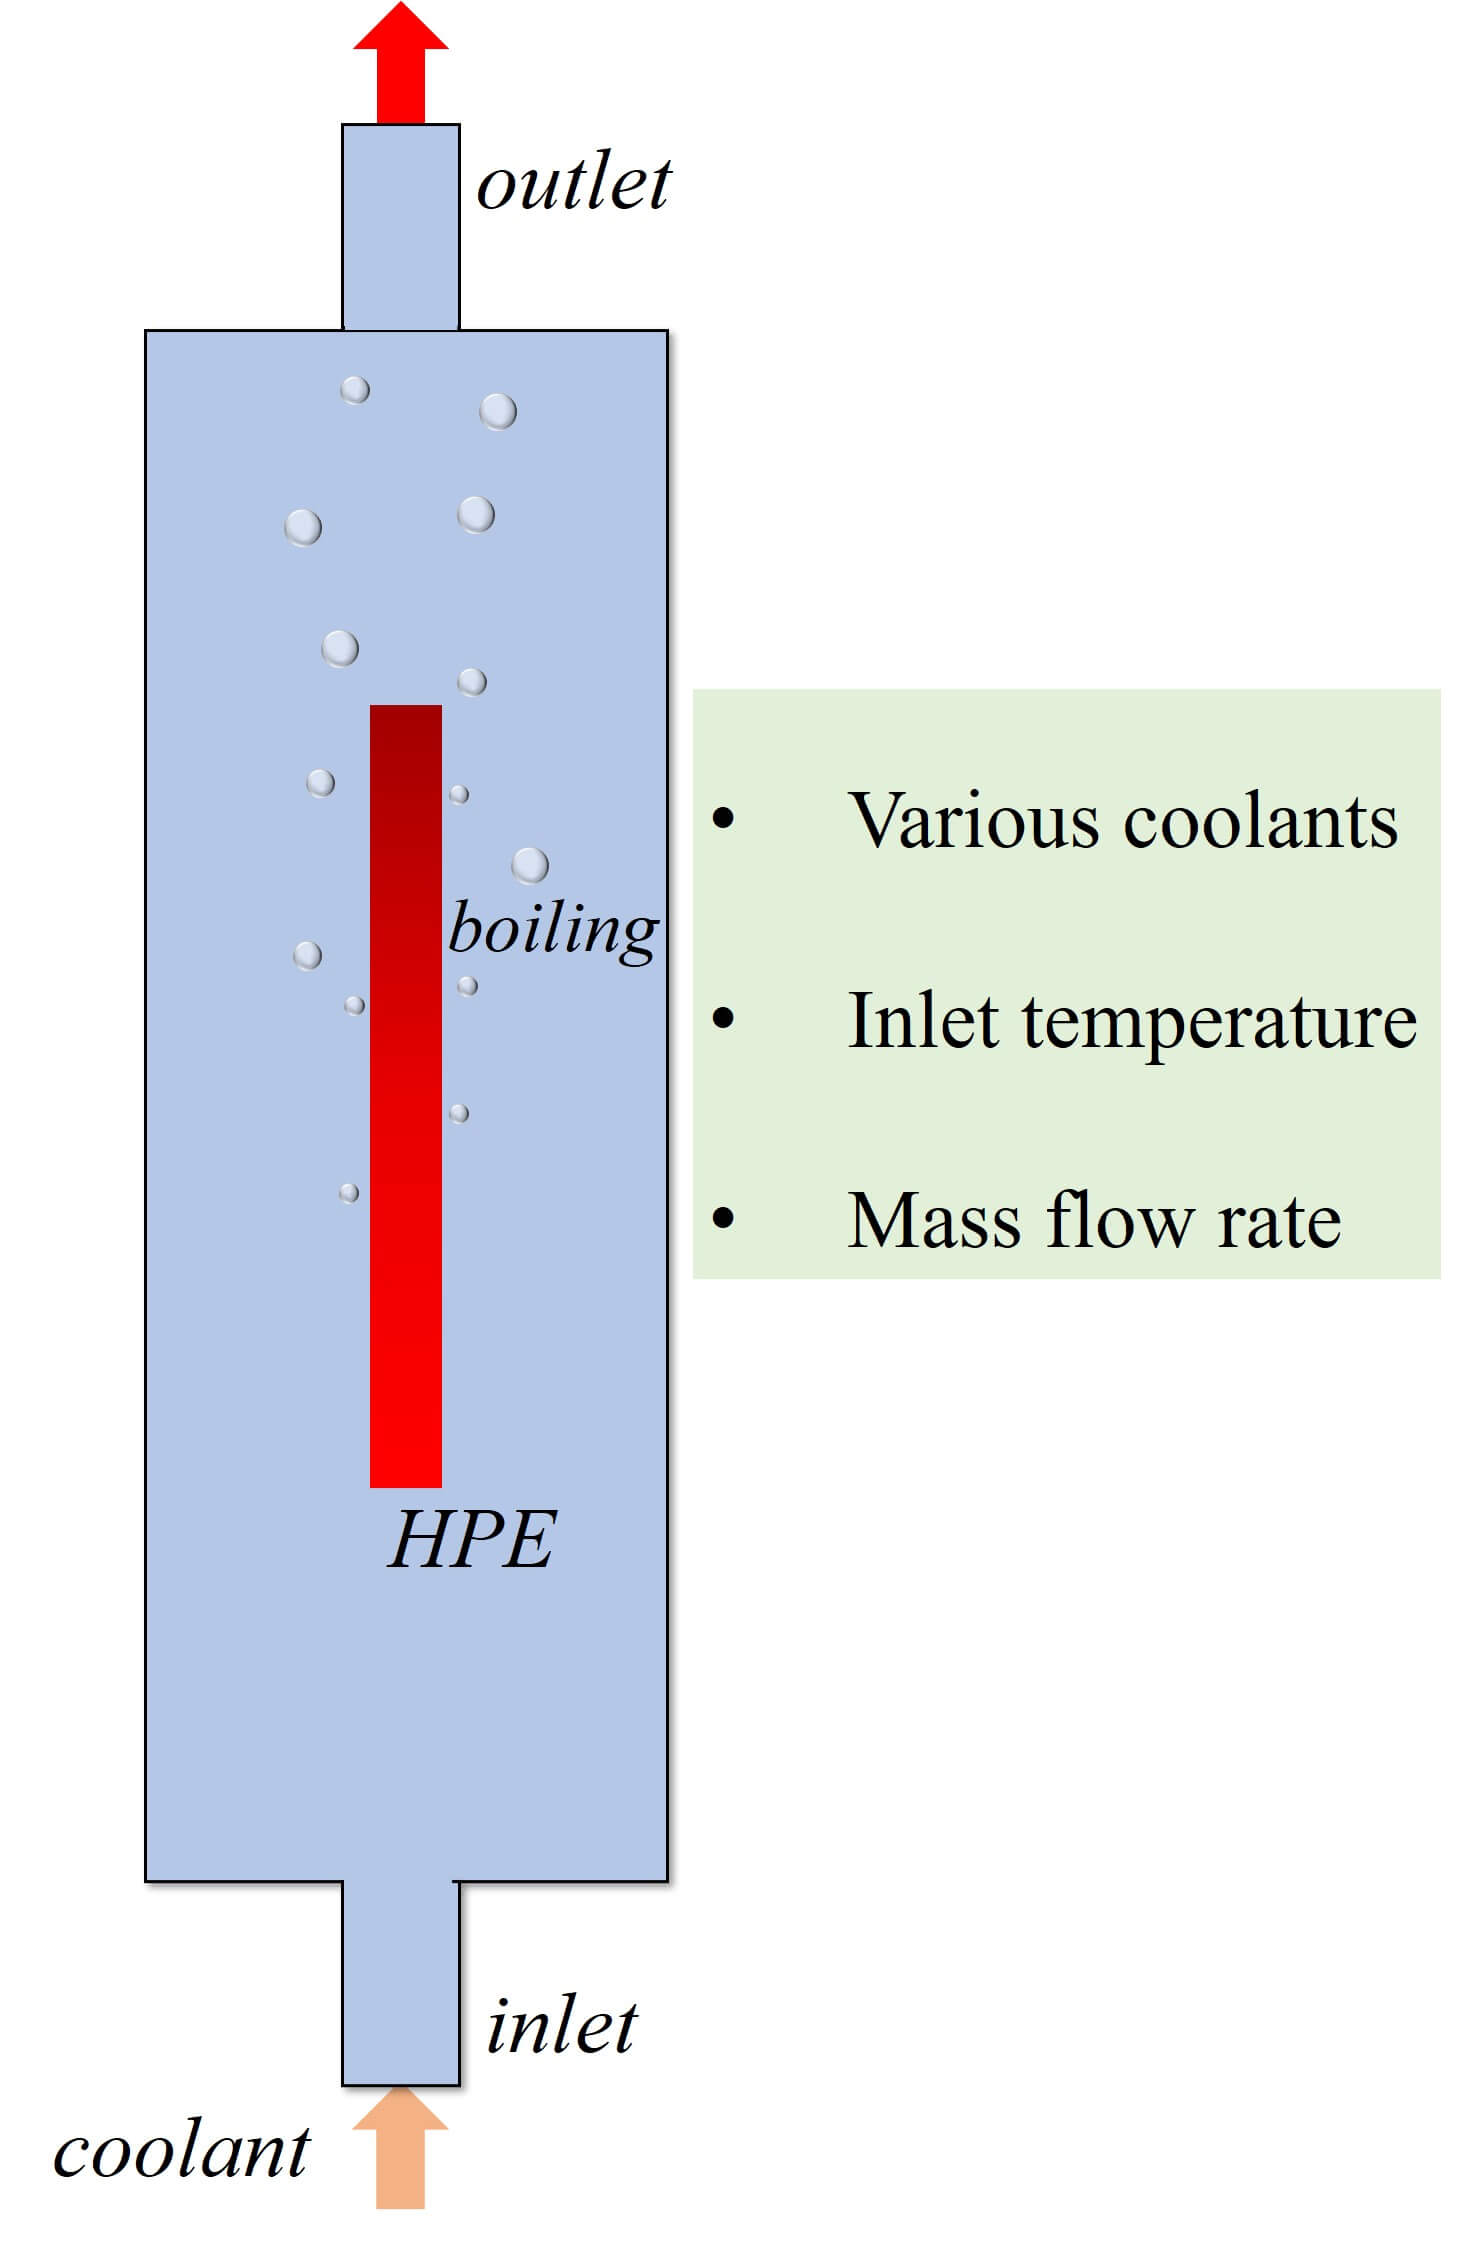
The power density of electronic components grows continuously, and the subsequent heat accumulation and temperature increase inevitably affect electronic equipment’s stability, reliability and service life. Therefore, achieving efficient cooling in limited space has become a key problem in updating electronic devices with high performance and high integration. Two-phase immersion is a novel cooling method. The computational fluid dynamics (CFD) method is used to investigate the cooling performance of two-phase immersion cooling on high-power electronics. The two-dimensional CFD model is utilized by the volume of fluid (VOF) method and Reynolds Stress Model. Lee’s model was employed to calculate the phase change rate. The heat transfer coefficient along the heated walls and the shear-lift force on bubbles are calculated. The simulation data are verified with the literature results. The cooling performance of different coolants has been studied. The results indicate that the boiling heat transfer coefficient can be enhanced by using a low boiling point coolant. The methanol is used as the cooling medium for further research. In addition, the mass flow rate and inlet temperature are investigated to assess the thermal performance of two-phase immersion cooling. The average temperature of the high-power electronics is 80°C, and the temperature difference can be constrained to 8°C. Meanwhile, the convective heat transfer coefficient reaches 2740 W/(m2·°C) when the inlet temperature is 50°C, and the mass flow rate is 0.3 kg/s. In conclusion, the results demonstrated that two-phase immersion cooling has provided an effective method for the thermal management of high-power electronics.Graphic Abstract
Keywords
Nomenclature
| t | Time, s |
| Heat transfer flux, W/m2 | |
| h | Local heat transfer coefficient, W/(m2·°C) |
| Average heat transfer coefficient, W/(m2·°C) | |
| T | Temperature, °C |
| ΔT | Temperature difference, °C |
| cp | Specific heat capacity, J/(kg·°C) |
| λ | Thermal conductivity, W/(m·°C) |
| ρ | Density, kg/m3 |
| Mass flow rate, kg/s | |
| Phase fraction | |
| Viscosity, Pa·s | |
| σ | Surface tension, N·m |
| Subscripts | |
| l | Liquid |
| v | Vapor |
| f | Bulk fluid |
| L | Length of the HPE |
| w | Wall |
| in | Inlet |
| out | Outlet |
| Abbreviations | |
| CFD | Computational fluid dynamics |
| HPE | High-power electronics |
| VOF | Volume of fluid |
| RSM | Reynolds stress model |
At present, power electronics play an irreplaceable role in a vast array of applications-from computers to data centers, battery chargers to new energy vehicles, and even aerospace industries. However, with the development of electronic equipment in the direction of integration, miniaturization and modularization, the problem of heat dissipation has more and more influence on its performance, reliability and working life. If heat dissipation is not good, high temperature will be generated in electronic devices, affecting the performance and even leading to device failure. For every 2°C increase above the maximum operating temperature of an electronic component, the failure frequency increases by 10% [1]. Reliable thermal management is one of the keys to the safe operation of high-power electronics (HPE). However, the energy consumption is tremendous for cooling HPEs. For example, in 2021, the total energy consumption of data centers reached 216.6 billion kWh in China, accounting for about 2.6% of the electricity consumption of the whole society. The average power usage effectiveness (PUE) of data centers in China is 1.49, which means that nearly 33% of electricity is used for cooling. The development of efficient cooling techniques is needed to reduce the expenses for construction and operation.
Various cooling methods, such as jet-impingement [2,3], mini/microchannel [4], phase change materials [5] and spray cooling [6,7], have been developed to enhance heat transfer efficiency for the thermal management of HPEs. Among the many cooling methods, immersion cooling becomes a potential and competitive candidate that directly immerses the high-power electronics in a nonconductive liquid, such as deionized water or fluorinated liquid. Unlike traditional cooling methods, this method does not require fans, sheet metal, interface materials, heat sinks, adhesive or other parts. Immersion cooling could be utilized in the thermal management for battery energy storage systems [8–10], data center cooling systems [11–13], concentrating photovoltaics [14,15] and high power density electronic [16,17]. However, immersion cooling is still in the early stage and has yet to be widely implemented industrially at scale due to challenges around the cost of the fluids, uncertainty in system lifetime benefits and perceived weight penalties of integration [8].
The immersion cooling techniques include two kinds: single-phase cooling and two-phase cooling. Implementing two-phase immersion cooling systems enables greater heat transfer efficiency through the boiling process compared to single-phase immersion cooling, allowing for greater power densities with two-phase immersion cooling. Furthermore, the cooling infrastructure required to support two-phase immersion cooling is typically less complex, as additional adiabatic cooling beyond a dry cooler is not necessary. During the two-phase cooling process, the coolant boils and thus exists in both a liquid and gas phase. Wang et al. [18] evaluated the cooling performance of different methods, such as forced air cooling, single-phase and two-phase immersion cooling, on a 60-stage sub-nanosecond pulse generator. As a result, the rising temperature of the avalanche transistor can be effectively limited by two-phase immersion cooling. Ramakrishnan et al. [19] studied the thermal performance of three techniques, such as air cooling, cold plates, and two-phase immersion cooling. Compared to air cooling, the results show that cold plates and two-phase immersion cooling can achieve better performance that yields the maximum CPU performance. Birbarah et al. [16] experimentally analyzed the impact of water-based immersion cooling on high-power electronics. With immersion cooling, an efficiency of 97.2% was achieved on a 2 kW power converter. An analysis of the thermal and stress performances of enhanced copper spreaders of high-power chips was conducted through nucleate boiling immersion cooling by Ali [20]. It can be concluded that the spreader cooling performance was greatly affected by the thickness of the spreader and the area of the chip. Ghaffari et al. [21] investigated the thermal performance of two-phase immersion on HPE, and the Novec 649TM was adopted as a coolant. The influence of heat spreading on the boiling state was also studied. The result indicated that lateral heat spreading combined with microporous coating is a key factor for the application of immersion cooling. A two-phase immersion cooling approach using vapor chamber heat spreaders was proposed by Zhou et al. [22]. According to the results, the vapor chamber was effective in transporting 500 W of heat load and effectively controlled the temperature of the heat source below 85°C. From two perspectives of temperature uniformity and thermal safety, Sun et al. [23] assessed the impact of coolant type, inlet velocity and cabinet internal structure on the immersion cooling of the chip. In conclusion, compared to single-phase immersion cooling, the application of the two-phase immersion cooling method provides higher heat transfer efficiency on account of the boiling process and allows for greater power densities.
Heat transfer enhancement of two-phase liquid immersion cooling through surface treatment has been studied. El-Genk et al. [24,25] studied the effect of inclination angle and surface average roughness on the boiling of dielectric liquid. A nucleate boiling heat transfer correlation was developed, which included critical heat flux, the corresponding wall superheats, surface temperature and average roughness. Hsu et al. [26] researched the effect of the two-tier micro-structures and nano-structures on immersion cooling. The result suggests that immersion cooling can be improved by using Si nanowires on a two-tiered Si micropillar structure. Chen et al. [27] studied the heat transfer efficiency of the smooth and porous surface for immersion cooling. It can be concluded that a porous structure improves heat transfer efficiency when liquid is in an unboiled state. However, recent research does not take into account the operating conditions and bubble behaviors for two-phase immersion cooling.
From the above analysis, immersion cooling, especially with phase change, represents a paradigm shift in high-power electronics cooling. The main object of this paper is to study the cooling effect of two-phase immersion on high-power electronics. On the basis of CFD method, the heat and mass transfer process is simulated. Lee model is selected as mass transfer mechanism. To ensure the safety operation of electronic devices, the coolant should be dielectric firstly. Considered the conditions for working fluid, three different liquids (deionized water, ethanol and methanol) were chosen as the coolant. The flow boiling behavior and heat transfer efficiency is evaluated for different coolants. The effects of different operating conditions on the heat transfer coefficient are carried out.
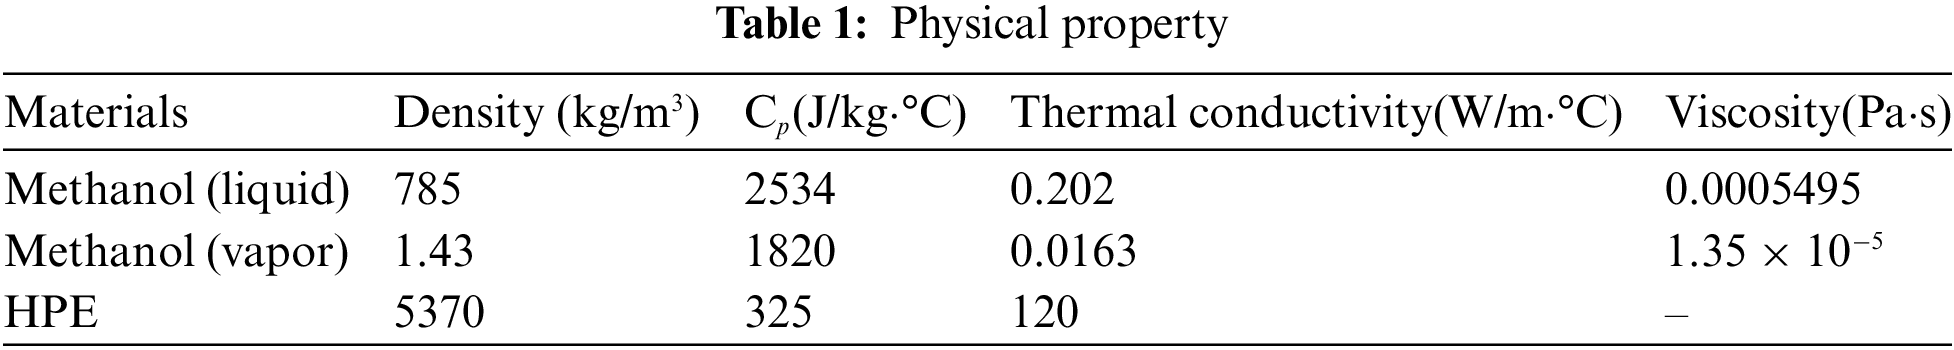
In order to study the thermal performance of two-phase immersion cooling on high-power electronics, a simplified two-dimensional model is developed, as shown in Fig. 1a. There are two separate zones in the computational domain, named the HPE and cooling container. The HPE is assumed as a uniform volume heat source, and the size is 4 mm × 40 mm. The container size is 20 mm × 60 mm. The inlet and outlet width are both 6 mm. The physical properties used in the simulation are listed in Table 1.
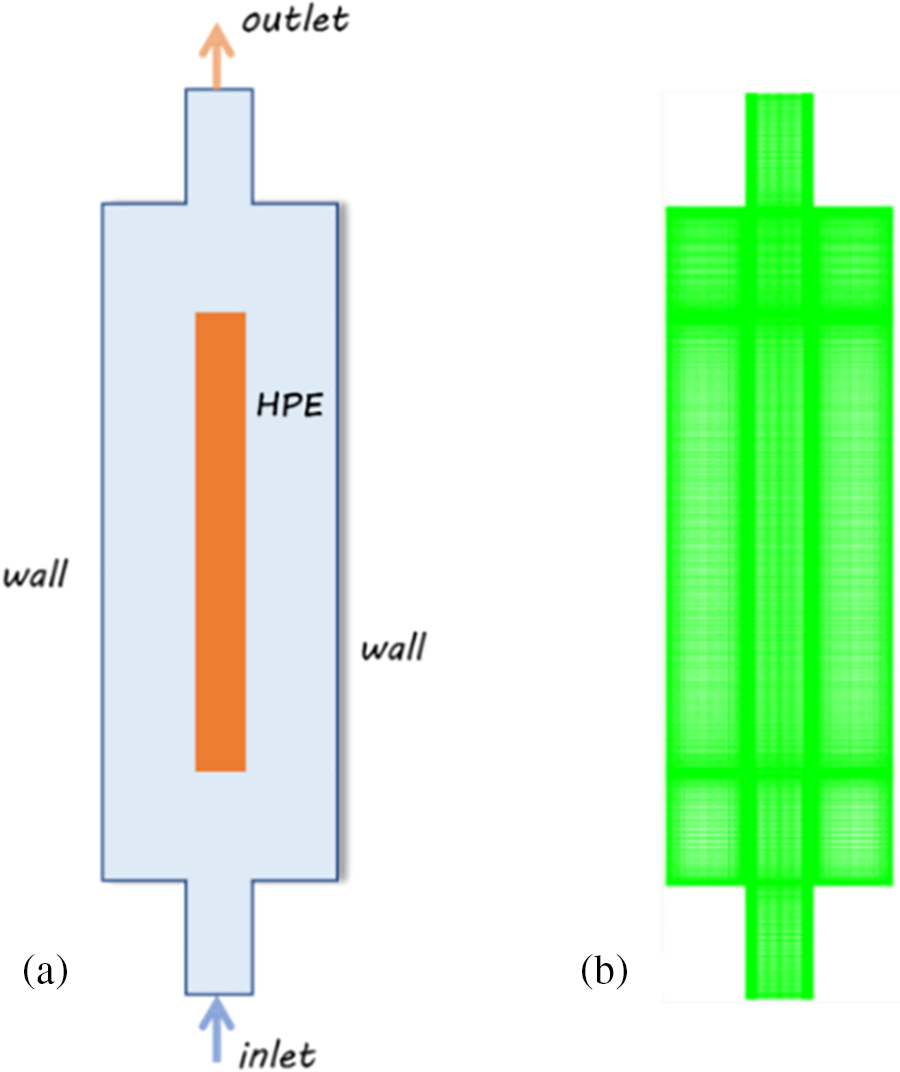
Figure 1: The 2D model. (a) Physical model, (b) grid
The grid is generated by ICEM CFD, and quadrilateral mesh is used, as shown in Fig. 1b. Near the solid walls of HPE, twelve layers of cells are used in order to capture interfacial behavior. The first layer thickness is 0.05 mm, and the grid growth factor is 1.1. The grid size has a significant impact on computation accuracy and time cost, so the test of grid independence has been performed. Four mesh amounts of 15571, 23465, 32951 and 47928 were selected for comparison. According to the simulation results, the average wall temperatures of HPE were 81.63°C, 80.17°C, 79.31°C and 79.74°C, respectively. As can be seen, the wall temperature almost leveled off after the grid number of 32951. Consequently, the grid number of 32951 Quad cells is selected for the CFD simulation.
2.2.1 Volume of Fluid (VOF) Method
For reasonable simplification of the numerical calculation, several assumptions used in this study are as follows [28,29]:
(1) The liquid and vapor phases are immiscible.
(2) The radiation heat transfer process is not considered.
(3) The high-power electronics are assumed to be a homogeneous and continuous medium.
(4) Physical properties of coolant variations with temperature and pressure are not considered because these have little change over the operating conditions.
(5) It is assumed that the heated surface is smooth, and cavity effects are neglected for nucleation.
In multiphase flows, finite volume numerical solutions are more challenging than for single-phase flows. In order to determine appropriate numerical methods, interface tracking, associated with mass transfer rate and surface tension at the interface by curvature and surface area, is the critical point and needs much attention [30]. The VOF method can be applied to model two-phase with a clearly defined interface between the gas and liquid and is used for surface-tracking applied to a fixed mesh. With the purpose of achieving the vapor–liquid flow pattern, the VOF model is adopted to describe the motions and track the vapor–liquid interface [31]. The relationship of vapor and liquid fraction is given by,
The average properties of two-phase flow at liquid and vapor interface are expressed as follows:
where α, ρ, cp and λ are volume fraction, density, specific heat capacity and thermal conductivity, respectively.
The Navier-Stokes equations for flow with phase change can be written as,
Continuity equation,
Momentum equation,
Continuum Surface Force (CSF) is used to model surface tension forces with wall adhesion. is calculated as follows [32]:
where σ is surface tension coefficient, as a function of temperature through a polynomial. C is surface curvature.
Energy equation,
In the energy equation, a source term Sh accounts for the extra heat transfer involved in boiling and condensation by multiplying the rate of mass transfer and latent heat, which is given by,
Mass transfer across liquid-vapor interfaces must be accurately modeled in phase change simulations. The phase change and mass transfer equation proposed by Lee is derived from the Hertz-Knudsen equation. It has the advantages of a simple format, easy calculation and high reliability, which has been widely used. The mass transfer rates per unit volume in Lee model are calculated as,
For evaporation,
For condensation,
However, the evaporation and condensation coefficient are difficult to determine in Lee model, which is generally grounded on the researcher’s experience or experimental data and lacks theoretical foundations. In this study, the values are referenced in the previous flow boiling studies [33,34], which are taken as 0.1.
The Reynolds stress model (RSM) retains the Reynolds stress equation, which is able to better reflect the characteristics of turbulent flow. The transport equations are shown below:
Moreover, the RSM has a clear advantage that automatically considers the buoyancy effect and near-wall effect. Mimouni et al. [35] came up with an improved model for predicting critical heat flux. The standard k-ε and RSM models have been compared, and the result shows that the RSM has a better forecast precision.
2.3 Initial and Boundary Conditions
At the initial stage, the overall temperature is set as inlet temperature. The liquid fills the entire fluid domain at the beginning. The overall temperature at the beginning is equal to the inlet temperature. Non-slip boundary condition is applied at solid walls. The influence of wall adhesion was considered by specifying the three-phase contact angle. Rather than imposing the boundary condition at the wall itself, the contact angle at which the fluid is in contact with the wall is used to adjust the surface normal in cells near the wall. The main boundary conditions are listed in Table 2. The outlet is specified as a pressure outlet with fixed atmospheric pressure, and the inlet section is treated as a mass flow inlet condition. Four different


Four mesh amounts of 15571, 23465, 32951 and 47928 were selected for comparison. According to the simulation results, the average wall temperatures of HPE were 81.63°C, 80.17°C, 79.31°C and 79.74°C, respectively. As can be seen, the wall temperature almost leveled off after the grid number of 32951. Consequently, the grid number of 32951 Quad cells is selected for the CFD simulation.
The local heat transfer coefficient on the surface of HPE is achieved from the following expression,
where Tw,iy is the surface temperature of HPE (i = 1 for left and i = 2 for right) at a different location, Tf,y is the bulk fluid temperature, which is defined as the sectional mean temperature at a different location, hi,y is the local convection coefficient, and q″ is the heat flux. It is worth noting that q″, Tw,iy and Tf,y are obtained from simulation results. Further, the average heat transfer coefficient
By consulting a great deal of literature, there is a lack of experimental research on the two-phase immersion cooling methods on high-power electronics. A numerical model based on the mentioned mathematical model, which used the two-phase immersion technique in concentrating photovoltaic cooling, is established according to the literature [36]. Then, the simulation result is validated with experimental data. Fig. 2 shows a comparison of experimental data and numerical simulation results for the HPE’s surface temperature. The maximum deviation between CFD and experimental data is 3.4%, and RSME (Root Mean Square Error) is 2.25. We are able to arrive at a conclusion that the simulation results agree well with the experimental results. Hence, the thermal performance of two-phase immersion cooling on the HPE can be effectively predicted by the established CFD model.
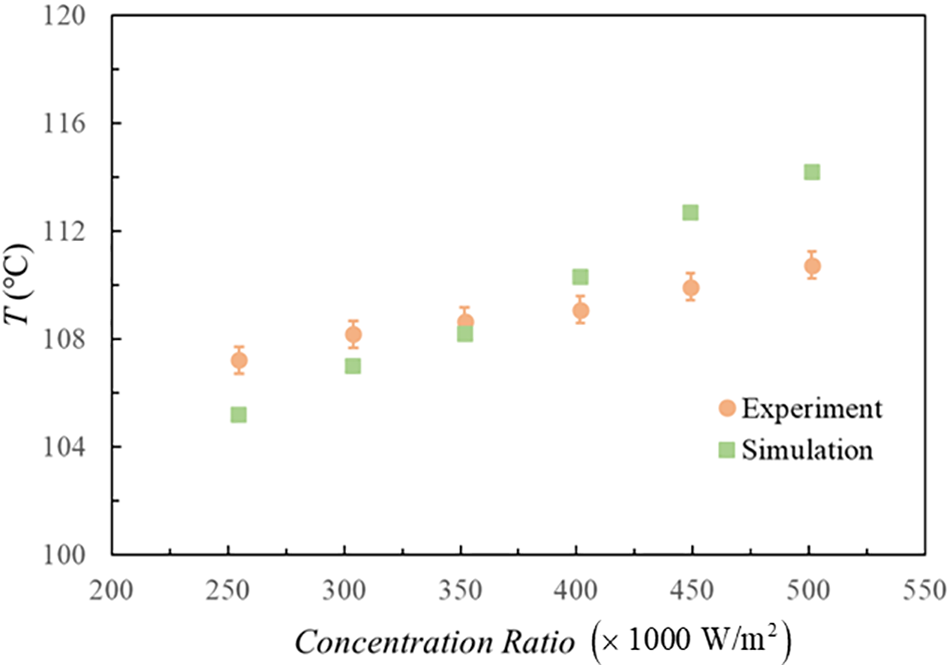
Figure 2: The validation of simulation and experimental data
3.2 Comparison of Different Coolant
The cooling performance of deionized water, ethanol and methanol has been compared with corresponding operation conditions Tin = 50°C and
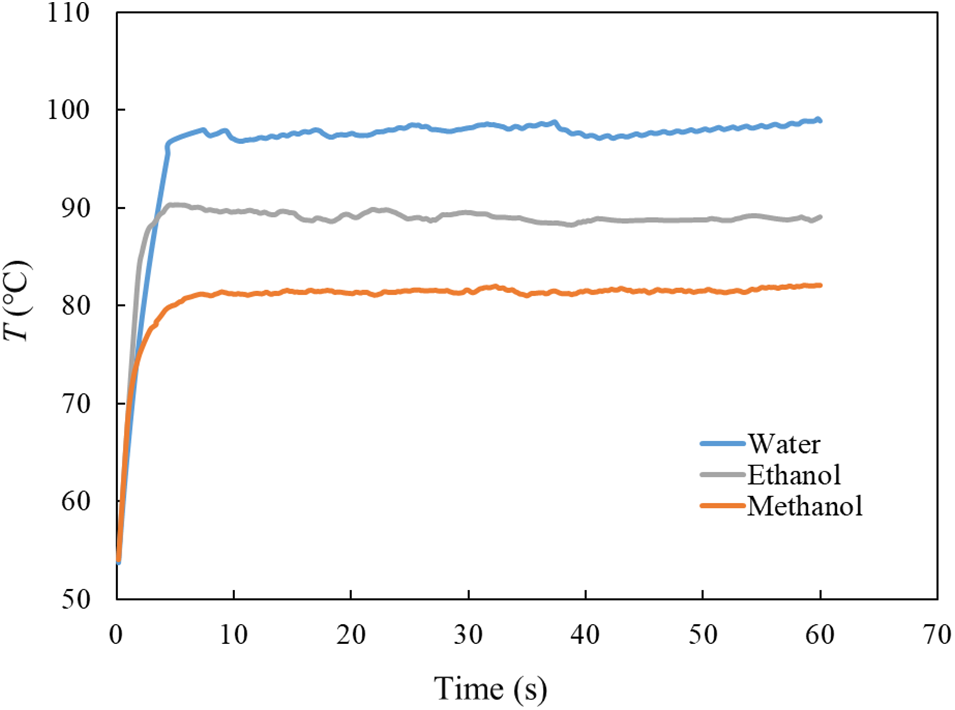
Figure 3: The comparison of THPE for different coolant
The calculation and analysis showed that the
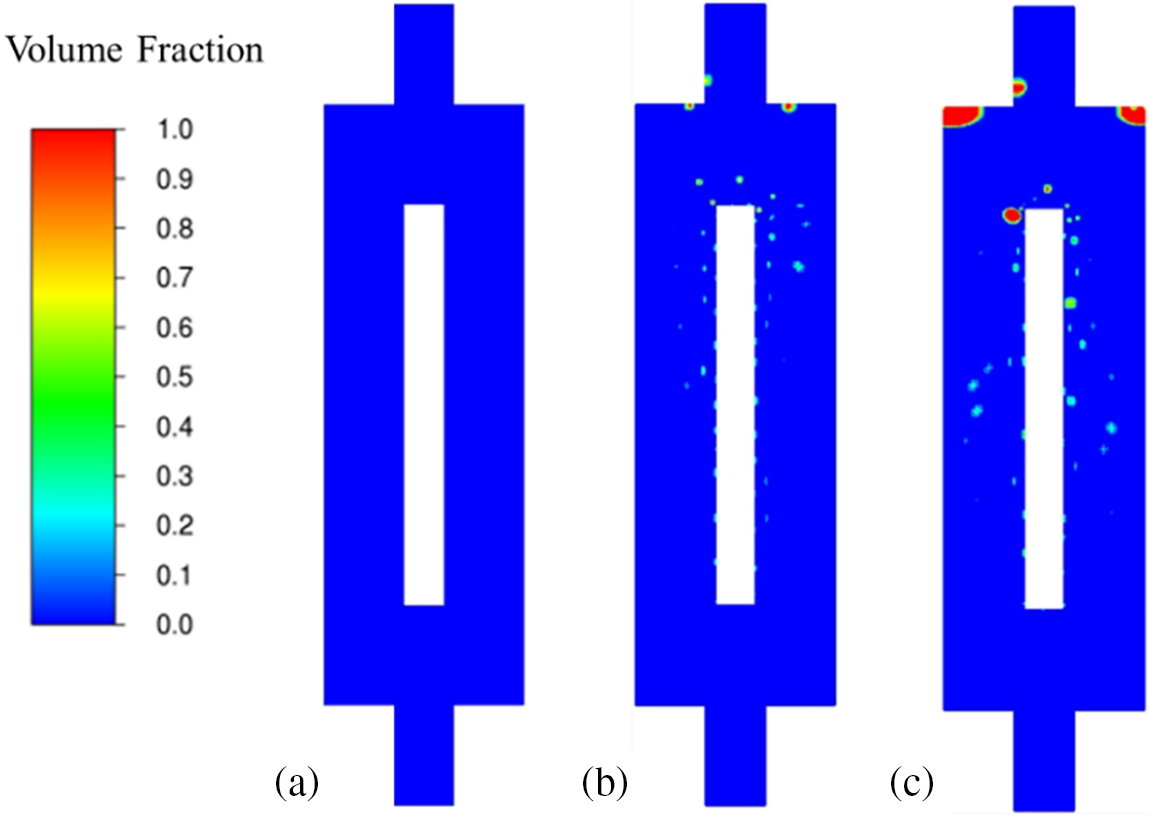
Figure 4: The contour of vapor fraction for different coolant. (a) Deionized water, (b) ethanol, (c) methanol
3.3 The Effects of Inlet Temperature on Cooling Performance
The inlet subcooling of the coolant has an important influence on the flow boiling process. Fig. 5a represents the average temperature of HPE with time for different inlet temperatures, when
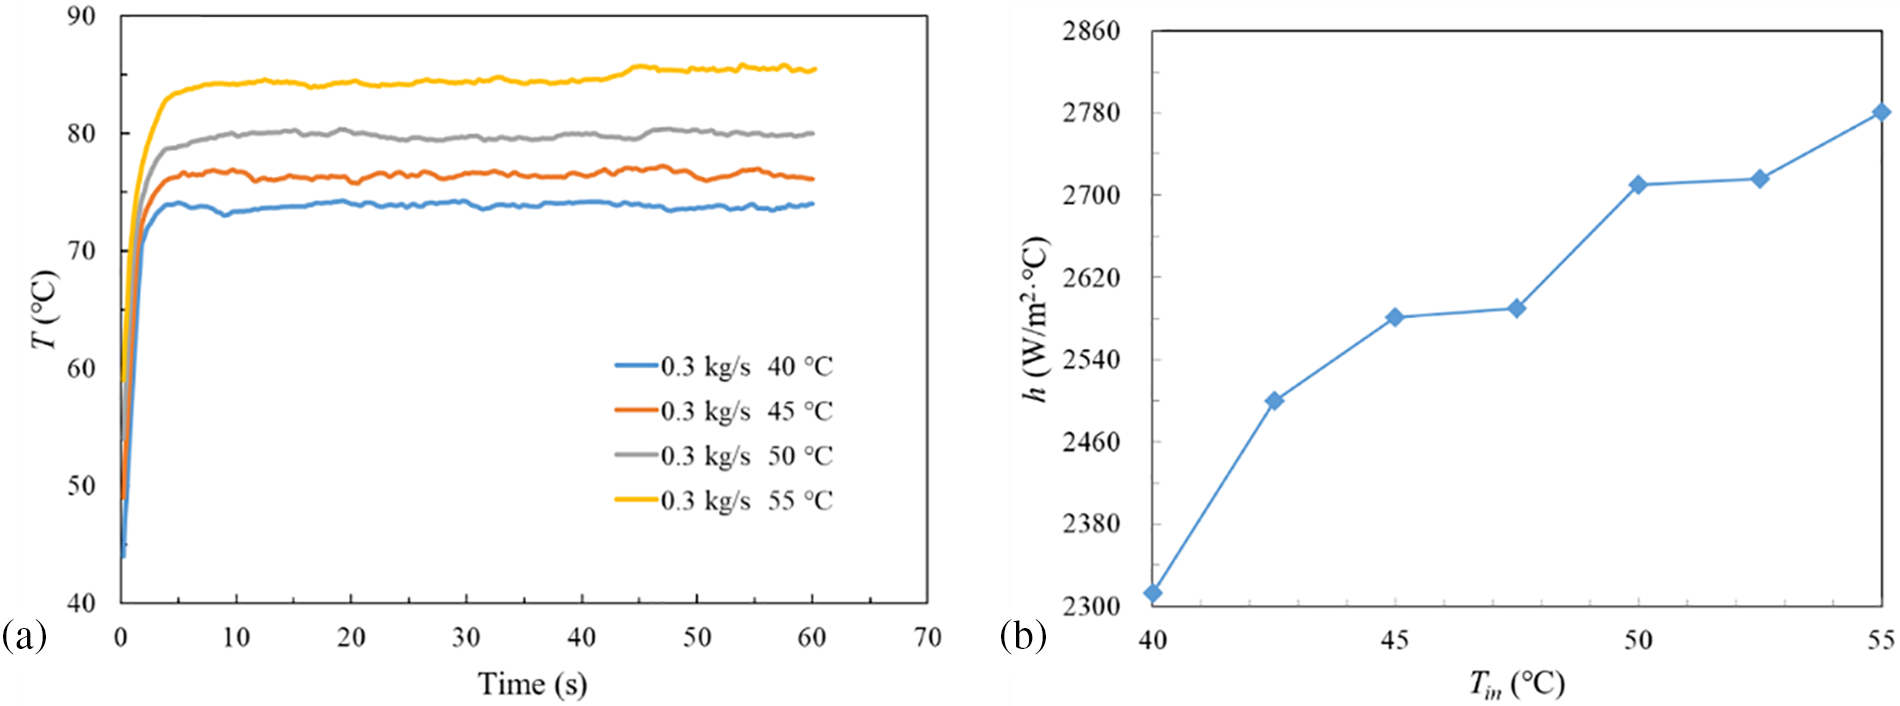
Figure 5: Thermal performance of different Tin at
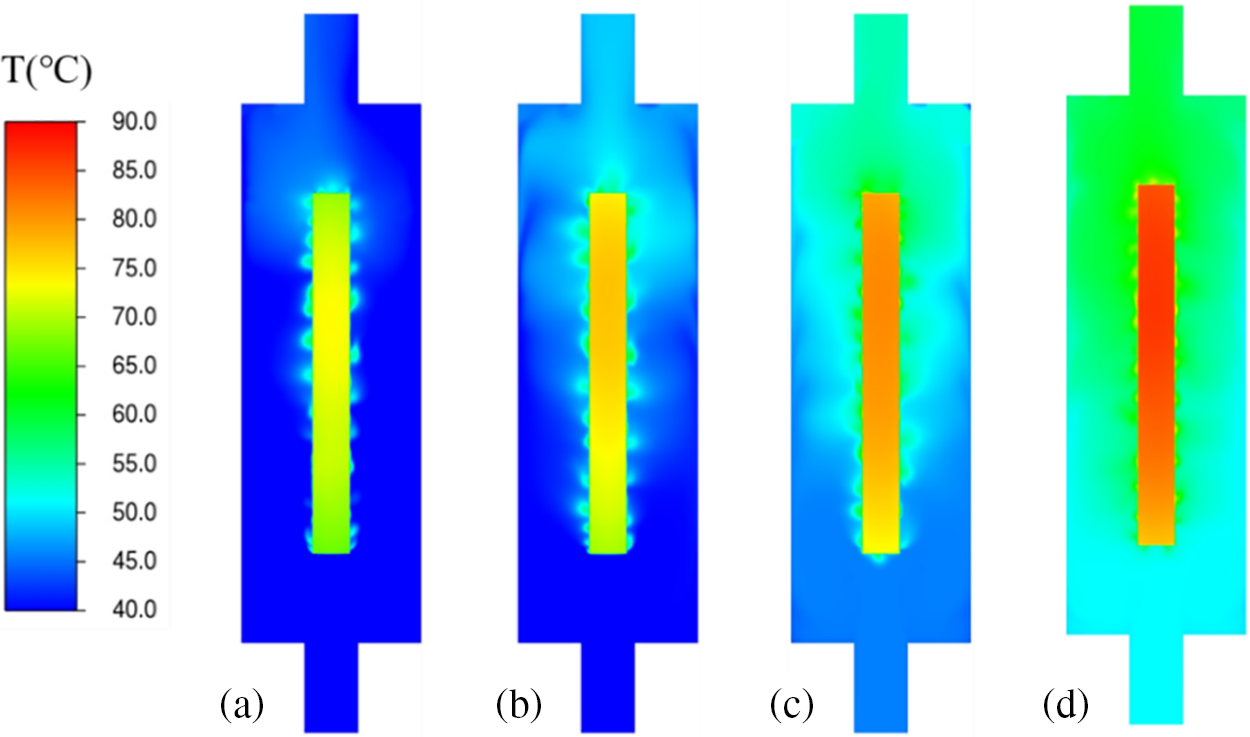
Figure 6: Temperature contours of different Tin at
After a steady state has been achieved, a volume of fraction for vapor between 0 and 1 is conducted to capture vapor-liquid mass transfer features around vapor bubbles and heated walls. As shown in Fig. 7, the contours of vapor volume fraction are given for different Tin at steady state (t = 60 s), when
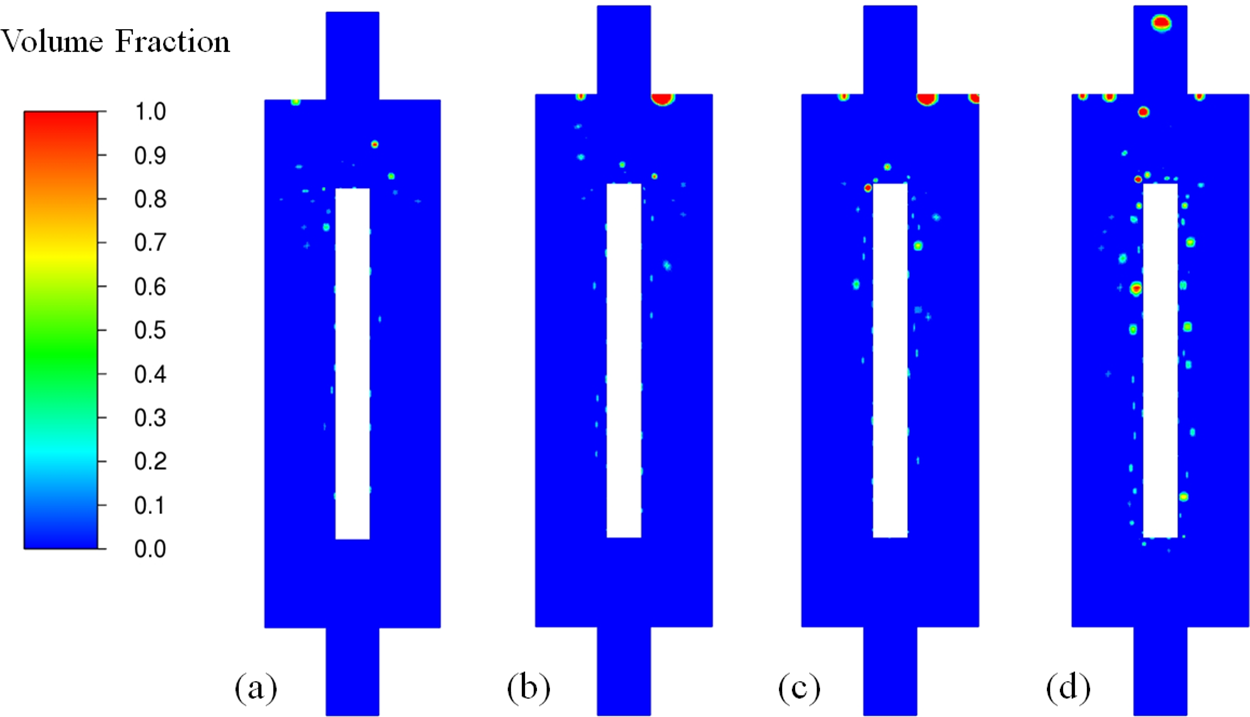
Figure 7: Vapor volume fraction contour of different Tin at
The thermal stress is formed in the operating process because of temperature differences, which may lead to HPE’s failure. Hence, the temperature uniformity of HPE is one of the main indicators in measuring the cooling performance of two-phase immersion cooling method. The temperature distribution along the HPE’s left surface from the bottom to the top for different Tin at
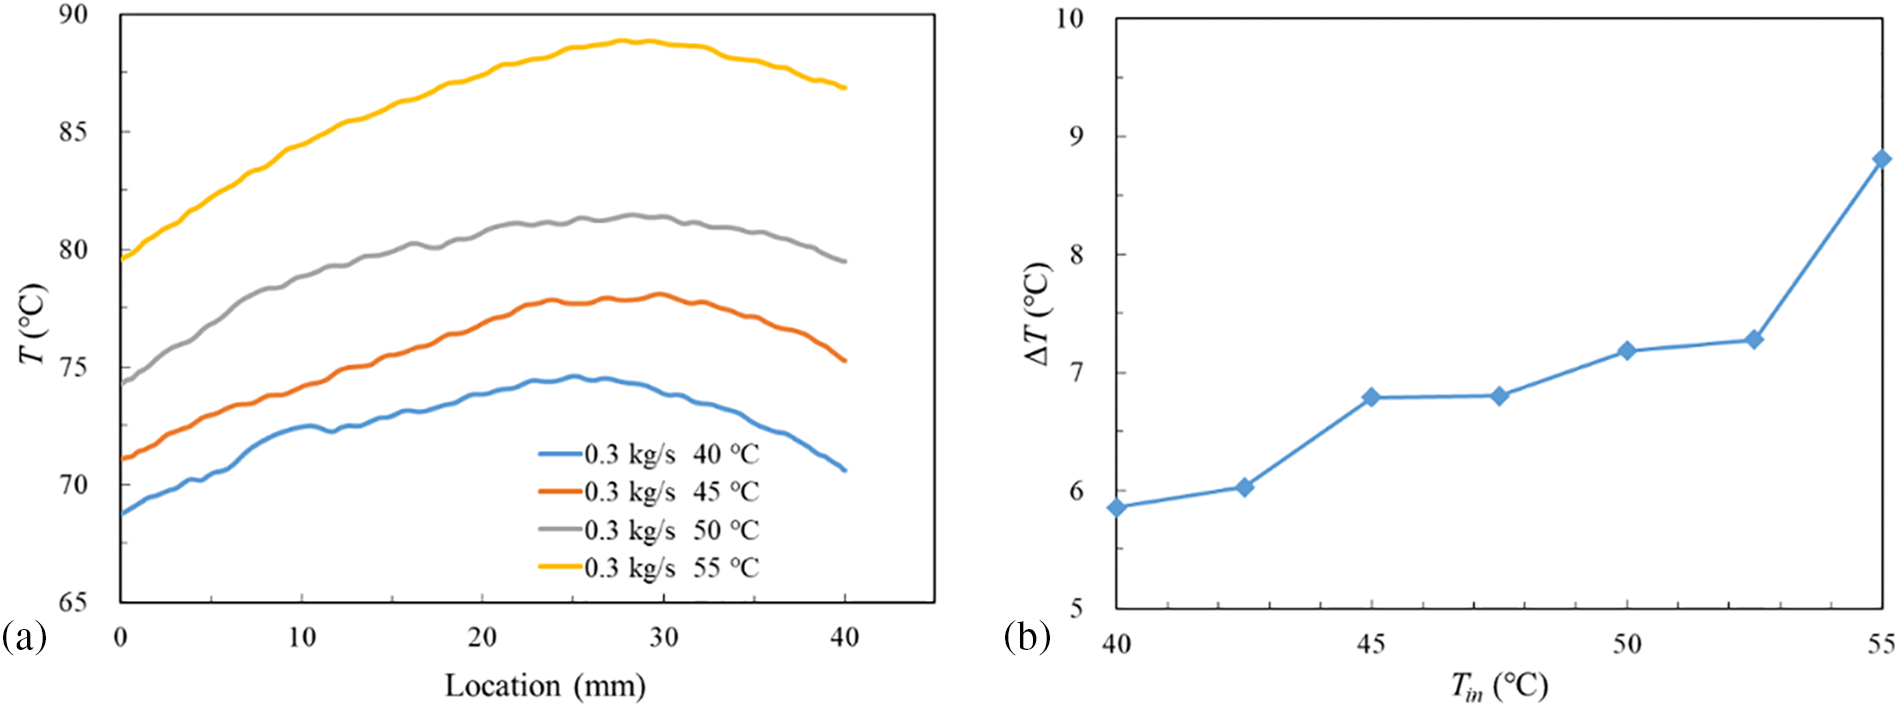
Figure 8: Temperature characteristics of different Tin at
3.4 The Effects of Mass Flow Rate on Cooling Performance
In the process of flow boiling, the mass flow rate of coolant has an important influence on the flow boiling state. Fig. 9a presents the average temperature of HPE with time at different mass flow rates when Tin = 50°C. The temperature of HPE is basically in a steady state with minor fluctuations after 15 s. In the meantime, the rising mass flow rate leads to the THPE showing a downward trend while the magnitude of the increase descends for larger
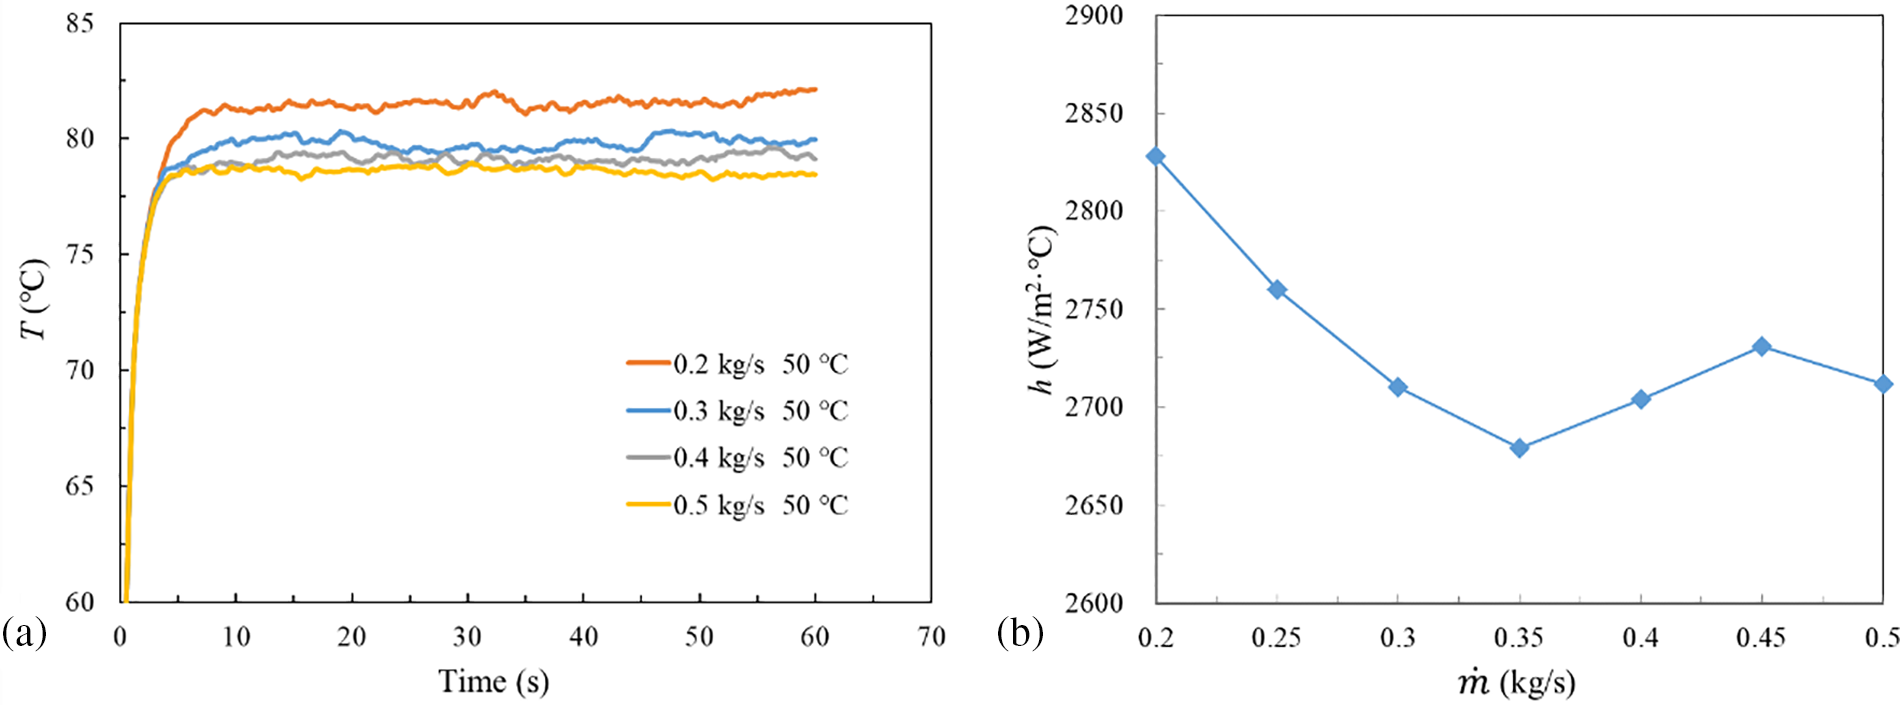
Figure 9: Thermal performance of different
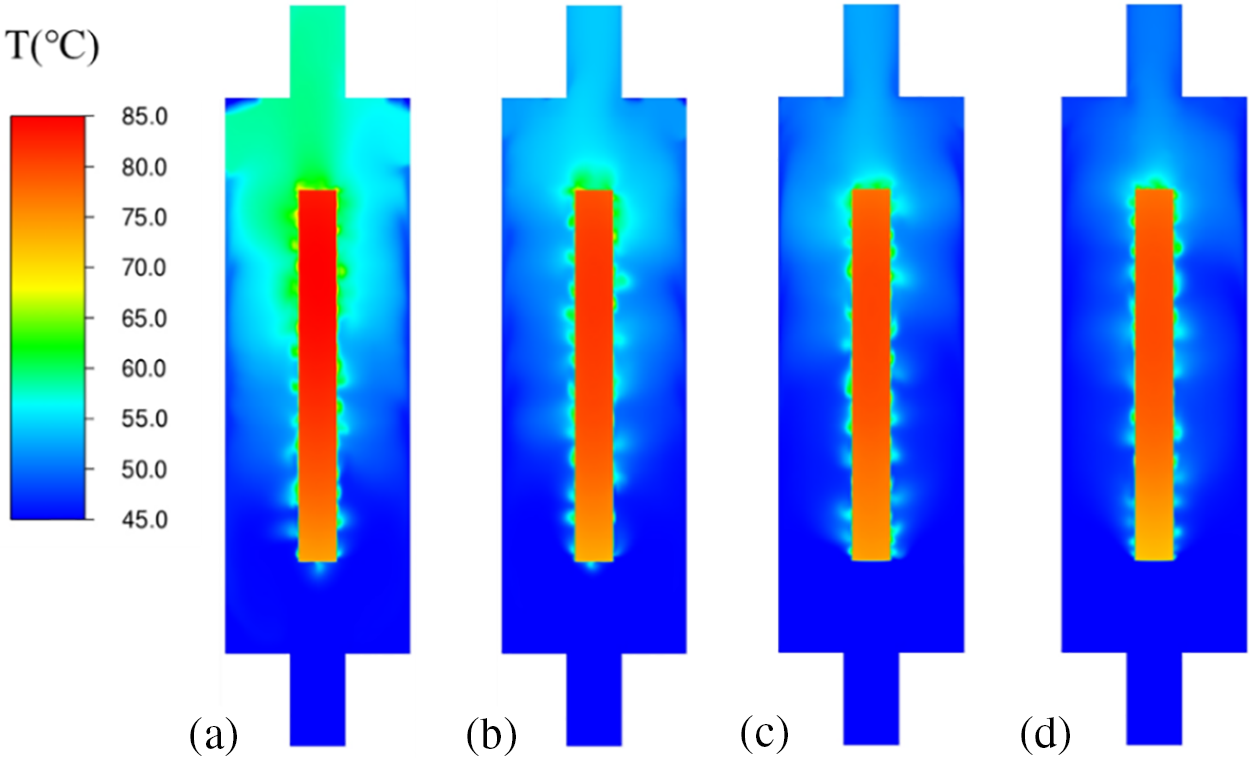
Figure 10: Temperature contours of different
Bubble behaviors, such as the formation of bubbles, departure, sliding, and coalescence, are considered critical heat transfer mechanisms of flow boiling on the HPE’s surface. Fig. 11 depicts the vapor volume fraction contours at different flow rates when the inlet temperature is 50°C. As can be seen, nucleate boiling occurs, and more bubbles are observed as the mass flow rate decreases. Due to strong surface tension effects, bubbles adhere to the heated wall at a low mass flow rate, which benefits the growth of bubbles. For high flow rates, shear-lift force plays a critical role in the bubble detachment process, which acts to suppress the formation and growth of small vapor bubbles produced on the heated surface. With the increase of
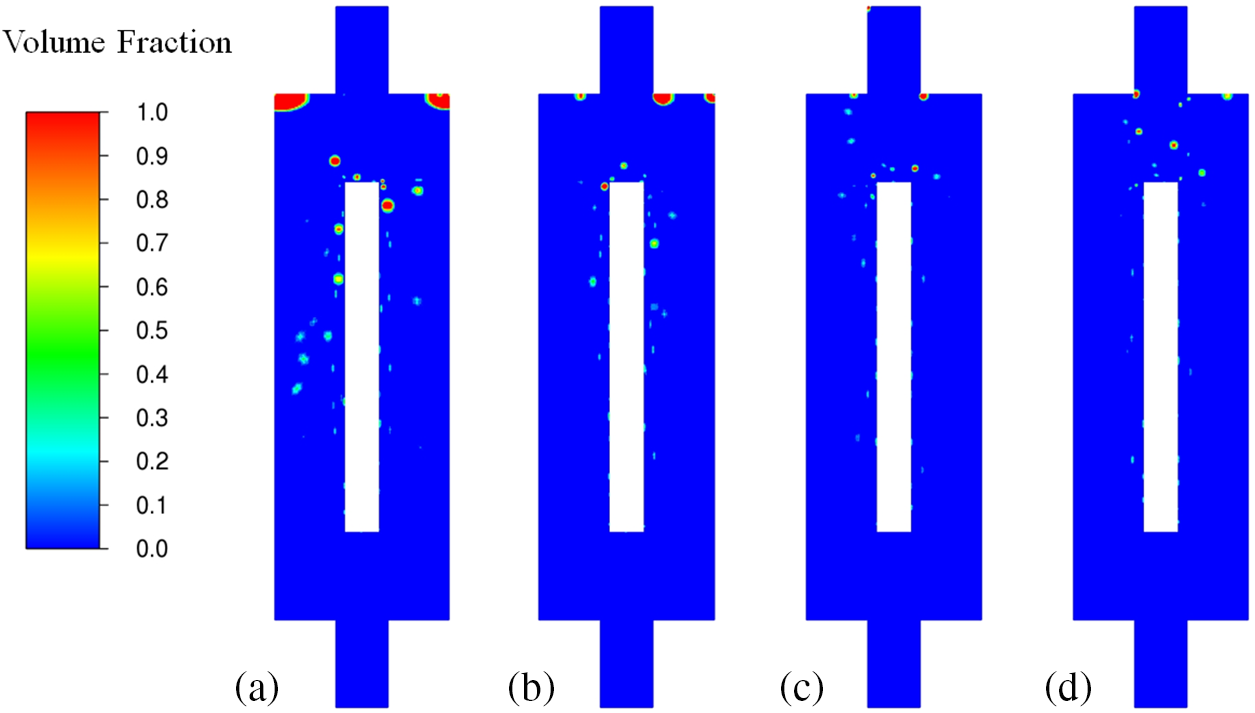
Figure 11: Vapor volume fraction of different
The temperature distribution of the HPE’s left surface for different mass flow rate at Tin = 50°C is presented in Fig. 12a. With the increase of
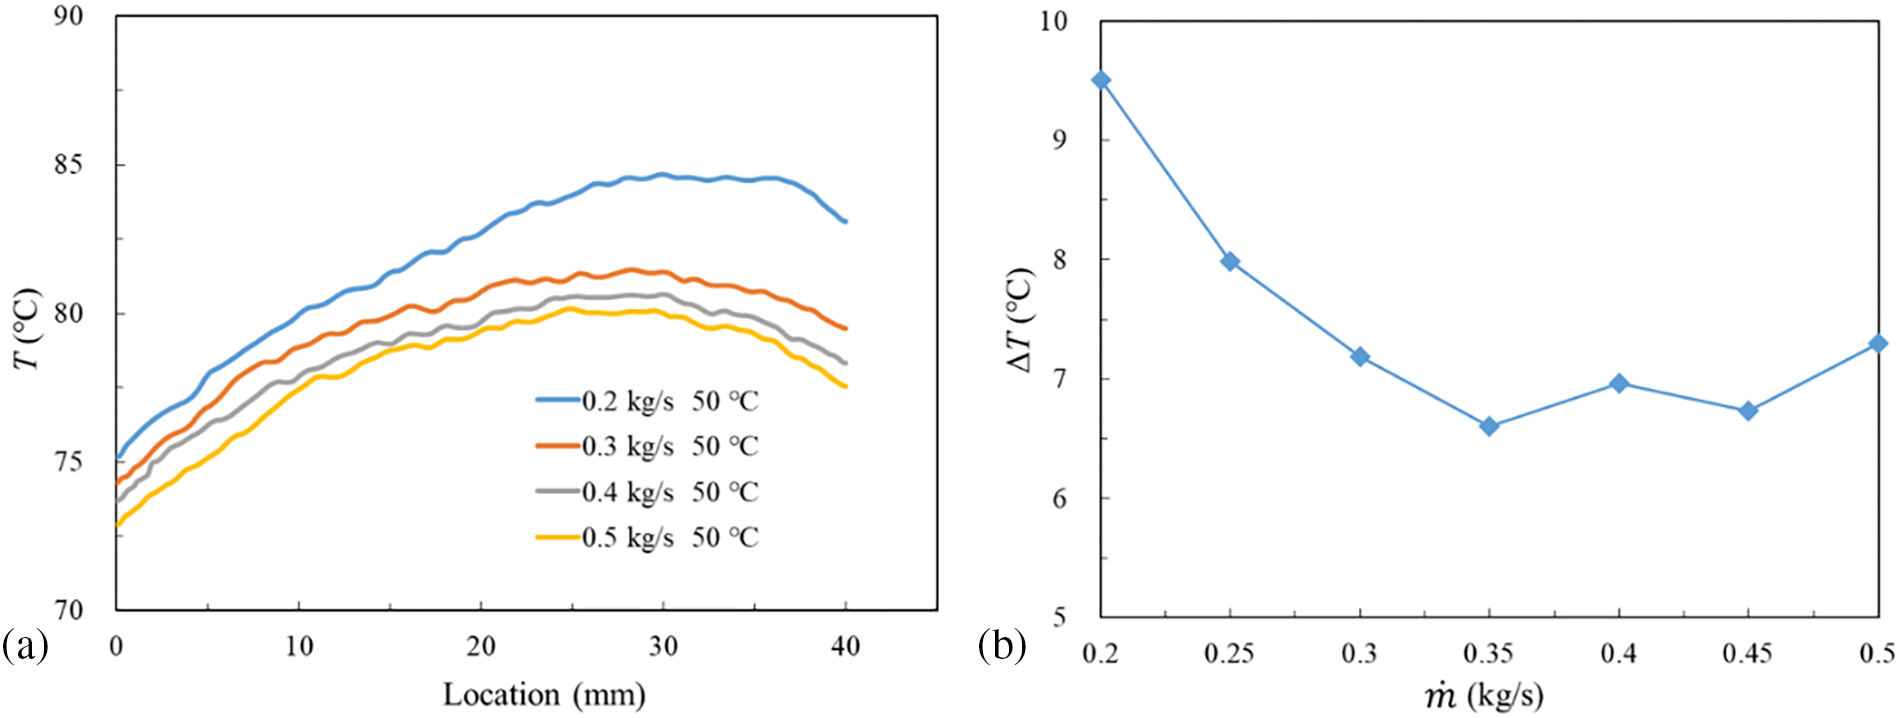
Figure 12: Temperature characteristics of different
The main objective of this paper is to study the application of the two-phase immersion cooling method on the thermal management of high-power electronics. Detailed 2D predictions of interfacial behavior and heat transfer characteristics of HPE have been achieved through CFD simulation. The effects of different cooling medium are investigated. In addition, the influence of different operating conditions has been discussed in detail. The research findings can be used to guide the optimal operating conditions design of two-phase immersion cooling system. More concretely, we get the following main conclusions:
1) The VOF model combined with Lee model and Reynolds Stress Model is utilized in the CFD simulation. The reliability of the CFD model has been verified with the experimental results in the literature, which proves that the equation model is correctly selected;
2) The cooling performance of different coolants, such as deionized water, ethanol and methanol has been studied. For deionized water, the cooling process has no change in phase. Meanwhile, for ethanol and methanol, the phase change occurs under corresponding operating conditions. The calculated heat transfer coefficient indicates that low-boiling coolant can control the HPE at a reasonable temperature and improve heat transfer efficiency;
3) The influences of different inlet temperatures on the cooling performance are analyzed. The temperature of HPE declines and the
4) The effects of two-phase immersion cooling at different mass flow rates have also been studied. The rising mass flow rate leads to the THPE showing a downward trend while the magnitude of the increase descends for a larger mass flow rate. The temperature difference is around 7°C, when m ranges from 0.3 to 0.5 kg/s.
As mentioned, the performance of the two-phase immersion cooling systems can be better understood from an academic viewpoint, and the results can be useful for further academic study and potential industrial assessments. The field of two-phase immersion cooling has a lot of scope for future work. The impacts of sloshing and vibrations on heat transfer performance need to be explored. Also, the effects of different coolants on major components and the reliability of two-phase immersion cooling technology should be evaluated.
Acknowledgement: The simulation work was completed in cooperation with Lanzhou University of Technology-Ansys Joint Simulation Laboratory, China.
Funding Statement: The authors are grateful for financial support from the Key Laboratory of Multiphase Flow Reaction and Separation Engineering of Shandong Province, China (Grant No. 2021MFRSE-C01), the Natural Science Foundation of Gansu Province, China (No. 22JR5RA269) and Fujian Province Science Foundation for Youths, China (No. 2020305069).
Author Contributions: The authors confirm contribution to the paper as follows: study conception and design: Liqun Zhou, Yongtong Li; numerical simulation: Liqun Zhou, Weilin Yang, Shi Lin; analysis and interpretation of results: Weilin Yang, Chaojie Li; draft manuscript preparation: Liqun Zhou, Weilin Yang. All authors reviewed the results and approved the final version of the manuscript.
Availability of Data and Materials: Data is available on request from the authors.
Conflicts of Interest: The authors declare that they have no known competing financial interests or personal relationships that could have appeared to influence the work reported in this paper.
References
1. Zhang, Y., Zhao, Y., Dai, S., Nie, B., Ma, H. et al. (2022). Cooling technologies for data centres and telecommunication base stations–A comprehensive review. Journal of Cleaner Production, 334, 130280. https://doi.org/10.1016/j.jclepro.2021.130280 [Google Scholar] [CrossRef]
2. Jones-Jackson, S., Rodriguez, R., Emadi, A. (2021). Jet impingement cooling in power electronics for electrified automotive transportation: Current status and future trends. IEEE Transactions on Power Electronics, 36(9), 10420–10435. https://doi.org/10.1109/tpel.2021.3059558 [Google Scholar] [CrossRef]
3. Wu, R., Fan, Y., Hong, T., Zou, H., Hu, R. et al. (2019). An immersed jet array impingement cooling device with distributed returns for direct body liquid cooling of high power electronics. Applied Thermal Engineering, 162, 114259. https://doi.org/10.1016/j.applthermaleng.2019.114259 [Google Scholar] [CrossRef]
4. van Erp, R., Soleimanzadeh, R., Nela, L., Kampitsis, G., Matioli, E. (2020). Co-designing electronics with microfluidics for more sustainable cooling. Nature, 585(7824), 211–216. https://doi.org/10.1038/s41586-020-2666-1 [Google Scholar] [PubMed] [CrossRef]
5. Ahmed, S. F., Rafa, N., Mehnaz, T., Ahmed, B., Islam, N. et al. (2022). Integration of phase change materials in improving the performance of heating, cooling, and clean energy storage systems: An overview. Journal of Cleaner Production, 364, 132639. https://doi.org/10.1016/j.jclepro.2022.132639 [Google Scholar] [CrossRef]
6. Riaz Siddiqui, F., Tso, C. Y., Qiu, H., Chao, C. Y. H., Fu, S. C. (2022). Hybrid nanofluid spray cooling performance and its residue surface effects: Toward thermal management of high heat flux devices. Applied Thermal Engineering, 211, 118454. https://doi.org/10.1016/j.applthermaleng.2022.118454 [Google Scholar] [CrossRef]
7. Wang, J. X., Li, Y. Z., Zhong, M. L., Zhang, H. S. (2021). Investigation on a gas-atomized spray cooling upon flat and micro-structured surfaces. International Journal of Thermal Sciences, 161, 106751. https://doi.org/10.1016/j.ijthermalsci.2020.106751 [Google Scholar] [CrossRef]
8. Roe, C., Feng, X., White, G., Li, R., Wang, H. et al. (2022). Immersion cooling for lithium-ion batteries–A review. Journal of Power Sources, 525, 231094. https://doi.org/10.1016/j.jpowsour.2022.231094 [Google Scholar] [CrossRef]
9. Suresh Patil, M., Seo, J. H., Lee, M. Y. (2021). A novel dielectric fluid immersion cooling technology for Li-ion battery thermal management. Energy Conversion and Management, 229, 113715. https://doi.org/10.1016/j.enconman.2020.113715 [Google Scholar] [CrossRef]
10. Wang, H., Tao, T., Xu, J., Shi, H., Mei, X. et al. (2022). Thermal performance of a liquid-immersed battery thermal management system for lithium-ion pouch batteries. Journal of Energy Storage, 46. https://doi.org/10.1016/j.est.2021.103835 [Google Scholar] [CrossRef]
11. Kanbur, B. B., Wu, C., Fan, S., Tong, W., Duan, F. (2020). Two-phase liquid-immersion data center cooling system: Experimental performance and thermoeconomic analysis. International Journal of Refrigeration, 118, 290–301. https://doi.org/10.1016/j.ijrefrig.2020.05.026 [Google Scholar] [CrossRef]
12. Kanbur, B. B., Wu, C., Fan, S., Duan, F. (2021). System-level experimental investigations of the direct immersion cooling data center units with thermodynamic and thermoeconomic assessments. Energy, 217, 103835. https://doi.org/10.1016/j.energy.2020.119373 [Google Scholar] [CrossRef]
13. Shah, J. M., Padmanaban, K., Singh, H., Duraisamy Asokan, S., Saini, S. et al. (2021). Evaluating the reliability of passive server components for single-phase immersion cooling. Journal of Electronic Packaging. https://doi.org/10.1115/1.4052536 [Google Scholar] [CrossRef]
14. Kang, X., Wang, Y., Huang, Q., Cui, Y., Shi, X. et al. (2016). Study on direct-contact phase-change liquid immersion cooling dense-array solar cells under high concentration ratios. Energy Conversion and Management, 128, 95–103. https://doi.org/10.1016/j.enconman.2016.09.073 [Google Scholar] [CrossRef]
15. Wang, Y., Wen, C., Huang, Q., Kang, X., Chen, M. et al. (2017). Performance comparison between ethanol phase-change immersion and active water cooling for solar cells in high concentrating photovoltaic system. Energy Conversion and Management, 149, 505–513. https://doi.org/10.1016/j.enconman.2017.07.054 [Google Scholar] [CrossRef]
16. Birbarah, P., Gebrael, T., Foulkes, T., Stillwell, A., Moore, A. et al. (2020). Water immersion cooling of high power density electronics. International Journal of Heat and Mass Transfer, 147, 118918. https://doi.org/10.1016/j.ijheatmasstransfer.2019.118918 [Google Scholar] [CrossRef]
17. Lionello, M., Rampazzo, M., Beghi, A., Varagnolo, D., Vesterlund, M. (2020). Graph-based modelling and simulation of liquid immersion cooling systems. Energy, 207, 118238. https://doi.org/10.1016/j.energy.2020.118238 [Google Scholar] [CrossRef]
18. Wang, Y., Ren, L., Yang, Z., Deng, Z., Ding, W. (2022). Application of two-phase immersion cooling technique for performance improvement of high power and high repetition avalanche transistorized subnanosecond pulse generators. IEEE Transactions on Power Electronics, 37(3), 3024–3039. https://doi.org/10.1109/tpel.2021.3111348 [Google Scholar] [CrossRef]
19. Ramakrishnan, B., Alissa, H., Manousakis, I., Lankston, R., Bianchini, R. et al. (2021). CPU overclocking: A performance assessment of air, cold plates, and two-phase immersion cooling. IEEE Transactions on Components, Packaging and Manufacturing Technology, 11(10), 1703–1715. https://doi.org/10.1109/tcpmt.2021.3106026 [Google Scholar] [CrossRef]
20. Ali, A. (2020). Thermal performance and stress analysis of heat spreaders for immersion cooling applications. Applied Thermal Engineering, 181, 115984. https://doi.org/10.1016/j.applthermaleng.2020.115984 [Google Scholar] [CrossRef]
21. Ghaffari, O., Tong, W., Larimi, Y. N., Al Sayed, C., Ganjali, A. et al. (2021). Experimental investigation of the effect of heat spreading on boiling of a dielectric liquid for immersion cooling of electronics. Journal of Electronic Packaging, 143(4), 041103. https://doi.org/10.1115/1.4051943 [Google Scholar] [CrossRef]
22. Zhou, G., Zhou, J., Huai, X., Zhou, F., Jiang, Y. (2022). A two-phase liquid immersion cooling strategy utilizing vapor chamber heat spreader for data center servers. Applied Thermal Engineering, 210, 118289. https://doi.org/10.1016/j.applthermaleng.2022.118289 [Google Scholar] [CrossRef]
23. Sun, X., Han, Z., Li, X. (2022). Simulation study on cooling effect of two-phase liquid-immersion cabinet in data center. Applied Thermal Engineering, 207, 118142. https://doi.org/10.1016/j.applthermaleng.2022.118142 [Google Scholar] [CrossRef]
24. El-Genk, M. S., Pourghasemi, M. (2020). Experimental investigation of saturation boiling of HFE-7000 dielectric liquid on rough copper surfaces. Thermal Science and Engineering Progress, 15, 100428. https://doi.org/10.1016/j.tsep.2019.100428 [Google Scholar] [CrossRef]
25. El-Genk, M. S., Pourghasemi, M. (2021). Experiments and correlations of saturation boiling of hfe-7000 dielectric liquid on rough inclined copper surfaces. International Journal of Heat and Mass Transfer, 164, 120540. https://doi.org/10.1016/j.ijheatmasstransfer.2020.120540 [Google Scholar] [CrossRef]
26. Hsu, Y. T., Li, J. X., Lu, M. C. (2018). Enhanced immersion cooling using two-tier micro- and nano-structures. Applied Thermal Engineering, 131, 864–873. [Google Scholar]
27. Chen, P., Harmand, S., Ouenzerfi, S. (2020). Immersion cooling effect of dielectric liquid and self-rewetting fluid on smooth and porous surface. Applied Thermal Engineering, 180, 115862. https://doi.org/10.1016/j.applthermaleng.2020.115862 [Google Scholar] [CrossRef]
28. Lee, J., O’Neill, L. E., Mudawar, I. (2020). 3-D computational investigation and experimental validation of effect of shear-lift on two-phase flow and heat transfer characteristics of highly subcooled flow boiling in vertical upflow. International Journal of Heat and Mass Transfer, 150, 119291. https://doi.org/10.1016/j.ijheatmasstransfer.2019.119291 [Google Scholar] [CrossRef]
29. Lee, J., Mudawar, I., Hasan, M. M., Nahra, H. K., Mackey, J. R. (2022). Experimental and computational investigation of flow boiling in microgravity. International Journal of Heat and Mass Transfer, 183, 122237. https://doi.org/10.1016/j.ijheatmasstransfer.2021.122237 [Google Scholar] [CrossRef]
30. Ahmadi, A. A., Bahiraei, M. (2021). Thermohydraulic performance optimization of cooling system of an electric arc furnace operated with nanofluid: A CFD study. Journal of Cleaner Production, 310, 127451. https://doi.org/10.1016/j.jclepro.2021.127451 [Google Scholar] [CrossRef]
31. Liu, X., Chen, Y. (2014). Fluid flow and heat transfer in flat-plate oscillating heat pipe. Energy and Buildings, 75, 29–42. https://doi.org/10.1016/j.enbuild.2014.01.041 [Google Scholar] [CrossRef]
32. Jouhara, H., Fadhl, B., Wrobel, L. C. (2016). Three-dimensional CFD simulation of geyser boiling in a two-phase closed thermosyphon. International Journal of Hydrogen Energy, 41(37), 16463–16476. https://doi.org/10.1016/j.ijhydene.2016.02.038 [Google Scholar] [CrossRef]
33. Lorenzini, D., Joshi, Y. K. (2018). Computational fluid dynamics modeling of flow boiling in microchannels with nonuniform heat flux. Journal of Heat Transfer, 140(1), 011501. https://doi.org/10.1115/1.4037343 [Google Scholar] [CrossRef]
34. Yeo, I., Lee, S. (2022). 2D computational investigation into transport phenomena of subcooled and saturated flow boiling in large length to diameter ratio micro-channel heat sinks. International Journal of Heat and Mass Transfer, 183, 122128. https://doi.org/10.1016/j.ijheatmasstransfer.2021.122128 [Google Scholar] [CrossRef]
35. Mimouni, S., Laviéville, J., Seiler, N., Ruyer, P. (2011). Combined evaluation of second order turbulence model and polydispersion model for two-phase boiling flow and application to fuel assembly analysis. Nuclear Engineering and Design, 241(11), 4523–4536. https://doi.org/10.1016/j.nucengdes.2010.12.028 [Google Scholar] [CrossRef]
36. Wen, C. (2018). Experimental and numerical research on heat transfer characteristics of phase-change immersion cooling method. China: Tianjin University. [Google Scholar]
Cite This Article
 Copyright © 2024 The Author(s). Published by Tech Science Press.
This work is licensed under a Creative Commons Attribution 4.0 International License , which permits unrestricted use, distribution, and reproduction in any medium, provided the original work is properly cited.
 Downloads
 Citation Tools