
 Submit a Paper
 Propose a Special lssue
 Open Access
ARTICLE

A Simulation Study on Heat Transfer of a Three-Layer Contact Structure under Ultrahigh Heat Flux Considering Thermal Contact Resistance
1 Institute for Advanced Technology, Shandong University, Jinan, 250061, China
2 Shandong Key Laboratory of Thermal Science and Smart Energy Systems, Jinan, 250061, China
3 Advanced Energy Science and Technology Guangdong Laboratory, Huizhou, 516003, China
4 Institute of Modern Physics, Chinese Academy of Sciences, Lanzhou, 730000, China
* Corresponding Authors: Xingjie Ren. Email: ; Yaling Zhang. Email:
# These authors contributed equally to this work
(This article belongs to the Special Issue: Microscale Heat and Mass Transfer and Efficient Energy Conversion)
Frontiers in Heat and Mass Transfer 2025, 23(3), 881-897. https://doi.org/10.32604/fhmt.2025.066302
Received 04 April 2025; Accepted 27 May 2025; Issue published 30 June 2025
 View Full Text
 Download PDF
Abstract
This paper investigates interfacial heat transfer characteristics in a multi-layer structure under ultra-high heat flux conditions, focusing on thermal contact resistance (TCR) between adjacent layers. A three-layer computational model with dual rough interfaces was developed to systematically analyze the synergistic effects of interfacial pressure, surface emissivity, and thermal interface materials (TIMs). Surface reconstruction using experimental measurement data generated two representative roughness models to quantify the impact of surface roughness on heat dissipation. Numerical simulations demonstrate that the absence of TIMs leads to insufficient thermal dissipation capacity under ultra-high heat flux conditions. Compared to TIM application, merely increasing the convective heat transfer coefficient shows limited effectiveness in enhancing heat dissipation efficiency.Keywords
The multi-interface contact structure is a common structure for heat transfer in many engineering applications. However, because of the inherent surface roughness of the solids, the actual contact is only at some discrete points and can cause a so-called thermal contact resistance that significantly affects the heat transfer efficiency of the multi-layer contact structure [1], moreover, it can heavily affect the accurate thermal management of the apparatus with a multi-layer structure, such as chip packaging [2,3], thermoelectric (TE) conversion process [4,5], and isotope production.
For example, in the process of isotope production, the target metal is heated by an ultrahigh energy proton beam, and the target metal will melt because of the deposition of energy, thus, the heat needs to be transferred by an interlayer graphite solid material to the copper heat exchanger to avoid over-temperature of the target metal. Although it is a simple heat conduction process for the multi-layer contact structure, it is significantly complicated when considering the thermal contact resistance effect, thus, an accurate thermal contact resistance model can be significant for the heat analysis of the multi-layer contact structure.
Since thermal contact resistance is caused by roughness, the first core issue in the numerical simulation research of thermal contact resistance is the reconstruction method of rough surfaces. In the early studies on thermal contact resistance, the height of surface asperities was generally assumed to follow a Gaussian distribution [6]. However, the height distribution of engineering material surfaces does not strictly follow Gaussian distribution. Currently, there are two main methods for rough surface regeneration. One uses fractal functions [7–10] for reconstruction, and the other uses surface topography measurement data [11] for reconstruction.
The advantage of fractal functions is that they can quickly construct rough surfaces with different surface topography parameters, thereby facilitating qualitative analysis of contact deformation and heat transfer [12]. However, the actual surface topography of materials is related to manufacturing processes and surface processing methods and does not strictly follow the description of fractal functions [13]. Even if the surface topography parameters are the same, their actual topographies may vary greatly [14]. Therefore, Gou et al. [15] used a high-precision surface topography instrument to measure the surface topography of the material, and then used the finite element method to conduct research on interface deformation and heat transfer. The results showed that the method of reconstructing rough surfaces using measurement data is more in line with the actual situation.
The second core issue is the thermo-mechanical coupling calculation of interface deformation and heat transfer. Research shows that when two solid rough surfaces come into contact, due to the influence of surface roughness, in fact, only some discrete points of the interfaces are in contact [16], this will lead to multiple deformation modes of the interface, including elastic deformation, plastic deformation, elastoplastic deformation [17]. Ren et al. [11] conducted a study on the thermal contact resistance of a composite material, calculating elastic deformation using the generalized Hooke’s law and plastic deformation using the plastic increment theory. The deformation of the uncontacted area and the contacted area of the interface was analyzed, and it was found that even at a relatively low pressure, the uncontacted area was elastic deformation and the contacted area had plastic deformation.
The heat transfer at the contact interface includes gas heat conduction (this item is not applicable in vacuum), solid spot heat conduction and gap radiation. Among them, gas heat conduction is related to the gas thermal conductivity, the thickness of the gas gap, and the gas-solid interface thermal resistance [18]. Solid spot heat conduction is related to the constriction thermal resistance of the contact point and the number of contact points [19]. When the interface temperature is higher than 300°C, interface heat radiation should also be considered [16]. Interface heat radiation is related to the surface emissivity and the gap scale. Dai et al. [20] implemented the calculation of interface heat transfer considering the variation of gas thermal conductivity and thickness, which improved the calculation accuracy of interface heat transfer compared with literature [15], and the deviation between the simulation results and the experimental results was within 10%. This greatly improved the accuracy of numerical simulation of thermal contact resistance. Ren et al. [11] calculated the proportion of solid contact point conduction and radiation in the total heat transfer of the interface based on this, and found that gas conduction was the main mode of interface heat transfer.
In addition, studies [11,15,20] calculate the deformation and heat transfer of the interface separately, that is, first conduct deformation analysis and then conduct heat transfer analysis based on the deformation model. This processing method is equivalent to ignoring the thermal expansion of the material and not considering the thermal expansion effect. This processing method causes a smaller deviation at lower temperatures, but a larger deviation at higher temperatures.
In addition, for the contact heat transfer numerical model of interfaces with added interface materials (such as thermal conductive grease, thermal conductive gaskets and nanoparticles, etc.), there are few published studies. Ren et al. [21] developed a contact heat transfer model considering the addition of thermal pads between the heat source and the heat sink, and analyzed the influence of parameters such as the thickness and elastic modulus of the pads on interface heat transfer. However, the studied temperature is below 100°C. For the ultra-high heat flux applications, there are no related reports yet, and further research is needed.
In this study, we developed a three-layer contact structure incorporating surface topography characteristics of contact interfaces. A finite element-based sequential thermo-mechanical coupling approach was employed to perform comprehensive contact analyses and heat transfer evaluations of the integrated structure. The systematic investigation encompassed three critical parameters: surface emissivity, interfacial roughness characteristics, and thermal interface material properties, with particular emphasis on their synergistic effects on the system’s thermal performance.
In this paper, we mainly study the interfacial heat transfer of a three-layer contact structure, as Fig. 1 shows. In the applications, the target metal is heated by an ultra-high flux proton beam, and the heat is transferred by the interlayer to the heat exchanger cooled by water. In this situation, thermal contact resistance is a major obstacle restricting the heat dissipation of the target metal to the heat exchanger. As we know, thermal contact resistance (TCR) is caused by the irregularities of the material surface, thus to study the interfacial heat transfer through the three-layer contact structure, we must consider the actual surface topography of the material surface. Here, we used the measured surface data to regenerate the rough surface to construct the numerical model. Besides, to study the influence of the roughness on the interfacial heat transfer, we constructed two models to study the effect of the surface topography on the interfacial heat transfer.

Figure 1: (a) The heat transfer structure; (b) The computational region; (c) The heat transfer through the rough contact interface
In the simulation, the measured data is used to reconstruct the rough surface, generate the volume, and then divide the mesh for numerical simulation of the thermal contact resistance. Moreover, to study the effect of reducing surface roughness on enhancing interfacial heat transfer, we use two models with different surface roughness to show the effect of surface roughness on the heat dissipation of the whole structure.
2.1.1 Surface Topography of the Contact Interfaces in Model 1
Fig. 2 shows the surface topography of the contact interfaces in Model 1. The surface topography comes from the actual measurement data obtained by a high-resolution surface topography microscope (Bruker GT-K). It can be seen from Fig. 2, that the actual surface topography is largely rough, and the asperities of the surface are largely random.

Figure 2: The surface topography of the contact interfaces in Model 1
2.1.2 Surface Topography of the Contact Interfaces in Model 2
In this model, the surface topography of the target metal remains the same as that in Model 1, however, two other surfaces of the interlayer and heat exchanger are replaced with polished surfaces, and the detailed surface topography is shown in Fig. 3.

Figure 3: The surface topography of the contact interfaces in Model 2
2.2 Computational Region and Mesh
After the rough surface reconstruction, the volume is generated according to the rough surfaces. The volume is generated according to the rough surfaces. Finally, the hexahedral mesh is used to mesh the volume, and the number of the meshes is 1,293,120. Besides, the region near the contact interface is divided into fine mesh, as Fig. 4 shows.

Figure 4: The computational region and mesh
3 Governing Equations and Boundary Conditions
The study of thermal contact resistance involves contact mechanics and heat transfer, so the governing equations include mechanical governing equations and heat transfer governing equations.
3.1 Mechanics Governing Equations
The mechanical governing equations describe the deformation and contact of two rough solid contact surfaces under stress, and their correctness will seriously affect the calculation results of subsequent heat transfer. Generally speaking, there are three types of deformation of rough contact interface under pressure loading, elastic deformation, plastic deformation and elastoplastic deformation, and the three deformation states match different governing equations. In this study, since the applied pressure is very small, it can be assumed that there is only elastic deformation at the contact interface.
In three-dimensional space, the stress state of any point in the body of an elastomer under load can be represented by 6 components, and the mechanical equilibrium equation of an elastomer is shown in Eqs. (1)–(3):
where
The displacement at any point in the elastic body can be represented by the three displacement components ux, uy, uz in the direction of the Cartesian coordinate system, and the relationship between the strain and the displacement in each direction satisfies Eqs. (4) and (5):
where
The stress-strain relation in elastic mechanics, also known as the elastic relation, follows the generalized Hooke’s law and is written in matrix form for simplicity, as shown in Eq. (6):
where
3.2 Governing Equations for Heat Transfer
The heat transfer analysis of the thermal contact resistance is simpler than the contact analysis, and the only processes involved are heat conduction and heat radiation when the convection effect of the contact gap is ignored.
3.2.1 Governing Equations of Heat Conduction
In this paper, the thermal contact resistance studied by numerical simulation is a steady-state heat conduction problem without an internal heat source, so it can be written in the form of Eq. (8):
where
In order to accurately predict the thermal contact resistance, the heat transfer at the contact interface deserves special attention. In the numerical simulation software used in this paper, this heat transfer method is referred to as interstitial heat conduction, as shown in Eq. (9):
where q means the heat flux the heat flux per unit area crossing the interface from point A on one surface to point B (W·m−2); k is the gap conductance/W·m−2·K−1; TA means the temperature of the point A at the surface with higher temperature/K; TB means the temperature of the point B at the surface with lower temperature/K. Gap Conductance k can be written by Eq. (10):
where d is the distance from point A to point B of the two contact surfaces/m;
For a pair of contact spots, the conductance is shown in Eq. (11):
where a is the radius of contact spot
where
Besides, F in Eq. (12) is the constriction alleviation factor and one of the recommended correlations is shown by Eq. (13) [16]:
where b is the radius of the cylinder feeding the contact spot.
Since there are only some discrete spots in contact when two rough surfaces are in contact, and the other areas are not in contact, thus thermal radiation is bound to occur between the two voids that are not in contact. The thermal radiation between the two gaps is calculated with Eq. (14):
where qra is the radiant heat flux/W·m−2. C is shown in Eq. (15):
where F is the view factor and is set to 1;
According to the description of the governing equations, the boundary condition can be divided into the static boundary condition and the heat transfer boundary condition. In this study, we use a sequential thermo-mechanical coupling method to study the interfacial heat transfer. Firstly, different pressure loads are applied to the upper surface of the target metal to calculate the contact of the different parts, and when the convergence is reached, different thermal loads are applied to the model to obtain the thermal contact resistance under different pressure and heat transfer conditions.
The simulation process is conducted under vacuum, that is, the heat transfer mode at the interface is the heat conduction in the actual solid contact spots and the thermal radiation in the gaps. The heat transfer boundary condition is to apply a uniform heat flux to the upper surface of the target metal, and the lower surface of the heat exchanger is set to a constant temperature boundary condition at a temperature of 300°C.
In addition, in the study of thermal contact resistance, the constant wall temperature boundary condition is generally used, because if the convection boundary condition is used, the temperature distribution of the same rough surface will be largely different, as shown in Fig. 5. Therefore, it is more reasonable to use the constant wall temperature boundary condition in the simulation of the thermal contact resistance, and the constant wall temperature boundary condition is also used in the following calculations.

Figure 5: The temperature distribution of the upper surface of the heat exchanger under two different boundaries, the heating power is 5 kW
3.4 Element Types and Material Properties
In this paper, the contact between different materials is by the gravity of the material, thus it can be concluded that the thermo-coupling is significantly weak, hence, the simulation is finished by a sequential thermo-mechanical method based on the finite element method. The solution of the thermal contact resistance is divided into two steps, one is to calculate the contact deformation of the two contact surfaces, and the other is to calculate the temperature distribution of the model after the deformation calculation. In practice, the element type used in each step is different, where the element type used to calculate the contact is C3D8. The cell is a hexahedral element where “C” stands for continuous element, “3D” means that the element is three-dimensional, and “8” means that there are 8 nodes on the element. The element type used to calculate the heat transfer process is DC3D8, which is a type of element for diffusion heat transfer or mass transfer and is also a three-dimensional eight-node linear element. The target metal is thorium, and the interface and heat exchanger are both graphite.
Fig. 6 shows the actual contact between the upper surface of the heat exchanger and the lower surface of the interlayer in Model 1, where the highlighted areas in the blue area indicate the actual contact area. And it can be seen that due to the roughness of the surface, when the contact pressure reaches 1 MPa, the actual contact area is still very small.

Figure 6: The contact area between the upper surface of the heat exchanger and the lower surface of the Interlayer (Interface 2) in Model 1
Fig. 7 shows the actual contact area between the target metal and the Interlayer. It can be seen that at the same pressure, the surface of the target metal is smoother than the surface of the interlayer and the heat exchanger, so there is more contact area at the Interface 1.

Figure 7: The contact area between the upper surface of the Interlayer and the lower surface of the target metal (Interface 1) in Model 1
In order to show that a smooth surface is more beneficial for the actual contact between the two surfaces, Fig. 8 shows the actual contact area between the interlayer and the heat exchanger surface. Compared with Fig. 6, we can find that the smoother surface has more contact area at the same pressure. The same conclusion can be seen in Fig. 9, which means the contact between the upper surface of the interlayer and the lower surface of the target metal. Compared with Fig. 8, we can find that the contact area of Interface 1 is less than that of Interface 2 at the same pressure, since the surface of the target metal is rougher than the surface of the interlayer and the heat exchanger.

Figure 8: The contact area between the upper surface of the heat exchanger and the lower surface of the Interlayer (Interface 2) in Model 2

Figure 9: The contact area between the upper surface of the Interlayer and the lower surface of the target metal (Interface 1) in Model 2
4.2 Thermal Contact Resistance
In this study, the model has two interfaces, Interface 1 is the contact interface between the target metal and the interlayer, and Interface 2 is the contact interface between the Interlayer and the heat exchanger. Therefore, the following section focuses on the thermal contact resistance between these two interfaces.
4.2.1 Thermal Contact Resistance at Interface 1
Fig. 10 shows the thermal contact resistance at Interface 1 of the two models. It can be seen from Fig. 10 that thermal contact resistance decreases with an increase of pressure and heating power, besides, thermal contact resistance at Interface 1 of Model 1 is lower than that of Model 2. The reason can be explained as follows. Interface 1 of Model 1 has two relatively rough contact surfaces, but one of the surfaces of Interface 1 in Model 2 is smooth and the other surface is rough, hence, when the pressure increases, the thermal contact resistance increases due to the influence of Interface 2, which shows that when a system has two or more contact interfaces, the roughness of each surface needs to be considered at the same time.

Figure 10: Thermal contact resistance at Interface 1
4.2.2 Thermal Contact Resistance at Interface 2
Fig. 11 shows the thermal contact resistance of Interface 2 in Model 1 and Model 2. It can be seen that for rougher Model 1, the thermal contact resistance decreases with an increase of pressure and heating power, and the thermal contact resistance of Model 2 is lower than that of Model 1, which is because Interface 2 of Model 2 has smoother contact surfaces than Model 1.

Figure 11: Thermal contact resistance at Interface 2
4.3 Effect of Surface Emissivity
Since the whole system is in a high-temperature environment, and thermal radiation is also one of the main heat transfer modes at the interface, it is necessary to consider the influence of different surface emissivity on the temperature of target metal. Fig. 12 shows the temperature of the upper surface of the target metal when Interface 1 applies different emissivity, and it can be seen from the figure that increasing the surface emissivity can enhance the interfacial heat transfer, but even if the emissivity finally reaches 0.9, the temperature of the target metal still exceeds the melting point, that is, the heat dissipation cannot match the need simply by increasing the surface emissivity.

Figure 12: The temperature of the target metal when Interface 1 with different surface emissivity at 3.5 kW of Model 2
4.4 Effect of Thermal Interface Materials
From the above analysis, it can be seen that when the pressure is increased to 1 MPa, the surface emissivity is increased to 0.9, and the heating power is 3.5 kW, the temperature of the target metal still exceeds the melting point, so the use of thermal interface materials must be considered to further reduce the thermal contact resistance.
In this section, we select three thermal interface materials (TIM) with thermal conductivity of 1, 10 and 50 W·m−1·K−1 to investigate the effect of TIM on the heat dissipation of the target metal when heating power is 5 kW.
Fig. 13 shows the temperature distribution of Model 2 when adding thermal interface material to Interface 1 and Interface 2, and the thermal conductivity of the TIM is 1 W·m−1·K−1. It can be seen that when the thermal interface material is added, the temperature on the upper surface of the target metal rapidly decreases to about 1000°C compared with the results in Fig. 12.

Figure 13: The temperature distribution of Model 2 when adding thermal interface material with thermal conductivity of 1 W·m−1·K−1 at 0.001 MPa
More detailed information can be found in Fig. 14. We can find that although the maximum temperature of the target metal decreases, the decrease extent is small, and the maximum temperature of the upper surface of the target metal is still more than 800°C by simply increasing the thermal conductivity of the thermal interface material to 50 W·m−1·K−1.
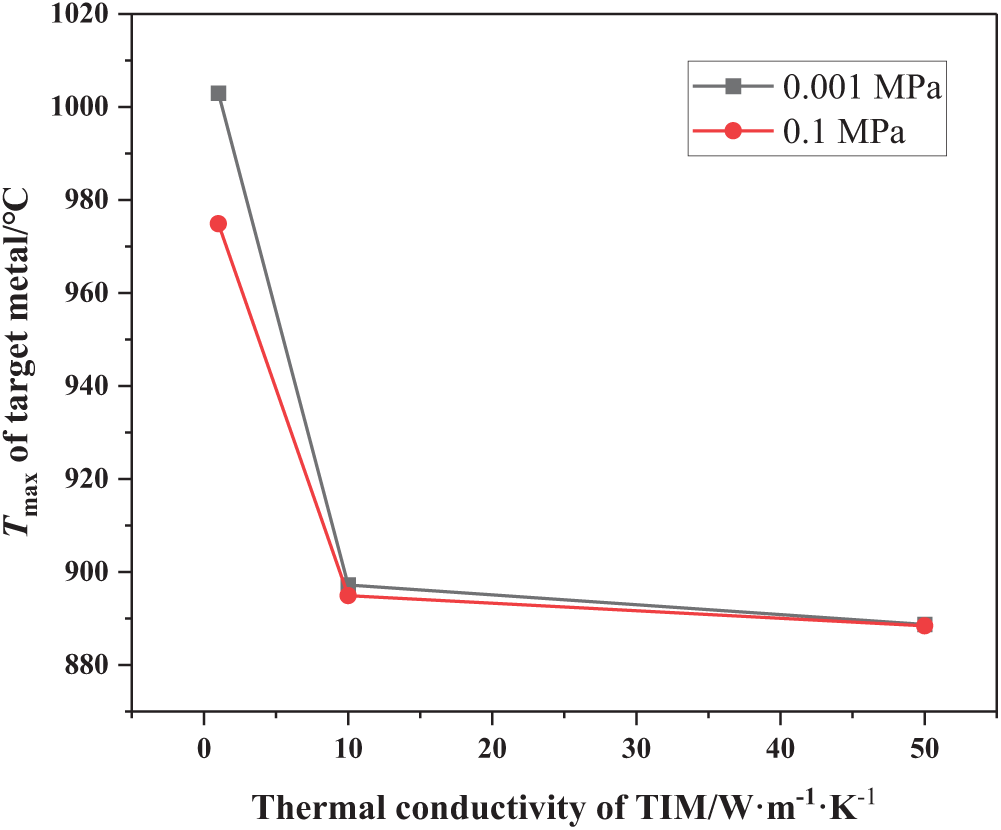
Figure 14: The temperature distribution of Model 2 when adding thermal interface material with different thermal conductivity
It is worth pointing out that the above results are obtained under the condition that the lower surface of the heat exchanger is set to be a constant wall temperature boundary condition, however, the actual lower surface of the heat exchanger is the convection boundary condition. To investigate the effect of the boundary conditions, we have made relevant calculations and set the convective heat transfer coefficient of the lower surface of the heat exchanger to different values, and the results are shown in Fig. 15. It can be seen in Fig. 15a that the temperature of the upper surface of the target is higher than that of the constant wall temperature. Fig. 15b demonstrates the temperature distribution of Model 2 when the thermal interface material is 50 W·m−1·K−1 and the convective heat transfer coefficient is 20,000 W·m−2·K−1. When we set the convective heat transfer coefficient to 40,000 W·m−2·K−1, the temperature distribution of Model 2 is shown in Fig. 15c, however, as can be seen from the figure, the maximum temperature of the target metal is still above 800°C.

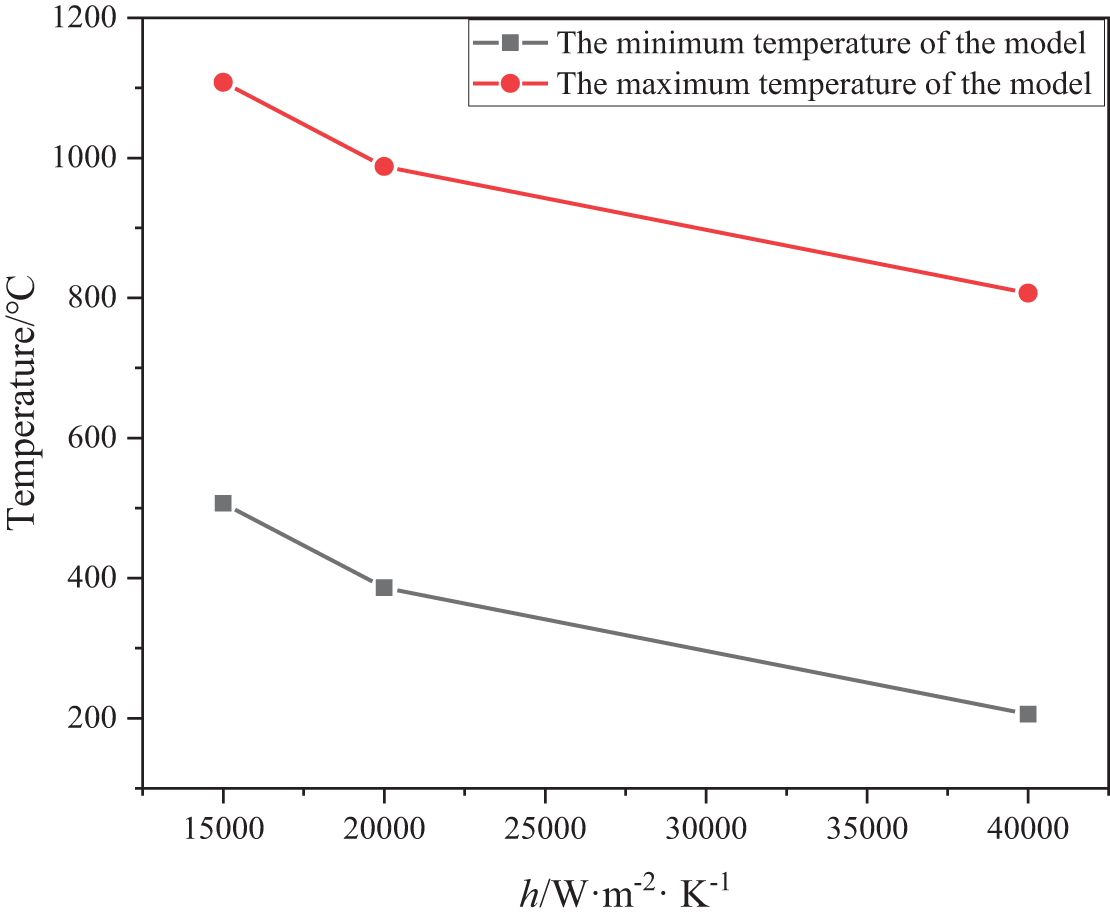
Figure 15: The temperature distribution of Model 2 on the lower surface of the heat exchanger with different convective heat transfer coefficients
This study employs a sequential thermo-mechanical coupling methodology to investigate thermal dissipation characteristics in a three-layer contact structure, with particular consideration of thermal contact resistance. The proposed numerical model systematically examines the synergistic effects of surface roughness, radiative emissivity, and thermal interface materials (TIMs) on heat transfer performance. Key findings are summarized as follows:
(1) While reducing surface roughness, enhancing contact pressure, and optimizing emissivity demonstrate measurable temperature reduction, the inherent limitations of these parametric adjustments result in persistent interfacial resistance, failing to meet operational cooling requirements.
(2) Implementation of high-performance TIMs with
(3) Compared with adding thermal interface material, the effect of increasing the efficiency of the heat dissipation is limited only by increasing the convective heat transfer coefficient.
Acknowledgement: Not applicable.
Funding Statement: This work was supported by the Natural Science Foundation of Shandong Province, China (No. ZR2023QE159).
Author Contributions: The authors confirm contribution to the paper as follows: Conceptualization, Xingjie Ren and Jianrong Zhang; methodology, Yaling Zhang; software, Xingjie Ren; validation, Qingfeng Tang, Heng Zhang and Yaling Zhang; formal analysis, Xingjie Ren; writing—original draft preparation, Xingjie Ren and Jianrong Zhang; writing—review and editing, Yaling Zhang; supervision, Yaling Zhang; project administration, Jianrong Zhang; funding acquisition, Xingjie Ren. All authors reviewed the results and approved the final version of the manuscript.
Availability of Data and Materials: Not applicable.
Ethics Approval: Not applicable.
Conflicts of Interest: The authors declare no conflicts of interest to report regarding the present study.
References
1. Sun D, You E, Zhang T, Xu J, Wang X, Ren X, et al. A review of thermal contact conductance research of conforming contact surfaces. Int Commun Heat Mass. 2024;159(1):108065. doi:10.1016/j.icheatmasstransfer.2024.108065. [Google Scholar] [CrossRef]
2. Wang X, Li H, Yao R, Lai W, Liu R, Yu R, et al. Thermal contact resistance optimization of press-pack IGBT device based on liquid metal thermal interface material. IEEE Trans Power Electron. 2022;37(5):5411–21. doi:10.1109/TPEL.2021.3129846. [Google Scholar] [CrossRef]
3. Hu J, Feng C, Shen B, Hu Z, Zhu F. Investigation regarding the influence of contact condition on the thermal contact resistance between copper and indium. IEEE Trans Electron Devices. 2021;68(8):4028–32. doi:10.1109/TED.2021.3084551. [Google Scholar] [CrossRef]
4. Gao G, Chen SY, Ai LQ, Liu N, Gou JJ, Gong CL. A thermal contact model encompassing near-field effects of multi-interface TEGs in hypersonic conditions. Int J Heat Mass Transf. 2023;216:124543. doi:10.1016/j.ijheatmasstransfer.2023.124543. [Google Scholar] [CrossRef]
5. Gao G, Li D, Gou JJ, Gong CL, Li SM. The quantitative study of interfacial contact effects in TEGs by real-topology-based simulations and novel indirect tests. Int J Heat Mass Transf. 2023;201:123579. doi:10.1016/j.ijheatmasstransfer.2022.123579. [Google Scholar] [CrossRef]
6. Greenwood J. A simplified elliptic model of rough surface contact. Wear. 2006;261(2):191–200. doi:10.1016/j.wear.2005.09.031. [Google Scholar] [CrossRef]
7. Wang HT, Liu YM, Cai YL, Liu ZH, Yang YW. Fractal analysis of the thermal contact conductance for mechanical interface. Int J Heat Mass Transf. 2021;169:120942. doi:10.1016/j.ijheatmasstransfer.2021.120942. [Google Scholar] [CrossRef]
8. Cheng Y, Wan ZP, Feng XM, Long YX. Fractal model of thermal contact conductance considering thermal stress and asperity interactions. Int J Heat Mass Transf. 2024;230(2):125787. doi:10.1016/j.ijheatmasstransfer.2024.125787. [Google Scholar] [CrossRef]
9. Sun XG, Meng CX, Duan TT. Fractal model of thermal contact conductance of two spherical joint surfaces considering friction coefficient. Ind Lubr Tribol. 2022;74(1):93–101. doi:10.1108/ilt-09-2021-0354. [Google Scholar] [CrossRef]
10. Sun XG. Thermal contact conductance model of rough surfaces with inclination based on three-dimensional fractal theory. Aircr Eng Aerosp Tec. 2024;96(2):265–72. doi:10.1108/aeat-02-2023-0054. [Google Scholar] [CrossRef]
11. Ren XJ, Dai YJ, Gou JJ, Tao WQ. Numerical study on thermal contact resistance of 8-harness satin woven pierced composite. Int J Therm Sci. 2021;159(4):106584. doi:10.1016/j.ijthermalsci.2020.106584. [Google Scholar] [CrossRef]
12. Zhang JH, Liu YL, Yan K, Fang B. A fractal model for predicting thermal contact conductance considering elasto-plastic deformation and base thermal resistances. J Mech Sci Technol. 2019;33(1):475–84. doi:10.1007/s12206-018-1247-9. [Google Scholar] [CrossRef]
13. Pawlus P, Reizer R, Wieczorowski M. A review of methods of random surface topography modeling. Tribol Int. 2020;152:106530. doi:10.1016/j.triboint.2020.106530. [Google Scholar] [CrossRef]
14. Frekers Y, Helmig T, Burghold EM, Kneer R. A numerical approach for investigating thermal contact conductance. Int J Therm Sci. 2017;121(5–6):45–54. doi:10.1016/j.ijthermalsci.2017.06.026. [Google Scholar] [CrossRef]
15. Gou JJ, Ren XJ, Dai YJ, Li S, Tao WQ. Study of thermal contact resistance of rough surfaces based on the practical topography. Comput Fluids. 2018;164(2):2–11. doi:10.1016/j.compfluid.2016.09.018. [Google Scholar] [CrossRef]
16. Madhusudana CV. Thermal contact conductance. New York, NY, USA: Springer; 2013. [Google Scholar]
17. Yovanovich MM. Four decades of research on thermal contact, gap, and joint resistance in microelectronics. IEEE T Compon Pack T. 2005;28(2):182–206. doi:10.1109/tcapt.2005.848483. [Google Scholar] [CrossRef]
18. Toptan A, Kropaczek DJ, Avramova MN. On the validity of the dilute gas assumption for gap conductance calculations in nuclear fuel performance codes. Nucl Eng Des. 2019;350(2):1–8. doi:10.1016/j.nucengdes.2019.04.042. [Google Scholar] [CrossRef]
19. Mesnyankin SY, Vikulov AG, Vikulov DG. Solid-solid thermal contact problems: current understanding. Phys-Uspekhi. 2009;52(9):891–914 doi:10.3367/ufne.0179.200909c.0945. [Google Scholar] [CrossRef]
20. Dai YJ, Gou JJ, Ren XJ, Bai F, Fang WZ, Tao WQ. A test-validated prediction model of thermal contact resistance for Ti-6Al-4V alloy. Appl Energ. 2018;228(7):1601–17. doi:10.1016/j.apenergy.2018.06.134. [Google Scholar] [CrossRef]
21. Ren X-J, Tang Q-F, Zhang H, Zhang J-R, Du M, Tao W-Q. Numerical study on the effect of thermal pad on enhancing interfacial heat transfer considering thermal contact resistance. Case Stud Therm Eng. 2023;49:103226. doi:10.1016/j.csite.2023.103226. [Google Scholar] [CrossRef]
Cite This Article
 Copyright © 2025 The Author(s). Published by Tech Science Press.
This work is licensed under a Creative Commons Attribution 4.0 International License , which permits unrestricted use, distribution, and reproduction in any medium, provided the original work is properly cited.
 Downloads
 Citation Tools