
 Submit a Paper
 Propose a Special lssue
 Open Access
ARTICLE

CFD Simulation and Thermal Performance Optimization of a Helical Coil Heat Exchanger in a Heating Furnace
School of Energy and Environmental Engineering, University of Science and Technology Beijing, Beijing, China
* Corresponding Author: Fuyong Su. Email:
(This article belongs to the Special Issue: Advances in Heat Exchanger Design, Performance, and Applications)
Frontiers in Heat and Mass Transfer 2026, 24(1), 11 https://doi.org/10.32604/fhmt.2026.076007
Received 12 November 2025; Accepted 13 January 2026; Issue published 28 February 2026
 View Full Text
 Download PDF
Abstract
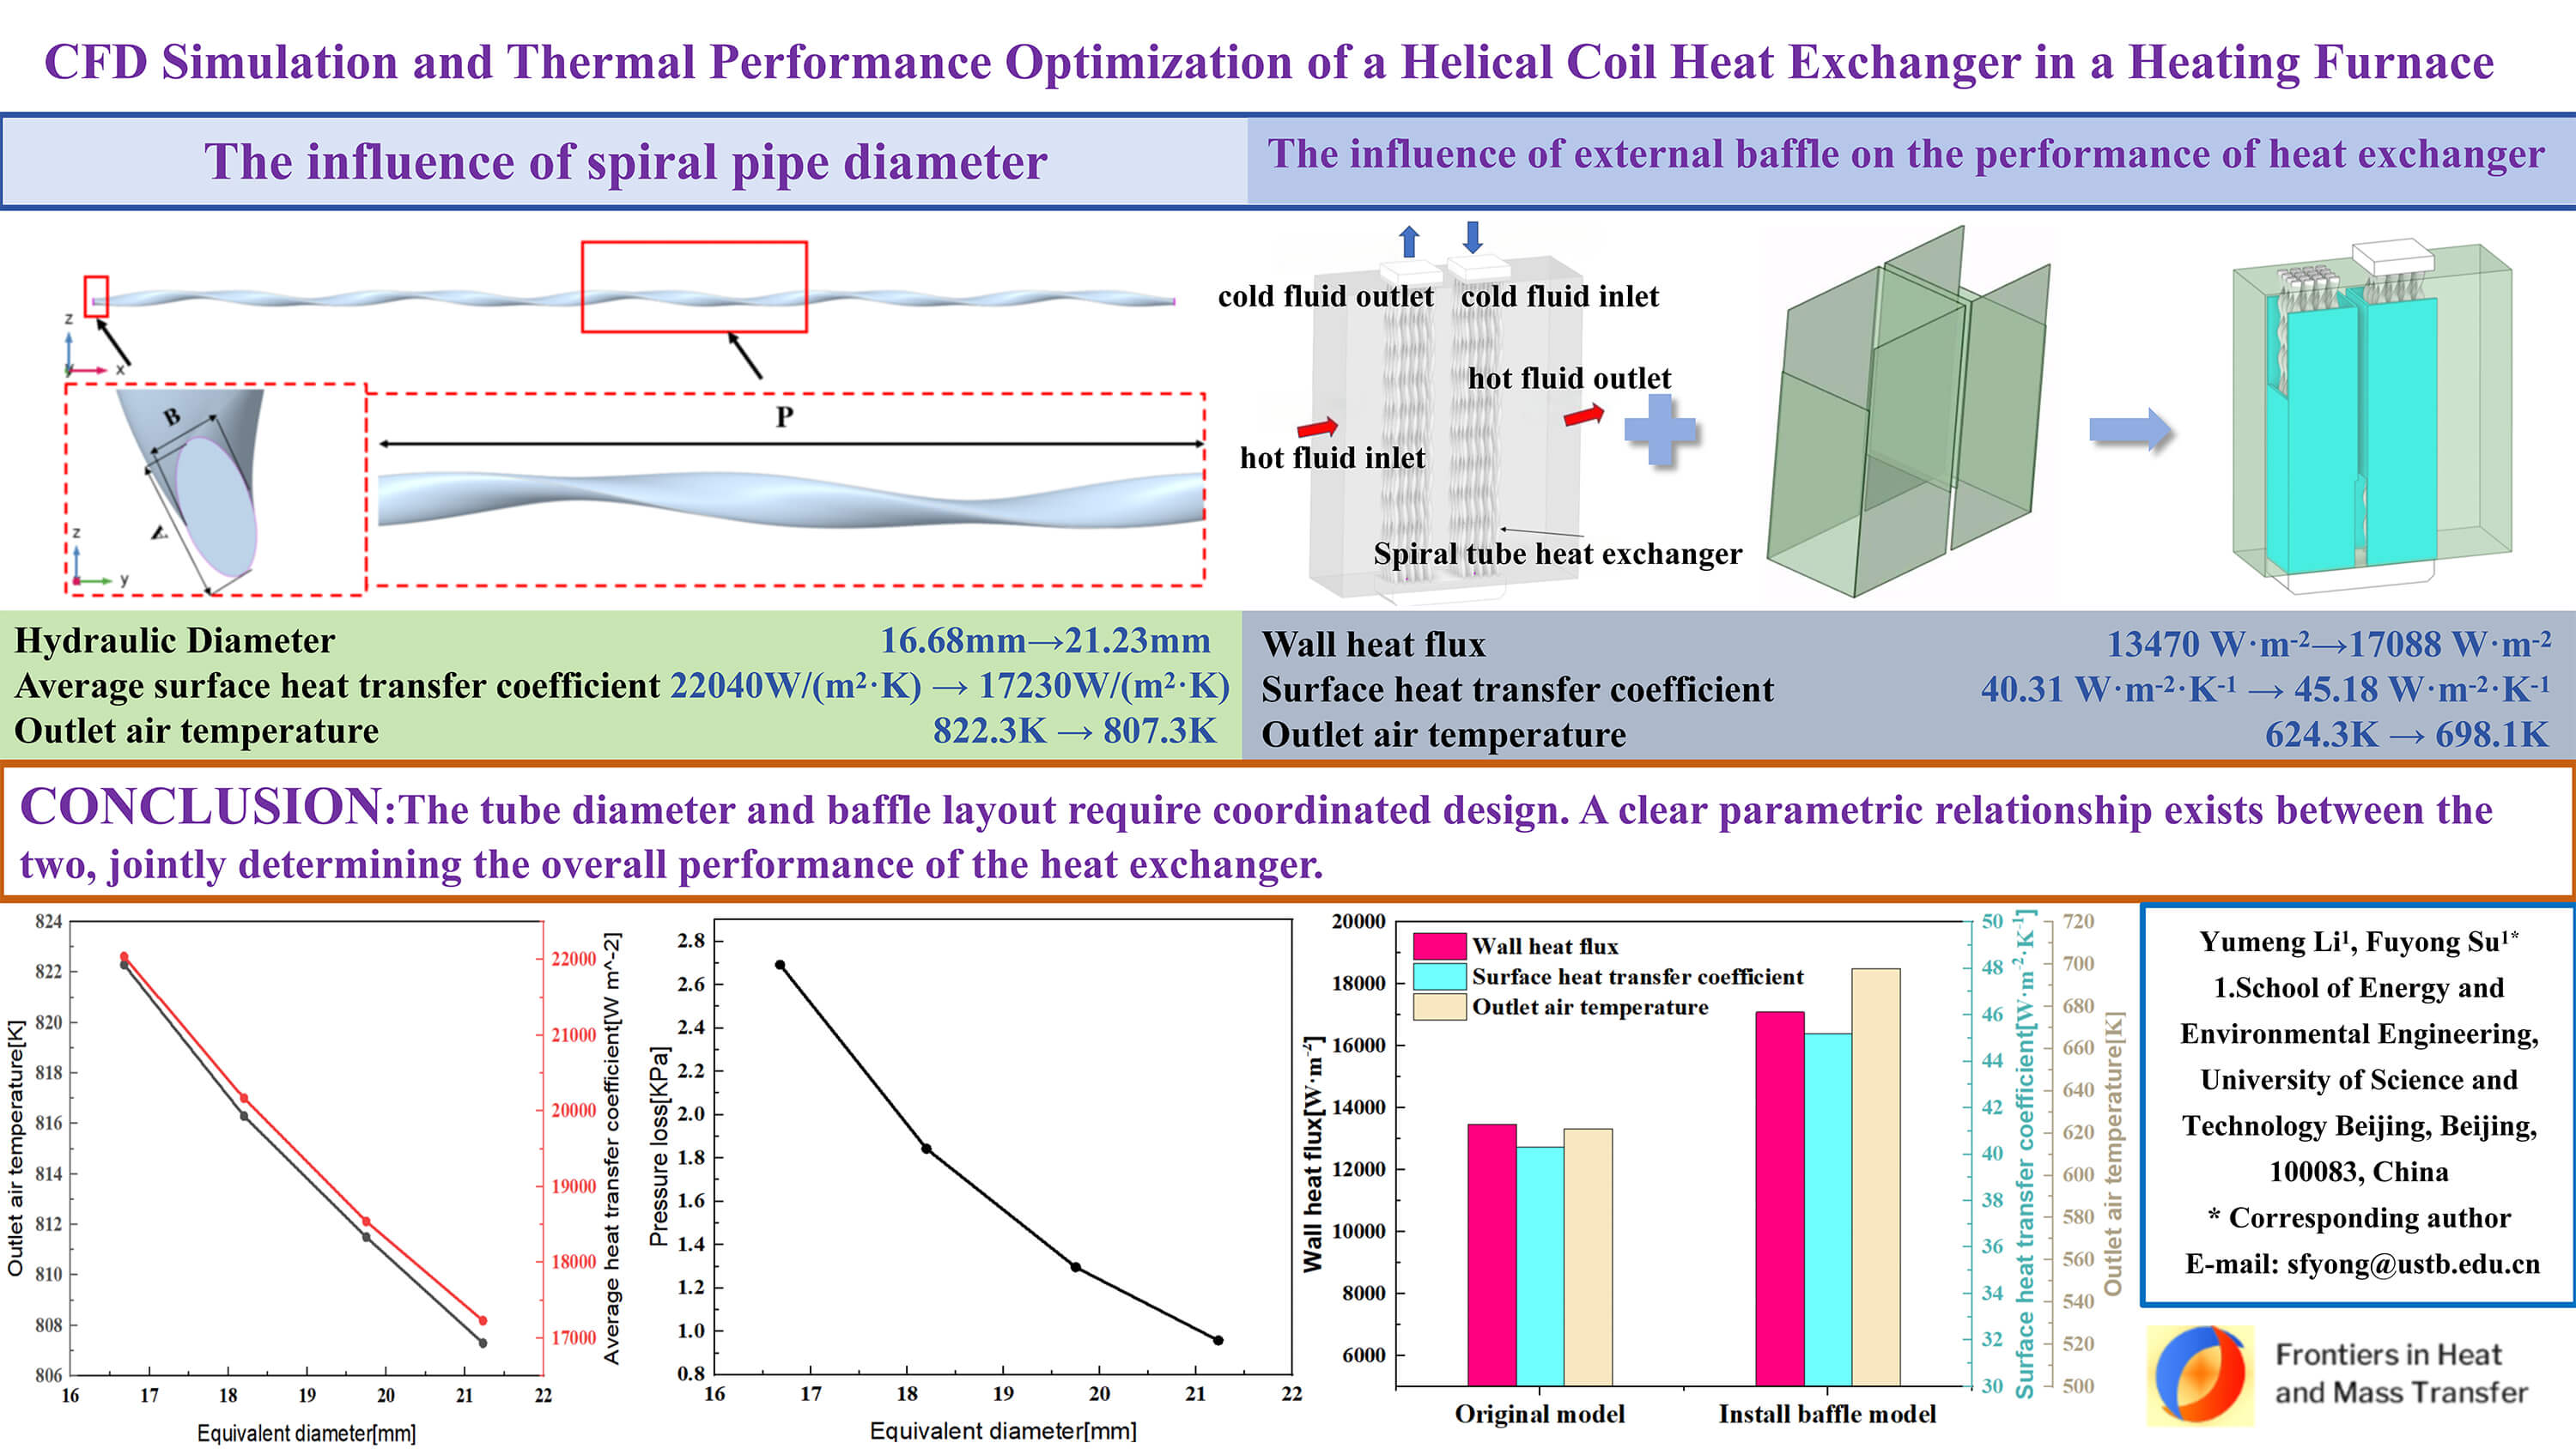
Based on the Fluent numerical simulation method, this study systematically analyzed the structural parameters of the spiral tube heat exchanger and the influence of the external baffle on its heat transfer performance. The results show that when the equivalent diameter of the spiral tube increased from 16.68 to 21.23 mm, its surface heat transfer coefficient decreased from 22,040 to 17,230 W/m2·K, and the outlet air temperature dropped from 822.3 to 807.3 K. However, the pressure loss decreased from 2.692 to 0.958 kPa. which reveals the contradiction between the heat transfer efficiency and the flow resistance. By adding a baffle to enhance the turbulent disturbance, the wall heat flux density is increased by 21.17%, the surface heat transfer coefficient is increased by 12.1%, and the outlet temperature is optimized, which verifies the significant improvement of the heat transfer performance by the countercurrent design. Comprehensive research shows that the collaborative optimization of spiral tube equivalent diameter parameters and baffle flow control is the key to improve the comprehensive performance of heat exchanger. The research results provide a theoretical basis for energy-saving design of industrial heat exchangers.Graphic Abstract
Keywords
In modern industrial production, the efficient utilization of energy and the performance optimization of heat exchange equipment have always been core issues in the field of industrial thermal engineering. As key equipment in industries such as petrochemicals and energy power [1–3], the thermal efficiency of heaters directly impacts production energy consumption and economic viability. Helical tube heat exchangers, with their compact structure, high heat transfer coefficient, and excellent pressure resistance, have become indispensable components in furnace systems. Further enhancing their heat transfer performance holds significant importance for achieving industrial energy conservation and consumption reduction [4–7].
In recent years, with the rapid development of computational fluid dynamics and enhanced heat transfer technologies, optimization research on helical tube heat exchangers has made progress in multiple aspects. Farnam et al. [8] conducted the first systematic investigation into the single-phase forced convective heat transfer characteristics of spiral twisted tubes in coil heat exchangers. Through integrated experimental and simulation studies, they clarified the influence patterns of spiral diameter and twist pitch on heat transfer and flow resistance. They demonstrated that within the laminar flow range, the twisted structure disrupts the development of the thermal boundary layer, enhancing the Nusselt number by up to 14.2%. Halawa and Tanious [9] further integrated elliptical cross-sections with twisted structures. Through numerical simulations, they revealed a synergistic enhancement mechanism between aspect ratio and torsional twist, achieving a 29.24% increase in average Nusselt number under specific parameters. They also systematically analyzed the variation range of thermohydraulic performance indices, offering new insights for spiral tube structural innovation. Additionally, researchers have explored tube bundle arrangement, external fin configuration, and nanofluid applications to continuously expand performance enhancement pathways [10–13].
However, existing studies exhibit several limitations: most literature focuses on isolated analysis of internal flow and heat transfer characteristics, with insufficient attention to synergistic optimization of external flow field organization and overall heat exchanger configuration; The coupling mechanism between helical tube parameters (e.g., tube diameter, pitch) and external flow control devices (e.g., baffles) remains unclear. Furthermore, the applicability of these designs to practical industrial scenarios—such as high-temperature flue gas-air heat exchange involving significant temperature gradients and complex boundary conditions—needs further validation [14,15].
This study addresses issues such as low heat transfer efficiency and uneven flow distribution by proposing solutions through spiral tube diameter optimization and baffle design. By establishing a three-dimensional numerical model encompassing both the tube bundle and shell side, this study systematically analyzes the influence mechanism of the equivalent diameter of spiral tubes on heat transfer and pressure drop. It also investigates the regulatory effect of externally added baffles on flue gas flow paths and their heat transfer enhancement capabilities. This research aims to clarify the interaction between structural parameters and flow organization, providing an optimization basis for industrial heat exchanger design that balances heat transfer enhancement and flow resistance. This advancement will drive the development of heat exchangers toward greater efficiency, lower resistance, and integration.
Flow and heat transfer in nature are now ubiquitous. Turbulent fluid is dominated by the law of physical conservation in the flow process. The basic conservation laws include mass conservation law, momentum conservation law and energy conservation law. These three conservation equations are applied to the mathematical expression of the flow in the shell side of the spiral tube heat exchanger. Mass conservation equation:
In this paper, the fluid flow adopts steady-state flow, in which
Momentum conservation equation:
Energy conservation equation:
Here
Turbulence is a flow state of the fluid itself, rather than a fluid property. The flow state includes laminar flow, transition flow and turbulence. The fluid is in irregular motion, and the velocity perpendicular to the axial velocity is produced, which is called turbulence. Turbulence phenomenon is common in the process of fluid flow. At present, numerical simulation methods have been widely used in turbulent flow analysis. There are five kinds of turbulence models in Fluent software, which are Spalart-Allmaras model, k-ε model and k-ω model. Among these, the renormalization group k-ε model (RNG k-ε) demonstrates adaptability to high strain rates and streamline-bending flows by modifying turbulent viscosity. The SST k-ω model, combining the strengths of both k-ε and k-ω models, performs well during the transition between near-wall and free-flow regions, particularly excelling in flows with strong reverse pressure gradients and separation. Fluid flow within helical pipes exhibits distinct three-dimensional rotational and secondary flow characteristics, particularly in regions of high curvature where vortex structures such as Dean vortices readily form. This type of flow simultaneously involves strong curvature effects, rotational flow, and boundary layer separation, placing high demands on the predictive capability of turbulence models. The Realizable k-ε model incorporates two key improvements over the standard k-ε model: First, it introduces constraints to the turbulent viscosity formula, ensuring physical consistency between Reynolds stresses and strain rates. Second, it includes rotational and curvature correction terms in the ε equation, significantly enhancing prediction accuracy for rotating flows, high pressure gradient flows, and secondary flows. Multiple studies demonstrate that the Realizable k-ε model more accurately reproduces velocity distributions, temperature fields, and Nusselt number variations when simulating turbulence in spiral tubes, bent pipes, and rotating equipment. It is particularly well-suited for capturing the complex swirling flow and enhanced heat transfer processes induced by the helically twisted tubes in this study. Therefore, selecting this model effectively captures the turbulent structures and heat transfer mechanisms within the spiral tube heat exchanger, providing reliable numerical basis for subsequent performance optimization [16–18].
The transport equations for k and ε in the Realizable k-ε model are as follows:
Turbulent kinetic energy k equation:
The dissipation rate ε equation is:
where
In these equations,
Helically twisted tubes are highly efficient heat transfer elements whose manufacturing process involves two primary steps: flattening and twisting. First, ordinary round tubes are flattened into an elliptical cross-section, then twisted helically along the axial direction to form a continuous helical surface structure longitudinally. The axial distance corresponding to a 360° rotation of the end face along the tube axis is defined as the pitch P. In engineering design, heat transfer performance and flow resistance can be optimized by adjusting the ratio A/B of the major to minor axes of the elliptical cross-section and the pitch P.
The spiral twisted tube heat exchanger studied in this paper consists of 32 spiral twisted tubes arranged in a 4 × 4 configuration, with 16 tubes each on the inlet and outlet sides. The spiral twisted tubes are formed by flattening and twisting circular tubes with an initial outer diameter D0 = 10 mm. The flattened elliptical cross-section has a major axis A = 15 mm and a minor axis B = 6.5 mm. The flattening ratio (flattening rate) η = B/A ≈ 0.433. with a pitch P = 200 mm. This corresponds to a twist angle per unit length of 360°/P = 1.8°/mm. The equivalent diameter De is calculated using the hydraulic diameter formula for an elliptical cross-section:
The tube bundle employs a support structure without baffle plates, as illustrated in Fig. 1.
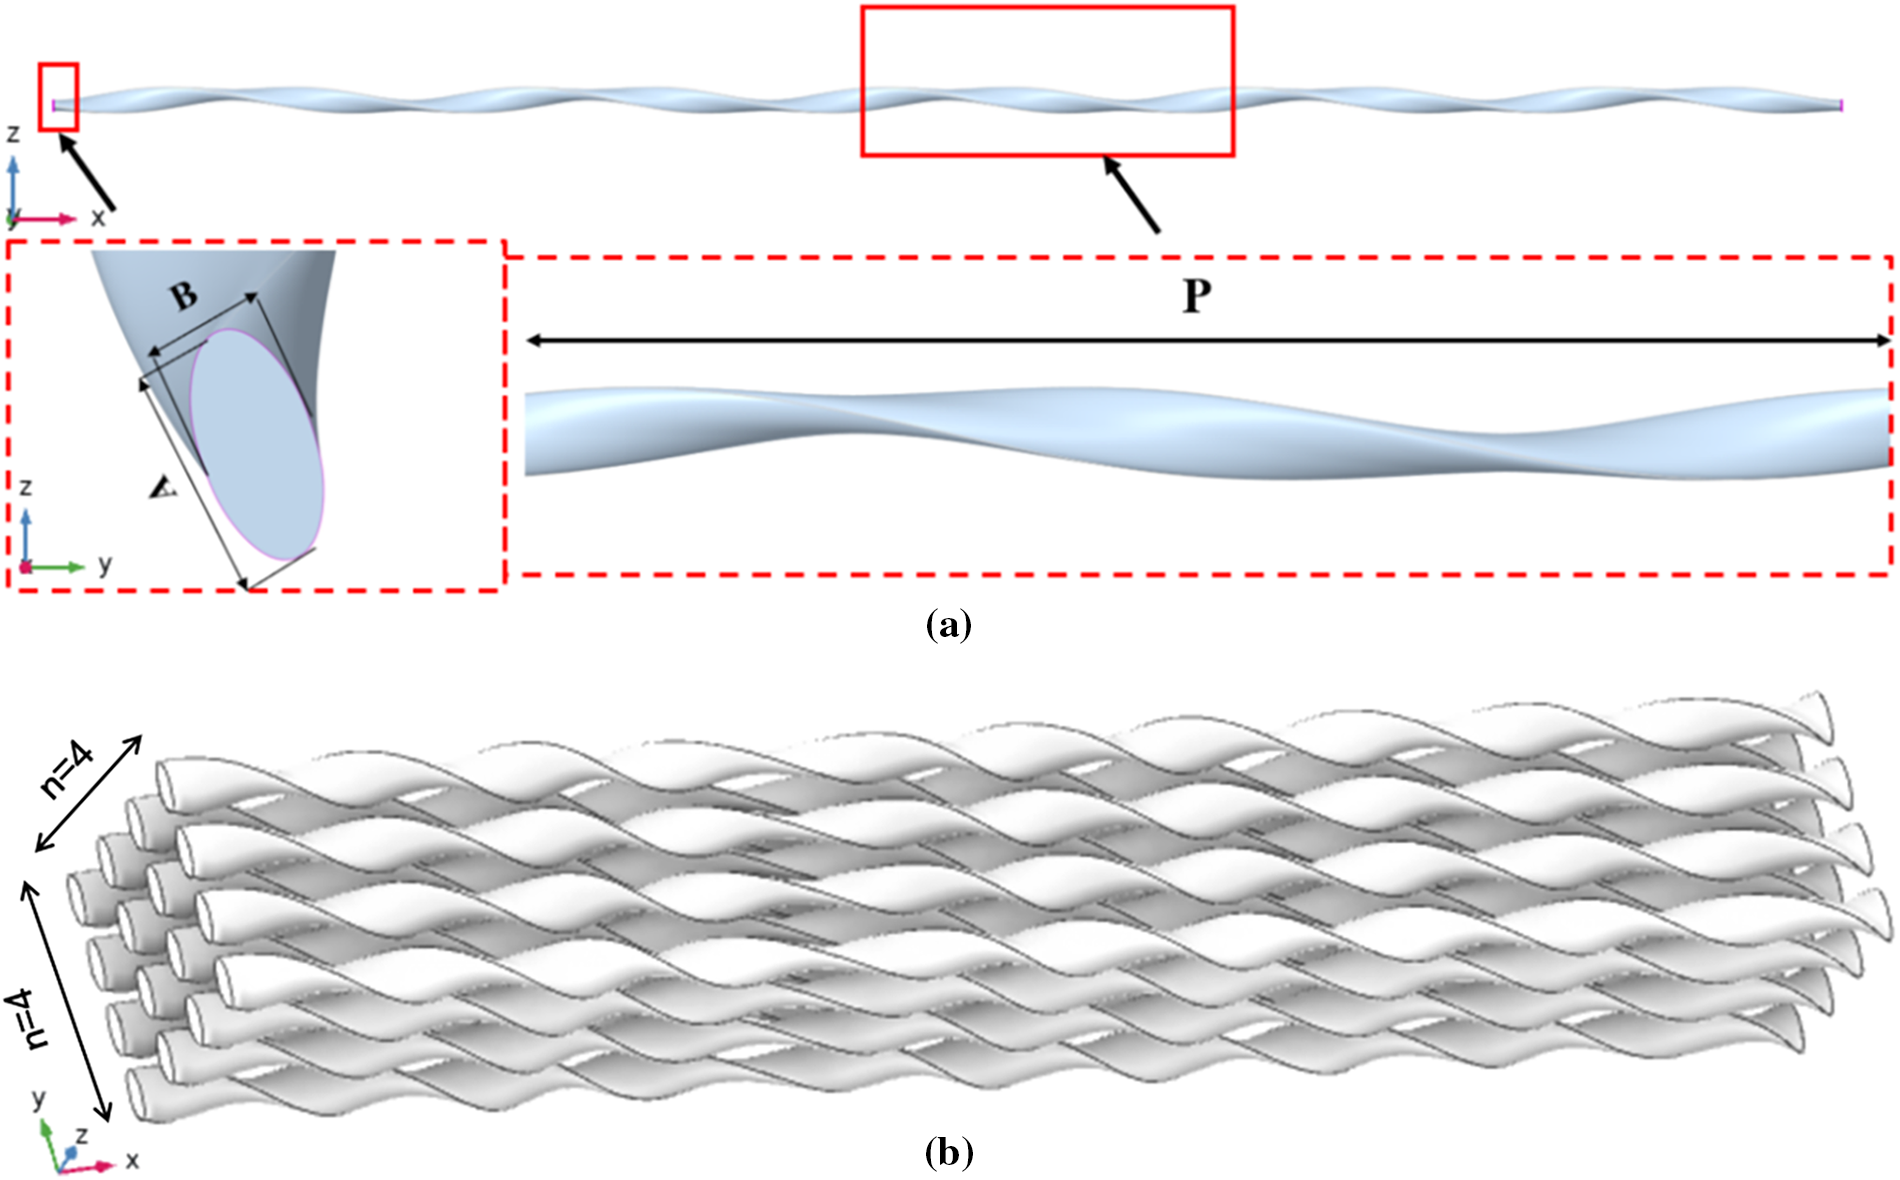
Figure 1: Structure diagram of spiral tube and spiral tube bundle. (a) Spiral tube structure; (b) Schematic diagram of spiral tube bundle.
2.3 Grid Division and Grid Independence Verification
As the number of grids increases, the time required for calculation increases, and convergence becomes more difficult. The number and quality of grids are different, and the results obtained at the final convergence will also be biased. Through grid independence verification, it is necessary to reduce the complexity of the calculation as much as possible while ensuring the accuracy of the calculation. In this calculation, the number of grids 1.01 × 10⁶, 2.05 × 10⁶, 2.98 × 10⁶ and 3.99 × 10⁶ were selected for verification. The average air temperature at the outlet was used as the index, and the simulation results were compared with the production data of the heating furnace, as shown in Fig. 2.
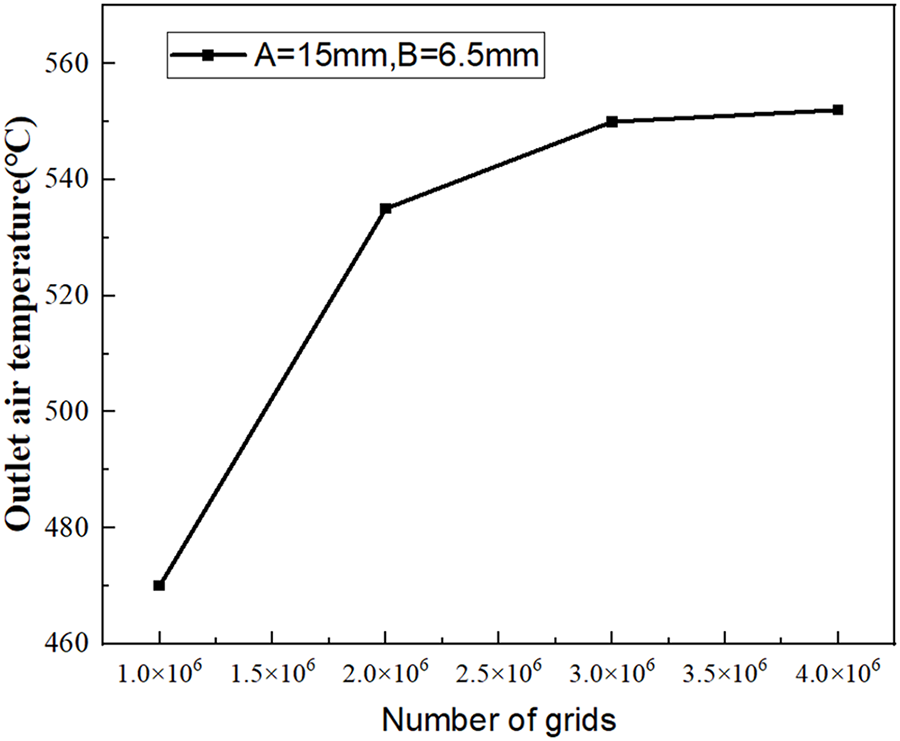
Figure 2: Verification of grid independence.
When the number of grids is less than 3.00 × 10⁶, the air outlet temperature increases from 470°C to 552°C. This significant jump indicates that the 1.01 × 10⁶ grid is too coarse to resolve the complex secondary flow (Dean vortex) near the spiral tube and the velocity and temperature boundary layers near the tube wall. This results in a severe underestimation of convective heat transfer, rendering the calculated outlet temperature unreliable. When the grid is increased to 4.00 × 10⁶, The calculated outlet temperature (approximately 553.2°C) exhibits a relative change rate below 0.22% compared to the reference value of approximately 552.0°C. Furthermore, the deviation from actual production data remains within the engineering tolerance limit (<2%). Based on the above analysis, it is determined that the mesh density of 3.99 × 10⁶ satisfies the mesh independence requirement. That is, further increasing the number of meshes has a negligible impact on the core calculation result (outlet temperature). Therefore, this mesh scheme is ultimately selected for all subsequent numerical simulations in this study to balance computational efficiency while ensuring calculation accuracy.
As shown in Fig. 3, a 6-layer boundary layer grid is set up. The maximum deviation of the surface grid is 0.42, and the maximum mass of the generated volume grid is 0.85. The outer side of the pipe grid is a polyhedron grid, and the inner side is a regular hexahedral structure.
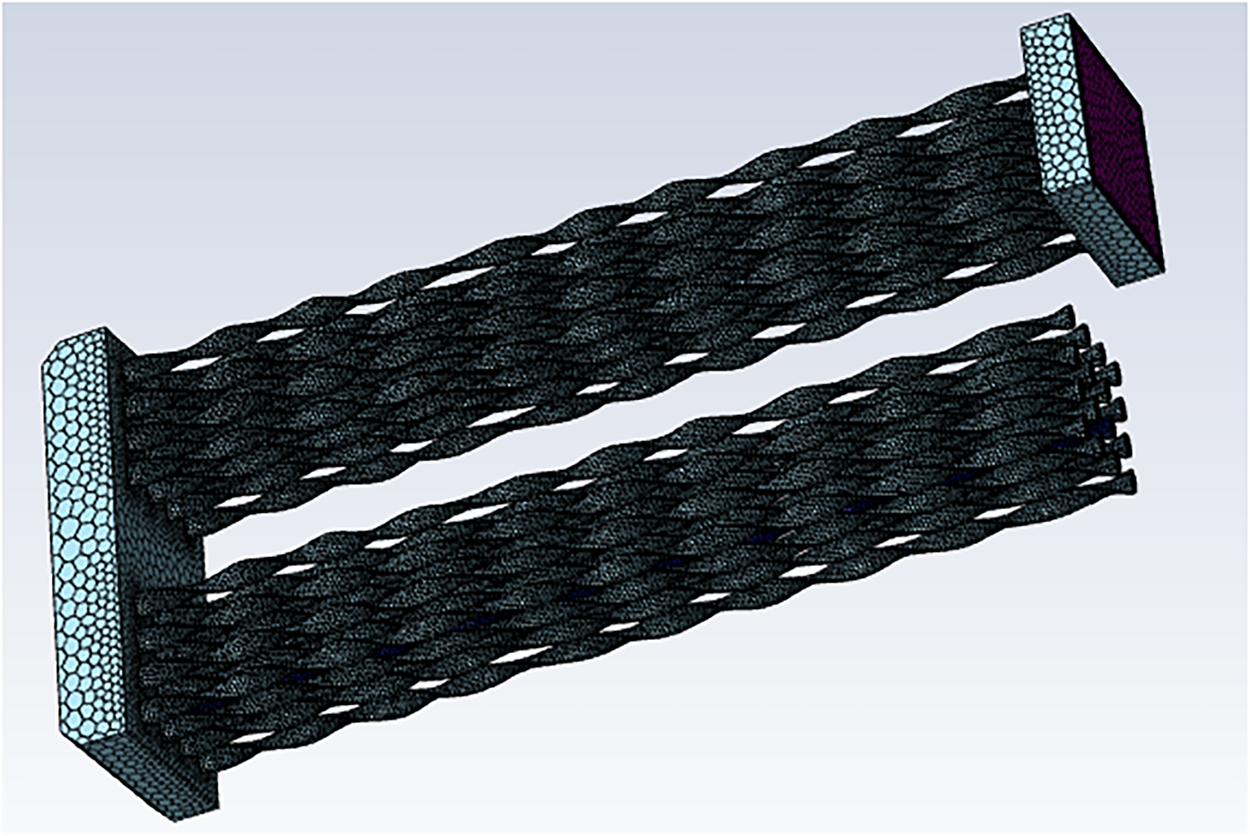
Figure 3: Grid diagram.
2.4 Basic Assumptions and Boundary Conditions
The numerical model established in this study is based on the following core assumptions:
(1) Steady-State Assumption: Although the governing equations include time terms (in a general form), this study focuses on steady-state heat transfer and flow performance under design conditions. Therefore, all time derivatives are set to zero (∂/∂t = 0), and the simulation solves for time-independent steady-state solutions.
(2) Fluid Properties Assumption: Air and flue gas are treated as incompressible ideal gases. Their physical properties (density, viscosity, specific heat capacity, thermal conductivity) are defined as functions of temperature, while the effects of pressure variations are neglected.
(3) Flow State Assumption: The flow field is assumed to be fully developed turbulence. The influence of laminar flow and transitional flow regions is disregarded. The Reynolds-Averaged Navier-Stokes (RANS) equations are employed for closure.
(4) Radiation and Natural Convection Assumptions: Given that forced convection is the primary heat transfer mechanism and flue gas temperatures do not exceed 1200 K, the model neglects radiation heat transfer and natural convection induced by buoyancy forces.
(5) Wall Condition Assumptions: All solid walls are defined with no-slip boundary conditions. When investigating the influence of pipe diameter (Section 3), the pipe wall was treated as a constant-temperature surface rather than a true conjugate heat transfer to simplify and isolate variables.
(6) Geometry and Operational Assumptions: The model geometry is idealized, neglecting the effects of manufacturing tolerances, welds, and surface roughness changes due to long-term operation-induced soot deposition and corrosion.
To enhance heat transfer efficiency, this heat exchanger employs a “semi-counterflow” flow arrangement. As shown in Fig. 4, the overall flow directions of the hot and cold fluids are largely opposite, though not strictly counterflow at every local section. Specifically: Cold air (air) within the tubes follows this path: Enters from the inlet tube bundle. Flows through the first pass of straight tubes. Turns direction in the bottom connecting chamber. Then flows into the outlet tube bundle for final discharge. The hot fluid (flue gas) outside the tubes enters laterally from one side of the heat exchanger shell, sweeps around the entire tube bundle, and exits from the opposite side. This arrangement maintains counter-current flow between the hot and cold fluids across most of the heat transfer area, thereby sustaining a high logarithmic mean temperature difference (LMTD). This is a key design feature for achieving high-efficiency heat transfer.
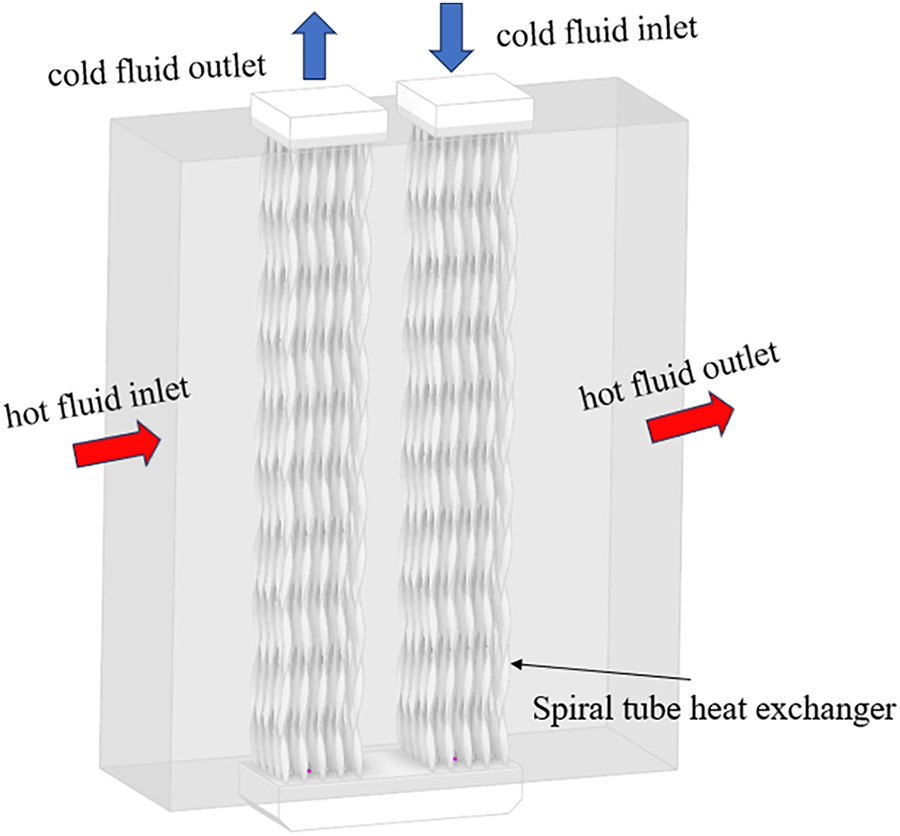
Figure 4: Boundary condition description diagram.
The numerical simulation boundary conditions were set according to actual operating conditions, with specific values as follows: Inlet: Configured as a velocity inlet. Velocity set to 2 m/s, temperature to 298.15 K. Turbulence intensity estimated based on hydraulic diameter and set to 5%. Outlet configured as pressure inlet with gauge pressure of 0 Pa. Outer-flow heat transfer modeled under constant wall temperature conditions, where all spiral tube wall temperatures are fixed at 873.15 K. When investigating the effect of externally added baffles, a complete flue gas external flow model is established. The flue gas inlet is set as a velocity inlet with a flow velocity of 0.5 m/s and a temperature of 1073.15 K. The outlet is set as a pressure outlet. Both the inner and outer tube surfaces are configured as coupled surfaces to enable fluid-solid conjugate heat transfer calculations between the fluid domain and the solid domain. The solver employed a pressure-based steady-state solver, utilizing the SIMPLE algorithm for pressure-velocity coupling. A second-order upwind scheme was applied to all equations (momentum, energy, turbulence) to enhance accuracy. Residual convergence criteria were set to 10−6 (energy equation) and 10−5 (other equations).
We will delve into the validation of simulation results. This section is crucial for ensuring the validity and reliability of the entire study. Accurately simulating real-world phenomena forms the foundation of simulation research, and verifying whether these results authentically reflect actual conditions is a critical step. This chapter will detail the validation methods employed, the evaluation criteria used, and how comparative analysis ensures the simulation model outputs possess high credibility. This validation process demonstrates the scientific rigor and practical applicability of the simulation results, providing a solid foundation for subsequent analyses and conclusions based on these findings.
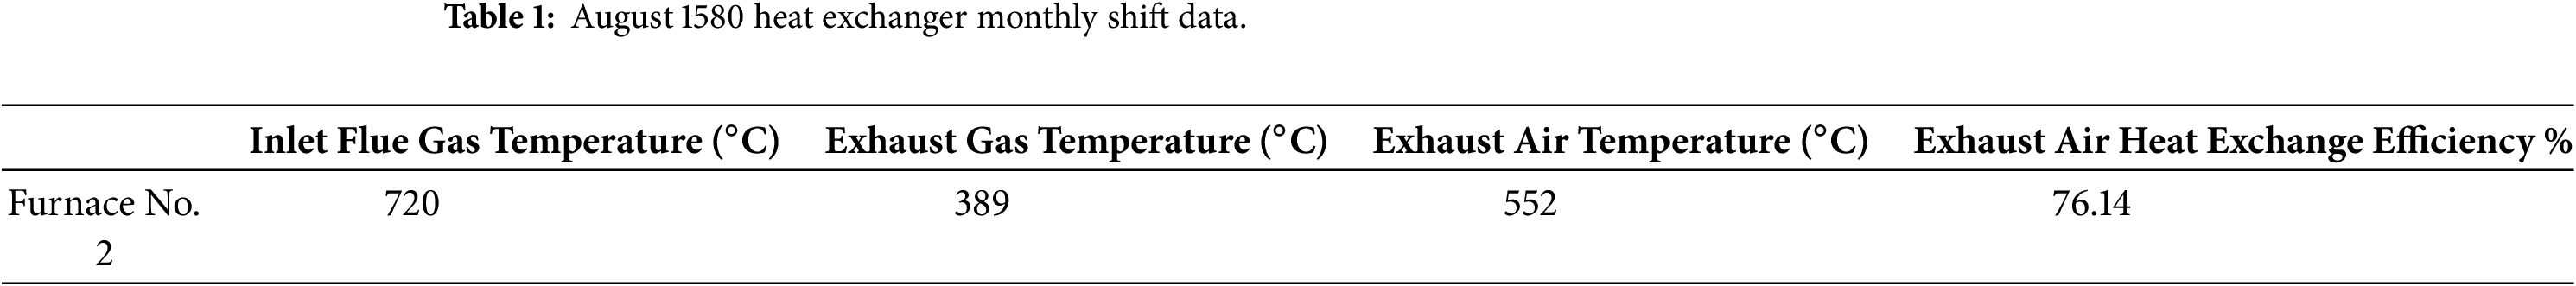
The validation of simulation results was conducted by comparing them with production data from the 1580 production line. This line utilizes four cylindrical tube heat exchangers, each with distinct heat transfer efficiencies and thermal loads. Production data for Furnace No. 2 during August is presented in the Table 1 below.
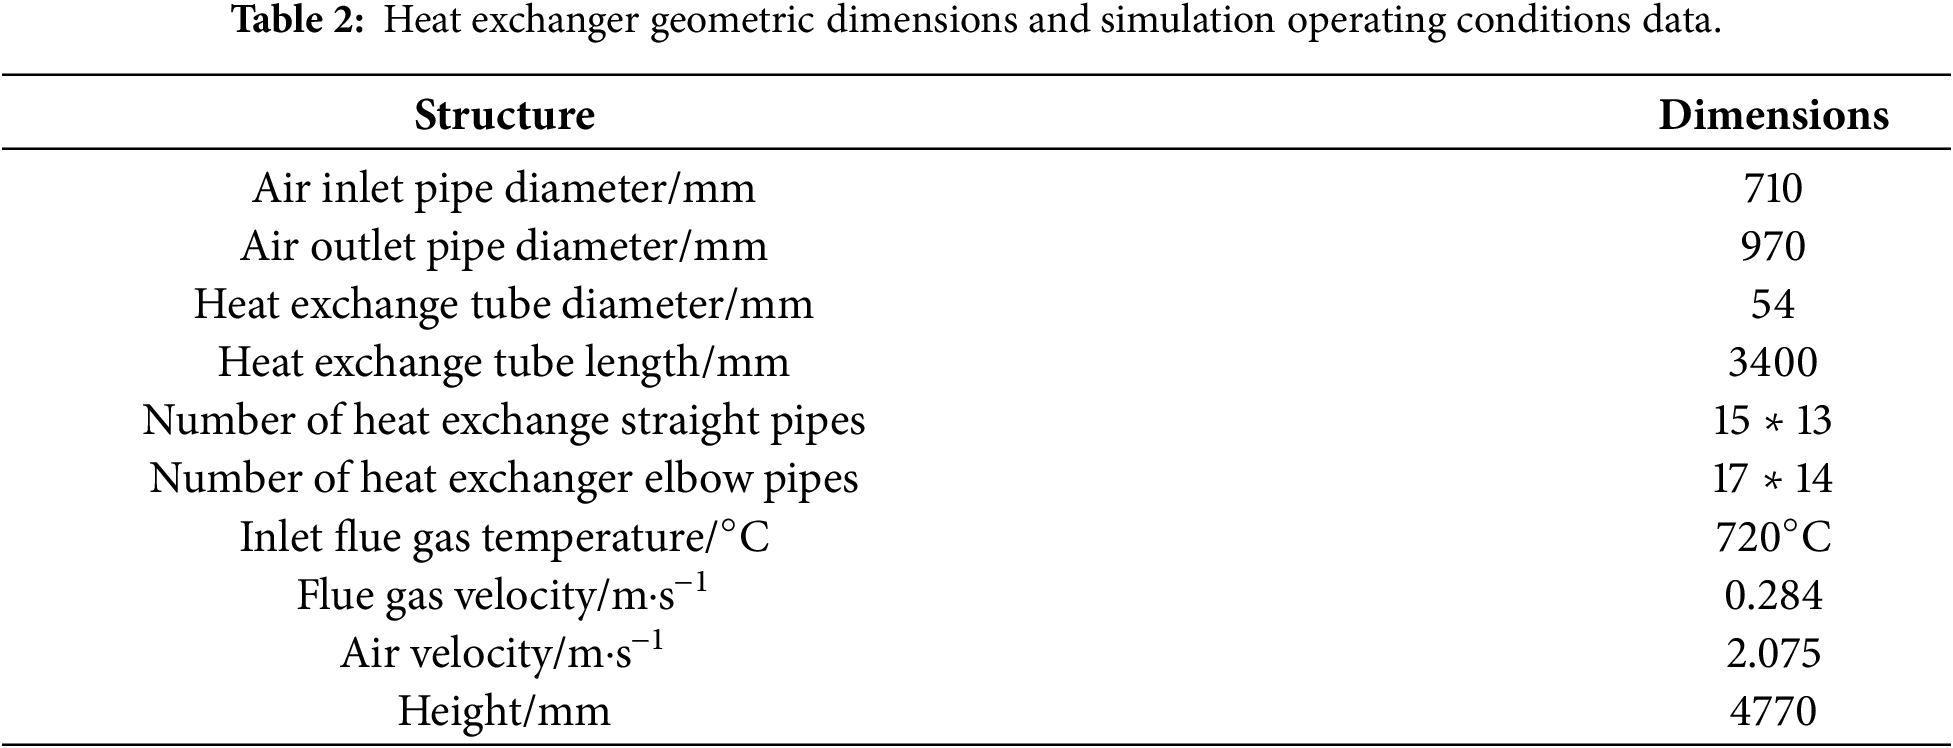
The model dimensions and operating conditions selected for the simulation are shown in the Table 2 below.
The physical model of the tube-type heat exchanger is shown in Fig. 5, and the simulation results are shown in Figs. 6 and 7.
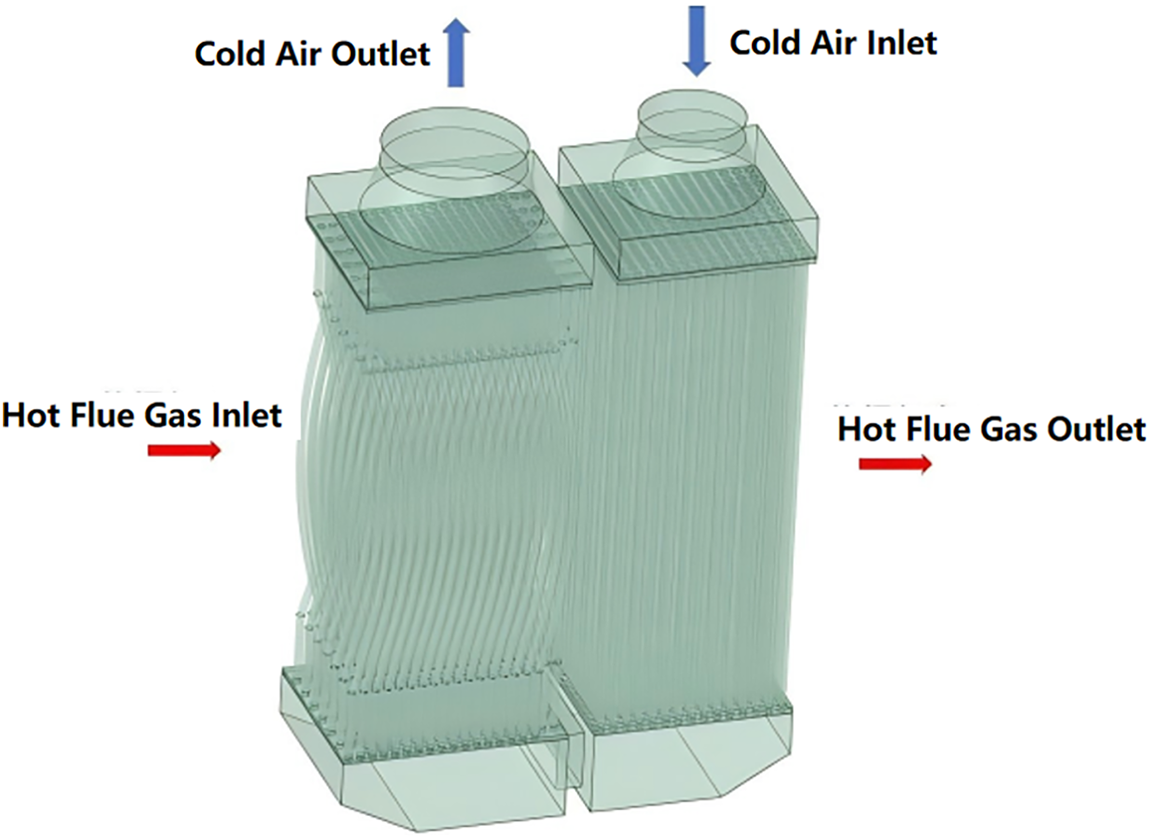
Figure 5: Physical model of a tube-type heat exchanger.
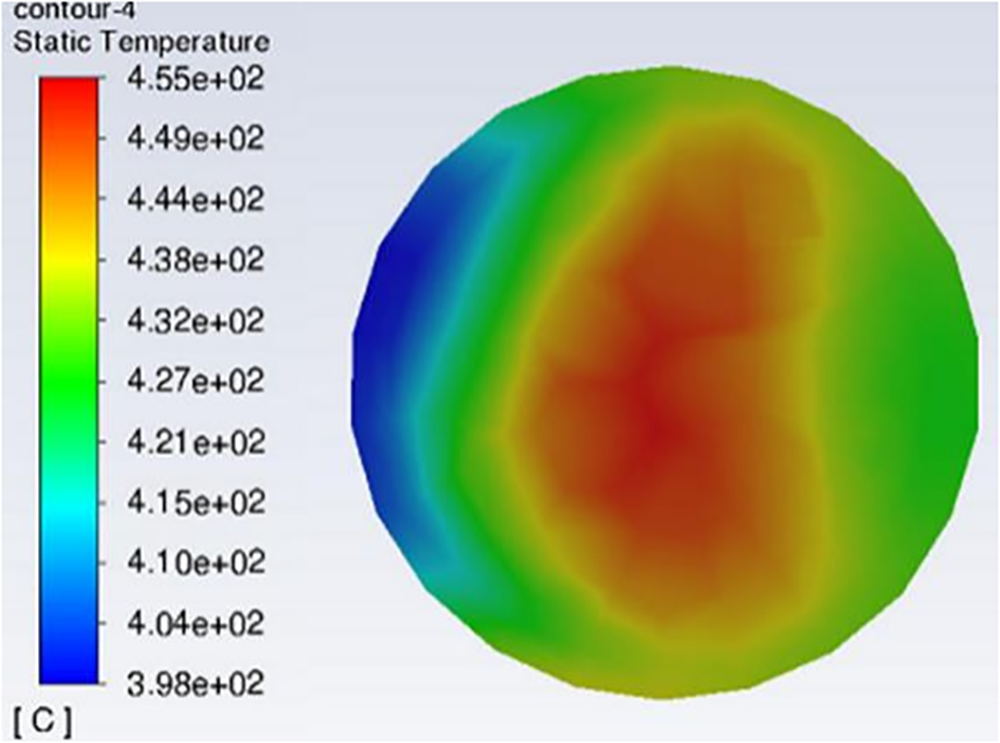
Figure 6: Air outlet temperature contour map.
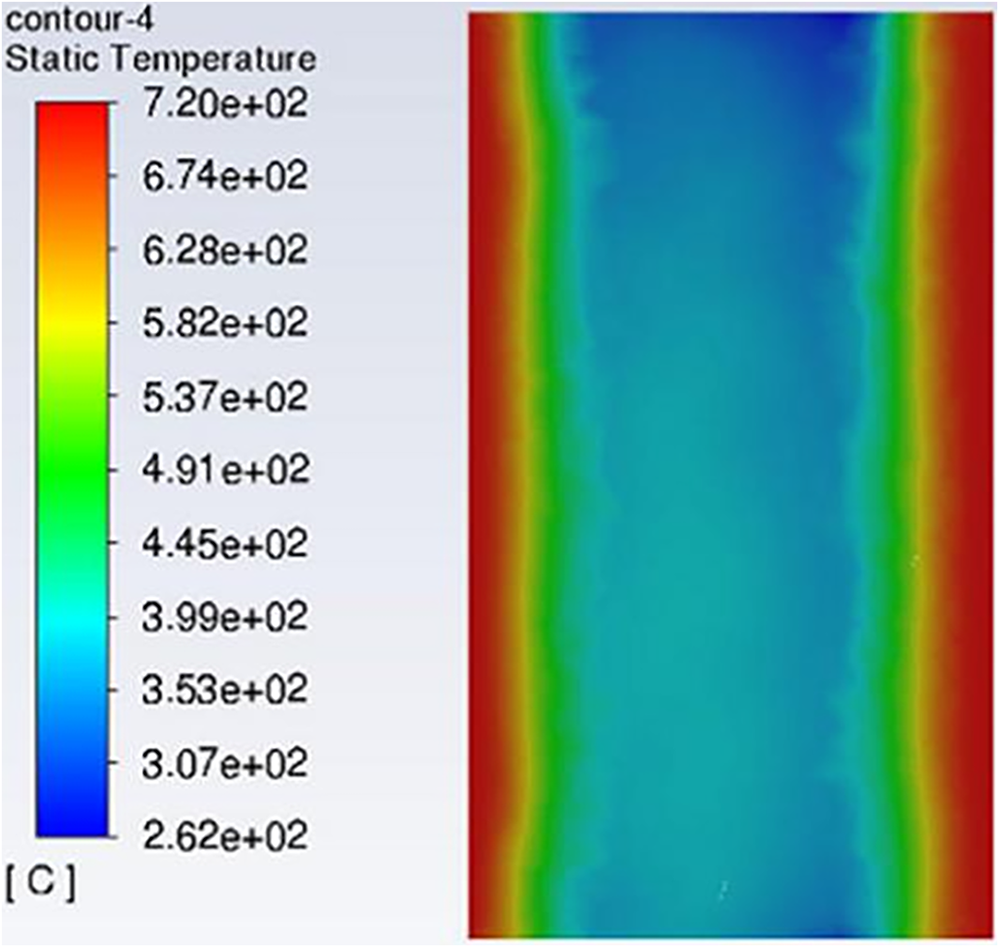
Figure 7: Flue gas outlet temperature.
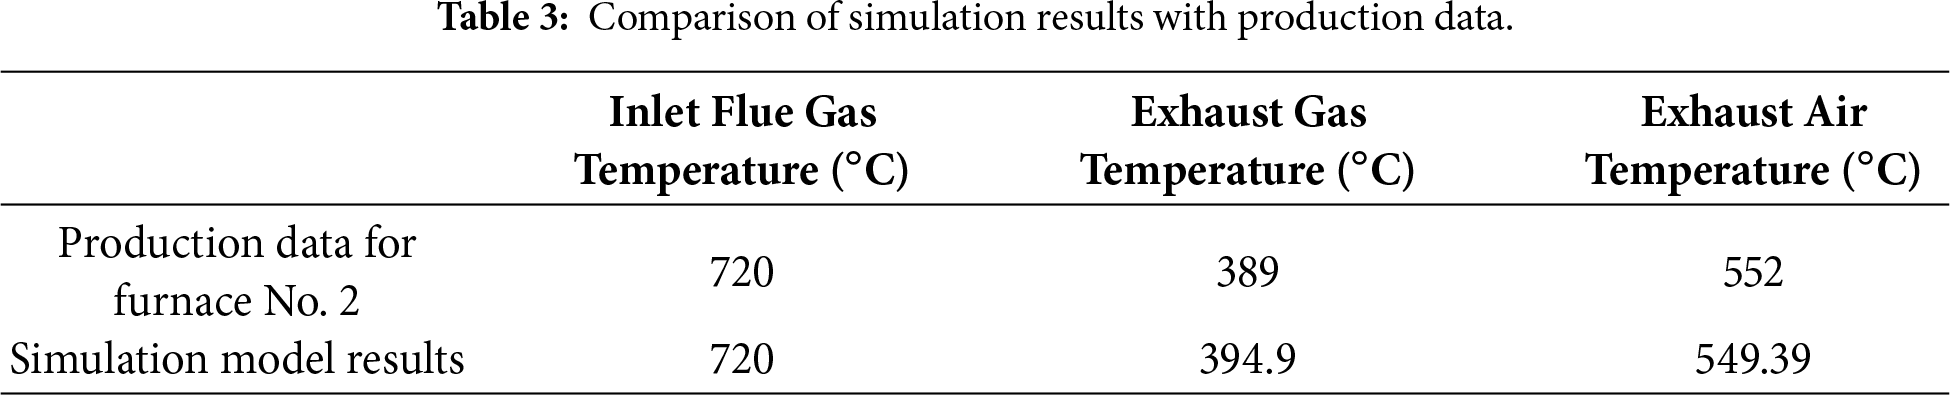
Table 3 presents a comparison between actual production data and simulation model results for Furnace No. 2. These data include inlet flue gas temperature, outlet flue gas temperature, and outlet air temperature—parameters critical for evaluating heat exchanger performance. The table reveals that the simulation model perfectly matches the actual production data for predicting inlet flue gas temperature, with no deviation. This indicates the model’s high accuracy in simulating initial conditions. For outlet flue gas temperature and outlet air temperature, the simulation results exhibit deviations of 1.49% and 0.48%, respectively, from the actual data. These errors fall within acceptable ranges, further validating the reliability of the simulation model.
3 The Influence of Spiral Pipe Diameter
The geometric dimensions of spiral tubes are the core design variables determining their heat transfer and flow resistance performance. To systematically investigate the influence of tube diameter and ensure the research conclusions possess engineering guidance value, this study referenced commonly used industrial heat exchange tube specifications (such as GB/T 24590-2021 “Special-Shaped Tubes for High-Efficiency Heat Exchangers”) and the typical dimensional ranges found in similar spiral tube optimization literature. Based on this, a representative set of elliptical-section spiral tubes was selected. By fixing the ratio of their major to minor axes (A/B ≈ 2.31) and pitch (P = 200 mm), the equivalent diameter was systematically varied. The four selected dimensions cover typical operating conditions ranging from small diameters (enhanced heat transfer, high flow resistance) to large diameters (reduced flow resistance, weakened heat transfer), aiming to reveal patterns in diameter variation. Specific dimensional parameters are shown in Table 4.
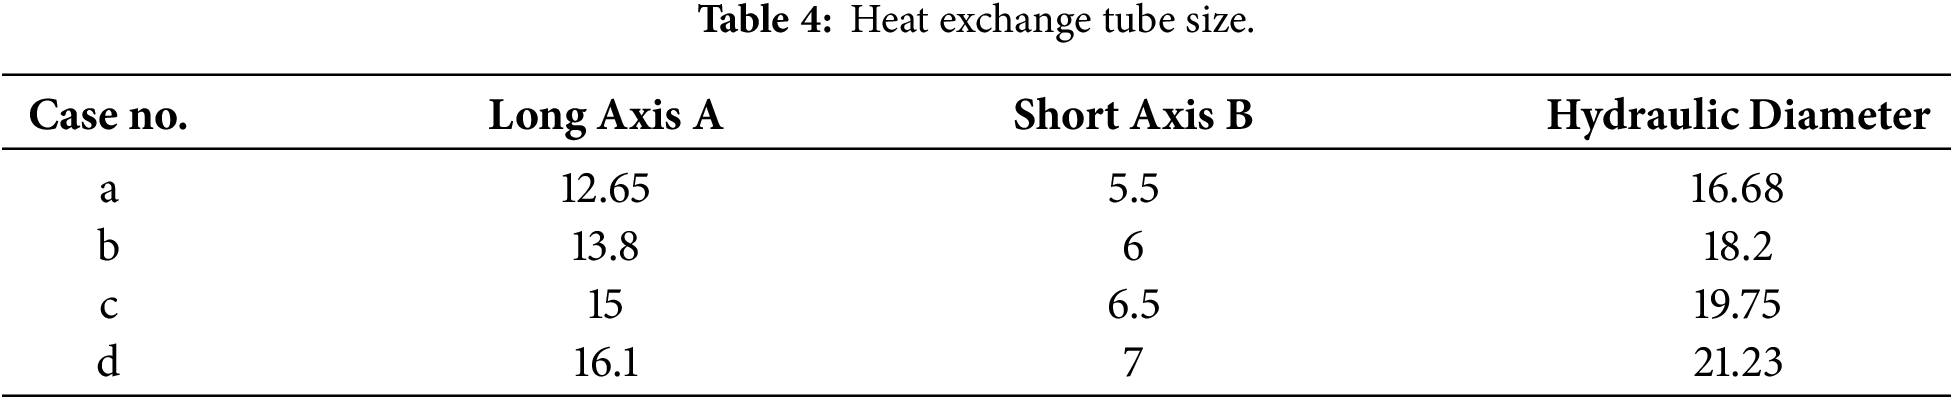
Based on the four geometric models defined in Table 1, numerical simulations were conducted under identical boundary conditions (see Section 2.4) to analyze the influence of tube diameter on the heat transfer and flow performance of the heat exchanger. The cross-section temperature cloud diagram of the heat exchanger under different pipe diameters is shown in Fig. 8. Comparing Fig. 8a–d, it can be seen that as the diameter of the spiral tube increases from the short axis of 5.5 mm to the long axis of 12.65 to the short axis of 7 mm and the long axis of 16.1 mm, there is no significant effect on the temperature distribution of the fluid in the tube.
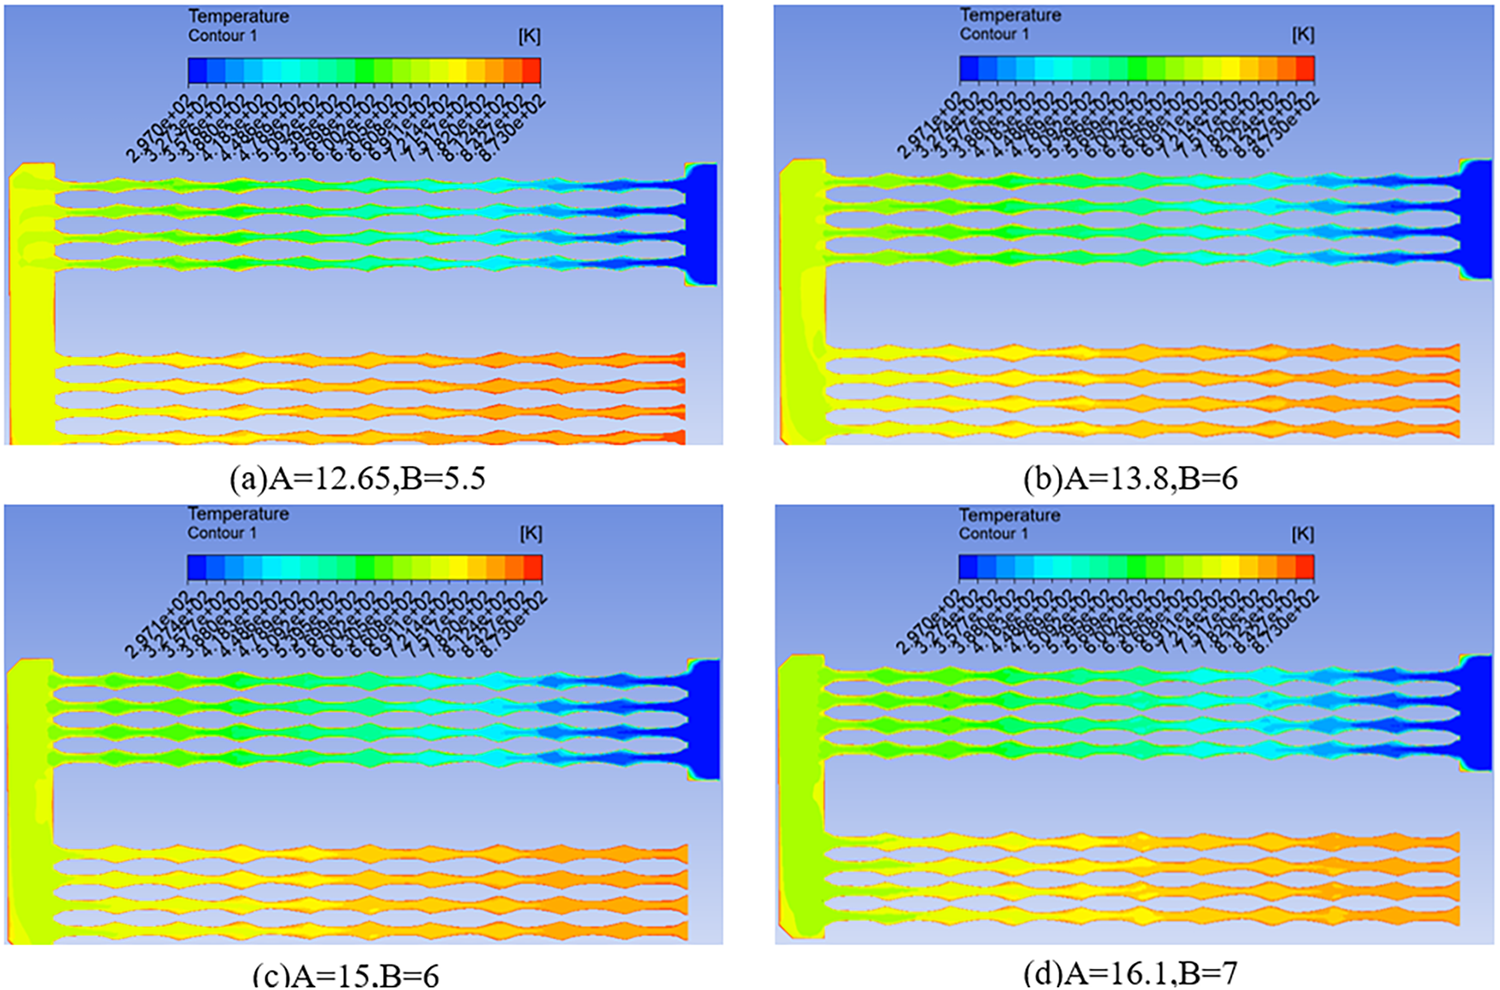
Figure 8: Cross-section temperature contours of heat exchangers with different pipe diameters. (a) A = 12.65, B = 5.5; (b) A = 13.8, B = 6; (c) A = 15, B = 6; (d) A = 16.1, B = 7.
Through the analysis of the flow field cloud diagram under different spiral tube diameters in Fig. 9, it can be seen that as the spiral tube increases from the short axis of 5 mm to the long axis of 12.65 mm to the short axis of 7 mm and the long axis of 16.1 mm, the maximum velocity in the flow field shows a downward trend, from 4.422 to 2.707 m·s−1. This phenomenon is mainly related to the combined effect of the geometric characteristics of the spiral pipe. Firstly, the increase of the pipe diameter directly leads to the expansion of the cross-sectional area of the pipe. According to the principle of fluid continuity, the average velocity decreases at a constant flow rate, and the local maximum velocity decreases. Secondly, the secondary flow (such as Dean vortex) caused by the bending geometry of the spiral tube is further strengthened due to the enhancement of the centrifugal force effect when the diameter increases, which aggravates the lateral mixing of the flow field and makes the velocity distribution tend to be uniform. The decrease of the maximum velocity reflects the transformation of the flow field from high-speed concentration to uniform distribution, which reflects the dominant influence of the diameter of the spiral tube on the flow characteristics.
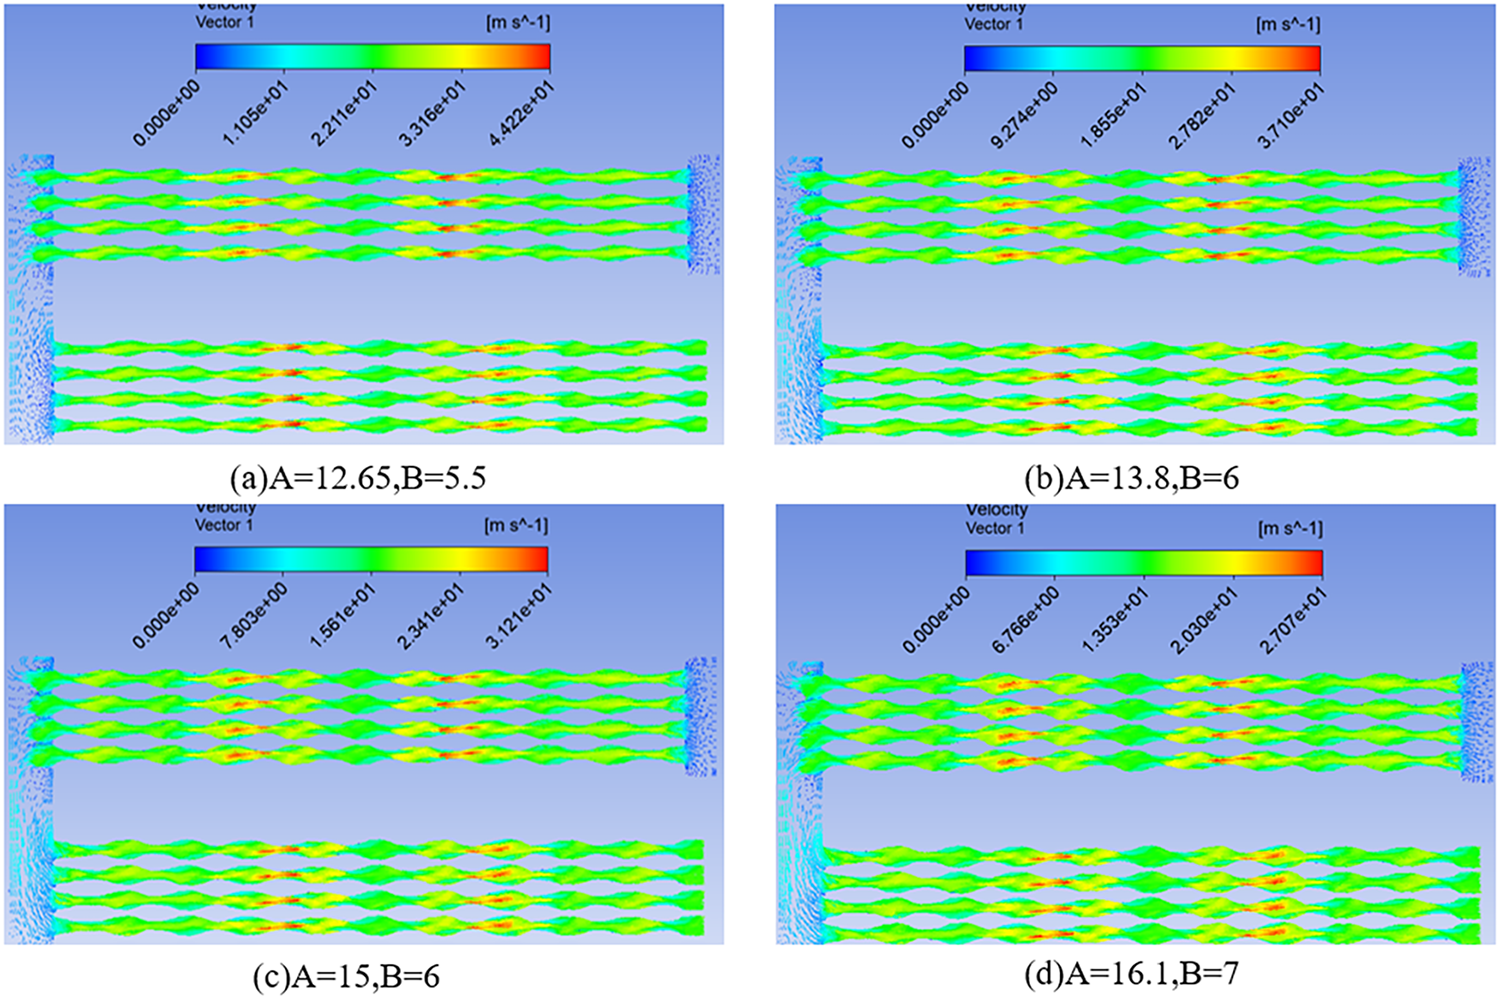
Figure 9: Velocity field contour maps of heat exchanger cross-sections with different pipe diameters. (a) A = 12.65, B = 5.5; (b) A = 13.8, B = 6; (c) A = 15, B = 6; (d) A = 16.1, B = 7.
Fig. 10 shows the variation of the outlet air temperature and the average surface heat transfer coefficient of the heat exchanger with the diameter of the pipe. It can be seen from the diagram that as the equivalent diameter increases from 16.68 to 21.23 mm, the average surface heat transfer coefficient of the heat exchanger decreases from 22,040 to 17,230 W/m2·K, and the outlet air temperature also decreases from 822.3 to 807.3 K. The change of equivalent diameter directly affects the cross-sectional area of the flow channel and the flow velocity of the fluid. When the equivalent diameter increases, the cross-sectional area of the flow channel increases and the flow velocity decreases, resulting in the weakening of the turbulence intensity and the decrease of the heat transfer coefficient. This is consistent with the classical heat transfer theory-the decrease of flow velocity will reduce the convective heat transfer efficiency between the fluid and the wall. On the contrary, a smaller equivalent diameter will increase the flow velocity, promote turbulence, and enhance the heat transfer coefficient, thereby improving the heat transfer efficiency. The change of outlet temperature is closely related to the heat transfer efficiency. When the heat transfer coefficient is higher, the heat exchanger can reach the equilibrium temperature of the hot and cold fluid more quickly, and the outlet temperature is closer to the design target value.
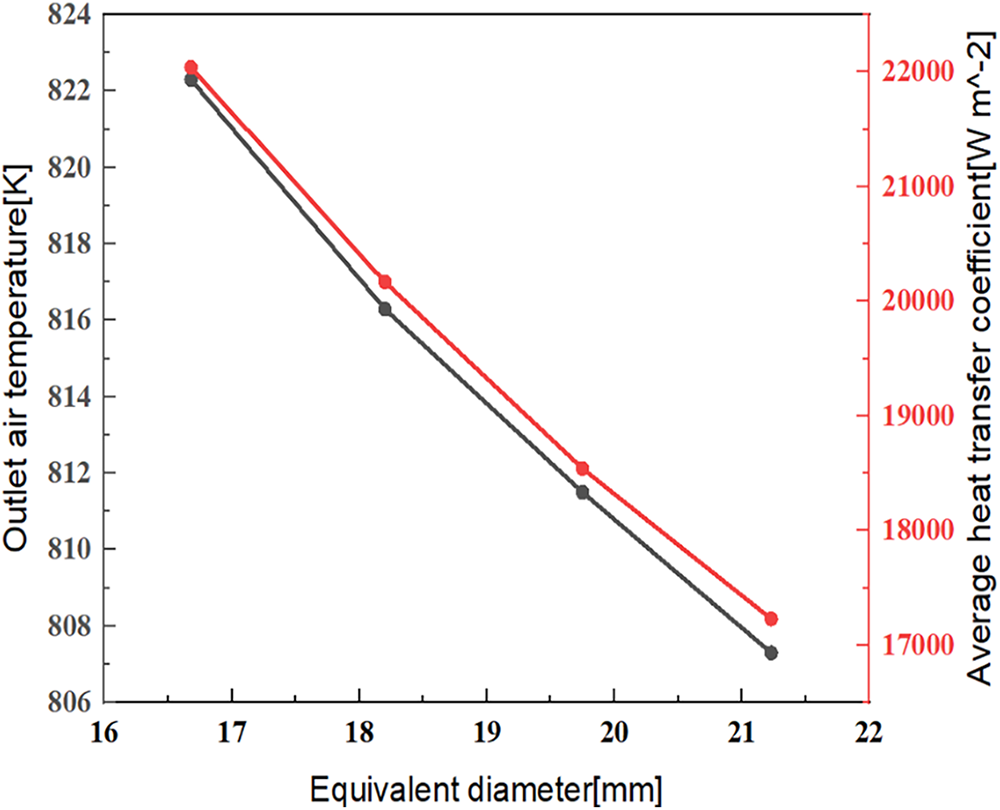
Figure 10: Variation of outlet air temperature (K) and average surface heat transfer coefficient (W/m2) of heat exchanger with tube diameter (mm).
Fig. 11 shows the variation of air pressure loss in the tube with the equivalent diameter. From the data trend, as the equivalent diameter increases, the pressure loss decreases from 2.692 to 0.958 kPa. This phenomenon can be explained by the Darcy-Weisbach formula in fluid mechanics: the pressure loss is inversely proportional to the pipe diameter. When the pipe diameter increases, the frictional resistance of the fluid flow decreases, and the velocity distribution tends to be uniform, thereby reducing the energy loss along the way. In addition, the increase of the pipe diameter reduces the contact area between the fluid and the pipe wall, which further weakens the effect of the viscous shear force. When other parameters (such as flow rate, fluid properties, pipe length and surface roughness) in pipeline system design remain constant, the expansion of pipe diameter will directly improve the flow efficiency and reduce energy consumption. Therefore, the reasonable selection of pipe diameter is the key factor to optimize the pipeline system and reduce the pressure loss.
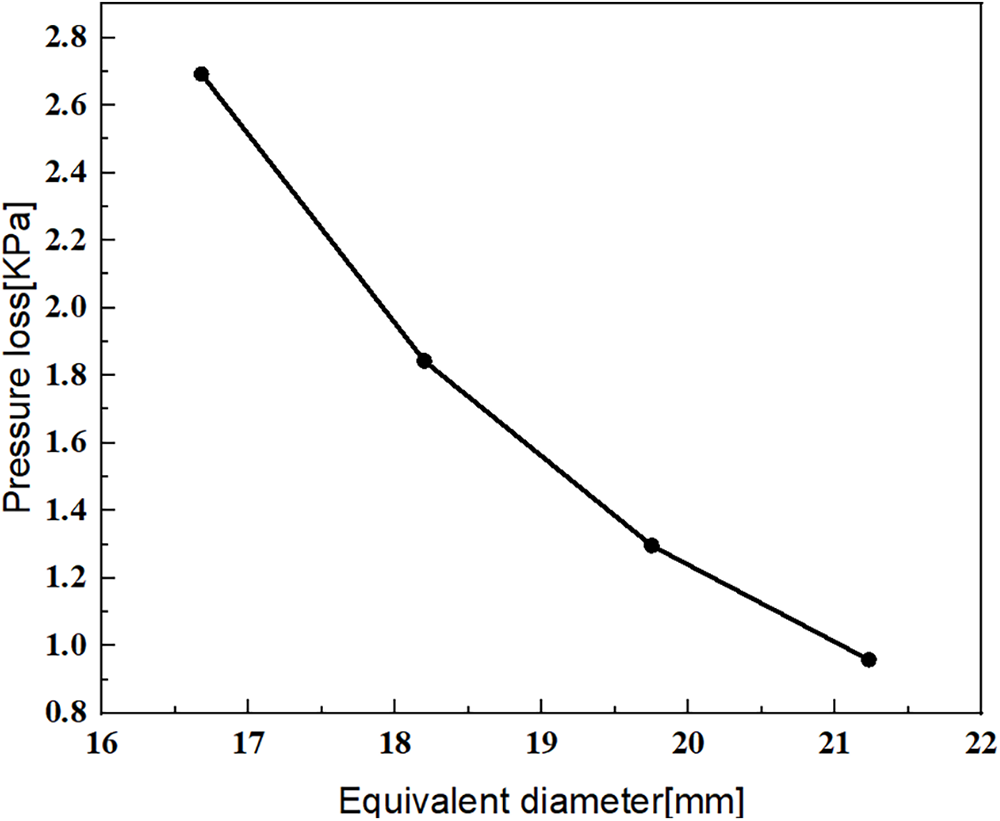
Figure 11: Variation of air pressure loss (kPa) with pipe diameter (mm).
Fig. 11 illustrates the variation of air pressure loss within the pipe as a function of equivalent diameter De. The data trend shows that as De increases from 16.68 to 21.23 mm, the pressure loss ΔP decreases significantly from 2.692 to 0.958 kPa. This phenomenon is primarily attributed to the decisive influence of increased pipe diameter on flow resistance.
Theoretically, the pressure drop within spiral pipes is primarily composed of friction losses along the flow path. Qualitative analysis can be performed using the Darcy-Weisbach equation:
Here,
It should be noted that to highlight the isolated effect of pipe diameter, this study employs the assumption of hydraulically smooth walls in the simulation, disregarding the influence of pipe wall roughness typically present in industrial applications. If roughness is considered, the friction factor f will increase, resulting in a higher actual pressure drop than the simulated value for the same De. Additionally, the secondary flow (Dean vortices) characteristic of helical pipes leads to a higher actual friction factor than the empirical value for straight pipes under equivalent conditions. Nevertheless, the core trend that “increasing pipe diameter effectively reduces system pressure loss” holds universal validity. In practical engineering design, a balance must be struck between enhancing heat transfer (which favors smaller diameters) and reducing pump power consumption (which favors larger diameters). This optimization must also account for constraints such as manufacturing processes, material costs, and permissible pressure drop limits.
4 The Influence of External Baffle on the Performance of Heat Exchanger
In shell-and-tube heat exchangers, installing baffles is a key method for optimizing the shell-side flow field and enhancing heat transfer. However, while baffles improve heat transfer performance, they inevitably introduce additional flow resistance. Therefore, evaluating their performance requires a comprehensive consideration of both the heat transfer enhancement effect and the associated increase in pressure drop. This section aims to systematically investigate and analyze the impact of a single arched longitudinal baffle on the overall performance of a spiral tube heat exchanger through numerical simulation.
To guide efficient counter-current flow between the flue gas outside the tubes and the air inside the tubes, a single arched longitudinal baffle was added to the shell side of the reference model (without baffles). Its design rationale and specific parameters are as follows: The most common single arched baffle in engineering practice was adopted to balance flow guidance and manufacturing complexity. The ratio of the baffle notch height to the shell inner diameter (notch ratio) was set at 25%. Two baffles spaced equidistantly along the flow direction divide the shell-side flow path into three serial flow zones, increasing the fluid’s lateral travel distance and turbulence when impinging on the tube bundle. The core functions of the baffles are: (1) Macro-scale flow field restructuring: Forcing flue gas to flow longitudinally (approximating counter-current direction), optimizing the overall temperature field and heat transfer temperature difference; (2) Micro-scale turbulence enhancement: Flow separation occurs at the baffle edges, generating periodic vortex shedding downstream. This significantly intensifies local turbulence, thereby thinning the thermal boundary layer and intensifying convective heat transfer.
In this section, the flow and heat transfer models of two kinds of flue gas external heat exchangers without and with baffles to limit the flow direction of flue gas are established, which is intended to explore the influence of the external baffle on the heat transfer performance of the heat exchanger. The schematic diagram of the two heat transfer models is shown in Fig. 12. The baffle plate thickness is 15 mm, with an opening height of 800 mm. Both the flue gas inlet and outlet feature upper openings, while the heat exchanger’s hot and cold connection sections have lower openings.
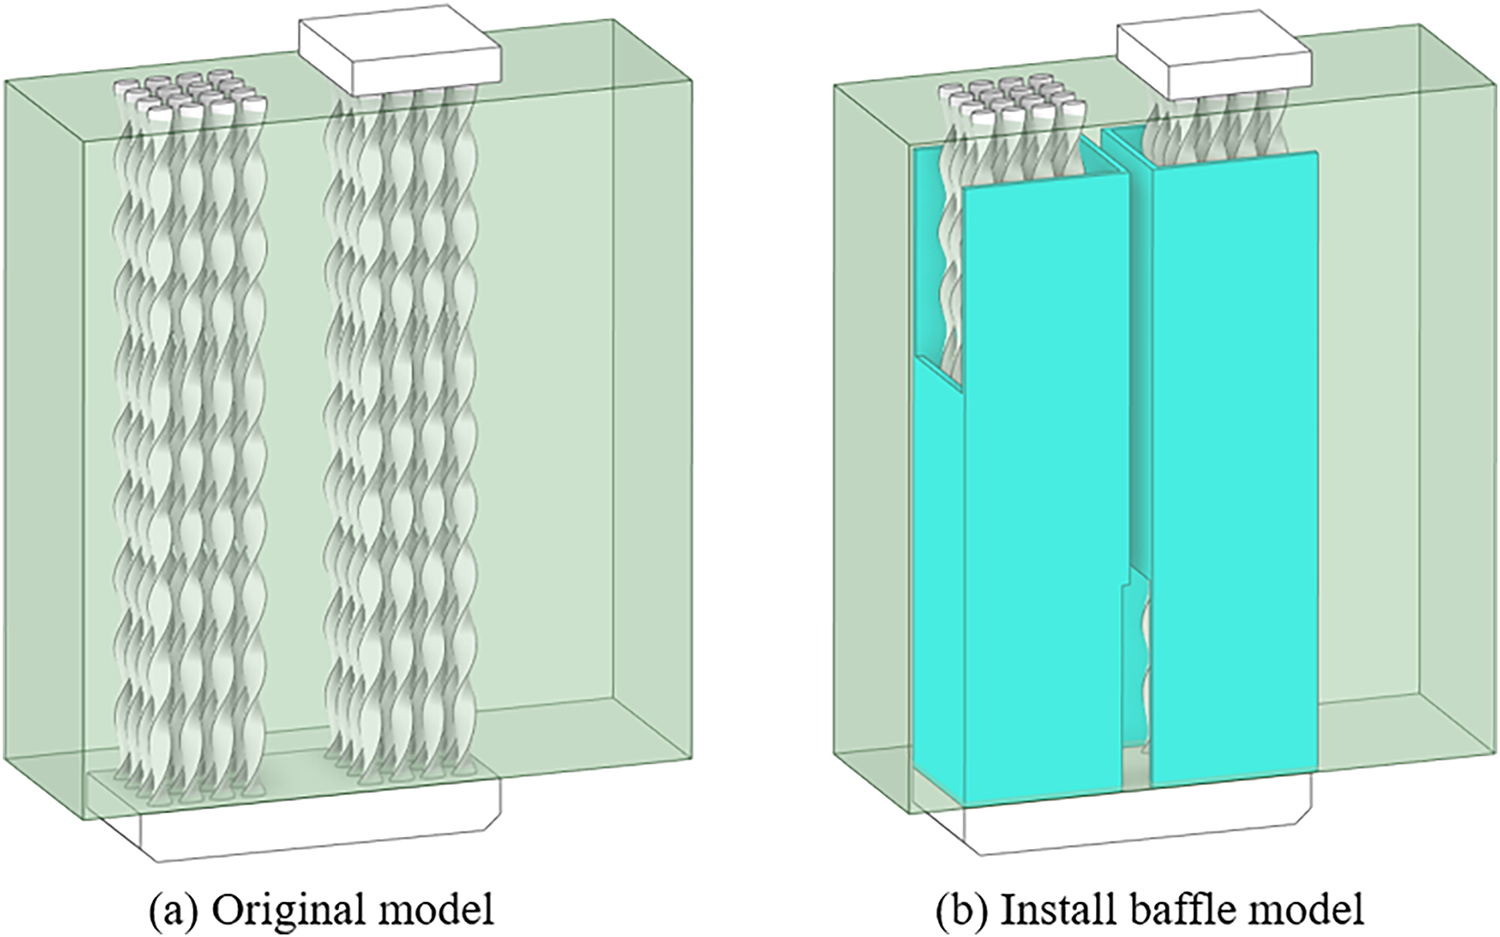
Figure 12: Comparison of the two models (a) Original model (b) Install baffle model.
The temperature contour maps of the pipe cross-section before and after installing baffles in the heat exchanger are shown in Fig. 13. After installing the baffles, the fluid temperature rise rate in the inlet section of the pipe significantly increased, and the area of high-temperature zones in the outlet section of the pipe notably expanded. The introduction of the baffle significantly changes the temperature gradient in the middle region. Because the baffle disturbs the fluid and enhances the turbulent mixing, the local heat exchange efficiency is improved, and the overall temperature distribution range is expanded, indicating that the flow channel structure optimization broadens the coverage of the low temperature region. In summary, the baffle improves the heat transfer performance by improving the flow path and enhancing turbulence.
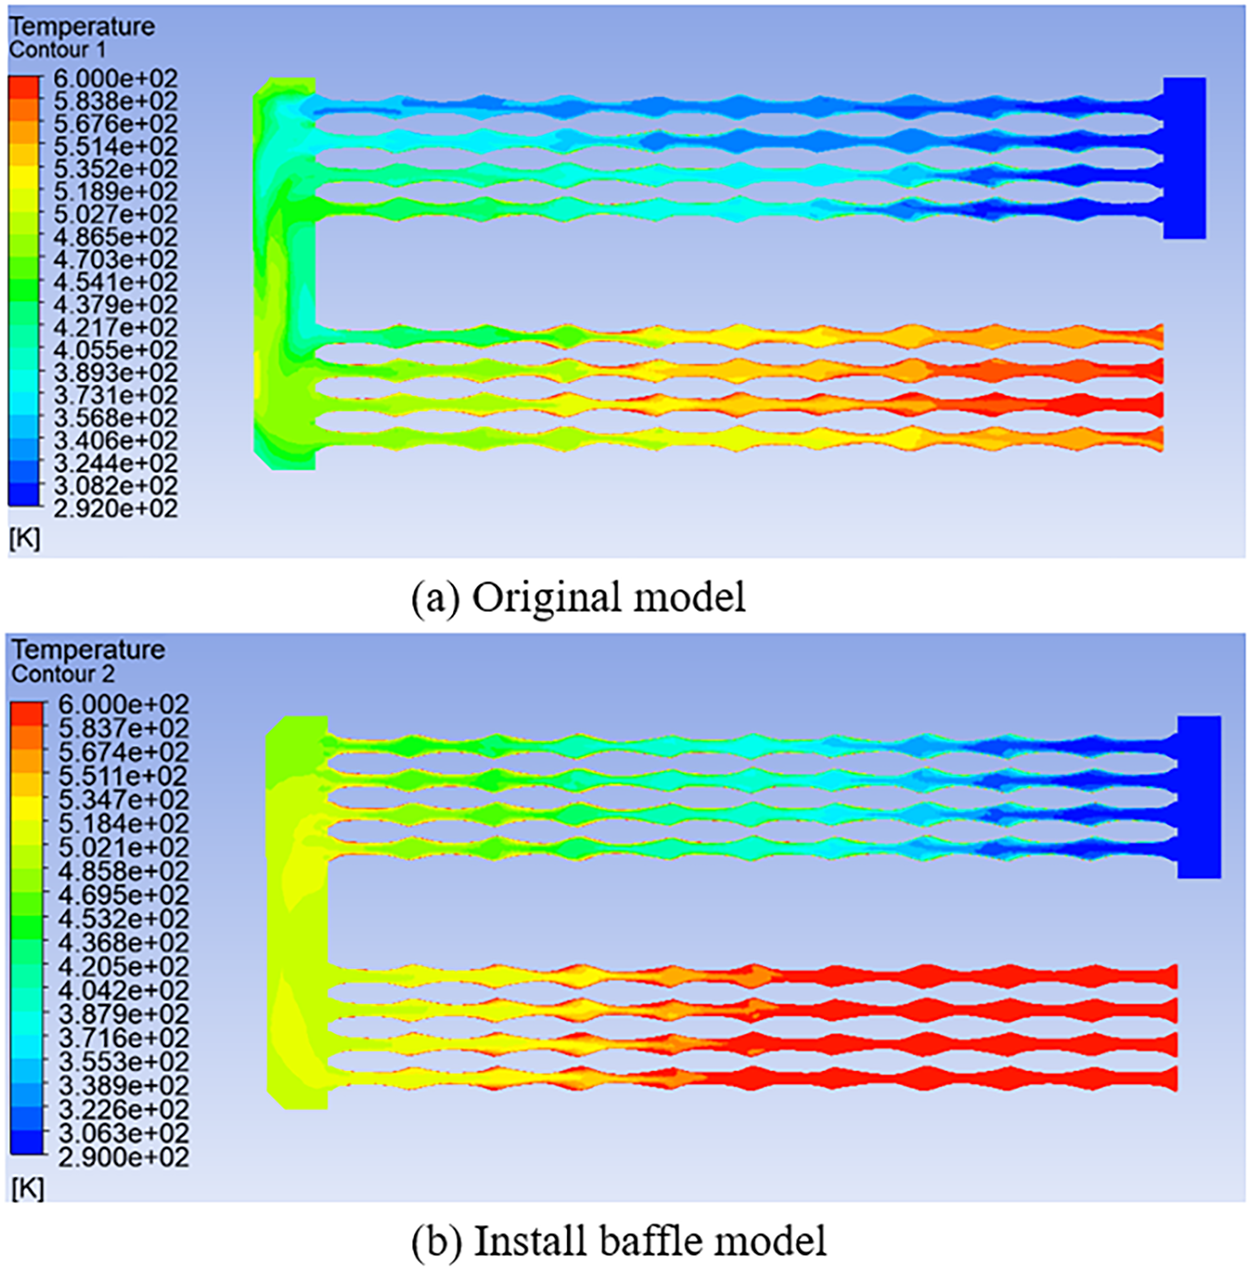
Figure 13: Heat exchanger section temperature cloud diagram. (a) Original model; (b) Install baffle model.
The comparison of heat flux on the tube wall surfaces before and after installing baffles in the heat exchanger is shown in Fig. 14. Without baffles, the heat flux distribution is uniform and the heat flow is relatively low. After installing the baffle, there are several areas where the heat flow increases significantly. The baffle optimizes the heat transfer path by enhancing the fluid disturbance, and its regulation of the medium and low temperature region improves the overall heat transfer intensity through turbulent mixing.
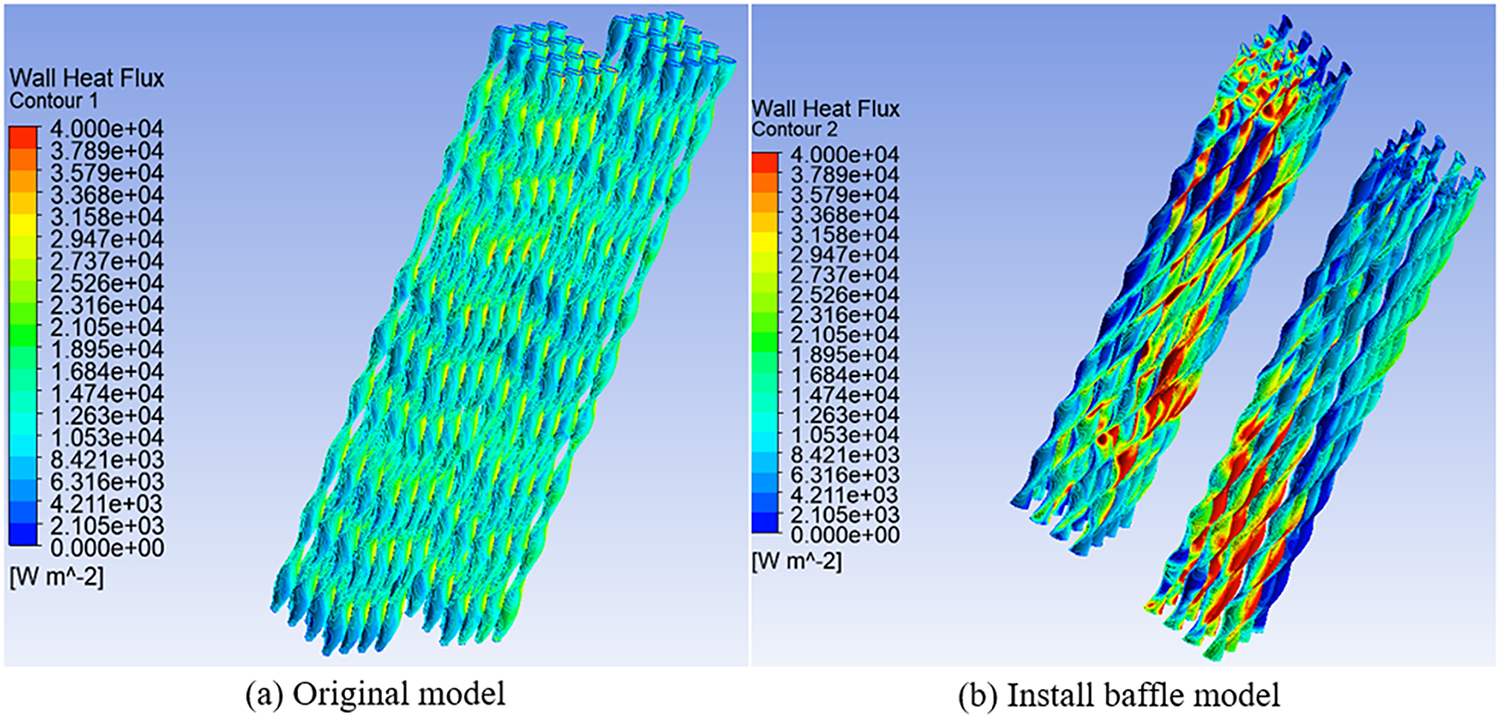
Figure 14: Heat flux cloud diagram of heat exchanger surface. (a) Original model; (b) Install baffle model.
Fig. 15 compares the heat transfer performance parameters of the two heat exchangers with and without baffles. From the data, the wall heat flux density increased significantly after the installation of the baffle. The wall heat flux density under the original model was 13,470 W·m−2, and increased to 17,088 W·m−2 after the installation of the baffle. The wall heat flux density increased by 21.17% in the model with baffles compared to the model without baffles, which indicates that the baffle structure effectively enhanced the heat transfer. In terms of surface heat transfer coefficient, the heat transfer coefficient increased from 40.31 to 45.18 W·m−2·K−1 after the installation of the baffle, which was increased due to the enhancement of fluid disturbance.
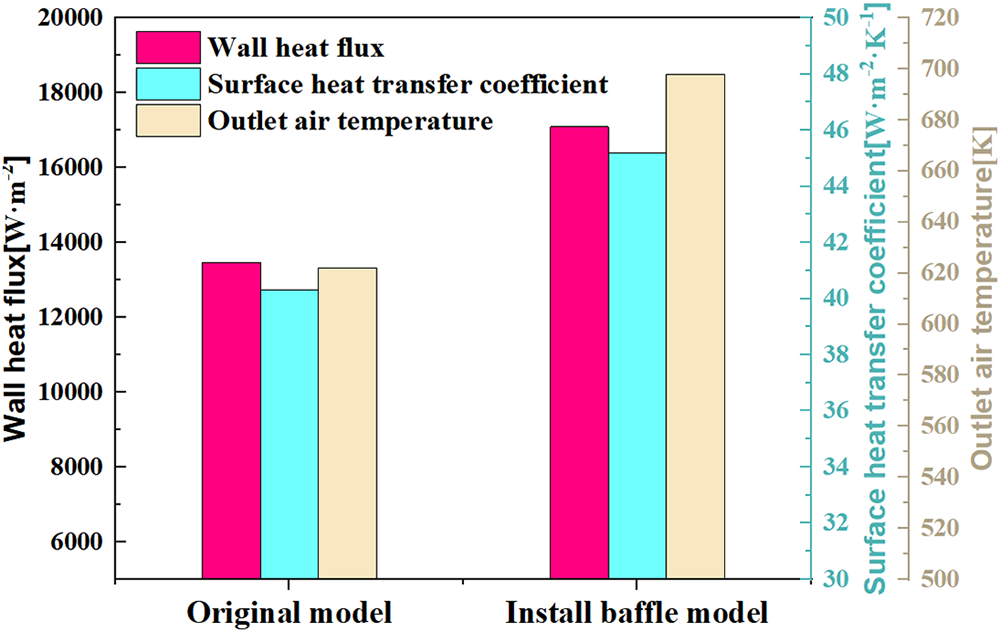
Figure 15: Comparison of heat transfer performance.
This is consistent with the principle that the baffle design enhances heat transfer by guiding fluid turbulence. The comparison of the outlet air temperature shows that the temperature gradient changes more significantly after the installation of the baffle. The temperature under the original model may be limited by uniform flow, resulting in insufficient heat transfer. The baffle further optimizes the heat exchange process by extending the fluid path and increasing the contact time. In general, the heat flux density of the wall is increased by about 21.17% after the installation of the baffle, the surface heat transfer efficiency is enhanced, and the regulation ability of the outlet air temperature is improved, which verifies the effectiveness of the baffle structure in improving the comprehensive performance of the heat exchanger.
Enhancing the energy efficiency of industrial furnaces urgently requires optimizing the performance of their core component—the spiral tube heat exchanger. This study aims to address the core challenge of synergistically improving the heat exchanger’s overall thermal-hydraulic performance by adjusting the spiral tube structural parameters (hydraulic diameter) and optimizing the shell-side flow field (through external baffles). To this end, we established a CFD-based numerical model and systematically analyzed the influence mechanisms of key parameters. The following conclusions were drawn:
(1) The increase of the equivalent diameter of the spiral tube significantly reduces the flow resistance but weakens the heat transfer efficiency. When the equivalent diameter increases from 16.68 to 21.23 mm, the surface heat transfer coefficient decreases by 21.8%, the outlet air temperature decreases by 15 K, and the pressure loss decreases by 64.4%. This shows that although the small pipe diameter can improve the heat transfer efficiency by enhancing turbulence, it needs to weigh higher energy consumption. In the actual design, the pipe diameter selection needs to be optimized in combination with the working conditions.
(2) The addition of baffles significantly improves the heat transfer performance by enhancing turbulence. The baffle increases the wall heat flux by 21.17%, the surface heat transfer coefficient by 12.1%, and the outlet air temperature. The mechanism is that the baffle extends the fluid path, enhances the disturbance, and optimizes the countercurrent contact efficiency of hot and cold fluids.
(3) The tube diameter and baffle layout require coordinated design. A clear parametric relationship exists between the two, jointly determining the overall performance of the heat exchanger. Future work may employ multi-objective optimization methods (such as NSGA-II) to systematically optimize multiple parameters including tube diameter, baffle spacing, and installation angle.
Research Limitations and Future Directions: The findings are derived from numerical simulations and are subject to model simplifications and mesh errors, requiring experimental calibration for absolute accuracy. Future work should incorporate experimental validation and further investigate the coupled effects of multiple parameters, such as spiral pitch and baffle geometry. Additionally, exploring intelligent optimization design methods based on machine learning holds promise.
Acknowledgement: None.
Funding Statement: This work was supported by the Jing-Jin-Ji Regional Integrated Environmental Improvement-National Science and Technology Major Project (No.2024ZD1200400).
Author Contributions: The authors confirm contribution to the paper as follows: study conception and design: Yumeng Li, Fuyong Su; data collection: Yumeng Li, Fuyong Su; analysis and interpretation of results: Yumeng Li, Fuyong Su; draft manuscript preparation: Yumeng Li, Fuyong Su. All authors reviewed and approved the final version of the manuscript.
Availability of Data and Materials: Data available within the article.
Ethics Approval: Not applicable.
Conflicts of Interest: The authors declare no conflicts of interest.
References
1. Fsadni AM, Whitty JPM. A review on the two-phase heat transfer characteristics in helically coiled tube heat exchangers. Int J Heat Mass Transf. 2016;95:551–65. doi:10.1016/j.ijheatmasstransfer.2015.12.034. [Google Scholar] [CrossRef]
2. Tuncer AD, Sözen A, Khanlari A, Gürbüz EY, Variyenli Hİ. Upgrading the performance of a new shell and helically coiled heat exchanger by using longitudinal fins. Appl Therm Eng. 2021;191:116876. doi:10.1016/j.applthermaleng.2021.116876. [Google Scholar] [CrossRef]
3. Tuncer AD, Sözen A, Khanlari A, Gürbüz EY, Variyenli Hİ. Analysis of thermal performance of an improved shell and helically coiled heat exchanger. Appl Therm Eng. 2021;184:116272. doi:10.1016/j.applthermaleng.2020.116272. [Google Scholar] [CrossRef]
4. Miansari M, Darvishi MR, Toghraie D, Barnoon P, Shirzad M, Alizadeh A. Numerical investigation of grooves effects on the thermal performance of helically grooved shell and coil tube heat exchanger. Chin J Chem Eng. 2022;44:424–34. doi:10.1016/j.cjche.2021.05.038. [Google Scholar] [CrossRef]
5. Hasan MJ, Ahmed SF, Bhuiyan AA. Geometrical and coil revolution effects on the performance enhancement of a helical heat exchanger using nanofluids. Case Stud Therm Eng. 2022;35:102106. doi:10.1016/j.csite.2022.102106. [Google Scholar] [CrossRef]
6. Naphon P, Wiriyasart S, Prurapark R, Srichat A. Numerical study on the nanofluid flows and temperature behaviors in the spirally coiled tubes with helical ribs. Case Stud Therm Eng. 2021;27:101204. doi:10.1016/j.csite.2021.101204. [Google Scholar] [CrossRef]
7. Wang W, Zhang Y, Lee KS, Li B. Optimal design of a double pipe heat exchanger based on the outward helically corrugated tube. Int J Heat Mass Transf. 2019;135:706–16. doi:10.1016/j.ijheatmasstransfer.2019.01.115. [Google Scholar] [CrossRef]
8. Farnam M, Khoshvaght-Aliabadi M, Asadollahzadeh MJ. Intensified single-phase forced convective heat transfer with helical-twisted tube in coil heat exchangers. Ann Nucl Energy. 2021;154:108108. doi:10.1016/j.anucene.2020.108108. [Google Scholar] [CrossRef]
9. Halawa T, Tanious AS. On the use of twisting technique to enhance the performance of helically coiled heat exchangers. Int J Therm Sci. 2023;183:107899. doi:10.1016/j.ijthermalsci.2022.107899. [Google Scholar] [CrossRef]
10. Guo F, Fu J, Hu Z, Sunden B. Design and optimization of staggered fin structure of heat exchanger based on Machine learning. Int J Heat Fluid Flow. 2024;108:109475. doi:10.1016/j.ijheatfluidflow.2024.109475. [Google Scholar] [CrossRef]
11. Elboughdiri N, Salih SQ, Chauhan BS, Albani A, Nutakki TUK, Alturise F, et al. Arc-curved microchannels engraved on segmented circular heat sink for heat transfer augmentation; ANN-based performance optimization. Case Stud Therm Eng. 2024;53:103837. doi:10.1016/j.csite.2023.103837. [Google Scholar] [CrossRef]
12. Tran N, Wang CC. Optimization of the airside thermal performance of mini-channel-flat-tube radiators by using composite straight-and-louvered fins. Int J Heat Mass Transf. 2020;160:120163. doi:10.1016/j.ijheatmasstransfer.2020.120163. [Google Scholar] [CrossRef]
13. Lee H, Kang M, Jung KW, Kharangate CR, Lee S, Iyengar M, et al. An artificial neural network model for predicting frictional pressure drop in micro-pin fin heat sink. Appl Therm Eng. 2021;194:117012. doi:10.1016/j.applthermaleng.2021.117012. [Google Scholar] [CrossRef]
14. Mekki BS, Langer J, Lynch S. Genetic algorithm based topology optimization of heat exchanger fins used in aerospace applications. Int J Heat Mass Transf. 2021;170:121002. doi:10.1016/j.ijheatmasstransfer.2021.121002. [Google Scholar] [CrossRef]
15. Sadighi Dizaji H, Jafarmadar S, Mobadersani F. Experimental studies on heat transfer and pressure drop characteristics for new arrangements of corrugated tubes in a double pipe heat exchanger. Int J Therm Sci. 2015;96:211–20. doi:10.1016/j.ijthermalsci.2015.05.009. [Google Scholar] [CrossRef]
16. Zong J, Zhang L, Liang X, Zhang Y, Zhang YW, Nie Z, et al. Numerical simulation of plate-fin heat exchanger and design of novel turbulator structures using a multi-scale simulation approach. Int Commun Heat Mass Transf. 2025;164:108897. doi:10.1016/j.icheatmasstransfer.2025.108897. [Google Scholar] [CrossRef]
17. Torri F, Berni F, Giacalone M, Mantovani S, Defanti S, Colombini G, et al. A methodology to reduce the computational effort in 3D-CFD simulations of plate-fin heat exchangers. Appl Therm Eng. 2024;245:122843. doi:10.1016/j.applthermaleng.2024.122843. [Google Scholar] [CrossRef]
18. Xu P, Wen J, Wang S, Chen Q, Li Y. Numerical simulation on flow and heat transfer performances of serrated and wavy fins in plate-fin heat exchanger for hydrogen liquefaction. Int J Hydrogen Energy. 2023;48(54):20680–93. doi:10.1016/j.ijhydene.2023.01.088. [Google Scholar] [CrossRef]
Cite This Article
 Copyright © 2026 The Author(s). Published by Tech Science Press.
This work is licensed under a Creative Commons Attribution 4.0 International License , which permits unrestricted use, distribution, and reproduction in any medium, provided the original work is properly cited.
 Downloads
 Citation Tools