
 Submit a Paper
 Propose a Special lssue
 Open Access
ARTICLE
Smart-Grid Monitoring using IoT with Modified Lagranges Key Based Data Transmission
1 Department of Electronics and Communication Engineering, Rohini College of Engineering and Technology, Kanyakumari, Tamilnadu, 629401, India
2 Department of Electronics and Communication Engineering, Sri Ramakrishna Engineering College, Coimbatore, Tamilnadu, 641022, India
* Corresponding Author: C. K. Morarji. Email:
Intelligent Automation & Soft Computing 2023, 35(3), 2875-2892. https://doi.org/10.32604/iasc.2023.025776
Received 04 December 2021; Accepted 11 February 2022; Issue published 17 August 2022
 View Full Text
 Download PDF
Abstract
One of the recent advancements in the electrical power systems is the smart-grid technology. For the effective functioning of the smart grid, the process like monitoring and controlling have to be given importance. In this paper, the Wireless Sensor Network (WSN) is utilized for tracking the power in smart grid applications. The smart grid is used to produce the electricity and it is connected with the sensor to transmit or receive the data. The data is transmitted quickly by using the Probabilistic Neural Network (PNN), which aids in identifying the shortest path of the nodes. While transmitting the data from the smart grid to the (Internet of Things) IoT web page, it is secured by introducing the secret keys between the neighbouring nodes through the process of key-management. In this method, the combination of Lagrange’s theorem and the Location Based Key (LBK) management is used for better security performance. This approach delivers optimal performance in terms of security, throughput, packet loss and delay, which are comparatively better than the existing methods.Keywords
In recent emerging technologies, the electrical power grid is the significant method since it is an interconnection of numerous control systems and transmission lines with the centralized generation. In several situations, the power supply is seamlessly provided by the power grid. The major challenges of these grids are primary energy source depletion, diversion in generation, variation in the climate and reliability. The lack of intelligence like monitoring and controlling ability of grid in several industrial appliances is overcome by the functional components. The Supervisory Control and Data Acquisition (SCADA) is regarded as the significant approach. The data collected by this system is processed and stored in the central computer. At the function of upstream, the control is limited by SCADA and the power distribution lessened in real-time. Thus, the electrical power grid called smart grid is evolved more intelligently with the beneficial factors like high response, maximum efficiency and environmental friendliness. This evaluation is determined by the large demand of power, unreliable power flow and settings of system. However, the smart grid is addressed with the dynamic architecture of intelligent mechanism.
The WSN is used to record and monitor the physical conditions of environment and in this approach, the collected data are prearranged at the central location. The major issues in WSN is the security and so the Fragmentation Aggregation Transmission WSN (FAT-WSN) [1] is used to minimize the fragments of data, which assists in optimizing the traffic distribution. The physical performance of the network is improved by the Adaptive Quality of Service (AQoS) [2] with the absence of physical disturbances. For providing the capability estimation of Direction of Arrival (DOA), the integration of node in WSN is provided by the Electronically Steerable Parasitic Array Radiator (ESPAR) [3], which improves the quality of the entire network. The concurrent optimized combinational challenges in WSN is addressed by Multiple Request Cooperative Integration (MRCI) [4]. To obtain optimal performance and to improve the throughput, delay, lifespan of the WSN network the, Congestion Aware Clustering and Routing (CCR) [5] is proposed. When the energy is drained out, more number of sensors have to be used for covering the target and this requirement is known as the problematic K-coverage [6]. For measuring the environmental temperature accurately with WSN, the Temperature Dependent Kinetic Battery Model (T-KiBaM) [7] is proposed with the extension of the model battery State-of-the-art.
One of the vital components of IoT is WSN as it contains several nodes of sensor and the wireless connections. In addition, it has the capacity to provide real-world interference in a digital manner. In WSN, the data is transmitted by the routing based cluster, in which the Cluster Heads (CH) are used for transmitting the data. When CH is failed, it is unable to forward the data and it affects the application of IoT. To overcome this issue, the virtual CH with the flow graph is used [8]. The energy is uniformly distributed between the CH and the members by the thresholds, thus the CH based thresholds are implemented by the Stable Election Protocol (SEP) [9]. The major issues in IoT is the leakage of data, which is overcome with the assistance of the Adaptive Feature Graph Update model (AFGU) [10]. In IoT, the sensor node is battery dependent and to increase the life of the battery, the Real-time Data Collection Model (RDCM) [11] is utilized. In IoT based WSN, the data is transferred by the nodes and the exposure of these nodes leads to the security attack. To avoid this issue, a new authentication information exchange [12] method is introduced. To provide the provisioning service for IoT, the software defined WSN (soft-WSN) [13] is introduced, through which the performance of the network is improved. The Firat Virtual WSN framework (FVWSN) is introduced to transmit the data and commands for the next set of networks [14].
For the secured data transformation, the key-management is used, through which the data is protected and the end-to-end encryption is done. To avoid the threats in the network Location Dependent Key-management (LDK) is presented in [15]. While establishing the key, the network nodes are authenticated with the help of transitory symmetric key [16] and the keys used are in pairs. To securely asses the communication, the secured links are clearly recovered by the state-of-the-art keys method [17]. Through this key, the q-s composition [18] is proposed to improve the features of the key. The three levels of security is provided by the Location dependent Key Management Protocol (LKMP-MS) for multiple sinks. By this key, the security is provided in the higher level [19].
The performance of the network is critical in WSN and so the Artificial Intelligence (AI) is used to enhance the reliability and performance. In WSN, the delay and the consumption of energy are the major issues, which are overcome by using AI based energy efficient robust routing scheme called ELDC [20]. The Back-Propagation based Artificial Neural Network (BP-ANN) [21] is used to determine the location and position. The Received Signal Strength Indicator (RSSI) from the anchor node is then collected by the mobile node with the help of laptop [22]. The issues in the classification of image is eliminated by the Convolutional Neural Network (CNN) with the combination of Auto-Encoder (AE). Thus, the extraction of feature is performed [23] in an efficient manner. The undefined attacks are found by using the Deep Neural Network (DNN), through which the static and dynamic sets of data are collected and evaluated [24]. The data transmitted quality is improved by proposing the scheme tolerance model [25] and the failed link is found by the improved quadratic minimum spanning tree.
In this paper, the smart grid is used to produce electricity and it is connected with the sensor to transmit and receive data. The data is transmitted quickly by identifying the shortest path of the nodes through the implementation of PNN. While transmitting the data from the smart grid to the IoT web page, it is secured by introducing the secret keys between the neighboring nodes with the aid of key-management. The combination of Lagrange’s theorem and the LBK management is implemented for better security performance. Thus, the security level and the network performance are enhanced with maximized lifespan of the network.
The smart grid technologies help to enable renewables sources in multiple industrial applications but it difficult to decide the best technical uses with relevance to the factors like performance, cost of technology, non-technical issues and privacy. The characteristics of the smart grid are lists as variability, and high initial cost. The function of smart grid isclearly explained in the Fig. 1.
The operation of the smart grid system is provided by supplying the present information of the working system to provide the overall system control. This set of informations and control of the systems are used in several ways like,
• The reliability of the distributed generation is maintained by minimizing the output level.
• The output of the distributed generation is provided with the present information.
• The distributed system is supported by controlling the system.
As it is difficult to monitor and control this system, the manufacturers of electricity generation are not confortable with this method. The monitoring and control of electricity generation are carried out by smart grid, which replaces the conventional power plants. Voltage regulation and cost are the vital impacts, which affect the distributed generation. The data are accessible from the smart grid and so the system operator gets precise value. However, these data are used to provide optimal output to the operator of the distributed systems.
Universally, the smart grid is not qualified with any agreement but in a wide range of communication, the technologies like information and control are used to contribute the operation of the electricity system with efficiency and flexibility.
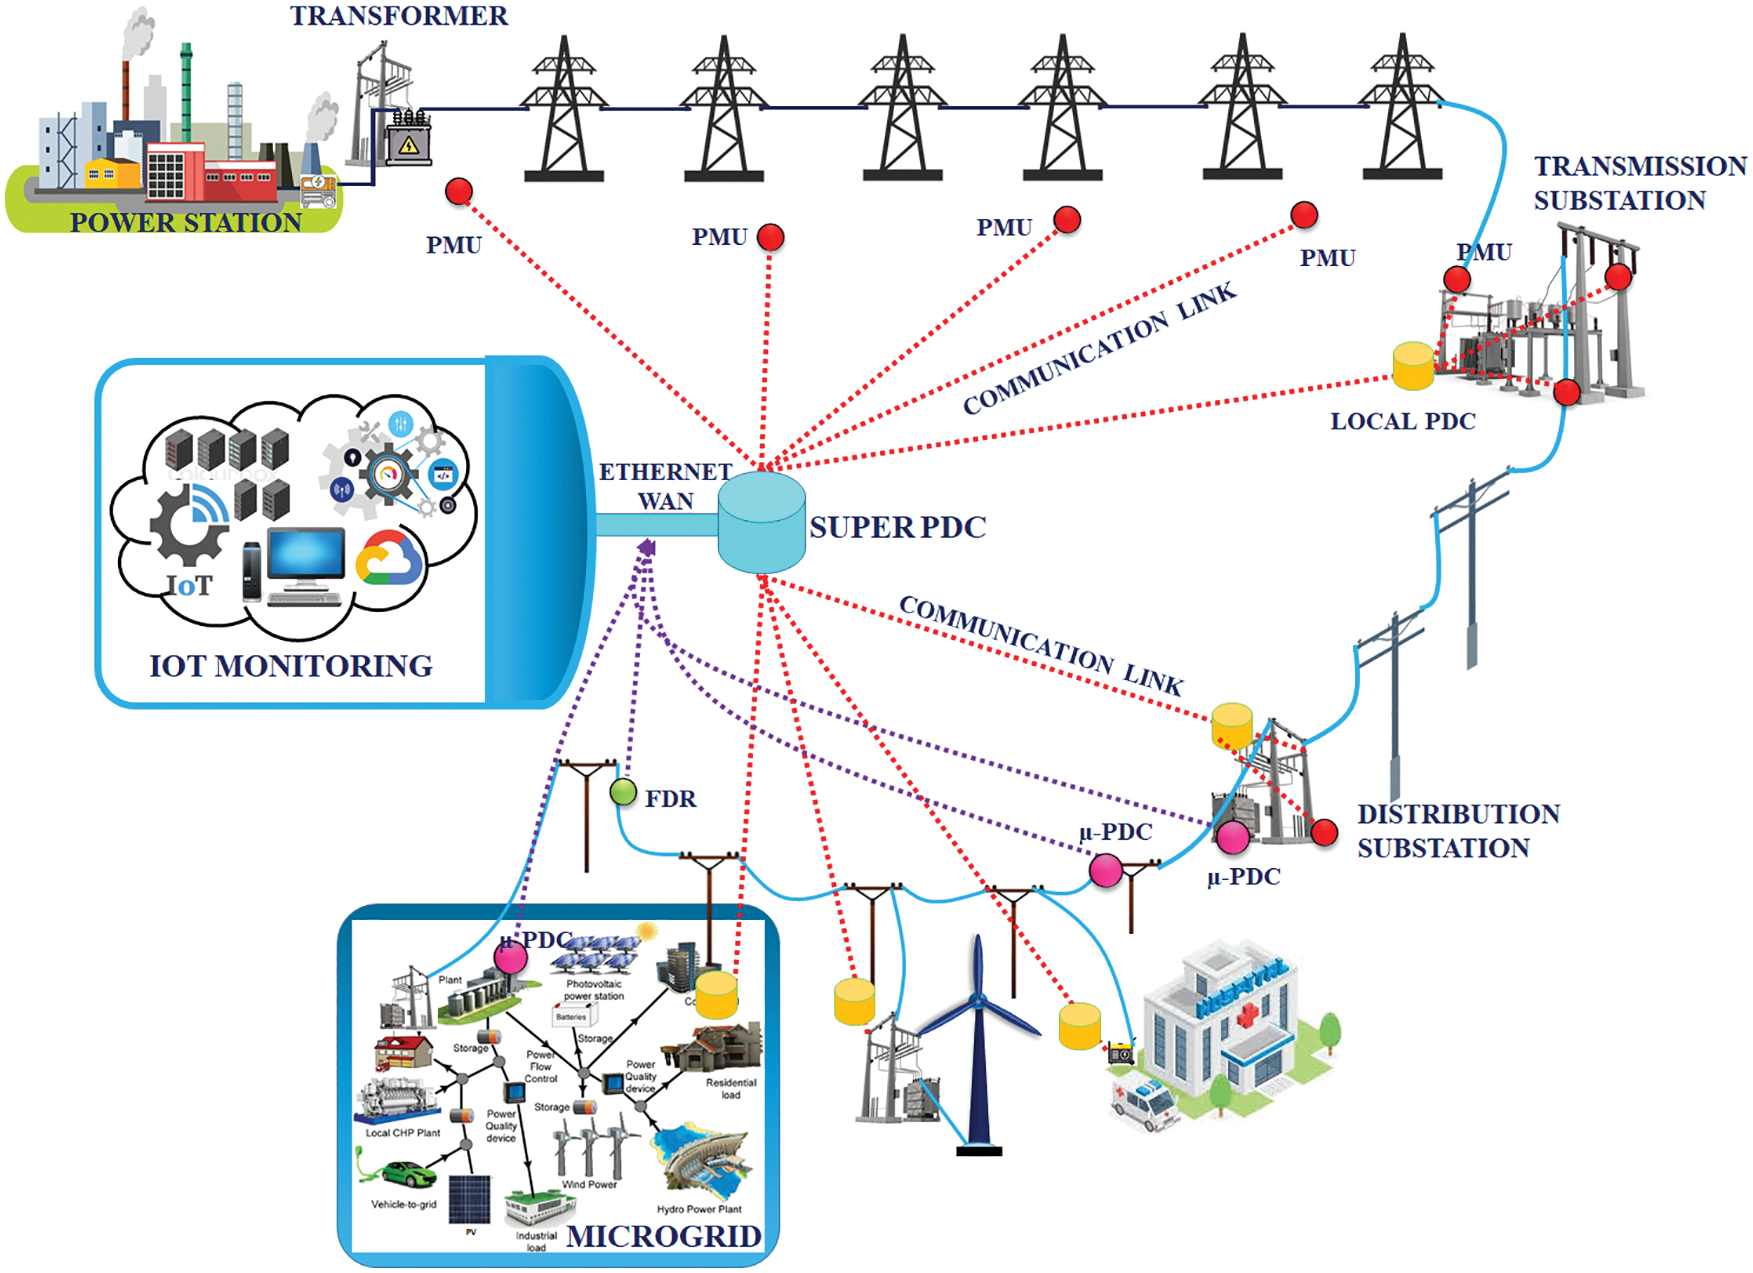
Figure 1: Function of smart grid
The technologies are characterized into four functions,
• Smart meter: Based on the collection of data from various sensors, the smart grids are formed and the components of the electricity system are characterized by these sensors. The distributed system’s output and the power are measured by the meters whereas the generated temperature and vibrations are measured by the sensors. The characteristics of the electricity in the distribution line is measured by the meters.
• Information displayer: The informations are gathered and analyzed. Then the analyzed data is displayed.
• Information controller: The controller receives the information, which controls the reduction of electricity and the voltage stabilization.
• Power resources: It minimizes the electricity demand by generating and storing the power.
Based on the cost and application, smart grid technology gets differed. In order to reduce the risk in integrating the renewables to the electricity systems, a prior consideration has to be given. Thus, the smart grids are used to provide better potential and to minimize the technological issues.
2.1.1 Integration of IoT with Smart Grid
The technologies like information sensing, transmission and preprocessing are achieved by smart grids in the earlier days but IoT is used as a significant technology for the development of grids in the recent days. In the existing power grids, the disturbances in the system are manually identified but in the smart grid, these disturbances are automatically known by the particular component called smart meter and it ceases the data that is transmitted from the sensors. Here, the IoT plays the major role in permitting this scheme as each grid components are provided with a IP address and the communication is accomplished in two-ways. The architecture of IoT in smart grid is classified into three stages. Initially, the states of equipment is analyzed by the smart devices of IoT. By this smart device, the informations are collected by using different technologies of communication. Finally, the smart grid is controlled by applying IoT and its application layers. The sensing of information at smart grid is developed by the IoT technology. In addition, the security, interaction, information collection are provided by IoT. The wifi-node Node MicroController Unit (MCU) is used as the IoT sensing device.
The sub-systems of the smart grids are power generation, transmission, distribution and utilization. However, the IoT is supplied to all these systems and it is enhanced by generating the IoT as the smart grid’s key element. In the power generating areas, the consumption of energy is monitored and controlled by IoT. At the transmission area, the transmission lines are monitored and controlled whereas the tower for transmission is protected. At the power distribution area, the equipment operations are managed and distributed automatically. At the power utilization area, the IoT with smart grid is used to improve the system performance.
The parameters that are obtained from the smart grid is transferred to the IoT web page through wifi- node MCU. The routing PNN is used to transmit the data quickly whereas the Lagrange key and the Location Based key management are used to protect the transmitted data. Thus, the data from the smart grid is transferred quickly and securely by this approach.
To transmit the received quickly to the IoT web page, the shortest path of the node is identified and transferred by using the PNN. When the number of nodes in the networks are increased, the network suffers to manage it. The Weighted Connected Dominated Sets (WCDS) of nodes with higher connectivity and energy are classified by using the PNN and the scalability of the node is identified by the clusters. The hidden layers in the PNN are used to train the data that are obtained from each nodes. At each node of the hidden layer, the clusters are placed instead of sensor node parameters. The function of the hidden layer at each node is represented as,
where,
The routing is efficiently performed by introducing the neural network, through which the sensor nodes are modeled with node dynamics and node interconnections along with other networks. The output of the present and previous sensor nodes are fed as the input for the neural network. Thus, the neural network model operates on the basis of the PNN, which assists in classifying and improving the network life span through WCDS.
For data communication, the identification of route is important since the consumption of energy during the routing performance and the network life span are decided by the route. Through this process, the clusters are formed. The sensor nodes divides the cluster as
The important factor of PNN is to select the training data sets. Thus, the clusters are considered as the trained data and these clusters are supplied to the PNN to make it highly efficient because the PNN consumes only the data with higher energy node. These nodes are then permitted to take part in the routing phase and the cluster data are assessed by measuring the distance metrics.
In WSN, n number of sensor nodes
The PNN is used to quickly transmit the data by finding the shortest path between the nodes and it is clearly explained in the Fig. 2. The cluster is formed by the following procedures,
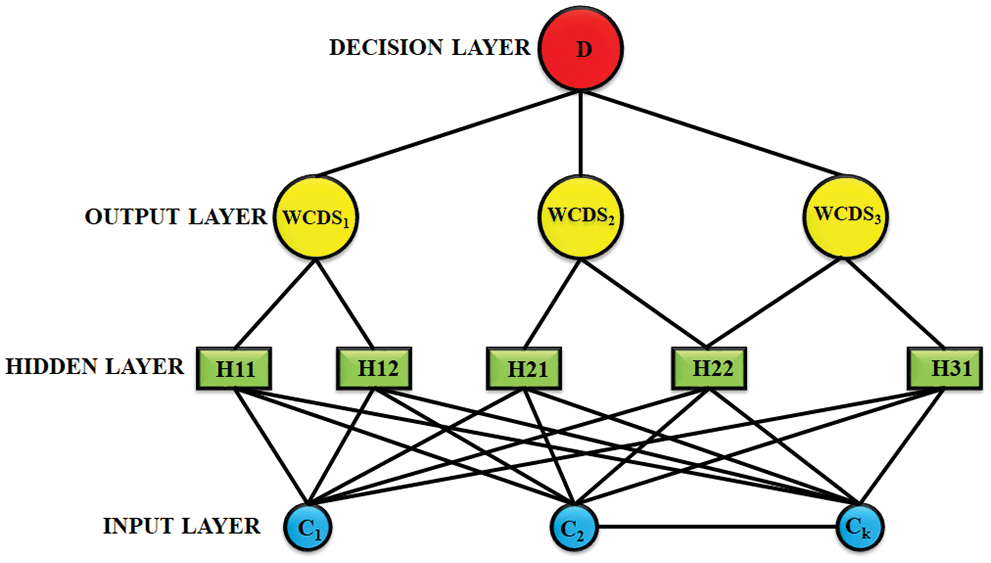
Figure 2: Classification modes of PNN
Algorithm for cluster formation:

After receiving the data from the smart grid, the PNN is used to quickly transmit that data. Through this PNN, the training data are initially formed and then the shortest path of the nodes are identified so that the data are transmitted quickly to the IoT web page. To secure the data during transition, the Lagrange and the location based keys are used.
To securely transmit the obtained data from the smart grid to the IoT web page, the keys are used. In this proposed system, the data is secured by using both the private and public keys, in which the Lagrange is used as private key. By this key, the data are encrypted at the source node and decrypted at the destination node. The LBK management is used as the public key, in which the node to node encryption and decryption is performed. Thus, the data is securely transmitted by using the key-management like Lagrange’s theorem and LBK management.
The data from the smart grid is securely transmitted by using the private key Lagrange, in which the decrypted keys are retained by using the Lagrange theorem through smart sensors in the absence of hierarchical structure in its sector departments. Thus, the Lagrange not only provides the algorithm for encryption and decryption but also provides the scheme for secured key management.
Secured Transformation of Data
The data is securely transmitted by following the three set of phases.
Phase 1 Generation of Keys
Initially, the session key is generated by the threshold cryptography and Lagrange, in which each cluster node requires minimum value of threshold
where F(0) =
Now, the partial keys
If f(0) =
In which
With the help of
The secret keys are generated by using the following mechanisms,
• The generation of id node is not generated randomly.
• The secret keys that shared are generated by this node.
• The secret keys are regenerated by placing the threshold id node permanently.
• The GF(p) polynomial equation is considered with p > n finite field.
• Select
Algorithm for key generation:

Phase 2 Encryption
• The Lagrange polynomial generate the secret key and this generated key is used as the integral form.
• This integral form provides the message in a secured way.
Phase 3 Decryption
• The session key is generated by the shared partial information.
• The integral transformation is used to decrypt the message.
2.3.2 Location Based Key-Management
The data from the smart grid is securely transmitted by using the public key of LBK management, which involves in performing the node to node encryption. In the network, the nodes are added at any situation by using the LBK management. When the node is began to initiate, it is unable to stop the node within a limited interval, which is regarded as the major constraint of this approach. After this limited interval, the node gets compromised by the adversary. Once the node is compromised, then the adversary is able to assess the keying material over the nodes. The LBK comprises of two set of nodes such as Sensor Node (SN) and Anchor Nodes (AN), among which the AN has the capacity to transmit the data at any range of power. Before placing the sensors, the common key is provided to each sensors and after initiating the sensor, each node uses this key after receiving the nonces from the AN, which leads to the generation of sub-keys. By this sub-keys, the new keys are generated between the neighboring nodes. The keys for each link are different and the common keys are avoided if it is repeated. Thus, the created sub-keys are monitored by the adversary to avoid the security lack. The LDK requires three set of phases at the sensors lifetime, which are pre-deployment, initialization and communication phases.
At the pre-deployment phase, the single common key is provided at the each nodes of both the anchor and sensor nodes to minimize the key-management cost. After this the initialization, this the beacons are transmitted from all anchor nodes. Thus, each beacon is transmitted at various power and it is generated by the nonces created by the common keys. By the anchor nodes, each sensor node is supplied through the set of beacons that are generated by the common keys. Thus, the sub-keys are generated by the sensor nodes with the supplied common keys and beacons.
To prove this, the sensor node
In the communication, the secrete links are developed by the keys that are generated in the initialization phase. To clarify this process, the parameters are used, in which the
At LDK, the nodes are added to the network at any time and the sensor nodes are initiated by the common key K to join with the network. It is situated in the deployed sensor nodes and it is then pre-deployed by the anchor nodes with the same beacons and the nonces with the same level of power. However, this pre-deployment is repeated for the newly deployed sensor nodes. Thus, the smart grid information, which is transmitted between the nodes are secured by the LDK.
Thus, the data obtained from the smart grid is transmitted to the IoT web page quickly and securely. To quickly send the data, the routing is performed by using PNN, which discovers the shortest path to transmit the data without any delay. For the fast and secured communication, the Lagrange and LBK are used. From Fig. 3, it is clear that the step by step process of key generation, encryption and decryption.
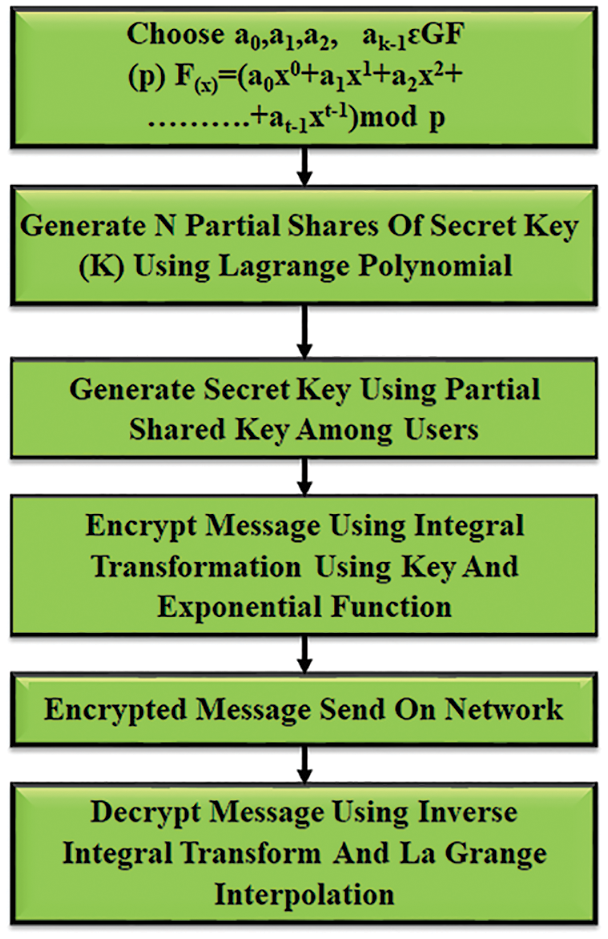
Figure 3: Flow chart for key generation, encryption and decryption
The required environment for performing the smart grid simulation contains smart meter

The data that are obtained from the smart grid includes grid voltage, grid current, frequency and output voltage. The voltage, current, frequency and speed sensors are used to monitor the speed of the devices like PV, DFIG and battery. The ADC unit is used to connect those sensors directly with the Arduino control, in which the data are converted to digital. Then the the digital data is obtained as the output of the Arduino and these outputs are directly connected to the MCU unit. Thus, the resultant data are then stored in the cloud by node MCU. From Fig. 4, It helps in monitoring the required data in the IoT web page. The Mean error comparison of proposed PNN with the existing CNN and DSR is given in the Tab. 2.
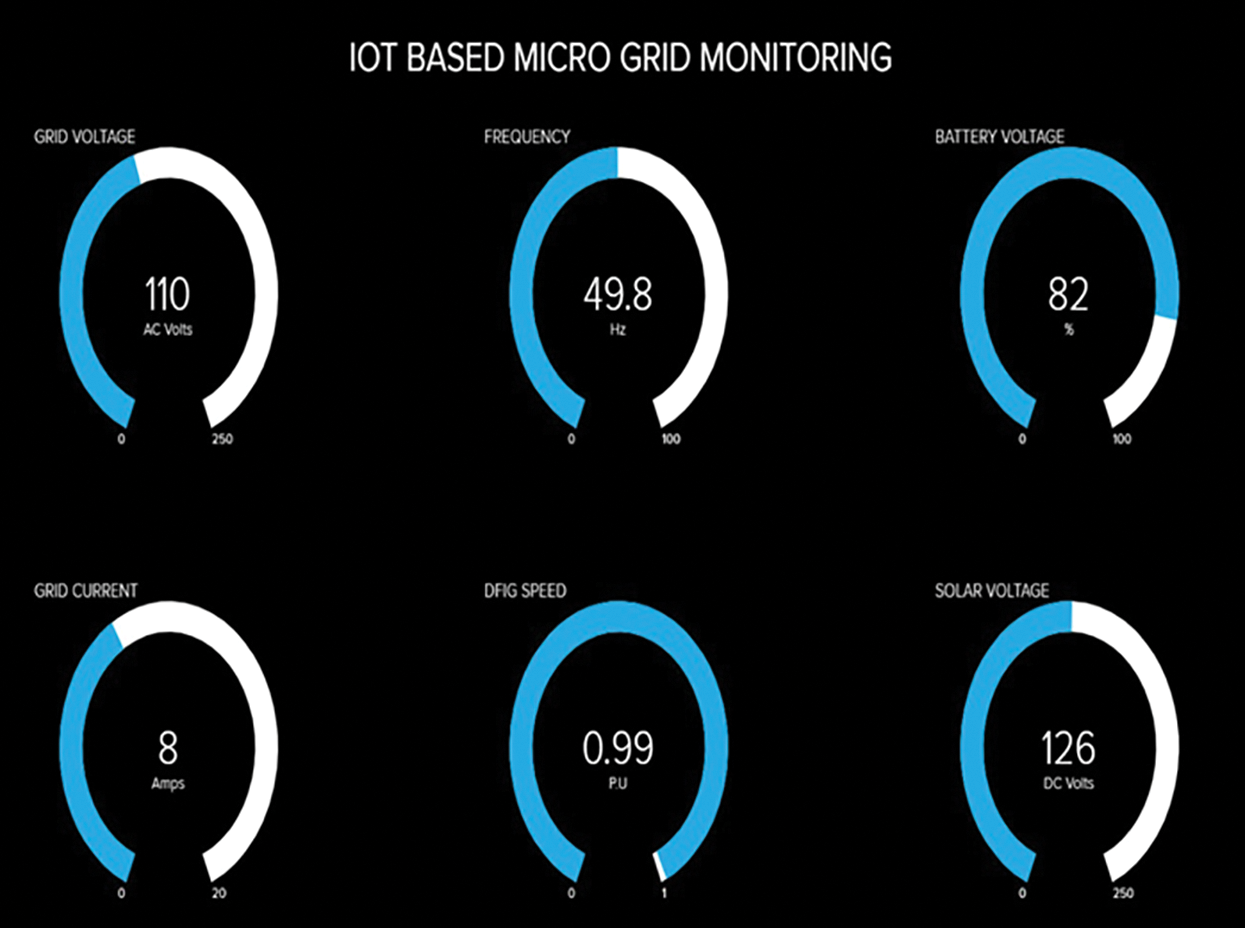
Figure 4: Smart grid monitoring in IoT page

3.2 Performance Analysis for Encryption and Decryption
The keys are generated with the interval and the required time to create the keys is given in Fig. 5. The data from clouds is assessed by several users and then the keys are generated at the small interval of time by the clouds. However, the proposed work achieves less consumption of time to generate the keys for encrypting and decrypting the messages.
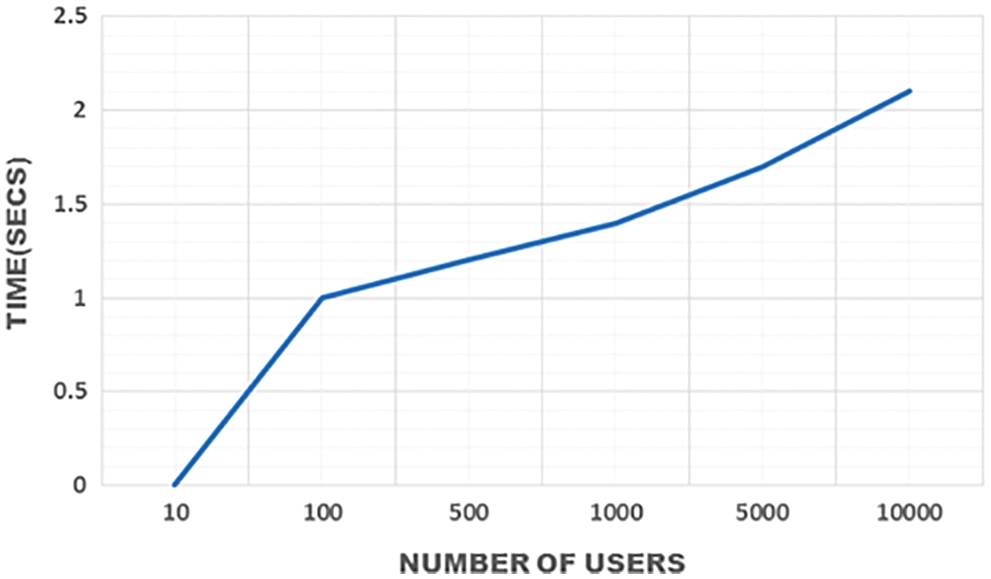
Figure 5: Time required for generating keys
The required time for performing the encryption and decryption is achieved by the size of the data as represented in the Figs. 6 and 7. In this figure, the increase of time depends on the size of the file and the time that is required to perform this files is less in this operation.
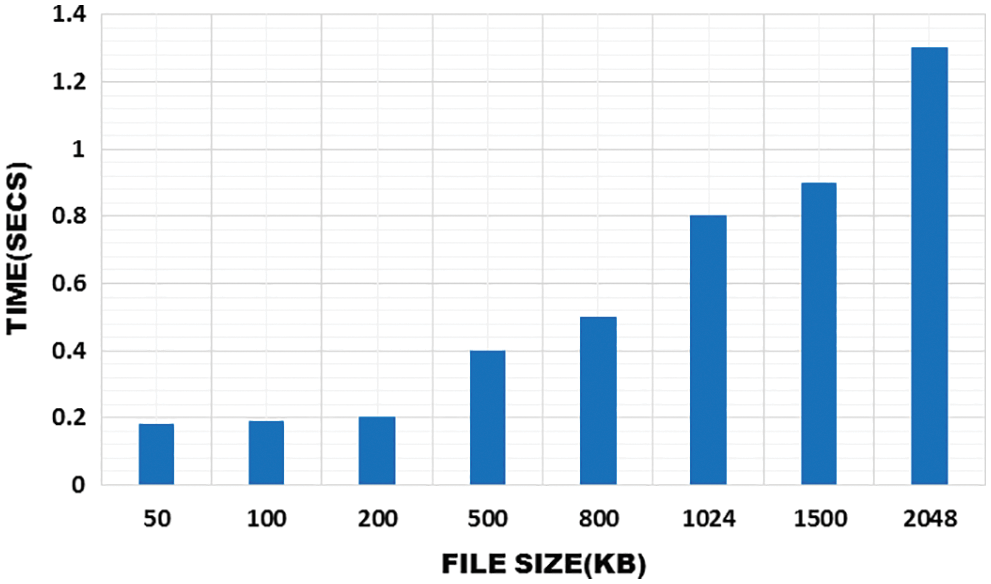
Figure 6: Time required for encryption
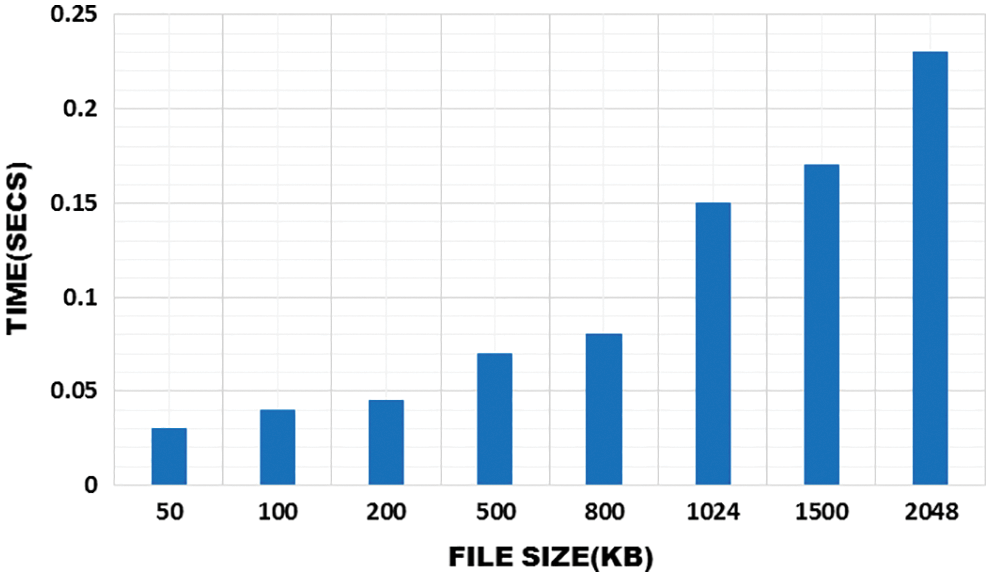
Figure 7: Time required for decryption
From Fig. 8, it is clear that the PNN achieves the maximum score. When the user request the service, the PNN acts quickly by satisfying its client at the top notch. Various decision factors are represented in the following figures. Initially, the decision threshold for satisfaction is performed to find whether the transaction is favorable or not. The satisfactory and analogizing rates are achieved in high level for lower threshold gain whereas the satisfactory and the analogizing rates for the higher threshold are improved by performing exact resource classification. When the preference of the users are increased at various threshold, the transmission is steadily achieved at the given interval of time. The user satisfactory comparison is represented in Fig. 9.
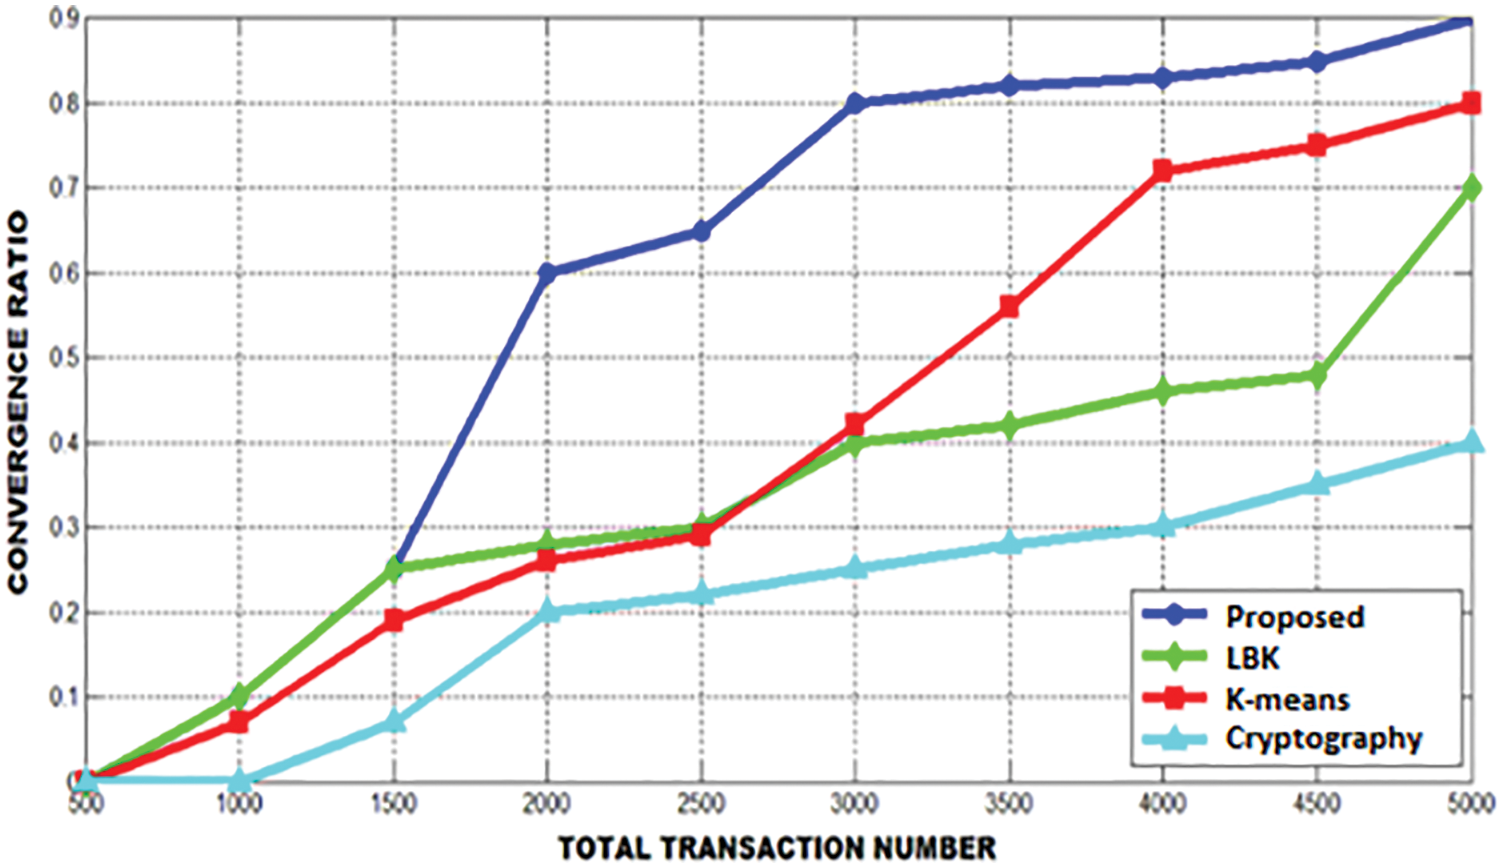
Figure 8: Convergence ratio comparison
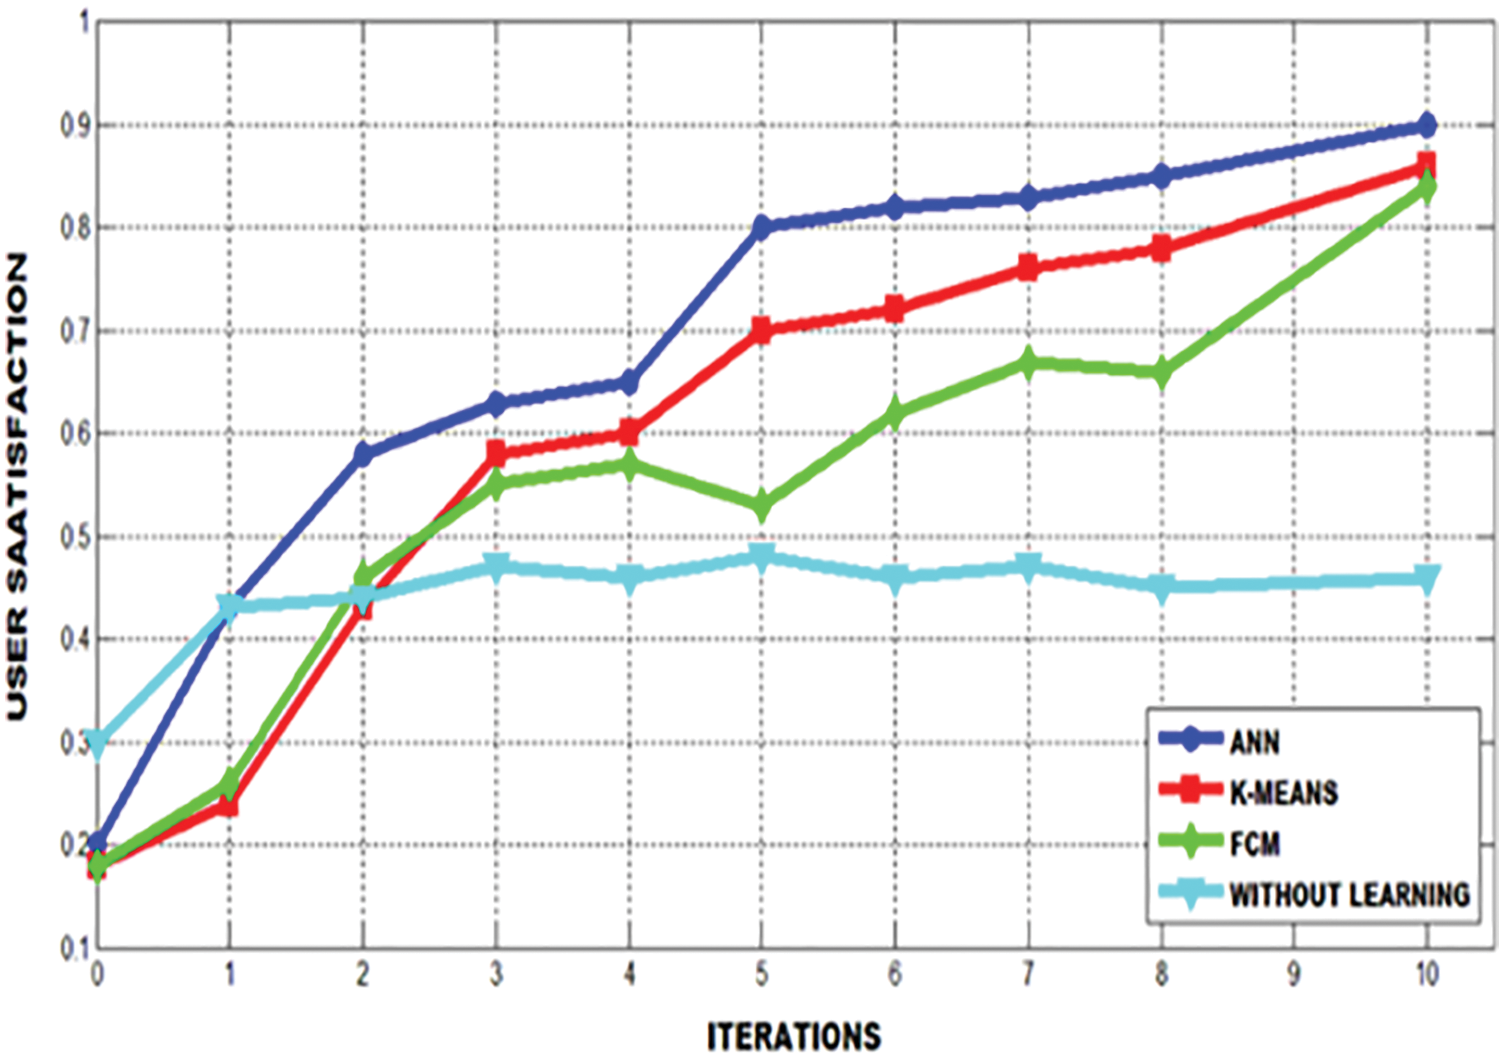
Figure 9: User satisfactory comparison
The success ratio of service matching with various decision thresholds are represented in Fig. 10 and the user satisfaction's success ratio is shown in Fig. 11. It is clear that the user satisfaction level is slightly enhanced
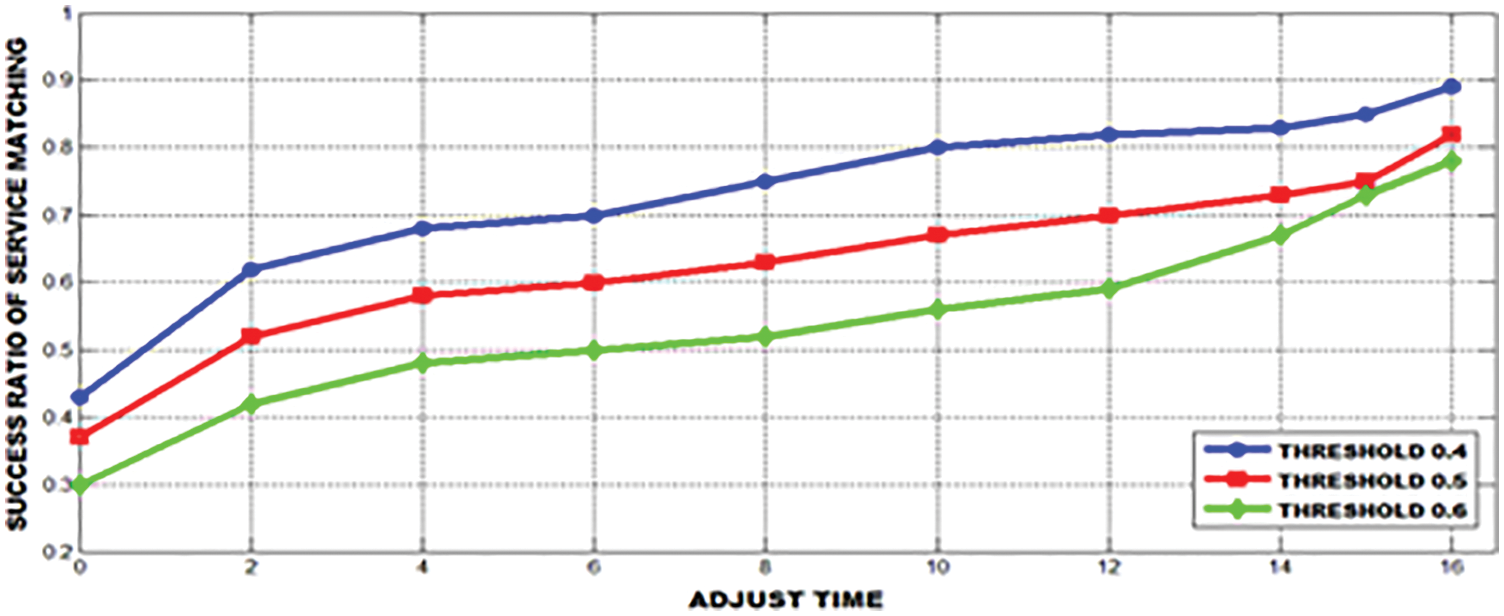
Figure 10: Success ratio of service matching with various decision thresholds
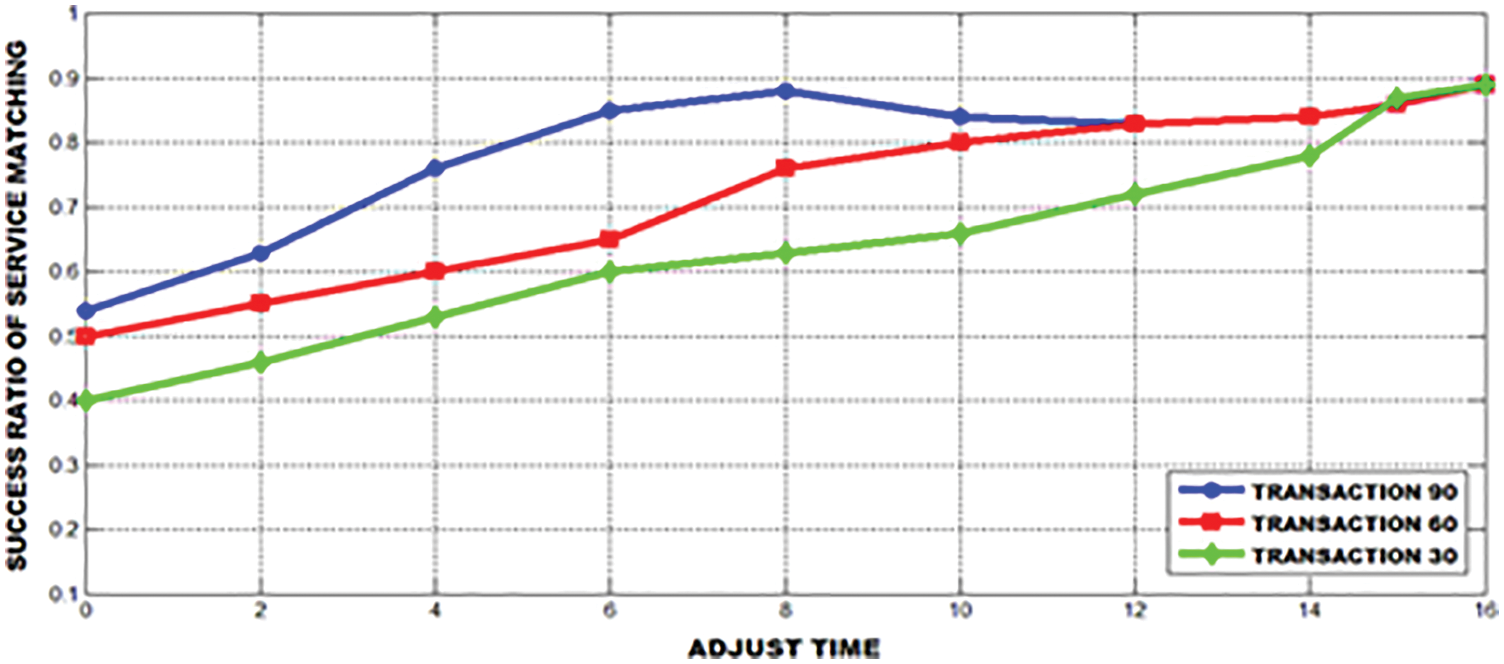
Figure 11: User satisfaction’s success ratio
The performance of the distance based localization is done by the replica place whereas the mobile roaming at 120 m × 120 m is assigned unevenly by 10 sensor nodes and 4 anchor nodes. The ratio of error with the fixed distance is 0.1 for the whole network and the valid approximation of space is 90. The error in mean approximation is found by building the unequal locations for mobile sensors. The system undergoes four iteration, through which the mean error is found. It is enlarged to 4:8096–6:3613 in dynamic stage and absence of enlargement in static stage. From Fig. 12, it is clear that there are several amount of aberrant users and however, the ratio of success is reasonably enhanced.
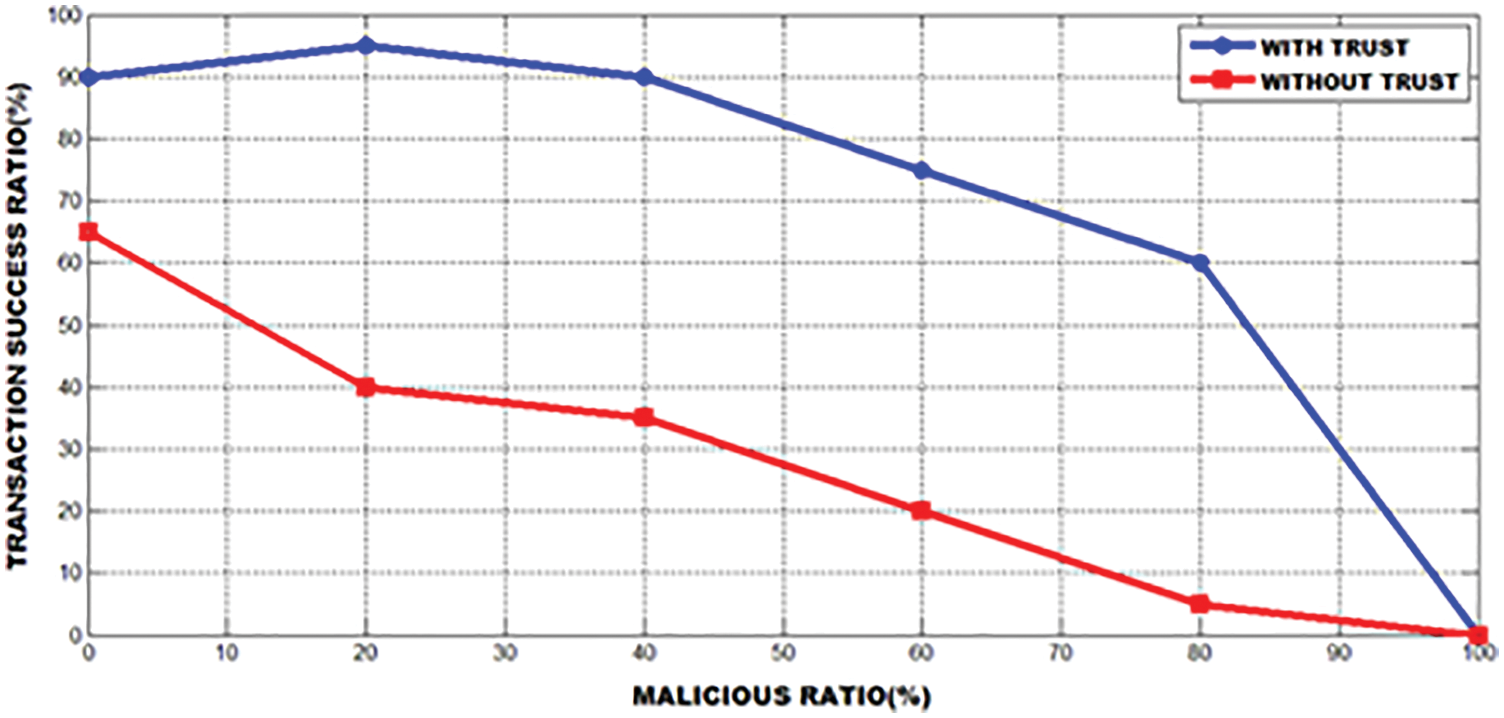
Figure 12: Effect of trust in transaction ratio of success
The iterations for mean estimation of proposed PNN is compared with the existing CNN and DSR is shown in Fig. 13. By this comparison, it is clear that the rank of communication is varied as 100, 200, 300, 400, 500 m. By monitoring the delivery ratio, detain, energy utilization and throughput, the PNN drops joining the range of transmission.
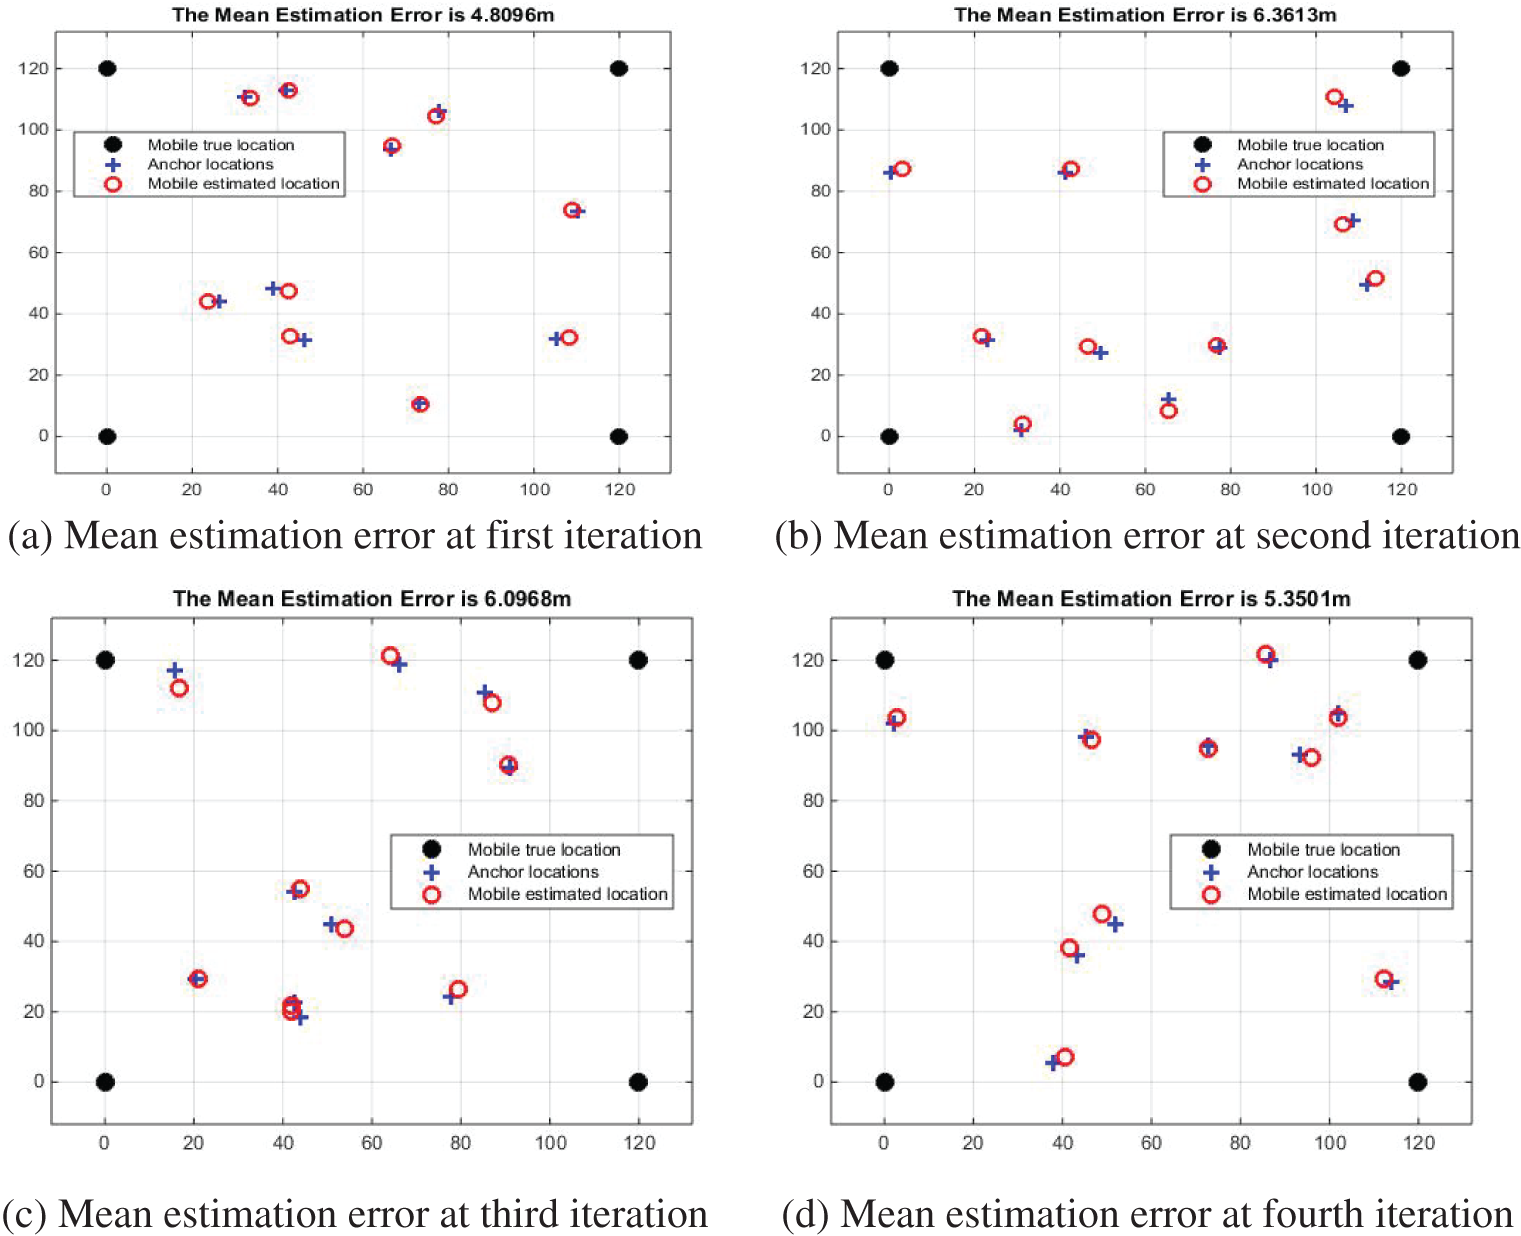
Figure 13: Four iteration for mean iteration
From the Fig. 14, the proposed PNN is compared with the existing CNN and DSR in terms of delivery ratio. By this comparison, it is clear that the proposed method is better than the existing methods.
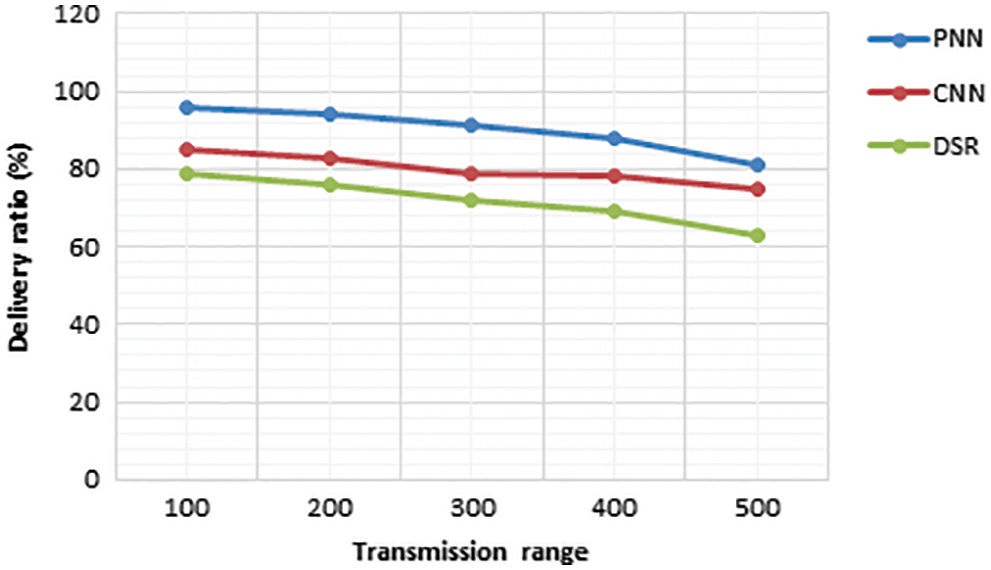
Figure 14: Transmission range vs delivery ratio
The estimation of delay is obtained by comparing the proposed PNN with the existing CNN and DSR. From Fig. 15, it is clear that the delay in PNN is reduced than the existing methods.
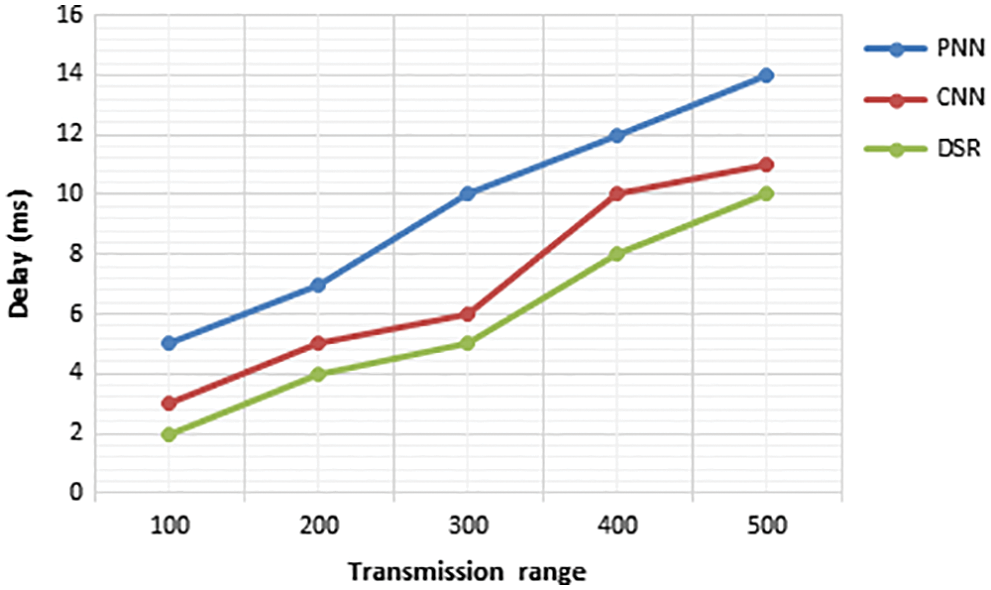
Figure 15: Transmission range vs. delay
The PNN is compared with the existing methods like CNN and DSR to evaluate the amount of energy consumption. Fig. 16 validates that the the PNN requires small amount of energy than the other conventional methods.
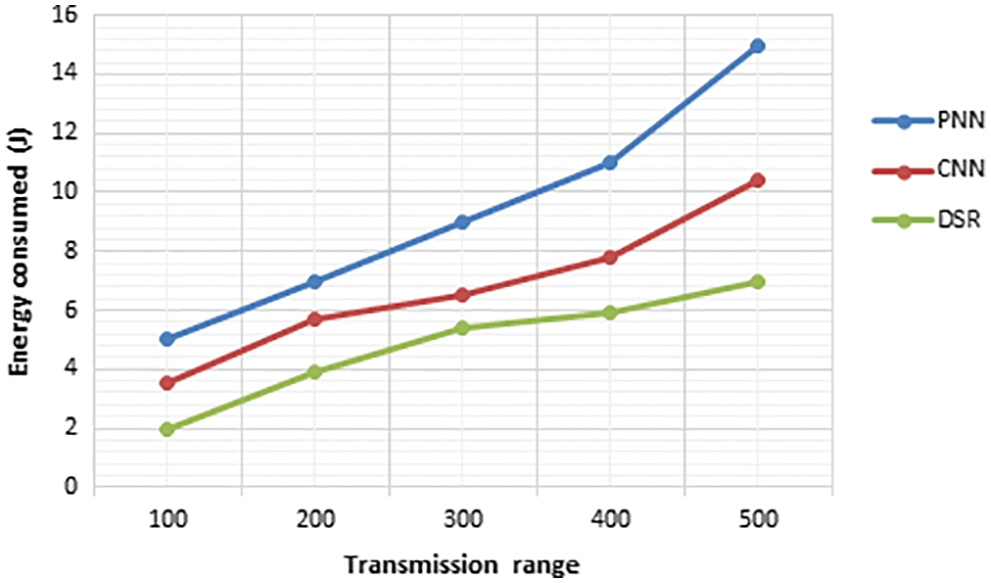
Figure 16: Transmission range vs. energy consumption
The throughput is evaluated by comparing the proposed PNN method with the existing CNN and DSR. From Fig. 17, it is proved that the throughput of the PNN is higher than the the existing methods.
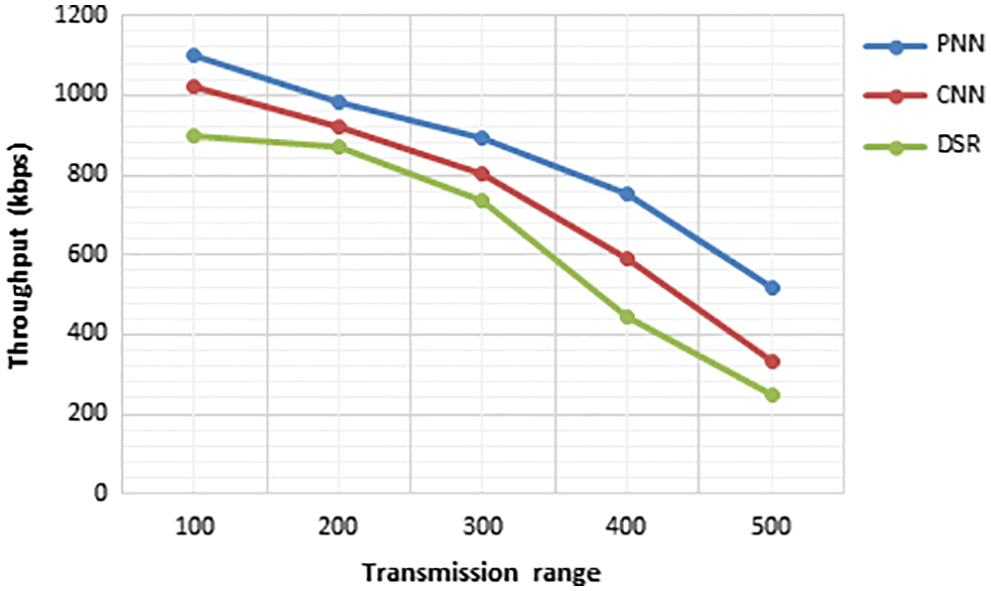
Figure 17: Transmission range vs. throughput
The packet drop in the PNN is evaluated by comparing it with the existing CNN and DSR methods. As per the Fig. 18, it is clear that the PNN throughput is improved than the existing methods.
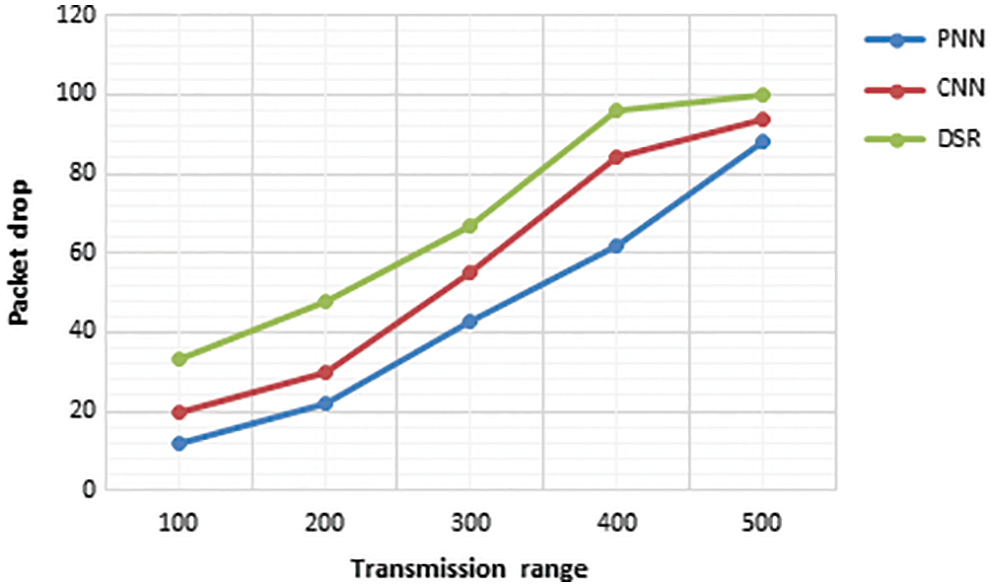
Figure 18: Transmission range vs. packet drop
3.3 Analysis of Energy Consumption
The transmission system at all nodes is evaluated by the standard delimited technique, which is actually a calculation of energy utilization. The mean value in the transmission is used to exchange the informations between the webs with the controlled sensor nodes. The duplicate mean value at the transmission is examined by the required rank for the techniques PNN, CNN, DSR with beacon nodes of 20%. The mean range is 4 and the web nodes are given as 100, 150, 200, 250, 300, 350, 400 as represented at Fig. 19.
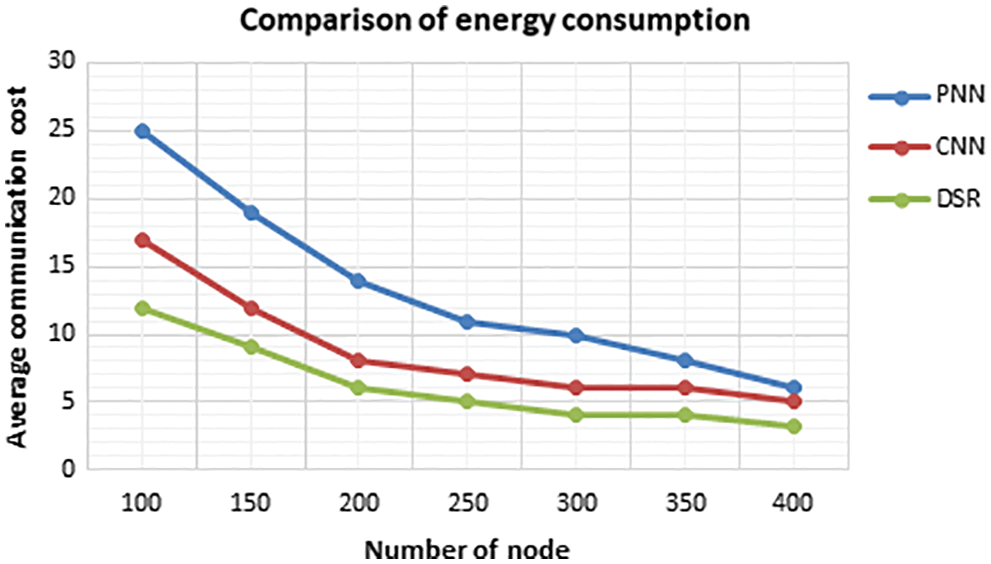
Figure 19: Comparison of energy consumption
When the web node is maximized at the node 200, it minimizes the fraction to 10% in the comparison of PNN, CNN, DSR, which is significantly portrayed Fig. 19. When the node is maximized, the perfectly situated nodes are also maximized but the the required gain gets lowered when the node is improved to 200. When the node to be transmitted is less than 250, the mean of DSR is 4 times lesser than the CNN whereas CNN is 2 times lesser than the PNN, which shows that the DSR transmission is balanced by decreasing the 50% through the implementation of CNN. However, there is no contact between the beacon nodes and undetermined nodes. When the data is transmitted by the undetermined node, the overall data are minimized by the proposed method and it is transmitted to the web by minimizing the mean transmission.
The mistakes in the velocity are minimized and the amount of reference node is improved. In addition, the mean value is provided. When the value of mean is high, the inserted error is increased by reducing the dependence of reference node velocity. By using the PNN, the factors like throughput, packet drop, delay energy consumptions are optimized.
In WSN, data is transmitted without any disruptions by utilizing secured communication and data distribution but the security of data is low in this method. In this work, the smart grid is considered as the source node to develop the flexibility, efficiency and adaptability. The major role of smart grid is the sensing of data and communication. The data from the smart grid is quickly transferred through the routing PNN by discovering the shortest path of nodes. The key-management is used to perform the communication with security whereas the Lagrange theorem LBK management is utilized to generate the secret keys for transmitting the data between the keys without ant interior threats. The Lagrange theorem is used to minimize the distortions in the transmitted signals. Thus, the security, throughput, packet loss and delay are regulated to a greater extent by this proposed work.
Funding Statement: The authors received no specific funding for this study.
Conflicts of Interest: The authors declare that they have no conflicts of interest to report regarding the present study.
References
1. D. Ma, X. Du, A. Xiao, R. Xiao, L. Ma et al., “A lossless convergence method for reducing data fragments on WSN,” IEEE Access, vol. 7, pp. 146158–146169, 2019. [Google Scholar]
2. M. U. Rehman, I. Uddin, M. Adnan, A. Tariq and S. Malik, “VTA-SMAC: Variable traffic-adaptive duty cycled sensor MAC protocol to enhance overall QoS of S-MAC protocol,” IEEE Access, vol. 9, pp. 33030–33040, 2021. [Google Scholar]
3. M. Groth, M. Rzymowski, K. Nyka and L. Kulas, “ESPAR antenna-based WSN node with DoA estimation capability,” IEEE Access, vol. 8, pp. 91435–91447, 2020. [Google Scholar]
4. Z. Zhou, J. Xu, Z. Zhang, F. Lei and W. Fang, “Energy-efficient optimization for concurrent compositions of WSN services,” IEEE Access, vol. 5, pp. 19994–20008, 2017. [Google Scholar]
5. M. Farsi, M. Badawy, M. Moustafa, H. A. Ali and Y. Abdulazeem, “A congestion-aware clustering and routing (CCR) protocol for mitigating congestion in WSN,” IEEE Access, vol. 7, pp. 105402–105419, 2019. [Google Scholar]
6. M. A. U. Rehman, R. Ullah, B. S. Kim, B. Nour and S. Mastorakis, “CCIC-WSN: An architecture for single-channel cluster-based information-centric wireless sensor networks,” IEEE Internet of Things Journal, vol. 8, no. 9, pp. 7661–7675, 2021. [Google Scholar]
7. L. Rodrigues, E. Leão, C. Montez, R. Moraes, P. Portugal et al., “An advanced battery model for WSN simulation in environments with temperature variations,” IEEE Sensors Journal, vol. 18, pp. 8179–8191, 2018. [Google Scholar]
8. J. W. Lin, P. R. Chelliah, M. C. Hsu and J. X. Hou, “Efficient fault-tolerant routing in IoT wireless sensor networks based on bipartite-flow graph modeling,” IEEE Access, vol. 7, pp. 14022–14034, 2019. [Google Scholar]
9. T. M. Behera, S. K. Mohapatra, U. C. Samal, M. S. Khan, M. Daneshmand et al., “I-SEP: An improved routing protocol for heterogeneous WSN for IoT-based environmental monitoring,” IEEE Internet of Things Journal, vol. 7, pp. 710–717, 2019. [Google Scholar]
10. X. Yu, J. Qiu, X. Yang, Y. Cong and L. Du, “An graph-based adaptive method for fast detection of transformed data leakage in IoT Via WSN,” IEEE Access, vol. 7, pp. 137111–137121, 2019. [Google Scholar]
11. N. A. M. Alduais, J. Abdullah and A. Jamil, “RDCM: An efficient real-time data collection model for IoT/WSN edge with multivariate sensors,” IEEE Access, vol. 7, pp. 89063–89082, 2019. [Google Scholar]
12. S. K. Yang, Y. M. Shiue, Z. Y. Su, I. H. Liu and C. G. Liu, “An authentication information exchange scheme in WSN for IoT applications,” IEEE Access, vol. 8, pp. 9728–9738, 2020. [Google Scholar]
13. S. Bera, S. Misra, S. K. Roy and M. S. Obaidat, “Soft-WSN: Software-defined WSN management system for IoT applications,” IEEE Systems Journal, vol. 12, no. 3, pp. 2074–2081, 2018. [Google Scholar]
14. G. Yıldırım and Y. Tatar, “Simplified agent-based resource sharing approach for WSN-WSN interaction in IoT/CPS projects,” IEEE Access, vol. 6, pp. 78077–78091, 2018. [Google Scholar]
15. J. Choi, J. Bang, L. H. Kim, M. Ahn and T. Kwon, “Location-based key management strong against insider threats in wireless sensor networks,” IEEE Systems Journal, vol. 11, no. 2, pp. 494–502, 2017. [Google Scholar]
16. M. Griotti, F. Gandino and M. Rebaudengo, “Transitory master key transport layer security for WSNs,” IEEE Access, vol. 8, pp. 20304–20312, 2020. [Google Scholar]
17. F. Gandino and A. Servetti, “Key recoverability in wireless sensor networks,” IEEE Access, vol. 7, pp. 164407–164417, 2019. [Google Scholar]
18. F. Gandino, R. Ferrero and M. Rebaudengo, “A key distribution scheme for mobile wireless sensor networks: q - s –composite,” IEEE Transactions on Information Forensics and Security, vol. 12, no. 1, pp. 34–47, 2017. [Google Scholar]
19. H. Fakhrey, M. Johnston, F. Angelini and R. Tiwari, “The optimum design of location-dependent key management protocol for a multiple sink WSN using a random selected cell reporter,” IEEE Sensors Journal, vol. 18, no. 24, pp. 10163–10173, 2018. [Google Scholar]
20. A. Mehmood, Z. Lv, J. Lloret and M. M. Umar, “ELDC: An artificial neural network based energy-efficient and robust routing scheme for pollution monitoring in WSNs,” IEEE Transactions on Emerging Topics in Computing, vol. 8, no. 1, pp. 106–114, 2020. [Google Scholar]
21. K. Zhang, K. Yang, S. Li, D. Jing and H. B. Chen, “ANN-based outlier detection for wireless sensor networks in smart buildings,” IEEE Access, vol. 7, pp. 95987–95997, 2019. [Google Scholar]
22. Z. Munadhil, S. K.Gharghan, A. H. Mutlag, A. A. Naji and J. Chahl, “Neural network-based Alzheimer’s patient localization for wireless sensor network in an indoor environment,” IEEE Access, vol. 8, pp. 150527–150538, 2020. [Google Scholar]
23. L. Zhao, H. Huang, X. Li, S. Ding, H. Zhao et al., “An accurate and robust approach of device-free localization with convolutional autoencoder,” IEEE Internet of Things Journal, vol. 6, no. 3, pp. 5825–5840, 2019. [Google Scholar]
24. R. Vinayakumar, M. Alazab, K. P. Soman, P. Poornachandran, A. A. Nemrat et al., “Deep learning approach for intelligent intrusion detection system,” IEEE Access, vol. 7, pp. 41525–41550, 2019. [Google Scholar]
25. V. K. Menaria, S. C. Jain, N. Raju, R. Kumari, A. Nayyar et al., “NLFFT: A novel fault tolerance model using artificial intelligence to improve performance in wireless sensor networks,” IEEE Access, vol. 8, pp. 149231–149254, 2020. [Google Scholar]
Cite This Article
 Copyright © 2023 The Author(s). Published by Tech Science Press.
This work is licensed under a Creative Commons Attribution 4.0 International License , which permits unrestricted use, distribution, and reproduction in any medium, provided the original work is properly cited.
 Downloads
 Citation Tools