
 Submit a Paper
 Propose a Special lssue
 Open Access
ARTICLE
An Intelligent Intrusion Detection System in Smart Grid Using PRNN Classifier
1 Department of Electrical and Electronics Engineering, Government College of Engineering, Srirangam, Trichy, 620012, India
2 Department of Electrical and Electronics Engineering, Thiagarajar College of Engineering, Madurai, 625015, India
* Corresponding Author: P. Ganesan. Email:
Intelligent Automation & Soft Computing 2023, 35(3), 2979-2996. https://doi.org/10.32604/iasc.2023.029264
Received 01 March 2022; Accepted 22 April 2022; Issue published 17 August 2022
 View Full Text
 Download PDF
Abstract
Typically, smart grid systems enhance the ability of conventional power system networks as it is vulnerable to several kinds of attacks. These vulnerabilities might cause the attackers or intruders to collapse the entire network system thus breaching the confidentiality and integrity of smart grid systems. Thus, for this purpose, Intrusion detection system (IDS) plays a pivotal part in offering a reliable and secured range of services in the smart grid framework. Several existing approaches are there to detect the intrusions in smart grid framework, however they are utilizing an old dataset to detect anomaly thus resulting in reduced rate of detection accuracy in real-time and huge data sources. So as to overcome these limitations, the proposed technique is presented which employs both real-time raw data from the smart grid network and KDD99 dataset thus detecting anomalies in the smart grid network. In the grid side data acquisition, the power transmitted to the grid is checked and enhanced in terms of power quality by eradicating distortion in transmission lines. In this approach, power quality in the smart grid network is enhanced by rectifying the fault using a FACT device termed UPQC (Unified Power Quality Controller) and thereby storing the data in cloud storage. The data from smart grid cloud storage and KDD99 are pre-processed and are optimized using Improved Aquila Swarm Optimization (IASO) to extract optimal features. The probabilistic Recurrent Neural Network (PRNN) classifier is then employed for the prediction and classification of intrusions. At last, the performance is estimated and the outcomes are projected in terms of grid voltage, grid current, Total Harmonic Distortion (THD), voltage sag/swell, accuracy, precision, recall, F-score, false acceptance rate (FAR), and detection rate of the classifier. The analysis is compared with existing techniques to validate the proposed model efficiency.Keywords
Smart grid is an upcoming and developing technology which carries intelligently to the final users by two-way interaction. But this technology is subjected to numerous cyber-attacks because of the characteristic’s weakness of the network. In order to secure and protect the networks of smart grid Intrusion Detection System is used. IDS enhances the security of smart grid by identifying the malicious tasks in the network. Usually, the cyberattacks in contradiction of Smart grid focus the Integrity, Availability and Confidentiality of the included systems and interactions. False Data Injection (FDI) attacks and Man in the Middle attacks (MiTM) disrupt the integrity and confidentiality respectively. The availability rule is violated by the different Denial of Service DoS attacks. An Advanced Persistent Threat (APT) is the hazardous cyberthreat for Smart Grid. Intrusion detection system (IDS) performs a vital role on smart grid and safeguards from the cyber-attacks [1]. The main role of Smart Grid is to offer the companies with perceptibility and services of prevalent control and new interaction abilities so as to communicate with one another and understand the transaction of electricity through the grid. An important advantage of IDS is its capability to identify zero-day cyber-attacks and irregularities that are not known, using the Deep Learning (DL) and Machine Learning Methods (ML). At last, the operational layer finds the potential irregularities like voltage of generator motor, exciter motor voltage and speed of the generator motor [2]. Various techniques have been suggested to develop the security of smart grid. For example, intrusion detection systems (IDS) can identify threats that are not known, cyber-attacks and vulnerabilities in any system. IDS domain is the part of security and plays an important role for the maintenance and protection of a secure network [3]. In addition, Price manipulation attacks threaten the integrity data of smart grid that lead to large modifications in the power consumption that disarrange the stability of the smart grid [4]. The communication network of the smart grid can be classified into Wide Area Network (WAN), Home Area Network (HAN) and Neighborhood Area Network (NAN) [5]. A huge quantity of energy needs suitable analysis of data and methods of anomaly detection [6].
Although the resolutions suggested are able to immunize the power systems and are functional, they are arithmetically very high cost and not measurable for complex networks. Hence a chance for methods of data analysis like Machine Learning arises to manage the complex dataset structure along with Artificial Intelligence (AI) to identify and avoid cyber-attacks. Machine Learning Algorithms can be employed to discover huge integration of sensor states, inputs and control [7]. The major intention of the proposed technique is to employ both real-time raw data from the smart grid network and KDD99 dataset thus detecting anomalies in the smart grid network.
The organization of the remaining article is given below. Section 2 analyses the prevailing studies. Section 3 narrates the suggested mechanism and methods adopted. The experiments are performed and outputs are offered in Section 4. The conclusion of this paper is in Section 5.
The author in the paper [8] designed a strategy for big data with the help of different machine learning methods and intrusion detection is done on the basis of classifications pertaining to the datasets of synchro phasor. In this work different machine learning methods such as support vector machines, deep neural networks, random forest, naive bayes and decision trees are performed for the datasets of synchro phasor. Smart grid is the enhanced version of the ancient grid that makes it more effective. Reference [9] considered the detection and avoidance of intrusions in the recent network systems. The use of mathematical instruments is suggested to process the outputs of telecommunication systems and analyze the arithmetic features of traffic in the network. Reference [10] evolved the next version power grid pattern that allows the transmission of real time messages among the users and the company through smart meters and Advanced metering infrastructure (AMI). Reference [11] served as a guide to many learning methods and review on applications in Intrusion Detection System that represents possible chances in Smart Grid security. Specification based can be considered as the most appropriate detection engines for Cyber Physical Systems (CPS) containing Smart Grid. Reference [12] focused on the necessity for defining anomaly detection techniques that are able to face the drift, for example, structure of the family altars, a house may turn into second residence etc. This adopted a network of short- or long-term memory with the purpose to forecast the user’s activity on the basis of recent previous utilizations. Reference [13] reported a project that supports the company through huge anomaly detection analysis on the information of Czech Republic. It has been seen that transfer of distribution of energy powered by Information and Communication Technologies (ICT) is known as Smart Grid. Reference [14] developed an IDS Intrusion detection System for Smart Grids using IEC 61850’s GOOSE messages Generic Object-Oriented Substation Event. Reference [15] framed the planned communication among hypervisor observing its vSDN and the origin of new flow possibly starting a Distributed Denial of Service (DDoS) attack through switches, as an active Bayesian game of intrusion detection. The smart grids in future need enhanced abilities on the basis of processing, automation, communication and monitoring. Reference [16] formulated two IDS Intrusion Detection System model issues for Smart grids. An experimental method is enhanced on the basis of column creation method to minimize the time of computation. Reference [17] monitored a smart grid with the use of ICT Information and communication technology devices that need methods for finding the irregularities such as cyberattacks, faults etc. The detection and differentiation of anomalies triggered by the cyberattack in contrast to the power system is obtained. Reference [18] proposed a system of statistical-based anomaly detection method based on supervised learning, and implemented a Lambda system with the in-memory distributed computing framework, Spark and its extension Spark Streaming. Reference [19] Suggested the framework of encoder-decoder in recurrent neural network (RNN) to identify an anomaly. Enhancing the reliability of power systems through anomaly detection in smart grid is critical. Reference [20] Evolved with a technique of generative model for anomaly detection that adopts the hierarchical structure of the network and the data collected from smart meters (SMs). The model is aimed to find the existence of anomalous events and unusual conditions at both customer and lateral levels. Three challenges existing in SG analytics are addressed as large-scale multivariate count measurements, missing points; and variable selection in this paper.
A comprehensive depiction of the proposed work strategy is provided here. The overall workflow and simulation setp is shown below in Figs. 1 and 2.
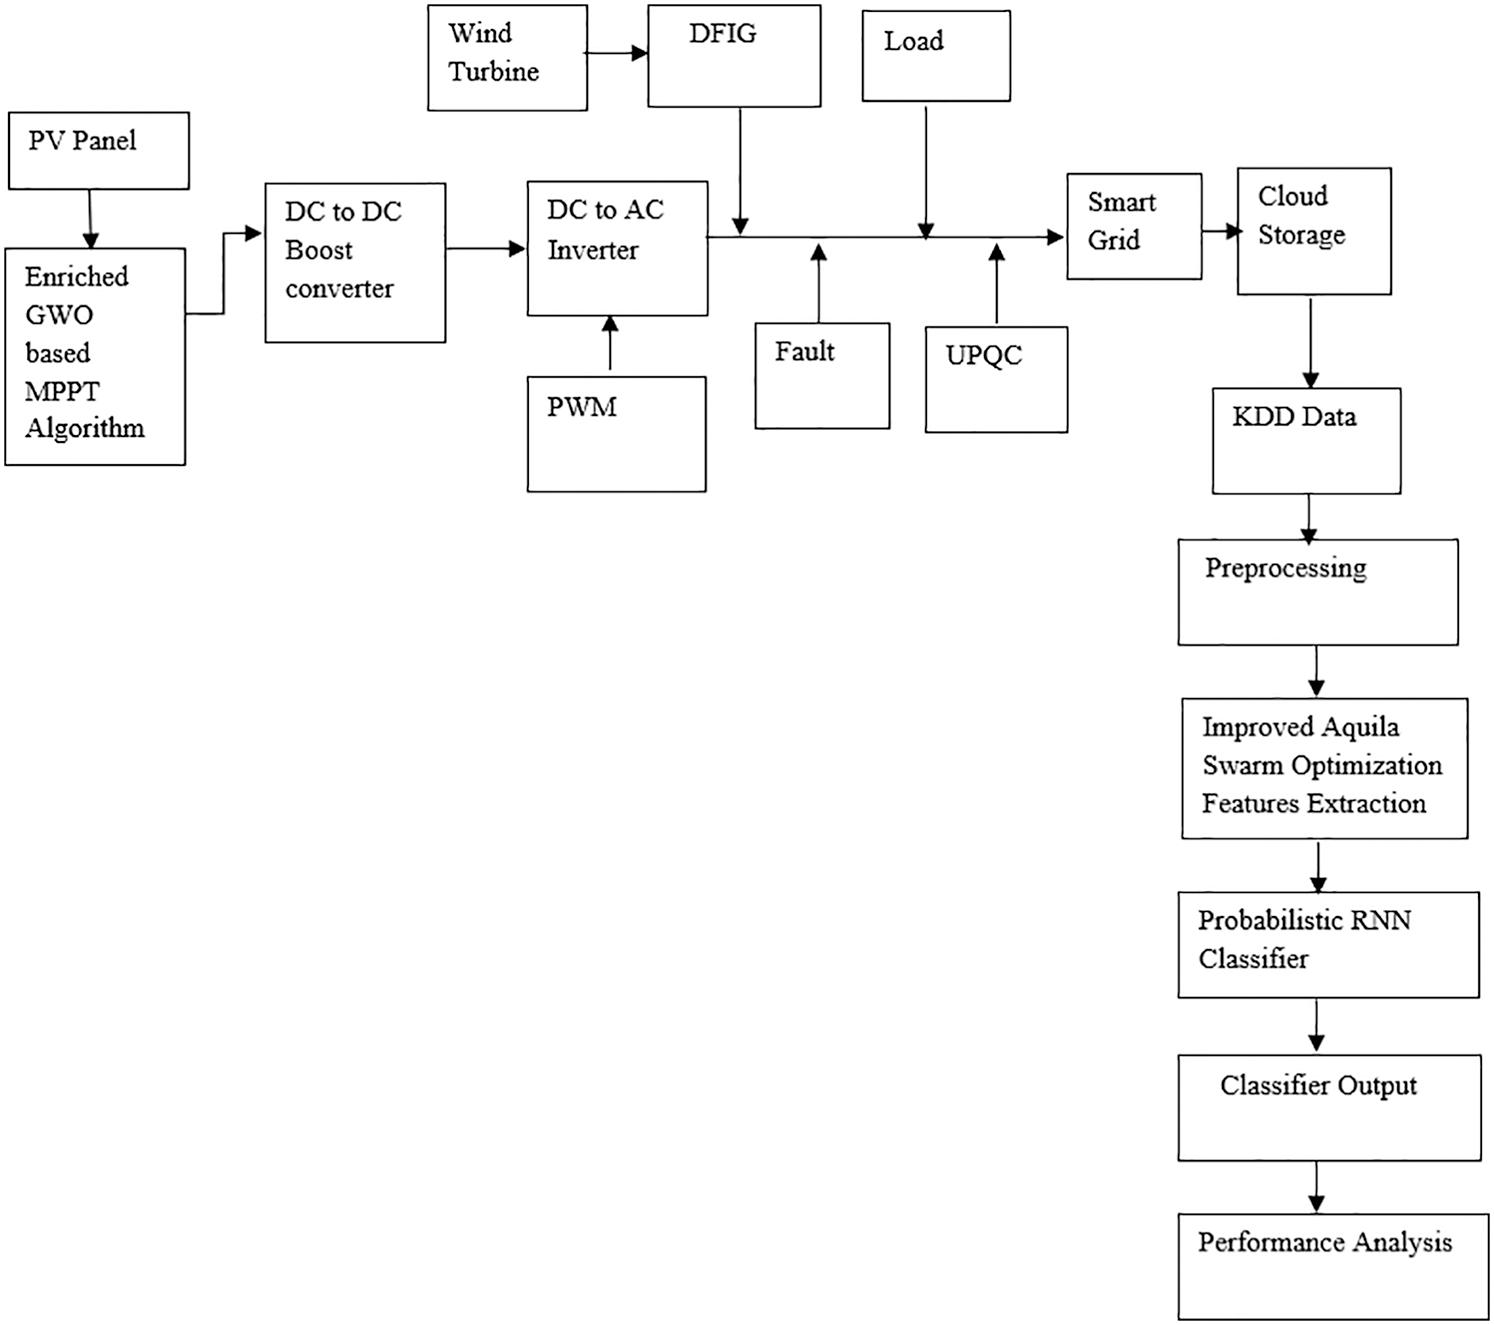
Figure 1: Flow of presented strategy
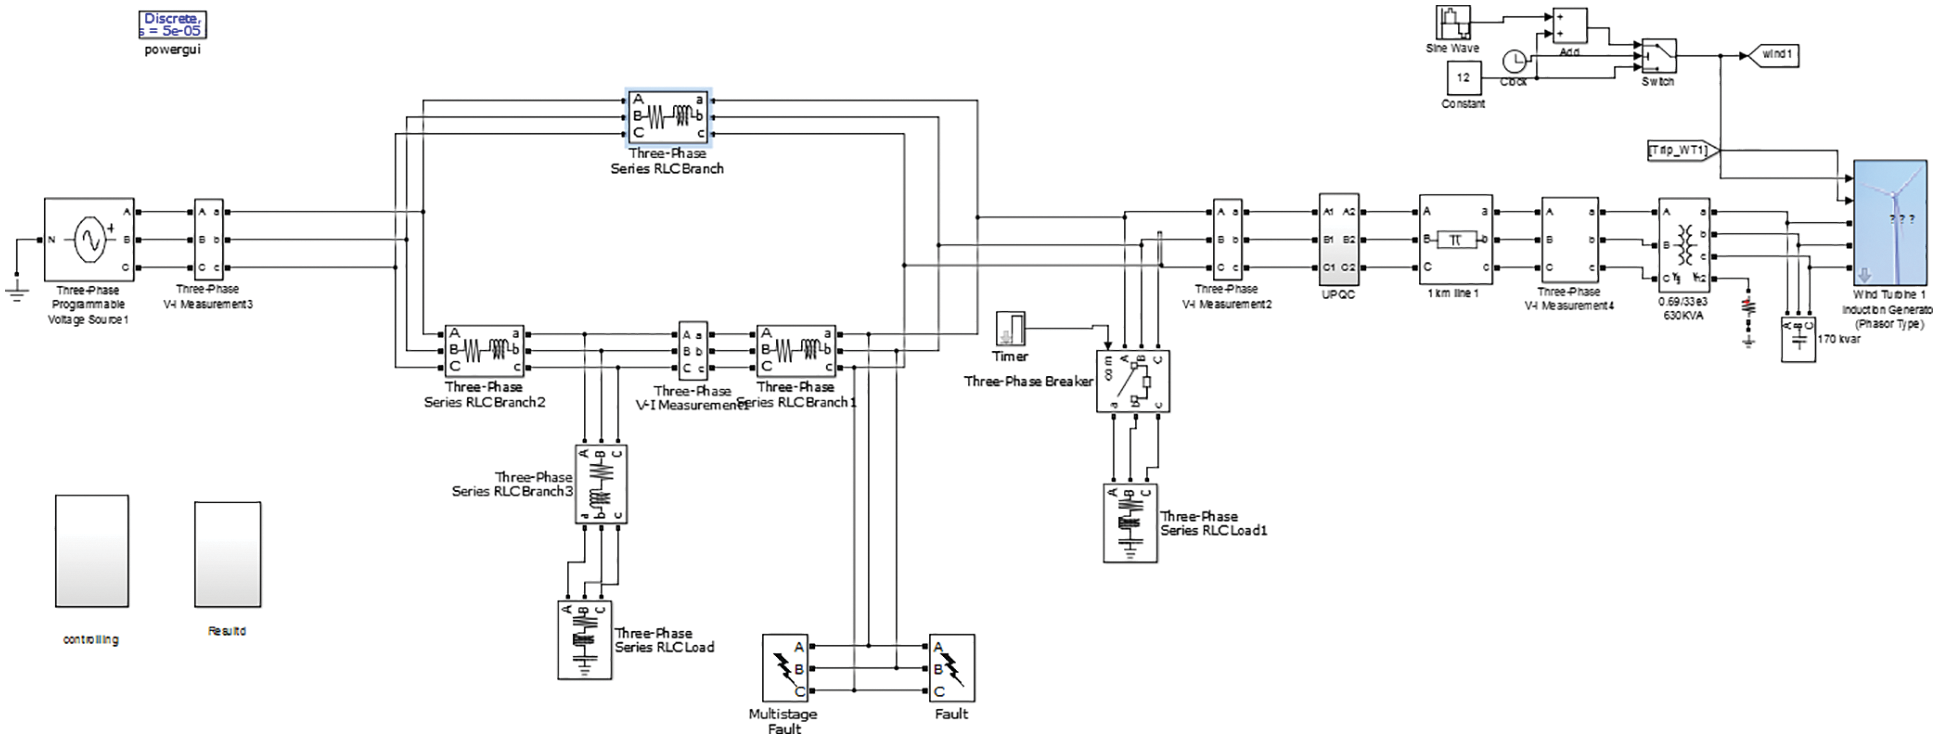
Figure 2: Simulation setup of proposed design (grid side)
3.1 Data Acquisition from Smart Grids
Initially, data acquisition is made from the smart grid stored values that are stored in the cloud and the KDD dataset. The renewable sources of energy like PV and wind turbines are considered as an input source.
(i) Initialization of input renewable source of energy
For the acquisition of smart grid data, at first solar panel (PV) is given to a direct current to direct current converter which is optimized to tune the input source parameters using Enriched Grey wolf optimization (EGWO) based Maximum Power Point Tracking (MPPT) approach. A PV system comprises PV arrays connected in series and the cells of PV are coupled in a parallel manner.
The solar cell current with relation to radiance and temperature is denoted as shown:
Here, Ipvi signifies current in PV, rds is the radiance, T is the temperature, Ki is the ideality constant. Then the maximum range of power is shown as:
The system of wind energy which converts the energy of wind in an electrical form. This comprises a wind turbine DFIG generator, with the rectifier and are uncontrolled which converts analog current source to the direct current source.
The wind system mechanism comprises mechanical input, wind speed, and mechanical torque similarly. The expression of kinetic energy is signified as shown:
The power of wind produced by means of wind turbine depending on the aerodynamics characteristics are expressed as shown:
The wind system is mechanically expressed as shown:
Here, ρ is equivalent to 1.225 kg/m3 which denotes the air density, Cpc indicates the power coefficient constant, rotor area is signified by A.
(ii) EGWO Based MPPT Approach and PWM generation
The technique of optimization is utilized for the purpose of monitoring the PV device’s MPPT that consists of local maximum power points (MPPs) number in the characteristics of P-V. Each module of PV should be regulated by means of voltage. The service cycles are then estimated on attaining best optimal values. The values of the PV source are thus tuned by means of tuning MPPT values. The technique of EGWO integrated is thus probable for MPPT tuning. The optimized source of PV is then improved/boosted with a DC-to-DC boost converter. Therefore, a source of DC is sent over the bus system of DC. By this EGWO approach, a communication is thus carried over the process of exploration and exploitation that is achieved over the two groups of the grey wolves that are self-determining in nature at which grouping of hunts this accommodates the hunt and utilizes four categories of grey wolves for the deeper utilization. Henceforth, a best and optimal value of fitness function is attained for MPPs of the system.

The source of Direct Current from solar is then converted by means of the analog current source. With the use of a pulse width modulation generator, pulse width modulation converting pulses are produced. Through this pulse width modulation signal, the secondary switches are thus driven at the modes of operation connected by the grid by assessing the frequency of gridline. So as to produce the pulses, one such reference signal is required and the amplitude, phase, and frequency of that reference signal is thus controlled over the output voltage in the analog current terminals inverter that are correlated with the pulse width modulation block.
(iii) Fault rectification and grid transmission/storage
The power compensation is measured on injecting some faults in the line of transmission. This injection is made so as to check the power stability efficiency in the proposed design with the utilization of UPQC controller. By using this UPQC, the errors and distortions in the transmission line are rectified and the harmonics are eliminated which enhances the power stability. Finally, the stabilized range of power is thus stored in a grid side for further use. The values acquired from this grid are then kept in the cloud server so that the anomaly occurrence can be detected.
In the pre-processing stage, the data from smart grid and KDD dataset are taken and are pre-processed so as to replace the missing values through means by removing outliers in the data if anything is presented. The KDD99 dataset is regarded as the most eminent datasets employed in the network security field for the purpose of IDS. This is developed in the MIT research lab and is employed by designers of IDS as a benchmarking dataset for the evaluation of several techniques and methods. This dataset comprises 4,900,000 rows and the attributes of about 41 with binary labels and 22 network attacks. The class label comprises four kinds of attacks like DoS, Probe, U2R, normal class, and R2L. The normal packets present are 77,054. The anomaly packets of about 71,215 are present having a total size of about 148, 269. The training and testing samples of machine learning models are 103,789 and 44.481 correspondingly. Then, the normalization of data is carried for scaling the data. Once the data normalization is completed then data encoding is performed for converting the non-numeric values to numeric format. After pre-processing the optimal range if features are selected with the use of an optimization approach termed Improved Aquila Swarm Optimization (IASO).
3.3 Improved Aquila Swarm Optimization
For the purpose of optimization, Improved Aquila Swarm optimization is employed. In this, the individuals in the IASO might catch the prey using four predation schemes. The initial strategy is to: flying high above in the sky to search for the prey. In this approach, Aquila might fly over the area of the hunt at the highest altitude and search initially by finding the target afterwards. Once, the prey has been found this will vertically dive towards the prey and the behavior of this is formulated as shown:
Here, X(t + 1) denotes the individual position at iteration t + 1, Xbest(t) signifies the present global optimum position at t-th iteration number and T signifies t-th current and maximum number of iterations allowed. The rand signifies the random number in the Gaussian distribution that falls in an interval between 0 and 1. The next step is the contour flight with the short glide attack. By this approach, Aquila might search from the ones that are flying in higher altitude for hovering the prey’s head thus preparing them for instinctive predation of Aquila’s behavior. The position that is updated is expressed as,
Here, XR(t) signifies the Aquila position at random, D denotes the dimension size. LF refers to Levy flight function. And x and y signify the search space and is denotes as shown:
Here, r1 denotes the search cycle number from 1 to 20, D1 signifies the random integer from values 1 to the D dimension, and ω represents the constant and is 0.005.
The third step is the one which works on low altitude flight prey approaching and the slow attack. In this approach, Aquila discovers and thus determines the location of prey approximately after which Aquila might descend for the predation preliminarily in a vertical position. This behavior of initial predation is denoted as:
Here, α and δ signifies the parameters of adjustment at the process of development that is fixed at 0.1, UB and LB denote the upper and lower bound of search spaces correspondingly.
The fourth step is watching the land and catching the prey. In this, Aquila will go to the land so as to follow the trajectory of prey’s escape and after which it attacks the prey. The behavior of predation is denoted as:
Here, QF is the average of quality function search strategy, G1 is the process of random motion parameter of Aquila tracking prey which is the random number among [−1, 1] and G2 is the process of flight slope of Aquila that tracks prey and is represented as 2 which linearly decreases to 0.
3.4 Probabilistic RNN Classifier
A probabilistic RNN is a multi-layer perceptron layer principally composed of time loop feedback in each layer and those layers are competent to overlay the other. Once the neural network is updated, a new kind of information will be transferred through the hierarchical structure and the layer of each neural network may obtain time information. For each number of iterations, the neural network might pass through the updates that are unlimited and which in turn enables them to obtain the depth of memory in an unlimited way. A PRNN standard structure which are trained by time steps thus offers the input sequences of m-dimension such as z1, zy2, …, zm, the state of n-dimensional hidden layer sequence is thus denoted as g1, g2, …, gn, and y1, y2…, yk which is the sequence of k-dimensional output and for iteration the formula is signified as:
In this, wgz, wgg, and wyg are indicated as the matrices of weight, bias is signified by cg, cy. tj denotes to input hidden layer, sj mentions the input for the output part, altogether these are variables of k-dimensional one. Non-linear predefined functions are indicated by e and h. The presented network update doesn’t provide information processing hierarchically; though, they were accomplished frequently over recursion just previous to the time node. The hidden layer structure for this RNN kind that are loaded with depth d-th of hidden layer is uttered as:
In this,
The performance assessment is made for power quality compensation made in the smart grid design and the performance of anomaly detection approach in the smart grids. The analysis made for this both are projected here.
4.1 Performance Analysis of Smart Grid
The representation of performance of the shunt current waveform is projected in the Fig. 3 provided below. The shunt current at the transmission line is having fluctuation which affects the power quality of the system. Thus, the fluctuation is eradicated and the current flow is maintained.
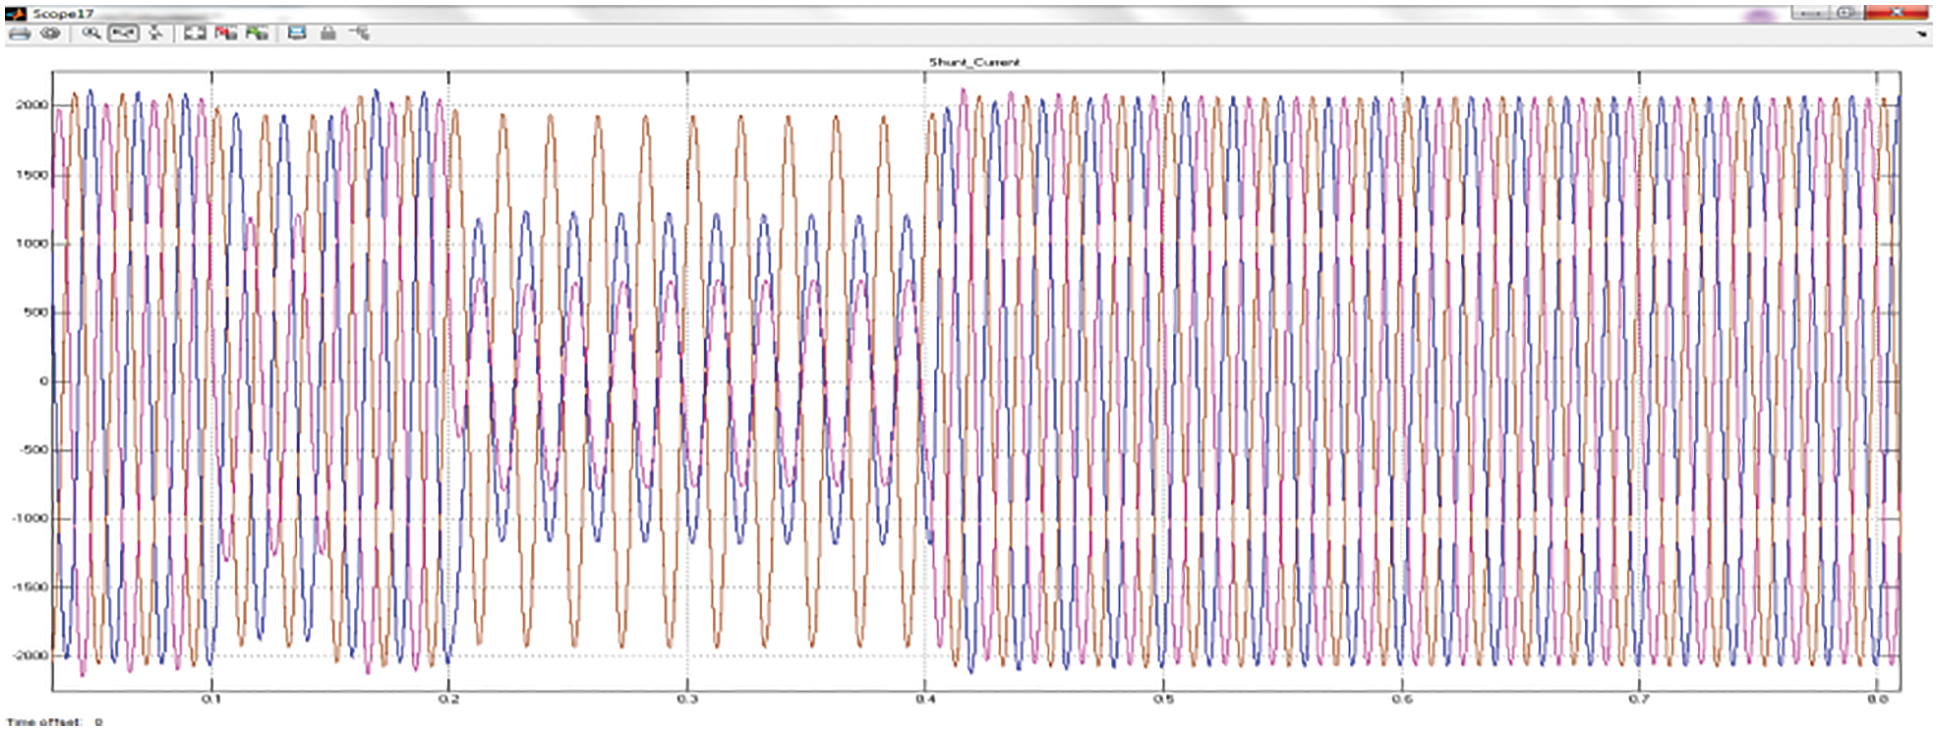
Figure 3: Performance representation of shunt current
The representation of performance of the series current waveform is projected in the Fig. 4 provided. The series current at the transmission line is fluctuating which affects the power quality of the system. Thus, the fluctuation is eradicated to maintain the flow of current.
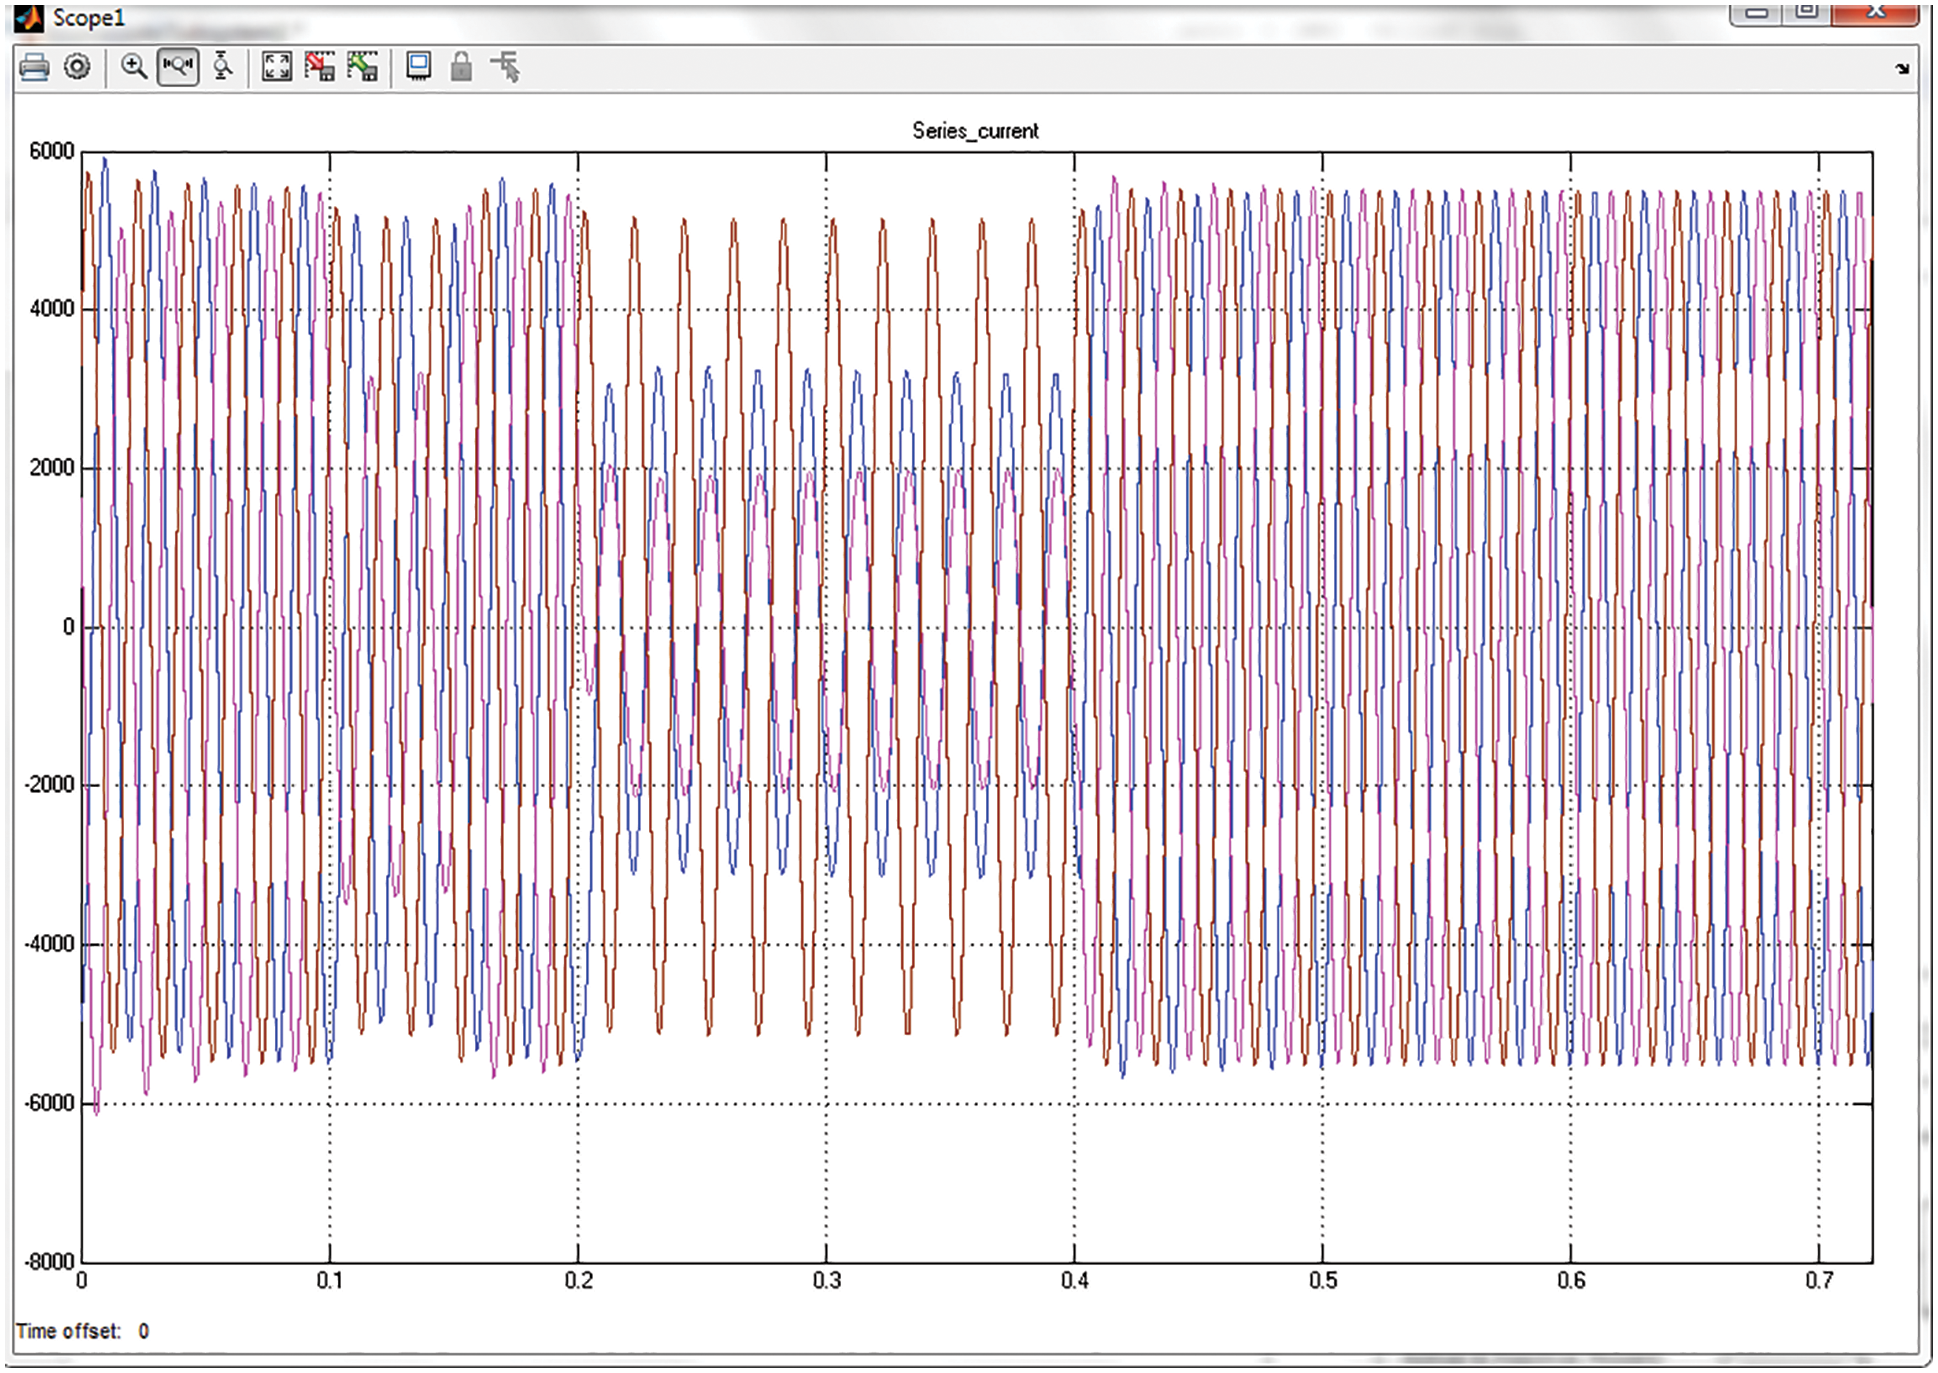
Figure 4: Performance representation of series current
Fig. 5 represents the grid current THD analysis performance of the suggested approach along with the use of UPQC FACT device. The analysis shows that the THD attained is about 0.04% at 0.5 s start time with 50 Hz of fundamental frequency.
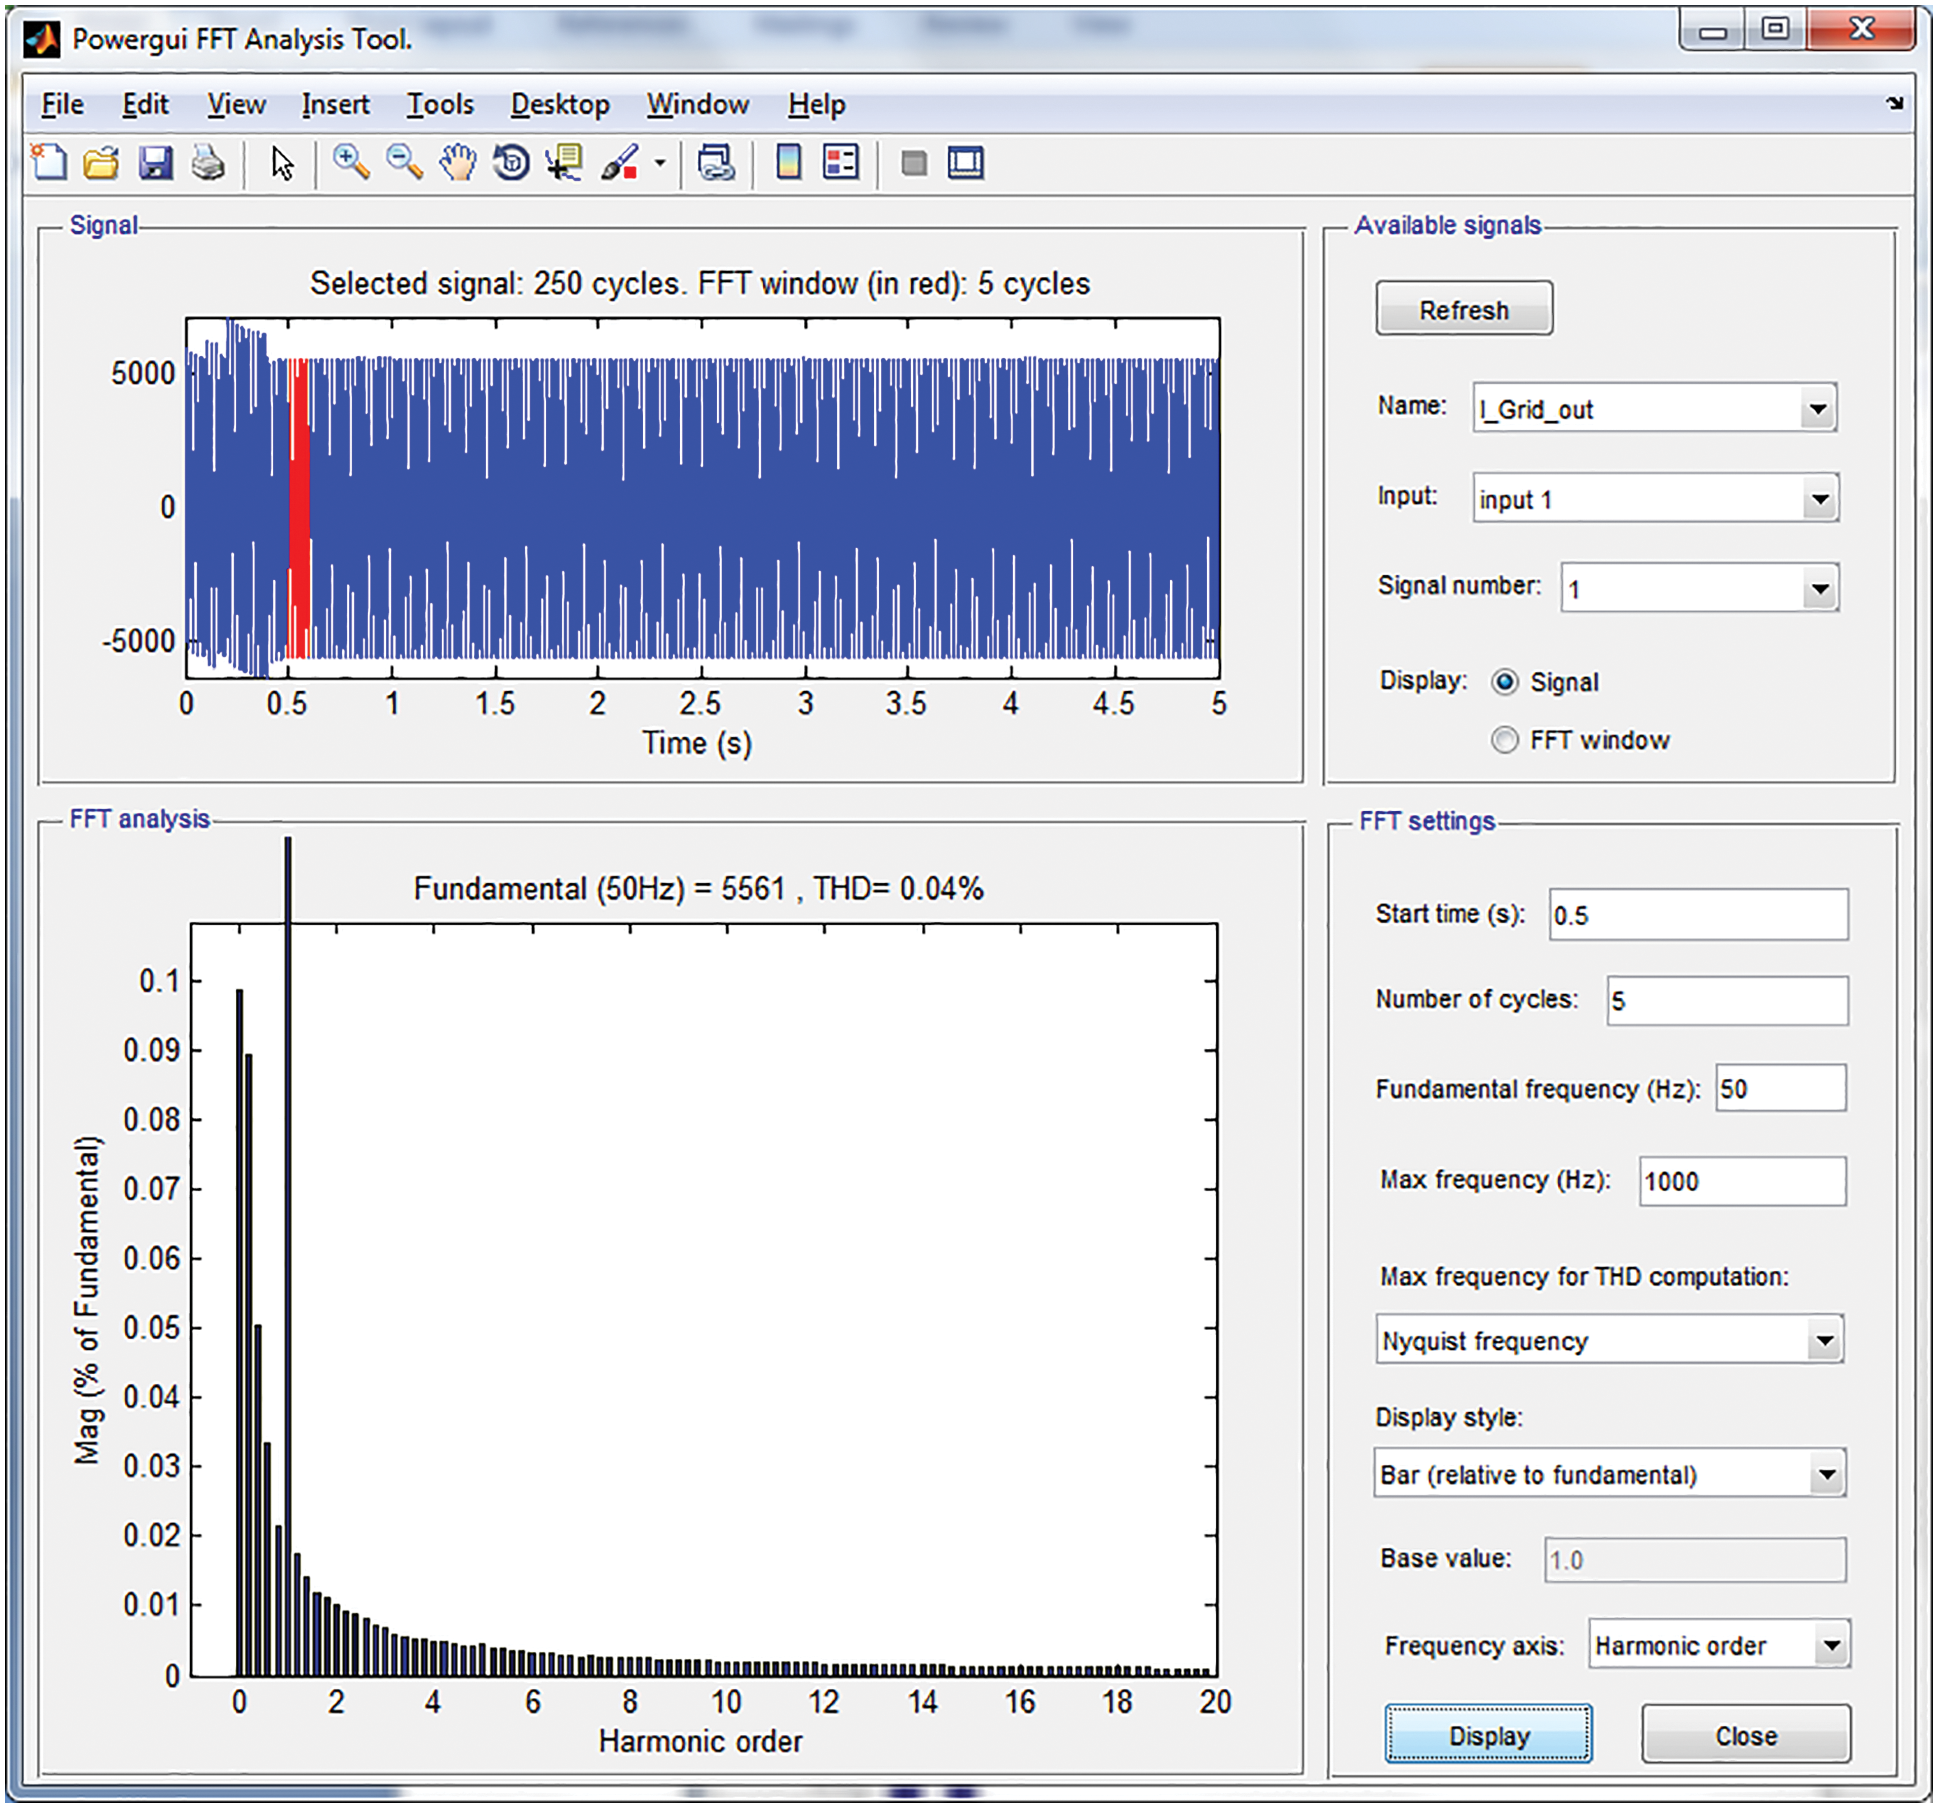
Figure 5: THD analysis of grid current at start time 0.5
Fig. 6 signifies the shunt voltage THD performance analysis of the proposed approach using UPQC FACT device. The analysis reveals that the attained THD is about 1.08% at 0.5 s start time with 50 Hz of fundamental frequency. The grid voltage analysis with UPQC is signified in a Fig. 7. The analysis reveals that power fluctuation is thus eradicated and a grid voltage is thus maintained.

Figure 6: THD analysis of shunt voltage at start time 0.5
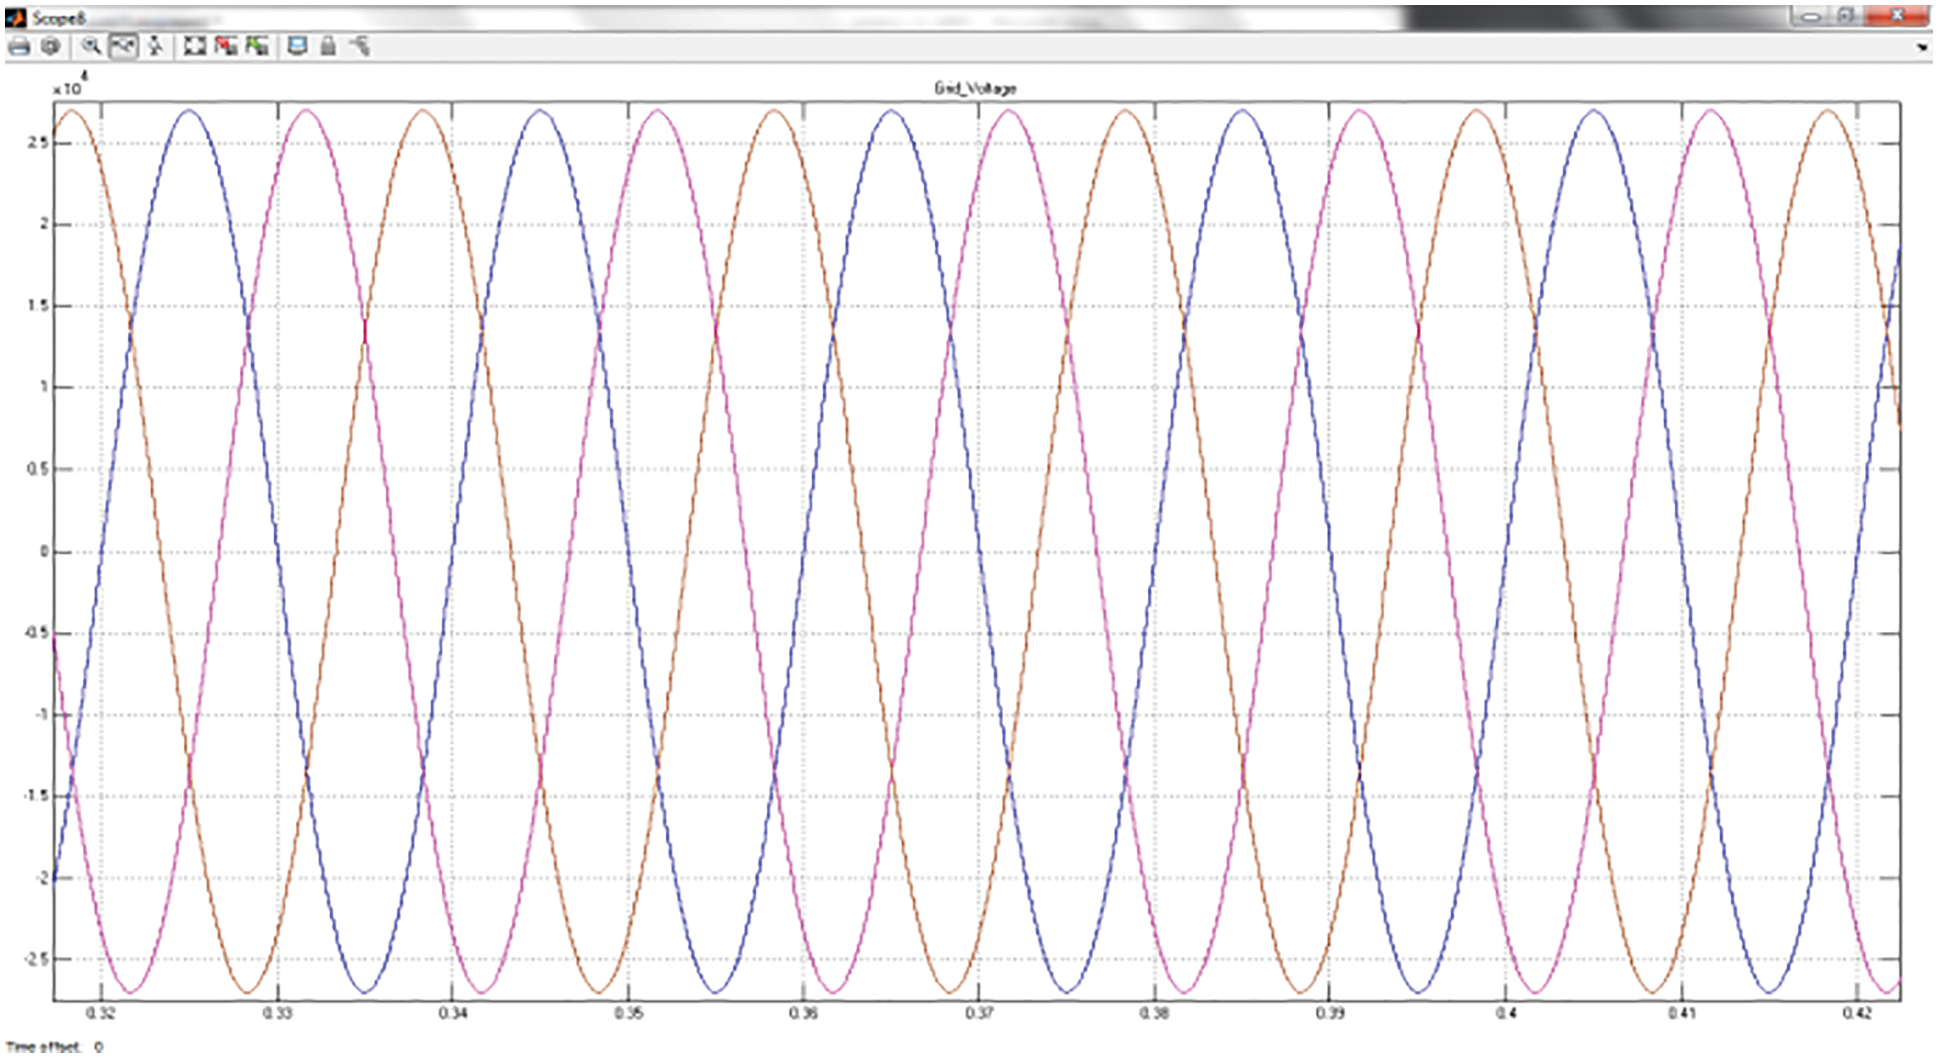
Figure 7: Grid voltage waveform representation
The grid current analysis is indicated in Fig. 8. From the analysis, it was illustrated that the fluctuation of current occurs which is rectified by maintaining the flow of current in the grid.

Figure 8: Grid current waveform representation
Fig. 9 depicts the performance assessment representation of the shunt voltage with its swell/sag. In this, there occurs some oscillation at some point of the transmission process.

Figure 9: Shunt voltage waveform representation
The Vabc_B575 (voltage bus 575) performance analysis with UPQC is specified in Fig. 10. The analysis reveals that there will be the occurrence of some fluctuations at the bus voltage at the transmission process and after some time interval the bus voltage is thus stabilized.
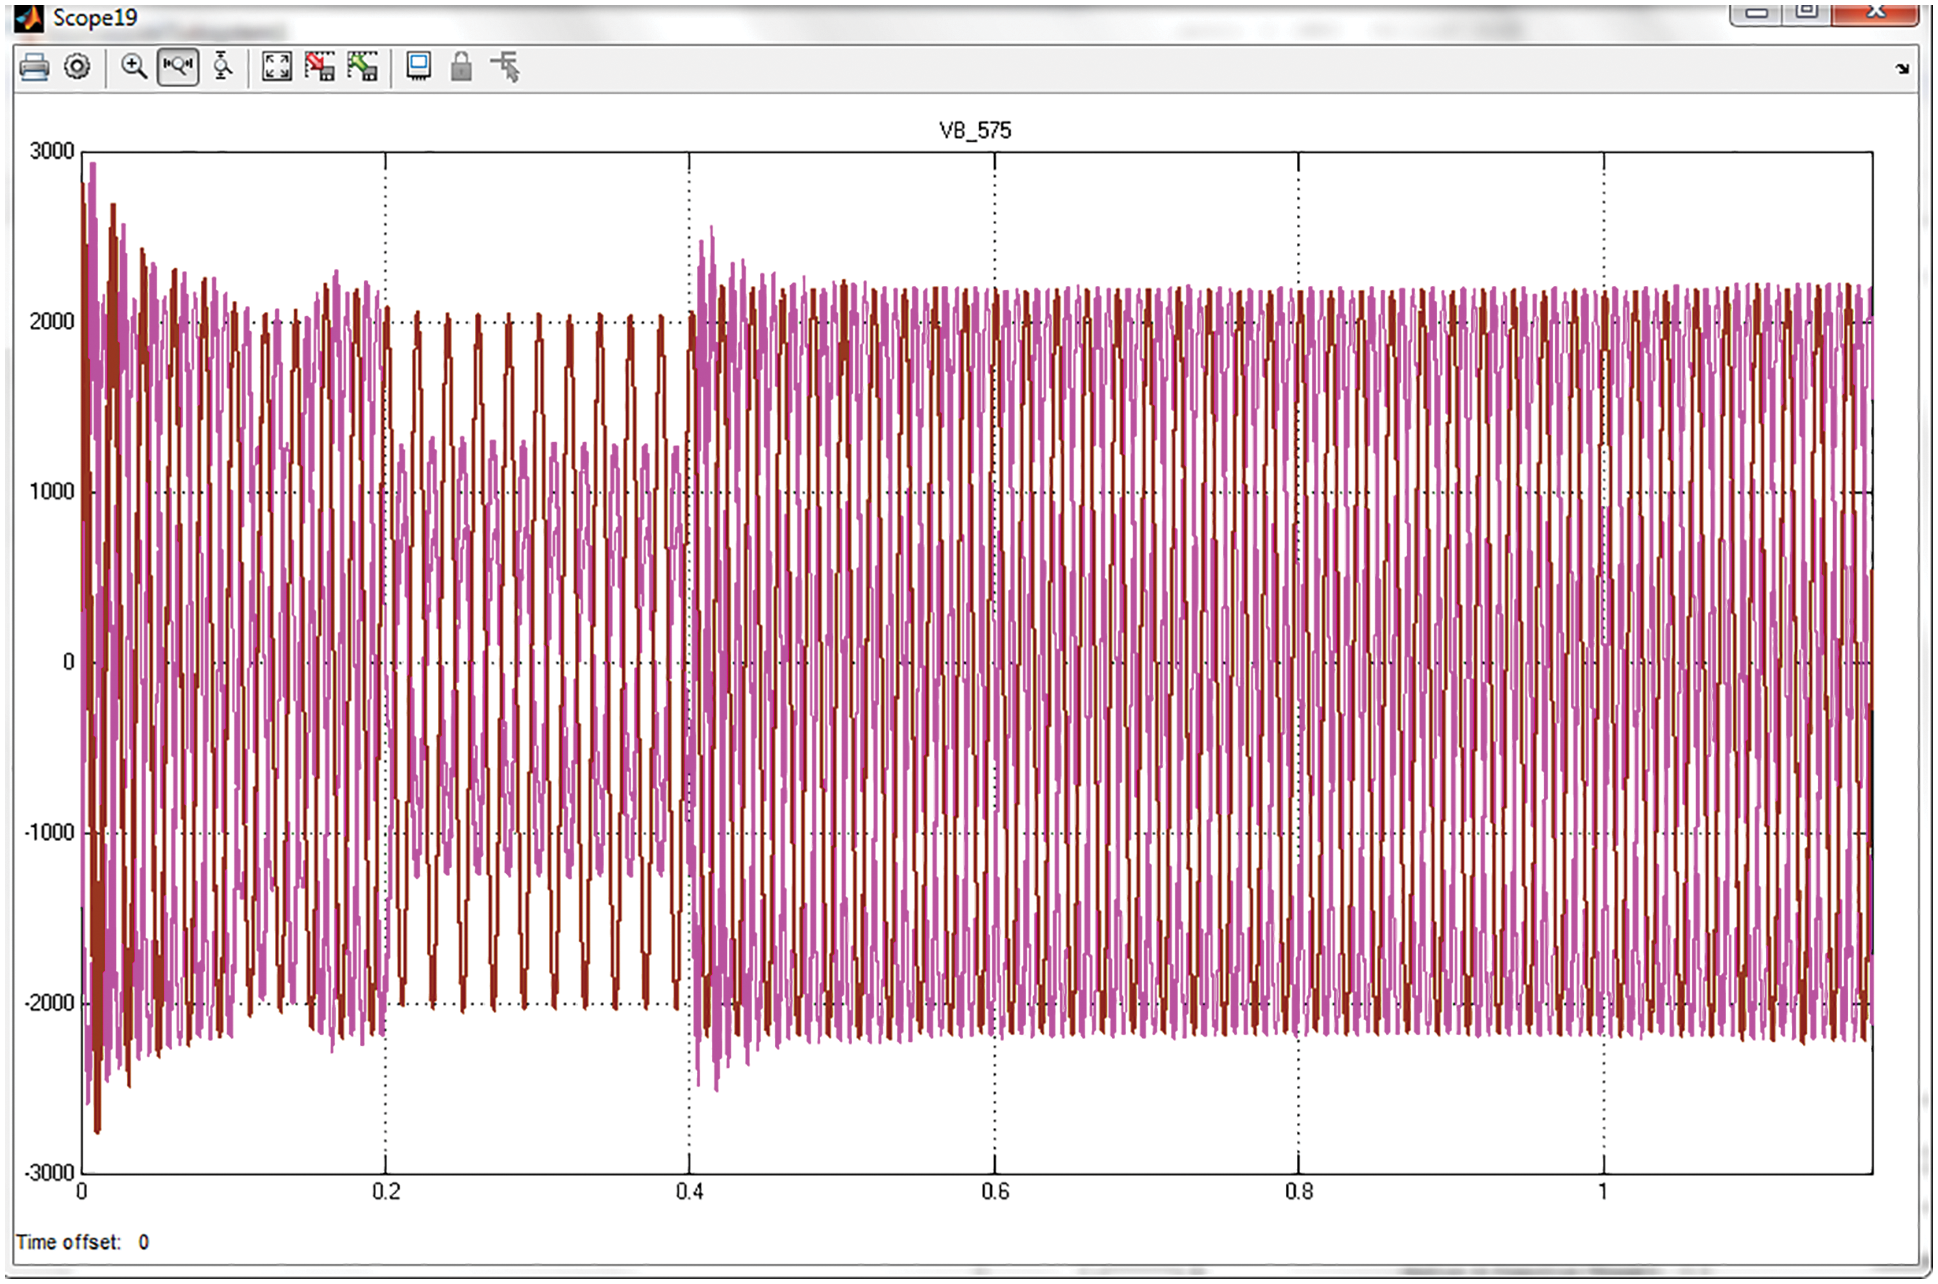
Figure 10: Representation of performance of Vabc_B575
The Vabc (voltage series of bus) performance analysis with UPQC is denoted in Fig. 11. It is seen that there will be an occurrence of some oscillations in the voltage of the bus at transmission and after some time period the voltage of the bus is thus stabilized.

Figure 11: Representation of performance of Vabc
4.2 Performance Analysis of Anomaly Detection in Smart Grid
For the detection of performance of anomaly systems employed, various performance metrics are employed for estimating the presented solution that includes precision, recall, accuracy, detection rate, FAR, and F-measure. These performance metrics are based on the True positive (TP), True Negative (TN), False positive (FP), and False Negative (FN). The analysis is compared with existing techniques to validate proposed system efficiency [21].
Tab. 1 is the depiction of performance comparison of precision, recall, and F-score for both proposed and existing schemes for class types (normal and attack). The simulated analysis shows that the proposed technique offers enhanced outcomes than others.
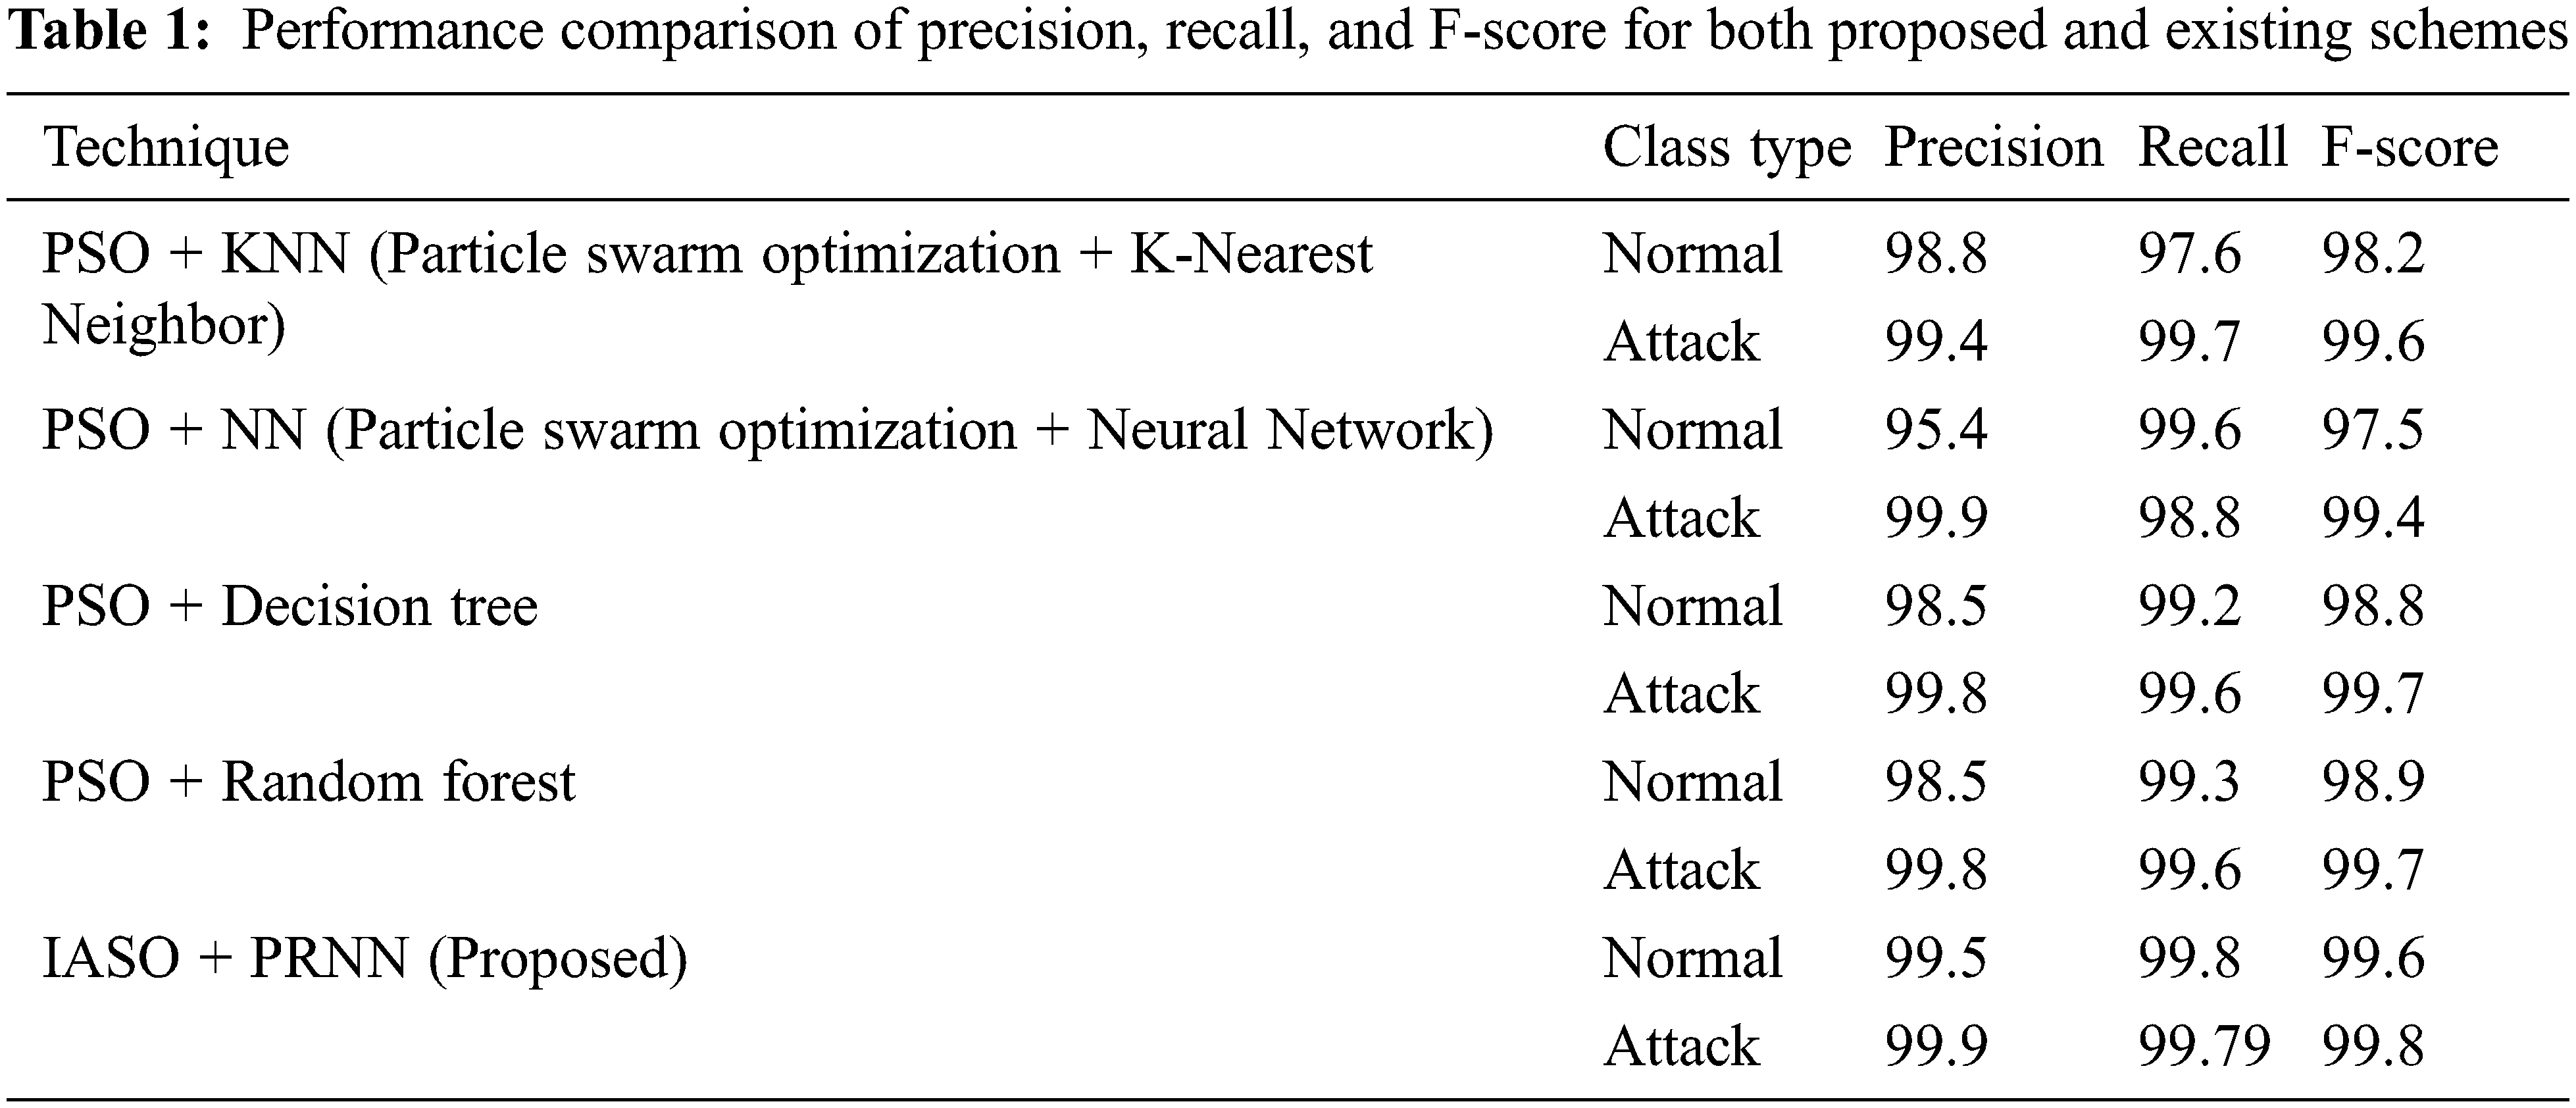
Fig. 12 is the illustration of performance comparison of precision, recall, and F-score in graphical form for both proposed and existing schemes for class types (normal and attack). The simulated analysis shows that the proposed technique offers enhanced outcomes than others.
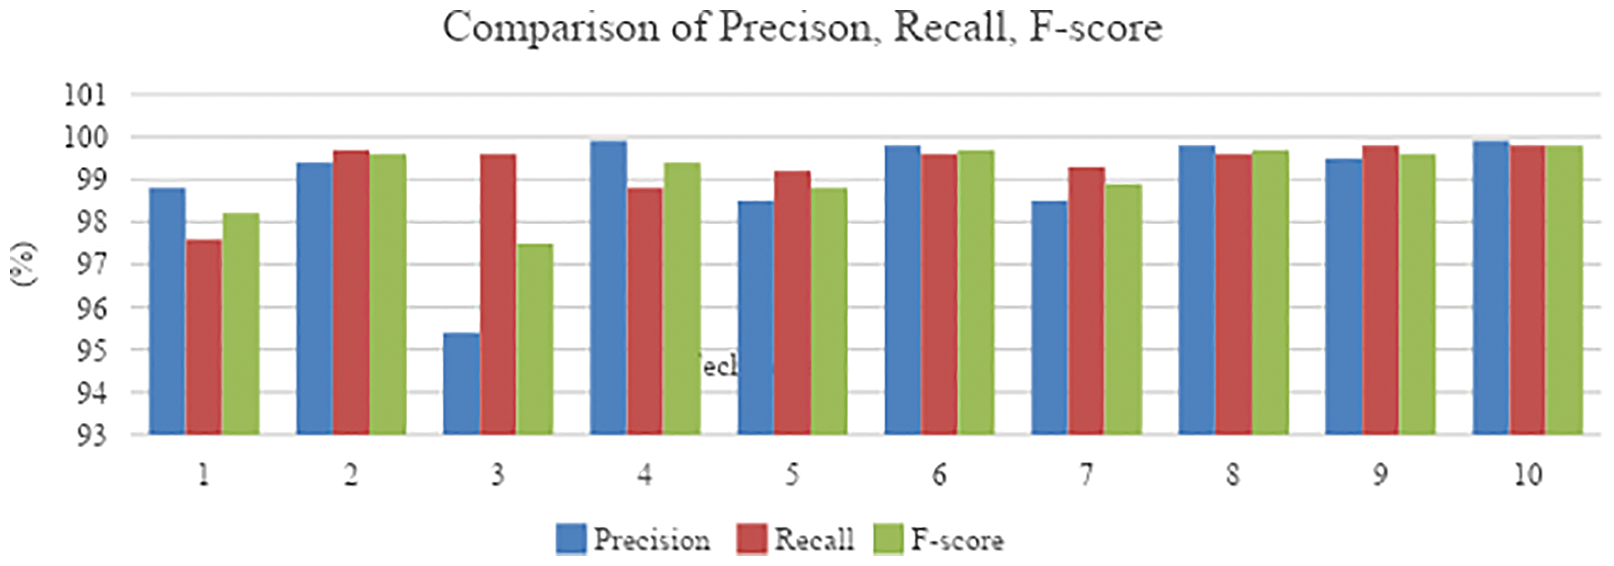
Figure 12: Comparative estimation of precision, recall, and F-score
Tab. 2 shows the tabulated form of comparative assessment of accuracy and DR for both raw data obtained from cloud storage and KDD99 dataset. The simulated analysis shows that the proposed technique offers enhanced outcomes than existing methods.

Fig. 13 offers the graphical representation of comparative assessment of accuracy and DR for both raw data obtained from cloud storage and KDD99 dataset. The simulated analysis shows that the proposed technique offers enhanced outcomes than existing methods.

Figure 13: Comparative assessment of accuracy and DR for both raw data and KDD99 dataset
Tab. 3 signifies the tabulated form of comparative assessment of accuracy, FAR and DR for KDD99 dataset. The simulated analysis shows that the proposed technique offers enhanced outcome than existing techniques on providing better accuracy and DR with a low rate of FAR.

Fig. 14 denotes the graphic scene of comparative assessment of accuracy, FAR and DR for KDD99 dataset. The simulated analysis shows that the proposed technique offers enhanced outcome than existing techniques on providing better accuracy and DR with a low rate of FAR.

Figure 14: Comparative analysis of existing methods with proposed for KDD99 dataset for accuracy and DR
Thus, the detection of anomaly in smart grid performance shows that the proposed system is better in offering enhanced performance of detection rate on comparing other existing methods.
In this work, a novel approach is presented to detect anomaly or intrusion in the smart grid framework which employs both real-time raw data from the smart grid network and KDD99 dataset. In the grid side acquisition of data, the power quality of the system was improved by eradicating distortion. The power quality was enhanced through rectifying the fault by employing UPQC and thus storing the raw data in cloud storage. The raw data stored in cloud and KDD99 are pre-processed and using IASO the optimal features were extracted. Then, probabilistic RNN classifiers were utilized so as to predict and classify intrusions in smart grid networks. Finally, the performance was evaluated and projected in terms of grid voltage, grid current, THD, voltage sag/swell, accuracy, precision, recall, F-score, false acceptance rate (FAR), and detection rate of the classifier. The attained outcome illustrates that the proposed mechanism is effective in detecting intrusions or outliers on comparing the traditional methodologies.
Funding Statement: The authors received no specific funding for this study.
Conflicts of Interest: The authors declare that they have no conflicts of interest to report regarding the present study.
References
1. G. Efstathopoulos, P. R. Grammatikis, P. Sarigiannidis, V. Argyriou, A. Sarigiannidis et al., “Operational data based intrusion detection system for smart grid,” in IEEE 24th Int. Workshop on Computer Aided Modeling and Design of Communication Links and Networks (CAMAD), Limassol, Cyprs, pp. 1–6, 2019. [Google Scholar]
2. P. Radoglou Grammatikis, P. Sarigiannidis, G. Efstathopoulos and E. Panaousis, “ARIES: A novel multivariate intrusion detection system for smart grid,” Sensors, vol. 20, no. 18, pp. 5305, 2020. [Google Scholar]
3. T. T. Khoei, G. Aissou, W. C. Hu and N. Kaabouch, “Ensemble learning methods for anomaly intrusion detection system in smart grid,” in IEEE Int. Conf. on Electro Information Technology (EIT), Mount Pleasant, MI, USA, pp. 129–135, 2021. [Google Scholar]
4. M. Attia, S. M. Senouci, H. Sedjelmaci, E. H. Aglzim and D. Chrenko, “An efficient intrusion detection system against cyber-physical attacks in the smart grid,” Computers & Electrical Engineering, vol. 68, pp. 499–512, 2018. [Google Scholar]
5. L. Chhaya, P. Sharma, G. Bhagwatikar and A. Kumar, “Wireless sensor network based smart grid communications: Cyber attacks intrusion detection system and topology control,” Electronics, vol. 6, no. 1, pp. 5, 2017. [Google Scholar]
6. L. Cui, Y. Qu, L. Gao, G. Xie and S. Yu, “Detecting false data attacks using machine learning techniques in smart grid: A survey,” Journal of Network and Computer Applications, vol. 170, pp. 102808, 2020. [Google Scholar]
7. H. Karimipour, S. Geris, A. Dehghantanha and H. Leung, “Intelligent anomaly detection for large-scale smart grids,” in IEEE Canadian Conf. of Electrical and Computer Engineering (CCECE), Edmonton, AB, Canada, pp. 1–4, 2019. [Google Scholar]
8. K. Vimalkumar and N. Radhika, “A big data framework for intrusion detection in smart grids using apache spark,” in Int. Conf. on Advances in Computing, Communications and Informatics (ICACCI), Udupi, Karnataka, India, pp. 198–204, 2017. [Google Scholar]
9. A. Kuznetsov, A. Kiian, O. Smirnov, A. Zamula, S. Rudenko et al., “Variance analysis of networks traffic for intrusion detection in smart grids,” in IEEE 6th Int. Conf. on Energy Smart Systems (ESS), Kyiv, Ukraine, pp. 353–358, 2019. [Google Scholar]
10. D. D. Roy and D. Shin, “Network intrusion detection in smart grids for imbalanced attack types using machine learning models,” in Int. Conf. on Information and Communication Technology Convergence (ICTC), Jeju Island, South Korea, pp. 576–581, 2019. [Google Scholar]
11. Q. Liu, V. Hagenmeyer and H. B. Keller, “A review of rule learning-based intrusion detection systems and their prospects in smart grids,” IEEE Access, vol. 9, pp. 57542–57564, 2021. [Google Scholar]
12. G. Fenza, M. Gallo and V. Loia, “Drift-aware methodology for anomaly detection in smart grid,” IEEE Access, vol. 7, pp. 9645–9657, 2019. [Google Scholar]
13. B. Rossi, S. Chren, B. Buhnova and T. Pitner, “Anomaly detection in smart grid data: An experience report,” in IEEE Int. Conf. on Systems, Man, and Cybernetics (SMC), Budapest, Hungary, pp. 002313–002318, 2016. [Google Scholar]
14. T. S. Ustun, S. M. Hussain, A. Ulutas, A. Onen, M. M. Roomi et al., “Machine learning-based intrusion detection for achieving cybersecurity in smart grids using IEC 61850 GOOSE messages,” Symmetry, vol. 13, no. 5, pp. 826, 2021. [Google Scholar]
15. R. A. Niazi and Y. Faheem, “A Bayesian game-theoretic intrusion detection system for hypervisor-based software defined networks in smart grids,” IEEE Access, vol. 7, pp. 88656–88672, 2019. [Google Scholar]
16. B. Genge, P.Haller, C. D. Dumitru and C. Enăchescu, “Designing optimal and resilient intrusion detection architectures for smart grids,” IEEE Transactions on Smart Grid, vol. 8, no. 5, pp. 2440–2451, 2017. [Google Scholar]
17. M. Panthi, “Anomaly detection in smart grids using machine learning techniques,” in First Int. Conf. on Power, Control and Computing Technologies (ICPC2T), Raipur, India, pp. 220–222, 2020. [Google Scholar]
18. X. Liu and P. S. Nielsen, “Regression-based online anomaly detection for smart grid data,” arXiv preprint arXiv: pp.1606.05781, 2016. [Google Scholar]
19. Z. Fengming, L. Shufang, G. Zhimin, W. Bo, T. Shiming et al., “Anomaly detection in smart grid based on encoder-decoder framework with recurrent neural network,” The Journal of China Universities of Posts and Telecommunications, vol. 24, no. 6, pp. 67–73, 2017. [Google Scholar]
20. R. Moghaddass and J. Wang, “A hierarchical framework for smart grid anomaly detection using large-scale smart meter data,” IEEE Transactions on Smart Grid, vol. 9, no. 6, pp. 5820–5830, 2017. [Google Scholar]
21. S. Khan, K. Kifayat, A. Kashif Bashir, A. Gurtov and M. Hassan, “Intelligent intrusion detection system in smart grid using computational intelligence and machine learning,” Transactions on Emerging Telecommunications Technologies, vol. 32, no. 6, pp. e4062, 2021. [Google Scholar]
Cite This Article
 Copyright © 2023 The Author(s). Published by Tech Science Press.
This work is licensed under a Creative Commons Attribution 4.0 International License , which permits unrestricted use, distribution, and reproduction in any medium, provided the original work is properly cited.
 Downloads
 Citation Tools