
 Submit a Paper
 Propose a Special lssue
 Open Access
ARTICLE
Brain Tumor Classification Using Image Fusion and EFPA-SVM Classifier
1 Anna University, Chennai, 600025, India
2 Department of Computer Science and Engineering, Tamilnadu College of Engineering, Coimbatore, 641659, India
* Corresponding Author: P. P. Fathimathul Rajeena. Email:
Intelligent Automation & Soft Computing 2023, 35(3), 2837-2855. https://doi.org/10.32604/iasc.2023.030144
Received 19 March 2022; Accepted 03 May 2022; Issue published 17 August 2022
 View Full Text
 Download PDF
Abstract
An accurate and early diagnosis of brain tumors based on medical imaging modalities is of great interest because brain tumors are a harmful threat to a person’s health worldwide. Several medical imaging techniques have been used to analyze brain tumors, including computed tomography (CT) and magnetic resonance imaging (MRI). CT provides information about dense tissues, whereas MRI gives information about soft tissues. However, the fusion of CT and MRI images has little effect on enhancing the accuracy of the diagnosis of brain tumors. Therefore, machine learning methods have been adopted to diagnose brain tumors in recent years. This paper intends to develop a novel scheme to detect and classify brain tumors based on fused CT and MRI images. The proposed approach starts with preprocessing the images to reduce the noise. Then, fusion rules are applied to get the fused image, and a segmentation algorithm is employed to isolate the tumor region from the background to isolate the tumor region. Finally, a machine learning classifier classified the brain images into benign and malignant tumors. Computing statistical measures evaluate the classification potential of the proposed scheme. Experimental outcomes are provided, and the Enhanced Flower Pollination Algorithm (EFPA) system shows that it outperforms other brain tumor classification methods considered for comparison.Keywords
The brain oversees and regulates several essential human processes, including speech, thought, movement, etc. A tumor is an abnormal enlargement in any part of the human body, including the brain. Uncontrollable and abnormal growth of cells in and around the brain is known as a brain tumor [1]. Abnormal cell proliferation disrupts neurological activity. Severe headaches, convulsions, insomnia, loss of sight, nausea, and confusion are all common signs of a tumor in the brain. A brain tumor can be classified into benign and malignant tumors, depending on the mass concentration. Benign tumors do not spread to other cells and are easy to remove because they have a smooth shape. Malignant tumor has irregular structure and are active cancer cells that spread to other cells. Based on the American Brain Tumor Association (ABTA) [2], there are four grades of brain tumors. Grades I and II are benign tumors, while grades III and IV are malignant. In the absence of effective treatment, benign tumors might become malignant tumors. A brain tumor cannot be prevented. However, brain tumors can be treated more effectively and with a lower death rate when discovered and diagnosed early. Detecting and diagnosing a brain tumor at its early stage is a highly challenging task because the brain has a highly complex structure.
Numerous medical imaging techniques such as CT, MRI, and PET are employed for diagnosing brain tumors. However, each imaging modality produces images in different ways. For instance, PET provides information about the functioning of organs, and CT offers information about dense tissue like bone in the human body. On the other hand, MRI gives detailed information about soft tissues like Gray Matter (GM), White Matter (WM), and Cerebrospinal Fluid (CSF) [3]. MRI is the standard tool to detect brain tumors because it provides more significant information about abnormalities within brain tissues and high resolution. CT images show the difference in tissue density, whereas MRI images offer a contrast between different soft tissues to obtain information about soft and dense tissues in a single image. Image fusion refers to combining CT and MRI images [4,5]. The fused image is more transparent and contains more information about the organ. The combined image retains the complementary information from the CT and MRI, allowing for more accurate detection. Furthermore, fused images can help the physician analyze the image more preciously and make the correct decision.
The principal contributions of this research work are as follows:
• A new method is developed to classify brain tumors based on fused image features.
• Improved Wavelet Threshold (IWTh) method is proposed to remove noise or redundant information from source images.
• The hybrid image fusion method is presented using Integer Wavelet Transform (IWT) and Non-Subsampled Contourlet Transform (NSCT)
• A segmentation algorithm is developed to separate the tumor region from its surrounding tissues
• EFPA is proposed to select salient features and reduce computational time. This attempt to develop a feature selection algorithm is new and has not been examined before for brain tumor classification
• Support Vector Machine (SVM) classifier is employed to classify brain tumors based on selected features.
• Comprehensive analysis is done to validate the potential of the proposed scheme for brain tumor diagnosis.
The categorization of the rest of the article is as follows: Section 2 focuses on related research in the field of brain tumor detection. Then, the methodology, simulation results, and conclusion are presented in Sections 3–5, respectively.
In recent years, with the advancement of imaging computing techniques, diagnostic technologies in the medical field have gained a lot of interest. As a result, many researchers have attempted to enhance various body parts’ segmentation and classification rate using different strategies as in [6–8]. This section presents a brief review of brain tumor diagnosis methods based on single modality and multimodality.
Nanthagopal et al. [5] developed a brain tumor classification method based on the wavelet transform and a machine learning classifier. The DWT method removes noise from CT images, and two features are computed: the Gray Level Co-occurrence Matrix (GLCM) features and the dominant grey level run length feature. To distinguish between normal and abnormal brain images, SVM and Probabilistic Neural Network (PNN) were used in conjunction with each other. The SVM classifier achieves the highest accuracy in classification. Kumar et al. [9] investigated the effectiveness of PCA and SVM in segmenting and classification of images of brain tumors. The accuracy of this procedure in detecting tumors was 94%. However, this method requires a tremendous amount of data for training, which is a disadvantage of this method. Amin et al. [10] developed a novel approach with a classification accuracy of 83.1% in the diagnosis and categorization of brain tumors compared to previous attempts. The success of this strategy was the use of a Gaussian filter for noise removal and a thresholding method for segmentation. The GLCM features are generated and sent into the SVM classifier, performing the classification operation. Bahadure et al. [3] integrated WT and SVM classifiers for diagnosing brain tumors. Adaptive contrast enhancement is utilized to suppress noisy data from MRI images. Wavelet transform (WT) is adopted to segment the tumor region from its neighbouring tissues. Texture features are computed, and SVM has carried out the classification task. However, shape features are equally important for brain tumor classification, which is a major limitation of this approach. Gumaste et al. [11] provided a strategy for brain tumor identification based on an SVM classifier as a segmentation tool, which had an accuracy of 92.6%.
A deep learning model was suggested by Mohsen et al. [1] to classify MRI images of the brain. First, input images are segmented into background and foreground using the Fuzzy C Means (FCM) algorithm. Then, the features are extracted using Discrete Wavelet Transform (DWT). Principal Component Analysis (PCA) is used to reduce the feature vector dimensions, and then to classify the feature vector, a deep learning network is used. However, MRI images are vulnerable to noise, so applying some denoising methods before segmentation. Due to the existence of noisy data, this model was unable to attain high classification accuracy. Kharrat et al. [12] designed a framework for diagnosing brain tumors using MRI images. The DWT method was utilized for feature extraction, and the Simulated Annealing (SA) method was used for selecting features. The SVM and Genetic Algorithm and Support Vector Machine (GA-SVM) algorithms distinguish between normal and pathological brain images. The GA-SVM outperformed the SVM in terms of performance. Sun et al. [13] studied the effectiveness of deep learning in segmenting multimodal magnetic MRI images. The authors used the intensity normalization method to preprocess MRI data. Finally, the tumor location is separated from its surrounding environment using 3D CNN. The results showed that the performance has improved. A key disadvantage of deep learning neural networks was that they required a large amount of data during training. The advantages and disadvantages of spatial domain and multi-resolution domain fusion approaches and the differences between them were provided by Yadav et al. [14] in their paper. Gong et al. [15] created a method for diagnosing brain tumors by combining ANN and Chaos Whale Optimization Algorithm (CWOA). The feature selection and ANN parameter optimization were done using the CWOA algorithm. According to the researchers, the Matthews correlation coefficient for this approach was 76.83%, and the detection rate was 88%. Sachdeva et al. [16] presented a deep learning-based brain segmentation. CNN is used for segmentation, and this method is tested both on MRI and CT images. High computing costs are the limitation of this approach. The authors of [17] demonstrated excellent accuracy in denoising and classifying tumors using a diffusion filter to evaluate tumor phases such as malignant and benign. The method detects malignant tumors at a rate of 99.02% and benign tumors at a rate of 99.67%. Chowdhury et al. [18] used a technique based on Artificial Neural Networks (ANN) and Principal component analysis (PCA) to classify normal brain images from abnormal brain images. This strategy, which used PCA in feature reduction and ANN in classification, claimed a classification accuracy of 91% for the features it reduced and classified.
The primary goal of image fusion is to merge two different types of information from image files to improve the accuracy of diagnostic decisions. Image fusion techniques can be divided into two types: i) time or spatial domain fusion and ii) frequency or transform domain fusion. Time-domain fusion is the most common type of image fusion. When it comes to medical image fusion, transform domain fusion seems preferable since it provides a better visual depiction of the merged image relative to spatial domain fusion. These methods employ multi-resolution or multiscale analysis techniques such as WT, curvelet Transform, and contourlet transform to deconstruct the image into approximations and detailed sub-images. Image fusion has been studied by several researchers who have utilized a variety of transforms. MRI and CT images were fused using the contourlet transform by Ganasala et al. [19]. Ramlal and colleagues [20] devised a method based on the Non-Stationary Wavelet Transform (NSCT) and stationary wavelet transformations. Usman et al. [21] described a technique to classify brain tumors based on multimodality MRI data. Images are preprocessed via histogram matching, and then various characteristics are computed using DWT on the resulting images. A random forest classifier was used to forecast classes. This strategy has not been centered on the denoising procedure. Sun et al. [22] used a dual-tree complex wavelet transform to fuse medical images. According to the literature, multiresolution-based image fusion successfully resolved the spatial domain fusion technique issues, but these methods suffer from their complexity and redundancy.
From the literature, it is seen that wavelet-based image fusion methods are widely used for image fusion. However, these methods suffered from some limitations like the poor resolution of curves and shift variants. Similarly, curvelet transform-based image fusion methods suffered from complexity and redundancy. Most researchers have used a single CT or MRI model to diagnose a brain tumor. Few researchers utilized feature reduction methods to reduce computational overhead. Very few researchers fused two different modalities to increase the classification rate. A majority of the researchers used DWT for feature extraction. However, no researcher has denoised an image using DWT. This research focuses on developing a new method for brain tumor classification based on fused CT and MRI images, denoised using DWT and a metaheuristic algorithm for feature selection.
The fundamental focus of this research is to explore the classification of two types of brain tumor from the multimodal fused images with the help of an ML classifier. The proposed method considered CT and MRI brain images. The proposed brain tumor classification framework comprises six major phases, namely 1) Image preprocessing employing the IWTh method, 2) image fusion using IWT followed by NSCT, 3) tumor segmentation utilizing segmentation algorithm, 4) feature extraction, 5) feature selection employing EFPA and 6) classification employing SVM. Performance is evaluated at the end. First, CT and MRI images are preprocessed using IWTh to suppress noisy data. Second, preprocessed images are decomposed separately by utilizing IWT followed by NSCT and then fused using fusion rules. Third, the tumor region is separated from its background, and features are extracted. Fourth, the EFPA selects the minimum sub-group of features from the extracted features. Finally, the fused images are classified into benign or malignant using the SVM classifier. Fig. 1 depicts the framework of the proposed strategy in detail.
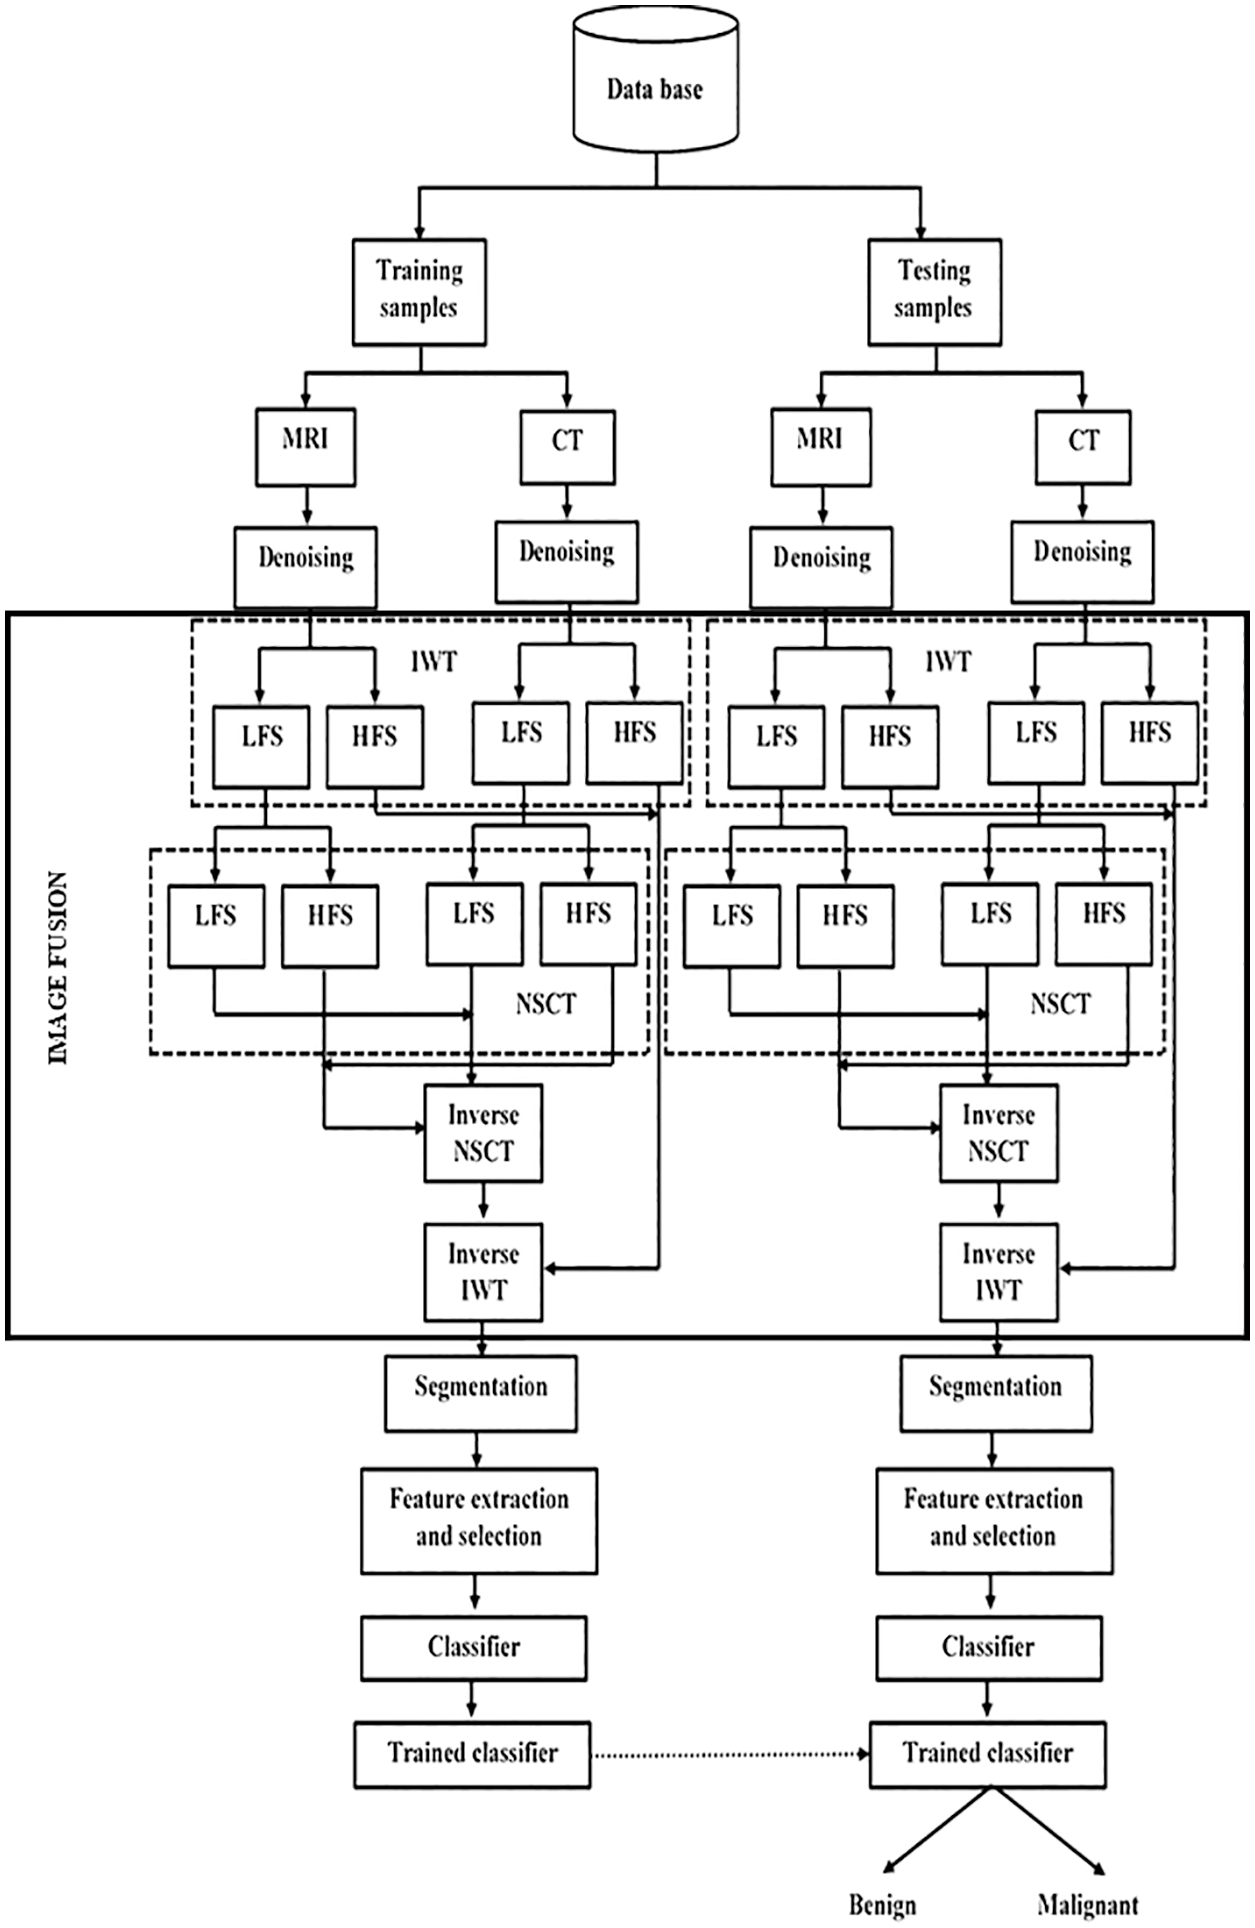
Figure 1: Proposed brain tumor classification framework
Preprocessing enhances image quality by removing distracting or undesired elements from the scene. Preprocessing is carried out in two approaches in this research: i) scaling and ii) denoising, respectively. Both CT and MRI images are downsized to a resolution of 512 × 512 pixels to ensure that information from the same structure is appropriately merged. It is generally known that brain cancer cells can take on a variety of shapes and forms with varied borders. Therefore, when it comes to distinguishing harmless from malignant brain tumors, texture and border characteristics are critical. Because of this, IWTh is recommended to maintain texture and shape characteristics during denoising. Denoising methods such as soft and hard thresholds are often utilized [23,24]. The drawbacks of these approaches include image smoothing, the loss of vital information, and fuzzy images, among other things. Therefore, IWTh is being suggested and implemented to address the mentioned problems.
The proposed IWTh can be mathematically expressed as,
where wi,j and
When β = 1, Eq. (1) becomes soft thresholding, and it will be a hard threshold when β = 0. Th represents a threshold, and it can be computed as,
where ni and σi represents the image size and the standard deviation at the ith scale.
The decomposition of an image into approximations and detailed coefficients is accomplished using DWT. The information contained in an approximation coefficient is different from the information contained in detailed coefficients, which comprises both informative and noise data. As a result, it is required to eliminate noise from the detailed coefficients. According to this research effort, Daubechies4 (Db4) is used to divide source photos into multiple sub-images, with the decomposition level set at 3. With the suggested thresholding method, only detailed parameters are denoised at each level, resulting in a more accurate result. Inverse DWT is done on both the approximate and detailed coefficients of the image to obtain denoised images.
The proposed method for fusing MRI and CT scans uses both the IWT and the NSCT transforms. In the literature, it has been observed that IWT is shift-invariant, whereas WT is shift variant, which offers the benefits of faster computing and memory efficiency. Compared to other transformations, the NSCT performs significantly better in encoding edge information [5,20]. The IWT algorithm deconstructs both CT and MRI scans individually in this proposed system. The IWT input image is divided into two sub-images: approximation coefficients (LFS) and detailed coefficients (HFS), respectively. The approximation coefficients have the same shape as the input image, but they have a different resolution. The Haar wavelet transformation is employed because of its simplicity and memory-efficient qualities, and the decomposition level is specified as three for this particular application. IWT is decomposed into three levels, as illustrated in Fig. 2.
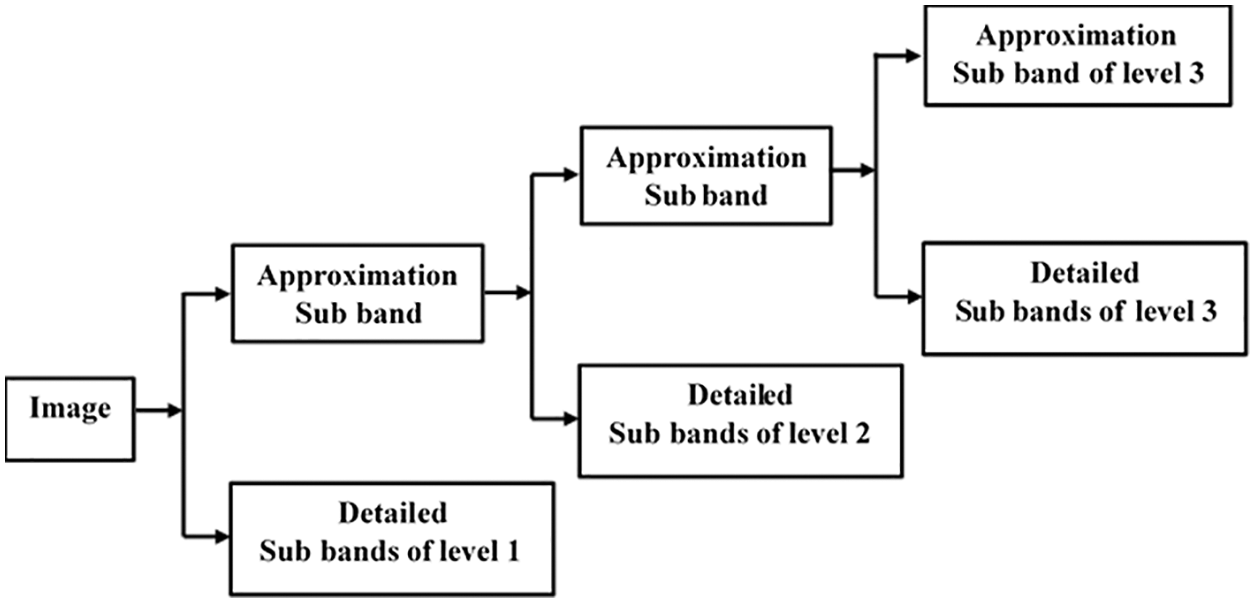
Figure 2: Decomposition process of IWT
The LFS from IWT decomposition is processed using NSCT to improve edge information. At decomposition level 1, the LFS of IWT to also reduced using NSCT. Images are split in NSCT to HFS and LFS when the NPFB processes them. The HFS at level 1 is supplied to the Non-subsampled Directional Filter Bank (NDFB) to achieve directional sub-images. There are two sets of decomposition levels in the proposed scheme: level-1 and level-2, with directions 8 and 8 for CT and MRI approximation coefficients, respectively. Two-level decomposition of NSCT is depicted in Fig. 3.
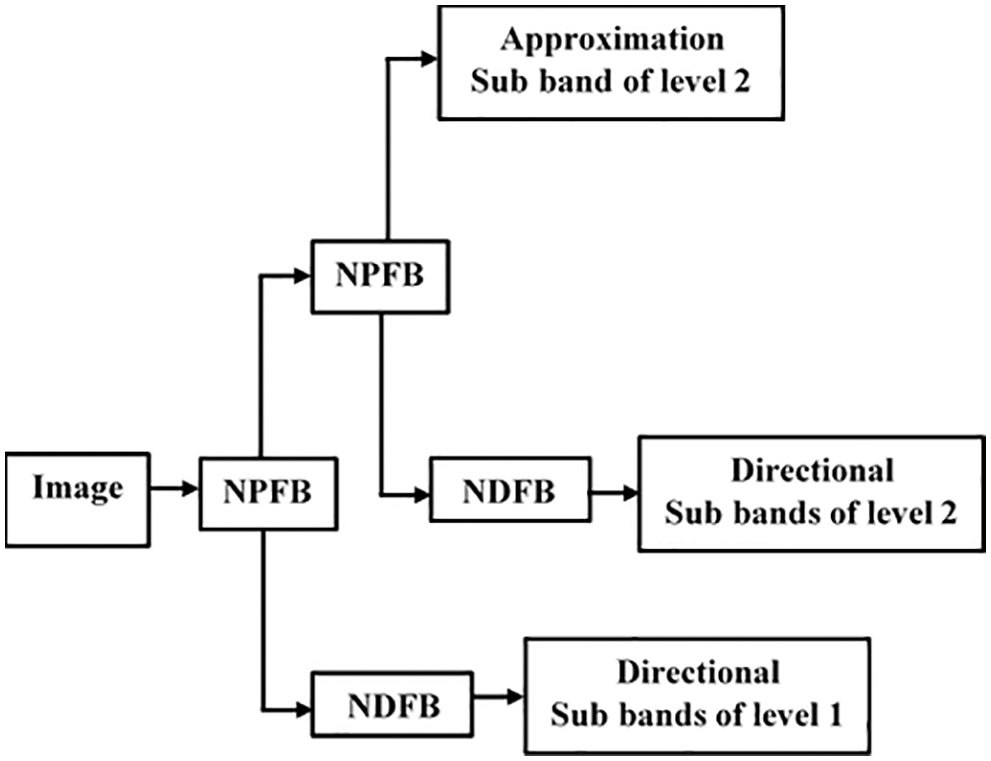
Figure 3: Decomposition process of NSCT
The LFS and HFS of NSCT are combined using the entropy-based fusing and the absolute maximum fusion rule. IWT’s HFS are fused using the sum of the squares rule. This image fusion approach ensures that the crucial details are preserved. Algorithm 1 provides the detailing of the image fusion process.

One of the most critical steps in diagnosing a brain tumor is the segmentation of the tumor. The primary purpose of segmentation is to separate the tumor from its surrounding structures. A new segmentation procedure based on the thresholding method is proposed in the presented scheme. Algorithm 2 outlines the tumor segmentation process.

Images can’t be classified without feature extraction. Both benign and malignant tumors have distinct shapes and structures. The proposed scheme considers three different features, namely statistical features, shape-based features, and GLCM features, by reviewing previous research papers studies [3,13,20,25]. The statistical features are the mean, median, maximum, minimum, standard deviation, and variance. The major and minor axis length, eccentricity, and circularity are included in the shape features. Finally, the GLCM features include correlation, contrast, energy, entropy, homogeneity, and variance. The obtained features are concatenated to get a single set of 16 indicators.
The features obtained from the tumor region are redundant or irredundant to brain tumor classification. A minimal subset of features with predictive potential is selected using EFPA to minimize the computed feature dimension and enhance the classification rate. Flower Pollination Algorithm (FPA) is a nature-inspired algorithm that imitates flowering plants’ pollination behaviour [26]. FPA has been applied in various optimization problems due to its characteristics of flexibility, scalable, robustness, and has very few parameters. FPA can be used to solve single-objective functions as well as multi-objective processes. Four rules show the core of FPA, namely biotic pollination, abiotic pollination, flower constancy, and switching probability. Pollinators like birds can transfer pollen over long-distance during cross-pollination. Biotic pollination and flower constancy are considered a global search, which is defined as,
where,
where, Γ(λ) represents standard gamma function (λ = 1.5). Abiotic and flower constancy are viewed as local search, which is expressed as
where,
where C is a random variable [0, 1], LB and UB are individuals’ lower and upper bound, respectively.
where ∝ is a constant (∝ < 1), s is a constant [1 − ∝, 1], t and tmax are the current and maximum iteration, respectively. In the presented approach, s = 0.8, tmax = 500, and ∝ =0.5.
The specified features are normalized within −1 and 1 to feed the ML classifier. SVM, a supervised learning model, is used for classification and regression issues. First, the images are classified using a non-linear SVM with a Gaussian kernel function in the described method. Then, based on the decision rule, the SVM tries to find a separating hyperplane on the data in the provided dataset.
4 Experimental Results and Discussion
Tables and statistical measurements used for evaluation are provided in this section. Additionally, it describes the proposed scheme’s strength and compares its performance to current best practices to demonstrate its superiority.
4.1 Description of the Dataset
615 patients with 615 CT and MRI brain images were used in the research work. These pre-registered images are gathered from a publicly available database by Harvard Medical school [27]. The source images are grouped into training data and testing data sets. The training data consists of 369 images, including 105 benign and 264 malignant, whereas testing data consists of 246 images, including 99 benign and 147 malignant tumor images. Samples of MRI and CT images are shown in Fig. 4. Fusion of MRI and CT is performed to get a clearer view of the brain. The resultant image information is better visible than individual CT or MRI. The developed brain tumor classification method is implemented in the MATLAB2019 platform and executed on an intel core i5 processor with 12 GB memory.
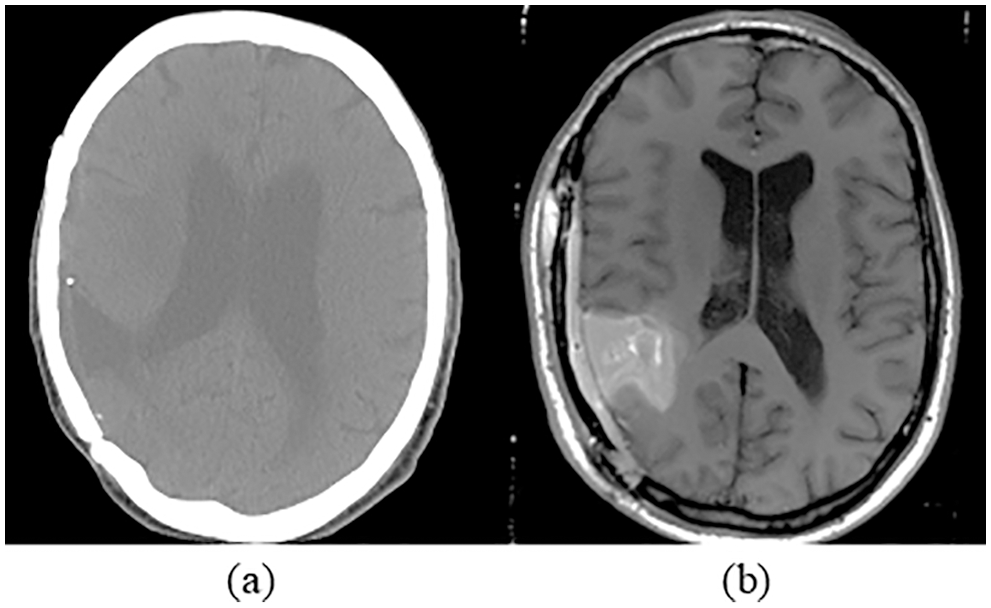
Figure 4: Sample of brain images (a) CT image (b) MRI image
The effectiveness of a categorization system can be evaluated using a variety of statistical indicators. Researchers typically employ sensitivity, specificity, and classification accuracy as their three metrics [1,3,21]. The suggested technique is evaluated using seven parameters, including accuracy rate, specificity, sensitivity, Positive Predictive Value (PPV), Negative Predictive Value (NPV), confusion matrix, and Receiver Operating Characteristics (ROC). The chosen criteria are given in Tab. 1.

Brain tumor classification depending on the image features after the fusion of images is the primary goal of this study. CT and MRI brain images are compared and contrasted. Images from the database are downsized to 512 × 512 because they are all of the various sizes. Gaussian noise is a common source of noise in medical images. As a result, obtaining precise brain images is a challenging endeavor. The IWTh algorithm is suggested to remove noise from the images. IWTh is applied to CT and MRI images to eliminate noise and improve picture quality. CT and MRI images are independently subjected to the Db4 wavelet transform to separate the approximations and detailed coefficients. Level 3 decomposition was selected. Section 3 explains the enhanced threshold method, which only de-noises the specific coefficients of all sub-bands. Inverse DWT is used to recover the denoised image after it has been denoised. For CT and MRI images, the suggested IWTh method’s denoising performance is compared to hard and soft thresholding methods. Tab. 2 summarizes the suggested IWTh’s Signal-to-Noise Ratio (SNR) performance, showing that the suggested IWTh has superior results than soft and hard thresholding, as indicated by the numbers in bold.

Figs. 5 and 6 show the preprocessed CT and MRI images, respectively, after denoising using hard thresholding, soft thresholding, and IWTh.
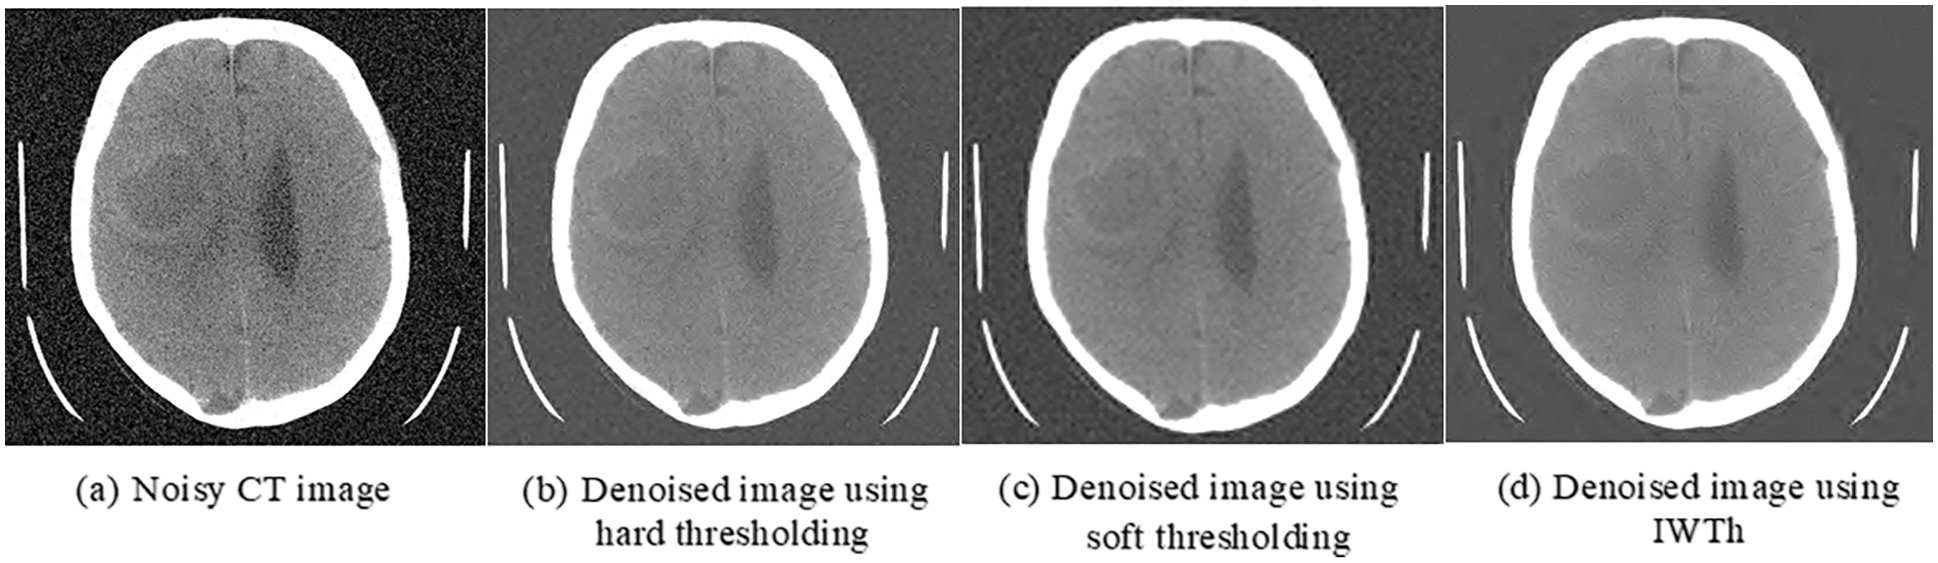
Figure 5: Preprocessed-CT images

Figure 6: Preprocessed-MRI images
Using IWT and NSCT, preprocessed brain images are combined to create a clearer picture of brain tissues and improve diagnostic accuracy. IWT can break down CT and MRI images into their parts up to three levels deep. Although the information in the approximated image is the same as in the original, the resolution is different. As a result, approximation coefficients are further divided using NSCT and a decomposition level of two into high frequency and low-frequency bands. Next, MRI and CT images are combined using image fusion principles outlined in Section 3.2. Following fusion, inverse NSCT and IWT create a fused image. Fig. 7 shows the fused image sample, where it can be seen that the boundary of the tumor, the texture, brightness, and contrast are better as compared to the individual image.

Figure 7: Fused images
Medical image analysis relies on image segmentation. It is mainly employed to reduce computation by separating the tumor from the surrounding tissue. Section 3.3 of this paper outlined a new segmentation algorithm developed in this study. The final result of the segmentation process is shown in Fig. 8. The proposed method can accurately separate a specific area from its background. Segmented tumor lesions are analyzed for statistical, first-order, and GLCM characteristics and merged to form a single feature representation. EFPA is used to pick the most significant features with strong discrimination capacity between benign and malignant tumors to reduce dimension and improve classification performance. Finally, the SVM classifier is loaded with the specified characteristics.

Figure 8: Segmentation outcome
Multiple experiments are carried out to confirm the suggested scheme’s efficacy. First, standard FPA and EFPA statistical metrics evaluate the classification capabilities, including accuracy, specificity, sensitivity, PPV, and NPV of the proposed method. As shown in Tab. 3 and depicted in Fig. 9, the suggested scheme with the standard FPA achieves 88.6% classification accuracy, 85.9% sensitivity, 90% specificity, and 90.5% NPV. In contrast, with the EFPA, the method achieved 97% classification accuracy, 97% specificity, 98% PPV, and 98% NPV. As a result, the suggested EFPA-based strategy produces improved classification performance.


Figure 9: Performance of the proposed scheme with FPA and EFPA
To demonstrate the effectiveness of the proposed scheme, a confusion matrix and ROC are also used. Outcomes of the developed scheme are envisioned utilizing a confusion matrix as illustrated in Fig. 10, where the number of correctly classified images is represented on the diagonal. In confusion matrices, rows correspond to the proposed method outcome, and columns denote actual classes. The classification error for FPA-SVM and EFPA-SVM is 11.4% and 2.4% respectively. This outcome reveals that the developed scheme with EFPA possesses higher classification accuracy when compared to standard FPA.
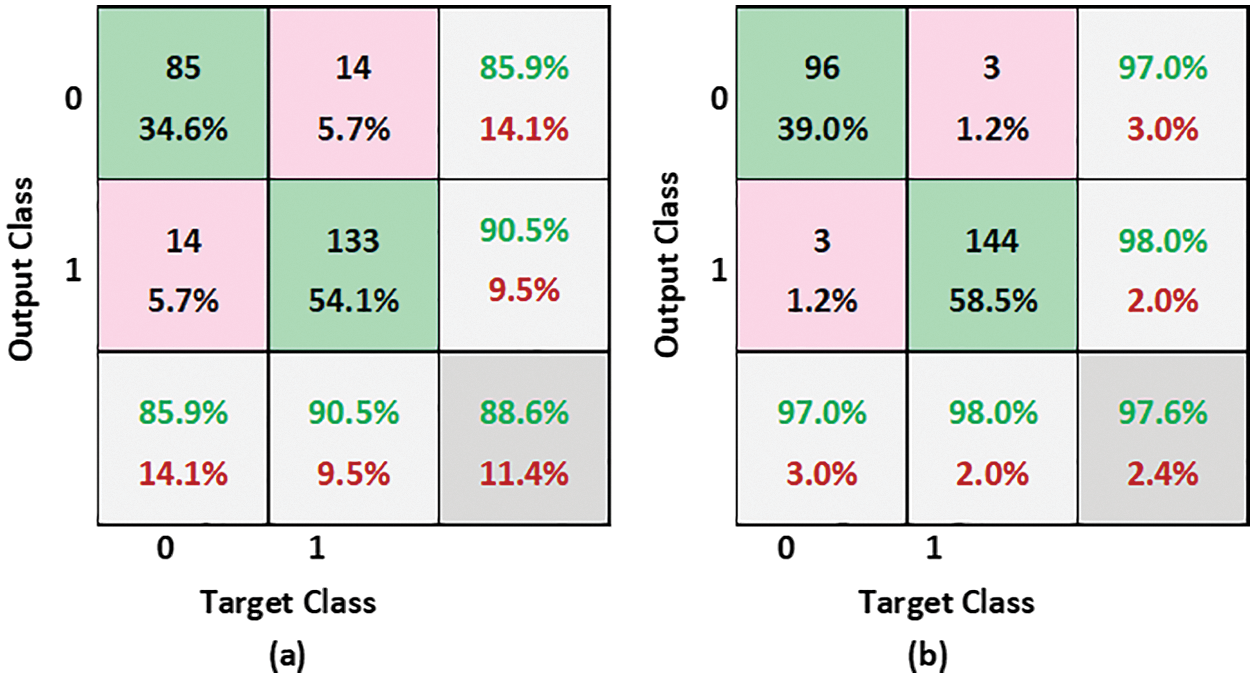
Figure 10: Confusion matrices (a) FPA-SVM (b) EFPA-SVM
ROC is a classifier whose graph is drawn by plotting TPR against FPR. It is one of the standard methods to assess the performance of a classifier. The FPR is drawn on the x-axis, and TPR is drawn on the y-axis. The area under the curve (AUC) lies between 0 and 1. AUC greater than 0.5 indicates good separation. ROC curve using FPA and EFPA is obtained evinced in Fig. 11.
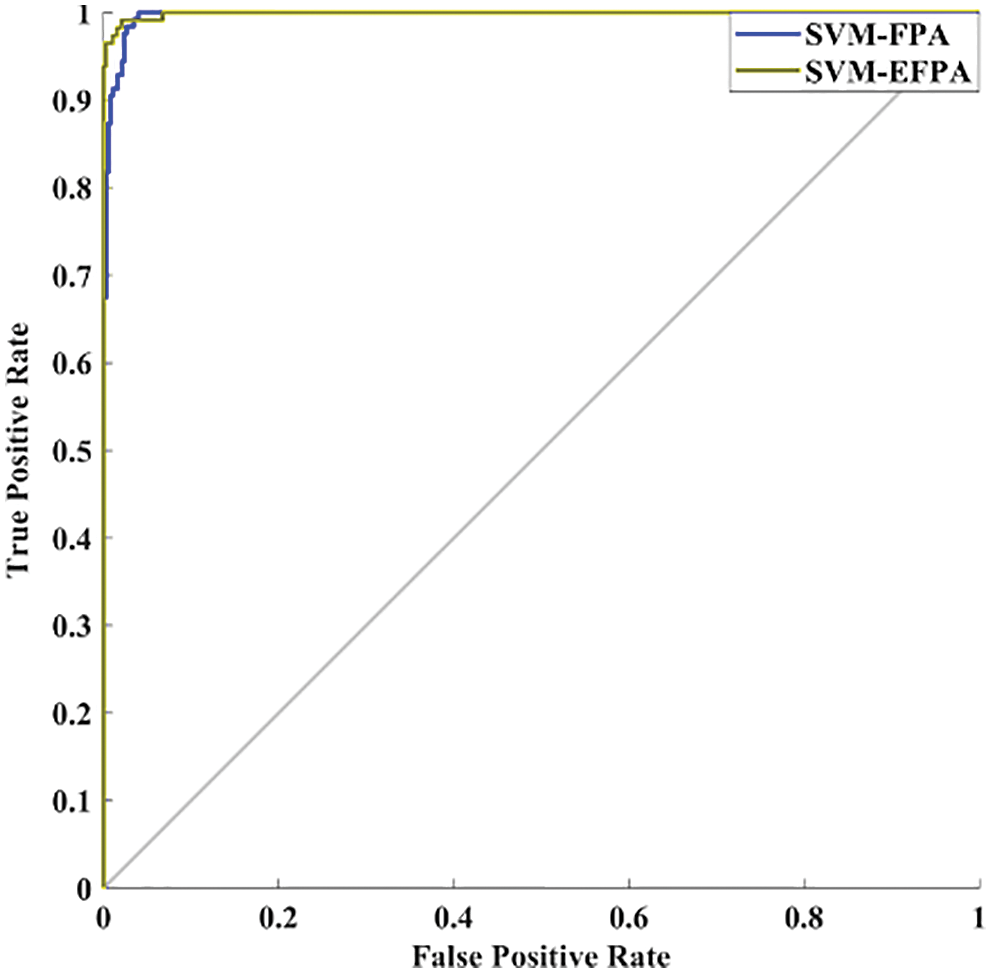
Figure 11: ROC analysis
AUC with FPA-SVM and EPFA-SVM is obtained as 0.9823 and 0.9120, respectively. Therefore, the proposed EFPA-SVM has high separation power as compared to FPA-SVM.
4.4 Comparison with Other Methods
Brain tumor diagnosis using a machine learning classifier can be found in the literature using fused image databases. To further demonstrate the suggested scheme’s usefulness, we have selected only those approaches that used the transform domain method for image fusion and the SVM for classification to demonstrate its effectiveness. There are two approaches to compare, NSCT and contourlet transform. Das et al. [28] used pulse-coupled neural network (PCNN) and NSCT techniques to create a unique multimodal medical image fusion method. NSCT first breaks down the source medical images. Then, the ‘max selection’ criterion fuses the low-frequency sub-bands (LFSs). Next, a PCNN model combines the high-frequency sub-bands (HFSs). Next, NSCT coefficients with extensive activation periods are chosen as the coefficient of fused images based on a modified frequency in the NSCT domain. After that, the fused image is created using INSCT (inverse NSCT). Analysis of results and comparison with current medical image fusion techniques, both subjective and objective, demonstrate the efficiency of the proposed method for fusing multimodal medical images. Prabha et al. [29] used contourlet transform to perform multilevel decomposition. Approximation coefficients are fused using high spatial frequency coefficients, and detailed coefficients are fused utilizing coefficients with high code values. Finally, the fused image is segmented using the Otsu thresholding method. Finally, GLCM features are input to the SVM classifier. This method’s main shortcoming is that statistical and morphological aspects are equally relevant in identifying brain tumors. Tab. 4 and Fig. 12 show how the new process stacked against the old one using sensitivity, specificity, and classification accuracy. Accuracy (97.6%), sensitivity (97%), and specificity (98%) of the devised approach outperform the other methods examined for comparison. Image denoising, fusion, and segmentation are all novel techniques used in this process. According to these results, the suggested system can accurately and precisely classify brain cancers.
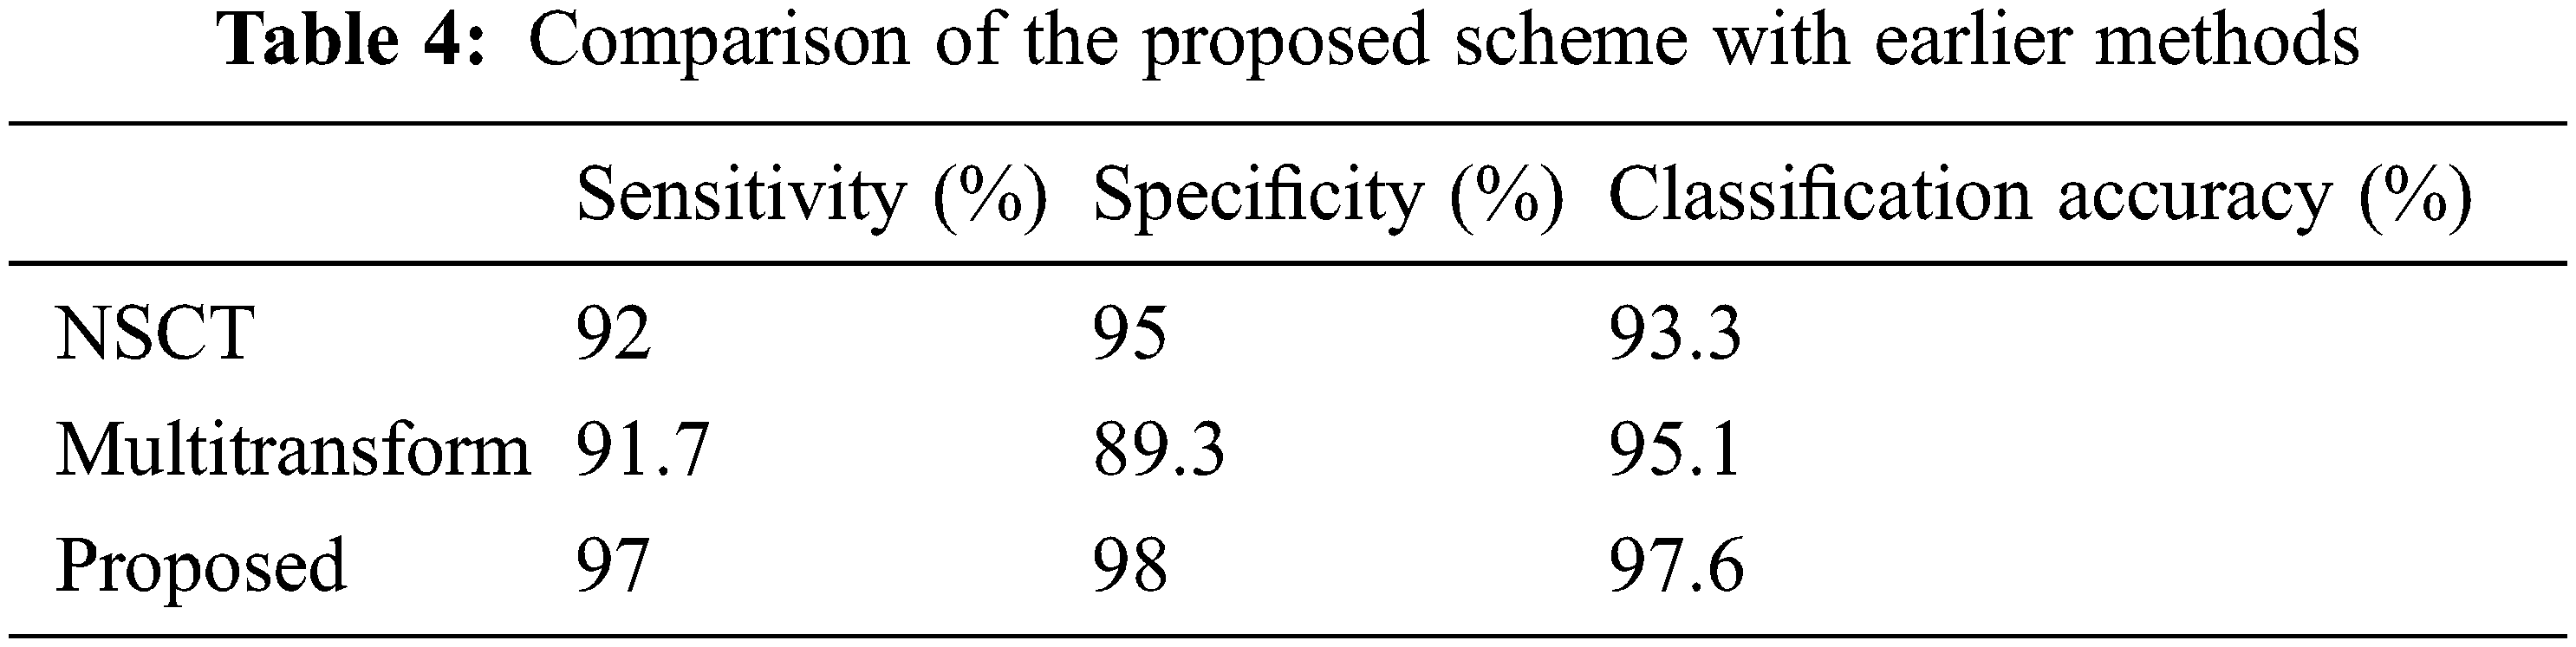
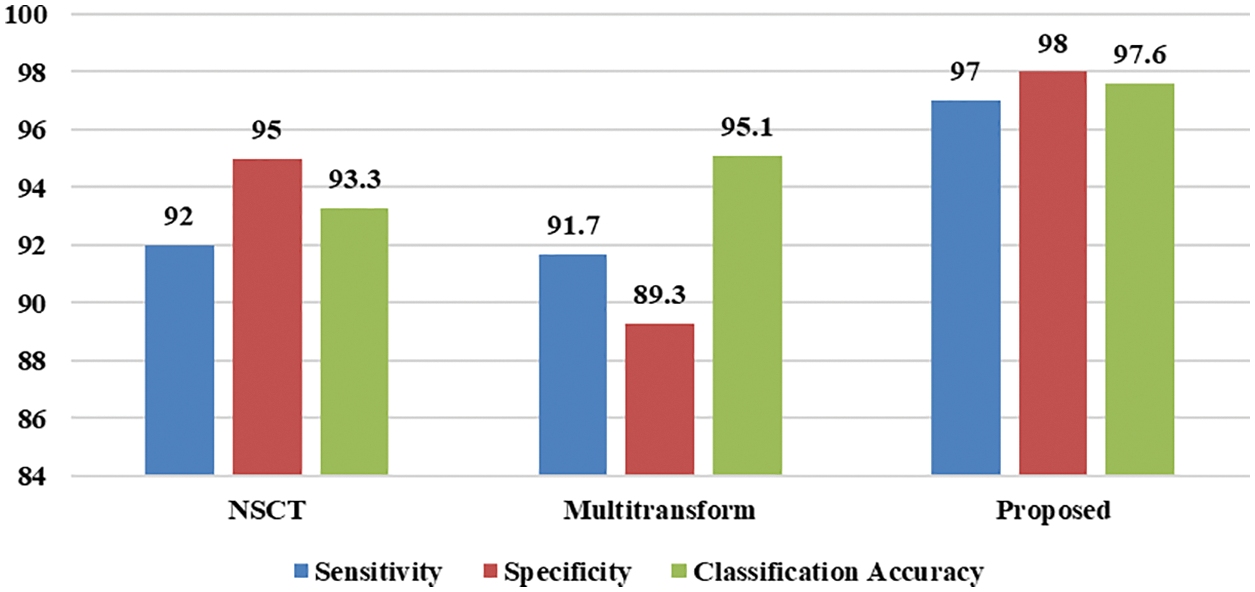
Figure 12: Performance comparison of the proposed scheme with earlier methods
5 Conclusion and Future Enhancement
A novel approach for brain tumor classification based on fused images is presented in this paper. The classification is done using fused MRI and CT images with two types of brain tumors such as benign and malignant. Medical images are affected by some noises, so it is necessary to perform preprocessing of the images. Both CT and MRI images are preprocessed with the IWTh method in the presented scheme. Subsequently, preprocessed images are separately decomposed utilizing IWT followed by NSCT into different sub-images and fused to obtain fused images. A new segmentation algorithm is applied. First, various features are extracted, and then EFPA is adopted to select relevant features and reduce the feature’s dimension. Finally, the SVM classifier classifies the image based on the reduced feature set. Numerical results proved that the proposed scheme yields better results than other methods taken for comparison.
Further to this, empirical findings revealed that the proposed scheme offer potential to classify brain tumor with high classification accuracy. So, it could be a supporting tool for the physician in brain tumor diagnosis. In future work, we will explore different metaheuristic algorithms and machine learning classifiers to enhance our results further. In addition, we will consider data augmentation methods to improve the generalization ability of the proposed scheme. Finally, we will also investigate the efficacy of the developed procedure on other medical images.
Funding Statement: The authors received no specific funding for this study.
Conflicts of Interest: The authors declare that they have no conflicts of interest to report regarding the present study.
References
1. H. Mohsen, E. S. A. E. Dahshan, E. S. M. E. Horbaty and A. B. M. Salem, “Classification using deep learning neural networks for brain tumors,” Future Computing and Informatics Journal, vol. 3, no. 1, pp. 68–71, 2018. [Google Scholar]
2. “American brain tumor association,” (1973). https://www.abta.org/. (Accessed on 01/23/2021). [Google Scholar]
3. N. B. Bahadure, A. K. Ray and H. P. Thethi, “Image analysis for MRI based brain tumor detection and feature extraction using biologically inspired BWT and SVM,” International Journal of Biomedical Imaging, vol. 2017, pp. 9749108, 2017. [Google Scholar]
4. A. Dogra, B. Goyal and S. Agrawal, “Medical image fusion: A brief introduction,” Biomedical & Pharmacology Journal, vol. 11, no. 3, pp. 1209, 2018. [Google Scholar]
5. P. Nanthagopal and R. Sukanesh, “Wavelet statistical texture features-based segmentation and classification of brain computed tomography images,” IET Image Processing, vol. 7, no. 1, pp. 25–32, 2013. [Google Scholar]
6. X. R. Zhang, J. Zhou, W. Sun and S. K. Jha, “A lightweight CNN based on transfer learning for COVID-19 diagnosis,” Computers, Materials & Continua, vol. 72, no. 1, pp. 1123–1137, 2022. [Google Scholar]
7. A. Malibari, R. Alshahrani, F. N. Al-Wesabi, S. B. H. Hassine, M. A. Alkhonaini et al., “Artificial intelligence based prostate cancer classification model using biomedical images,” Computers, Materials & Continua, vol. 72, no. 1, pp. 3799–313, 2022. [Google Scholar]
8. S. Partovi, D. Sin, Z. Lu, L. Sieck, H. Marshall et al., “Fast MRI breast cancer screening-ready for prime time,” Clinical Imaging, vol. 60, no. 2, pp. 160–168, 2020. [Google Scholar]
9. P. Kumar and B. Vijayakumar, “Brain tumour Mr image segmentation and classification using by PCA and RBF kernel based support vector machine,” Middle-East Journal of Scientific Research, vol. 23, no. 9, pp. 2106–2116, 2015. [Google Scholar]
10. J. Amin, M. Sharif, M. Yasmin and S. L. Fernandes, “A distinctive approach in brain tumor detection and classification using MRI,” Pattern Recognition Letters, vol. 139, pp. 118–127, 2020. [Google Scholar]
11. P. P. Gumaste and V. K. Bairagi, “A hybrid method for brain tumor detection using advanced textural feature extraction,” Biomedical and Pharmacology Journal, vol. 13, no. 1, pp. 145–157, 2020. [Google Scholar]
12. A. Kharrat and M. Neji, “A hybrid feature selection for MRI brain tumor classification,” in Int. Conf. on Innovations in Bio-Inspired Computing and Applications, Marrakech, Morocco, vol.735, pp. 329–338, 2017. [Google Scholar]
13. L. Sun, S. Zhang, H. Chen and L. Luo, “Brain tumor segmentation and survival prediction using multimodal MRI scans with deep learning,” Frontiers in Neuroscience, vol. 13, pp. 810, 2019. [Google Scholar]
14. S. P. Yadav and S. Yadav, “Image fusion using hybrid methods in multimodality medical images,” Medical & Biological Engineering & Computing, vol. 58, no. 4, pp. 669–687, 2020. [Google Scholar]
15. S. Gong, W. Gao and F. Abza, “Brain tumor diagnosis based on artificial neural network and a chaos whale optimization algorithm,” Computational Intelligence, vol. 36, no. 1, pp. 259–275, 2020. [Google Scholar]
16. J. Sachdeva, V. Kumar, I. Gupta, N. Khandelwal and C. K. Ahuja, “Segmentation, feature extraction, and multiclass brain tumor classification,” Journal of Digital Imaging, vol. 26, no. 6, pp. 1141–1150, 2013. [Google Scholar]
17. T. Ruba, R. Tamilselvi, M. P. Beham and N. Aparna, “Accurate classification and detection of brain cancer cells in MRI and CT images using nano contrast agents,” Biomedical and Pharmacology Journal, vol. 13, no. 3, pp. 1227–1237, 2020. [Google Scholar]
18. A. Chowdhury, A. R. Chowdhry, I. Das and A. Halder, “Detection and classification of brain tumor using ML,” International Journal of Advanced Research in Computer Science, vol. 9, no. 2, pp. 585–591, 2018. [Google Scholar]
19. P. Ganasala and V. Kumar, “CT and MR image fusion scheme in nonsubsampled contourlet transform domain,” Journal of Digital Imaging, vol. 27, no. 3, pp. 407–418, 2014. [Google Scholar]
20. S. D. Ramlal, J. Sachdeva, C. K. Ahuja and N. Khandelwal, “An improved multimodal medical image fusion scheme based on hybrid combination of nonsubsampled contourlet transform and stationary wavelet transform,” International Journal of Imaging Systems and Technology, vol. 29, no. 2, pp. 146–160, 2019. [Google Scholar]
21. K. Usman and K. Rajpoot, “Brain tumor classification from multimodality MRI using wavelets and machine learning,” Pattern Analysis and Applications, vol. 20, no. 3, pp. 871–881, 2017. [Google Scholar]
22. B. Sun, W. Zhu, C. Luo, K. Hu, Y. Hu et al., “Fusion of noisy images based on joint distribution model in dual-tree complex wavelet domain,” International Journal of Imaging Systems and Technology, vol. 29, no. 1, pp. 29–41, 2019. [Google Scholar]
23. J. Yu and D. C. Liu, “Thresholding-based wavelet packet methods for doppler ultrasound signal denoising,” in 7th Asian-Pacific Conf. on Medical and Biological Engineering, Beijing, China, vol. 19, no. 9, pp. 408–412, 2008. [Google Scholar]
24. O. E. B’Charri, L. Rachid, K. Elmansouri, A. Abenaou and W. Jenkal, “ECG signal performance denoising assessment based on threshold tuning of dual-tree wavelet transform,” Biomedical Engineering Online, vol. 16, no. 1, pp. 26, 2017. [Google Scholar]
25. T. Kavitha and C. Chellamuthu, “Fusion of SPECT and MRI images using integer wavelet transform in combination with curvelet transform,” The Imaging Science Journal, vol. 63, no. 1, pp. 17–23, 2015. [Google Scholar]
26. X. Yang, “Flower pollination algorithm for global optimization,” in Int. Conf. on Unconventional Computing and Natural Computation, Berlin, Heidelberg, vol. 7445, pp. 240–249, 2012. [Google Scholar]
27. “The whole brain atlas of harvard medical School (2015),” http://www.med.harvard.edu/AANLIB/. (Accessed on 01/26/2021). [Google Scholar]
28. S. Das and M. K. Kundu, “NSCT-based multimodal medical image fusion using pulse-coupled neural network and modified spatial frequency,” Medical & Biological Engineering & Computing, vol. 50, no. 10, pp. 1105–1114, 2012. [Google Scholar]
29. S. Prabha, R. S. Raghav, C. Moulya, K. G. Preethi and K. S. Sankaran, “Fusion based brain tumor classification using multiscale transform methods,” in Int. Conf. on Communication and Signal Processing (ICCSP), Chennai, India, pp. 1390–1393, 2020. [Google Scholar]
Cite This Article
 Copyright © 2023 The Author(s). Published by Tech Science Press.
This work is licensed under a Creative Commons Attribution 4.0 International License , which permits unrestricted use, distribution, and reproduction in any medium, provided the original work is properly cited.
 Downloads
 Citation Tools