
 Submit a Paper
 Propose a Special lssue
 Open Access
ARTICLE
Butterfly Optimized Feature Selection with Fuzzy C-Means Classifier for Thyroid Prediction
1 Department of Computer Science and Engineering, Kathir College of Engineering, Coimbatore, 641062, India
2 Department of Computer science and Engineering, Bannari Amman Institute of Technology, Sathyamangalam, 638401, Tamilnadu, India
3 Department of Computer Science, College of Computers and Information Technology, Taif University, Taif, 21944, Saudi Arabia
4 Department of Information Technology, College of Computers and Information Technology, Taif University, P.O. BOX 11099, Taif, 21944, Saudi Arabia
5 Department of Mathematics, Faculty of Science, Mansoura University, Mansoura 35516, Egypt
6 Department of Computational Mathematics, Science, and Engineering (CMSE), Michigan State University, East Lansing, MI, 48824, USA
* Corresponding Author: Mohamed Abouhawwash. Email:
Intelligent Automation & Soft Computing 2023, 35(3), 2909-2924. https://doi.org/10.32604/iasc.2023.030335
Received 24 March 2022; Accepted 26 April 2022; Issue published 17 August 2022
 View Full Text
 Download PDF
Abstract
The main task of thyroid hormones is controlling the metabolism rate of humans, the development of neurons, and the significant growth of reproductive activities. In medical science, thyroid disorder will lead to creating thyroiditis and thyroid cancer. The two main thyroid disorders are hyperthyroidism and hypothyroidism. Many research works focus on the prediction of thyroid disorder. To improve the accuracy in the classification of thyroid disorder this paper proposes optimization-based feature selection by using differential evolution with the Butterfly optimization algorithm (DE-BOA). For the classifier fuzzy C-means algorithm (FCM) is used. The proposed DEBOA-FCM is evaluated with parametric metric measures of sensitivity, specificity, and accuracy. In this work, the thyroid disease dataset collected from the machine learning University of California Irvine (UCI) database was used. The accuracy rate for the Differential Evolutionary algorithm got 0.884, the Butterfly optimization algorithm got 0.906, Fuzzy C-Means algorithm got 0.899 and DEBOA + Focused Concept Miner (FCM) proposed work 0.943.Keywords
In medical science, diagnosis and prediction of disease is a complicated task for physicians. The secretions of the thyroid hormone are important in metabolism regulation. The thyroid gland is one of the main organs of our body. Due to hormonal changes in the body two prominent disorders of thyroid disease are hypothyroidism and hyperthyroidism [1]. Due to excess hormones, hyperthyroidism disorder formed. This disorder disrupts the chemical equilibrium of the human body. Therefore, it causes other illnesses and toxic adenomas can develop. In addition to that, hyper thyroiditis is the main cause of diseases like malignant tumors or the pituitary gland.
Thyroid cancer is caused due to genetic nature of our parents [2]. Thyroid cancer or tumor is caused by faulty genetic nature. And also, deficiency in the nutritious diet and certain chemical changes occur in our body. It may lead our life at a high-risk rate in various forms of thyroid cancer. The thyroid hormones are controlled by thyrotropin (TSH) [3]. When the secretion of thyroid hormone reduces caused many diseases like constipation, dry skin, prolonged menstrual bleeding, weight gain, and feeling cold. In addition to this, it causes the disorders of Hashimoto’s thyroiditis and Thyroid hormone resistance [4].
The structure of the thyroid is like a butterfly shape. Its right and left lobes of the thyroid look like the wings of a butterfly. The link between these two wings is called the isthmus [4–5]. The hormones produced through the thyroid gland control the growth of the human body and its metabolism. Thyroid disease is a peculiar one compared with other diseases in the aspects of easy diagnosis and accesses the treatment [6]. The secretion of thyroid hormone increases and decreases can create health problems in various ways. There are so many research works that have been done on the diagnosis of thyroid disease. The issues in the traditional method are inaccurate diagnosis, time consumption is high, inconsistency, and elimination of redundant features and consists of missing attribute values. To overcome these issues DEBOA-FCM proposed work is implemented.
To diagnose various types of diseases with a high accuracy rate by using machine learning technique which helps the physicians in the aspects of reducing the cost and minimizing the prediction time and error rate. In this work efficient prediction of thyroid disease based on optimized feature selection with fuzzy c-means classifier is implemented. The purpose of this work undergoes various stages like pre-processing, feature selection, and classification. Handling huge features leads to time-consuming and cost-effectiveness. Therefore, proposed work DEBOA-FCM is needed to develop a model for the prediction of thyroid disease with minimum features and classify the thyroid disease as normal, hyperthyroidism, and hypothyroidism. The main contribution of this proposed work is:
• To reduce inconsistency, eliminate the redundant features, and maintain the missing feature values by using pre-processing phase.
• To handle a large volume of data with whole features will mislead inaccurate diagnosis. Therefore, feature selection is implemented by using a fusion of differential evolutionary algorithm with the Butterfly optimization algorithm.
The paper has been organized as follows: Section 2 describes the review of the literature, Section 3 describes the feature selection is based on DEBOA, Section 4 discusses experimented results and Section 5 concludes the paper with future directions.
Nowadays thyroid disease is a common problem based on the hormonal changes in the body. Thyroid disease can affect women, men, children, and elder persons. A hormonal change in the body creates thyroid disorder which is detected by blood tests. The classification of thyroid disease is hyperthyroidism and hypothyroidism. Clinically hyperthyroidism is based on excessive thyroid hormones and hypothyroidism is a lack of thyroid hormone [5]. Prediction of hypothyroid disease using Linear Discriminant Analysis (LDA) [6] performs well. Borzouei et. al. [7] proposed forecasting the thyroid cancer survey in which 44,280 new instances (12,150 men and 32,130 women) in the American Cancer Society. Shiva Borzouei et.al [8] proposed a new model based on Multinomial logistic regression with a neural network that diagnoses the thyroid disorder of hyperthyroidism and hypothyroidism. In the machine learning algorithm, the diagnosis of thyroid disease using the attributes in the dataset requires more attention. These attributes are converted into matrix format by using the rough set method. This matrix is a combination of rows that denotes the attributes and columns are represented rules which are applied to each attribute in the data set [9]. Ankita et.al. [10] focus diagnosis of thyroid disease using comparatives of Support Vector Machine(SVM), multiple linear regression, Nave Bayes and Decision Tree.
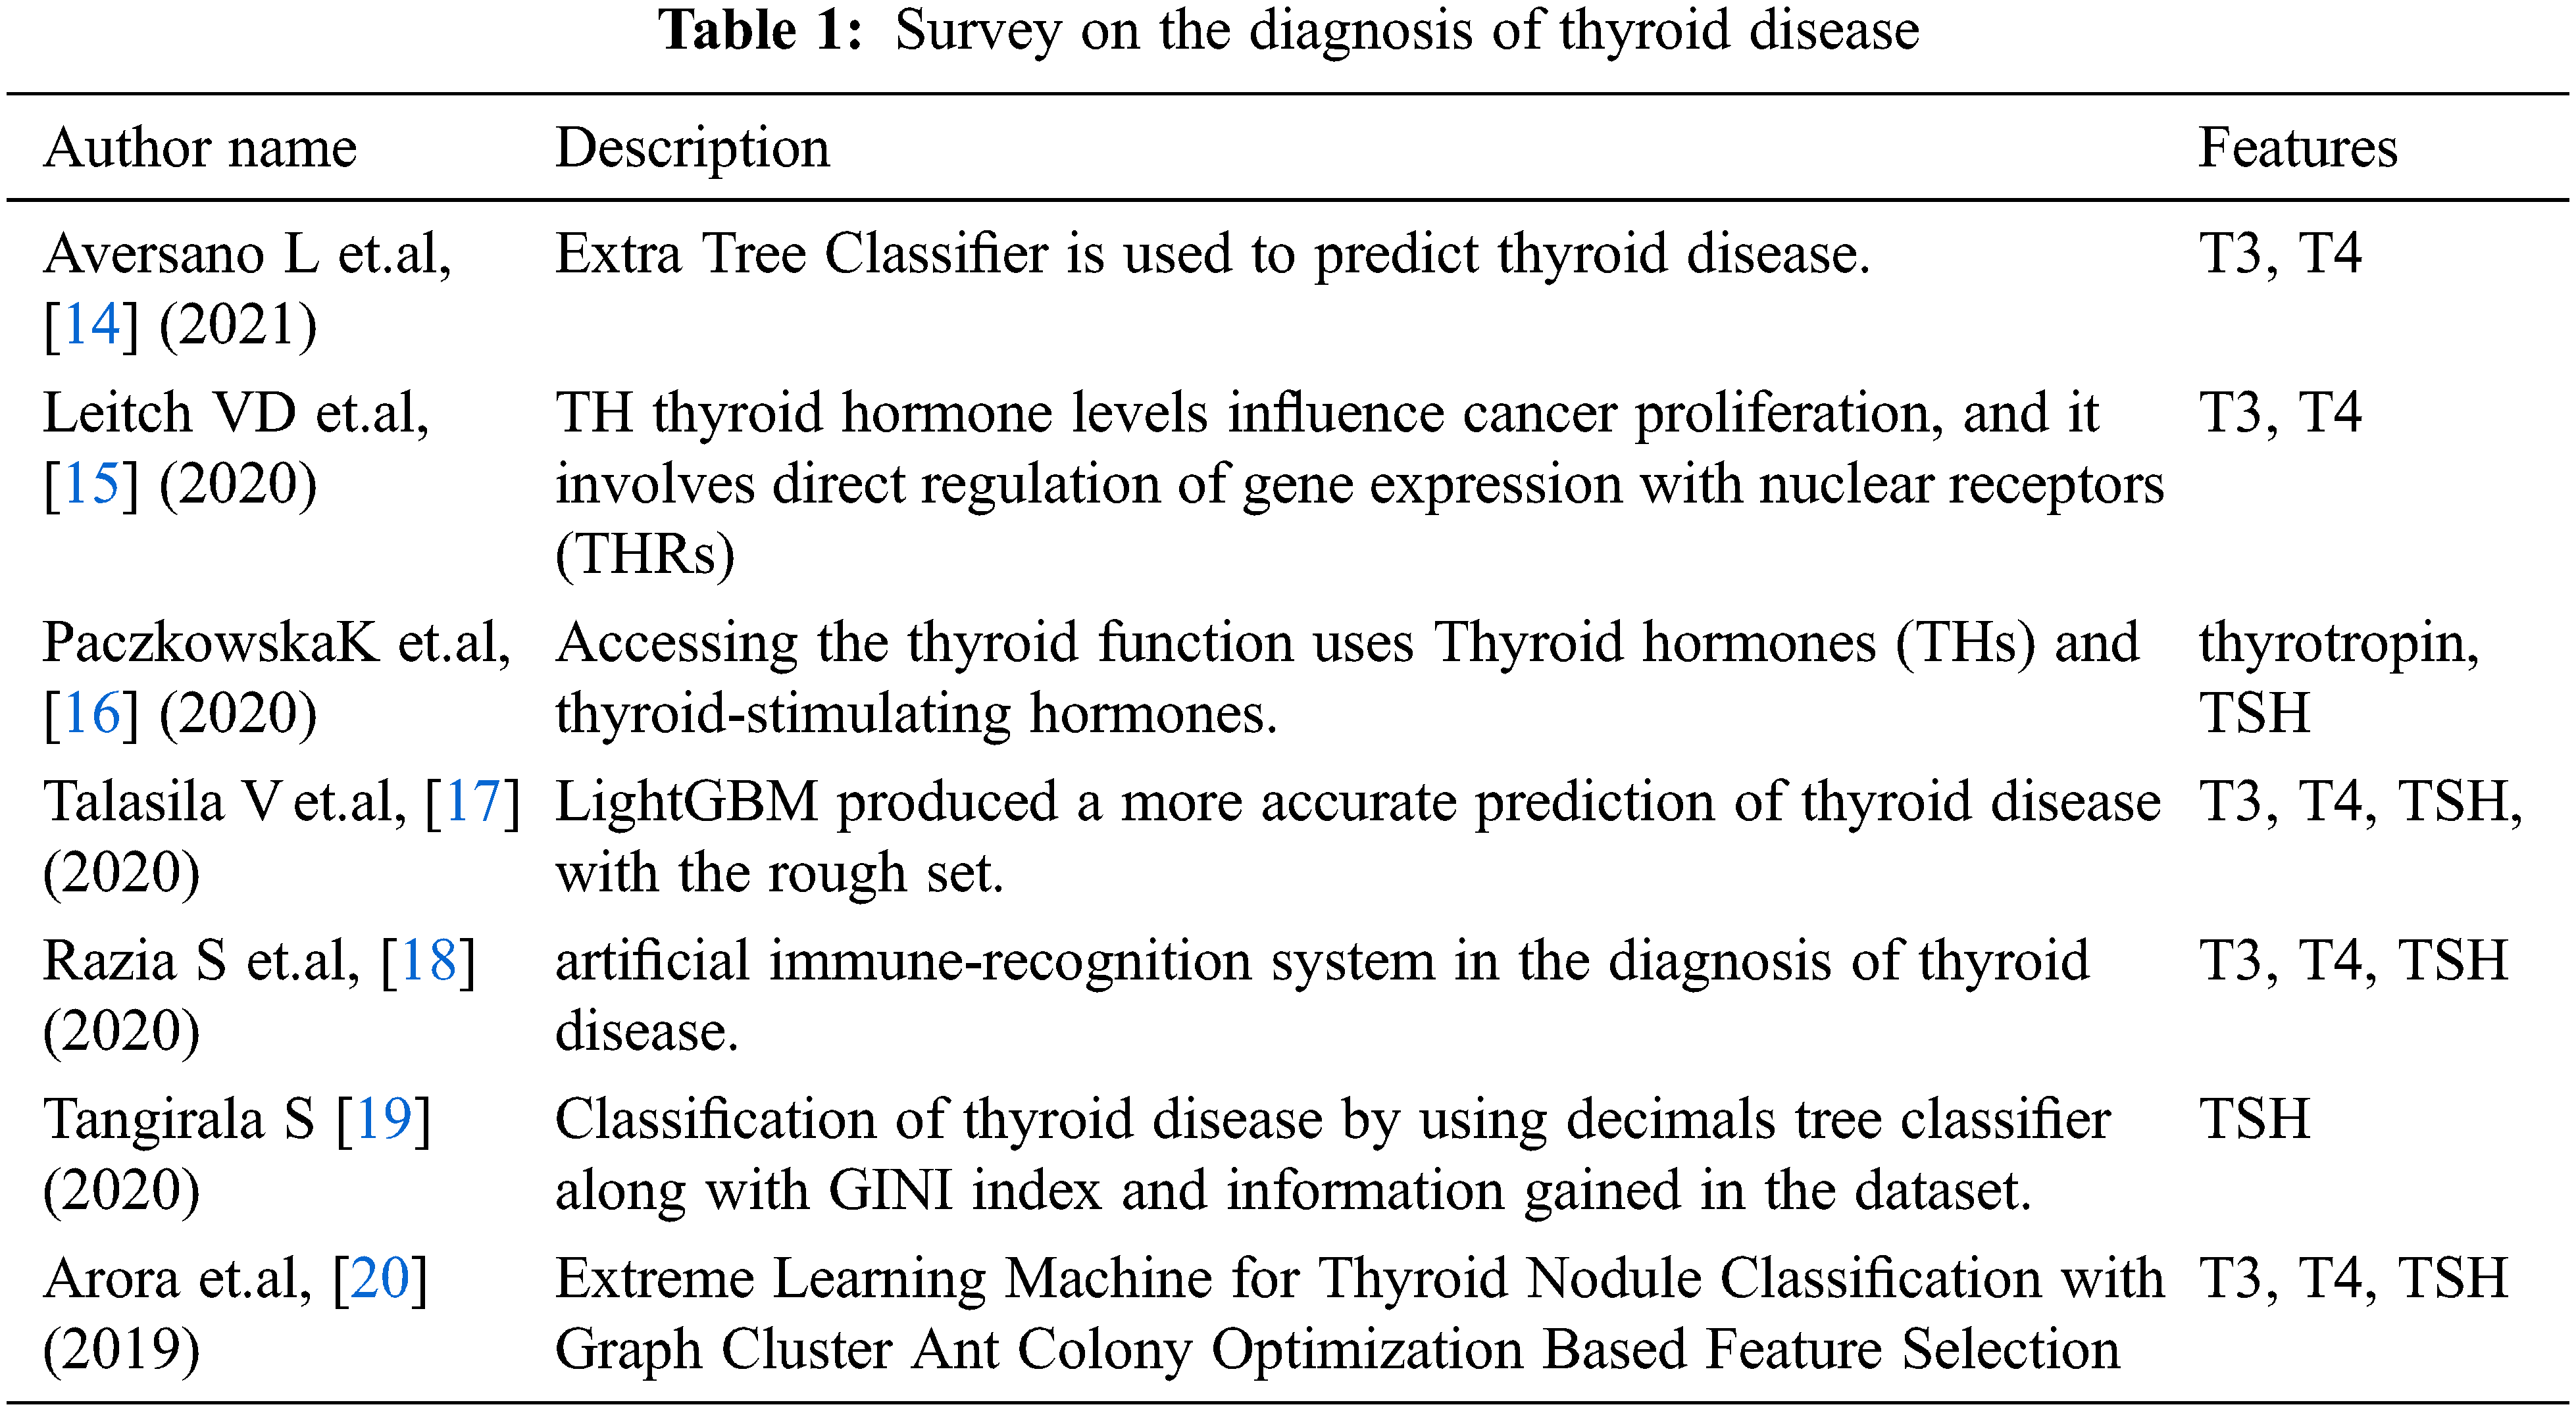
In the last few years, the concept of artificial intelligence is used in the classification of thyroid disease. For the clinical examination, the machine learning algorithm has effectively implemented the interpretation of data related to thyroid disease and diagnosis of the disease at the early stage [11]. Singh [12] proposed the K-nearest neighbor and Support vector machine, Bayesian classification of thyroid diseases in the data set of the ultrasound image of thyroid nodules. Erol et al. [13] proposed a multilayer perceptron with a radial basis function neural network for the classification of thyroid disease. Tab. 1. shows that survey about thyroid disease. Above discussed techniques have less efficiency in thyroid prediction.
The proposed work of diagnosis thyroid disease using machine learning algorithms provides better parallelism, high speed, and tolerance of error against noise. The reuse feature which is kept in Machine Learning Applications(MLA) helps to think of an option for proposed work development. Thyroid attributes are suitably converted for representing hard analysis. Two levels are followed 1. Discretizing, 2. Matrix is formed with rows and columns. A row represents attributes with similar scores and a column defines the attribute definition by the ruleset. The overview of the proposed work is shown in Fig. 1.
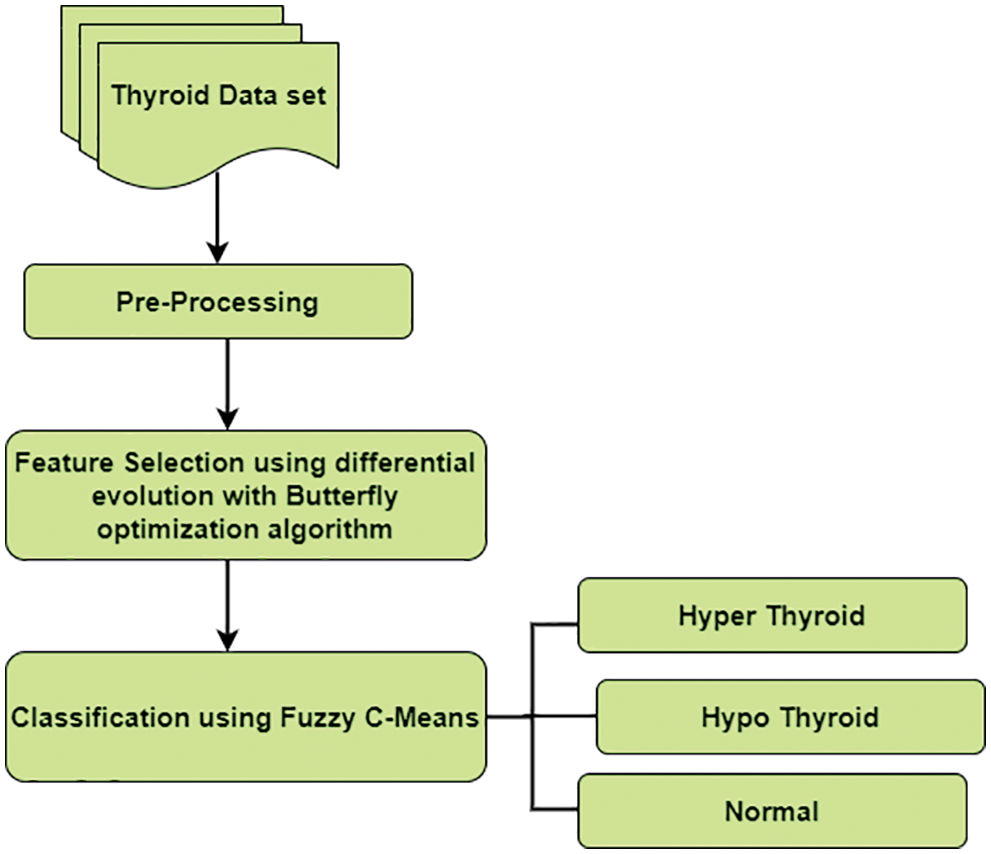
Figure 1: Overview of proposed work
Various problems like noisy variables, data redundancies, and missing values are recovered using the pre-processing step as shown in Fig. 2. The cost of mining can be reduced by using high-quality data for producing quality results. The whole dataset is pre-processed by using an algorithm. Traditional algorithms extract features from discrete datasets. If it is a continuous feature, algorithms are combined to introduce discrete attributes. UCI repository in our work has continuous and discrete data for pre-processing. The masking technique is used to check the false number constraint and missing values. If these values are available, then it is replaced by the column’s mean value.
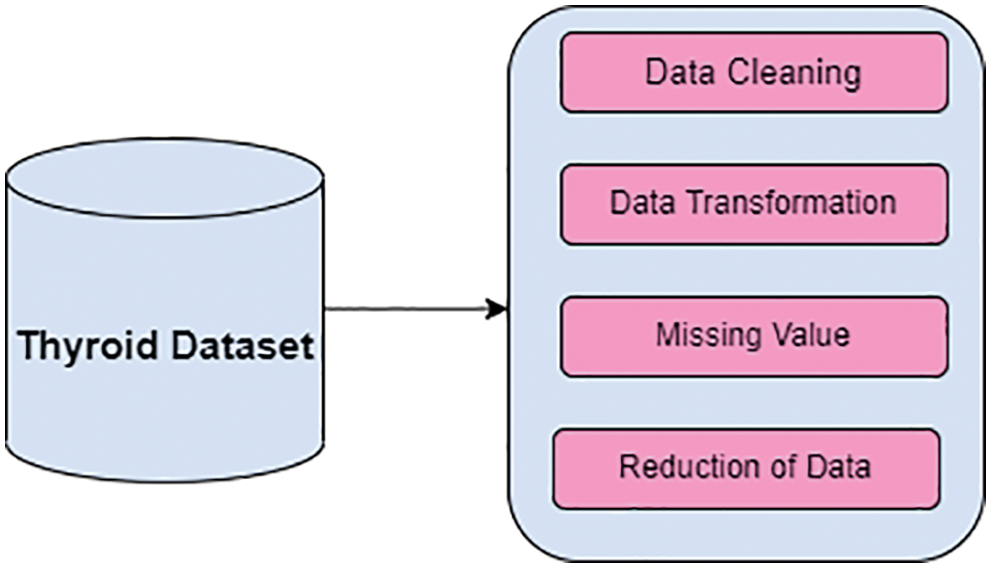
Figure 2: Data pre-processing
Data cleaning improves the accuracy and to produce the high-quality results this UCI repository data set undergoes a data cleaning process. removal of noise, cleaning redundant data. Data Transformation consists of an input UCI repository dataset containing a combination of discrete and continuous data types. These data are transformed into a standard format for the analysis. In this work, data transformation is done by using normalization. The normalized range of input values between [−1.0 to 1.0] or [0.0 to Missing Data the input dataset contains missing elements that can be replaced by values or discarded the missing information. Missing values or null values are identified by using the mask method and replaced by their column mean value. Data Reduction helps to improve the accuracy, increase the storage space dimensionality reduction of data is used. Irrelevant features of data are discarded.
3.2 Proposed Feature Selection
Improving accurate diagnosis, minimizing the accessing time, and discarding irrelevant attributes of the data are essential. Examining the whole data set is a tedious one. Therefore, selecting significant attributes of data is needed. These selections of significant features help the experts in the aspect of quick diagnosis of disease. In the feature selection, identify the most relevant features or selection of subset features from the dataset. These subset features are ranked based on selection strategies. Hence, reduction of dimensionality attributes, removing irrelevant attributes and redundant data in the data set. In this proposed work, feature selection is based on the fusion of Differential evolution with the Butterfly optimization algorithm. (DE-BOA). Feature
3.2.1 Differential Evolution (DE)
Differential Evolution (DE) is an effective optimization search problem. It is based on directional search and stored in vector format. Like an evolutionary algorithm, it implements crossover, mutation, and selection. The main part of Differential Evolution is selecting the mutation operator from vector values, based on these values it can scale the difference between the remaining two values (members) of the population. The procedure of differential evolution is given in algorithm 1 as shown in pseudo-code form.
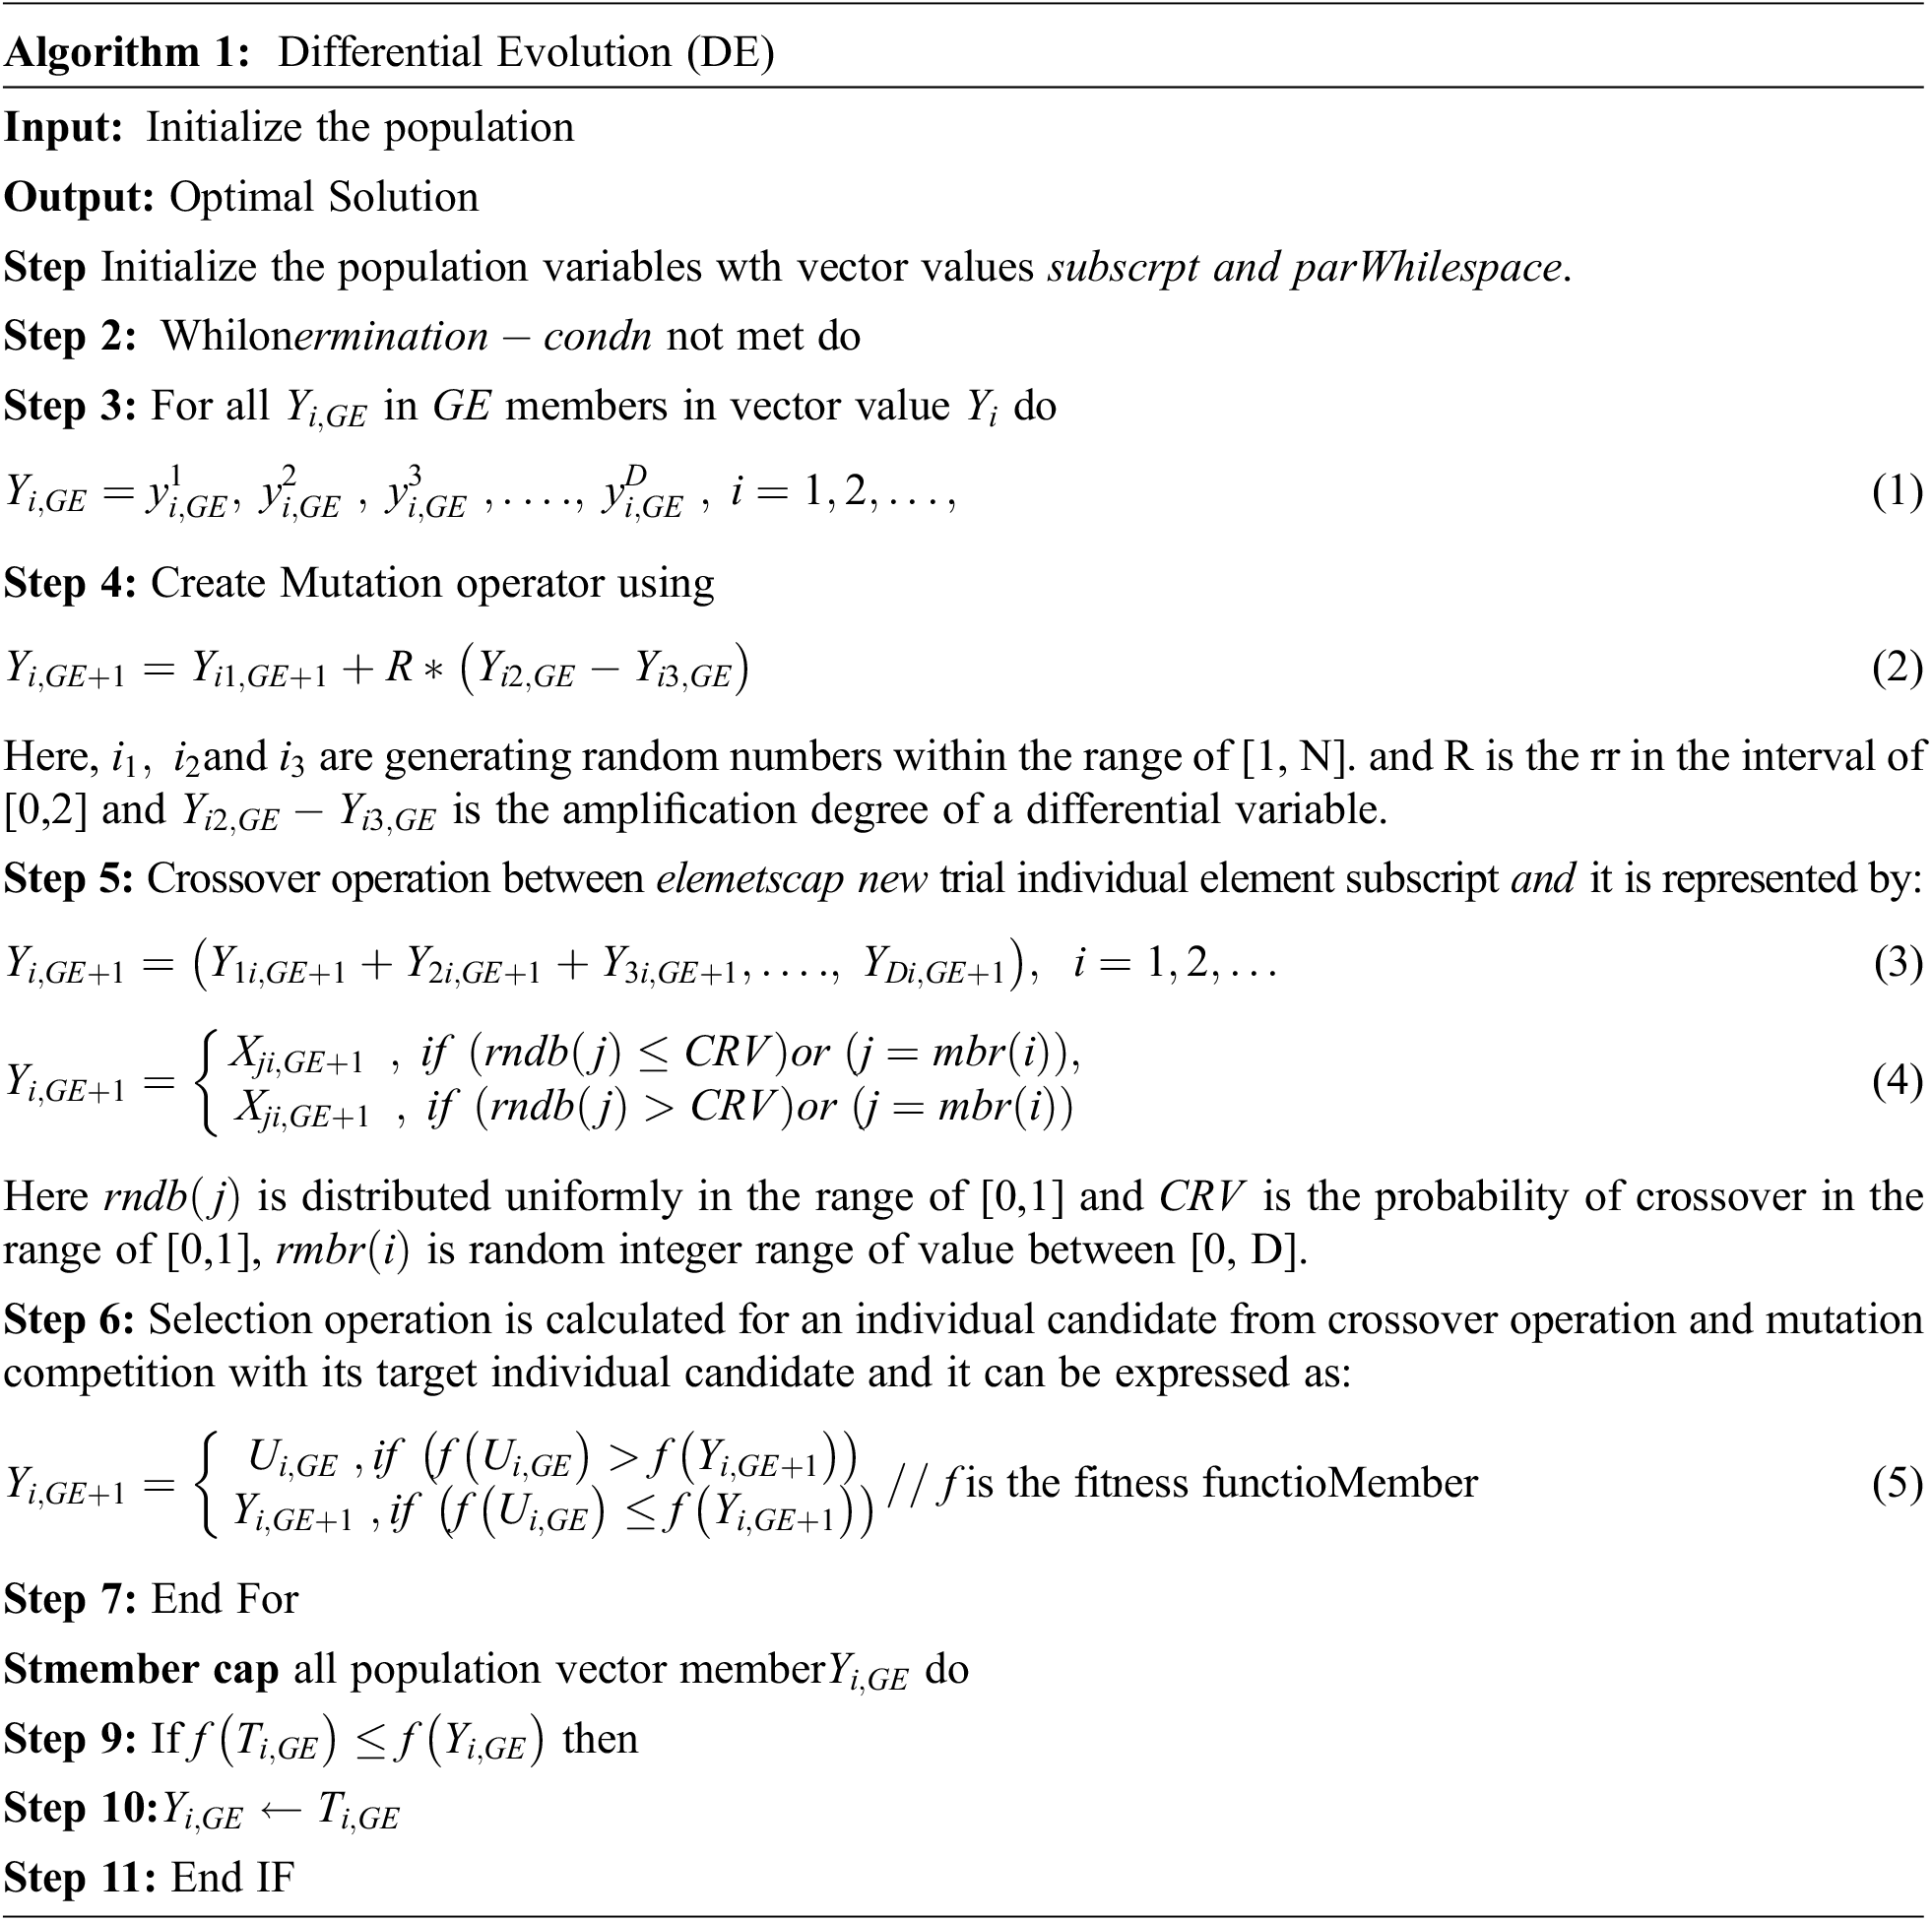
In Algorithm 1, shows that implementation of Differential evolution and its crossover is called binomial crossover. Newly creation of trial population vector which transfers over to the next generation. The newly created trial vector is replaced by the target vector value which is equal toor minimum cost based on a fitness function. Fig. 3 shows theworkflow of DE.
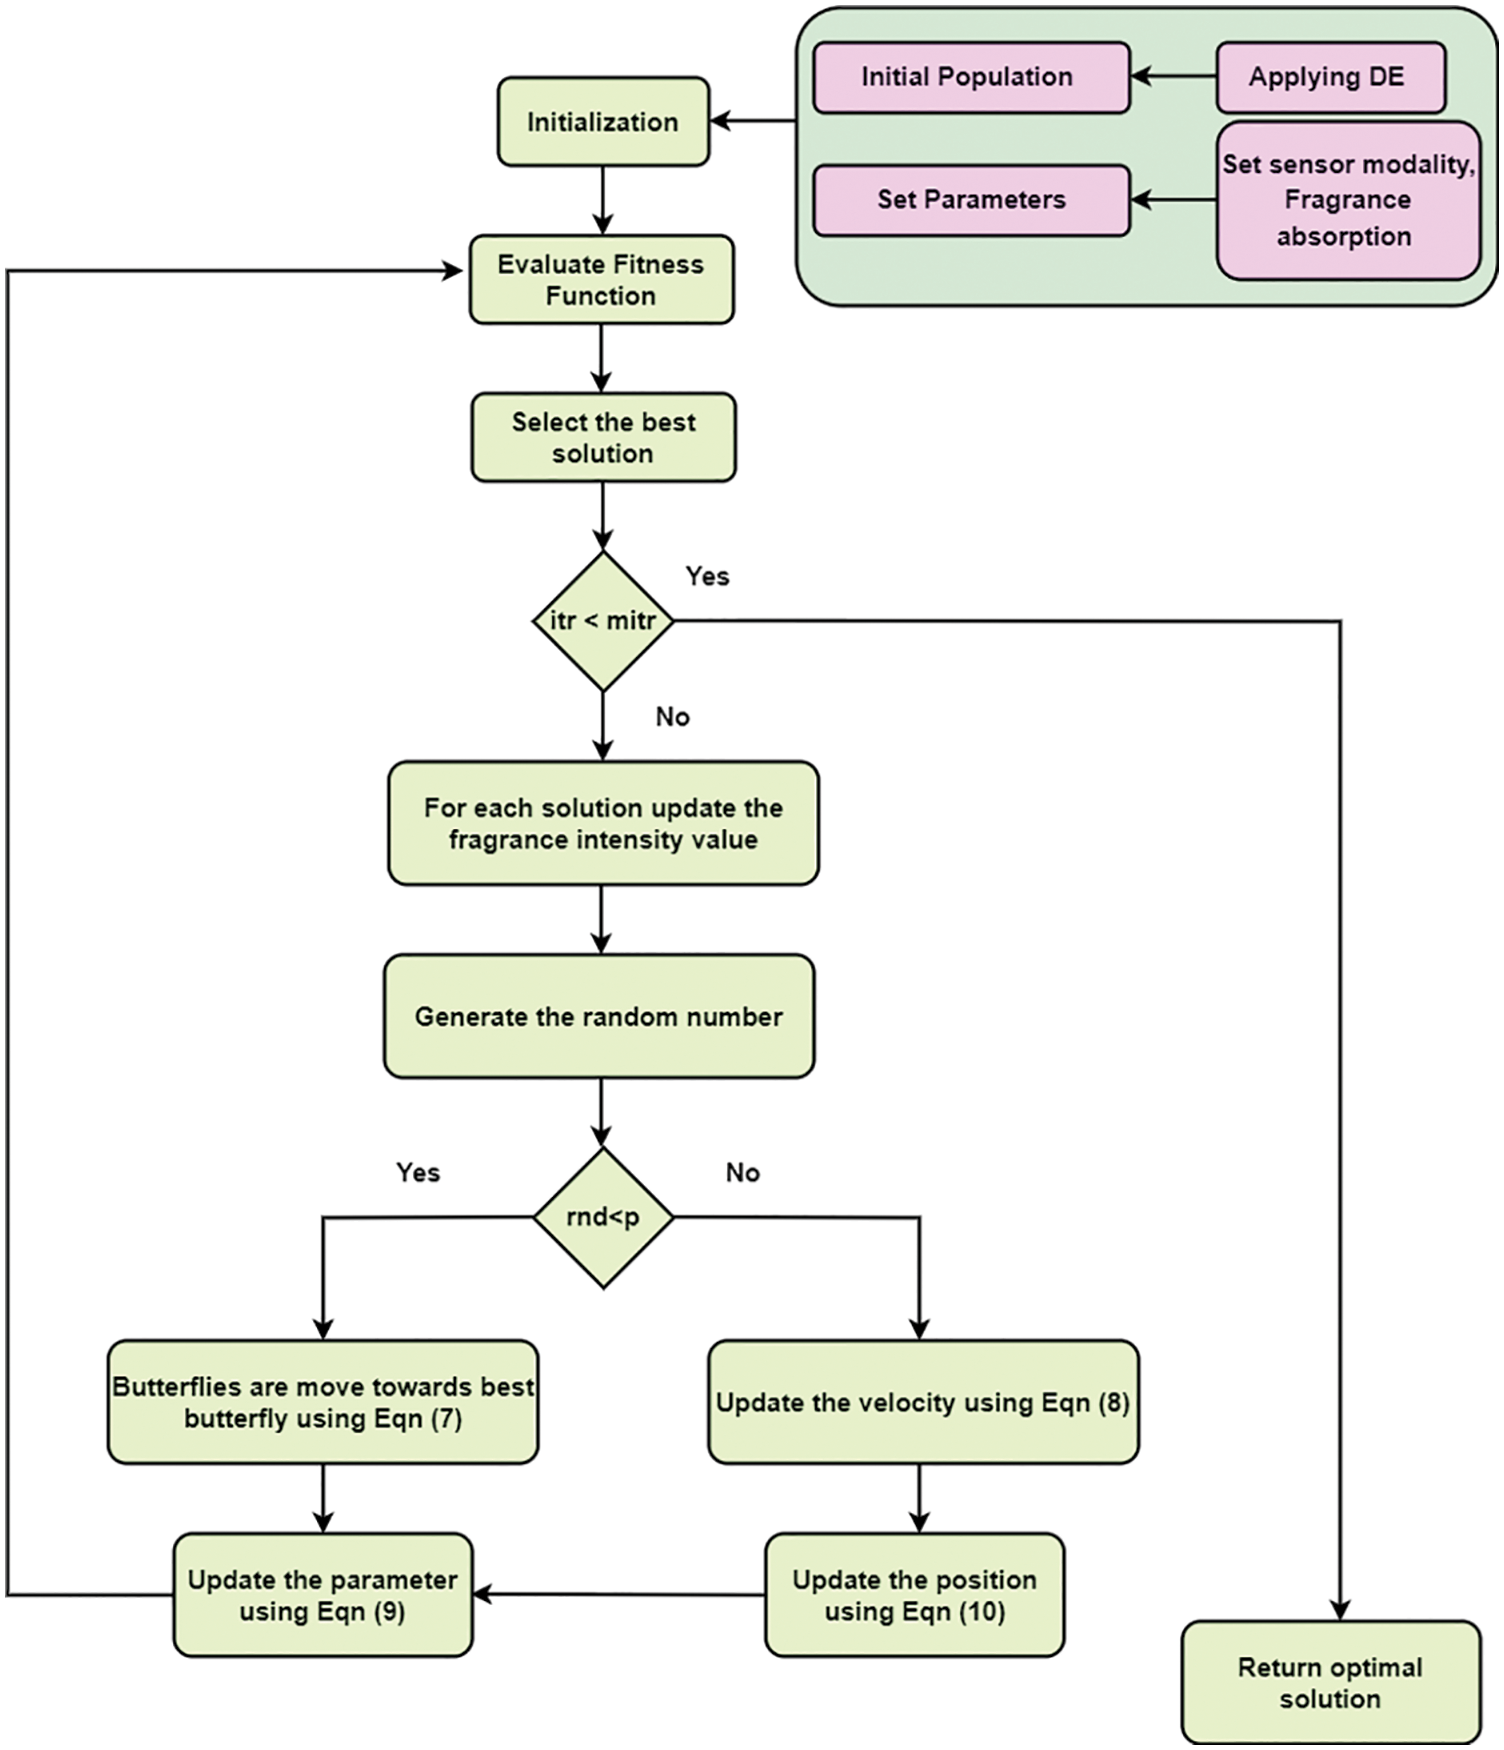
Figure 3: Proposed DE butterfly optimization algorithm
3.2.2 Butterfly Optimization Algorithm
The idea behind the butterfly optimization algorithm (BOA) isa fusion of behaviours of the butterfly insect with its biological character. Butterflies are insects that belonging to Lepidoptera. It has senses like sight, smell, taste, touch, and hearing [21].It mimics social behaviour and buttery food. By using these senses,it can search its food, mating parcener, escape from its enemies, and immigrate from one place to another place. During immigration, it generates a fragrance with intensity for propagating the distance. The fragrance intensity attracts the other best butterfly by sensing the fragrance and moving towards it and it is called a global search. If it fails to sense the intensity of the fragrance of best butterfly randomly it can move to another new position in the search space and it is called as local search. The fragrance sensing is shown as physical strength of the stimulus and it can be expressed as:
Here,
Here
Here
Here,
Here
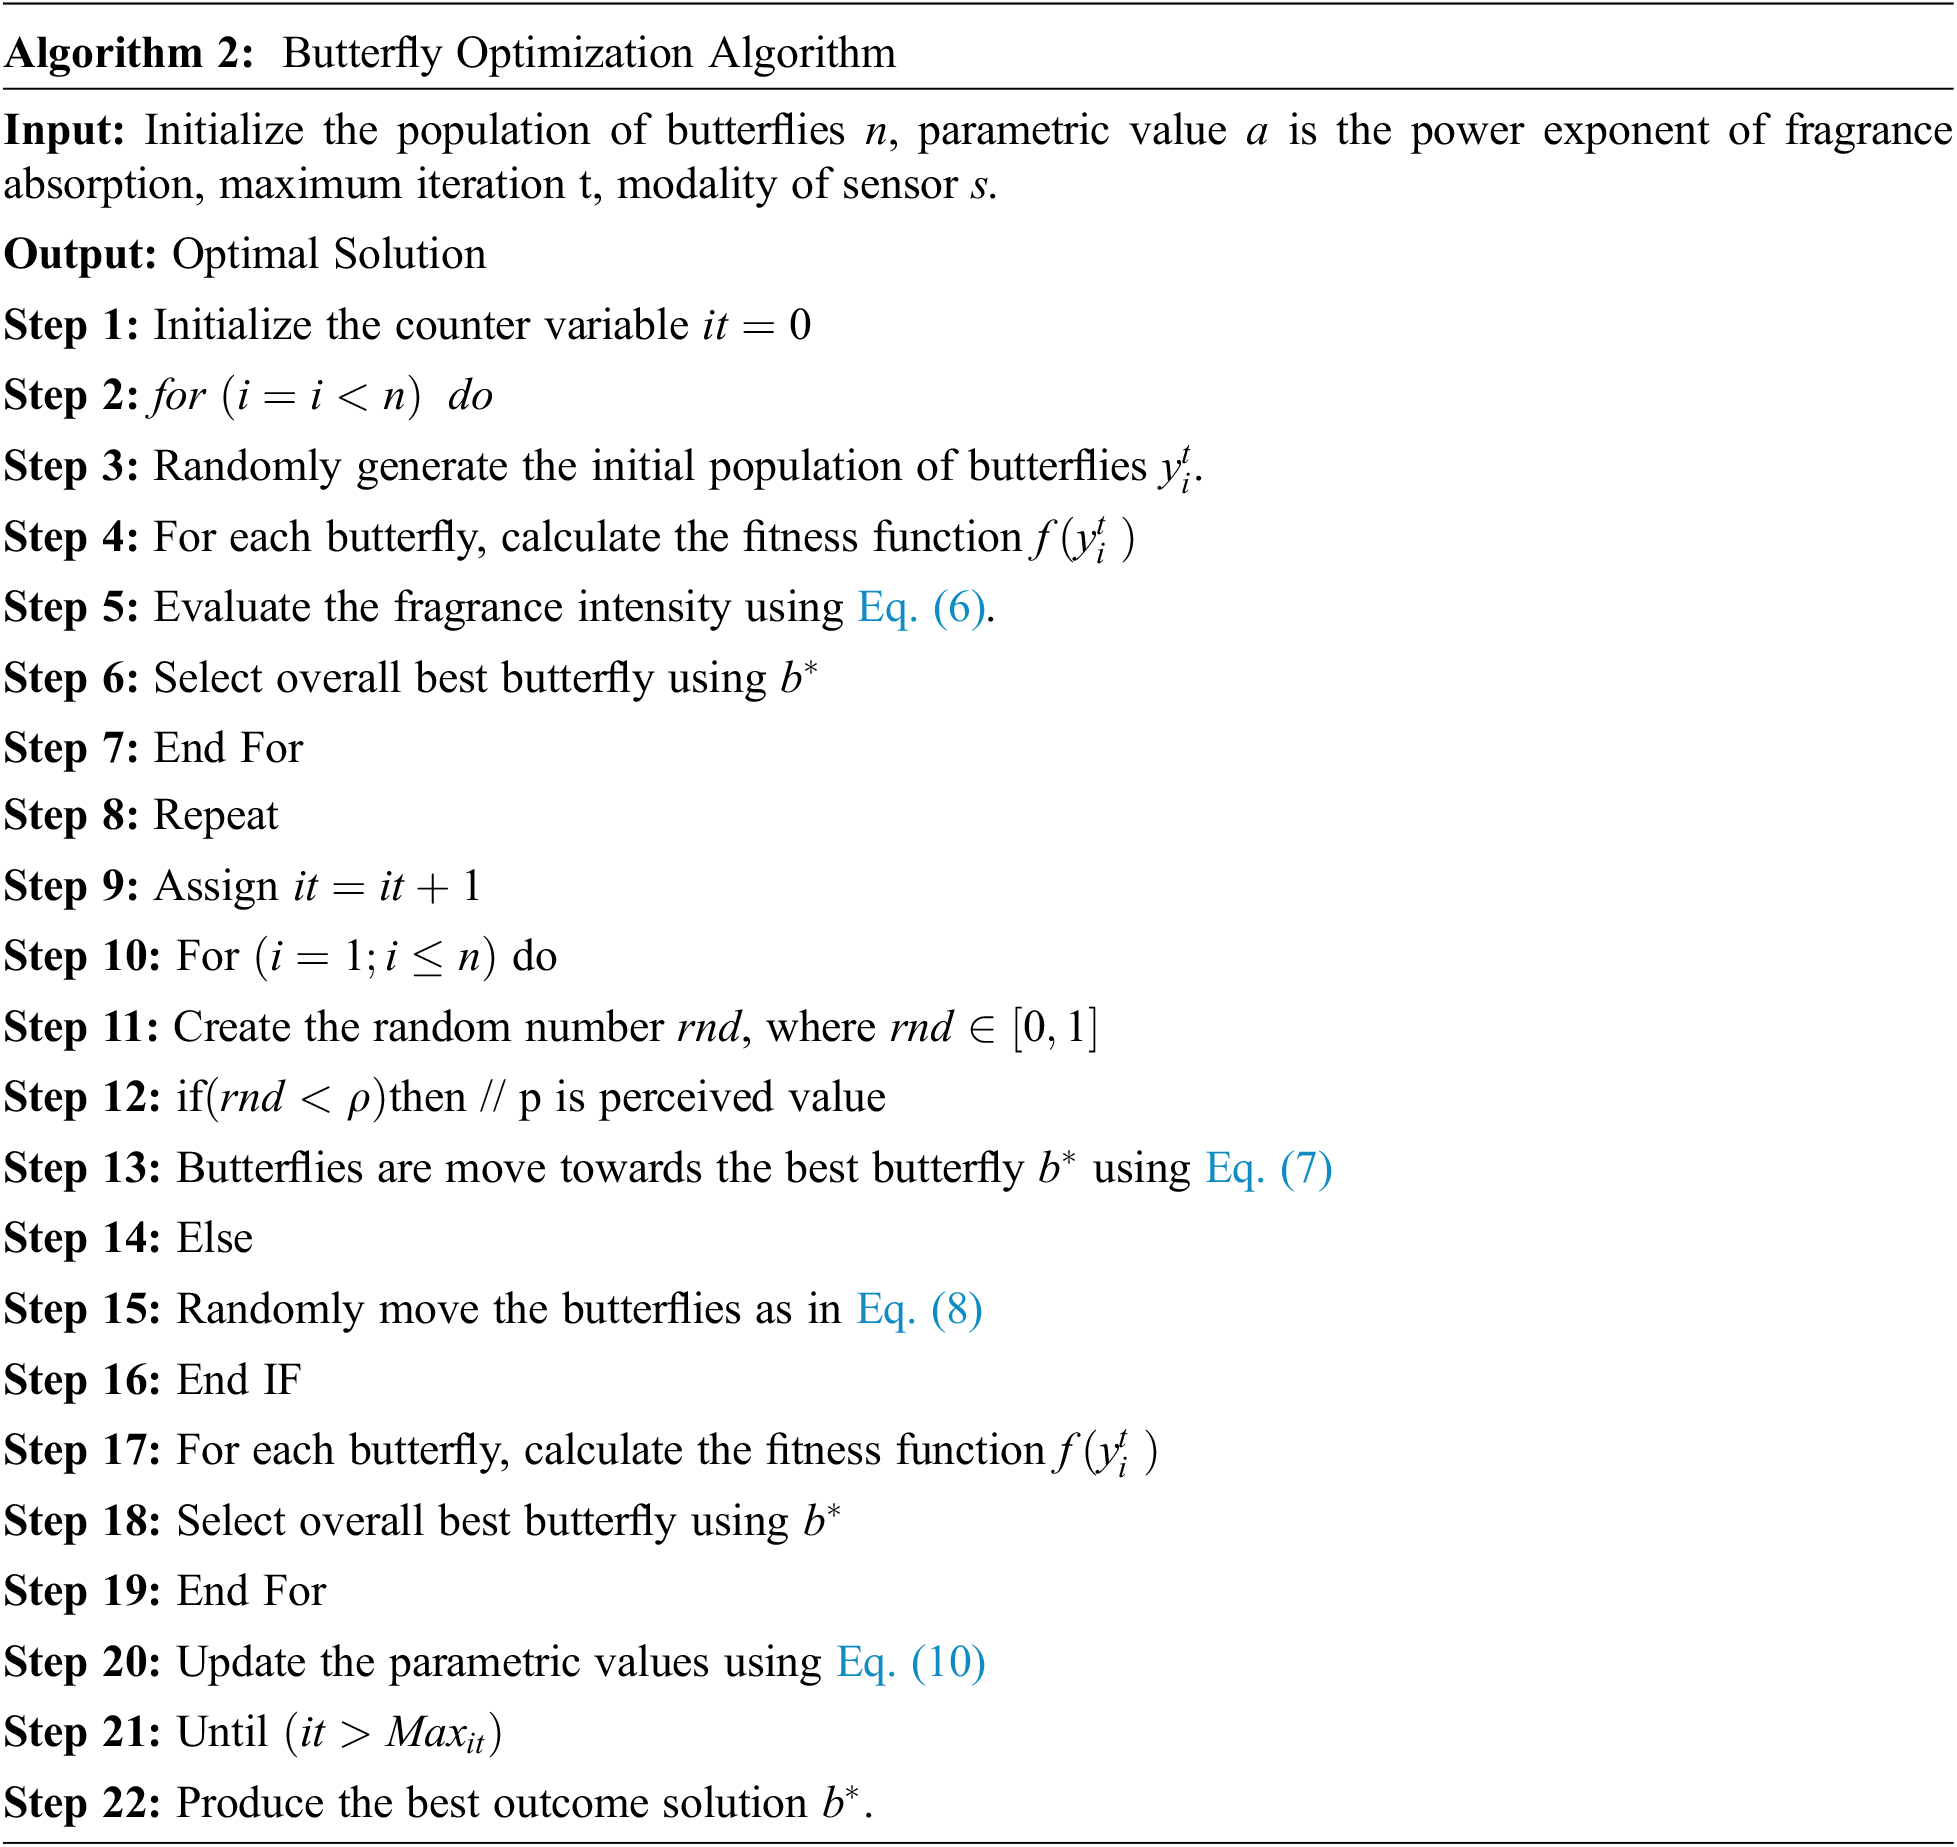
In the algorithm 2, parametric values are initialized and based on the intensity value of fragrance butterfly select the best solution.Fig. 3. shows that proposed feature selection algorithm based on fusion of differential evolution with butterfly optimization algorithm (DE-BOA).
In the Fig. 3 describes that, in the diagnosis of thyroid disease optimized fusion feature selection is implemented for higher in accuracy rate, minimizing the redundant features as well as irrelevant features in the data set.
3.3 Classification using Fuzzy C-Means Algorithm (FCM)
Classification plays a vital role for diagnosis the type of thyroid. In order to estimate higher accuracy rate in this paper C-Means algorithm is used to classify the normal, hypothyroid and hyperthyroid.FCM is an unsupervised learning algorithm.The purpose of FCM is reducing the dissimilarity elements and identify the cluster centroids. In a single data it provides two or more clusters. For every cluster it assigns the membership to each data point and each centroid value of cluster is based on distance between data point and cluster. If more data is belonging to or nearer to centre point of cluster is combined together to form a membership point. In each data point the summation of membership should be equal to one. The objective function is
Here, m is the real number greater than value 1, D is the total number of data,
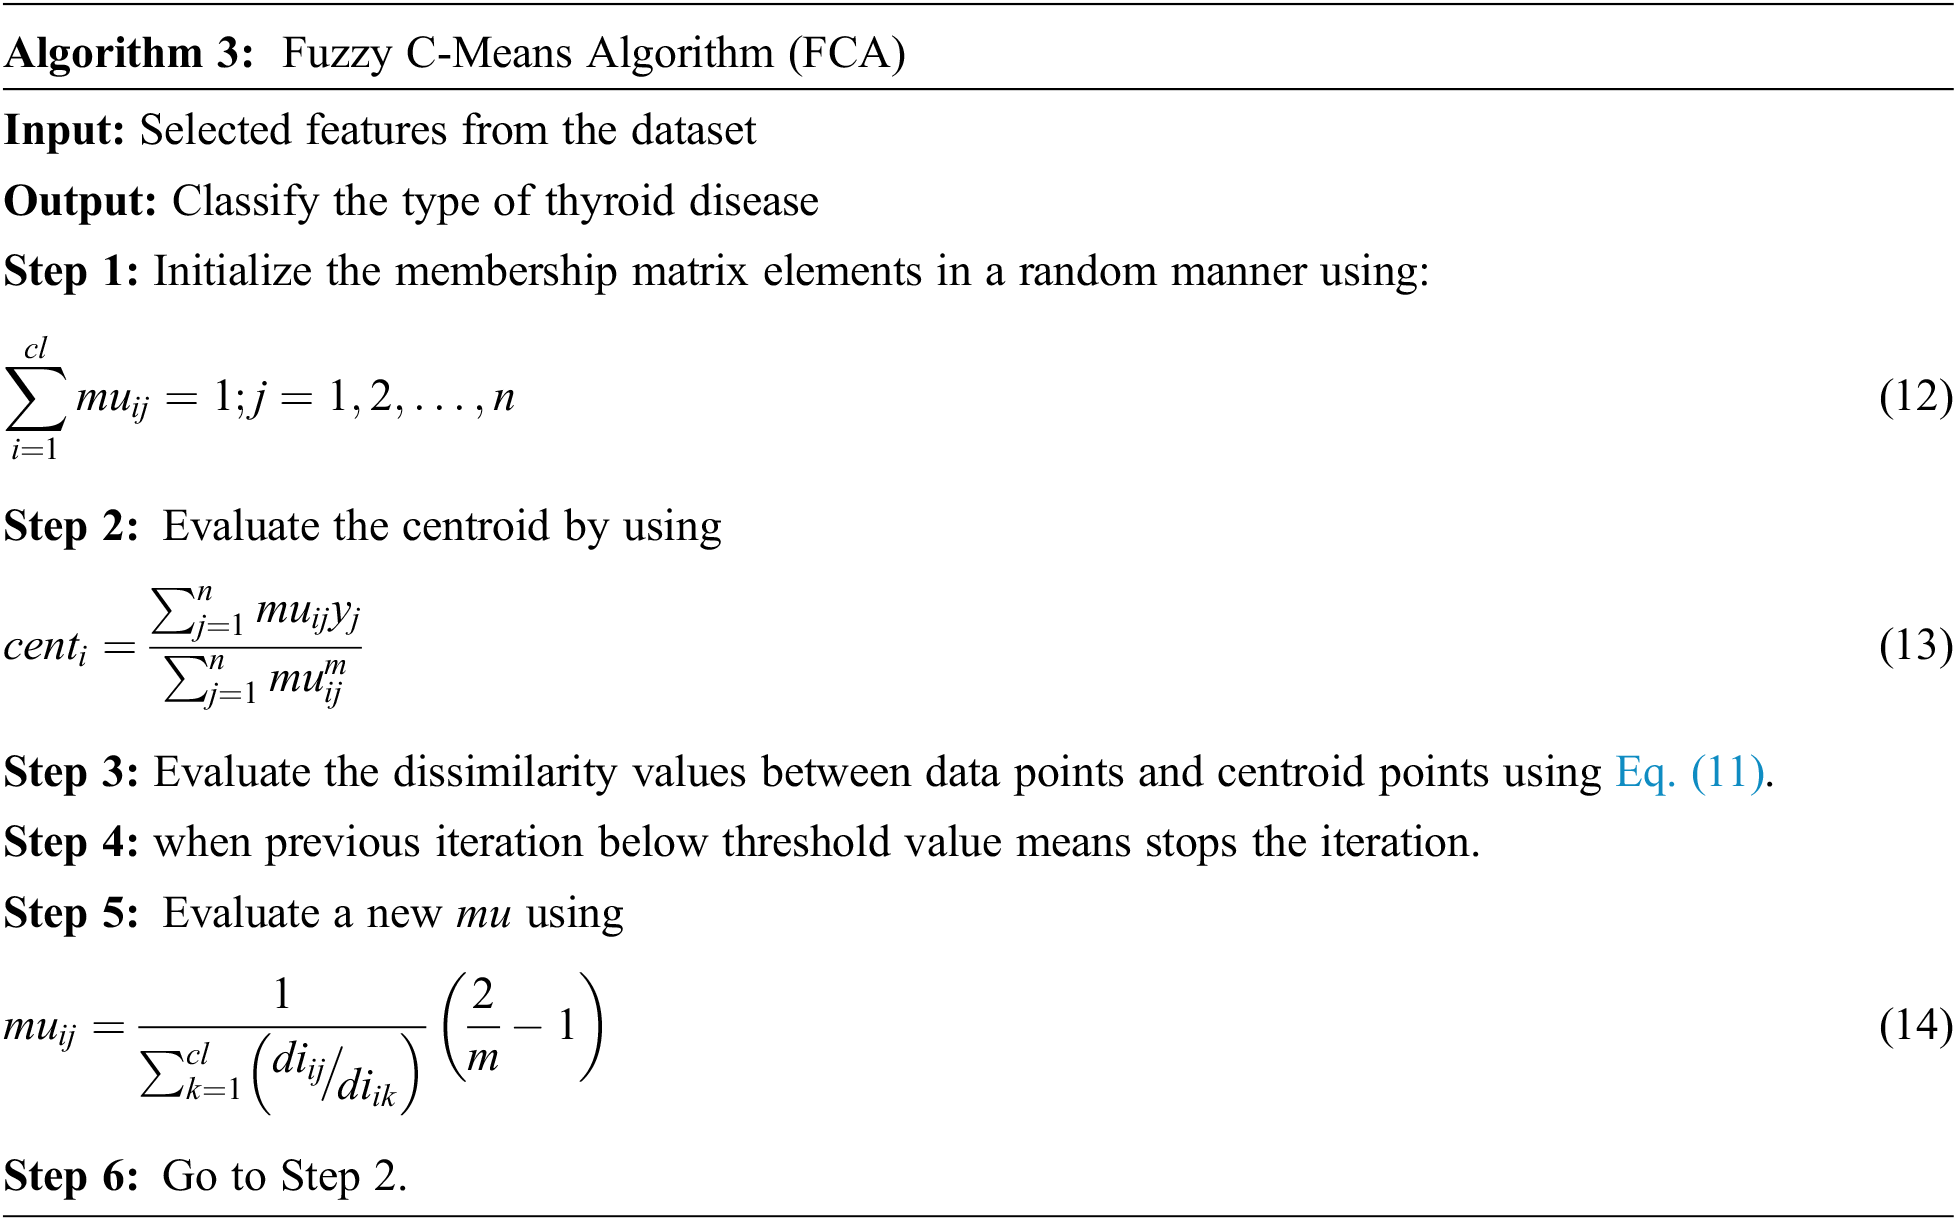
The algorithm 3, iteratively updating the Centroid of cluster and its membership values for each data point. Repeatedly it moves the centroids value of cluster to the exact location within the UCI repository data set.
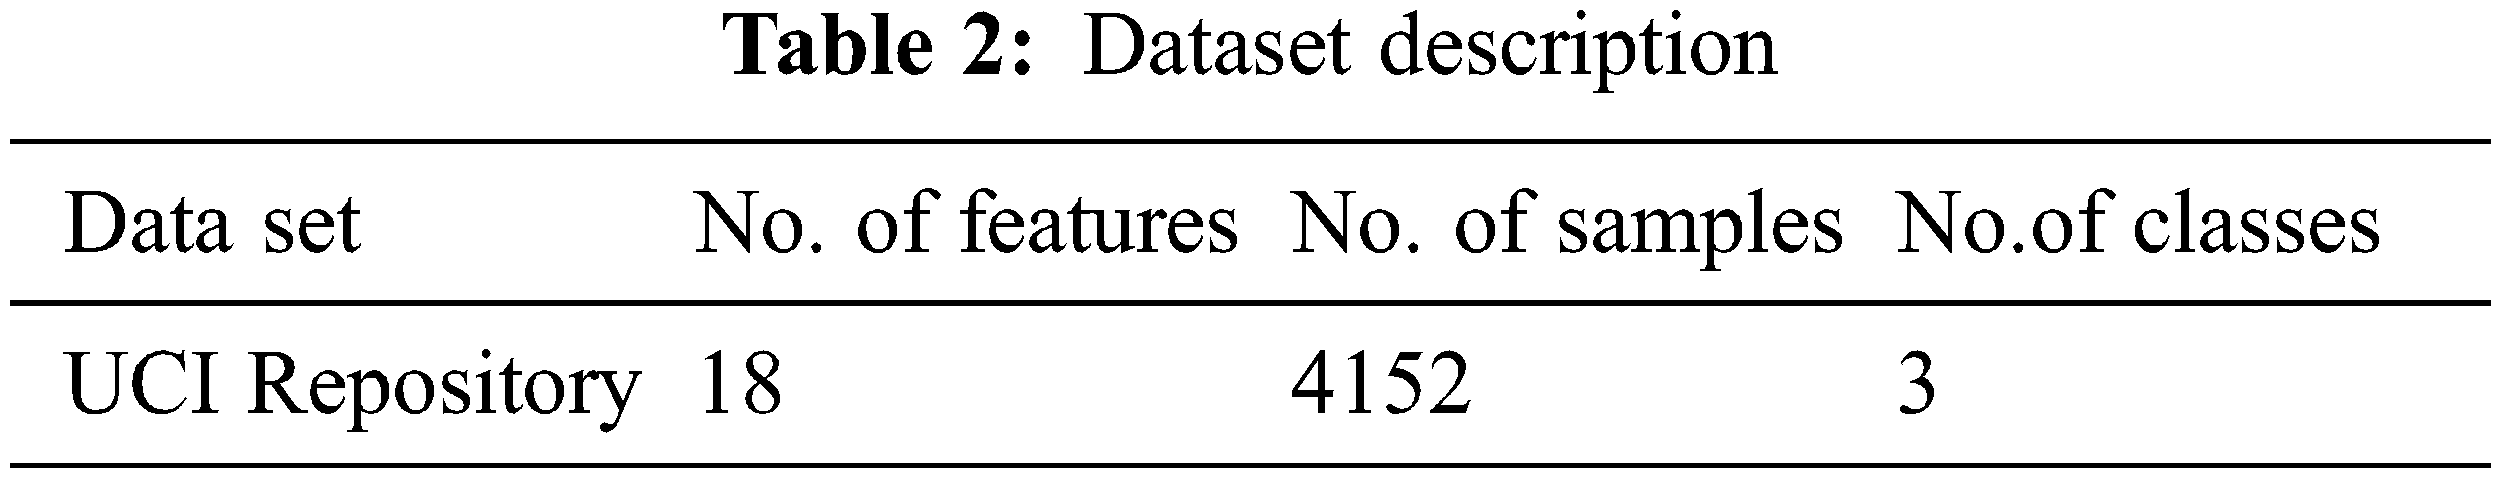
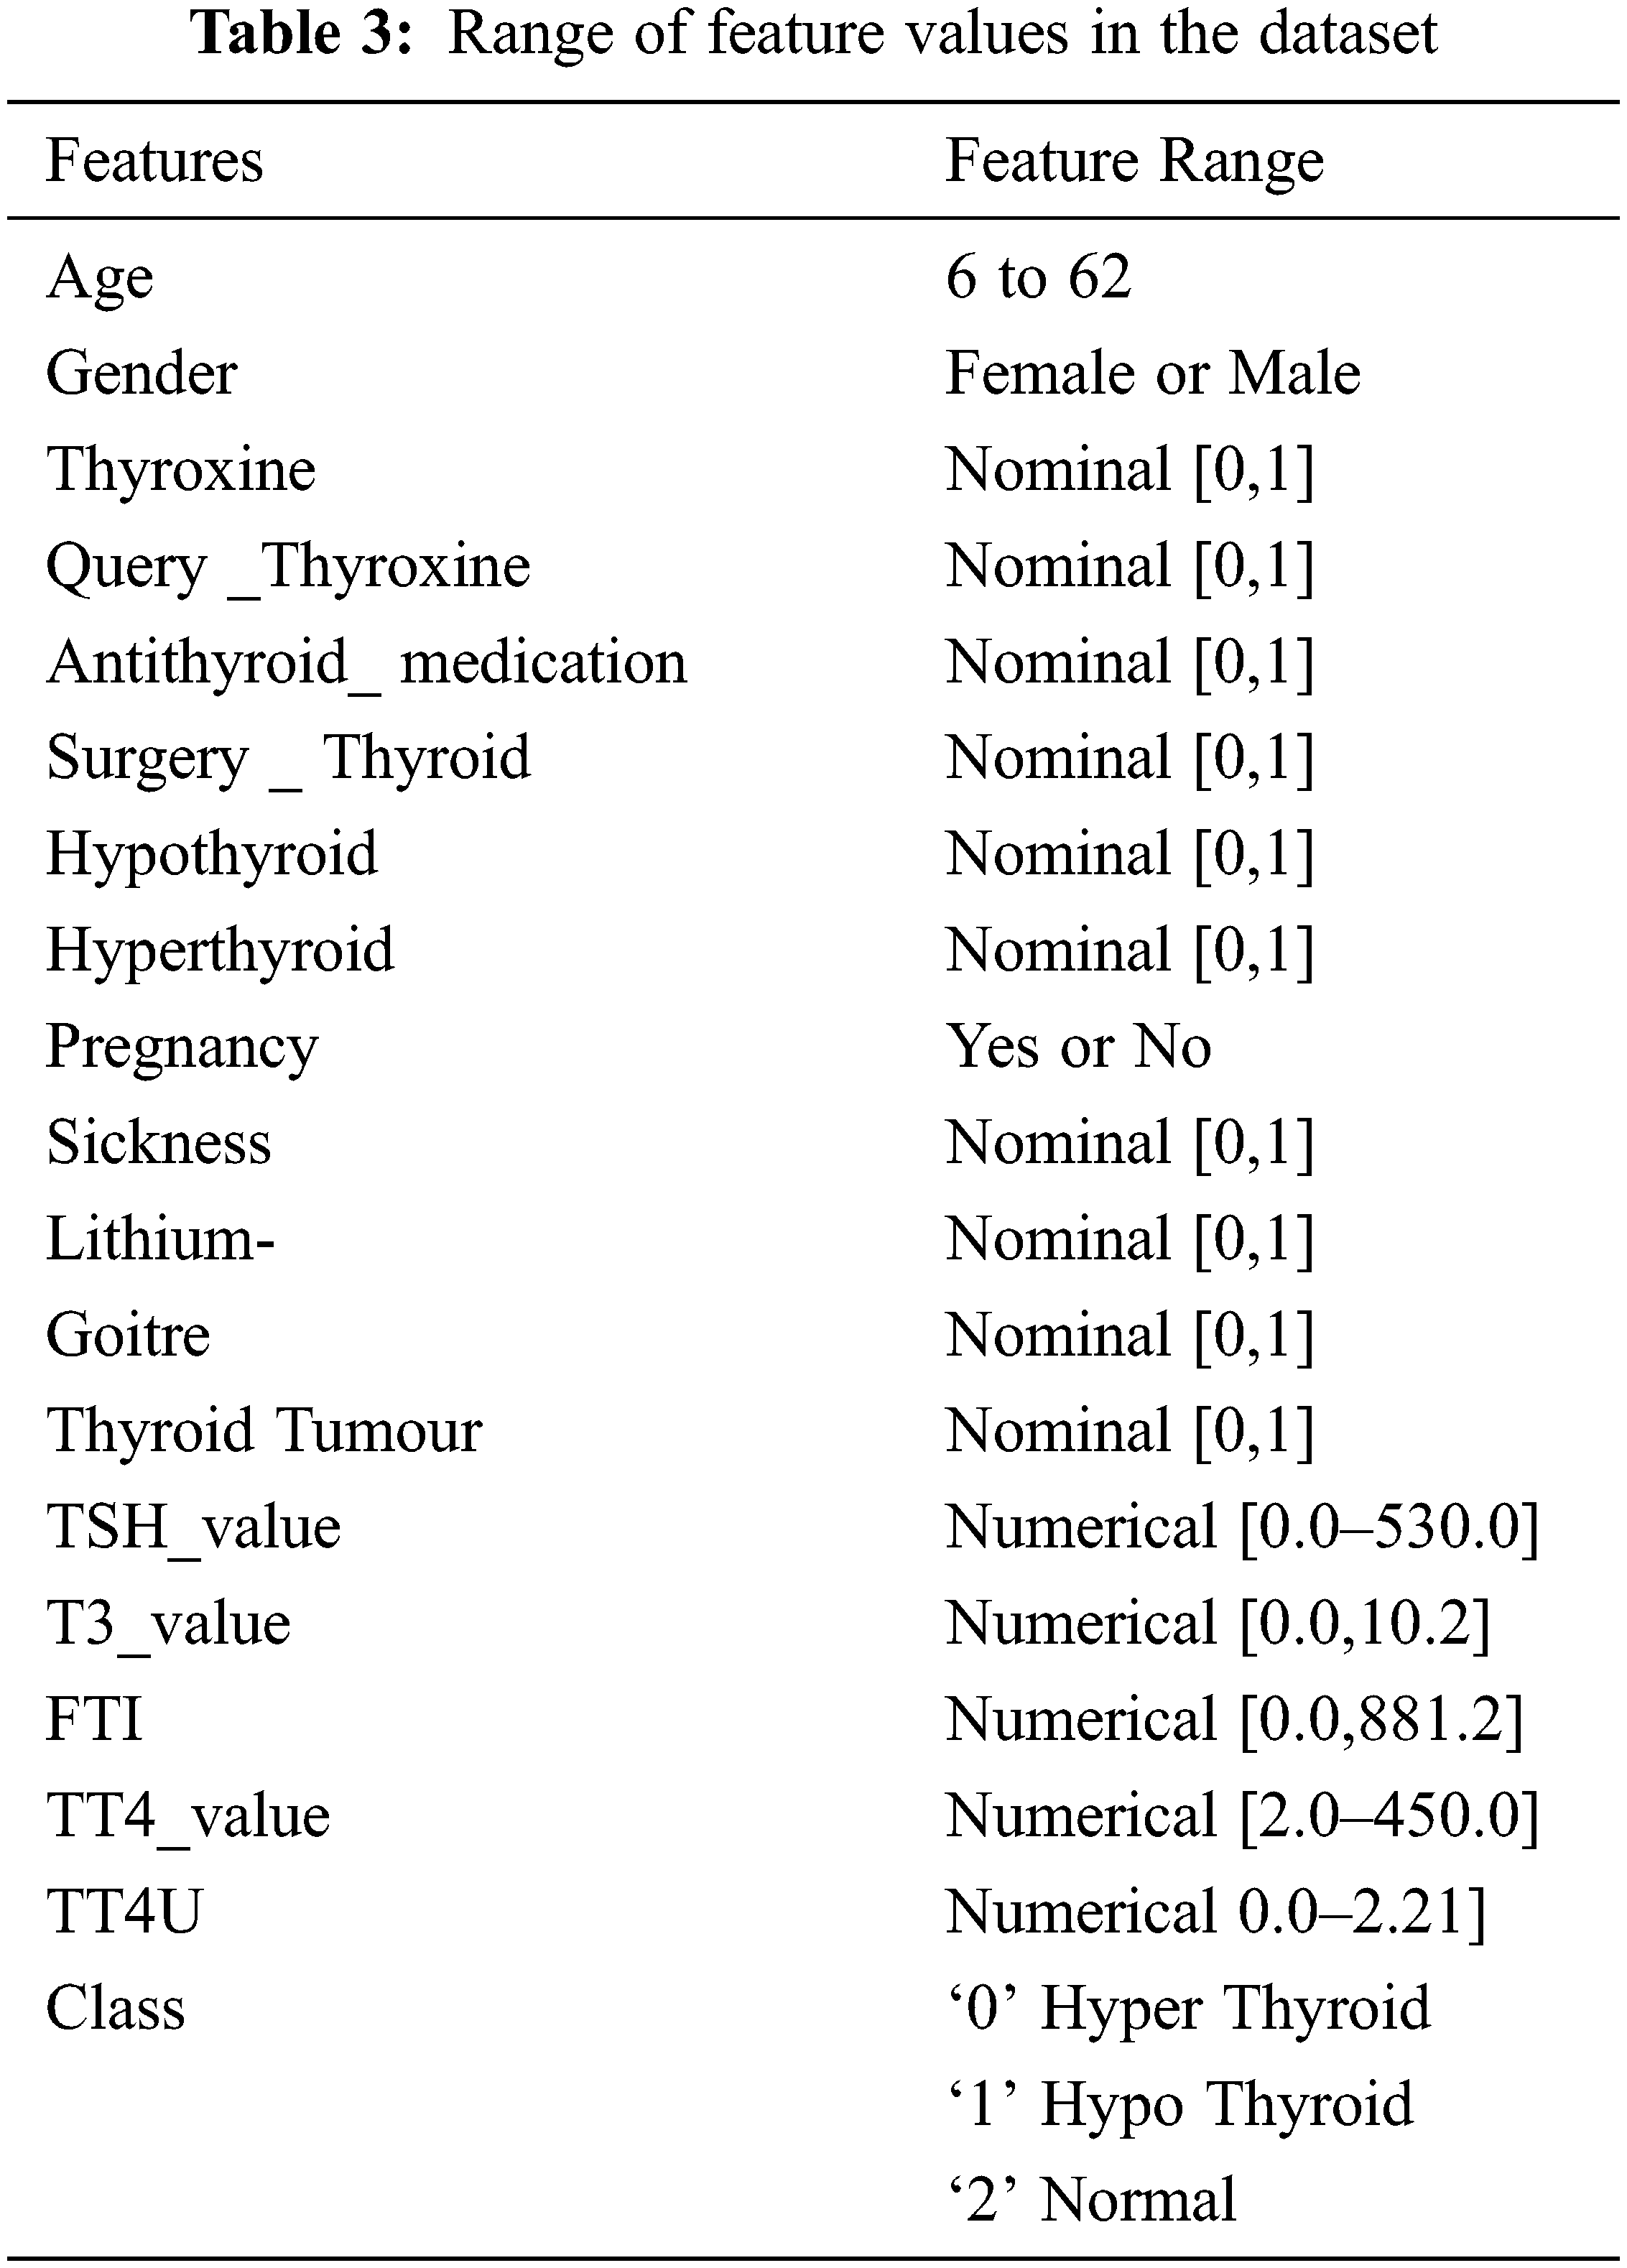
To implement the diagnosis of thyroid disease and classify the types of disease by using the UCI repository data set [22–34]. In this work, the operating system that has been used is Linux Ubuntu-18.04 with ApacheSpark-2.4.3. Python Language is used in the Spark platform. Differential evolution, butterfly optimization algorithm, fuzzy C-means algorithm is used in this work. Tab. 2. shows the dataset for thyroid disease, composed of 4152 instances, 18 features, and class. The thyroid dataset aims to predict whether the person is suffering from thyroid disease or not and which categorize of thyroid. Range of features values in the dataset are shown in Tab. 3.
The performance metric measures of proposed work is given below:
Accuracy
Accuracy (ACC) is used for the exact prediction of disease.
Precision
Recall
F-Measure harmonic mean of precision and recall
Mean Absolute Error (MAE)
Kappa Statistic
It is a measure of agreement between two categorical variables, A and B. The Kappa Statistic takes values between 0 and 1. The observed agreement variable between A and B is shown by
False Negative Rate
It is a ratio of positive result which produce the negative test result along with the test and provided the condition is present.
Negative Predictive Value (NPV)
NPV is the level of contributes to the negative test
Tab. 4 shows that features selected by the feature-selection algorithms with the execution time.
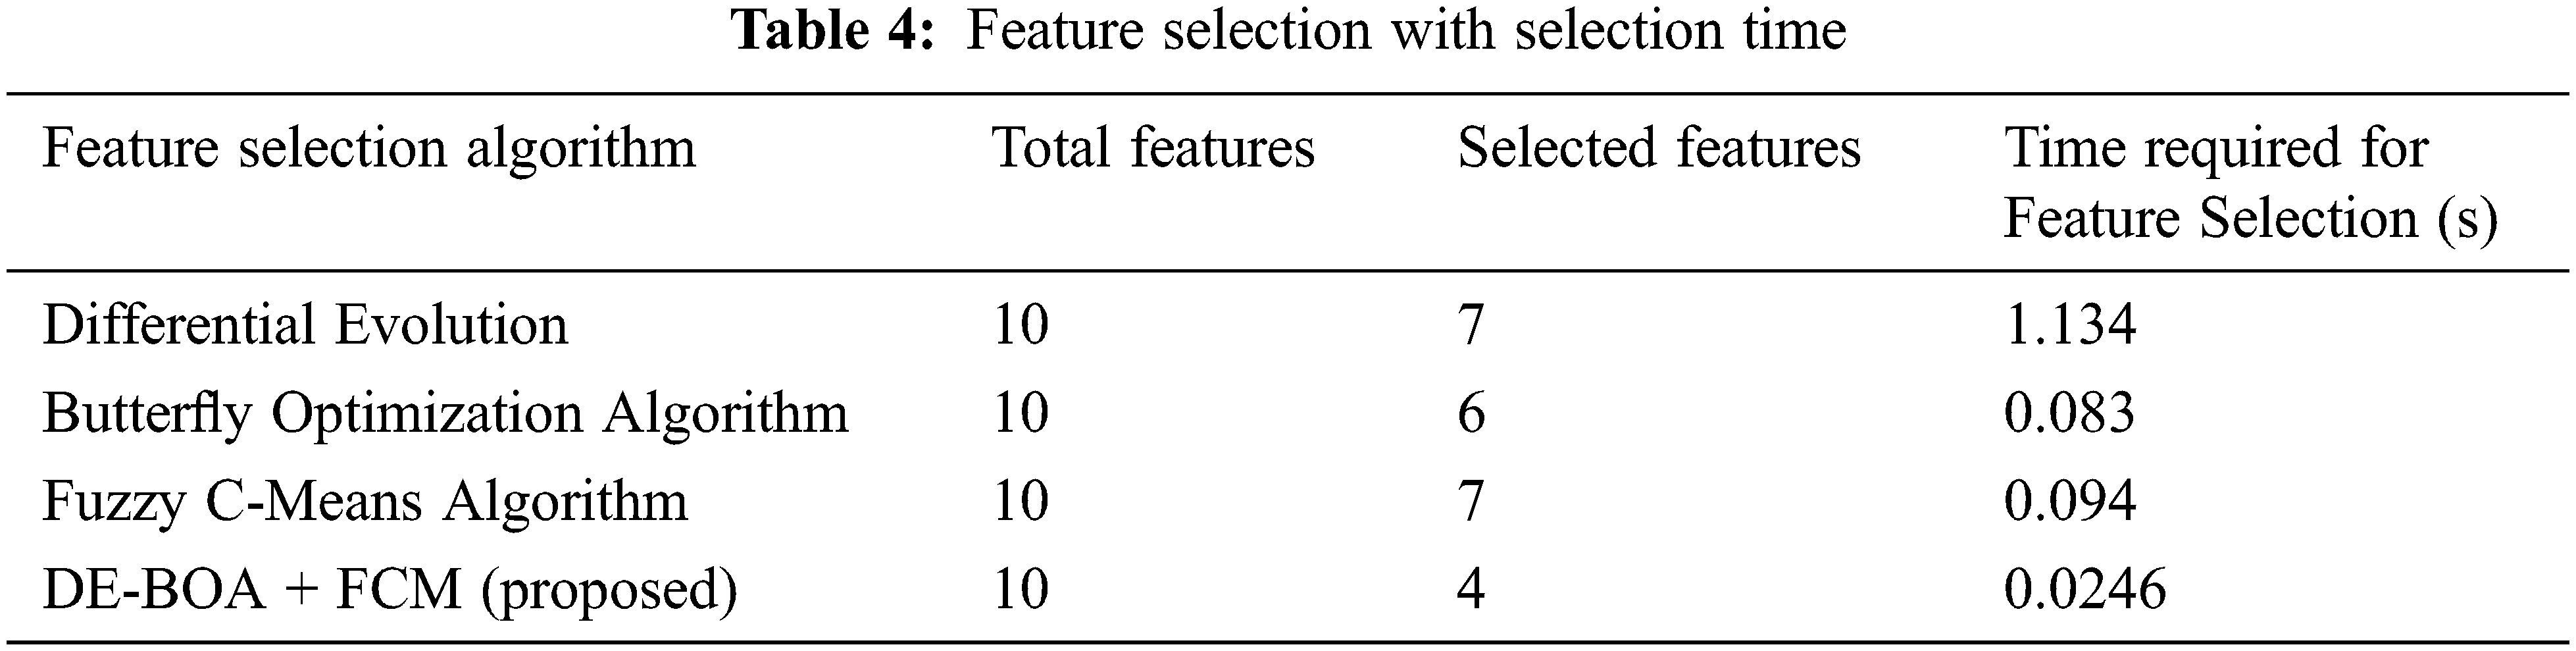
In the Tab. 4, relevant features are selected for the process of proposed work. In the observation of Tab. 4, proposed work requires minimum time for selecting the features in the data set. The selected features give more accurate result. Some prioritized features are T3,T4,TSH, pregnancy, blood pressure. Tab. 5 shows that performance metric measures of precision, recall, F1-Score and kappa statistic.
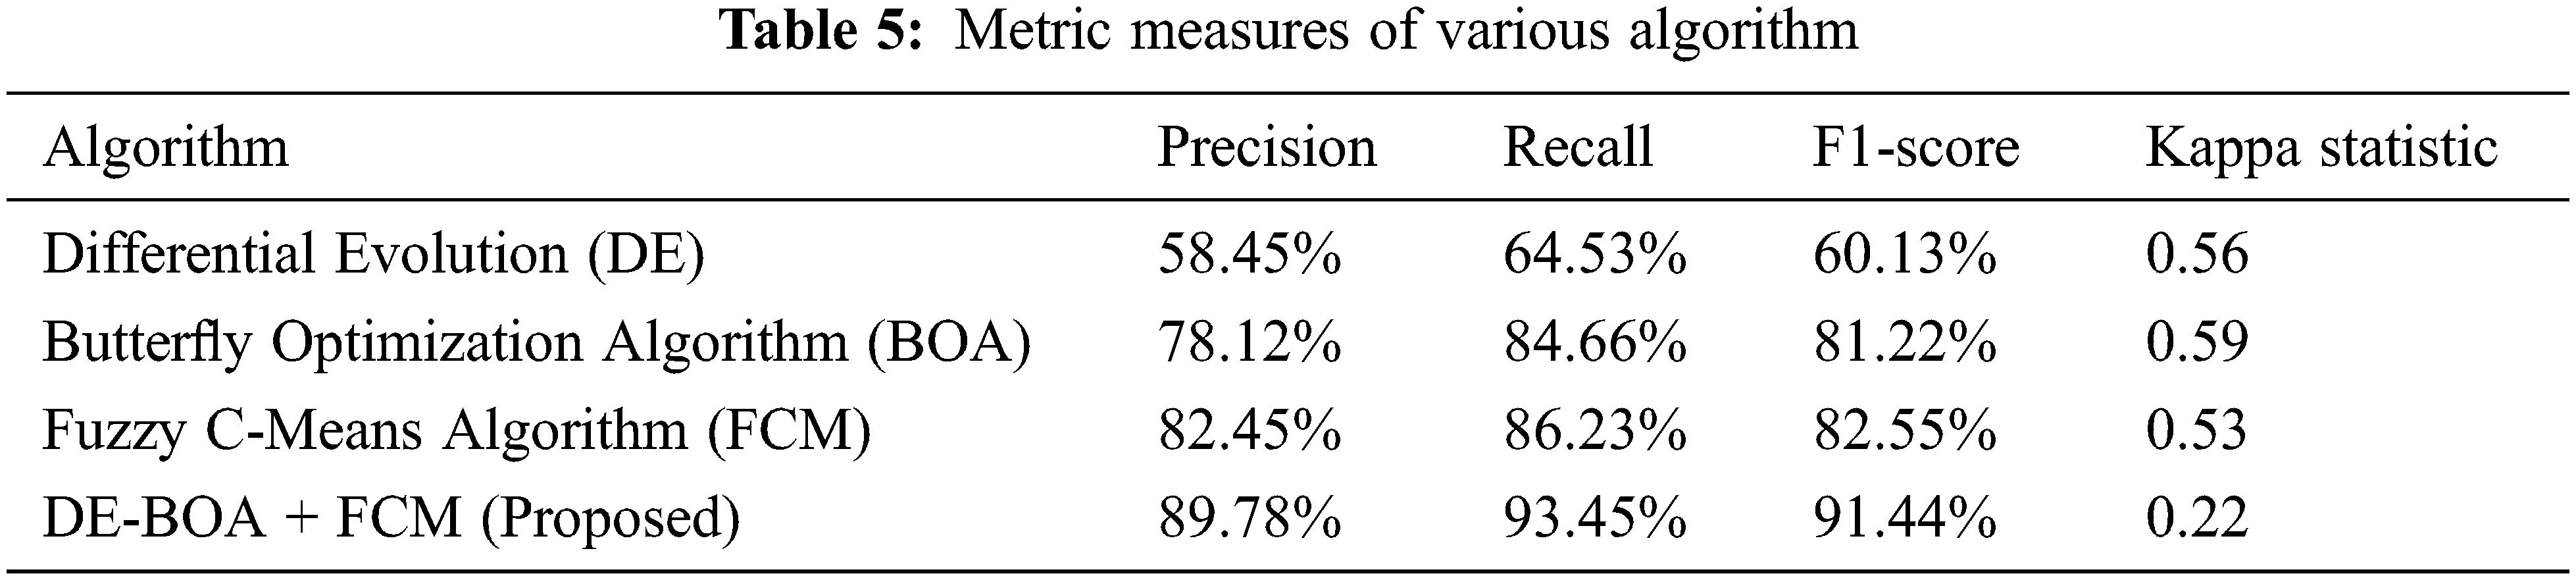
In the Tab. 5, shows that precision, recall, F1-Score values of proposed work DE-BOA+FCM produces 89.78%, 93.45% and 91.44%. The range of kappa statistics between 0 and 1. The proposed work got 0.22. The DE got precision of 58.45%, Recall of 64.53%, F1-Score of 60.13% and Kappa statistic of 0.56. The BOA got precision of 78.12%, Recall of 84.66%, F1-Score of 81.22% and Kappa statistic of 0.59. The FCM got precision of 82.45%, Recall of 86.23%, F1-Score of 82.55% and Kappa statistic of 0.53. Fig. 4 show that Mean absolute Error rate.
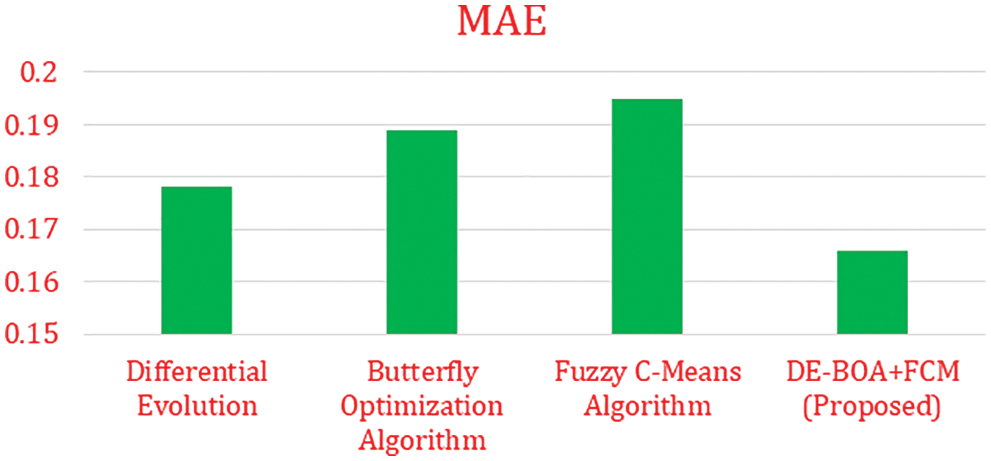
Figure 4: Mean absolute error
In the Fig. 4 show that error rate for various algorithms. our proposed work produces minimum error rate in the analysis of thyroid disease. Fig. 5 shows that computation time is required for the diagnosis of thyroid disease.
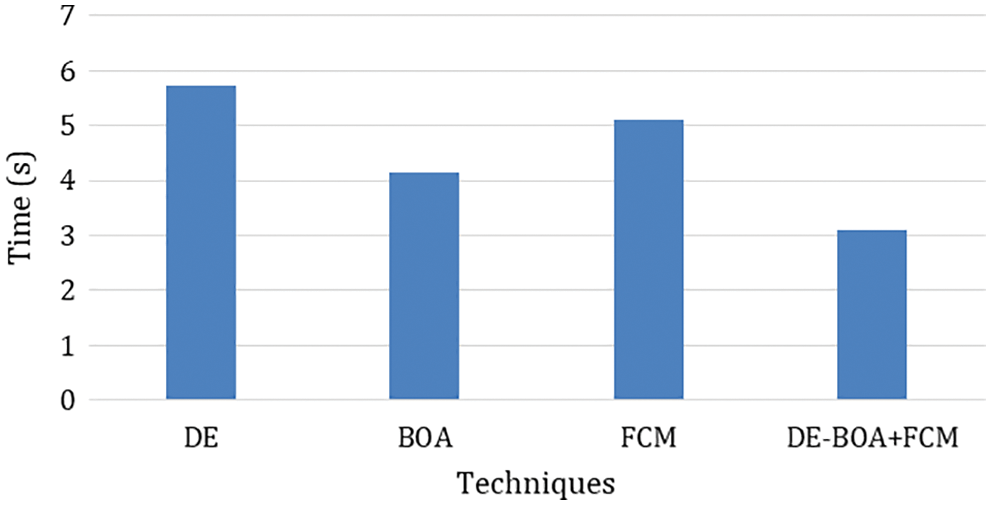
Figure 5: Computation time
In the observation of Fig. 5 the computation time required in the diagnosis of thyroid disease. Tab. 6 shows that metric measures of False negative Rate (FNR) and Negative Predictive Rate by using Eqs. (22).
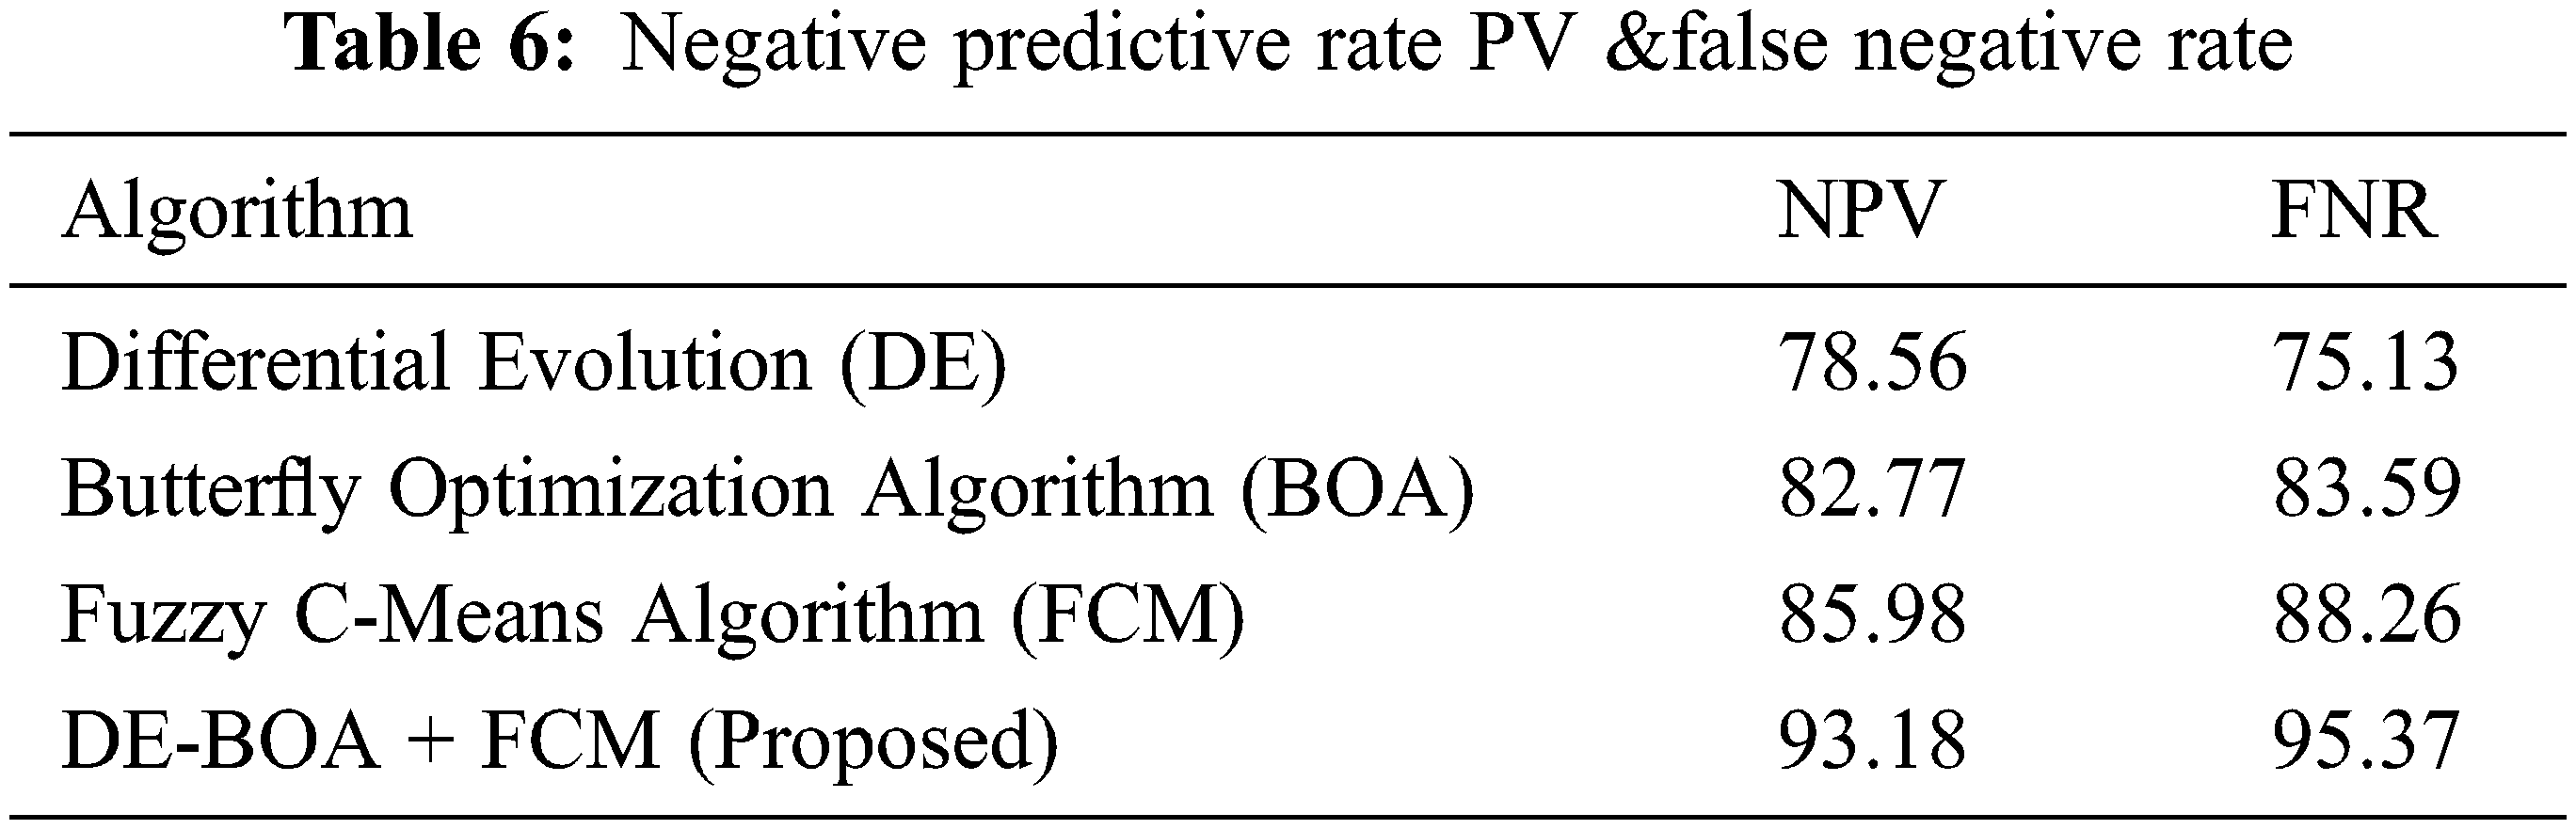
From the Tab. 6, observed that comparing of results of existing models with proposedDE-BOA+FCMmodel achieved better performance in the aspects of NPV and FNR rate of 93.18 and 95.37. The DE got NPV of 78.56 and FNR of 75.13. The BOA got NPV of 82.77 and FNR of 83.59. The FCM got NPV of 85.98 and FNR of 88.26. Fig. 6. shows that confusion matrix for various algorithm used in the classification of thyroid disease.
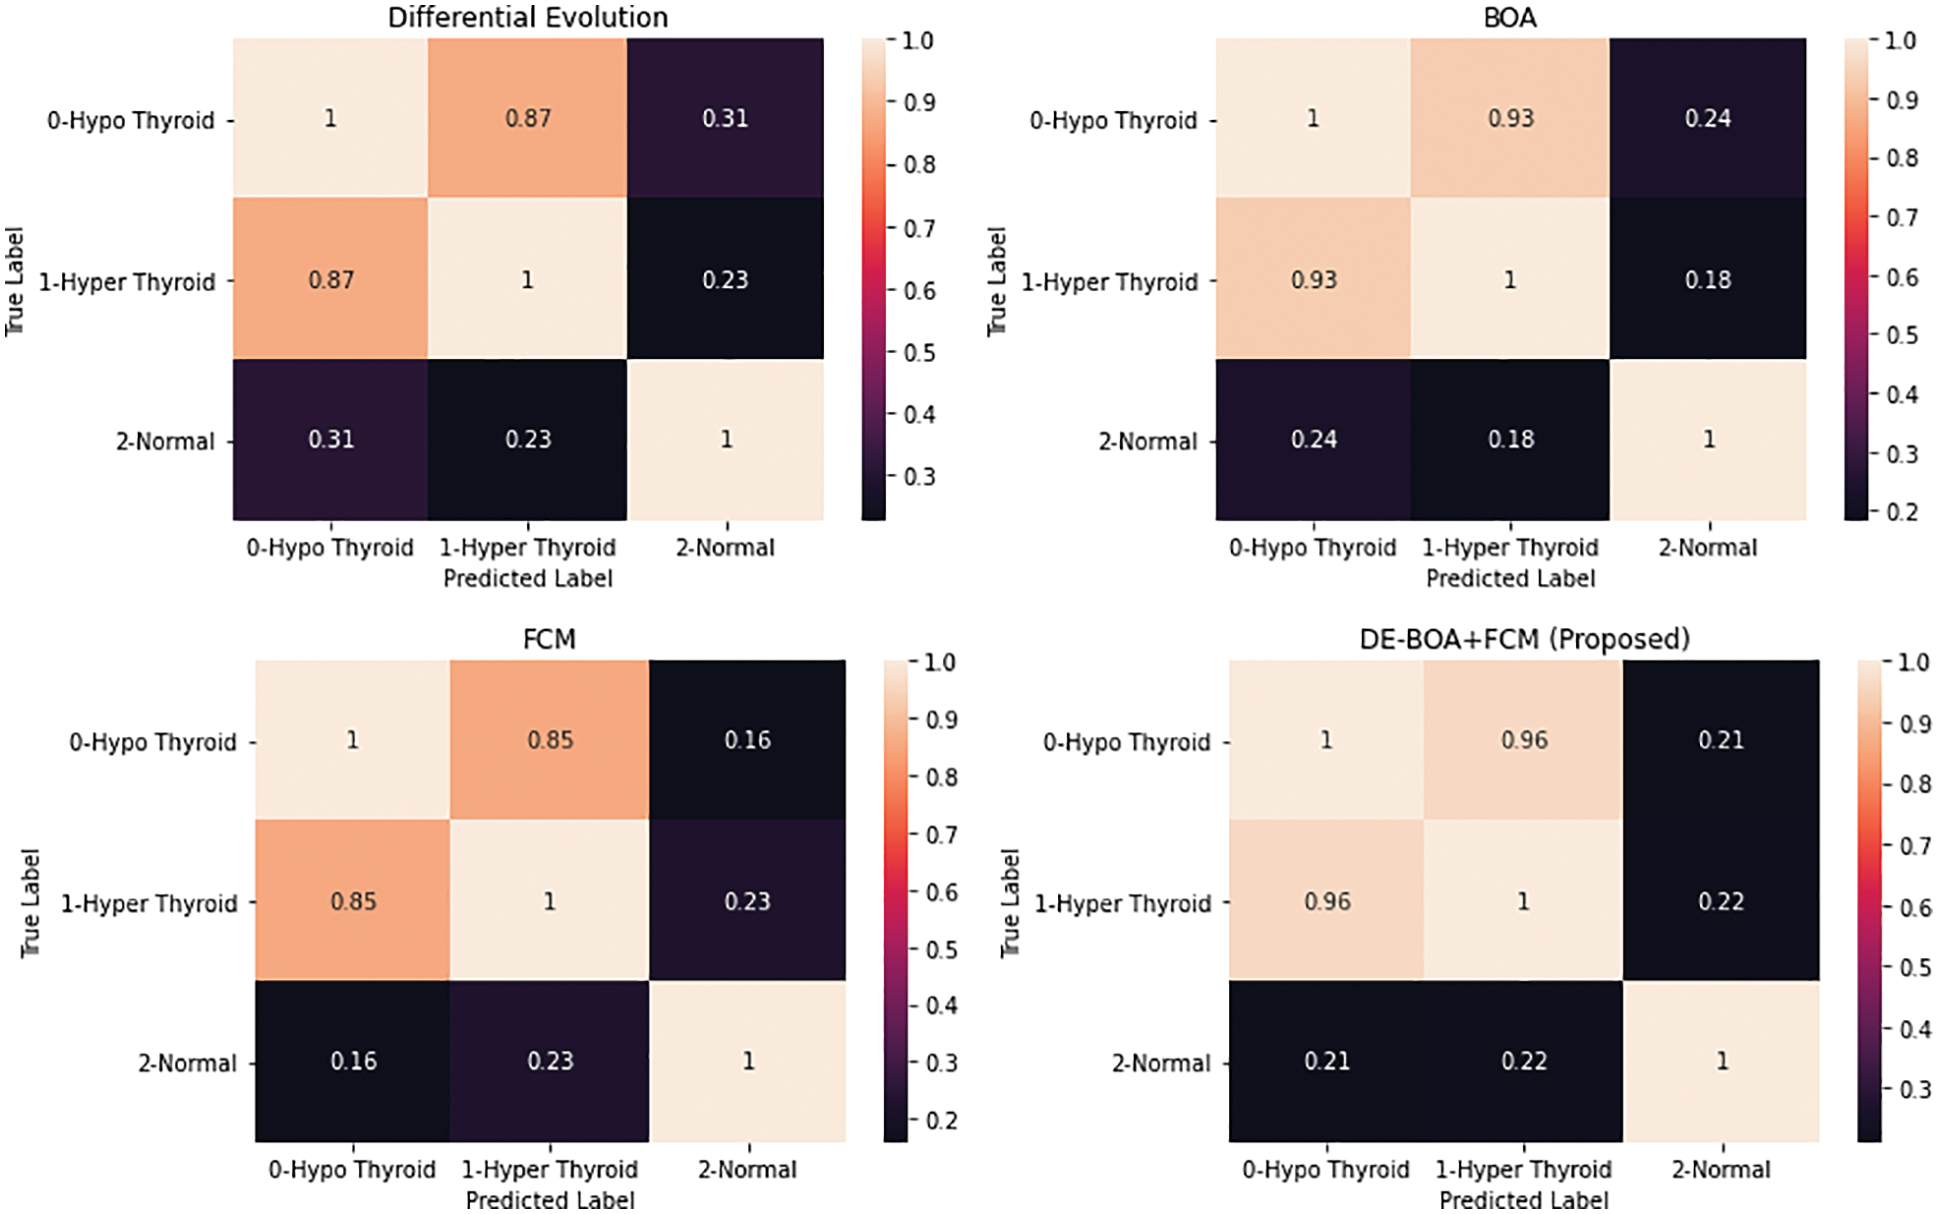
Figure 6: Confusion matrix of various algorithm
Fig. 6. represents the confusion matrices for the various algorithms like Differential Evolutionary algorithm, Butterfly optimization algorithm, Fuzzy C-Means algorithm and DEBOA + FCM proposed work. Fig. 7 shows that accuracy rate of various machine learning algorithms in the diagnosis of thyroid disease.
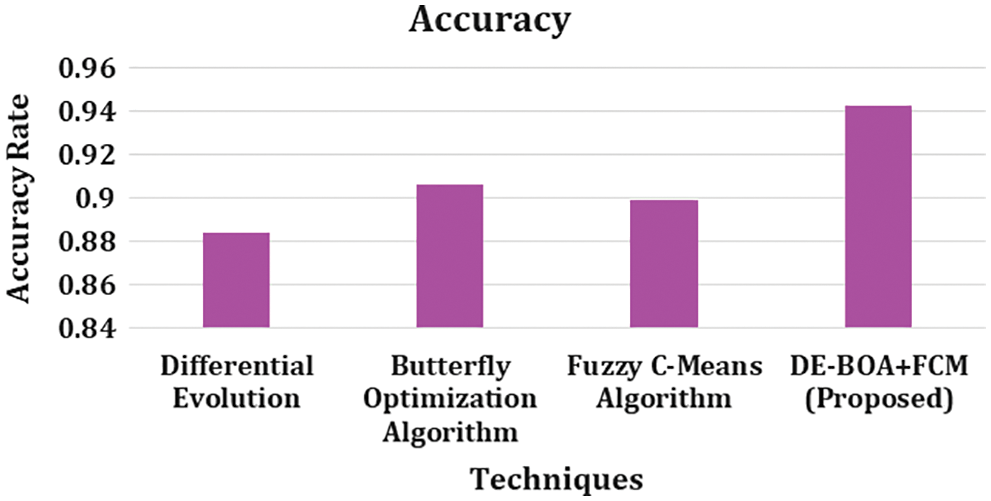
Figure 7: Accuracy rate
In the observation of Fig. 7. describes that, accuracy rate for differential evolutionary algorithm got 0.884, Butterfly optimization algorithm got 0.906, Fuzzy C-Means algorithm got 0.899 and DEBOA + FCM proposed work 0.943. In overall metric measures of precision, recall, accuracy, F1-score, Kappa statistics our proposed work produces better result.
The early prediction and diagnosis of disease are highly necessity for human being to survive in the world. Using machine learning algorithms, accurate recognition and prediction of disease have become more important. The necessary of pre-processing were implemented before feature selection processing is done. In this work, dimensionality reduction of feature selection is based on differential evolutionary algorithm with butterfly optimization algorithm is used. For the classification of thyroid disease by using fuzzy C-means algorithm is implemented. The performance of proposed work DEBOA + FCM is evaluated through metric measures of accuracy, precision, recall, f1-score, error rate and confusion matrix. Accuracy rate for Differential Evolutionary algorithm got 0.884, Butterfly optimization algorithm got 0.906, Fuzzy C-Means algorithm got 0.899 and DEBOA + FCM proposed work 0.943. As a future work, this diagnosis of thyroid detection model uses ensembled based implementation fusion technique of neuro-fuzzy inference system in the classification of thyroid disease.
Acknowledgement: Authors would like to thank for the support of Taif University Researchers Supporting Project number (TURSP-2020/211), Taif University, Taif, Saudi Arabia.
Funding Statement: Taif University Researchers are supporting project number (TURSP-2020/211), Taif University, Taif, Saudi Arabia.
Conflicts of Interest: The authors declare that there is no conflict of interests regarding the publication of the paper.
References
1. M. Ramya and P. V. S. Kumar, “Prediction and providing medication for thyroid disease using machine learningtechnique (SVM),” Turkish Journal of Computer and Mathematics Education, vol. 11, no. 3, pp. 1099–1107, 2020. [Google Scholar]
2. S. S. Islam, M. D. S. Haque, M. S. Miah, T. B. Sarwar and R. Nugraha, “Sarwar and R.Nugraha, Application of machine learning algorithms to predict the thyroid diseaserisk: An experimental comparative study,” PeerJ Computer Science, vol. 3, no. 3, pp. 1–13, 2022. [Google Scholar]
3. G. Pushpanathan, S. Gowthami and U. A. Kumar, “Comparative analysis of thyroid disease based on hormone level using data mining techniques,” International Journal of Engineering Research & Technology, vol. 12, no. 10, pp. 0181–2278, 2020. [Google Scholar]
4. P. N. Taylor, D. Albrecht, A. Scholz, G. G. Buey, J. H. J.H.Lazarus et al., “Global epidemiology of hyperthyroidism and hypothyroidism,” Nature Reviews Endocrinology, vol. 14, no. 5, pp. 301–316, 2018. [Google Scholar]
5. S. Umadevi and K. S. JeenMarseline, “Applying classification algorithms to predict thyroid disease,” International Journal of Engineering Science, vol. 7, no. 10, pp. 15118–15120, 2017. [Google Scholar]
6. R. A. Smith, V. Cokkinides and H. J. Eyre, “American cancer society guidelines for the early detection of cancer,” Cancer Journal for Clinicians, vol. 53, no. 1, pp. 27–43, 2003. [Google Scholar]
7. S. Borzouei, H. Mahjub, N. Sajadi and M. Farhadian, “Diagnosing thyroid disorders: Comparison of logistic regressionand neural network models,” Journal of Family Medicine and Primary Care, vol. 9, no. 6, pp. 1–14, 2020. [Google Scholar]
8. M. T. Raghuraman, E. Sailatha and S. Gunasekaran, “Efficient thyroid disease prediction and comparative study using machine learning algorithms,” International Journal Of Information And Computing Science, vol. 6, no. 6, pp. 1–15, 2019. [Google Scholar]
9. A. Tyagi, R. Mehra and A. Saxena, “Interactive thyroid disease prediction system using machine learning technique,” in Proc. 2018 Fifth Int. Conf. on Parallel, Distributed and Grid Computing (PDGC), Waknaghat, India, pp. 689–693, 2018. [Google Scholar]
10. T. Akhtar, S. Omer Gilani, Z. Mushtaq, S. Arif, M. Jamil et al., “Effective voting ensemble of homogenous ensembling with multiple attribute selection approaches for improved identification of thyroid disorder,” Electronics, vol. 10, no. 2, pp. 1–17, 2021. [Google Scholar]
11. N. Singh and A. Jindal, “Segmentation method and comparison of classification methods for thyroid ultrasound images,” International Journal ofComputer Application, vol. 50, no. 5, pp. 43–49, 2012. [Google Scholar]
12. R. Erol, S. N. Oğulata, C. Şahinand and Z. N. Alparslan, “A radial basis function neural network (RBFNN) approach for structural classification of thyroid diseases,” Journal of Medical Systems, vol. 32, no. 3, pp. 215–220, 2008. [Google Scholar]
13. L. Aversano, M. L. Bernardi, M. Cimitile, M. Iammarino and P. E. Macchia, “Thyroid disease treatment prediction with machine learning approaches,” Procedia Computer Science, vol. 192, no. 3, pp. 1031–1040, 2021. [Google Scholar]
14. V. D. Leitch, J. D. Bassett and G. R. Williams, “Role of thyroid hormones in craniofacial development,” Nature Reviews Endocrinology, vol. 16, no. 3, pp. 147–164, 2020. [Google Scholar]
15. K. Paczkowska, A. Otlewska, O. Loska, K. Kola£kov, M. Bolanowski et al., “Laboratory interference in the thyroid function test,” Endokrynologia Polska, vol. 71, no. 6, pp. 551–560, 2020. [Google Scholar]
16. S. Razia, P. S. Kumar and A. S. Rao, “Machine learning techniques for thyroid disease diagnosis: A systematic review. modern approaches in machine learning and cognitivescience,” PeerJ Computer Science, vol. 8, pp. 203–212, 2020. [Google Scholar]
17. V. Talasila, K. Madhubabu, K. Madhubabu, M. Mahadasyam and N. Atchala, “The prediction of diseases using rough set theory with recurrent neural network in big data analytics,” International Journal of Intelligent Engineering and Systems, vol. 13, no. 5, pp. 10–18, 2020. [Google Scholar]
18. S. Tangirala, “Evaluating the impact of GINI index and information gain on classification using decision tree classifier algorithm,” International Journal of Advanced Computer Science and Applications, vol. 11, no. 3, pp. 612–619, 2020. [Google Scholar]
19. S. Rasheeduddin and K. Rajasekhar, “Extreme learning machine for thyroid nodule classification with graph cluster ant colony optimization basedfeature selection,” International Journal of Recent Technology and Engineering, vol. 8, no. 2, pp. 2277–3878, 2019. [Google Scholar]
20. S. Arora and S. Singh, “Butterfly optimization algorithm: A novel approach for global optimization,” Soft Computing, vol. 23, no. 3, pp. 715–734, 2019. [Google Scholar]
21. K. Geetha, S. Capt and S. Baboo, “An empirical model for thyroid disease classification using evolutionary multivariate bayseianprediction method,” Journal of Computer Science and Technology, vol. 16, no. 1, pp. 975–985, 2016. [Google Scholar]
22. M. Kirubha, R. Prinitha, P. Preethika and A. Samyuktha, “Analysis of thyroid disease using K means and fuzzy C means algorithm,” International Journal of Computer Science and Engineering, vol. 6, no. 10, pp. 1–12, 2019. [Google Scholar]
23. M. Masud, G. S. Gaba, K. Choudhary, M. Hossain, M. F. Alhamid et al., “Lightweight and anonymity-preserving user authentication scheme for IoT-based healthcare,” IEEE Internet of Things Journal, vol. 2, no. 4, pp. 1–14, 2021. [Google Scholar]
24. M. Abouhawwash and K. Deb, “Karush-kuhn-tucker proximity measure for multi-objective optimization based on numerical gradients,” in Proc. of the 2016 on Genetic and Evolutionary Computation Conf. Companion, ACM, Denver Colorado USA, pp. 525–532, 2016. [Google Scholar]
25. A. H. El-Bassiouny, M. Abouhawwash and H. S. Shahen, “New generalized extreme value distribution and its bivariate extension,” International Journal of Computer Applications, vol. 173, no. 3, pp. 1–10, 2017. [Google Scholar]
26. A. H. El-Bassiouny, M. Abouhawwash and H. S. Shahen, “Inverted exponentiated gamma and its bivariate extension,” International Journal of Computer Application, vol. 3, no. 8, pp. 13–39, 2018. [Google Scholar]
27. A. H. El-Bassiouny, H. S. Shahen and M. Abouhawwash, “A new bivariate modified weibull distribution and its extended distribution,” Journal of Statistics Applications & Probability, vol. 7, no. 2, pp. 217–231, 2018. [Google Scholar]
28. M. Abouhawwash and M. A. Jameel, “KKT proximity measure versus augmented achievement scalarization function,” International Journal of Computer Applications, vol. 182, no. 24, pp. 1–7, 2018. [Google Scholar]
29. H. S. Shahen, A. H. El-Bassiouny and M. Abouhawwash, “Bivariate exponentiated modified weibull distribution,” Journal of Statistics Applications & Probability, vol. 8, no. 1, pp. 27–39, 2019. [Google Scholar]
30. M. Abouhawwash and M. A. Jameel, “Evolutionary multi-objective optimization using benson’skarush-kuhn-tucker proximity measure,” in Proc. Int. Conf. on Evolutionary Multi Criterion Optimization, East Lansing, Michigan, USA, Springer, pp. 27–38, 2019. [Google Scholar]
31. M. Abouhawwash, M. A. Jameel and K. Deb, “A smooth proximity measure for optimality in multi-objective optimization using benson’s method,” Computers \\& Operations Research, vol. 117, no. 2, pp. 104900, 2020. [Google Scholar]
32. M. Abouhawwash, K. Deb and A. Alessio, “Exploration of multi-objective optimization with genetic algorithms for PET image reconstruction,” Journal of Nuclear Medicine, vol. 61, no. 1, pp. 572, 2020. [Google Scholar]
33. S. Ibrahim, H. Alhumyani, M. Masud, S. S. Alshamrani, O. Cheikhrouhou et al., “Framework for efficient medical image encryption using dynamic S-boxes and chaotic maps,” IEEE Access, vol. 8, no. 13, pp. 160433–160449, 2020. [Google Scholar]
34. M. Rawashdeh, M. Zamil, S. M. Samarah, M. Obaidat and M. Masud, “IOT based service migration for connected communities,” Computers & Electrical Engineering, vol. 96, no. 2, pp. 1–10, 2021. [Google Scholar]
Cite This Article
 Copyright © 2023 The Author(s). Published by Tech Science Press.
This work is licensed under a Creative Commons Attribution 4.0 International License , which permits unrestricted use, distribution, and reproduction in any medium, provided the original work is properly cited.
 Downloads
 Citation Tools