
 Submit a Paper
 Propose a Special lssue
 Open Access
ARTICLE
Stage-Wise Categorization and Prediction of Diabetic Retinopathy Using Ensemble Learning and 2D-CNN
1 Department of Computer Science and Engineering, Sri Venkateswara College of Engineering, Sriperumbudur, Chennai, India
2 Department of Computer Science and Engineering, KG Reddy College of Engineering and Technology (Autonomous), Hyderabad, Telangana, India
3 Department of Computer Science and Engineering, Sridevi Women’s Engineering College, Hyderabad, Telangana, India
4 Department of Computer Science and Engineering, Saveetha School of Engineering, Saveetha Institute of Medical and Technical Sciences, Thandalam, Chennai, India
* Corresponding Author: N. M. Balamurugan. Email:
Intelligent Automation & Soft Computing 2023, 36(1), 499-514. https://doi.org/10.32604/iasc.2023.031661
Received 23 April 2022; Accepted 22 June 2022; Issue published 29 September 2022
 View Full Text
 Download PDF
Abstract
Diabetic Eye Disease (DED) is a fundamental cause of blindness in human beings in the medical world. Different techniques are proposed to forecast and examine the stages in Prognostication of Diabetic Retinopathy (DR). The Machine Learning (ML) and the Deep Learning (DL) algorithms are the predominant techniques to project and explore the images of DR. Even though some solutions were adapted to challenge the cause of DR disease, still there should be an efficient and accurate DR prediction to be adapted to refine its performance. In this work, a hybrid technique was proposed for classification and prediction of DR. The proposed hybrid technique consists of Ensemble Learning (EL), 2 Dimensional-Conventional Neural Network (2D-CNN), Transfer Learning (TL) and Correlation method. Initially, the Stochastic Gradient Boosting (SGB) EL method was used to predict the DR. Secondly, the boosting based EL method was used to predict the DR of images. Thirdly 2D-CNN was applied to categorize the various stages of DR images. Finally, the TL was adopted to transfer the classification prediction to training datasets. When this TL was applied, a new prediction feature was increased. From the experiment, the proposed technique has achieved 97.8% of accuracy in prophecies of DR images and 98% accuracy in grading of images. The experiment was also extended to measure the sensitivity (99.6%) and specificity (97.3%) metrics. The predicted accuracy rate was compared with existing methods.Keywords
If the person has a diabetic’s issue, then that person would be affected by eye disease and it is called the DR. It is caused by blood sugar and it damages blood vessels. Finally this cause would be the reason for vision loss and the person gets blurred vision. The diabetic person is affected by different eye diseases such as DR, Glaucoma and Macular Edema (GME). The DR is the solitary reason for apparition destruction. The initial symptoms of DR are floater; blurred vision and finally vision loss [1–3]. The DR is hush-hush into two types such as Proliferative Diabetic Retinopathy (PDR) and Non-Proliferative Diabetic Retinopathy (NPDR) [4–8]. The primary stages or an initial stage of DR is known as NPDR. In this juncture, the blood flowing vessels in the retina deteriorated and started to leakage the blood and fluid in the retina. The second stage or severe juncture of DR is termed as PDR. In this juncture the blood pitchers are damaged and new abnormal vessels start to grow in the retina and also jelly-like liquid substances start to leak in the middle of the retina or middle of the eye [9–12]. So, the DR required early stage prediction and controlling required stopping the growth of unwanted substances in the eye. The best way of diagnosing DR is dilated examination performed by the eye doctor or ophthalmologists. Some of the other prevention or diagnosing methods are Optical Coherence Tomography (OCT), Fluorescein Angiography (FA) and Funds Photography (FP) [13]. The FA is a method based on the examination of evaluating the central retinal vasculature and examining the affected parts of the retina. And also FA confirms the diagnosis of neovascularization disk and abnormal activities of vessels in the parts of the eye. The other symptoms of FA are vomiting, nausea, and different allergic activities. The OCT method verifies the cross sectional of Magnetic Resonance Imaging (MRI) images of retina and also checks the thickness of retina, quantifying intra-retinal and retinal thickness in short duration of timing. Yet another work was discussed DL based DR for improved rider [14]. The main problems to solve these issues were that OCT needs skilled operators, cost of the equipment and difficulty to capture the images in different positions [15–18]. Nowadays the number of people affected with DR has increased more, so proper screening and long-time observation are needed to check the status of the eye of the person. Therefore, nowadays fully automated and computerized techniques are required to predict the early stage of DR and cure it. Also a fast and real time solution is required and it should be recommended with the DR affected people. Normally the DR has four stages such as insignificant NPDR, sensible NPDR, unadorned NPDR and finally PDR. Among these 4 stages, if a person was diagnosed with diabetes and the result falls under the first two stages, then the tested person can be cured and avoided the vision loss.
The main purpose of this research work is to detect DR early and increase the prediction rate of DR considerably. Some different statistics, data mining and Artificial Intelligence (AI) techniques are deployed to achieve better prediction accuracy [19–24]. But most of the works did not use all the features together. This proposed AI and different features based concepts will be used to predict and classify the stages of DR affected images, and further it has to be leading to better results. In this work, the subset of AI such as ML and DL produced better prediction and classification as the results. In this work the 2D-CNN version of DL was used to detect early stage prediction and classification with multiple features such as texture, morphological and optic disc etc. The main contribution and novelty of the proposed work are as follows.
i) The proposed hybrid method consists of EL, 2D-CNN, TL and Correlation methods.
ii) The SGB ensemble method was applied to predict the DR in sequence; the boosting based EL method was deployed to predict the DR of images.
iii) Later 2D-CNN technique was cast off to categorize the various stages of DR images.
iv) Finally the TL rummage-sale to transfer the prediction to training datasets. Hence automatically new features were well trained and thereby auto prediction performance was increased.
The related work is as follows to claim the important role of this proposed work. Ashish et al. [1] created a couple of varieties of a DL algorithm to forecast DR. The input of the system was one or the other a set of one-field or three turf color fundus photographs. The three-field grabbed nasal, principal, and temporal images was used as input and processed them using a comparable Inception-v3 segment. In the internal validation set, one field, three fields and sorts were well calibrated. In the peripheral substantiation set, one field style puffed up the frequency of un-industrialized DR. The system was technologically advanced based on Inception-v3 construction. The results suggested that the system improved risk stratification for developing DR. The authors [2] described the various stages of DR and the points are categorized as R0, R1, R2 and R3. Nazir et al. [3] presented an automated object localization approach based on a Fast Region-CNN (FRCNN) algorithm and segmentation using Fuzzy K-Means (FKM) clustering. The approach requires the bounding-box annotations to work; however, the dataset annotations are generated through ground-truths. Fig. 1 illustrates the object detection and segmentation using CNN algorithm. Here preprocessed images are accepted through CNN for feature extraction with feature map along with FRCNN algorithm.
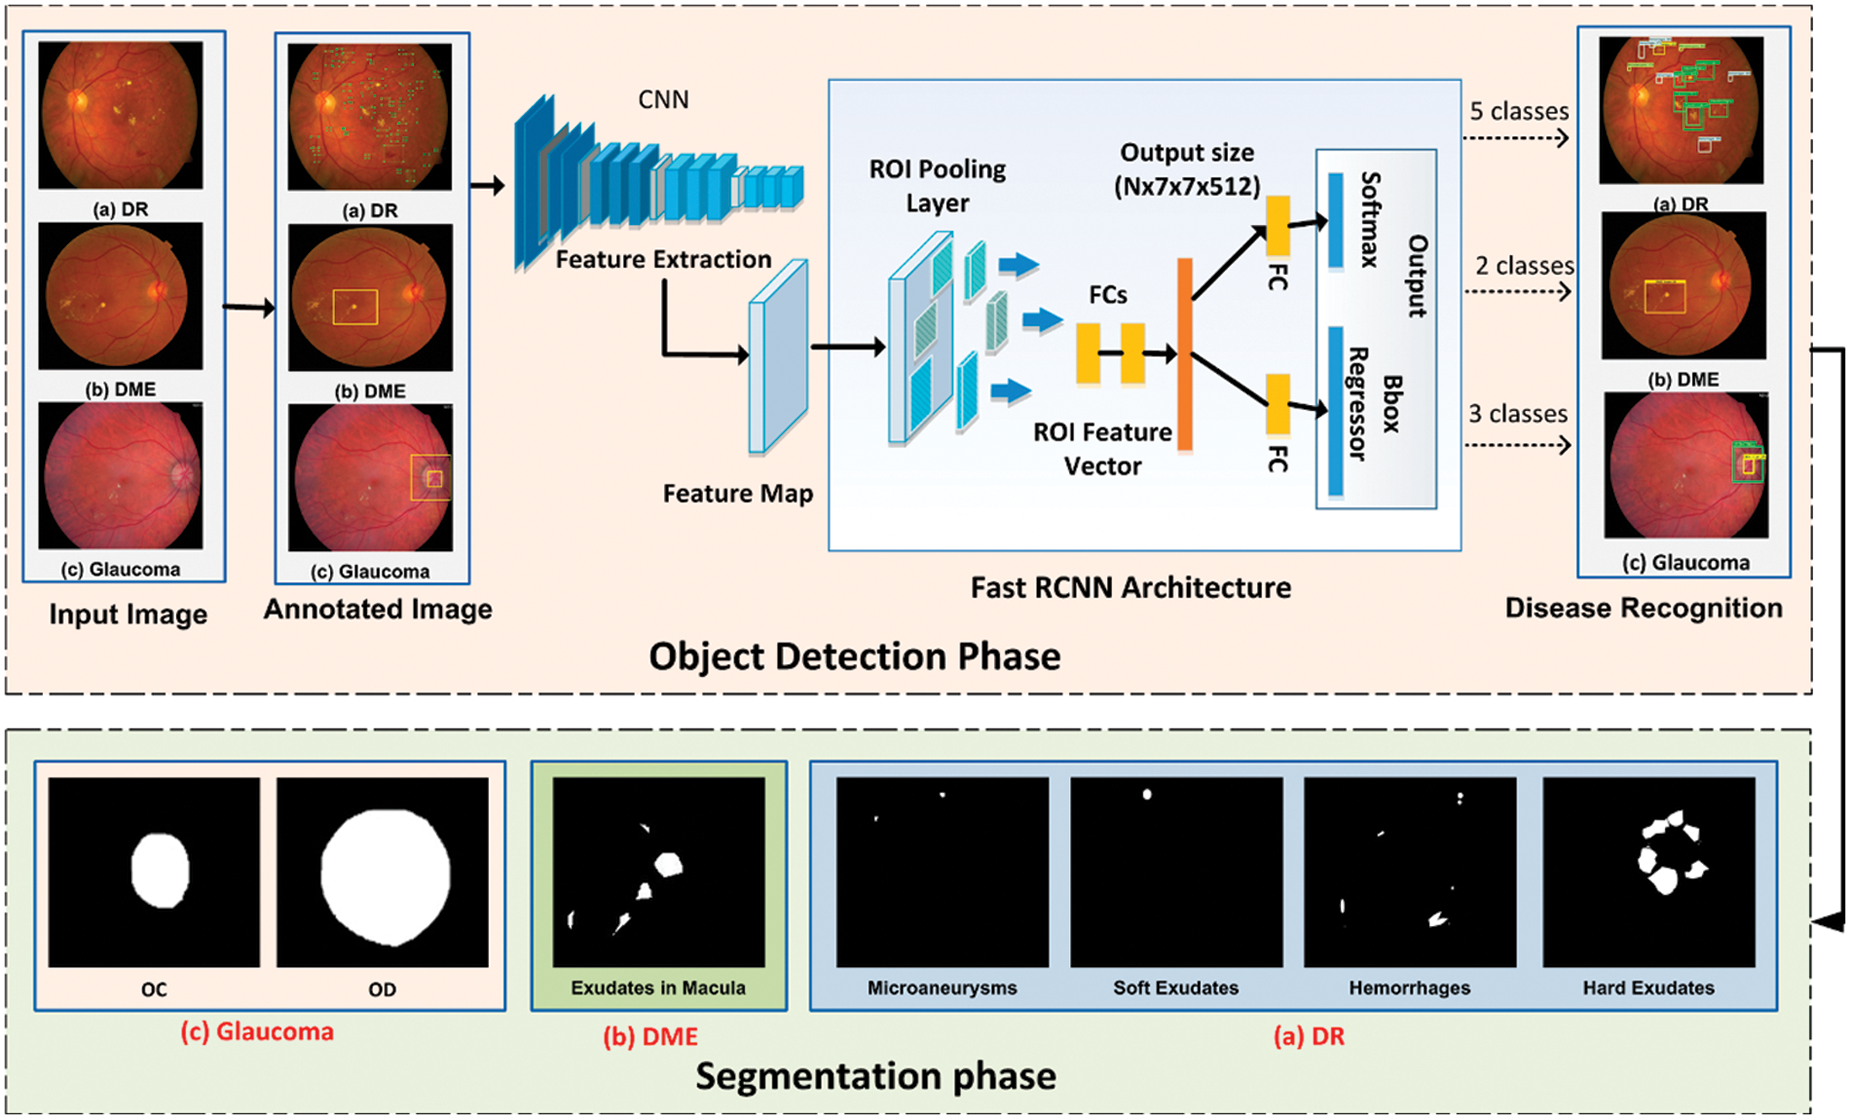
Figure 1: Localization and segmentation approach for object detection
The annotated images for localization using FRCNN was a single-stage exercise technique that was qualified, concluded and then segmented through FKM clustering technique. The segmented sections and ground truths were then associated through intersection over union operations. The FRCNN method accurately perceived the anomalies of DR, DME, and Glaucoma Regions (GR) simultaneously. Chaurasiya et al. [4] discussed Support Vector Machine (SVM) classifiers to identify the severity of DR disease based on surface geographies. Texture feature represented the image as Grey Level Co-occurrence (GLC) of pixel pairs, entropy, Grey Level Run-length (GLR) of a particular passion value, Moment Invariant (MI) and so on. SVM classifier was used to train the dataset to classify the images [5]. A Binary Particle Swarm Optimization (BPSO) technique was applied to increase the classification accuracy. Here BPSO and SVM techniques reduce the effect of misleading features present in the images. Hacisoftaoglu et al. [6] used smart phone-based retinal images for detecting DR using DL frameworks like AlexNet and GoogLeNet. Here AlexNet extracts low-level features using five convolution layers such as convolutions, activation functions, dropouts, fully connected, and max pooling of CNN technique. The highest probability images are classified using a softmax classifier technique. The classification accuracy of the single dataset was predicted with AlexNet as 61% for iExaminer, 62% for D-Eye, 69% for Peek Retina, and 75% for iNView images. The Classification accuracies of multiple datasets were predicted with GoogLeNet as 61% for iExaminer, 70% for D-Eye, 71% for Peek Retina, and 89% for iNView images. Gadekallu et al. [7] discussed Standard scalar technique and it was deployed to normalize the raw dataset. The most significant features are extracted using Principal Component Analysis (PCA). The Firefly algorithm was used to reduce the dimensionality of images. The classification of the reduced dataset was adopted by Deep Convolutional Neural Network (DCNN). The proposed model justifies the superiority in terms of Accuracy, Data precision, Sensitivity, Recall and Specificity for better results.
Herliana et al. [8] discussed Particle Swarm Optimization (PSO) and it was applied to select the best DR feature in the DR Dataset. The Neural Network (NN) classification method further classified the selected feature. The result of NN based PSO increased the classification result about 4.35% from a previous result of 71.76%. The authors [9–12] proposed a framework for various classification of DR. In this framework, different classifiers such as extra tree, SVM, K-Nearest Neighbor (KNN) and multi-layer classifiers were applied for prediction of DR. The scope of this work was that the proposed technique had achieved the precision 79%–84%. Salz et al. [13] proposed a system to analyze fundus images using the DCNN with 3 fully connected layers and 18 convolutional layers. The performance of the proposed architecture was measured by Five-fold and 10-fold cross validation methods. The performance measures were the accuracy of 88% to 89%, quadratic weighted kappa score of 0.91 to 0.92, the specificity of 94% to 95%, and the sensitivity of 87% to 89%. Jadhav et al. [14] proposed a DR detection model consisting of seven phases. At first, Contrast Limited Adaptive Histogram Equalization (CLAHE) was used to pre-processing the retinal images as input. Next, the open-close watershed transformation performs the optic disc removal. Segmenting the blood receptacle and its exclusion was done by Grey Level Thresholding (GLT). Gabor filtering and top hat transformation had segmented the abnormalities presented in the retinal input images. The feature extraction phase had extracted the features like Kapur’s entropy, Texture Energy Measurement, Home-grown Binary Pattern, and Shanon’s. Further the images categorized as ordinary, former, sensible or unadorned and they were done by Deep Belief Network (DBN) based classifier. To improve the optimum feature selection and update the weight in DBN the Modified Gear and Steering-based Rider Optimization Algorithm (MGS-ROA) was used. The authors [15–17] proposed a DL model to predict feature progression of DR.
Zeng et al. [18] proposed a Siamese-like CNN framework for predicting DR which had taken binocular images as input. Here Inception V3 architecture reduced the input parameters and computational complexity. The proposed method increased the performance with an accuracy of 95.1% and a kappa score of 0.829. This method was not performed well since paired fundus images are unavailable. Torre et al. [17] presented an interpretable classifier to classify the images based on disease severity. This model was able to predict the score of every important pixel of the input image to make a final decision. Pixel wise relevance propagation algorithm was introduced to generate the scores. The score depends on the input images and leaving the constant part. Wang et al. [19] analyzed the quality of annotations and then predicted DR by different annotation methods including logistic regression. The different annotation methods were (a) The Single Grader for Single Annotations (SGSA), (b) Multiple Graders from Single Annotations (MGSA), (c) Voting for Multiple Annotations (VMA), and (d) Adjudication of Disagreement with Double Annotations (ADDA). While using ADDA, prediction performance had achieved the highest priority. When considering grading, the performance was not good along with prediction. Gulshan et al. [20] introduced a DL algorithm based method and it was used to predict the expected DR along with class and assign scores to individual pixels. It exhibited their relevance in each input sample. To take a final classification decision, the assigned score was employed. In this work, more than 90% of sensitivity and specificity values were gained as DL framework performance. The proposed algorithm improved performance through appropriate measures. Sengupta et al. [21] proposed a solution for severe cases of DR and they were detected by a DL classifier technique. The EyePACS dataset was trained with a total of 1, 28,175 images and the proposed model was adopted to improve the tagging of the images. Compared to human expert capabilities, this model achieves 97% sensitivity and 93.5% specificity for detecting the worst cases of DR. The disadvantage of this model was lack of interpretability.
Islam et al. [22] proposed a supervised learning based approach for DR detection. To achieve more accuracy, the Artificial Neural Network (ANN) was introduced. The image features are extracted by ANN classifier. In this work, Feed Forward (FF) back propagation NN based architecture was coined. In this work, the design compound applied to achieve non-linear relationships. Here ANN was used for corresponding relationships. Unseen relationships on hidden data were assumed as well. Also to define the structure of ANN, there was no specific restriction applied. It was actually numerical information for this work.
Xu et al. [23] proposed a model for the identification of the early-stage of glaucoma. Here early diagnosis was done to focus on an Optic Disc Region (ODR). The localization of OD was achieved through Regions with Convolutional Neural Network (RCNN). Other stages used DCNN for checking glaucomatous or healthy to classify the computer disc. The proposed framework achieved an area-under-the-cure (AUC) as 0.874 for localization and classification of glaucoma. It takes a two-stage framework and this method was computationally complex for localizing and classifying of glaucoma. By increasing the network hierarchy, it loses the discriminative set of features and affects the performance. Giles et al. [24] presented a novel methodology for diagnosing the progression of DR and view of Micro-Aneurysms (MAs) turnover. To obtain MAs turnover, the traditional image analysis based roadmap was used. The SVM algorithm had shown to be more operative for classification tasks. SVM classifier was used to detect MAs turnover. In this proposed methodology, pre-training of features was not required and it had relatively memory efficiency. The methodology was exceedingly competent in high dimensional galaxies. But it was not suitable for huge datasets. Decencière et al. [25] discussed the concept to improve the classification of DR; five DCNN models are used. The five different frameworks were Dense121, Dense169, Resnet50, InceptionV3, and Xception. These frameworks encode the rich features from the dataset. Kaggle dataset was applied to train and evaluate the model. To locate and classify the DR lesions, a framework was applied and it was separated into different classes. This method suffers from high computational cost too.
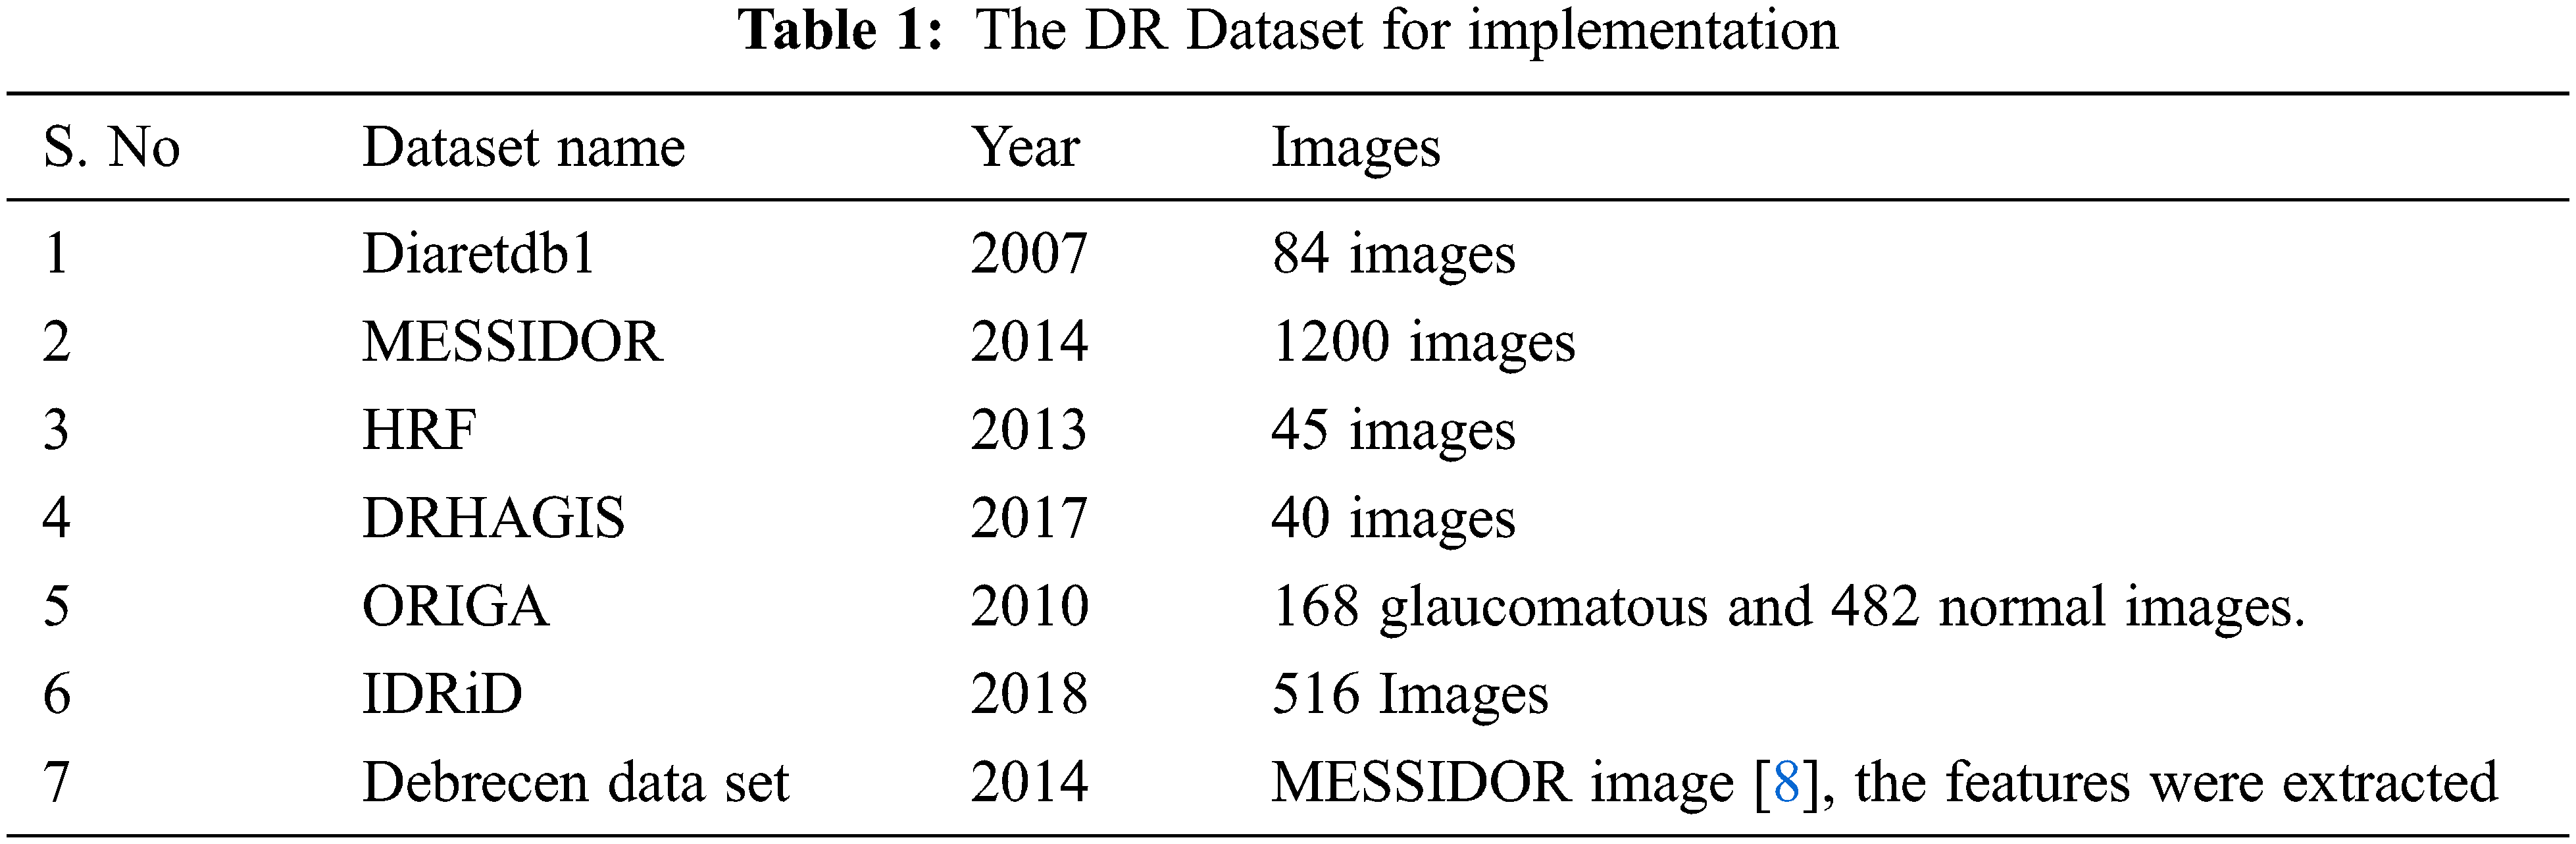
This research work was carried out in the Department of Deep Learning, Saveetha School of Engineering, Chennai, India. For features classification, training and testing, the MESSIDOR Dataset [26] was used. Total of 1200 fundus color images were there in the MESSIDOR Dataset. For the experiment, 600 images were castoff for training, 300 images were used for testing and 300 images were used for validation. Some of the training, testing and validation datasets used in this work have shown in Tab. 1 [27].
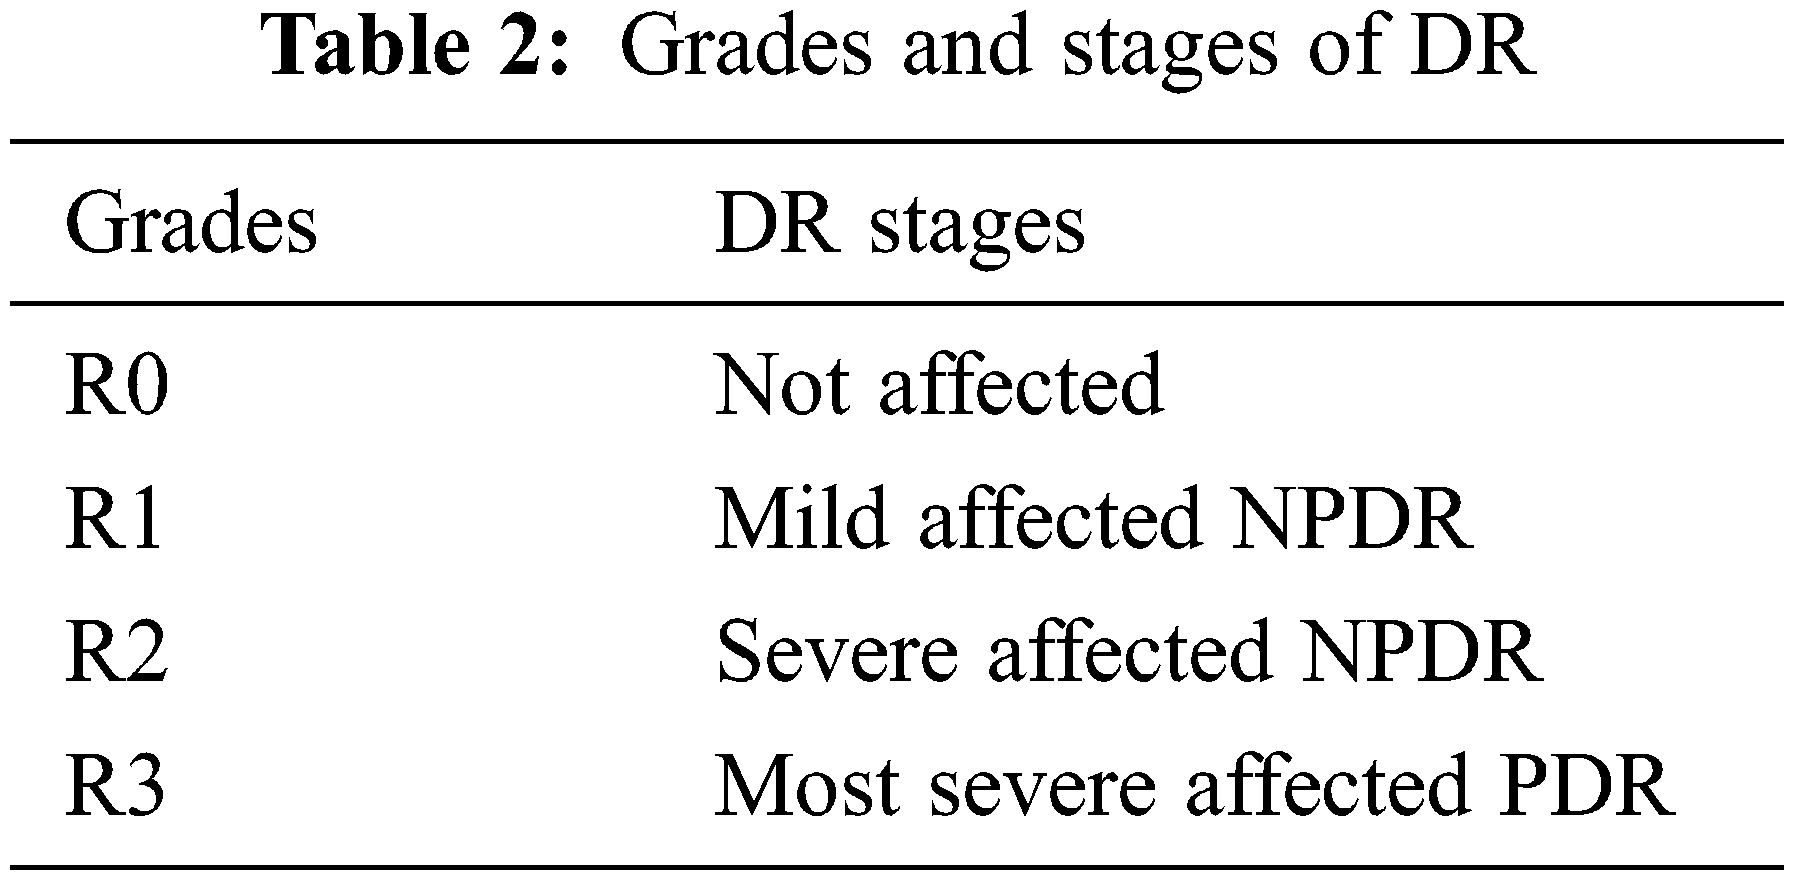
The DR was classified into different stages or grades. The authors of the [11] described the various stages of DR and the stages were graded as R0, R1, R2 and R3. The author of [28] presented the various classifications. It was further graded as R0, R1, R2 and R3 based on the affected status. The R0 means not affected, R1 means mild affected (NPDR), R2 means severe affected (NPDR), R3 means most severe affected (PDR). The summarized grade of all stages of DR was shown in Tab. 2.
The various stages of DR were shown in Fig. 2. The various features of DR predictions were shown in Tab. 3. Some of the dominating features were blood vessels, optic distance, fovea, Blot hemorrhages, exudates number etc. [29–33].
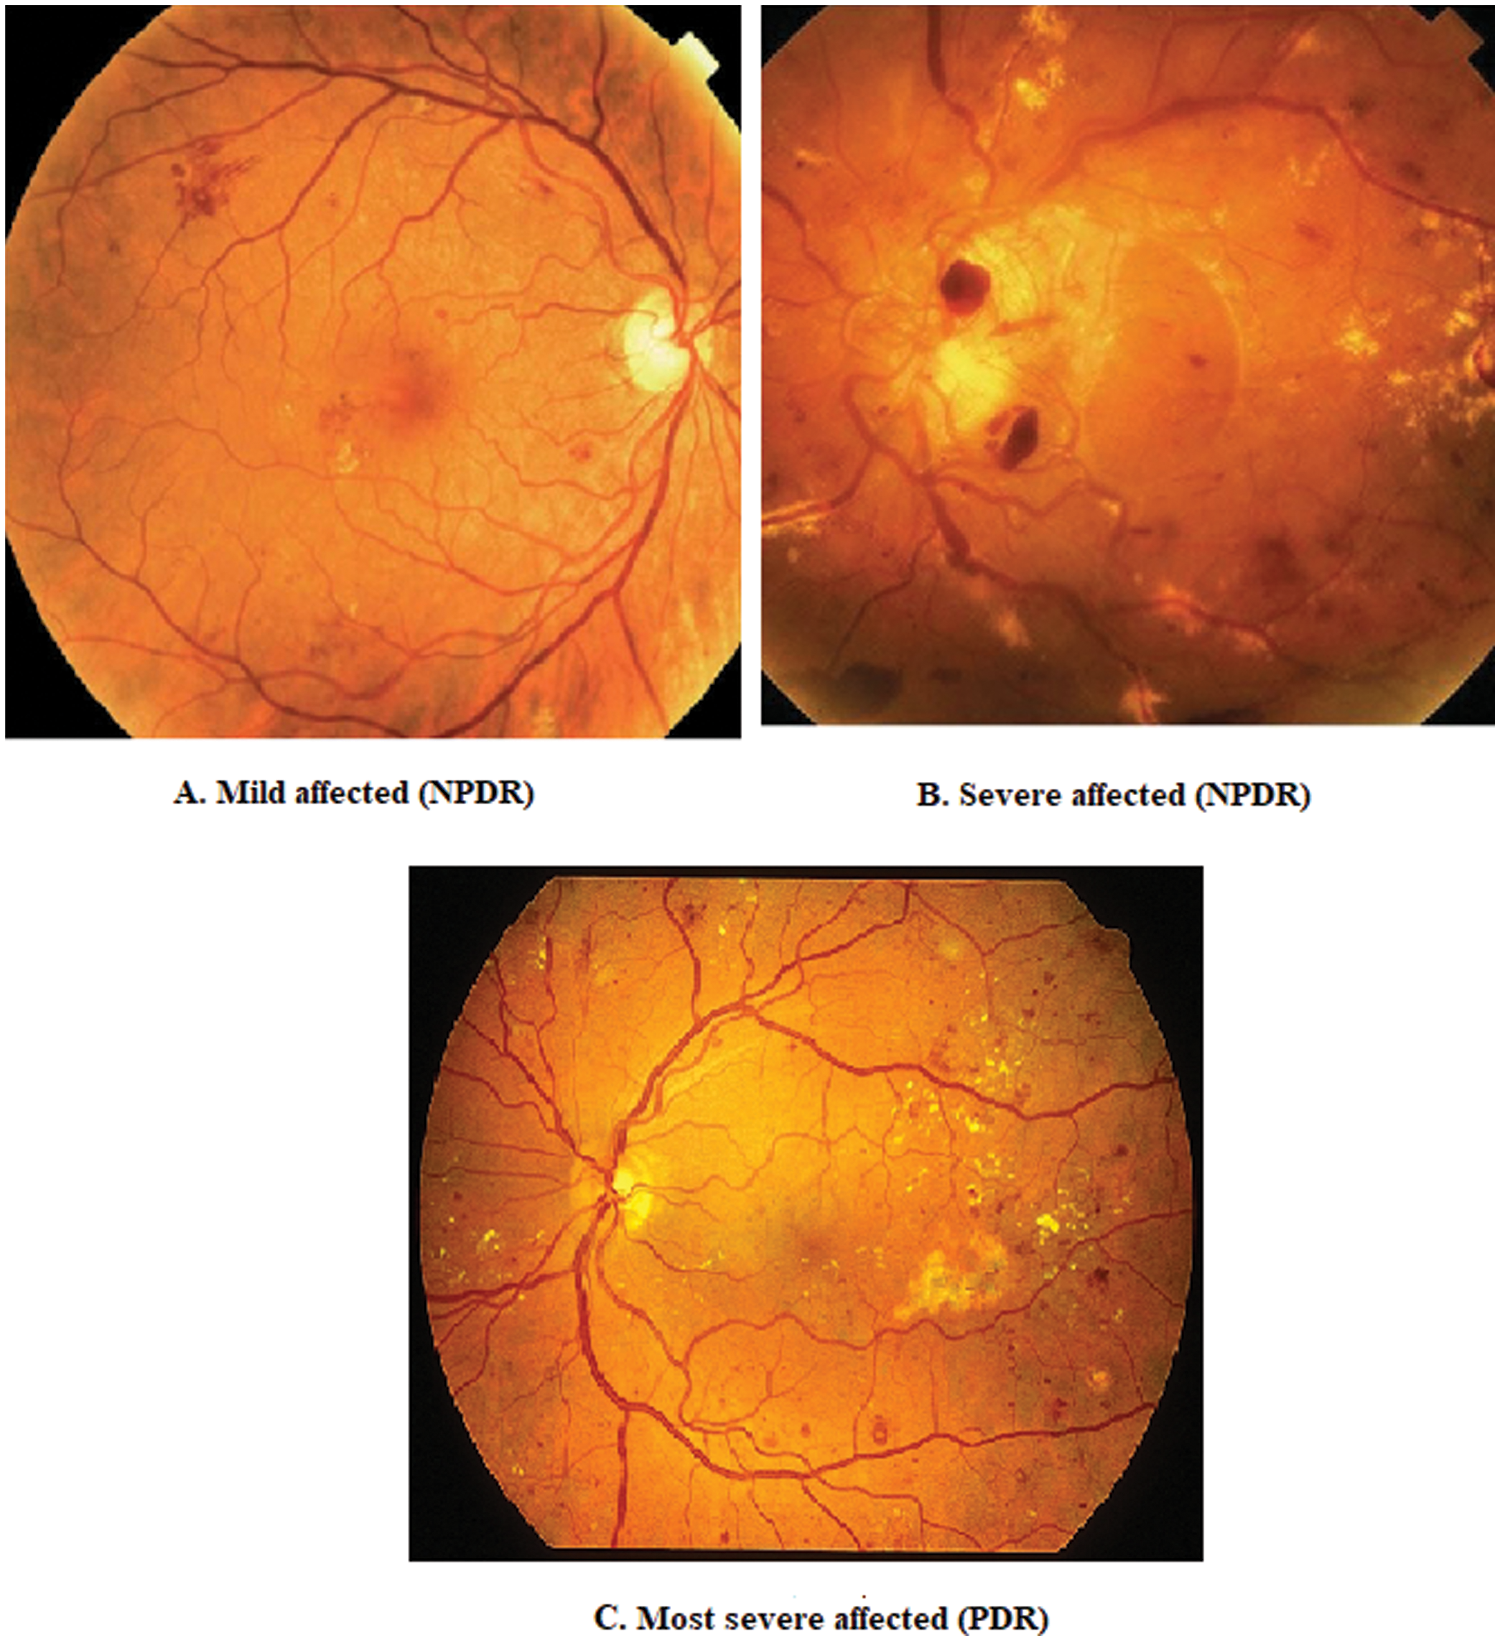
Figure 2: Various Stages of DR Sample Images

Tab. 3 is listing the features of DR prediction. All features listed belong to parts of the eye which were essential in prediction of DR since all these features were changed if DR causes.
The main intent of the proposed work is to predict the DR using multiple features, classification of various stages using multiple features and finding pre-DR images from the huge amount of datasets. The proposed method predicted and classified DR images with EL (SGB), Deep Modeling (CNN with TL) and correlation techniques.
4.1 Stochastic Gradient Boosting
It is a combination of boosting and bagging approaches. It is an EL approach with a Hybrid method of DL [34] and makes the prediction by different weighted trees using features. For every iteration, it identifies new features and also new loss functions are created for better prediction of DR images. Using this method, the given set of images is predicted in the form of binary classifications. The structure of the binary prediction using SGB has shown in Fig. 3. In this structure, initially features mentioned in Tab. 3 are included one by one and all the features are combined for better predictions and accuracy. The real functions are trained based on the loss functions between real functions and classification of images. The structure of the SGB is the combination of weighted images, features and combine or averaging.
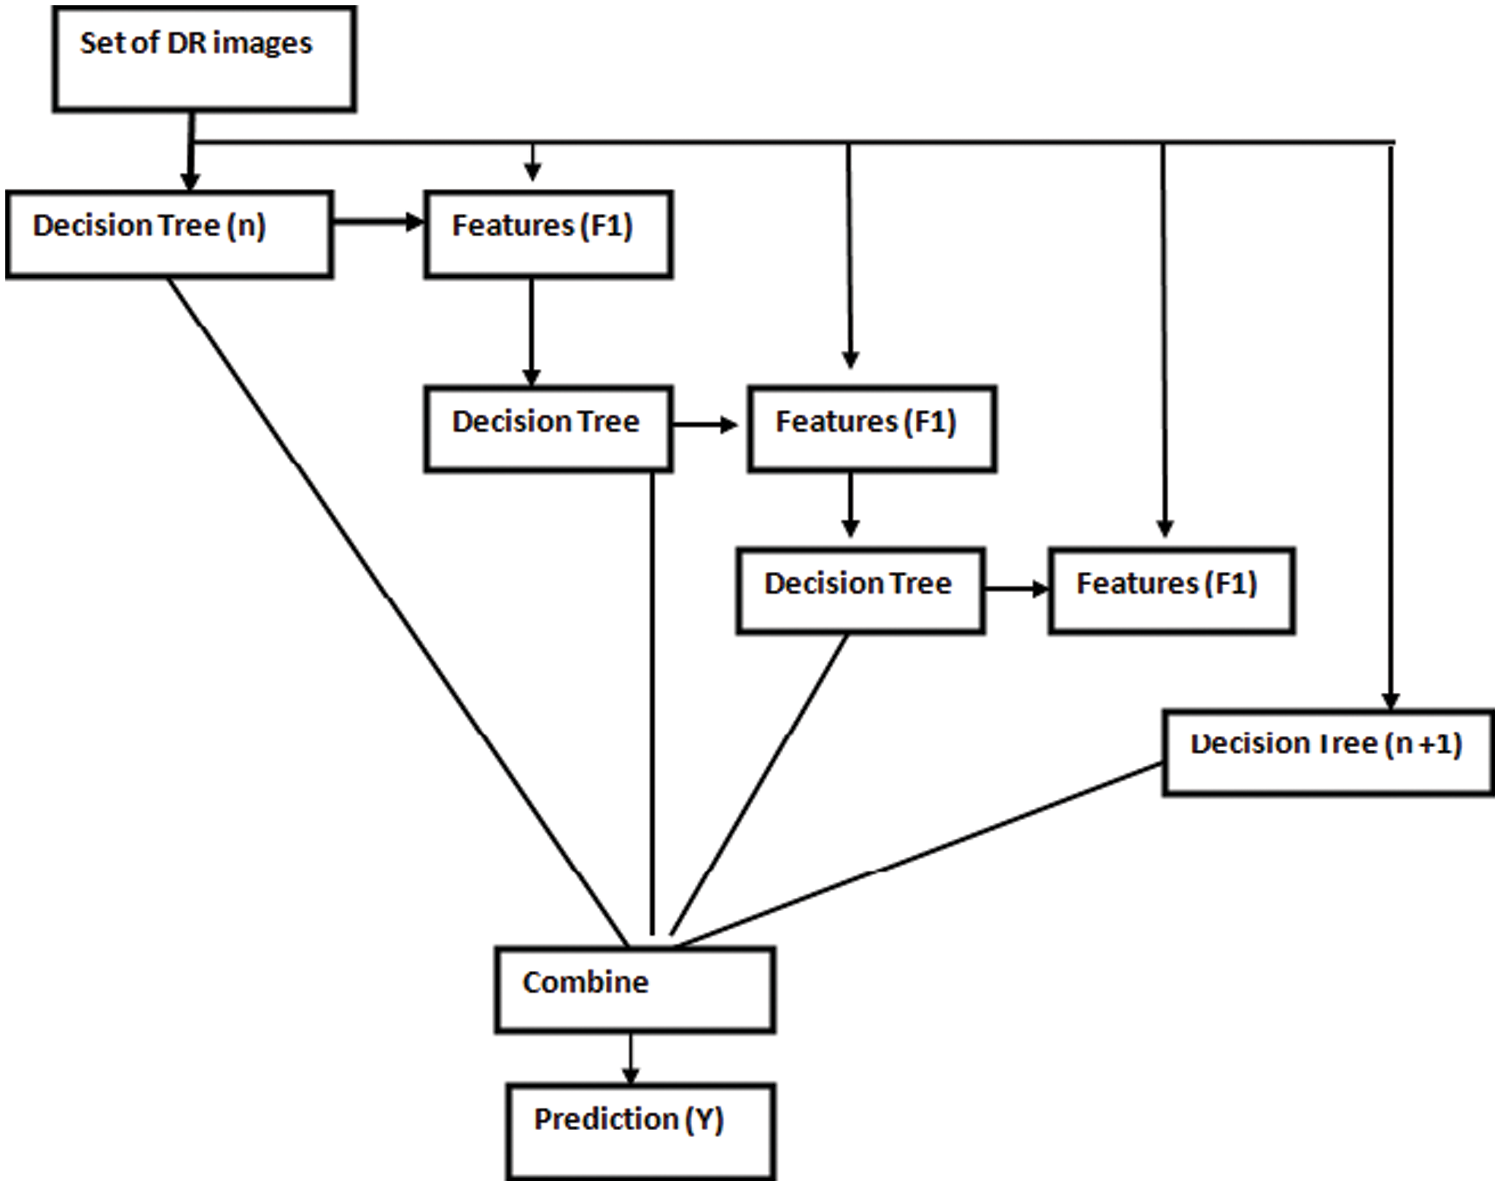
Figure 3: Structure of boosting algorithm
The deep modeling is designed using CNN and hyper tuning parameters. This combination produced better classification and predictions. In this work, 2D-CNN coined for prediction and hyper tuning parameters are used to increase the prediction performance and accuracy. The 2D-CNN has some common usage such as vertical and horizontal turnover, rotation translation, column transformation etc. The main advantages of 2D-CNN are strengthening the model using rebuilt and increasing the number of inputs. Another main important trick gained from this model is that information filling such as random crop and size changing of images is identified. The main purpose of introducing 2D-CNN is that it has highlighted the classification based on the given inputs and features. Due to the varieties of inputs and knowledge varying data, different operations are extracted from the features. In this method, self-adaptive information is also extracted.
TL used to gain the knowledge of solving one problem to get knowledge from the related problems or related predictions. It is used to fine-tune the pre-train model with the help of subsequent information or knowledge. In this DR prediction, with the help of trained images predictions are performed and based on the predictions, new knowledge or information are gathered. For example, in this work current input prediction is performed with the help of trained images, after that with the help of TL features, final prediction is performed.
The correlation is used to measure the strong relationship between two prediction variables. The values of the prediction have between −1 to 1. In this work, initially based on the features and pre-processing, the initial prediction is performed. Secondly using EL, the prediction is performed. Thirdly using the DL based modeling, final predictions are performed. Finally as per consideration, the combination of correlation and value of the prediction is greater than 0.4 and hence it should be considered as the DR.
The working model is the combination of features and pre-processing, DL modeling and correlation of different predictions. Fig. 4 has shown the overall working model for the proposed DR prediction system.
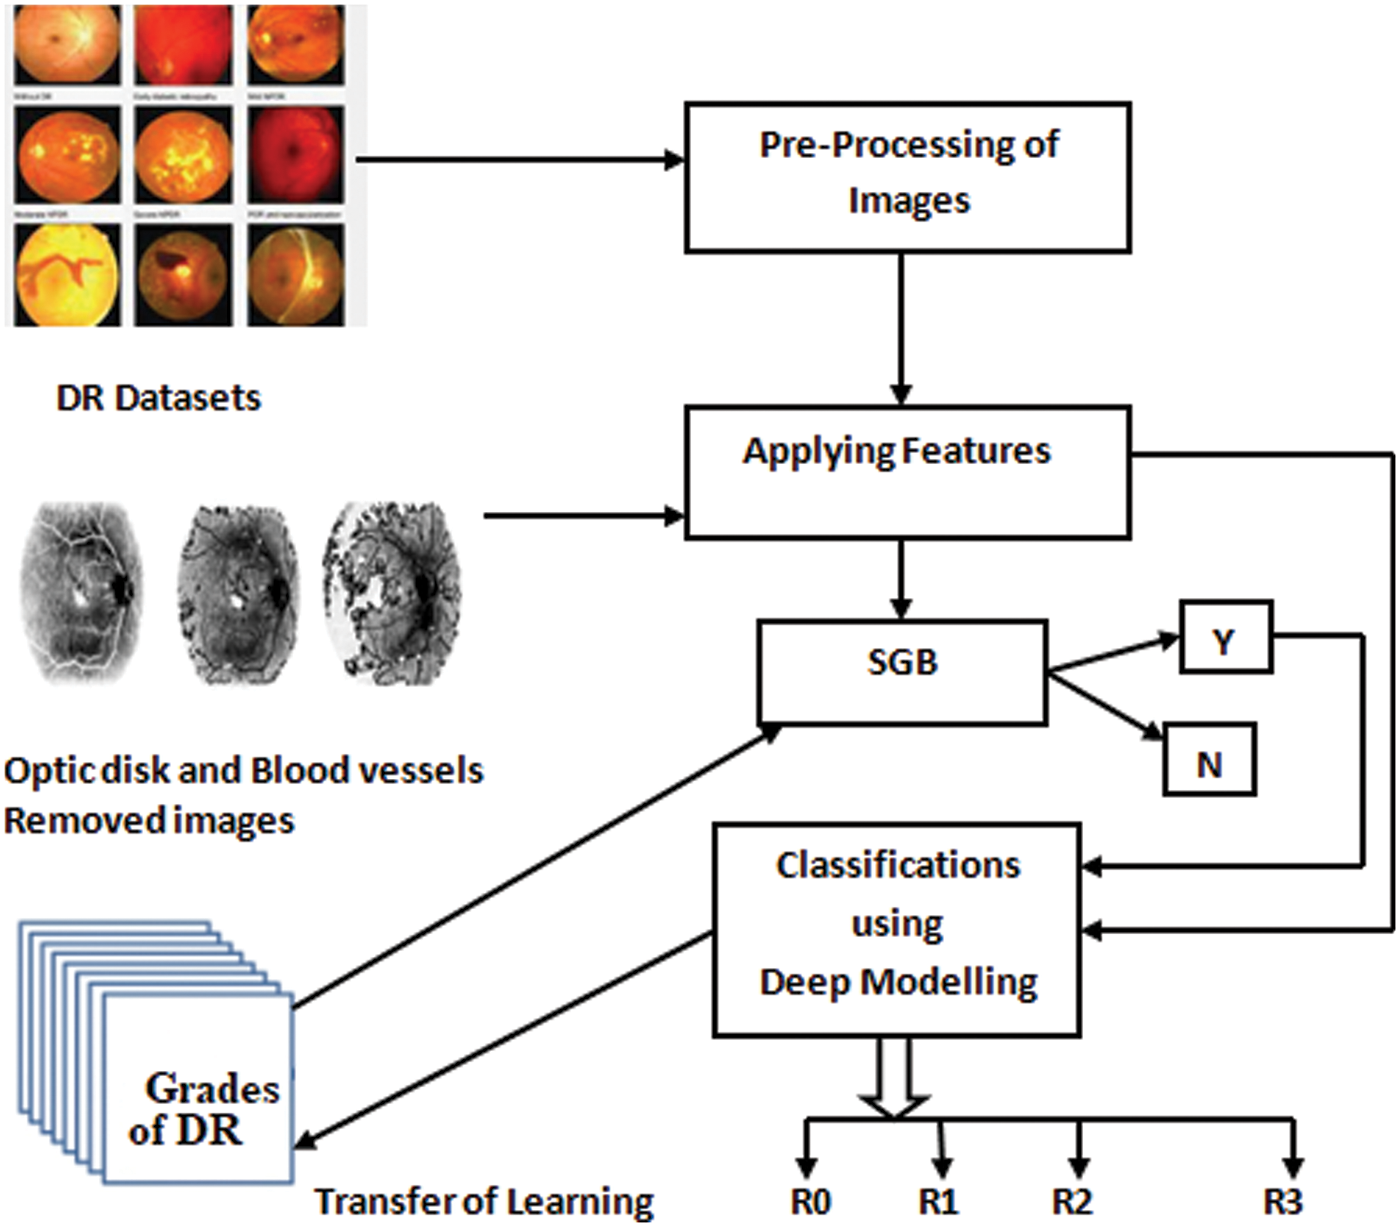
Figure 4: The overall DR prediction system model
The step by step processes of the proposed working model are as follows. The set of the given input images are described in Eq. (1).
where X–denotes number of input images, {X1, …, Xn} represent various images in the datasets. The training, testing and prediction of images have shown in Eqs. (2) and (3).
where D–denotes predicted images, Y1-trained images, X1-Given input images. Finally using Eqs. (1)–(3) is coined to represent the overall prediction ratio.
where Y is the overall predicted ratios from the given subsets of images. The initial prediction is performed with the help of pre-processing of images such as segmentations, features prediction and features ranking. Eqs. (4) to (6) help to perform the initial prediction of DR based on the initial training and testing. The given image pixel is processed using the threshold values. Gaussian Pixel Density has been used to find initial differences between the images and the predicted performance with help of Eq. (4).
where P1 and P2 denoted as priori probability density values and σ1, σ2 denoted standard deviation of density regions. The various input features of the images are represented using Eq. (5).
where F represents the sum of all features and P denotes probability of prediction of each feature. Before applying the prediction technique, initial predictions are performed using Eqs. (2) and (5). With help of training and various features, initial predictions are performed.
In Eq. (6), Y1 represents the prediction of DR based on the features and based on the training and test data. Eq. (7) is representing the prediction based on the EL. The classification of learning updating is performed using SGB based learning parameters.
where L represents the various categories of DR images, x is the input, y is the predicted classification based on the Eq. (5), α is the learning rates, t is the initialized learning weights, and γ is relevant features of images. Based on the Eqs. (4) to (7), the various stages of images are classified. The classification is performed with the 2D-CNN and representation of CNN has shown in Eq. (8).
where (wi, hi) is denoted as input array, (wk, hk) is denoted as kernel array, (wo, ho) is denoted as output array. Using Eq. (8), different classifications are performed and the classification is denoted as Eq. (9).
where A stands for Affected, S stands for Severe. Based on Eqs. (7)–(9), prediction and classification of DR are performed and again for better accuracy, the predicted output is transferred to Eq. (7). So, new prediction and classification is transferred using TL. With help of TL prediction is performed continuously.
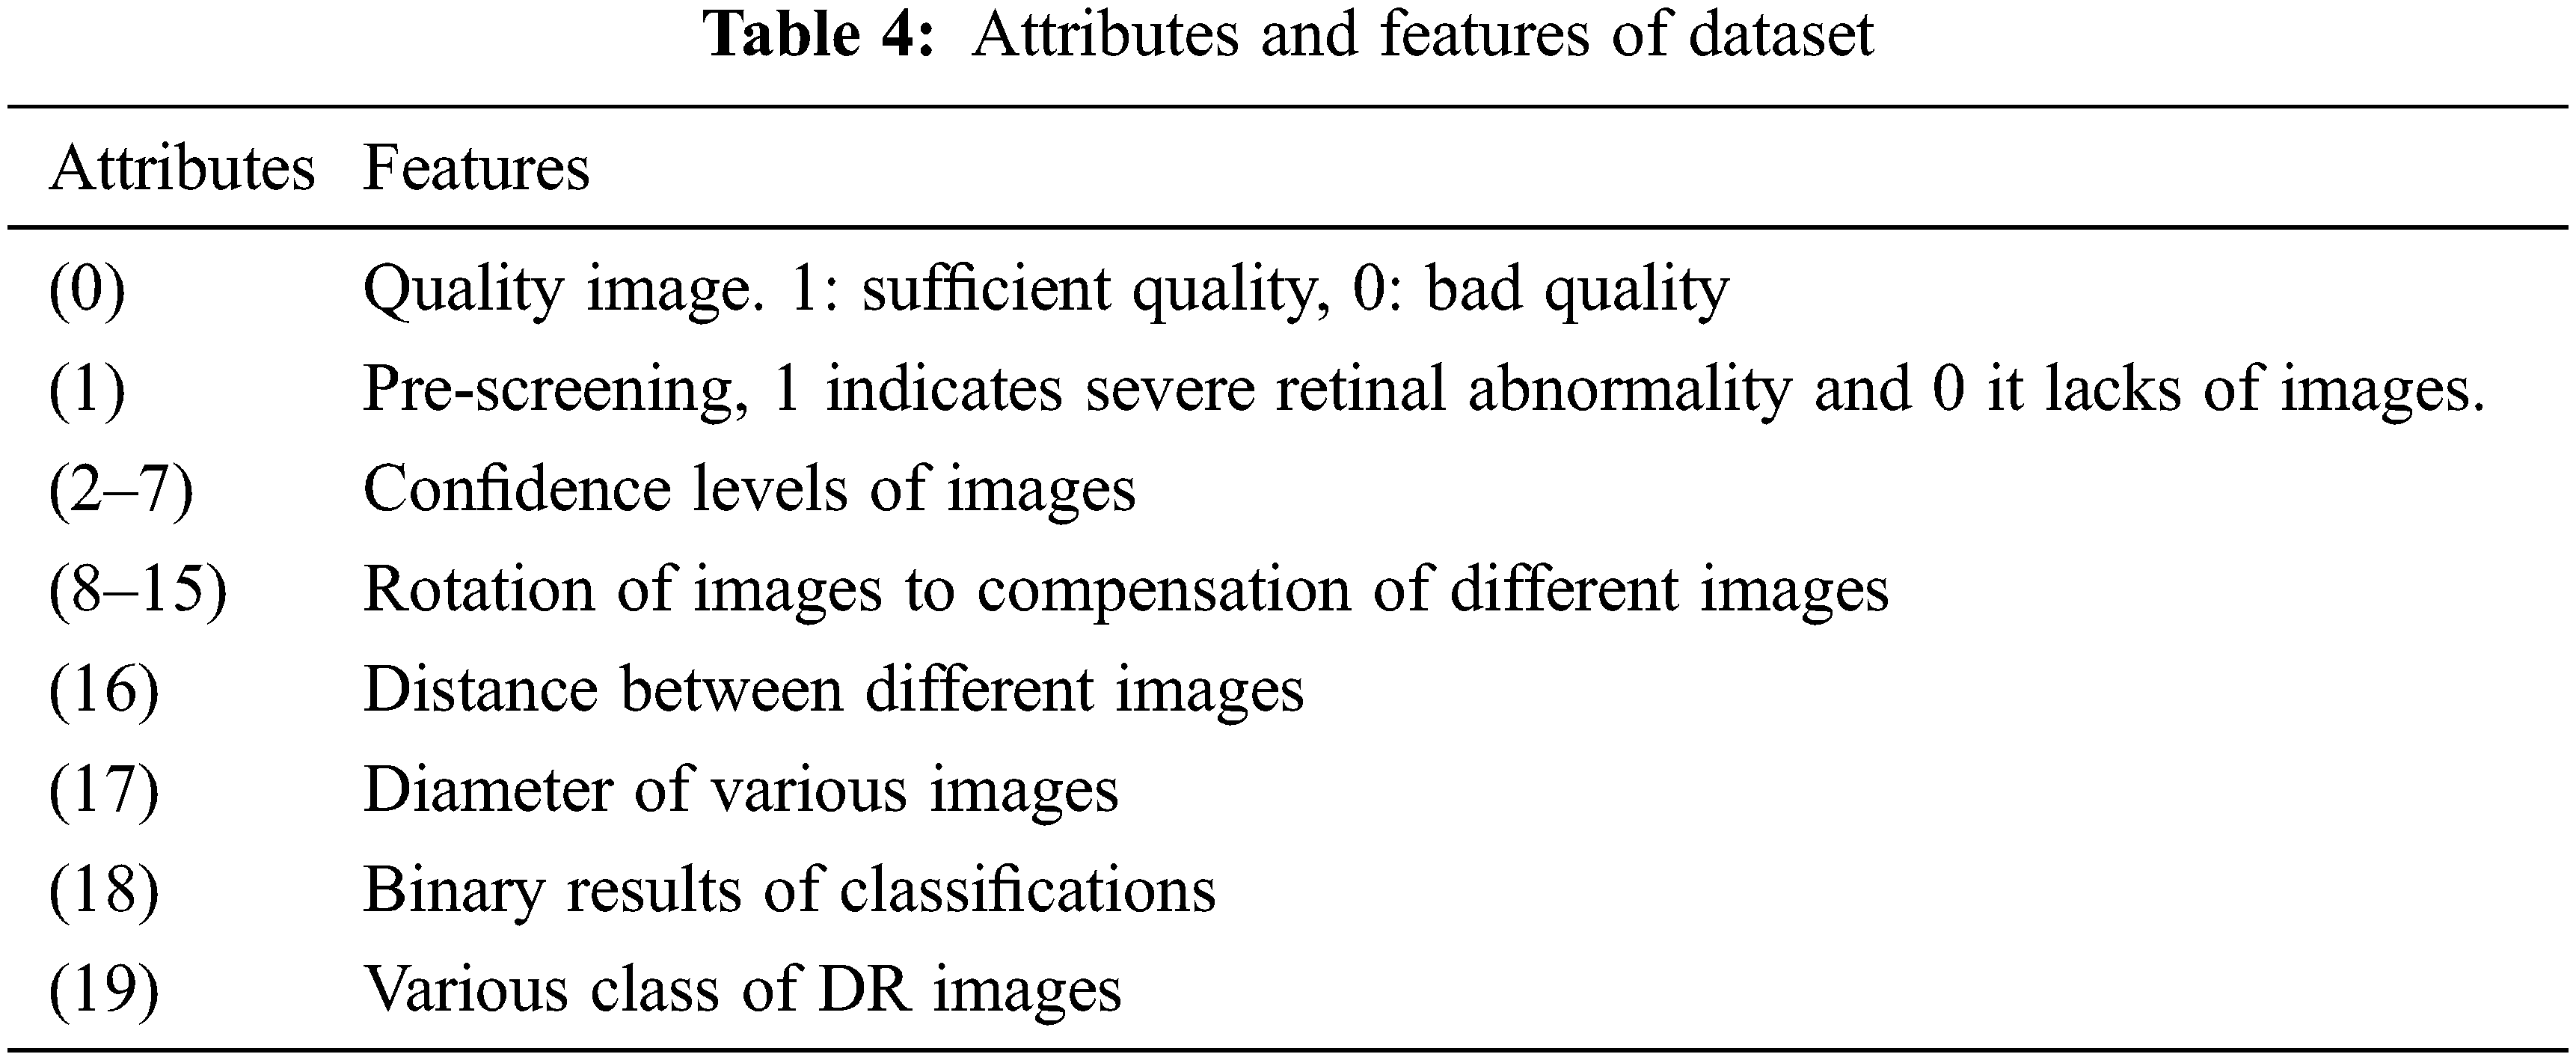
This section presented results of experiments using the different parameters of DR Datasets. The experimental procedure is executed using python programming and the various iterations of the results are averaged and then correlated. The main parameters for comparisons are accuracy, sensitivity and specificity with stage wise classification of images. The various features of the dataset images [31] are listed in Tab. 4 and the accuracy of different classification methods are shown in Tab. 5 [32]. Here 19 attributes and features are used through architecture of prediction of DR as proposed. The undergone processes are checked for quality of images, pre-screening, confident levels of images, rotation of images, measuring distance between neighbor images, diameter of images, assigning binary values of images and finally classification of DR images. Hence Tab. 4 would be involved to predict the DR with novelty. Tab. 5 is listing the features, which are supposed to be used to achieve more efficiency with the proposed hybrid method.
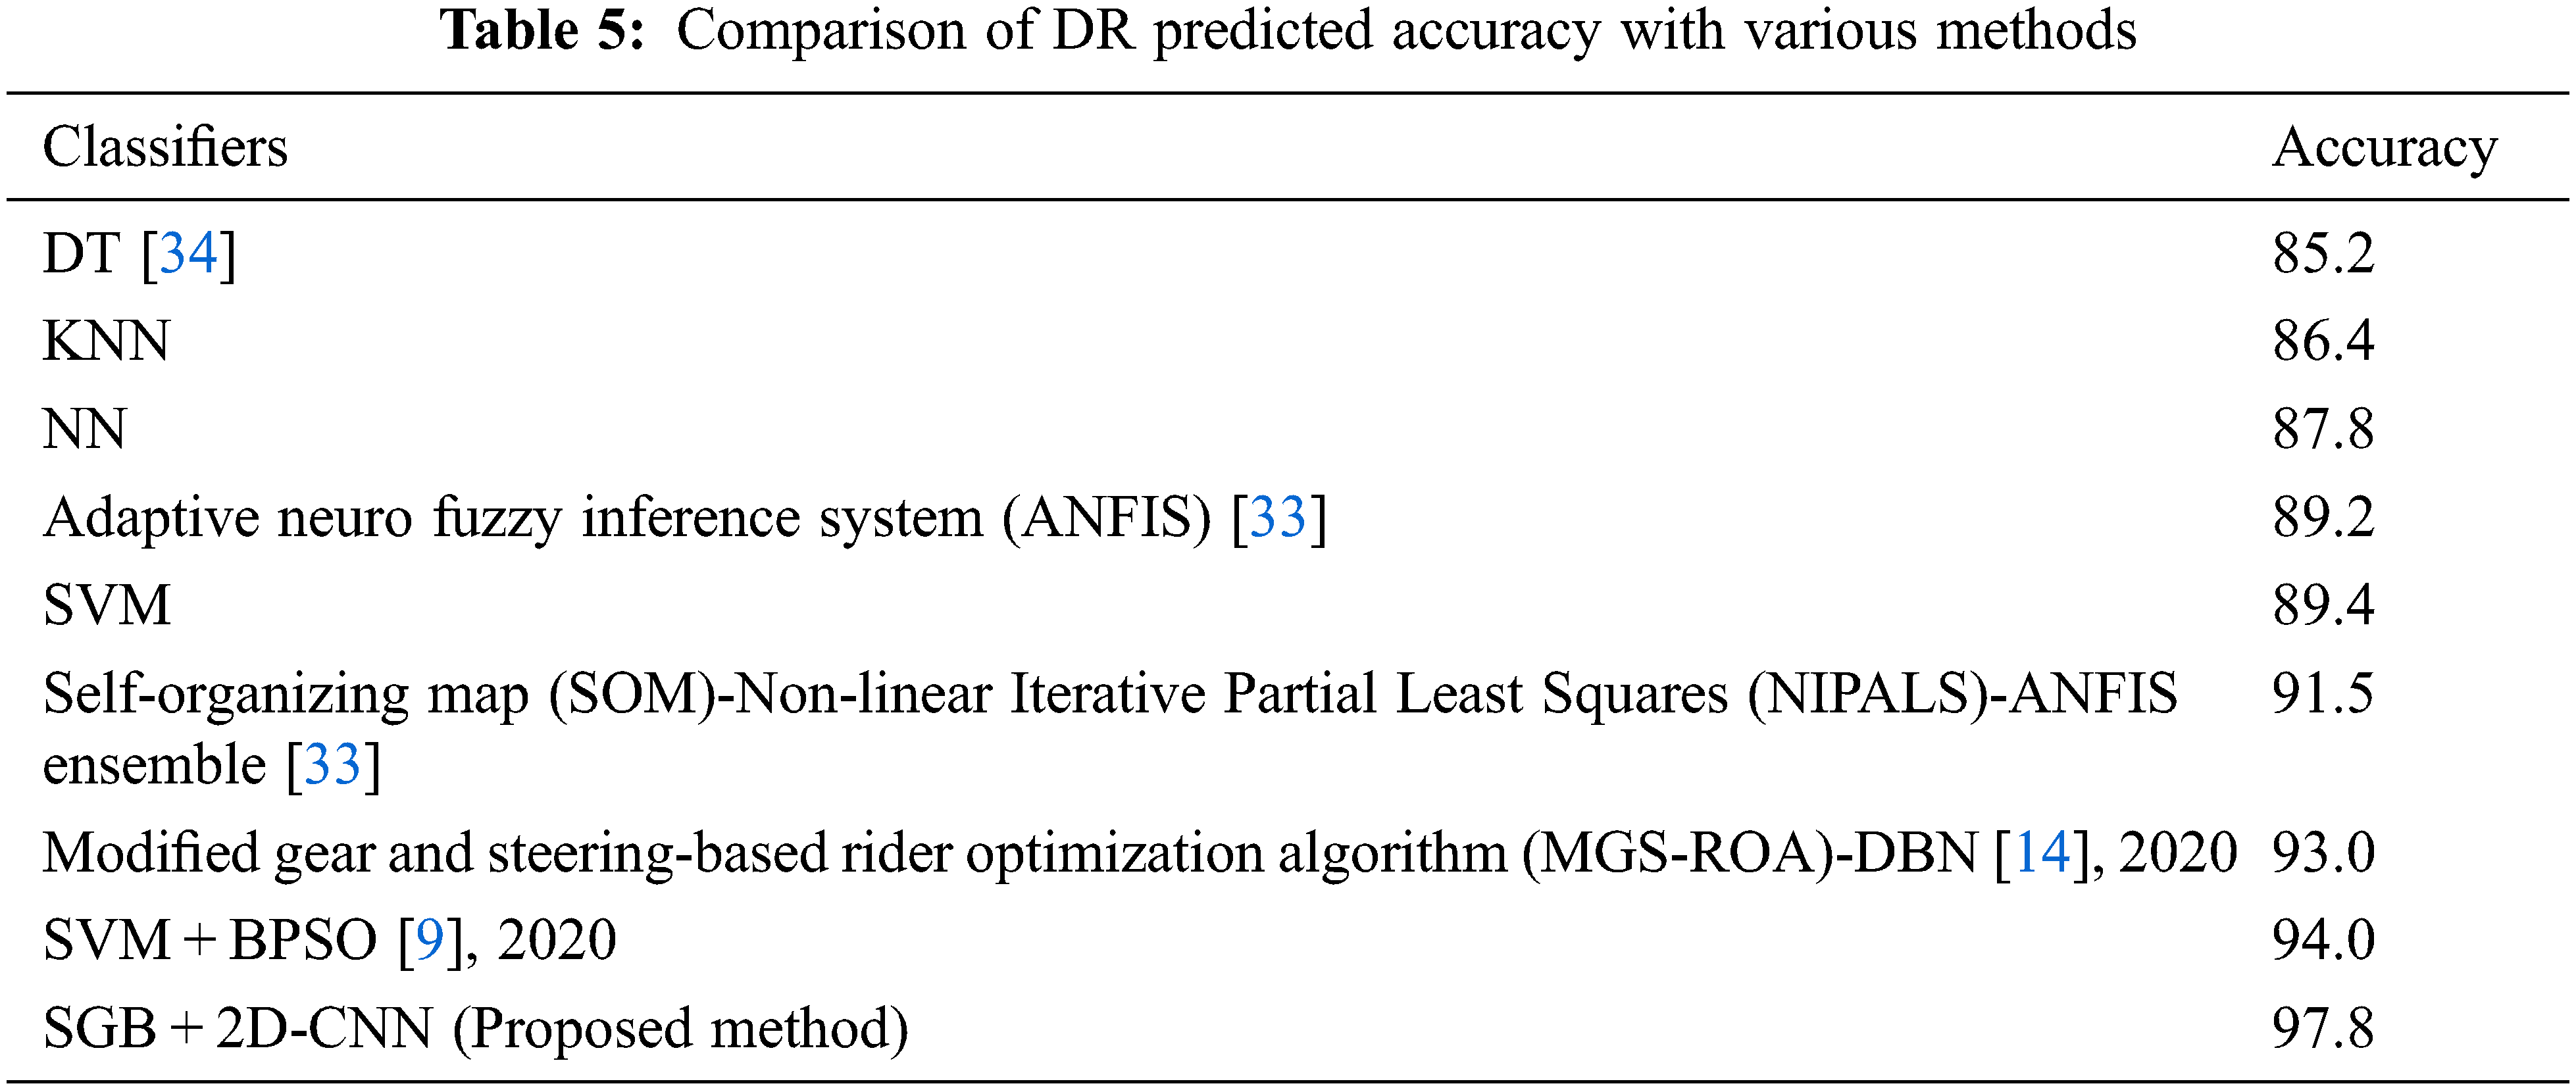
The above mentioned features are extracted in the different iterations of the experiment and the average of the results is calculated using the boosting of various features in different iterations. The existing accuracy of predictions and proposed method’s predictions are shown in Tab. 5.
Fig. 5 has shown the comparative accuracy of the prediction of DR images of difference algorithms. Here, proposed work is compared to the previous methods such as SVM and EL methods. The ensemble boosting prediction error of proposed method is very low when compared to the other works. The various subsets of datasets features are extracted using different ensemble boosting models and these features help to automatically increase the accuracy. This proposed method has two sets of features such as prediction features and image features. Using these features and different stage of prediction techniques, classification accuracy is measured. From the inference, proposed work has gained 97.8% accuracy.
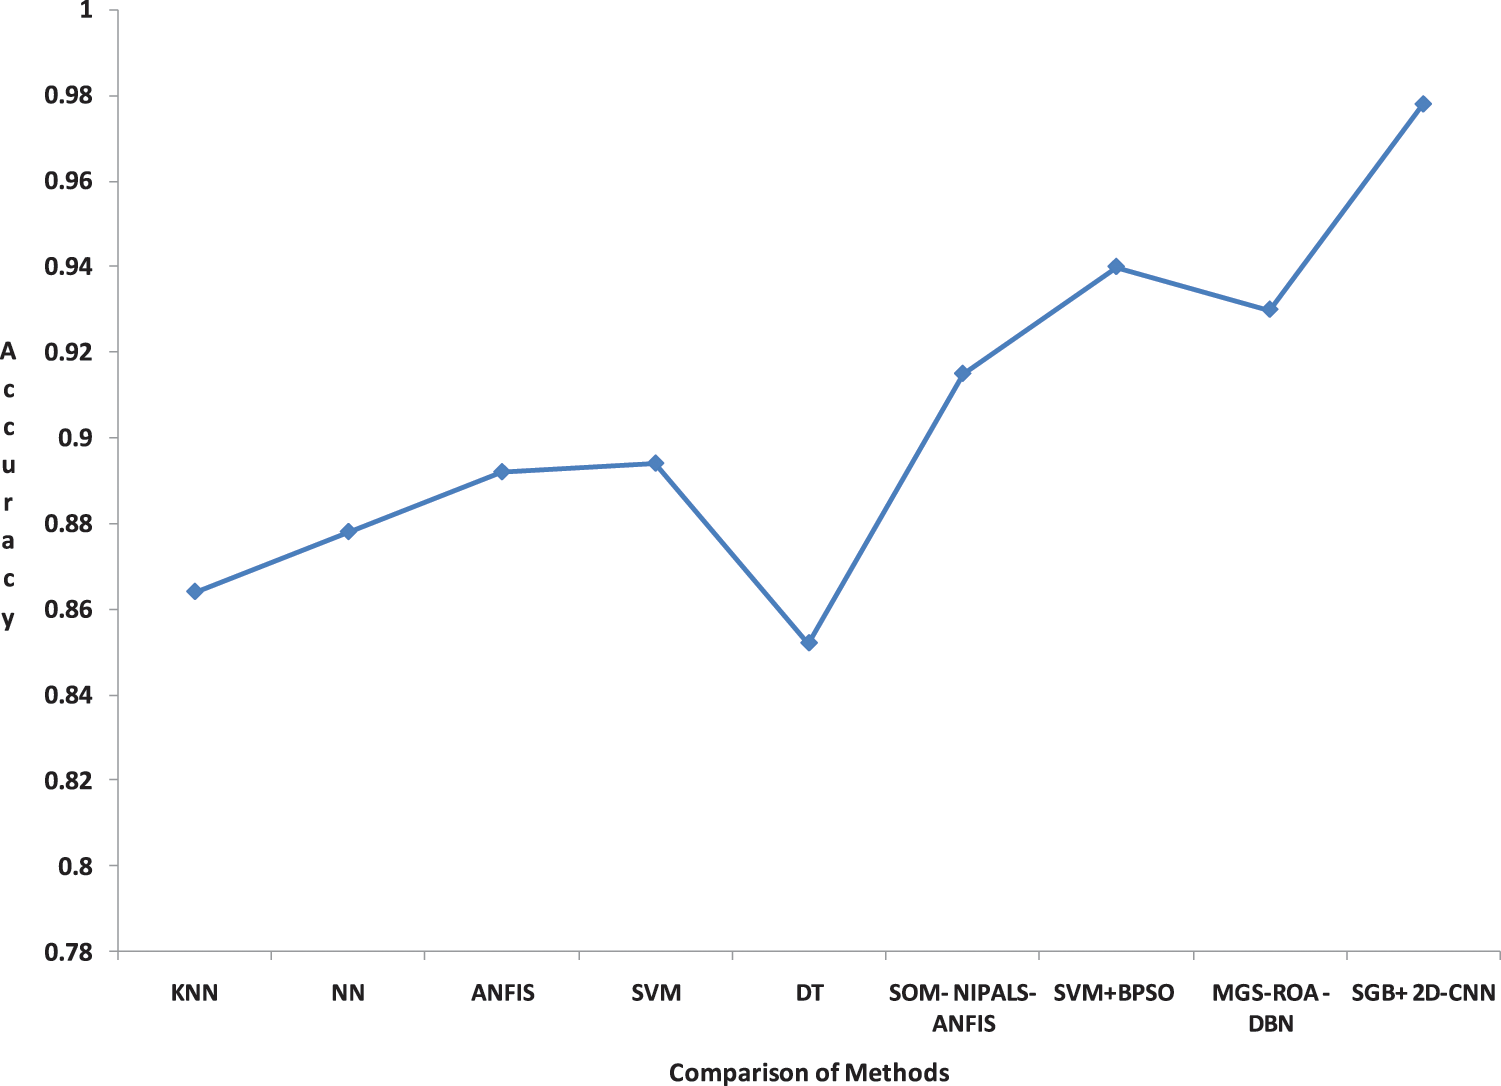
Figure 5: Comparisons of Accuracy
Two more main parameters are sensitivity and specificity predictions of images. To find the correctly matched features, the sensitivity is used on the DR images and it is shown in Fig. 6. To find the wrongly matched images, the specificity is used from the DR images. Sensitivity prediction has gained sensitivity (99.6%).
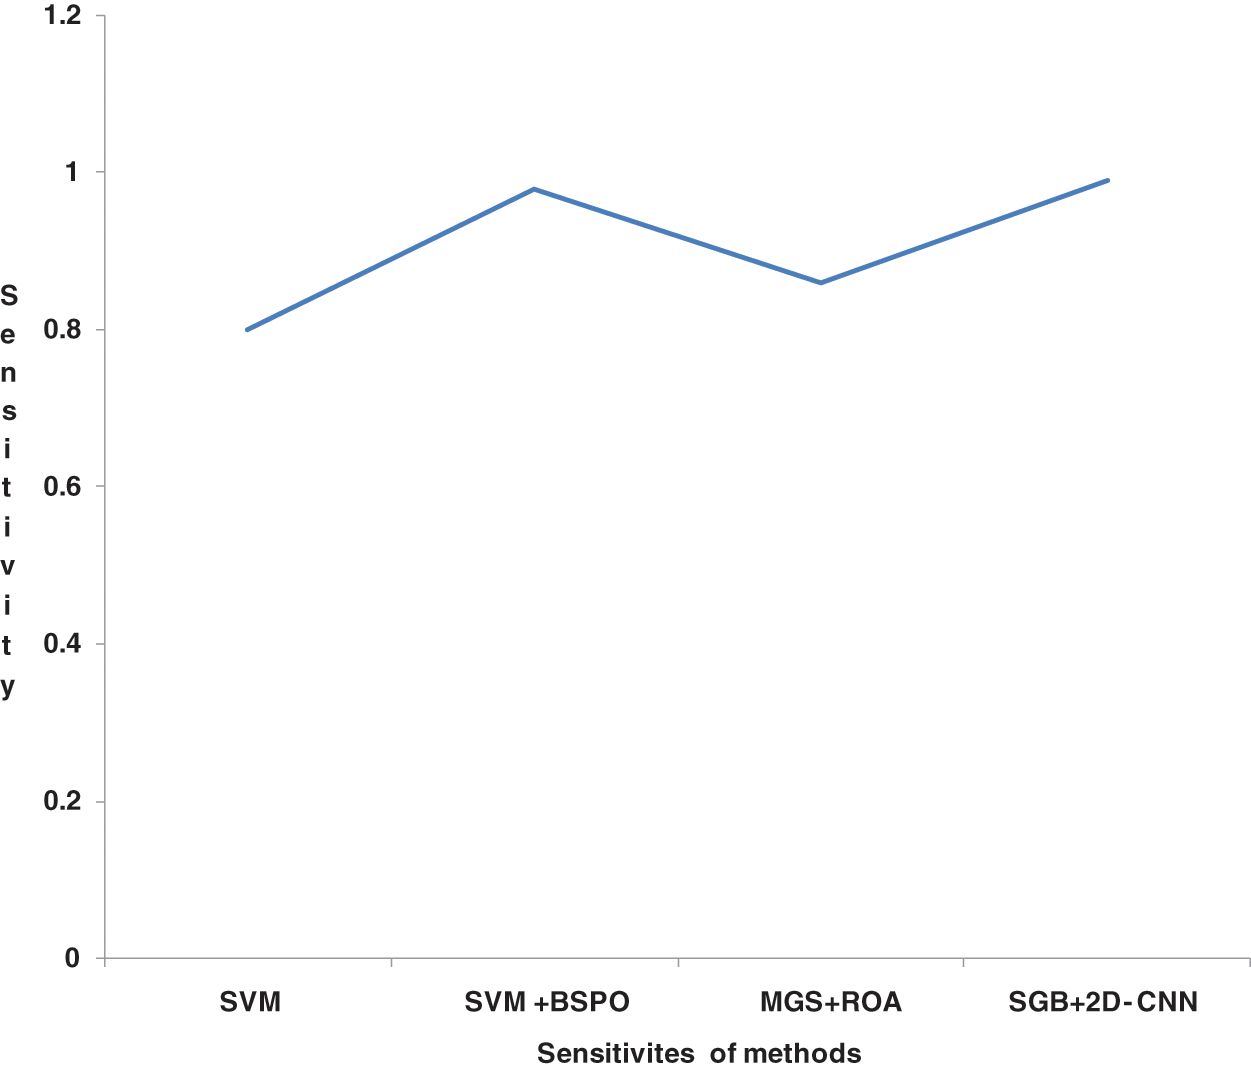
Figure 6: Comparison of sensitivity of various methods
The specificity of prediction is shown in Fig. 7 and its metric achieved as 97.3% for proposed work. For the different iterations, the corresponding average values are measured and respective values are plotted in the graphs. Compared to the methods proposed in [6,9,16], predicted correctly matched and wrongly matched accuracies are high in the proposed method.
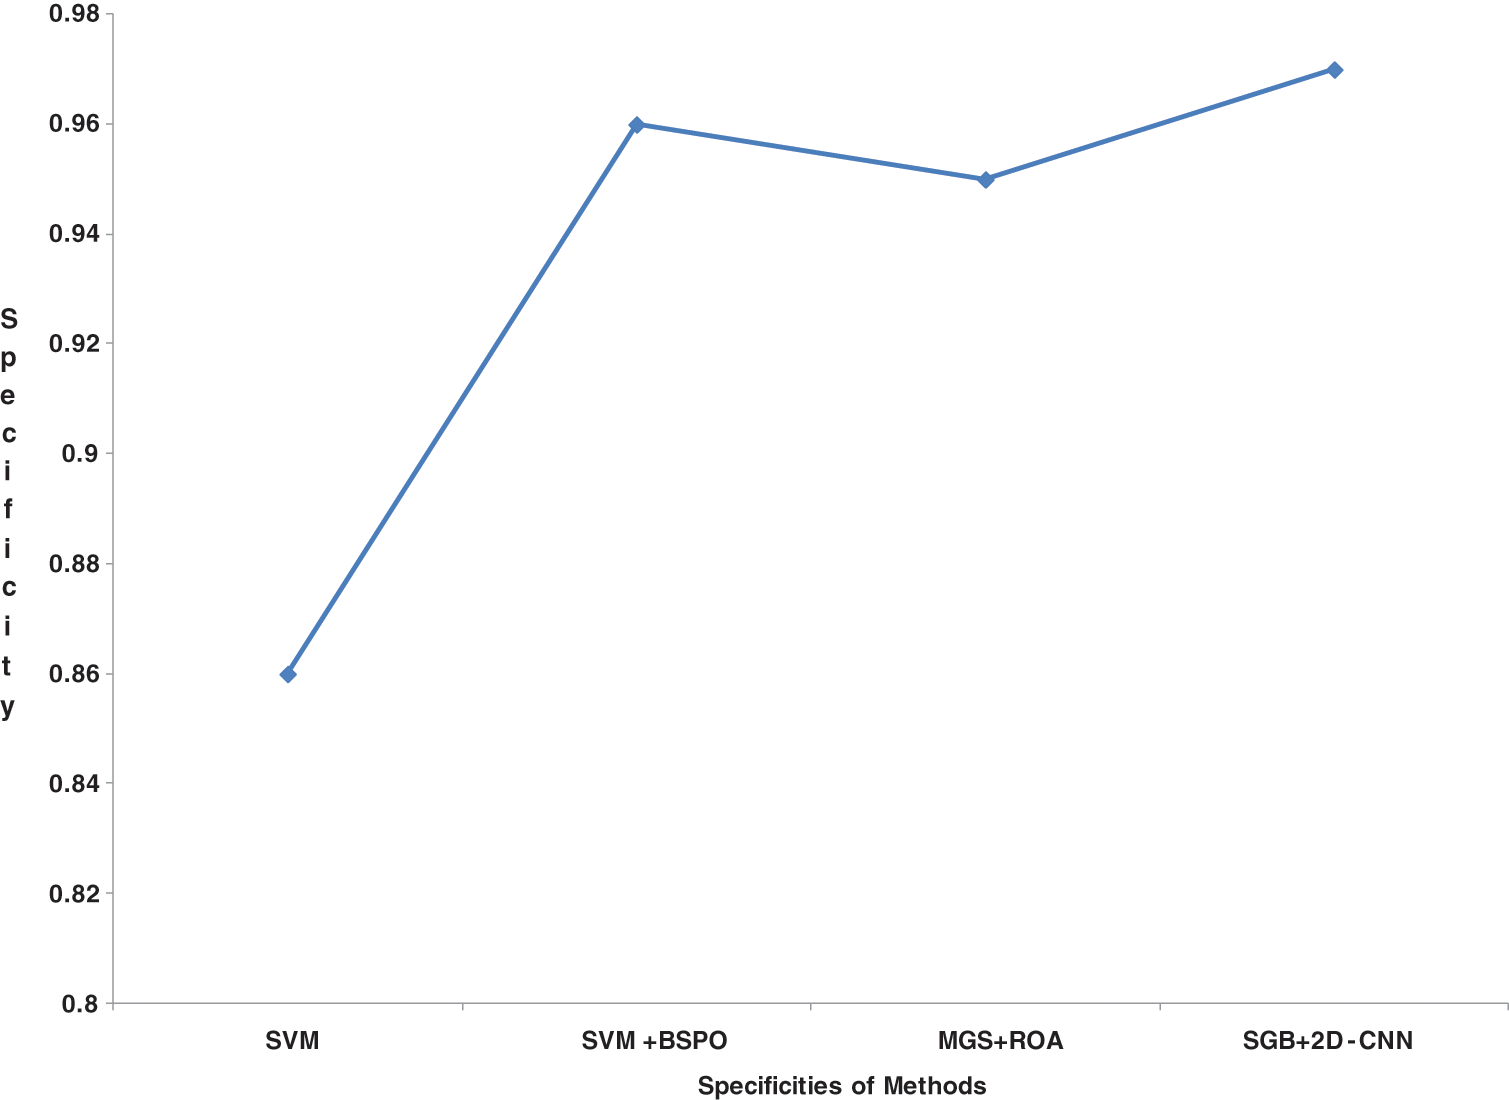
Figure 7: Comparison of specificity of various methods
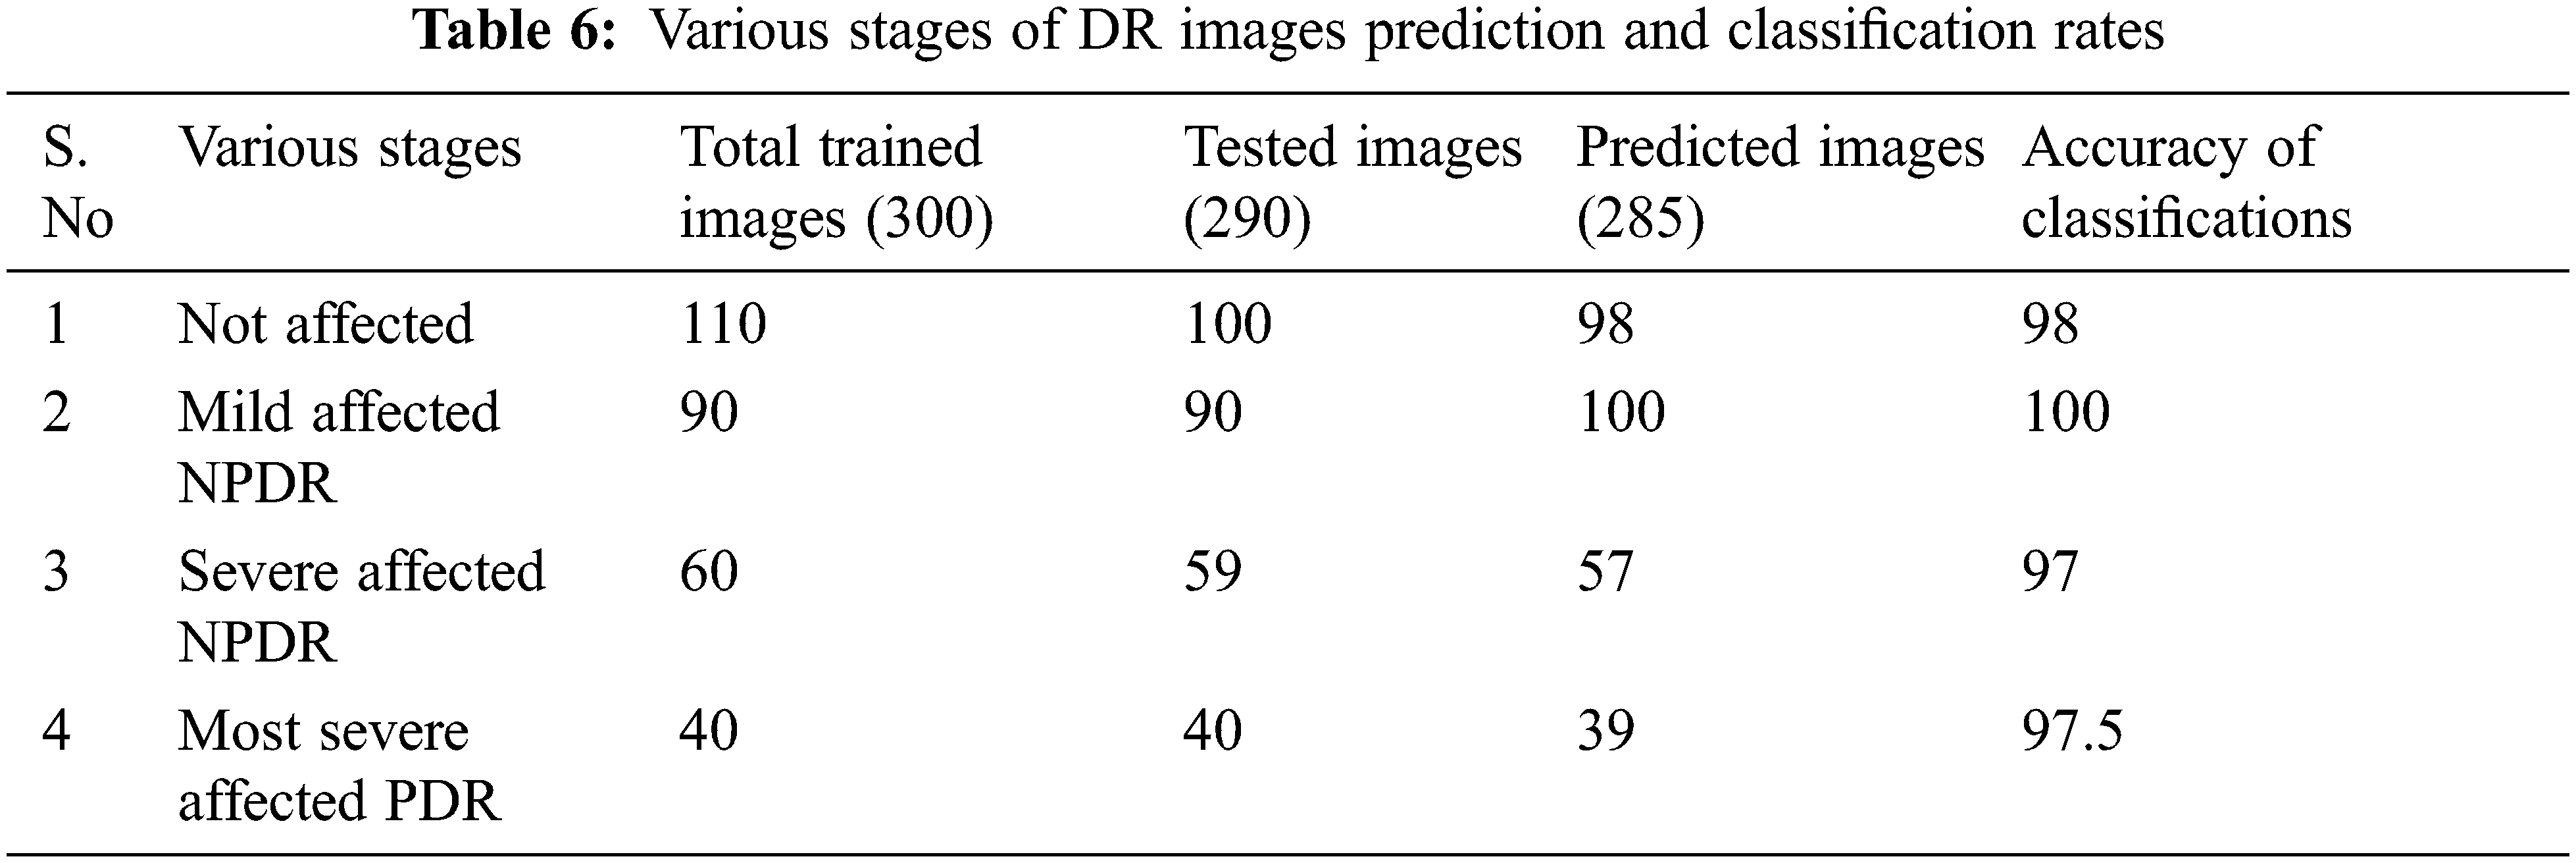
Another main important classification is stage wise prediction. In this work four stages are taken to predict DR and it is mentioned in Tab. 2. For the stage wise classification, the 2D-CNN concept is used. For stage wise classification, around 300 images are trained and 300 images are tested. The tested and trained images are used for match with DR images. The various stages of classification and corresponding accuracy of predictions are shown in Tab. 6. The stage wise DR images are effectively classified and the accuracy of the images measured and its accuracy measure is high with 2D-CNN method.
This research is carried out to predict the DR and observation was made by comparing accuracy, sensitivity and specificity of SVM, BPSO, KNN, NN, ANRS, DBN of ML and DL algorithms along with the proposed hybrid technique. This hybrid technique is a combination of EL and 2D-CNN algorithms. The inference is that accuracy of the proposed technique has achieved 97.8% and existing ML and DL has only produced accuracy as 85.2% to 94.0% [4,8,19] and hence comparatively proposed technique has achieved high accuracy. Likewise, specificity of the proposed method has gained 97.3% whereas other ML and DL algorithms have achieved lesser [6,10,15]. The comparative graph shows that sensitivity of the proposed algorithm has gained as 99.6%, whereas other ML and DL have achieved lesser [14,23,26].
In this world, one of the primary reasons for blindness is DR disease. More people are affected every year and the retina of the eye is also affected, at the end, people lose their vision also. The different works were proposed previously, but the accuracy of the prediction of DR was low and stage wise sorting, prediction, accuracy was also very low. So, in this hybrid proposed work, a new ensemble with 2D-CNN based prediction method is used to predict the DR and also classify the stages of images with the DR Dataset. The SGB ensemble method was used to predict the DR. Initially, the boosting based EL method is used to predict the DR of images. Later, 2D-CNN is used to categorize the various stages of DR images. The TL is used to transfer the classification prediction to train the datasets using 2D-CNN. Around 300 images are trained, 290 images are tested and 285 classifications of images are validated. The experiment has produced 97.8% accuracy. The classification is also increased in the proposed work, when compared to the other methods for DR prediction. In future, the prediction features and other dynamic parameters of the retina should be used in the accuracy and prediction rates. This research work can be applied in many eye issues related to the medical diagnosis system. This research work would be a strong remedy for diabetic’s patient. Real time chip based DR diagnosis systems are needed, so in near future, current research work could be extended for automation along with DL algorithms. As Coronavirus Disease (COVID-19) cases are growing recently, it is essential to extend this work with COVID-19 [34,35] cases because RD may be caused because of COVID-19. In other aspects this work can be also extended with automated video based RD detection [36] with DL mechanism [37].
Funding Statement: The authors received no specific funding for this study.
Conflicts of Interest: The authors declare that they have no conflicts of interest to report regarding the present study.
References
1. B. Ashish, B. Siva, B. Boris, V. Sunny, V. Subhashini et al., “Predicting the risk of developing diabetic retinopathy using deep learning,” The Lancet Digital Health, vol. 3, no. 1, pp. e10–e19, 2021. [Google Scholar]
2. X. Lin, X. Yufeng, X. Pan, X. Jingya, Y. Ding et al., “Global, regional, and national burden and trend of diabetes in 195 countries and territories: An analysis from 1990 to 2025,” Scientific Reports, vol. 10, no. 1, pp. 1–11, 2020. [Google Scholar]
3. T. Nazir, A. Irtaza, A. Javed, H. Malik, D. Hussain et al., “Retinal image analysis for diabetes-based eye disease detection using deep learning,” Applied Sciences, vol. 10, no. 18, pp. 6185, 2020. [Google Scholar]
4. R. K. Chaurasiya, M. I. Khan, D. Karanjgaokar and B. K. Prasanna, “BPSO-based feature selection for precise class labeling of diabetic retinopathy images,” in Advanced Engineering Optimization Through Intelligent Techniques, Springer, Singapore, pp. 253–264, 2020. [Google Scholar]
5. P. Porwal, S. Pachade, R. Kamble, M. Kokare, G. Deshmukh et al., “Indian diabetic retinopathy image dataset (IDRiDA database for diabetic retinopathy screening research,” Data, vol. 3, no. 3, pp. 25, 2018. [Google Scholar]
6. R. E. Hacisoftaoglu, M. Karakaya and A. B. Sallam, “Deep learning frameworks for diabetic retinopathy detection with smartphone-based retinal imaging systems,” Pattern Recognition Letters, vol. 135, pp. 409–417, 2020. [Google Scholar]
7. T. R. Gadekallu, N. Khare, S. Bhattacharya, S. Singh, P. K. R. Maddikunta et al., “Early detection of diabetic retinopathy using PCA-firefly based deep learning model,” Electronics, vol. 9, no. 2, pp. 274, 2020. [Google Scholar]
8. A. Herliana, T. Arifin, S. Susanti and A. B. Hikmah, “Feature selection of diabetic retinopathy disease using particle swarm optimization and neural network,” in IEEE Int. Conf. on Cyber and IT Service Management (CITSM), Parapat, Indonesia, pp. 1–4, 2018. [Google Scholar]
9. R. A. Welikala, M. M. Fraz, J. Dehmeshki, A. Hoppe, V. Tah et al., “Genetic algorithm based feature selection combined with dual classification for the automated detection of proliferative diabetic retinopathy,” Computerized Medical Imaging and Graphics, vol. 43, pp. 64–77, 2015. [Google Scholar]
10. B. Tymchenko, M. Philip and S. Dmitry, “Deep learning approach to diabetic retinopathy detection,” ArXiv Preprint ArXiv, pp. 02261 (1–92020. [Google Scholar]
11. G. Saranya, G. Geetha, M. Safa and K. Meenakshi, “Multi-label and multi-class retinal classification and comparative model of retinal diseases,” International Journal of Advanced Science and Technology, vol. 29, no. 6, pp. 2319–2329, 2020. [Google Scholar]
12. K. Viswanath and D. D. M. Murray, “Diabetic retinopathy: Clinical findings and management,” Community Eye Health, vol. 16, no. 46, pp. 21–24, 2003. [Google Scholar]
13. D. A. Salz and J. W. Andre, “Imaging in diabetic retinopathy,” Middle East African Journal of Ophthalmology, vol. 22, no. 2, pp. 145–50, 2015. [Google Scholar]
14. A. S. Jadhav, B. P. Pushpa and B. Sunil, “Optimal feature selection-based diabetic retinopathy detection using improved rider optimization algorithm enabled with deep learning,” Evolutionary Intelligence, vol. 14, pp. 1431–1448, 2021. [Google Scholar]
15. A. Filippo, B. Fethallah, M. Andreas, W. Jeff, H. Zdenka et al., “Deep learning algorithm predicts diabetic retinopathy progression in individual patients,” NPJ Digital Medicine, vol. 2, no. 1, pp. 1–9, 2019. [Google Scholar]
16. V. M. Mane and D. V. Jadhav, “Holoentropy enabled-decision tree for automatic classification of diabetic retinopathy using retinal fundus images,” Biomed Tech (Berl), vol. 62, no. 3, pp. 321–332, 2017. [Google Scholar]
17. D. L. Torre, A. V. Jordi and P. Domenec, “A deep learning interpretable classifier for diabetic retinopathy disease grading,” Neuro Computing, vol. 396, pp. 465–476, 2020. [Google Scholar]
18. X. Zeng, H. Chen, Y. Luo and W. Ye, “Automated diabetic retinopathy detection based on binocular siamese-like convolutional neural network,” IEEE Access, vol. 7, pp. 30744–30753, 2019. [Google Scholar]
19. J. Wang, B. Yujing and X. Bin, “Feasibility of diagnosing both severity and features of diabetic retinopathy in fundus photography,” IEEE Access, vol. 7, pp. 102589–102597, 2019. [Google Scholar]
20. V. Gulshan, R. P. Rajan, K. Widner, R. Tyler, W. Kira et al., “Performance of a deep-learning algorithm vs manual grading for detecting diabetic retinopathy in India,” JAMA Ophthalmol, vol. 137, no. 9, pp. 987–993, 2019. [Google Scholar]
21. S. Sengupta, M. D. Sindal, P. Baskaran, U. Pan and R. Venkatesh, “Sensitivity and specificity of smartphone-based retinal imaging for diabetic retinopathy a comparative study,” Ophthalmol Retina, vol. 3, pp. 2, pp. 146–153, 2019. [Google Scholar]
22. S. M. S. Islam, M. M. Hasan and S. Abdullah, “Deep CNN-based early detection and grading of diabetic retinopathy using retinal fundus images,” in Safety, Security, and Reliability of Robotic Systems, Boca Raton, Florida: CRC Press, pp. 107–118, 2020. [Google Scholar]
23. J. Xu, X. Zhang, H. Chen, J. Li, J. Zhang et al., “Automatic analysis of microaneurysms turnover to diagnose the progression of diabetic retinopathy,” IEEE Access, vol. 6, pp. 9632–9642, 2018. [Google Scholar]
24. M. D. Giles, H. McCarthy, T. Sehrish, Y. Dijkwel, C. H. Mesarich et al., “Conservation and expansion of a necrosis-inducing small secreted protein family from host-variable phytopathogens of the sclerotiniaceae,” Molecular Plant Pathology, vol. 21, no. 4, pp. 512–526, 2020. [Google Scholar]
25. E. Decencière, X. Zhang, G. Cazuguel, B. Lay, B. Cochener et al., “Feedback on a publicly distributed image database: The messidor database,” Image Analysis & Stereology, vol. 33, no. 4, pp. 231–234, 2014. [Google Scholar]
26. G. Meenakshi and G. Thailambal, “A study on various classifications and prediction techniques for diabetic retinopathy,” in Proc. Int. Conf. on Trends in Electronics and Informatics (ICOEI), Tirunelveli, India, pp. 859–865, 2021. [Google Scholar]
27. B. Antal and A. Hajdu, “An ensemble-based system for microaneurysm detection and diabetic retinopathy grading,” IEEE Transaction Biomedical Engineering, vol. 59, no. 6, pp. 1720–1726, 2012. [Google Scholar]
28. D. S. Sisodia, S. Nair and K. Pooja, “Diabetic retinal fundus images: Preprocessing and feature extraction for early detection of diabetic retinopathy,” Biomedical and Pharmacology Journal, vol. 10, no. 2, pp. 615–626, 2017. [Google Scholar]
29. W. Huang, J. Cheng, Y. Yang and G. Guo, “An improved deep convolutional neural network with multi-scale information for bearing fault diagnosis,” Neuro Computing, vol. 359, pp. 77–92, 2019. [Google Scholar]
30. W. L. Alyoubi, W. M. Shalash and M. F. Abulkhair, “Diabetic retinopathy detection through deep learning techniques: A review,” Informatics in Medicine Unlocked, vol. 20, pp. 1–11, 2020. [Google Scholar]
31. M. Mursalin, Y. Zhang, Y. Chen, and N. V. Chawla, “Automated epileptic seizure detection using improved correlation-based feature selection with random forest classifier,” Neuro Computing, vol. 241, pp. 204–214, 2017. [Google Scholar]
32. M. Nilashi, H. Ahmadi, L. Shahmoradi, O. Ibrahim and E. Akbari, “A predictive method for hepatitis disease diagnosis using ensembles of neuro-fuzzy technique,” Journal of Infection and Public Health, vol. 12, no. 1, pp. 13–20, 2019. [Google Scholar]
33. N. Sikder, M. Masud, A. K. Bairagi, A. S. M. Arif, A. A. Nahid et al., “Severity classification of diabetic retinopathy using an ensemble learning algorithm through analyzing retinal images,” Symmetry, vol. 13, no. 670, pp. 1–26, 2021. [Google Scholar]
34. M. Adimoolam, G. Karthi, A. John, M. Senthilkumar, A. Ahmadian et al., “A hybrid learning approach for the stage-wise classification and prediction of COVID-19 X-ray images,” Expert Systems, vol. 39, no. 4, pp. 1–15, 2021. [Google Scholar]
35. M. Senthilkumar, A. John, A. Abugabah, M. Adimoolam, S. S. Shubham et al., “An approach to forecast impact of covid-19 using supervised machine learning model,” Software: Practice and Experience, vol. 52, no. 4, pp. 824–840, 2022. [Google Scholar]
36. N. M. Balamurugan, T. K. S. Rathish babu, M. Adimoolam and A. John, “A novel efficient algorithm for duplicate video comparison in surveillance video storage systems,” Journal of Ambient Intelligence and Humanized Computing, pp. 1–15, 2021. [Google Scholar]
37. A. John, D. P. Dominic, M. Adimoolam and N. M. Balamurugan, “Prediction strategies of stock market data using deep learning algorithm,” Recent Advances in Computer Science and Communications, vol. 14, no. 6, pp. 1852–1859, 2021. [Google Scholar]
Cite This Article
 Copyright © 2023 The Author(s). Published by Tech Science Press.
This work is licensed under a Creative Commons Attribution 4.0 International License , which permits unrestricted use, distribution, and reproduction in any medium, provided the original work is properly cited.
 Downloads
 Citation Tools