
 Submit a Paper
 Propose a Special lssue
 Open Access
ARTICLE

Machine Learning Based Diagnosis for Diabetic Retinopathy for SKPD-PSC
1 Department of Computer Science and Engineering, Erode Sengunthar Engineering College, Perundurai, Erode, 638057, Tamil Nadu, India
2 Department of Information Systems, College of Computer Sciences and Information Technology, King Faisal University, Al Hasa, Saudi Arabia
3 Department of Information Systems, College of Computer and Information Science, Princess Nourah bint Abdulrahman University, P.O. BOX 84428, Riyadh, 11671, Saudi Arabia
4 Department of Computer Science & Engineering, Swami Keshvanand Institute of Technology, Management & Gramothan (SKIT), Jaipur, 302017, Rajasthan, India
* Corresponding Author: M. P. Thiruvenkatasuresh. Email:
Intelligent Automation & Soft Computing 2023, 36(2), 1767-1782. https://doi.org/10.32604/iasc.2023.033711
Received 25 June 2022; Accepted 19 August 2022; Issue published 05 January 2023
 View Full Text
 Download PDF
Abstract
The study aimed to apply to Machine Learning (ML) researchers working in image processing and biomedical analysis who play an extensive role in comprehending and performing on complex medical data, eventually improving patient care. Developing a novel ML algorithm specific to Diabetic Retinopathy (DR) is a challenge and need of the hour. Biomedical images include several challenges, including relevant feature selection, class variations, and robust classification. Although the current research in DR has yielded favourable results, several research issues need to be explored. There is a requirement to look at novel pre-processing methods to discard irrelevant features, balance the obtained relevant features, and obtain a robust classification. This is performed using the Steerable Kernalized Partial Derivative and Platt Scale Classifier (SKPD-PSC) method. The novelty of this method relies on the appropriate non-linear classification of exclusive image processing models in harmony with the Platt Scale Classifier (PSC) to improve the accuracy of DR detection. First, a Steerable Filter Kernel Pre-processing (SFKP) model is applied to the Retinal Images (RI) to remove irrelevant and redundant features and extract more meaningful pathological features through Directional Derivatives of Gaussians (DDG). Next, the Partial Derivative Image Localization (PDIL) model is applied to the extracted features to localize candidate features and suppress the background noise. Finally, a Platt Scale Classifier (PSC) is applied to the localized features for robust classification. For the experiments, we used the publicly available DR detection database provided by Standard Diabetic Retinopathy (SDR), called DIARETDB0. A database of 130 image samples has been collected to train and test the ML-based classifiers. Experimental results show that the proposed method that combines the image processing and ML models can attain good detection performance with a high DR detection accuracy rate with minimum time and complexity compared to the state-of-the-art methods. The accuracy and speed of DR detection for numerous types of images will be tested through experimental evaluation. Compared to state-of-the-art methods, the method increases DR detection accuracy by 24% and DR detection time by 37.Keywords
Diabetic Retinopathy (DR) is a common obstacle of diabetes connected with retinal vascular damage caused by long-standing diabetes mellitus and dissimilarities in retinal blood vessels. These dissimilarities can, in turn, result in blood vessel leakage, distorting vision. DR is the most widespread cause of vision loss in individuals with diabetes. Hence, it is also considered a notable cause of blindness among working-age adults. However, early DR detection can protect against vision loss.
A Deep Network Patch (DNP) based method was proposed in [1] with the aid of a Lesion Localization Model (LLM). The objective of designing this patch-based method was to minimize the complexity while enhancing the performance of DR recognition. For this purpose, a practical model using two Convolutional Neural Network (CNN) models for selecting training patches has been developed. Here, complicated examples were given due to concentration during the training process. With the aid of region labelling, without special training requirements, complexity was even said to be reduced. Next, using red LLM, though the complexity involved in DR detection was minimized, the accuracy rate is one of the major factors in detection. The focus was not on DR detection accuracy because only informative samples were included in the CNN training iteration, compromising DR detection accuracy. In this work, a separate pre-processing model using SFKP is applied that extracts more meaningful pathological features by minimizing inter-class similarities and intra-class variations (i.e., minimizing redundant and irrelevant features) amongst different classes by constructing local orientation maps. In this way, the complexity and accuracy involved in DR detection are said to be improved. In [2], a new CNN and a transfer learning method were used to create a Binary Classification (BC) method that works like Siamese. The method accepted binocular fundus images as inputs, and the correlated values were learnt to make an effective prediction. These results also illustrate that the BC method had a significant advantage in helping ophthalmologists diagnose DR more effectively and enhance the DR screening rate.
Despite improvements in the screening rate, DR accuracy remained unchanged. To address this issue, in this work, PDIL is first applied to the extracted features so that efficient differentiation between the Actual Retinal Features (ARF) and False Retinal Features (FRF) is made using a second derivative. Next, a ML model based on PSC differentiates between the DR and non-DR. This is done by putting the classifier scores through a logistic transformation, which improves the accuracy of DR detection. This paper presents a novel method called SKPD-PSC for DR detection. Pre-processing of the images is performed using Gaussian derivatives and four different inclinations. After Pre-processing, the images are passed through an image localization model in two stages. In the first stage, the algorithm detects the derivate vector through the second stage, where the image is graded based on the second directional derivative. Finally, employing PSC, correct classifications for effective DR diagnosis and detection are presented [3].
A novel pre-processing technique is used to eliminate noise in DR detection by balancing the features that are used to create a more accurate model. This is accomplished by utilising the SKPD-PSC technique.
The significant contributions of the proposed work can be summarized as follows:
• A pre-processing model applies Steerable Kernalized Filter (SKF) to enhance the key features of the raw RI by removing the irrelevant and redundant features. DDG is used to extract the more meaningful pathological features. An orientation-selective kernel is used for addressing high inter-class similarities and intra-class variations.
• The feature extraction uses the Partial Derivative Retinal Localization (PDRL) algorithm to localize the candidate features for DR. A two-stage image localization model uses second-order Partial Derivatives (PD) and preserves the ARF but also excludes the false features. In addition, the designed model is used to enhance the True Positive Rate (TPR) and suppress the background noise.
• A novel PSC model effectively performs image classification by tackling non-linearity, a common problem in biomedical image classification. In addition, the PSC model is used for detecting the DR and the non-DR with higher DR detection accuracy. The target probabilities are evaluated depending on the estimated probability of outcomes. For each positive sample, the target probabilities and samples detected with DR are evaluated depending on the probability estimate outcomes. For each negative sample, the target probabilities and samples are not detected with DR.
In the following sections, we will moderately present our ideas and show the experimental results. In Section 2, a related literature review for DR classification detection is presented with an in-depth related literature review on DR detection. Section 3 fully illustrates the proposed ML method for DR detection with the algorithms. The experimental results are shown in Section 4, and we discuss specific significant findings in Section 5. Finally, a conclusion is given in Section 6.
Automatic localization of the regions of a RI might include a certain number of lesions that can significantly help the medical experts in DR detection. An investigation of the Deep Learning (DL)-Artificial Intelligence (AI) method was presented in [4] for DR treatment and prognosis. A novel automatic detection of DR and maculopathy in eye fundus images utilizing fuzzy image processing was designed. However, the errors involved in DR grading were not analyzed. To address this issue [5,6], reference standards for evaluating ML models in DR were investigated. A systematic review of the current trend and progress made in DR screening was presented in [7]. It also provided an integrated overview of current state-of-the-art knowledge of novel materials and methods using AI. A manual diagnosis of DR requires highly specialised expertise to detect and quantify minute details that make the task comprehensive and time-consuming. In [8], a computer-assisted tool was designed to classify the RI to diagnose DR swiftly and precisely. A Neural Network (NN) with CNN architecture identified the exudates, micro-aneurysms, and haemorrhages in the retina image. Yet a novel method for DR from eye fundus images using a generalization of the Bag-of-Visual-Words (BoVW) method was designed [9] to perform feature extraction, feature encoding, and classification. Finally, the classification error was also analyzed.
In [10], a novel Deep Convolutional Neural Network (DCNN)-the based algorithm was proposed. In the conventional DCNN model, the customarily applied max-pooling layers were replaced with fractional max-pooling. Next, the different layers were trained to obtain more discriminative features. Finally, a Support Vector Machine (SVM) classifier was applied to learn the boundary distributions of each class. Reference [10] for identifying DR., Two different forms of retinal features obtained from Optical Coherence Tomography and Fluorescein Angiography were used. A review of various learning techniques for diagnosing the diabetic effect on the eye was presented. A generalised method of characterization of semi-automatic exudates to diagnose DR with the aid of an exudate screening system of the RI was presented. This method used retinal blood vessel suppression based on morphological processing and classification based on an adaptive neuro-fuzzy inference system to tell the difference between normal and abnormal retinal structures.
A pilot study using DL-NN for multi-categorical data was proposed. A hierarchical ensemble of CNNs was employed in [11] the domain of biomedical imaging, using morphological opening and a Gaussian kernel to improve the accuracy rate. A novel automated method for DR screening using an ML system was designed. Yet another Computer-Aided Diagnosis (CAD) for DR using deep CNN was proposed [12]. This was achieved by training an SVM classifier to study class distribution, concentrating on recognition rate. A review of DR in human eyes was proposed. The hybrid ML techniques were introduced to improve disease detection accuracy. A novel approach was introduced [13] that depended on the multifractal geometry to classify the DR. But, the disease Detection Time (DT) was not reduced. A CNN ensemble-based framework was introduced for categorizing the DR’s distinct stages in color fundus images. However, the accuracy was not enhanced at an early stage. Multi-Scale Shallow CNN’s integrated model was developed for identifying DR depending on the classification of RI. The different ML methods were introduced to discover the DR disease. However, the designed method was unable to detect the early stage. The ML algorithms were employed [14] to identify DR for the early stages.
3 Proposed Steerable Kernalized Partial Derivative and Platt Scale Classifier Method
In this section, recognition of DR using the SKPD-PSC method is presented. An ML automated method to classify the input RI into two types, DR and non-DR, is presented. Fig. 1 shows the block diagram of the SKPD-PSC method. As shown in Fig. 1, the proposed SKPD-PSC method consists of three steps, i.e., pre-processing, localization and classification. In the pre-processing step, a steerable filter is applied to the input RI, i.e., pathological features are extracted and then the retinal features are localized using a second-order partial derivative. Finally, in the classification step, a set of discriminative features is extracted, a scalar parameter is trained, and a logistic function is used to identify the true DR from the amount of non-DR.

Figure 1: Block diagram of SKPD-PSC method
3.1 Steerable Filter Kernel Pre-processing Model
The detection of DR with computerized methods is a cumbersome task due to high inter-class similarities and intra-class variations amongst different classes of DR. Although detection and localization of DR are performed employing various pre-processing models, a classification system with substantial images belonging to each class and expert annotations remains a major issue. In this work, to address this issue, first pre-processing is performed by applying SKF, which is an orientation-selective convolution kernel model utilized specifically for removing irrelevant features and redundant features (i.e., high inter-class similarities and intra-class variations). In this way, more meaningful and pathological features are extracted via a linear combination of a small set of rotated versions of itself. Fig. 2, given below, shows the block diagram of the SKF Pre-processing model.

Figure 2: Steerable filter kernel pre-processing model
A SKF model is used for DR detection with the goal of removing completely unconnected features and redundant features (i.e., high inter-class similarities and intra-class variations between different classes of DR). As a result, the proposed method uses the SKF model to carry out preprocessing.
Since separate models for each type of lesion have distinctive edges and patterns, the utilization of SKF can assist in eliminating the irrelevant and redundant features and help recognize more meaningful pathological features. SKF is based on the evaluation of DDG, and accordingly, these filters are utilized to build local orientation maps (i.e., in localizing the relevant feature of interest) via a linear combination of Gaussian second derivatives. For a ‘
From Eq. (1) above, ‘a’ and ‘b’ denote the RI, and ‘v’ represents the Gaussian Function (GF) variance. The SKF formulation with an inclination of ‘
From the above Eq. (2), ‘
If the parameter ‘

Figure 3: SKF features extracted
In addition, the final extracted feature created by SKFs for a ‘
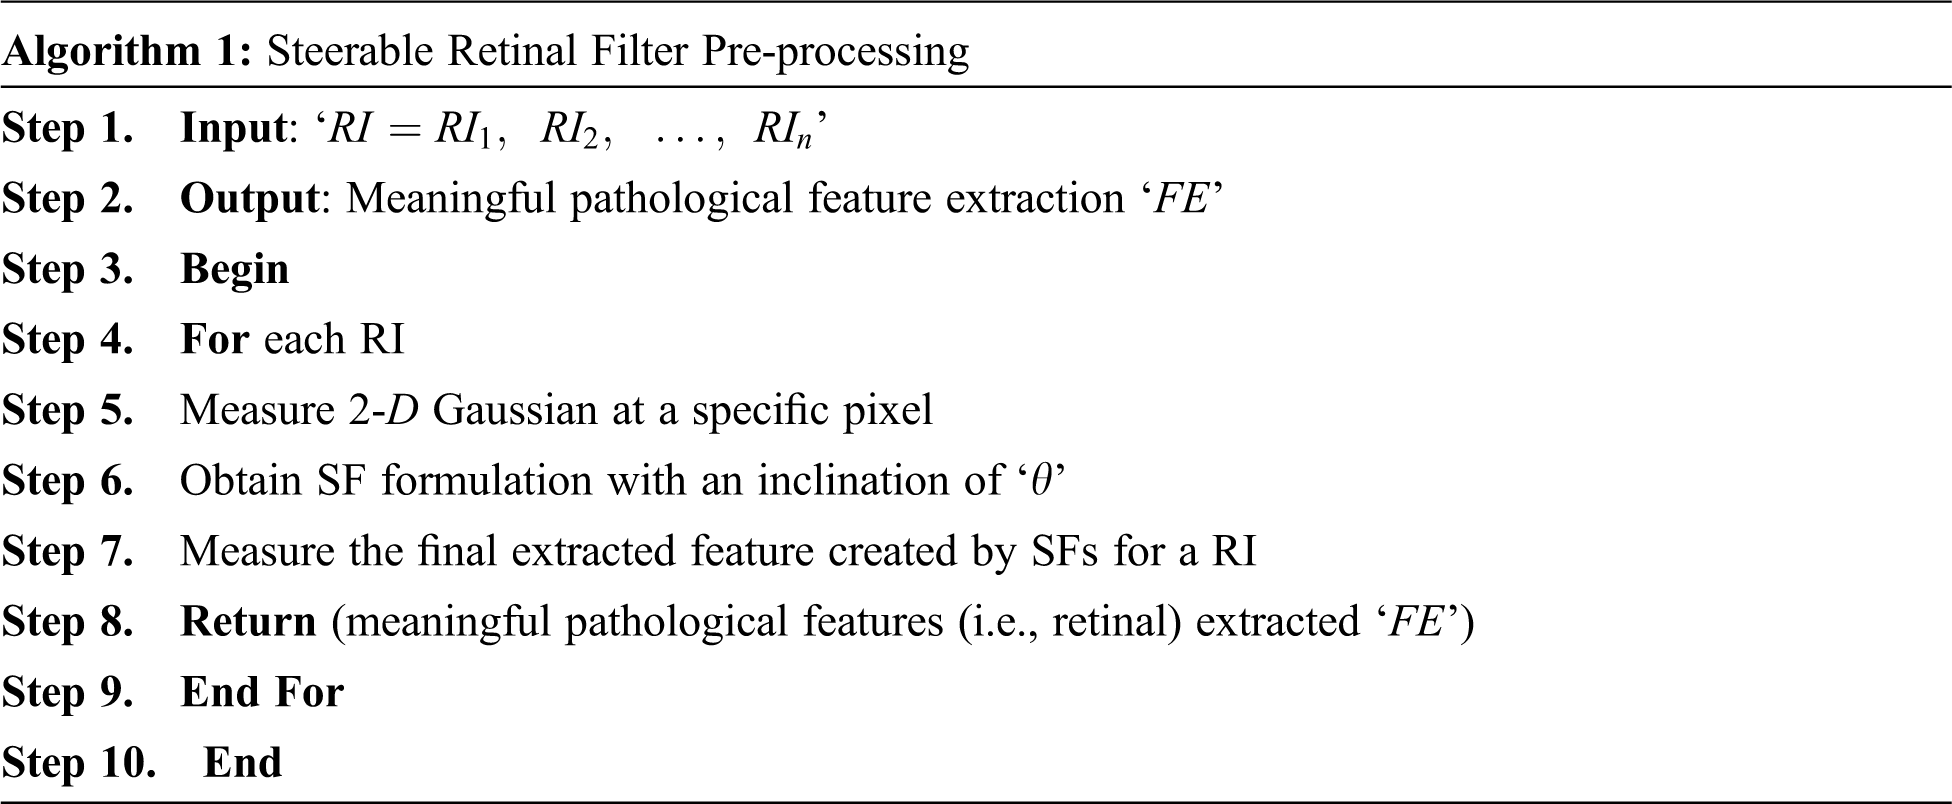
As given in the above SRFP algorithm, with retinopathy images using the Diabetic Retinopathy Database (DIARETDB0) as the input, the objective of this algorithm remains to remove redundant and irrelevant features, therefore contributing to higher DR detection accuracy. To start with, a GF variance is applied to the input images. Next, to minimize high inter-class similarities and intra-class variations amongst different classes of DR, an orientation-selective kernel is applied. Finally, meaningful pathological features are extracted with minimum time and complexity.
3.2 Partial Derivative Image Localization
Besides the redundant and irrelevant features, many dark background noises or other dark round objects exist in the extracted image. We need to localize the candidate features and, at the same time, suppress these background noises as much as possible. Considering that some redundant and irrelevant features may be similar to the intensities of some subtle background noises, localization of candidate images is not said to be feasible based on their intensities. In this work, we measure the second derivatives of pathological features extracted in different directions for RI localization that can preserve the ARF for further classification and exclude false ones as much as possible. Fig. 4 given below shows the block diagram of the PDIL model.

Figure 4: Block diagram of PDIL
Given an extracted feature ‘FE’, for each point ‘a, b’, a continuous surface is first fitted in a local window with a size of ‘5 * 5’ centred at that point. The PD of the extracted feature ‘
From the above Eq. (7), the derivative vector for multi-variable functions ‘
The second directional derivative of ‘
From Eqs. (9) and (10) we can get the second directional derivative for the extracted feature. The final location is given below in Eq. (11), which is a mathematical expression. Fig. 5 given below shows the PDIL model.

Figure 5: Result of candidate PD localization (a) Retinal feature extracted image (b) The final location of the candidate
As given in the above Fig. 5, (a) shows the pathological input features and (b) represents the candidate’s location differentiated by two different colors. Here, all candidates are indicated in yellow, and true candidates are indicated as black dots. The pseudo-code representation of PDIL is given below.

As given in the above PDIL algorithm, by initializing meaningful pathological features, local window size, and unit vector, the objective remains to localise the candidate features for DR using the Partial Derivative function. First, the derivative vector is obtained in a local window with a size of ‘
The localised RI are in the form of nonlinear patterns, so the classification of RI is made by applying a nonlinear classification model. In this third stage, the PSC, an ML model, is used to do the classification task. This model transforms the output into a probability distribution over classes and is used so that the classification of localized RI and, therefore, the DR detection accuracy can be made virtually. The algorithm takes a projection of the localized RI onto the Platt Scale as input parameters, and the classification of each localized RI will be the output of this stage. The classification is based on the PSC learning processes. Fig. 6, given below, shows the block diagram of the PSC model.
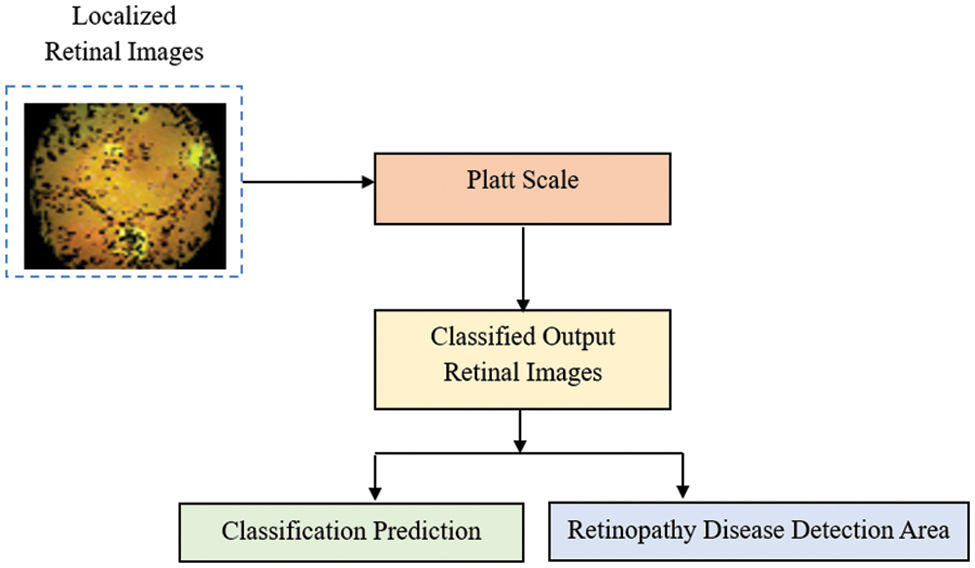
Figure 6: Block diagram of PSC model
Let us consider the problem of binary classification; for inputs ‘F’, we want to determine whether they belong to one of two classes, i.e., ‘+1’ and ‘−1’. The further assumption regarding the classification is made in such a manner that the classification results are arrived at by means of a function ‘Fun’ by predicting a class label ‘
From the above Eq. (12), ‘
From the above Eq. (13), ‘e’ refers to the natural logarithm, ‘F0’ refers to the ‘F’ value of the sigmoid’s midpoint, with ‘L’ and ‘k’ representing the curve’s maximum value and curve steepness. The DR prediction is now said to be made based on a probability estimate mathematically expressed as given below Eq. (14)
On the other hand, if ‘y ≠ 0’, the probability estimates contain a correction compared to the old decision function ‘
From the above Eqs. (15) and (16), “T” represents the target probabilities, “S” indicates the samples, “N” denotes the number of samples, “S+” and “S−” refer to the positive and negative samples, respectively. The homogeneous value ‘+1’ refers to the Laplace Smoothing. With these obtained target probabilities, DR detection accuracy is said to be improved. The pseudo-code representation of the Platt Scale DR classification is below.

As given in the above Platt Scale DR Classification, for each localized retinal feature provided as input and positive and negative samples initialized (i.e., according to test and training samples), the algorithm’s objective remains in the robust classification of DR, therefore improving DR detection accuracy. This is said to be achieved in this work by measuring the target probabilities based on the probability estimate results. According to the results of the target probabilities, samples detected with DR are differentiated from those without, contributing to higher DR detection accuracy.
An experimental evaluation of the SKPD-PSC method for DR is made by performing comparisons with the DNP-based method and the Siamese-like BC method. The experimental measurement is conducted using the DIARETDB0, and simulations are carried out using MATLAB. This DIARETDB0 is a public database for benchmarking DR detection and is used for comparison with the DNP-based and Siamese-like BC methods. The database consists of 130 color fundus images. Out of these 130 color fundus images, 20 images are standard, and 110 contain signs of diabetic retinopathy. These images were captured with a 50-degree field-of-view digital fundus camera with unknown camera settings. The method’s effectiveness is measured regarding DR-DT, detection accuracy, and ROC. The proposed SKPD-PSC method uses the holdout method for cross-validation. Cross-validation is applied to estimate the predictive models by dividing the original sample into a training set to train the model and a test set to evaluate it. The input dataset is divided into two sets: the training set and the testing set. Most DR images are used for training, i.e., 80% of images and a smaller portion of DR images are taken for testing, i.e., 20% of images.
Experiment parameters like DR detection accuracy, DR detection time, and ROC curve are chosen in accordance with the goal of the proposed SKPD-PSC method. Through the use of the PDRL algorithm and the PSC, this research has filtered superfluous information while keeping the key data about the retina intact. With the help of the SKPD-PSC method, this dramatically enhances DR detection accuracy and decreases DR detection time.
The most common cause of blindness worldwide is DR, a retinal disease caused by diabetes mellitus. Vision loss and vision deterioration must be detected and treated early to prevent or delay these effects. In order to detect and classify DR on fundus retina images, the research community has proposed some AI-based detection and classification methods.
4.1 Performance Measure of DR Detection Accuracy
The following equation is used to determine the DR detection accuracy, which is the number of samples correctly labelled out of the total number of samples. From the above Eq. (17), the DR detection accuracy ‘DRDA’ is measured based on the percentage ratio of correct detection ‘DRDcorrec’ to the RI (i.e., color fundus images) provided as input ‘RIi’ for conducting simulations. The different sampling images taken as input encompass both the typical signs of DR as well as noise. Despite the fact that pre-processing is completed in all three techniques, a certain amount of noise is left unnoticed, so the outcomes are neither linear nor non-linear in nature. Table 1 shows the DR detection accuracy comparison when using different classifiers: SKPD-PSC, existing DNP, and Siamese-like BC on the DIARETDB0 database.

Fig. 7 graphically compares the results of DR detection accuracy obtained from three different classification and prediction models in terms of DR detection accuracy. The X-axis refers to the number of images in the range of 13 to 130 collected for simulations, consisting of both normal images and images containing signs of diabetic retinopathy. The number of images is taken from DIARETDB0. This dataset includes 130 color fundus images. The number of images is randomly selected in each iteration (i.e., 13, 26, 39, 52, 65, 78, 91, 104, 117, and 130). The DR detection accuracy here is neither inversely nor directly proportional to the number of images provided as input. This is because the sample image provided as input includes the normal signs of DR and also due to the presence of noise; though pre-processing is being performed in all the three methods, a certain amount of noise is left to be unnoticed; therefore, the results are said to be neither linear nor non-linear.

Figure 7: Graphical representation of DR detection accuracy
However, simulations conducted with ‘13’ samples show that ‘12’ images were correctly detected using SKPD-PSC, ‘11’ images using DNP, and ‘
4.2 Performance Measure of DR Detection Time
The time consumed in detecting the DR is said to be the DR-DT. DR-DT is said to be one of the essential parameters for analyzing diabetic retinopathy. This is since the minimum DR-DT, the faster the detection is said to be, and the sooner the treatment is said to be given. From the above Eq. (18), the DR-DT ‘DRDT’ is measured as input ‘RIi’ and the time consumed in obtaining the target probabilities ‘

Fig. 8 given above shows the graphical image of the DR-DT with the number of images ranging from 13 to 130 as input collected from the DIARETDB0 database. From the figure, it is inferred that the DR-DT is directly proportional to the number of images. This is because increasing the number of images increases the time consumed in segregating between the positive and negative samples; therefore, the DR-DT also increases. However, from the simulation of the ‘13’ number of images, the time consumed in obtaining the target probabilities (i.e., positive and negative) using SKPD-PSC is ‘0.025 ms’, ‘0.033 ms’ using DNP and ‘0.046 ms’ using Siamese-like BC. With this, the DR-DT using SKPD-PSC was observed to be ‘0.325’, ‘0.429’ and ‘0.598 ms’ using DNP, and Siamese-like BC, respectively.
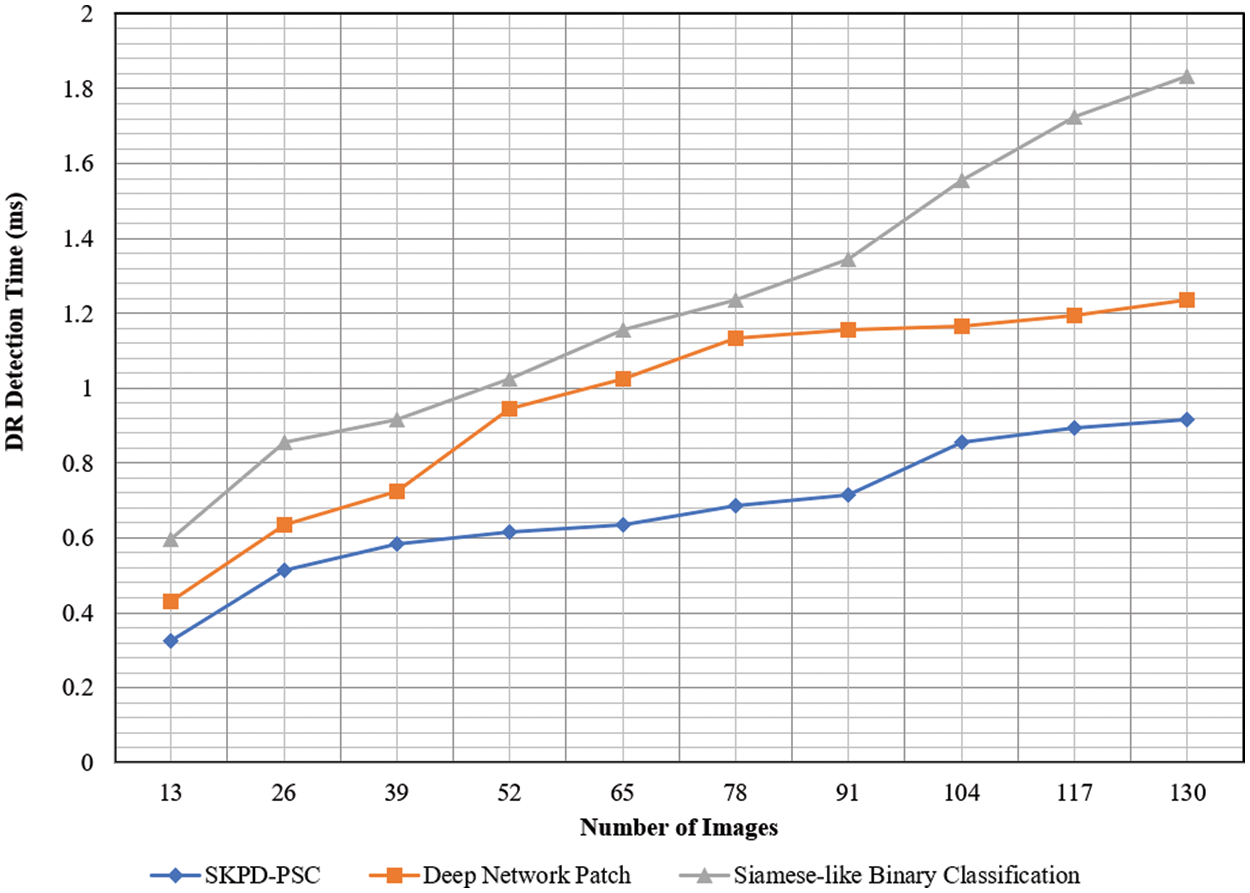
Figure 8: Graphical representation of DR-DT
The results are based on the original data. From the simulations, it is inferred that the DR-DT using SKPD-PSC is comparatively less than DNP and Siamese-like BC. For each iteration, the number of images, i.e., 13, is used to evaluate the DR-DT for three different methods. The SKPD-PSC method, DNP, and Siamese-like BC value is ‘0.325’, ‘0.429’, and ‘0.59 ms’, respectively. For each iteration, the proposed method is compared to two existing methods. The assessed results prove that the average is significantly reduced DR-DT using the SKPD-PSC method by 29% compared to DNP and 44% compared to Siamese-like BC. This is because of the application of the PDRL algorithm. By applying this algorithm, besides removing irrelevant and redundant features, ARF is preserved, excluding the FRF. This, in turn, reduces the DR-DT with the SKPD-PSC method.
4.3 Performance Measure of Receiver Operating Characteristic Curve
The Receiver Operating Characteristic (ROC) curve is one of the important tools to visualize the performance of a binary classifier algorithm. It refers to a plot of TPR against False Positive Rate (FPR). ROC curves are extensively used in DR detection to assess the performance of the recognition rate. The ROC curve corresponds to a graphical representation that establishes the optimal cut-point; hence, it is referred to as the receiver operating characteristic. In order to construct a ROC curve, we have to calculate the TPR and FPR for each of the corresponding existing and proposed methods. Table 3 shows the DR-DT comparison using SKPD-PSC, DNP, and Siamese-like BC with images acquired from the DIARETDB0 database.

Fig. 9 illustrated the ROC curve for the existing DNP, Siamese-like BC and proposed SKPD-PSC. Three curves in three colors, blue, merown, and light green, represent the ROC curve of the existing DNP, Siamese-like BC, and proposed SKPD-PSC, respectively, using the DIARETDB0 database. In the graph, the x-axis represents the FPR, and the y-axis represents the TPR.

Figure 9: Graphical representation of ROC curve
The basic assumption behind the design of ROC analysis is that a diagnostic variable is used to differentiate between DR and non-DR. Hence, ROC analysis assesses the DR detection performance of the system in terms of TPR and FPR for each possible cut point value of the test. The Area Under Curve (AUC) value of any classifier model lies between 0.5 and 1. On the one hand, the values of 0.50 indicate that the differentiation between the DR and non-DR cannot be made, whereas an optimal classifier is said to have a AUC value of near 1.0.
A diagonal line on the graph from (0, 0) in the lower left-hand corner to (1, 1) in the upper right-hand corner is drawn. This line reflects the characteristics of a DR detection test with no discriminating power. The basic assumption behind the design of ROC analysis is that a diagnostic variable is used to discriminate between two states (i.e., DR/Non-DR). Hence, ROC analysis assesses the DR detection performance of the system in terms of TPR and FPR for each possible cut point value of the test. Based on the diagonal values drawn, the Equal Error Rate (EER) for the DIARETDB0 database using SKPD-PSC, existing DNP and Siamese-like BC was found to be ‘1.190’, ‘2.5’ and ‘4.28’, respectively. From the above value, it is found that the EER using the proposed SKPD-PSC is comparatively less than the other two existing methods, DNP and Siamese-like BC. This is because of the application of the Platt Scale DR classification algorithm. By applying this algorithm, target probabilities are arrived at, producing the classified results and the degree of certainty. Therefore, the improvement is observed in the ROC curve analysis.
On techniques to remove noise from DR images, the proposed system’s accuracy is based. In contrast to using a more significant number of DR images, using a small number of images still yields good accuracy.
This paper proposed a novel method called SKPD-PSC for DR detection in color fundus images, which contains three stages, i.e., pre-processing, image localization and classification. Existing methods such as the DNP-based and Siamese-like BC are used as the foundation paper. For a comprehension of the proposed methodology, these two key papers are made clear. By analysing the issues raised in these foundational papers, the proposed method concept is derived. Implementing the suggested method successfully persuades the shortcomings of these approaches. In the first stage, meaningful features are extracted by eliminating the irrelevant and redundant features using the Steerable Filter function, and localized retinal features are also obtained using the second-order PD function. Finally, to classify the DR and the non-DR, a Platt Scale is applied that possesses the advantage of modifying the existing function based on a probable degree of certainty, contributing to TPR. The performance of the proposed SKPD-PSC method is determined in terms of DR detection accuracy, DR-DT, and ROC curve concerning the different number of color fundus images and compared with two conventional methods. The simulation results show that the proposed SKPD-PSC method outperforms previous works in terms of performance.
Funding Statement: This research is supported by Princess Nourah bint Abdulrahman University Researchers Supporting Project number (PNURSP2022R195), Princess Nourah bint Abdulrahman University, Riyadh, Saudi Arabia.
Conflicts of Interest: The authors declare that they have no conflicts of interest to report regarding the present study.
References
1. L. Qiao, Y. Zhu and H. Zhou, “Diabetic retinopathy detection using prognosis of microaneurysm and early diagnosis system for non-proliferative diabetic retinopathy based on deep learning algorithms,” IEEE Access, vol. 8, pp. 104292–104302, 2020. [Google Scholar]
2. J. Xu, G. Hu, Y. Huang, H. Huang and B. Chen Bin, “The multifocal erg in early detection of diabetic retinopathy,” in IEEE Engineering in Medicine and Biology 27th Annual Conf., Shanghai, pp. 7762–7765, 2005. [Google Scholar]
3. S. Yu, D. Xiao and Y. Kanagasingam, “Exudate detection for diabetic retinopathy with convolutional neural networks,” in 39th Annual Int. Conf. of the IEEE Engineering in Medicine and Biology Society (EMBC), Jeju, Korea (Southpp. 1744–1747, 2017. [Google Scholar]
4. M. M. Dharmana and M. S. Aiswarya, “Pre-diagnosis of diabetic retinopathy using blob detection,” in 2nd Int. Conf. on Inventive Research in Computing Applications (ICIRCA), Coimbatore, India, pp. 98–101, 2020. [Google Scholar]
5. H. Yazid, H. Arof and N. Mokhtar, “Edge sharpening for diabetic retinopathy detection,” in IEEE Conf. on Cybernetics and Intelligent Systems, Singapore, pp. 41–44, 2010. [Google Scholar]
6. R. S. Rajkumar, T. Jagathishkumar, D. Ragul and A. G. Selvarani, “Transfer learning approach for diabetic retinopathy detection using residual network,” in 6th Int. Conf. on Inventive Computation Technologies (ICICT), Coimbatore, India, pp. 1189–1193, 2021. [Google Scholar]
7. M. Akter, M. S. Uddin and M. H. Khan, “Morphology-based exudates detection from color fundus images in diabetic retinopathy,” in Int. Conf. on Electrical Engineering and Information & Communication Technology, Dhaka, Bangladesh, pp. 1–4, 2014. [Google Scholar]
8. B. Yaşar, B. Yeşilkaya, Ö. K. Cura and A. Akan, “A new method to detect diabetic retinopathy,” in Medical Technologies National Congress (TIPTEKNO), Magusa, Cyprus, pp. 1–4, 2018. [Google Scholar]
9. Z. A. Omar, M. Hanafi, S. Mashohor, N. F. M. Mahfudz and M. Munaim, “Automatic diabetic retinopathy detection and classification system,” in 7th IEEE Int. Conf. on System Engineering and Technology (ICSET), Shah Alam, Malaysia, pp. 162–166, 2017. [Google Scholar]
10. K. K. Palavalasa and B. Sambaturu, “Automatic diabetic retinopathy detection using digital image processing,” in Int. Conf. on Communication and Signal Processing, Chennai, India, pp. 0072–0076, 2018. [Google Scholar]
11. C. Jayakumari, V. Lavanya and E. P. Sumesh, “Automated diabetic retinopathy detection and classification using ImageNet convolution neural network using fundus images,” in Int. Conf. on Smart Electronics and Communication, Trichy, India, pp. 577–582, 2020. [Google Scholar]
12. A. Reethika, J. Sathish, P. K. Priya, F. D. Shadrach and M. S. Kanivarshini, “Diabetic retinopathy detection using statistical features,” in 2nd Int. Conf. on Innovative Practices in Technology and Management, Gautam Buddha Nagar, India, pp. 44–48, 2022. [Google Scholar]
13. T. Zaman and Q. D. Hossain, “Detection of diabetic retinopathy at early stage using retinal fundus images,” in Int. Conf. on Electronics, Communications and Information Technology, Khulna, Bangladesh, pp. 1–4, 2021. [Google Scholar]
14. P. L. Jancy and B. Latha, “Deep learning techniques for diabetic retinopathy diagnosis using optical coherence tomography: A review,” in Int. Conf. on Advanced Computing Technologies and Applications, Coimbatore, India, pp. 1–4, 2022. [Google Scholar]
Cite This Article
 Copyright © 2023 The Author(s). Published by Tech Science Press.
This work is licensed under a Creative Commons Attribution 4.0 International License , which permits unrestricted use, distribution, and reproduction in any medium, provided the original work is properly cited.
 Downloads
 Citation Tools