
 Submit a Paper
 Propose a Special lssue
 Open Access
ARTICLE

Neural Network-Based State of Charge Estimation Method for Lithium-ion Batteries Based on Temperature
School of Electronic and Electrical Engineering, Kyungpook National University, Daegu, 41566, Korea
* Corresponding Author: Insoo Lee. Email:
Intelligent Automation & Soft Computing 2023, 36(2), 2025-2040. https://doi.org/10.32604/iasc.2023.034749
Received 26 July 2022; Accepted 22 September 2022; Issue published 05 January 2023
 View Full Text
 Download PDF
Abstract
Lithium-ion batteries are commonly used in electric vehicles, mobile phones, and laptops. These batteries demonstrate several advantages, such as environmental friendliness, high energy density, and long life. However, battery overcharging and overdischarging may occur if the batteries are not monitored continuously. Overcharging causes fire and explosion casualties, and overdischarging causes a reduction in the battery capacity and life. In addition, the internal resistance of such batteries varies depending on their external temperature, electrolyte, cathode material, and other factors; the capacity of the batteries decreases with temperature. In this study, we develop a method for estimating the state of charge (SOC) using a neural network model that is best suited to the external temperature of such batteries based on their characteristics. During our simulation, we acquired data at temperatures of 25°C, 30°C, 35°C, and 40°C. Based on the temperature parameters, the voltage, current, and time parameters were obtained, and six cycles of the parameters based on the temperature were used for the experiment. Experimental data to verify the proposed method were obtained through a discharge experiment conducted using a vehicle driving simulator. The experimental data were provided as inputs to three types of neural network models: multilayer neural network (MNN), long short-term memory (LSTM), and gated recurrent unit (GRU). The neural network models were trained and optimized for the specific temperatures measured during the experiment, and the SOC was estimated by selecting the most suitable model for each temperature. The experimental results revealed that the mean absolute errors of the MNN, LSTM, and GRU using the proposed method were 2.17%, 2.19%, and 2.15%, respectively, which are better than those of the conventional method (4.47%, 4.60%, and 4.40%). Finally, SOC estimation based on GRU using the proposed method was found to be 2.15%, which was the most accurate.Keywords
Abbreviations
| MNN | Multilayer neural network |
| LSTM | Long short-term memory |
| GRU | Gated recurrent unit |
| SOC | State of charge |
| MAE | Mean absolute error |
| ReLU | Rectified linear unit |
| RMSprop | Root mean square propagation |
| RNN | Recurrent neural network |
| HWFET | Highway fuel economy test |
| MSE | Mean squared error |
Currently, lithium-ion batteries are the most widely used batteries, and they are environmentally friendly and possess a high energy density, high charge and discharge efficiency, and long battery life. They serve as primary energy storage systems for a wide variety of devices, such as electric vehicles, mobile phones, laptops, and power storage systems [1–3]. However, overcharging and overdischarging may occur if lithium-ion batteries are not continuously monitored. Overcharging may result in a fire or explosion, whereas overdischarging can cause an increase in the internal resistance of the batteries, which may result in a decrease in battery capacity and life [4–5]. In addition, the internal resistance, which shortens the life of a lithium-ion battery, varies depending on the temperature. As the temperature decreases, the internal resistance increases, thereby decreasing battery capacity [6]. The characteristics of the battery vary with temperature, and if the acquired data are used without considering the temperature at the time of data acquisition, the state of charge (SOC) estimation can be inaccurate. Therefore, to improve the accuracy of SOC estimation, it is necessary to classify the data according to appropriate temperatures, and it is important to accurately estimate the SOC of the battery using the classified data. The SOC is an important concept that represents the remaining capacity of a battery. When the SOC is 100%, the battery is completely charged, and when the SOC is 0%, the battery is completely discharged. Thus, overcharging and overdischarging can be prevented by accurately estimating the SOC of the battery, thereby preventing battery damage and accidents.
SOC estimation methods consist of model-based and data-driven approaches [7–16]. Model-based methods create a model suitable for the data and estimate the SOC using the generated model; they can estimate the SOC with high accuracy. However, users must possess specialized battery knowledge to create models that fit their battery characteristics. In addition, the designing of such models is time-consuming. Model-based methods include the equivalent circuit model, electrochemical model, and the Kalman filter. In contrast, data-driven methods do not require model design; therefore, they do not require specialized knowledge of the battery characteristics. In addition, the development time for data-driven methods is much shorter than that for model-based methods. However, data-driven methods require a large amount of data, and such methods include machine learning.
In this study, we develop a model using the temperature measured during a discharge experiment and select a relevant model to estimate the SOC of a battery. The discharge experiment was conducted using a vehicle driving simulator that simulated the output of an actual vehicle. The vehicle driving scenario applied to the simulator employed the highway fuel economy test (HWFET) cycle, which is typically used to measure fuel efficiency in the United States. The SOC estimation model used a multilayer neural network (MNN), long short-term memory (LSTM), and gated recurrent unit (GRU). The MNN model is used as a popular model. Because the data used in this study are time-series data, we selected the LSTM. In addition, the dataset is small; therefore, we select the GRU, which is advantageous for small datasets. The experimental procedure was as follows: First, the data acquired by the vehicle driving simulator are classified based on the measured temperature and learned using each model. Subsequently, the SOC is estimated using the model, and the results are transferred to the user.
The remainder of this paper is organized as follows. In Section 2, the proposed method is described. Sections 3 and 4 discuss the vehicle driving simulator and the models used for learning, respectively. Section 5 describes the experimental process and results. Finally, Section 6 presents the conclusions of this study.
2 Proposed SOC Estimation Method
The SOC represents the capacity remaining in a battery, which is an important measure of the battery state [17]. In this study, the SOC was calculated using Coulomb counting to confirm the error and results of the proposed SOC estimation method. Notably, Coulomb counting is expressed as follows:
where SOC(0) denotes the initial measured capacity of the battery (%),
2.2 Battery SOC Estimation Method
This paper develops a method for estimating the SOC by selecting different models depending on the measured temperature. Fig. 1 illustrates the proposed SOC estimation method.
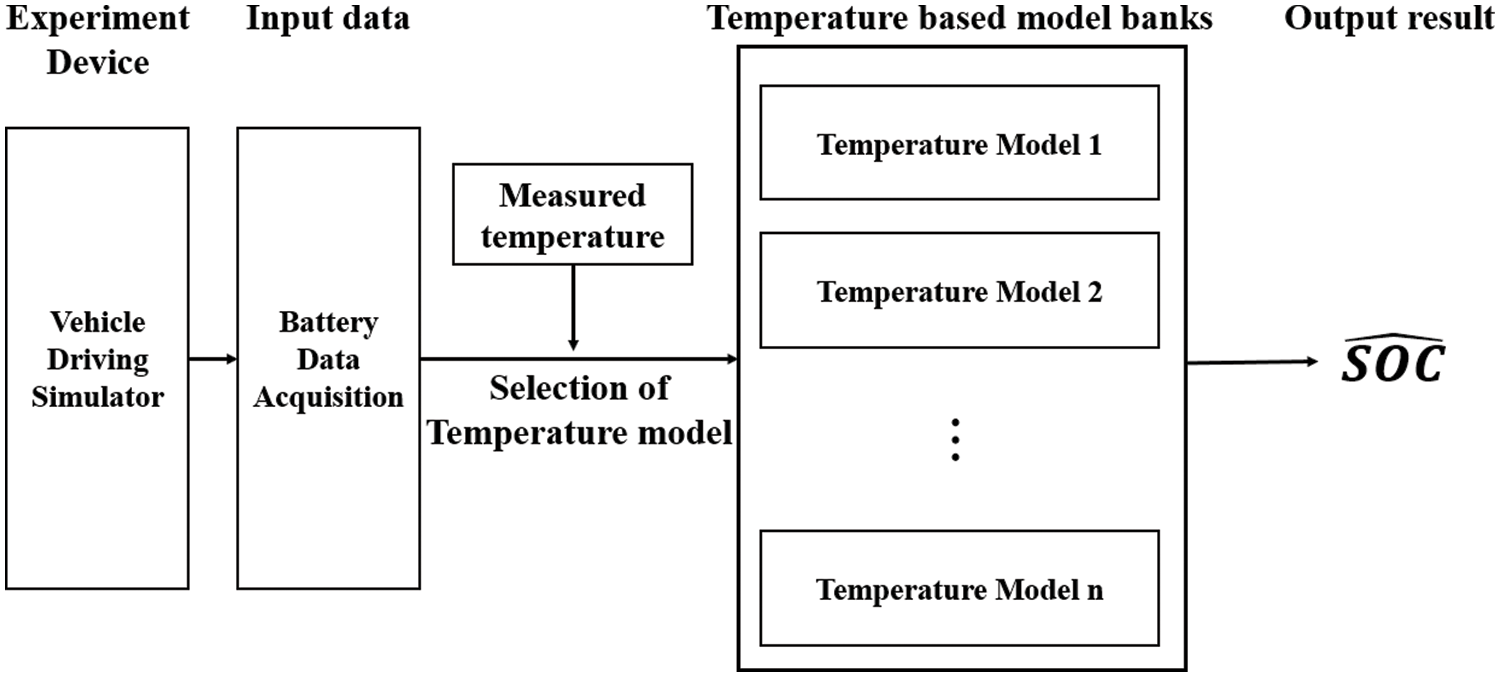
Figure 1: Proposed SOC estimation method
The proposed method classifies data depending on the temperature at which the simulator is operated and learns the data using each temperature model. Herein, 25°C, 30°C, 35°C, and 40°C models were generated for each temperature dataset, and the model that best suited the temperature was selected to estimate the SOC depending on the measured temperature. The operational process of the proposed method was as follows: first, battery data are acquired using a vehicle driving simulator. During the simulation, the acquired data are fed into a model that is well suited to the measured temperature. Next, the SOC is estimated using the model, and the results are transferred to the user.
This paper develops a vehicle driving simulator to estimate the SOC by simulating the output of an actual vehicle. The configuration of the vehicle driving simulator is illustrated in Fig. 2.
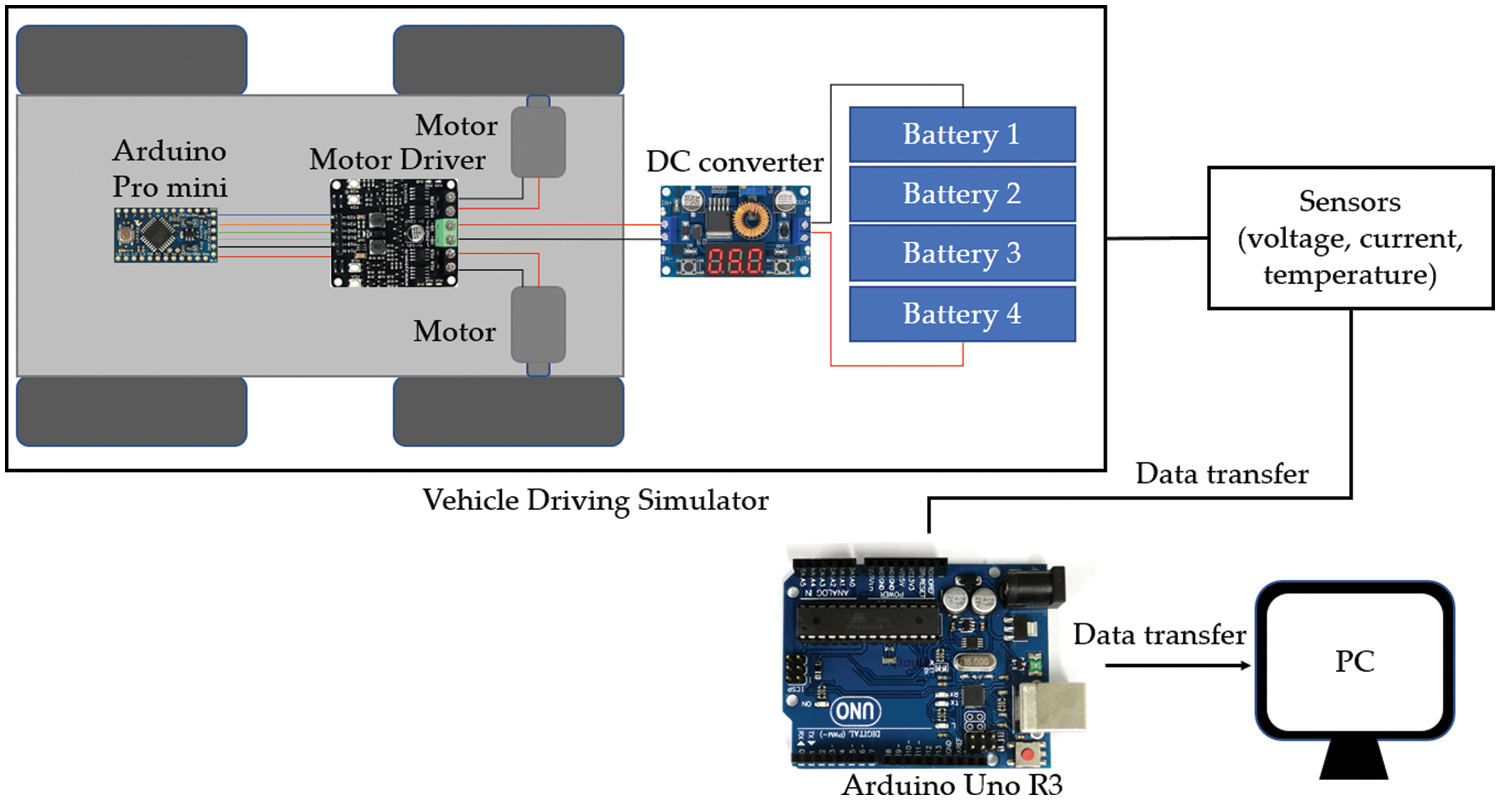
Figure 2: Configuration of the vehicle driving simulator
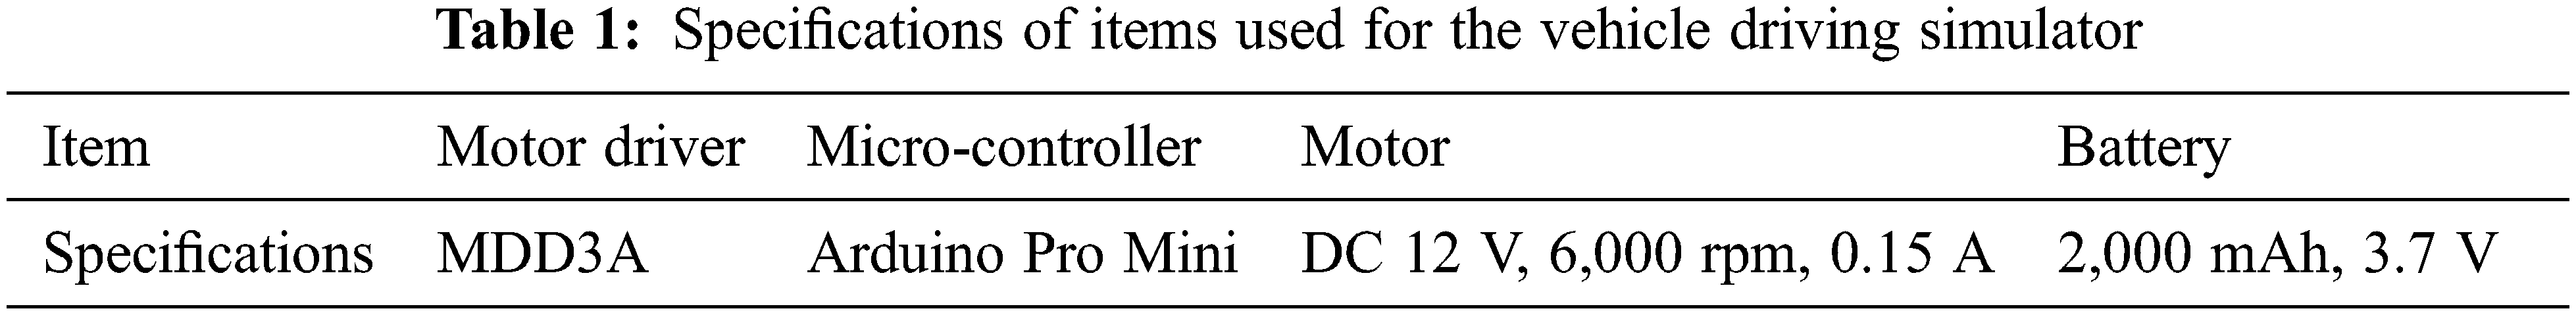
The simulator consisted of two direct current (DC) motors, each with a rated voltage of 12 V and 6,000 rpm speed, an MDD3A motor driver, a DC converter, an Arduino Pro Mini Module, a remote-control car frame, four batteries, and four tires. Table 1 lists these items and their specifications. Each battery has a nominal voltage of 3.7 V and a rated capacity of 2,000 mAh. The four batteries activate the motors through a DC converter in the simulation.
The voltage supplied by the four batteries connected in series is adjusted to 12 V using a DC converter, and it is used as the input. The output of the simulator represents the Hyundai Avante Sports AD 1.6 model with 255/40/18 tires driving in the HWFET cycle. The HWFET is a highway driving scenario defined by the United States Environmental Protection Agency to measure the fuel efficiency of a vehicle. The motor output simulates the third-gear ratio of the model and tires, and the speed of the model is controlled by the Arduino and the motor driver. The HWFET is shown in Fig. 3.
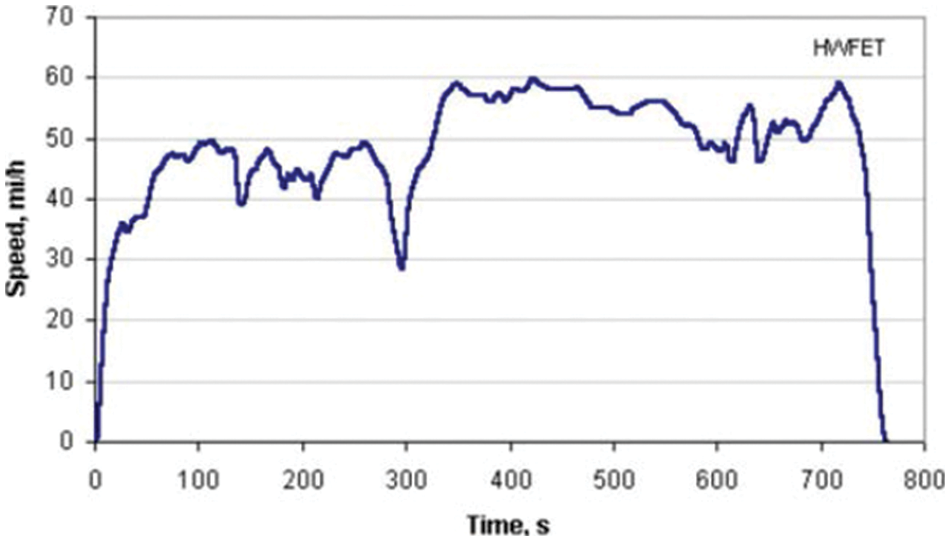
Figure 3: Highway fuel economy test cycle
4 Deep Neural Network Algorithms
The MNN is a neural network that adds one or more hidden layers to a single perceptron. As the perceptron cannot classify nonlinearly, an MNN can be used to solve the problems presented by the perceptron [18]. The structure of the MNN is illustrated in Fig. 4.
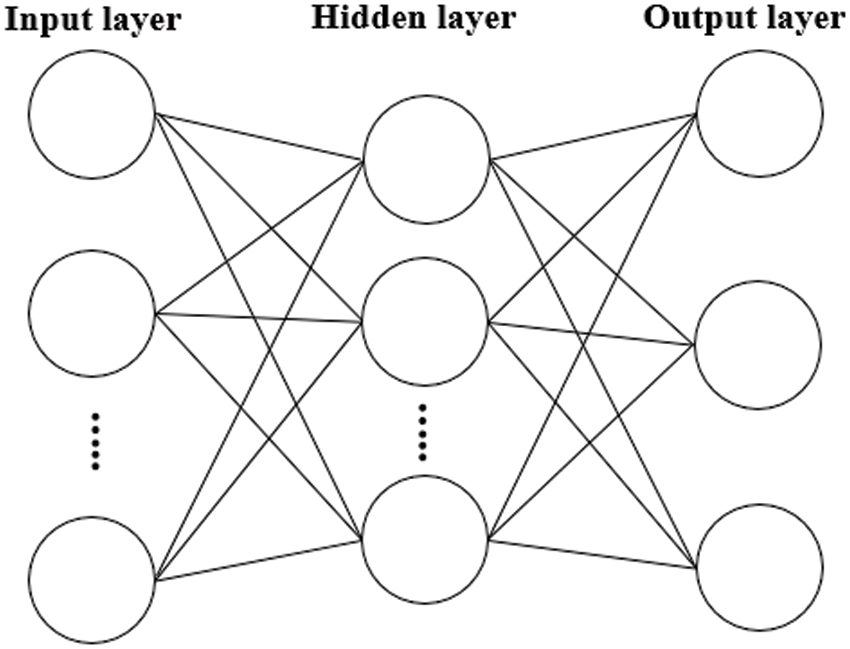
Figure 4: Structure of the MNN
The MNN uses feedforward and backpropagation; it calculates the output through the feedforward mechanism and corrects the error through backpropagation. For the SOC estimation model, the voltage, current, temperature, and time data are used as the input layer, and the SOC is the output obtained from the output layer. The rectified linear unit (ReLU) function is used as the activation function in the MNN. Compared with the sigmoid function, the ReLU function demonstrates the advantages of possessing a nonvanishing gradient and fast convergence [19]. The equation for the ReLU function is defined as follows:
Adam is used as the optimizer for the MNN. Adam is a first-order gradient-based optimization algorithm that combines momentum and root mean squared propagation (RMSprop). It is easy to implement and efficient because it requires only a small amount of computation [20]. The equations for Adam are as follows.
Here,
The LSTM is a recurrent neural network (RNN) in which past outputs affect current input data [21]. RNNs demonstrate the advantage of predicting time-series data. However, the gradient may vanish as learning time increases, which presents a problem. The LSTM solves the vanishing gradient problem by adding a cell state and three different gates (forget, input, and output gates) to the RNN; it solves the problems of the RNN by using a cell to determine whether the data from past and current cells are to be used. The structure of the LSTM is shown in Fig. 5.
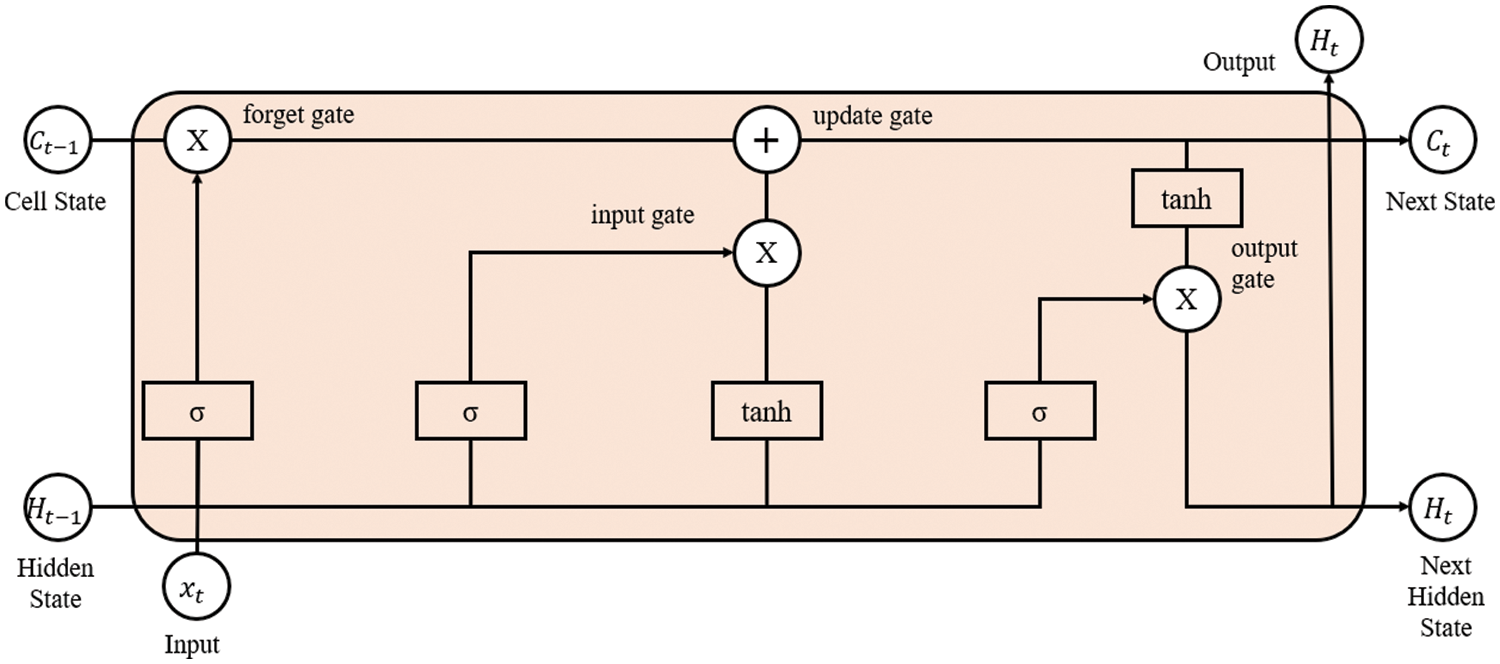
Figure 5: Structure of an LSTM
The equations of an LSTM are as follows.
Step 1) Forget gate
Step 2) Input gate
Step 3. Cell state update
Step 4) Output gate
where
For the LSTM model employed for SOC estimation, Adam was used as the optimizer, and tanh was used as the activation function. Tanh performs better than the sigmoid function with respect to the vanishing gradient problem, whereas when using the ReLU in the LSTM, the data diverge as the output value of the previous cell increases. The tanh function is expressed as follows:
The GRU is an RNN that simplifies the LSTM. The LSTM network suffers from two issues: vanishing gradient and a long learning time owing to its complex structure [22]. The GRU addresses these problems by determining the amount of data to be used from the previous cell using the update and reset gates. In addition, the GRU performs well even when using small datasets [23]. The GRU structure is shown in Fig. 6.
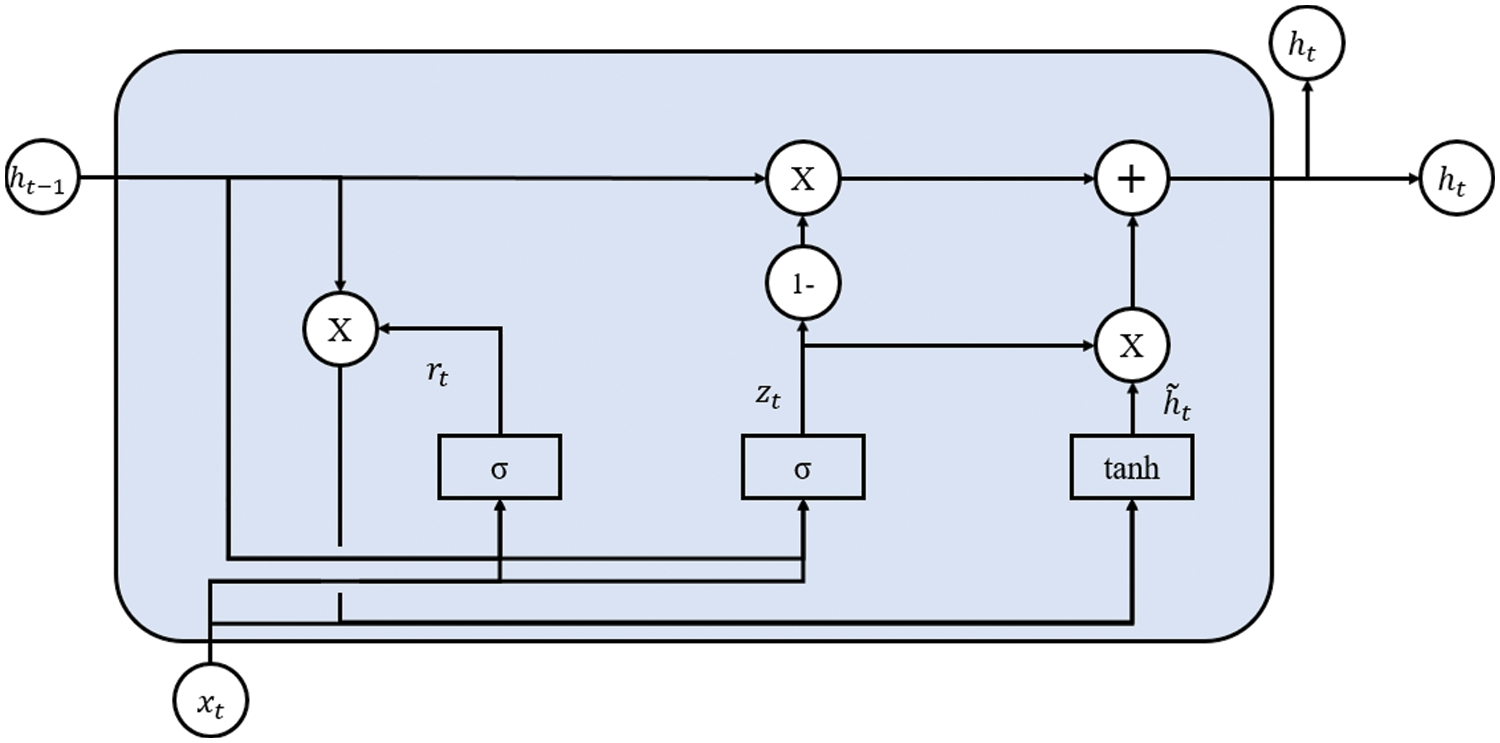
Figure 6: Structure of a GRU
The equations of a GRU are as follows.
Step 1) Reset gate
Step 2) Update gate
Step 3) Candidate hidden state
Step 4) Hidden state/Output
where
5 Experimental Process and Results
The experimental procedure followed in this study is as follows. First, the four lithium-ion batteries used in the experiment are completely charged at a constant voltage of 4.2 V. The batteries used in this study are lithium-ion polymer batteries. These are full-cell batteries. The cathode is Li(NiCoMn)O2, and the anode is graphite. The capacity corresponding to a completely charged state was defined as 100% SOC. The batteries are stabilized for 1 h after charging was completed. Next, these batteries are connected in series and set to produce a voltage output of 12 V using a DC converter. Finally, the external temperature of the batteries is set using a thermostat, and a discharge experiment is conducted using the vehicle driving simulator.
The discharge experiment continues until the motor of the vehicle driving simulator stopped, and the data acquired during the experiment were defined as one cycle of battery data. The data acquired constitutes the voltage, current, temperature, and time datasets. Battery data from six cycles are used for the experiment depending on the temperature set during the operation of the vehicle driving simulator. The acquired data are used as inputs for the MNN, LSTM, and GRU, and the SOC is estimated using the generated models. The SOC estimation model is created using TensorFlow and Keras based on Python.
5.2 MNN Model for SOC Prediction
This section describes the MNN model generated for SOC estimation. The input parameters acquired during the discharge experiment are voltage, current, time, and external battery temperature. Five voltage datasets, five current datasets, one time dataset, and one temperature dataset are used as inputs to the MNN. The structure of the MNN is 12-256-128-1, and it consists of an input layer, two hidden layers, and one output layer. The number of epochs was 15,000. The ReLU function is used as the activation function, and Adam is used as the optimizer of the MNN. Learning is considered complete when the mean squared error (MSE) is less than 10−6. The structure of the MNN for SOC estimation is illustrated in Fig. 7, and a loss graph of the proposed model is shown in Fig. 8.
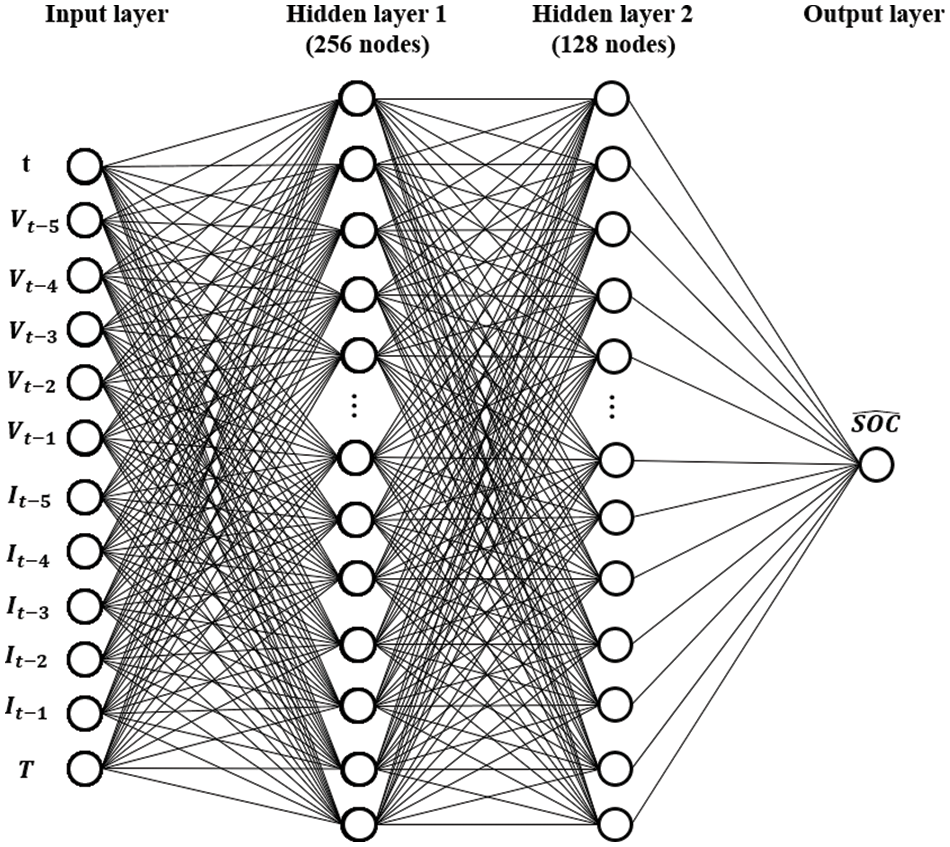
Figure 7: Structure of the MNN for SOC estimation
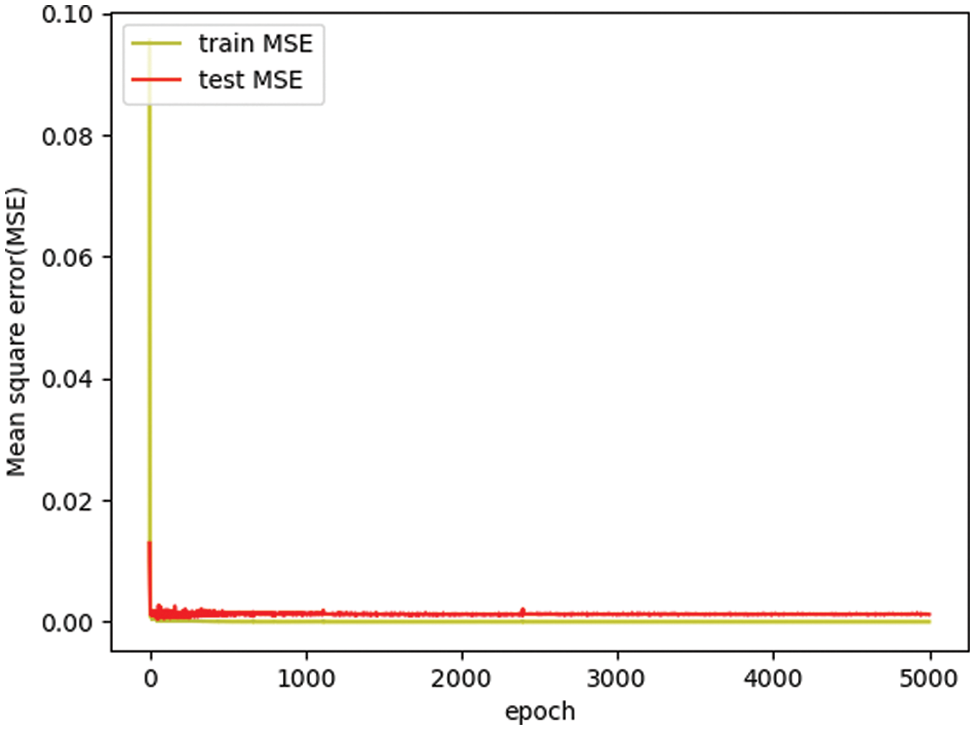
Figure 8: Loss graph of the proposed MNN model
In Figs. 7, 9, and 10, t denotes the time dataset, V denotes the voltage data, I denotes the current data, and T denotes the temperature data. In Fig. 8, train MSE denotes the training data MSE, and test MSE denotes the test data MSE.
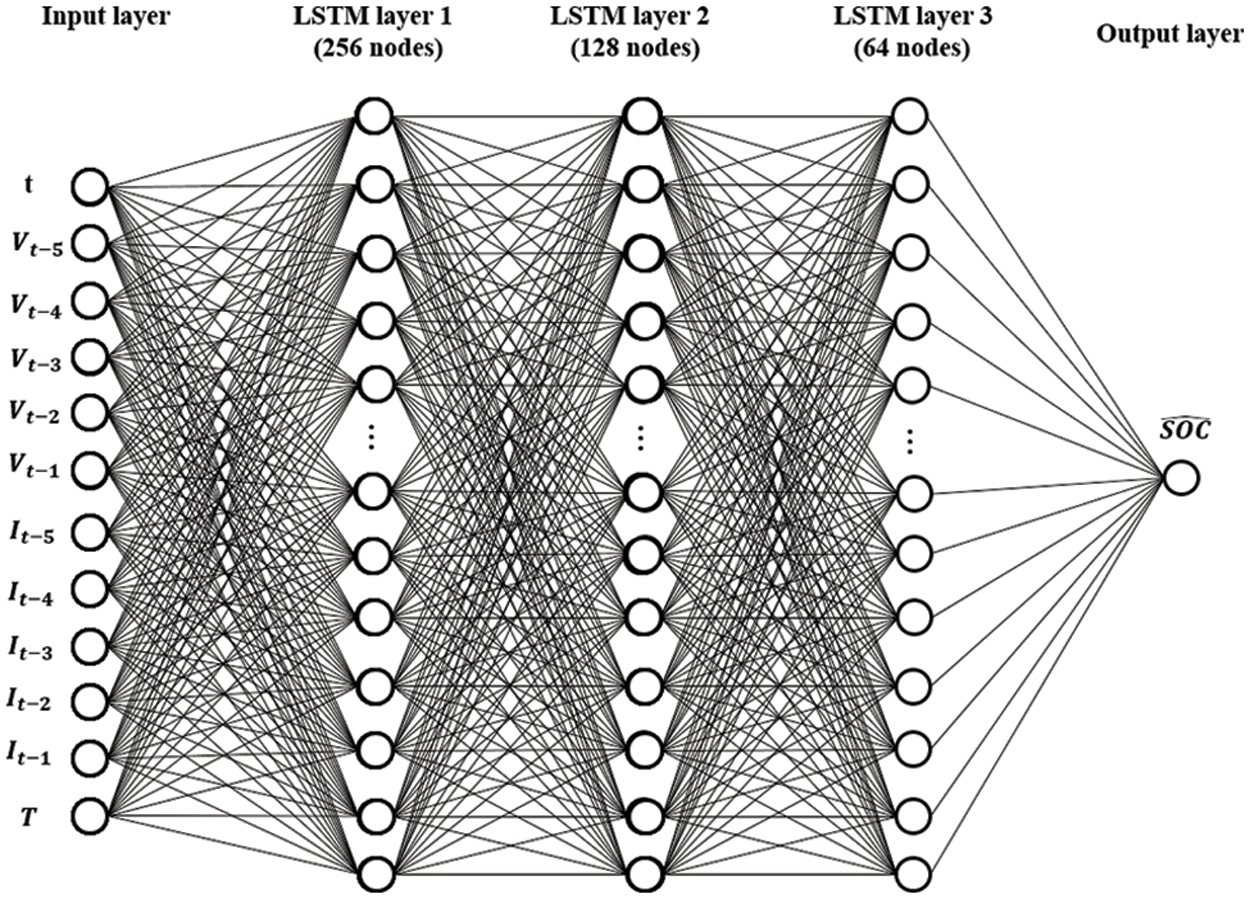
Figure 9: Structure of the LSTM model for SOC estimation
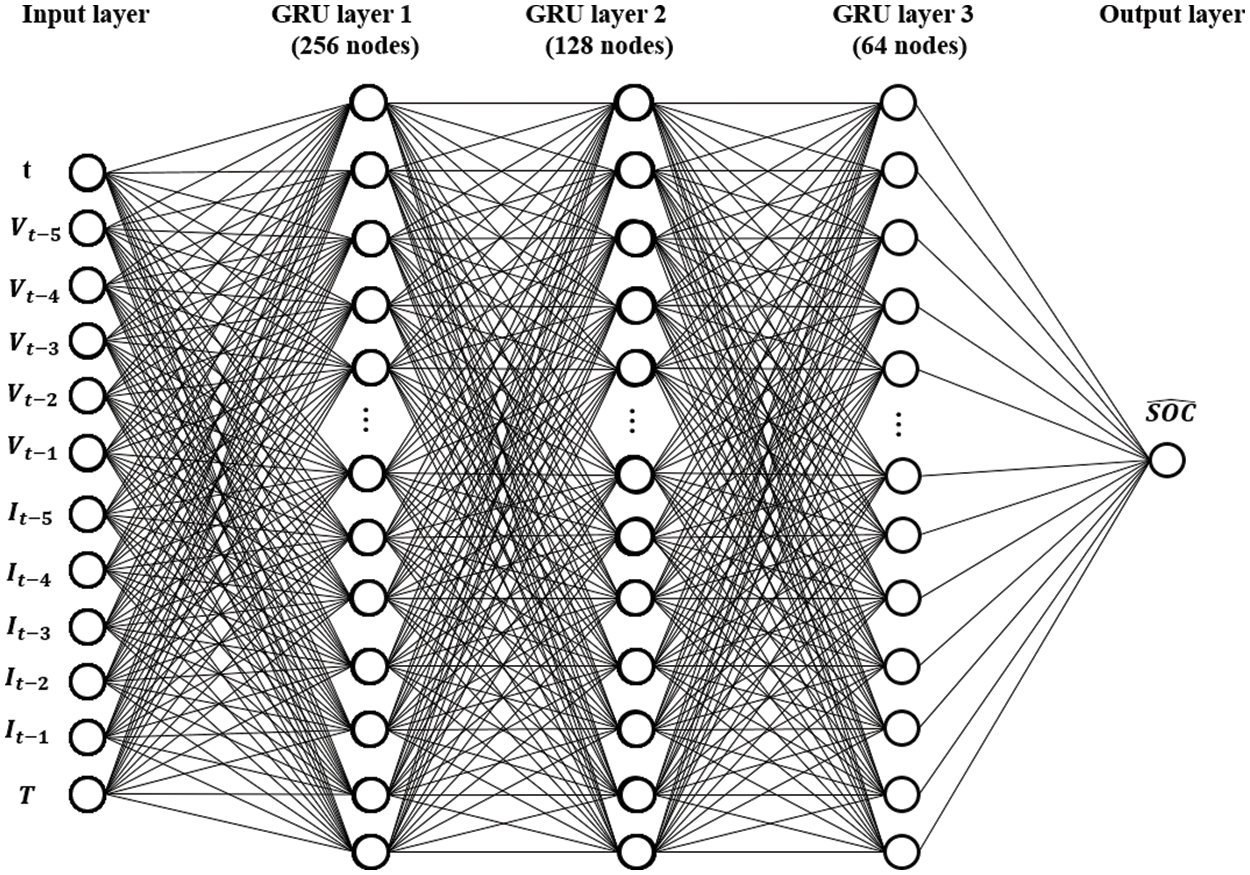
Figure 10: Structure of the GRU model for SOC estimation
5.3 LSTM Model for SOC Prediction
Next, we describe the LSTM model used to estimate the SOC. The inputs are the same as those used for the MNN. The structure of the LSTM for SOC estimation is 12-256-128-64-1, and it consists of an input layer, three hidden layers, and one output layer. The number of epochs was 5,000. Tanh is used as the activation function, and Adam is used as the optimizer. The structure of the LSTM for SOC estimation is shown in Fig. 9.
5.4 GRU Model for SOC Prediction
Finally, we describe the GRU model used to estimate the SOC. The input data for the GRU model are the same as those used for the MNN. The GRU structure for SOC estimation is 12-256-128-64-1, and it consists of an input layer, three hidden layers, and one output layer. The number of epochs was 5,000. The activation function is tanh, and the Adam algorithm is used as the optimizer. The structure of the GRU model used to estimate the SOC is shown in Fig. 10.
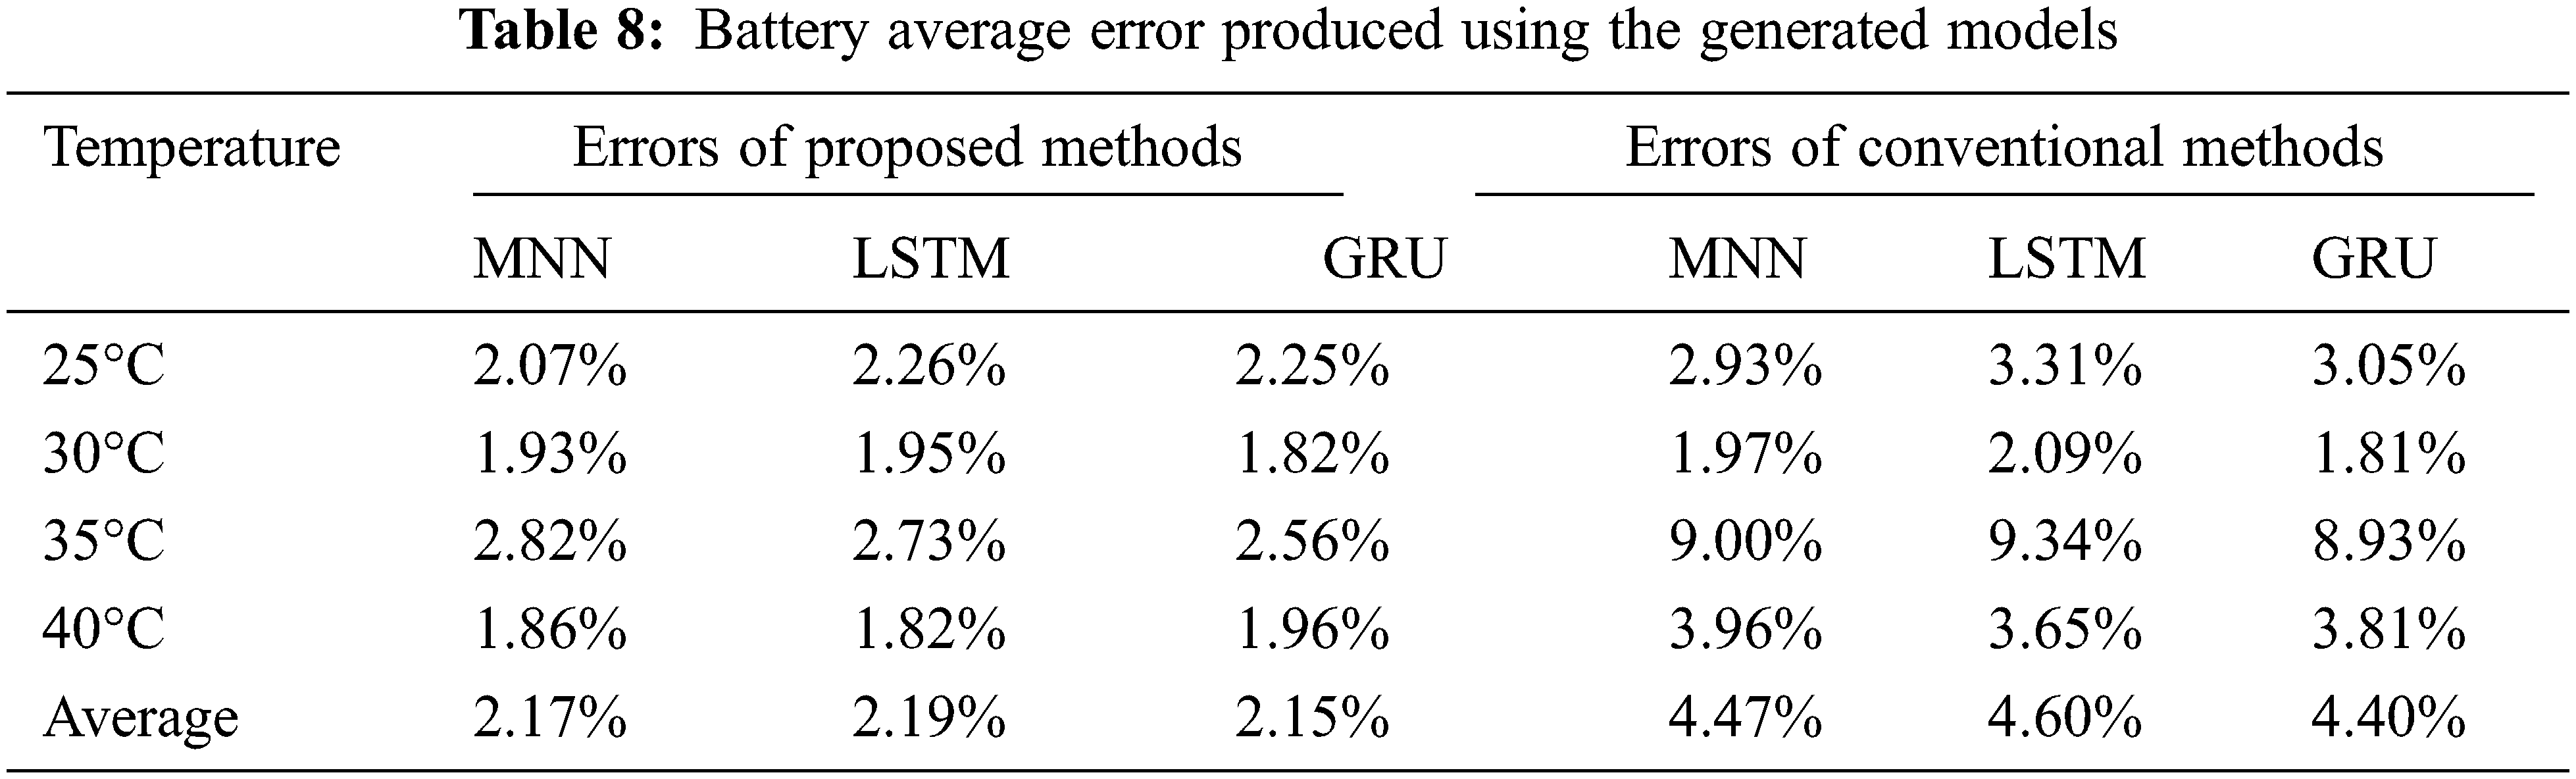
The SOC is estimated using a suitable MNN, LSTM, or GRU model, depending on the temperature measured during the discharge experiment. To evaluate the performance of the proposed method, the SOC is also estimated using a conventional method, which used a model generated using all datasets including the 25°C, 30°C, 35°C, and 40°C temperature parameters and the corresponding voltage parameters, for comparison. Figs. 11–13 show a comparison of the SOC estimation results obtained using the MNN, LSTM, and GRU. Each figure consists of the calculated SOC, the SOC of the proposed method, and the SOC of the conventional method. Tables 2–7 present the results of the SOC estimation using each model. The estimated error rates in Tables 2–9 were calculated using the mean absolute error (MAE). The MAE equation is as follows.
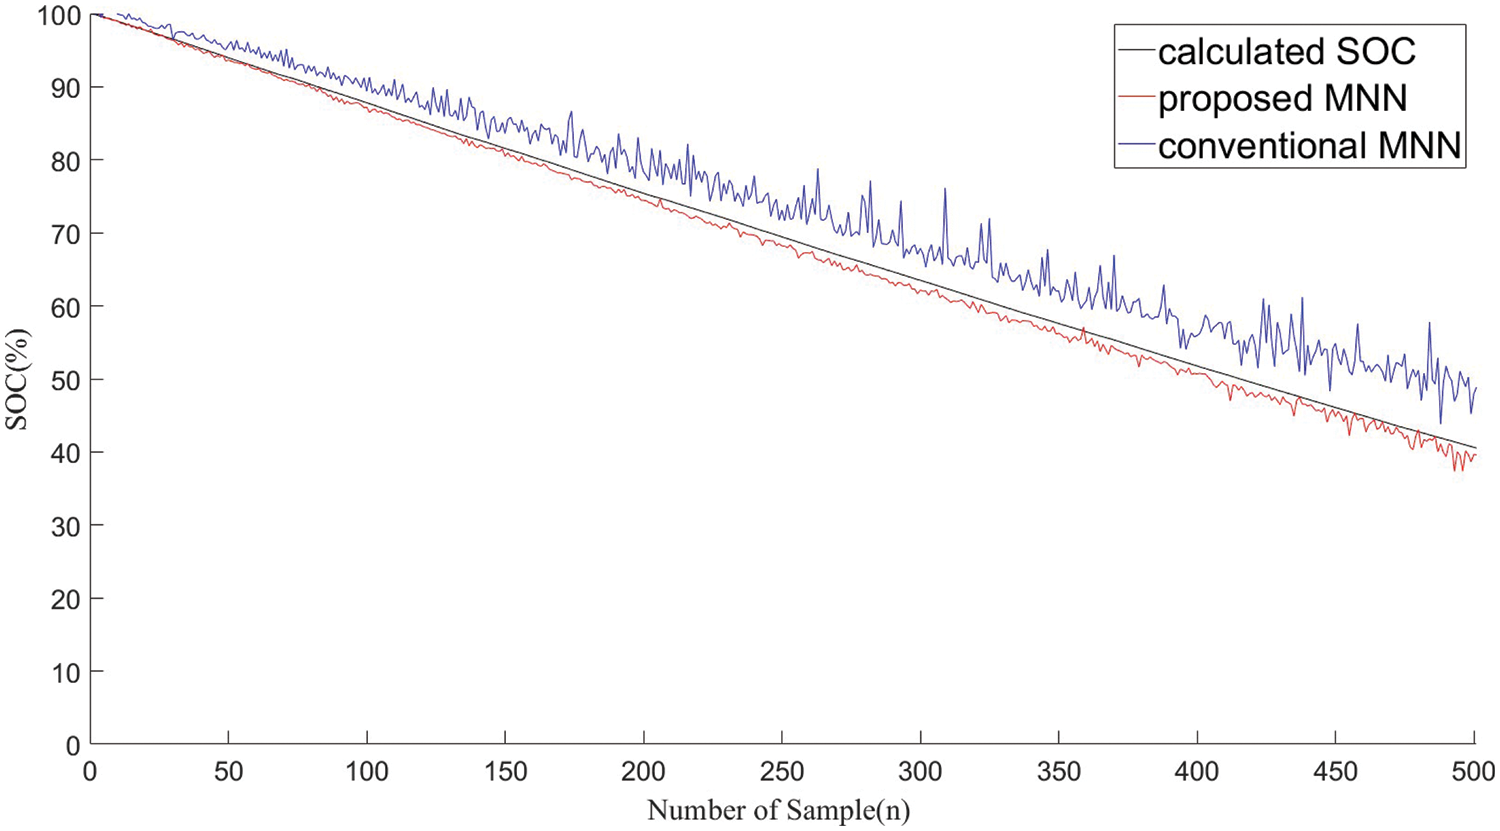
Figure 11: SOC estimation results of MNN using the proposed and conventional methods
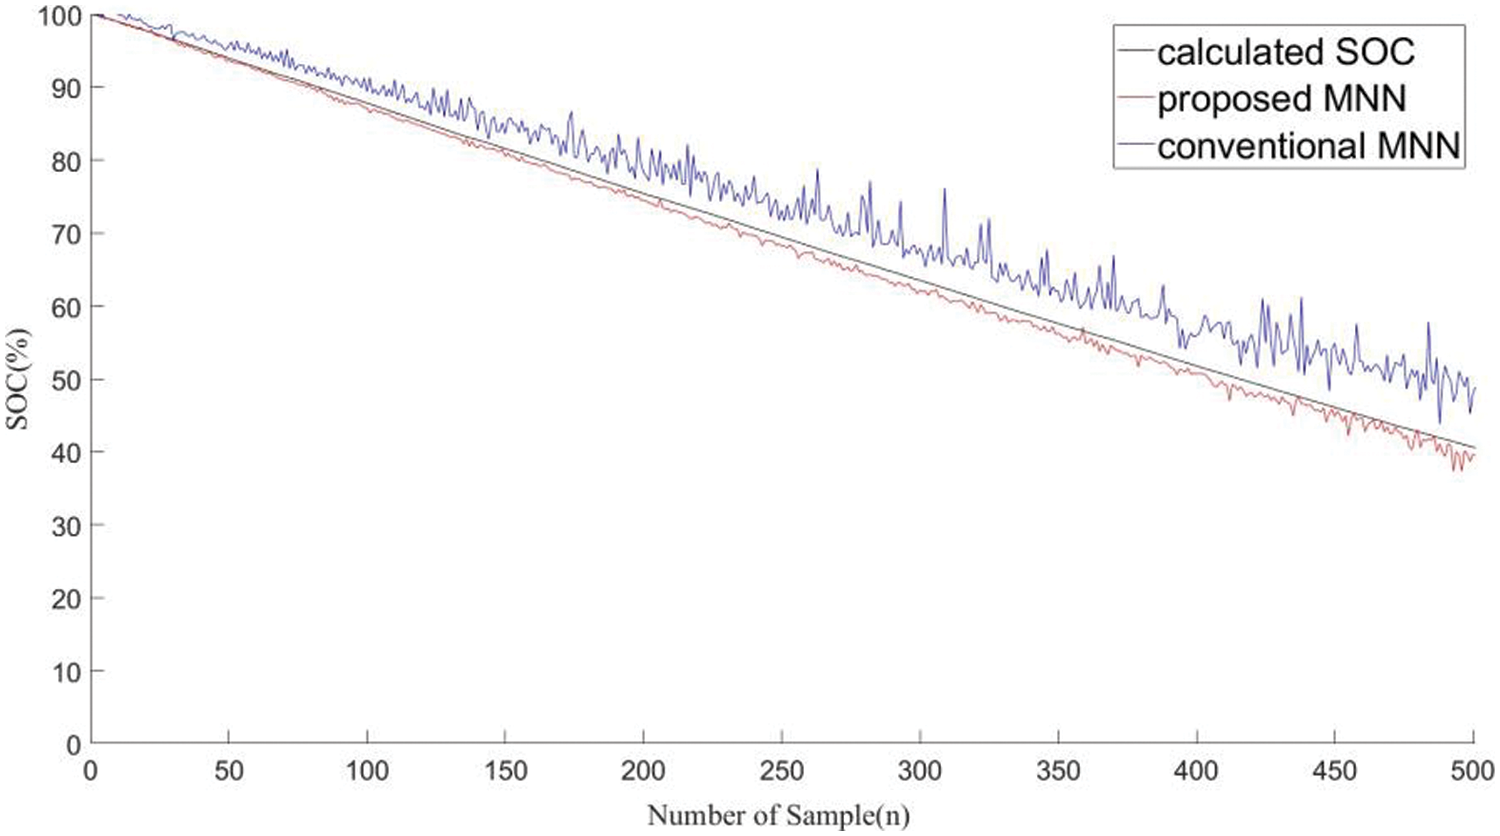
Figure 12: SOC estimation results of LSTM using the proposed and conventional methods
Figure 13: SOC estimation results of GRU using the proposed and conventional methods


where n denotes the total number of parameters,
Tables 2 and 3 present the SOC estimation error rates obtained using the proposed and conventional MNN methods, respectively. The method proposed in this study demonstrates a minimum estimation error of 0.98% and a maximum estimation error of 3.89%. The average error of the model based on temperature is the highest at 1.86% at 40°C. The total average error of the proposed method is 2.17% and that of the conventional method is 4.46%.
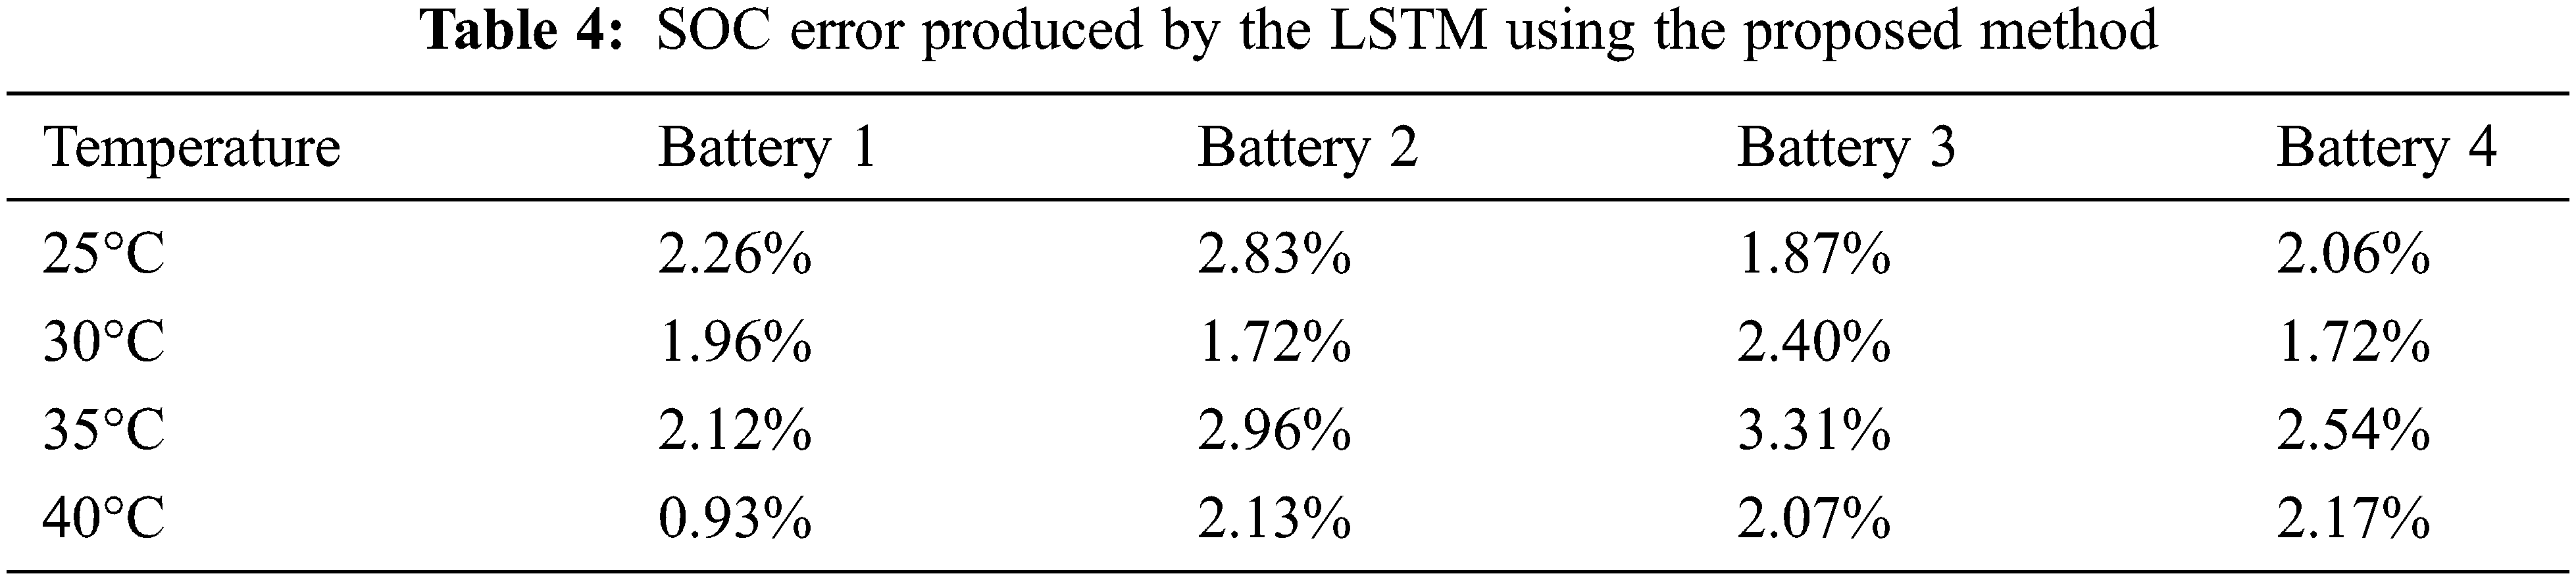
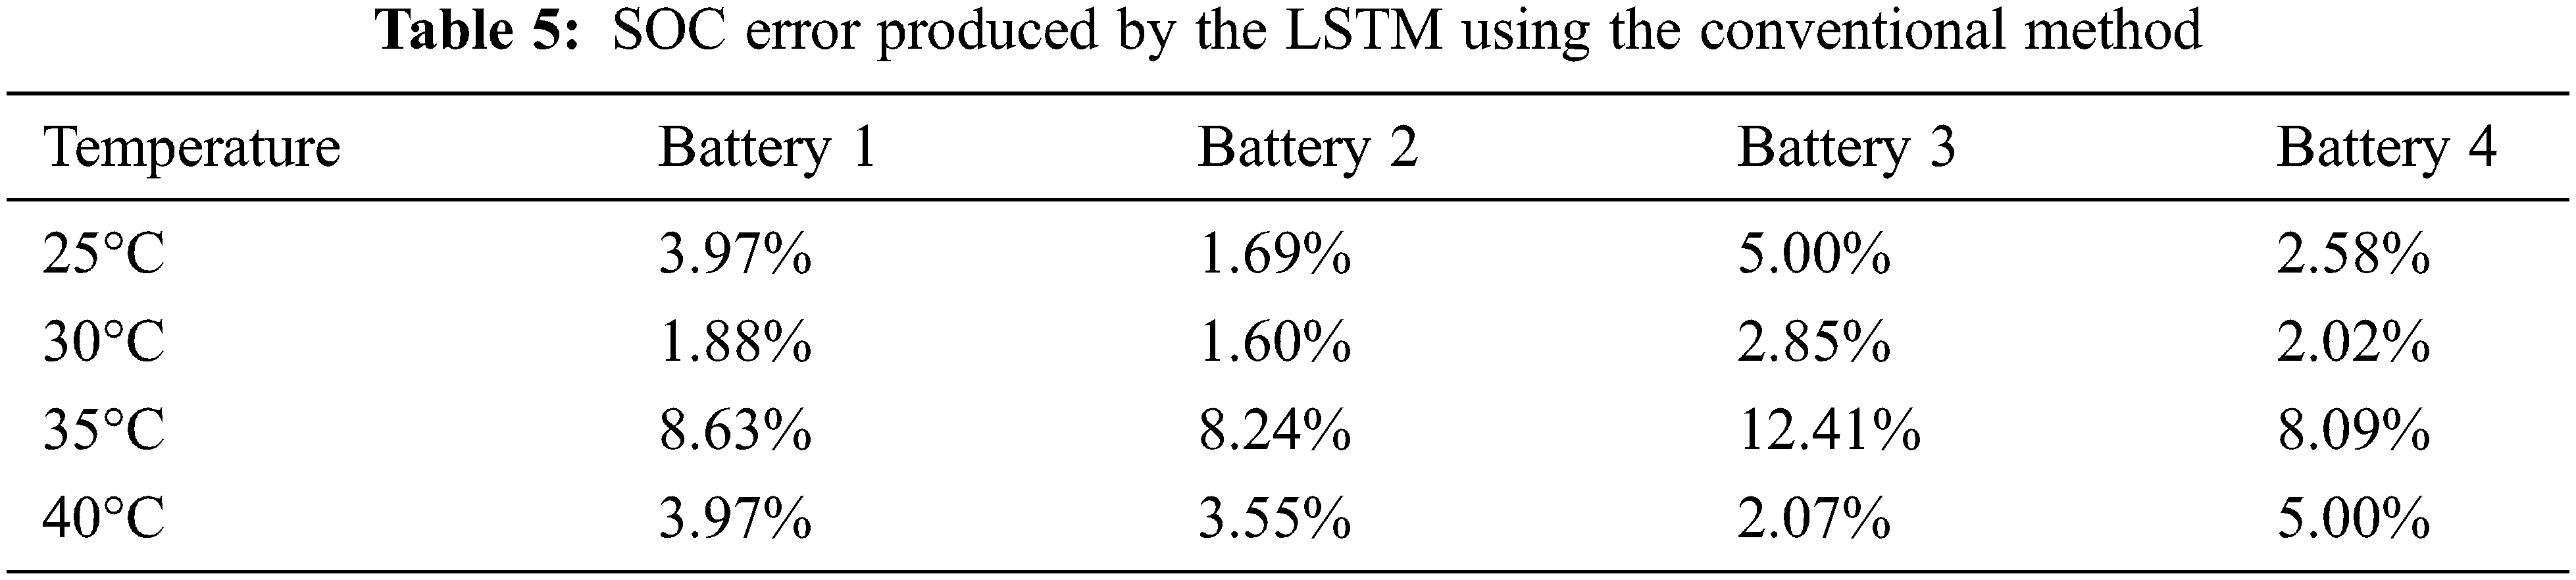
Tables 4 and 5 present the SOC estimation error rates obtained using the proposed LSTM method and conventional LSTM method, respectively. The lowest estimated error of the proposed method is 0.93%, whereas the highest estimated error rate is 3.31%. The average error based on temperature is the best at 1.82% at 40°C. The total average error of the proposed method is 2.19% and that of the conventional method is 4.60%.
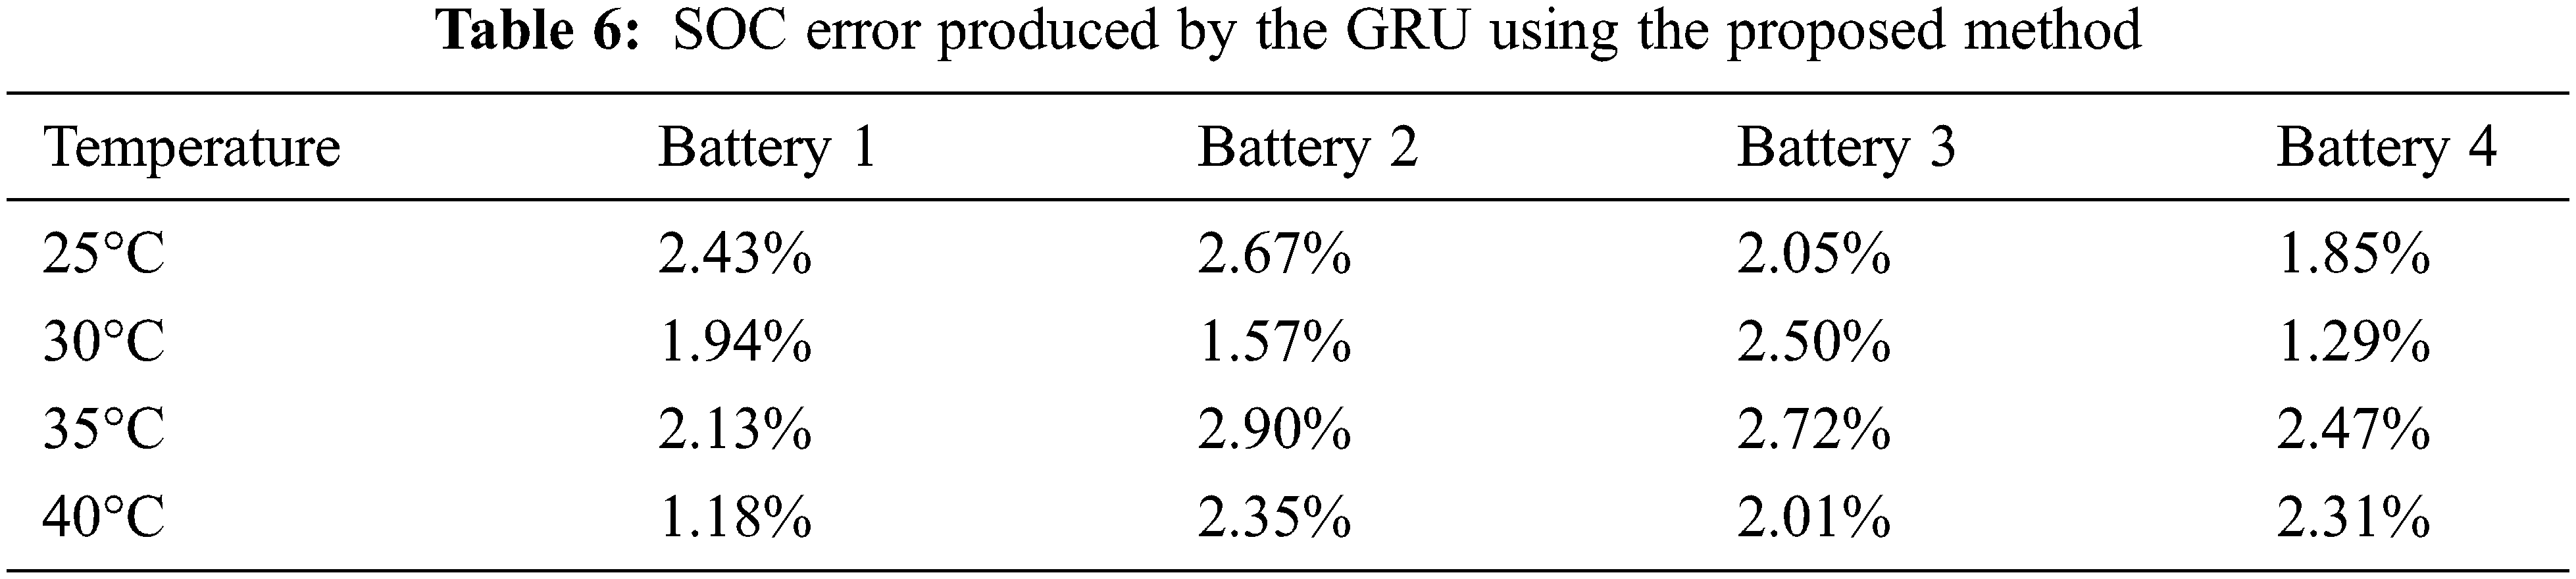
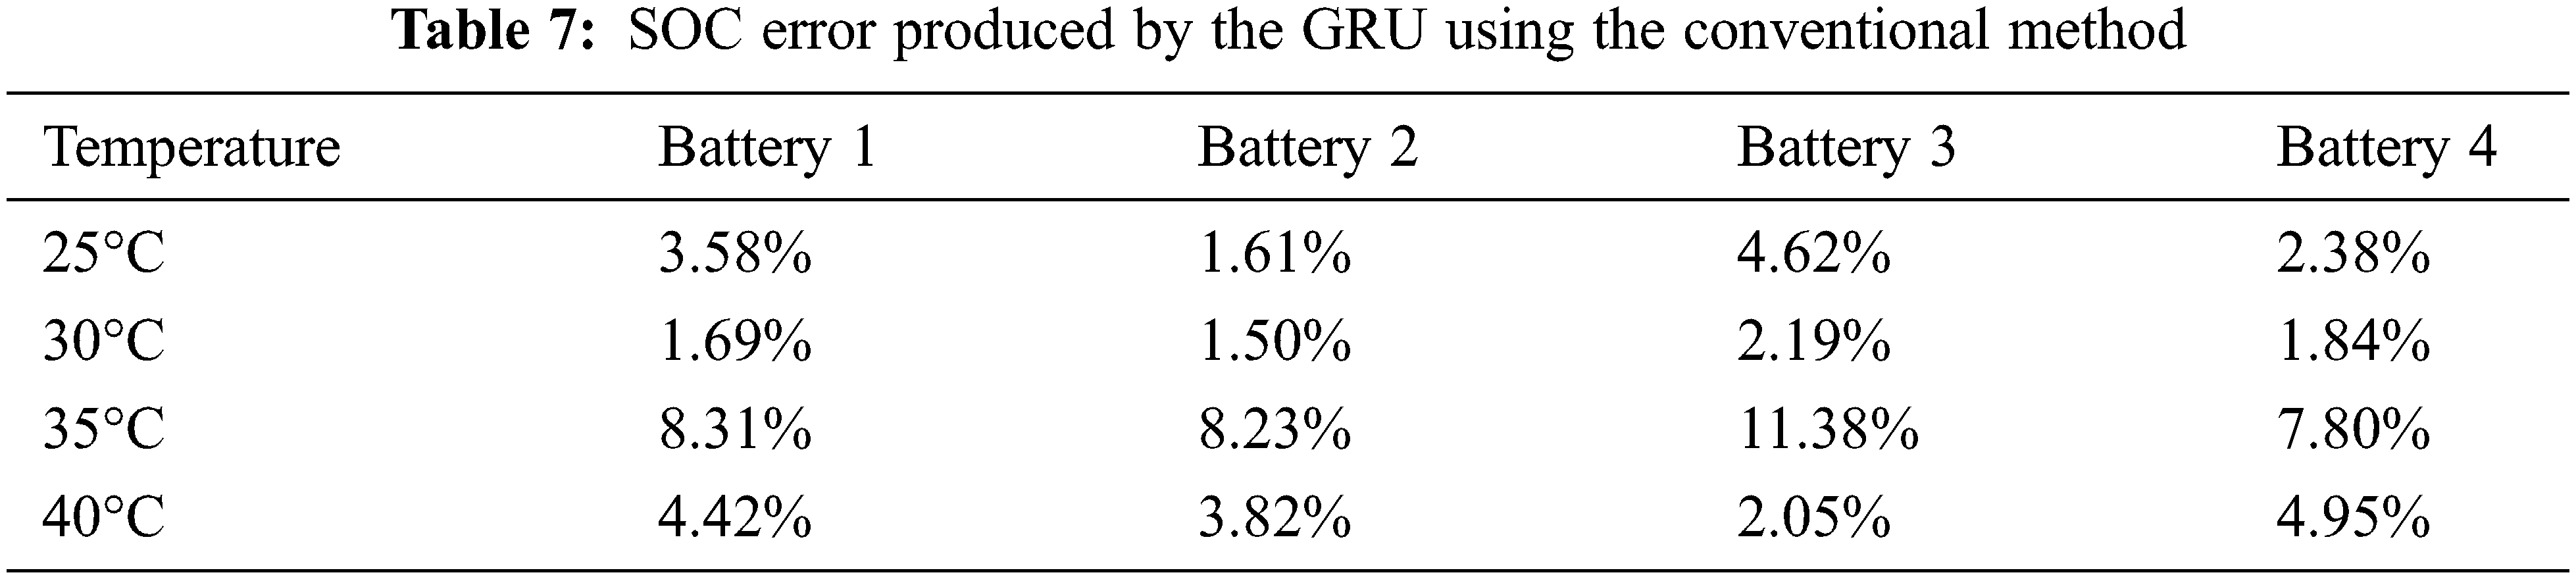
Tables 6 and 7 present the SOC estimation error rates obtained using the proposed and conventional GRU methods, respectively. The lowest estimated error of the proposed method is 1.18%, whereas the highest error is 2.90%. The average error based on temperature is the highest at 1.82% at 30°C. Table 8 summarizes the average battery errors estimated using the generated models. It is confirmed that the average error of the proposed method is more than 2% lower than that of the conventional method for all models, with GRU demonstrating the best performance. The average errors of the GRU and conventional methods are 2.15% and 4.40%, respectively.
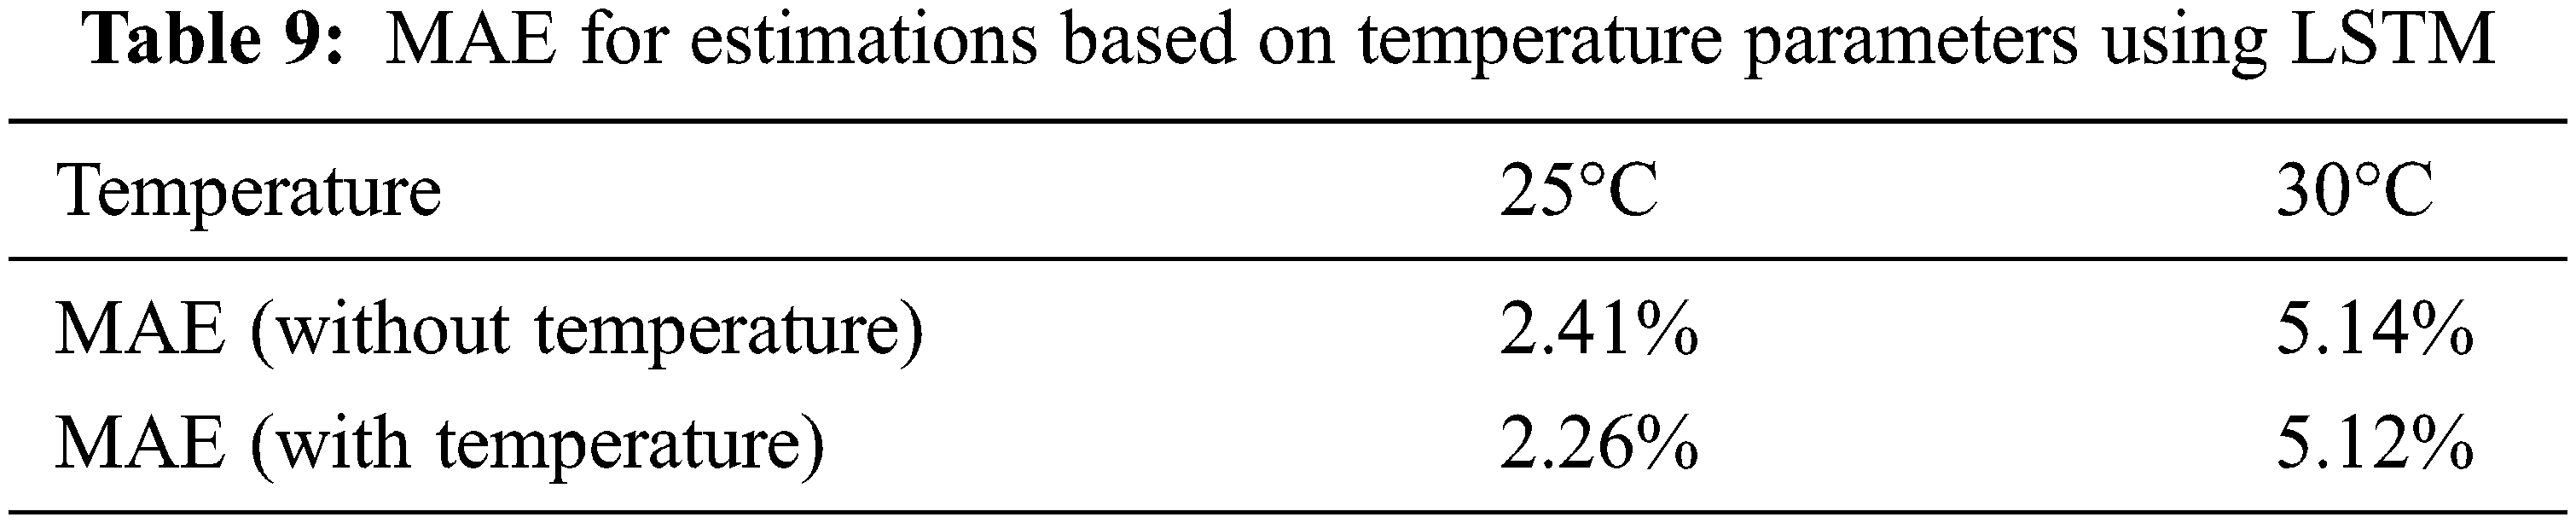
Table 9 lists the MAEs obtained for estimations based on the temperature parameters. Regardless of the suitability of the model, the results of using the temperature parameters are better, and the MAE of 30°C without selecting a suitable model owing to the absence of the temperature is confirmed to be worse than that at 25°C with selecting the suitable model. Fig. 14 shows a graph of the average MAE of the proposed and conventional methods presented in Table 8. Thus, we demonstrate that the proposed method is superior to the conventional method.
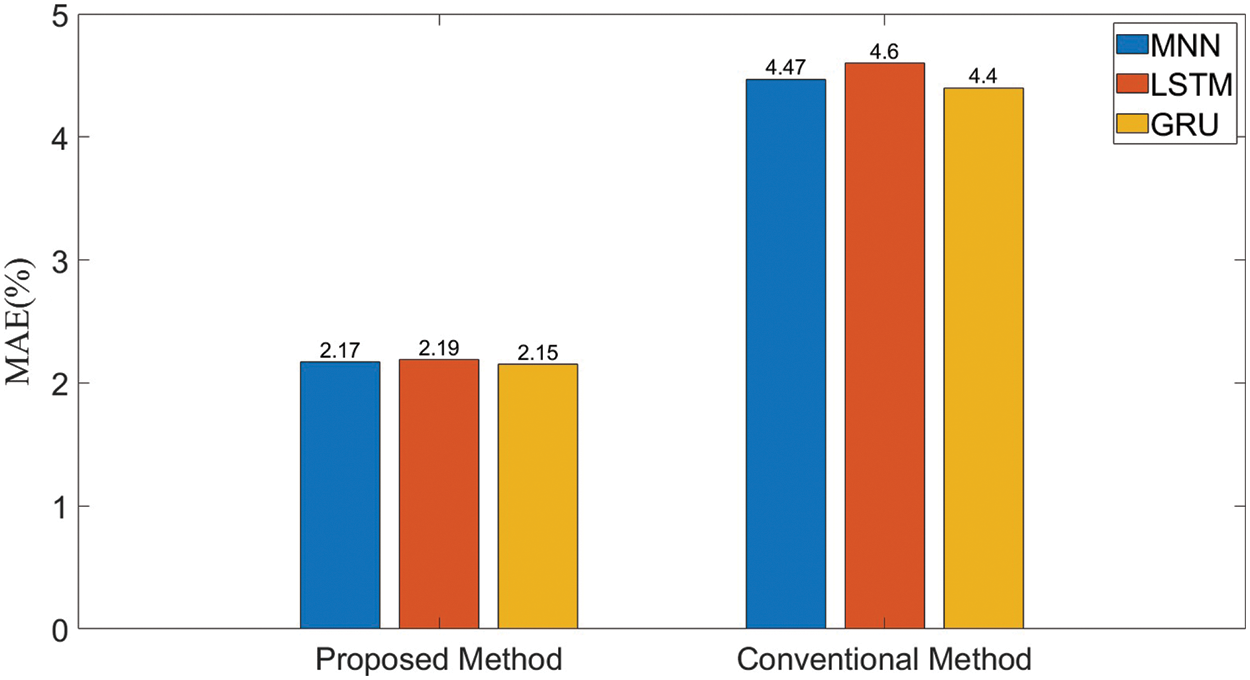
Figure 14: MAE produced by the proposed and conventional methods
This study has developed a method for estimating the SOC by selecting a suitable model depending on the temperature measured during the experiment. To estimate the SOC, a discharge experiment has been conducted using a custom vehicle driving simulator. The data acquired during the experiment have been classified based on temperature and used for the MNN, LSTM, and GRU models. Finally, the SOC has been estimated using a model generated from the data.
During the experiment, four temperatures have been measured, and the SOC has been estimated using the MNN, LSTM, and GRU models appropriate for the temperatures. Most of the proposed methods have exhibited lower errors than the conventional methods. The proposed MNN method has exhibited an average error of 2.17%, which is superior to the average error of 4.46% obtained by the conventional MNN method. The LSTM method has exhibited an average error of 2.19%, which is superior to the average error of 4.60% produced by the conventional LSTM method. In the case of the GRU, the average error of the proposed method has been 2.15%, which is superior to the average error of 4.40% produced by the conventional GRU method. The average error of the GRU is the lowest among the three models.
In future research, we plan to estimate the SOC by using data acquired using the Jetson Nano developer kit developed by NVIDIA for application in a real environment. Subsequently, we plan to implement a graphical user interface to display the SOC estimation results, express the SOC and error rate of the battery in real time, and verify its performance. We expect that the proposed method is applicable to the SOC problem of actual systems using batteries, such as unmanned aerial vehicle and smart assistive system [24,25].
Funding Statement: This study was supported by the BK21 FOUR project funded by the Ministry of Education, Korea (4199990113966).
Conflicts of Interest: The authors declare that they have no conflicts of interest to report regarding the present study.
References
1. H. Zuo, B. Zhang, Z. Huang, K. Wei, H. Zhu et al., “Effect analysis on SOC values of the power lithium manganate battery during discharging process and its intelligent estimation,” Energy, vol. 238, no. 2, pp. 121854, 2022. [Google Scholar]
2. S. Panchal, I. Dincer, M. Agelin-Chaab, R. Fraser and M. Fowler, “Experimental temperature distributions in a prismatic lithium-ion battery at varying conditions,” International Communications in Heat and Mass Transfer, vol. 71, no. 3, pp. 35–43, 2016. [Google Scholar]
3. W. Tong, W. Q. Koh, E. Birgersson, A. S. Mujumdar and C. Yap, “Correlating uncertainties of a lithium-ion battery – A Monte Carlo simulation,” International Journal of Energy Research, vol. 39, no. 6, pp. 778–788, 2015. [Google Scholar]
4. K. An, P. Barai, K. Smith and P. P. Mukherjee, “Probing the thermal implications in mechanical degradation of lithium-ion battery electrodes,” Journal of The Electrochemical Society, vol. 161, no. 6, pp. 1058–1070, 2014. [Google Scholar]
5. J. Chen, Q. Ouyang, C. Xu and H. Su, “Neural network-based state of charge observer design for lithium-ion batteries,” IEEE Transactions on Control Systems Technology, vol. 26, no. 1, pp. 313–320, 2018. [Google Scholar]
6. S. Ma, M. Jiang, P. Tao, C. Song, J. Wu et al., “Temperature effect and thermal impact in lithium-ion batteries: A review,” Progress in Natural Science: Materials International, vol. 28, no. 6, pp. 653–666, 2018. [Google Scholar]
7. K. W. Cheng, B. P. Divakar, H. Wu, K. ding and H. F. Ho, “Battery-management system (BMS) and SOC development for electrical vehicles,” IEEE Transactions on Vehicular Technology, vol. 60, no. 1, pp. 76–88, 2011. [Google Scholar]
8. X. Hu, S. Li and H. Peng, “A comparative study of equivalent circuit models for Li-ion batteries,” Journal of Power Sources, vol. 198, pp. 359–367, 2012. [Google Scholar]
9. D. N. T. How, M. A. Hannan, M. S. H. Lipu and P. J. Ker, “State of charge estimation for lithium-ion batteries using model-based and data-driven methods: A review,” IEEE Access, vol. 7, pp. 136116–136136, 2019. [Google Scholar]
10. J. C. A. Anton, P. J. G. Nieto, C. B. Viejo and J. A. V. Vilan, “Support vector machines used to estimate the battery state of charge,” IEEE Transactions on Power Electronics, vol. 28, no. 12, pp. 5919–5926, 2013. [Google Scholar]
11. C. Bian, H. He and S. Yang, “Stacked bidirectional long short-term memory networks for state-of-charge estimation of lithium-ion batteries,” Energy, vol. 191, no. 9, pp. 116538, 2020. [Google Scholar]
12. J. H. Park, J. H. Lee, S. J. Kim and I. S. Lee, “Real-time state of charge estimation for each cell of lithium battery pack using neural networks,” Applied Science, vol. 10, no. 23, pp. 8644, 2020. [Google Scholar]
13. J. H. Lee and I. S. Lee, “Lithium battery SOH monitoring and an SOC estimation algorithm based on the SOH result,” Energies, vol. 14, no. 15, pp. 4506, 2021. [Google Scholar]
14. X. Lai, W. Yi, Y. Cui, C. Qin, X. Han et al., “Capacity estimation of lithium-ion cells by combining model-based and data-driven methods based on a sequential extended Kalman filter,” Energy, vol. 216, no. 2, pp. 119233, 2021. [Google Scholar]
15. F. Xiao, C. Li, Y. Fan, G. Yang and X. Tang, “State of charge estimation for lithium-ion battery based on gaussian process regression with deep recurrent kernel,” International Journal of Electrical Power & Energy Systems, vol. 124, no. 3, pp. 106369, 2021. [Google Scholar]
16. V. Chandran, C. K. Patil, A. Karthick, D. Ganeshaperumal, R. Rahim et al., “State of charge estimation of lithium-ion battery for electric vehicles using machine learning algorithms,” World Electric Vehicle Journal, vol. 12, no. 1, pp. 38, 2021. [Google Scholar]
17. R. Zhang, B. Xia, B. Li, L. Cao, Y. Lai et al., “State of the art of lithium-ion battery SOC estimation for electrical vehicles,” Energies, vol. 11, no. 7, pp. 1820, 2018. [Google Scholar]
18. S. He, K. Reif and R. Unbehauen, “Multilayer neural networks for solving a class of partial differential equations,” Neural Networks, vol. 13, no. 3, pp. 385–396, 2000. [Google Scholar]
19. S. Alhagry, A. A. Fahmy and R. A. El-Khoribi, “Emotion recognition based on EEG using LSTM recurrent neural network,” International Journal of Advanced Computer Science and Applications (IJACSA), vol. 8, no. 10, 2017. [Google Scholar]
20. D. P. Kingma and J. Ba, “Adam: A method for stochastic optimization,” in International Conference on Learning Representations (ICLR), San Diego, CA, USA, 2015. [Google Scholar]
21. Y. Yu, X. Si, C. Hu and J. Zhang, “A review of recurrent neural networks: LSTM cells and network architectures,” Neural Computation, vol. 31, no. 7, pp. 1235–1270, 2019. [Google Scholar]
22. K. H. Cho, B. V. Merrienboer, C. Gulcehre, D. Bahdanau, F. Bougares et al., “Learning phrase representations using RNN encoder-decoder for statistical machine translation,” in Proc. of the 2014 Conf. on Empirical Methods in Natural Language Processing, Doha, Qatar, pp. 1724–1734, 2014. [Google Scholar]
23. Y. Wang, Z. Chen and W. Zhang, “Lithium-ion battery state-of-charge estimation for small target sample sets using the improved GRU-based transfer learning,” Energy, vol. 244, no. 13, pp. 123178, 2022. [Google Scholar]
24. U. Masud, T. Saeed, F. Akram, H. Malaikah and A. Akbar, “Unmanned aerial vehicle for laser based biomedical sensor development and examination of device trajectory,” Sensors, vol. 22, no. 9, pp. 3413, 2022. [Google Scholar]
25. U. Masud, T. Saeed, H. M. Malaikah, F. U. Islam and G. Abbas, “Smart assistive system for visually impaired people obstruction avoidance through object detection and classification,” IEEE Access, vol. 10, pp. 13428–13441, 2022. [Google Scholar]
Cite This Article
 Copyright © 2023 The Author(s). Published by Tech Science Press.
This work is licensed under a Creative Commons Attribution 4.0 International License , which permits unrestricted use, distribution, and reproduction in any medium, provided the original work is properly cited.
 Downloads
 Citation Tools