
 Submit a Paper
 Propose a Special lssue
 Open Access
ARTICLE

Hyperparameter Optimization Based Deep Belief Network for Clean Buses Using Solar Energy Model
1 College of Engineering, Princess Nourah Bint Abdulrahman University, Riyadh 84428, Kingdom of Saudi Arabia
2 Transport Engineering School of Engineering and The Built Environment, Edinburgh Napier University, Edinburgh EH10 5D, UK
3 Department of Computing, Muscat College, University of Sterling, UK
* Corresponding Author: Shekaina Justin. Email:
Intelligent Automation & Soft Computing 2023, 37(1), 1091-1109. https://doi.org/10.32604/iasc.2023.032589
Received 23 May 2022; Accepted 26 October 2022; Issue published 29 April 2023
 View Full Text
 Download PDF
Abstract
Renewable energy has become a solution to the world’s energy concerns in recent years. Photovoltaic (PV) technology is the fastest technique to convert solar radiation into electricity. Solar-powered buses, metros, and cars use PV technology. Such technologies are always evolving. Included in the parameters that need to be analysed and examined include PV capabilities, vehicle power requirements, utility patterns, acceleration and deceleration rates, and storage module type and capacity, among others. PVPG is intermittent and weather-dependent. Accurate forecasting and modelling of PV system output power are key to managing storage, delivery, and smart grids. With unparalleled data granularity, a data-driven system could better anticipate solar generation. Deep learning (DL) models have gained popularity due to their capacity to handle complex datasets and increase computing power. This article introduces the Galactic Swarm Optimization with Deep Belief Network (GSODBN-PPGF) model. The GSODBN-PPGF model predicts PV power production. The GSODBN-PPGF model normalises data using data scaling. DBN is used to forecast PV power output. The GSO algorithm boosts the DBN model’s predicted output. GSODBN-PPGF projected 0.002 after40 h but observed 0.063. The GSODBN-PPGF model validation is compared to existing approaches. Simulations showed that the GSODBN-PPGF model outperformed recent techniques. It shows that the proposed model is better at forecasting than other models and can be used to predict the PV power output for the next day.Keywords
The advancement of the universal economy constantly increases demand for electricity and has a great influence on the atmosphere. The enormous utilisation of fossil fuels results in severe issues relating to greenhouse gas discharges, which also result in global warming and metrological changes across the globe [1]. In this regard, a growing amount of electrical energy has been produced from renewable energy sources in recent decades, with photovoltaic (PV) energy being the primary source, with a higher penetration level in the energy marketplace [2]. Photovoltaic (PV) power generation is a possible source of electricity in many regions. High penetration of PV energy complicates grid operations and planning due to its intermittent nature. Short-term projections are useful in power generation planning and in power markets where PV power and energy storage can be sold or hedged. Accurately predicting how much power will be produced by PV is important for making the energy market work better, cutting down on reserves, and keeping the system safe.
PV power is particularly auspicious because of its availability and potential. The aggregate volume of solar energy which the Earth gets from solar radiation at any single instant is almost 1.8 × 10¹¹ MW, which could completely address the demand for human action worldwide [3]. Precise prediction of PV power generation (PVPG) is very significant because it could find a decision-making device in power system processes [4]. Certainly, it is helpful for power systems as well as power providers. The output efficiency and performance of a PV system are affected by the solar tracking system, sun angle, shade or partial shading, dust, and cell operating temperature. The impact of these factors on the practical operation of the PV system has received scant attention. Throughout the development of the PV industry, PVPG forecasting has been an important subject of substantial research.
Data transmission costs should be considered for renewable energy estimates and grid connection needs. A solar PV power generation system must record power generation, real-time power, fault warnings, etc. through network transmission. Uninterrupted data transmission costs more, which is an economic issue for solar PV owners. To save on data transmission costs, the electricity operator’s metre data management system (MDMS) delays obtaining solar PV power generation information. This strategy reduces data transmission costs but complicates solar PV power forecasts. Power suppliers must acquire accurate data regarding PVPG to set up dedicated marketable offers, thus increasing profit and decreasing production rates. In the meantime, it could further alleviate the adverse influence caused by PV power uncertainty, thereby assuring the reliability and stability of the power system [5]. However, PV output is primarily determined by the strength of solar irradiance and the variety of weather conditions, which can be generally uncontrollable and uncertain [6].It is impossible to predict or control the output of a PV system because of the unpredictable nature of solar irradiation and a wide range of weather conditions. Because of the erratic nature of the weather, a photovoltaic system’s output changes constantly throughout time. The PV system power generation changes dynamically with time because of the changeability of weather conditions. Thus, a stable and accurate prediction of PVPG is significantly tougher and remains a challenging one. It is of the utmost importance to have an accurate prediction of photovoltaic power generation (PVPG), as this can serve as a tool for decision-making in the operations of power systems. It is to the advantage of both the power suppliers and the power systems. To establish specific business offers, power suppliers need to gather exact information about PVPG. This will allow them to lower their production costs and increase their profits. In the meantime, it may also offset the negative impact that is generated by the unpredictability caused by PV power, which ensures the stability and reliability of the power system. However, the amount of electricity that can be generated by a PV system is mostly determined by the amount of solar irradiation as well as several different meteorological conditions. These aspects of the weather are typically unpredictable and difficult to control. The way a photovoltaic (PV) system makes electricity changes over time because the weather is always changing.
Numerous forecasting approaches are suggested in the literature related to ML for solar PV generation [7]. Fig. 1 illustrates the process of a solar PV power generation system. However, no single technique is capable of performing precisely on all of the cases examined. Converting from a single solar PV plant (dataset) to another suggests numerous kinds of changeability for ML techniques. The result of distinct methods utilising similar power and weather data or a similar technique with dissimilar internal hyper-parameter scenery might result in distinct estimations. The methods were stated to have volatility problems, that is, a minor variation in input data might lead to substantial differences in the estimation values, which influence the model’s reliability [8]. The modelling could not be able to produce similar outcomes on a new dataset due to its uncertainties in the PV system properties, long-term effects, data collection faults, and system output results [9]. Solar photovoltaic (PV) cells directly convert sunlight into electricity. The process of transforming light (photons) into electricity is referred to as PV (voltage). Each solar panel contains approximately 60 cells, although new technology is increasing efficiency, and many panels now contain XX cells. When the sun shines on a solar panel, the energy is absorbed by the PV cells in the panel. This energy generates electrical charges that move in reaction to an internal electrical field in the cell, resulting in the flow of electricity. As a result, during the last decade, an increasing amount of electricity has been generated from renewable energy sources, with photovoltaic (PV) energy being a prominent source with a high penetration rate in the energy market. Because of its potential and availability, PV electricity is extremely promising. At any given time, the Earth gets about MW of energy from the sun in the form of solar radiation, which is enough to meet the needs of everyone on Earth.
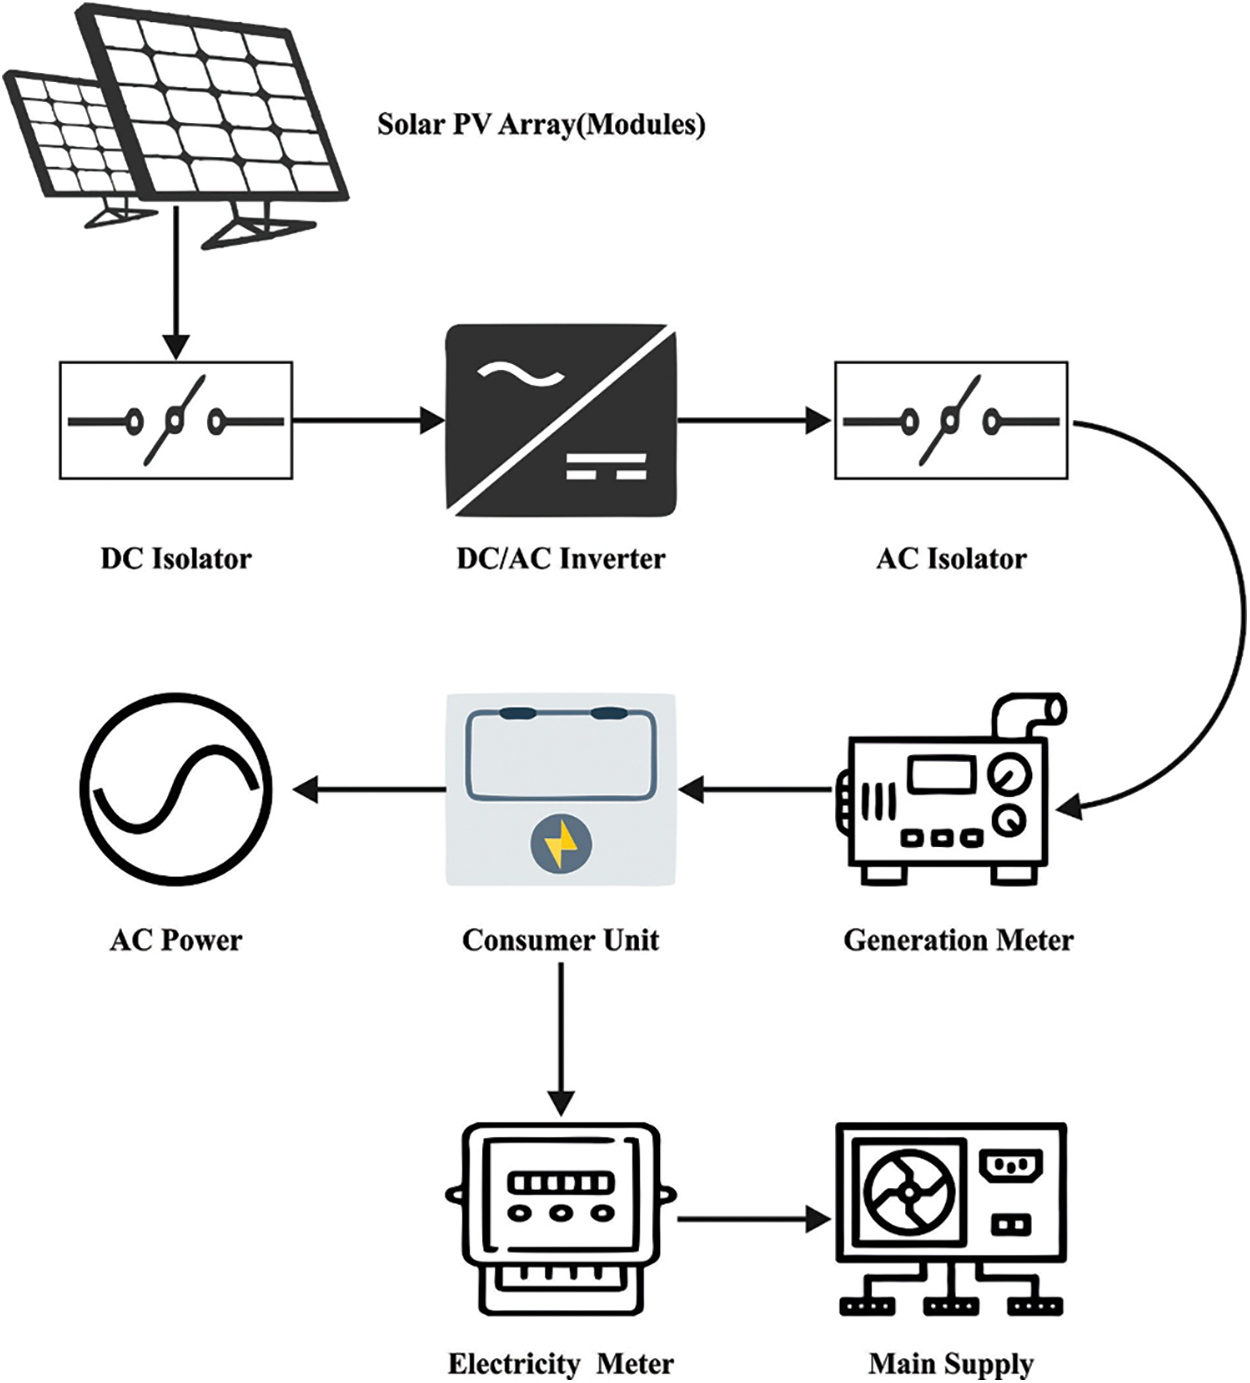
Figure 1: Process in solar photovoltaic power generation system
DL has been acquiring interest in recent times because of its capability in managing complicated data and the developments in computational power. In contrast, ML methods are highly stable on new datasets as varying the input to some extent does not influence the original hypothesis studied by the algorithm [10]. Numerous substructures of ANNs were implemented in a successful manner for forecasting renewable energy, from simpler ANN networks to more complicated methods such as self-organizing maps, LSTM networks, and auto-encoders. Self-organizing maps and Auto-encoder are unverified DL methods for encoding and classifying data, while LSTM network systems are utilised for time-sequence data prediction as a supervised learning methodology.
This article introduces a new Galactic Swarm Optimization with Deep Belief Network based Photovoltaic Power Generation Forecasting (GSODBN-PPGF) model. The presented GSODBN-PPGF model majorly focuses on the prediction of PV power output generation. The presented GSODBN-PPGF model applies a data scaling technique to normalise the data into a uniform format. In addition, the DBN model is applied to forecast the PV power generation output. To boost the forecasting output of the DBN model, the GSO algorithm has been utilized. The experimental validation of the GSODBN-PPGF model is assessed against existing methods.
The researchers in [11] suggest a hybrid method which incorporates ML techniques with Theta statistical methodology for a more precise estimation of upcoming solar power production from renewable energy machineries. The ML techniques involve gate recurrent unit (GRU), Auto Encoder long-short-term memory (Auto-LSTM), LSTM, and a newly presented Auto-GRU. For advancing the precision of the suggested Statistical Hybrid Model (MLSHM), ML uses 2 different methods: data diversity and structural diversity. In [12], an innovative short-term solar power estimation method is provided by using the learning capability of an LSTM-related DL approach and the idea of wavelet transform (WT). The LSTM with dropout related DL method has been proposed for predicting future solar energy production values over different time horizons.
The researchers in [13] provide an easier but efficient univariate method for predicting solar PV energy output many steps ahead. The goal is to maintain the higher level of preciseness of ML techniques for several steps ahead of estimation. At every prediction level, the suggested method initially acquires an innovative depiction of the novel time sequences on the basis of the resampling process. A separate prediction method was then applied for single-step estimation on the re-sampled time sequences. Theocharides et al. [14] evaluate the execution of distinct ML methods to estimate the power output of PV modules. In particular, a diversity of approaches has been seen, inculcating support vector regression (SVR), regression trees (RT), and ANNs with different features and hyper-parameters.
In [15], an enhanced applicable stacked ensemble method (DSE-XGB) was recommended by using 2 DL techniques such as LSTM and ANN as base methods for solar energy prediction. The estimations from those base methods have been validated with the use of an extreme gradient boosting technique for enhancing the precision of the solar PV production forecast. Zazoum [16] uses ML techniques to examine the relationship between solar photovoltaic (PV) power and a variety of input variables. Two diverse ML techniques like Gaussian process regression (GPR) and support vector machine (SVM) are compared. Dairi et al. [17] plan to offer effective short-term forecasting of solar power generation by utilising the Variational AutoEncoder (VAE) method. Implementing the VAE-driven DL method is anticipated to enhance forecasting precision due to its appropriate outcomes in flexible nonlinear approximation and time series modelling.
For the day-ahead forecasting of solar power output, Wang et al. [18] created a model based on the combination of CNN and LSTM that, when the input sequence is increased, exhibits superior forecasting accuracy than either method alone. More accurate hour-ahead solar power forecasting has been demonstrated by a physical constrained LSTM model (PC-LSTM) than by statistical and traditional machine learning models. This method’s predicting accuracy outperforms other benchmark approaches by 18.34%. Using actual field data, five-minute power production predictions have been made for a variety of PV technologies [19]. To maintain model robustness, none of this research has included deep learning-based PV power estimates for different PV power plants. To the authors’ knowledge, there is also a lack of a comparison between the deep learning approach and the regression, neural network, machine learning, and hybrid (ANFIS) methods put together. So, it is still possible to make a deep learning method that can predict the power output of a PV plant over a four-year period.
Olatomiwa et al. used a similar model in [20] to investigate the potential of support vector regression (SVR) for predicting solar radiation in Nigeria. They concluded that for estimating solar radiation at the study site, SVR with a polynomial basis outperforms SVR with a radial basis function and other approaches. To forecast the monthly mean horizontal global solar radiation, they suggested a hybrid machine learning strategy that combines a support vector machine (SVM) with a firefly algorithm (FFA). They concluded that the created SVM-FFA model might be rated as an effective machine learning method for precisely predicting horizontal global solar radiation. The approach, though, works best with linear data—not multivariate data.
The organisation of this paper is as follows: In Section 2, it gives an overview of the deep belief network approach. In Section 3, the proposed method and the solution procedures are described. Section 4 presents the test results obtained by using the proposed and other methods under comparison. It is followed by the conclusions in Section 5.
In this study, a novel GSODBN-PPGF technique has been developed for the prediction of PV power output generation. The presented GSODBN-PPGF model primarily utilised a min-max normalization-based data scaling technique to normalise the data into a uniform format. In addition, the GSODBN model is applied to forecast the PV power generation output.
Several spikes and non-stationary modules to predictive technique input data represented that the PV power production method was unsuitable for training and that this is an effort for higher forecast error. While the problems continuously occur, one of the techniques employs meteorological data and historical PV power output data as inputs, which are variable and unpredictable owing to meteorological conditions [21]. So, pre-processing of the input data could diminish the computational cost and unsuitable training issues, enhancing the accuracy of the model significantly. The accumulated data of PV power output involves night time values, in which case there is an existence of multiple zeros in the PV power output. The data sparsity issue arises since so many zero values result in an unwell trained method, influencing the execution of the method. So, the lack of data in the input data is seen as an important factor that could affect how accurate the predictions are.
The generation of electrical power by a photovoltaic (PV) system shifts in a dynamic manner with the passage of time due to the changeability of various meteorological conditions. As a result, developing a PVPG forecast that is both accurate and consistent is extremely complex and will likely continue to be so. The dataset utilised contains variables that are distinct in scale. In similar cases, whereas distinct variables may be entirely distinct scales, they may lead to false prioritisation from the method of any variable. Therefore, the feature scaling of the dataset was executed to help accelerate the computation under this technique and improve the convergence rate. If the dataset was trained, it would need fewer tests.
The purpose of processing data entries that fall within a variety of ranges into a single consistent range is to achieve the goal of reducing the amount of error caused by regression while keeping the correlation among the datasets intact. For this examination, the min-max normalisation technique is utilized. This method confines the data to falling somewhere in the range of zero to one. Normalization, which is executed at this point, is a general pre-processed approach that decreases the dispersion of gathered data. Every piece of data has been rescaled in a specific range from zero to one. The dataset has been normalised by calculating:
where as
The works revealed that normalised data has a significant impact on the outcome of several techniques, as the main goal of normalised data is to ensure the quality of data before it can be fed into many techniques.
3.2 DBN Based Prediction Model
Once the input data is pre-processed, the DBN model is applied to forecast the PV power generation output. The DBN comprises multiple layers of neural networks that can be classified into hidden and visible layers [22]. The hidden layer is utilised for extracting features, and the visible layer is utilised for accepting inputs. The DBN is considered a DNN model that is comprised of single-layer BPNN and multi-layer unsupervised RBM networks. The DBN is layer-wise trained, which initialises the vector in the first unit, viz., layer-wise mapping from the initial layer. The
Likewise, the reconstructed error of the secondary layer of the DBN is transmitted to the next layer, and so forth until it reaches the final layer of the DBN. The DBN is layer-wise trained. It cannot guarantee that the eigenvector of the entire network layers is mapped nonlinearly to the best via training, but it only guarantees that the weight of all the layers is mapped non-linearly to the eigenvector of the present layer to accomplish the best. Thus, the output dataset of DBN is inputted to the BPNN for learning the trained dataset, besides the learning rate
In Eq. (2), the desired output is represented as
As per the abovementioned error gradient value, the concrete structure durability predictive module is established. The gradient at time
In the durability predictive module of concrete structure, the training and testing dataset are inputted for model training, and output layer can be denoted by
In Eq. (10), the state of the DBN memory model is characterized by the term
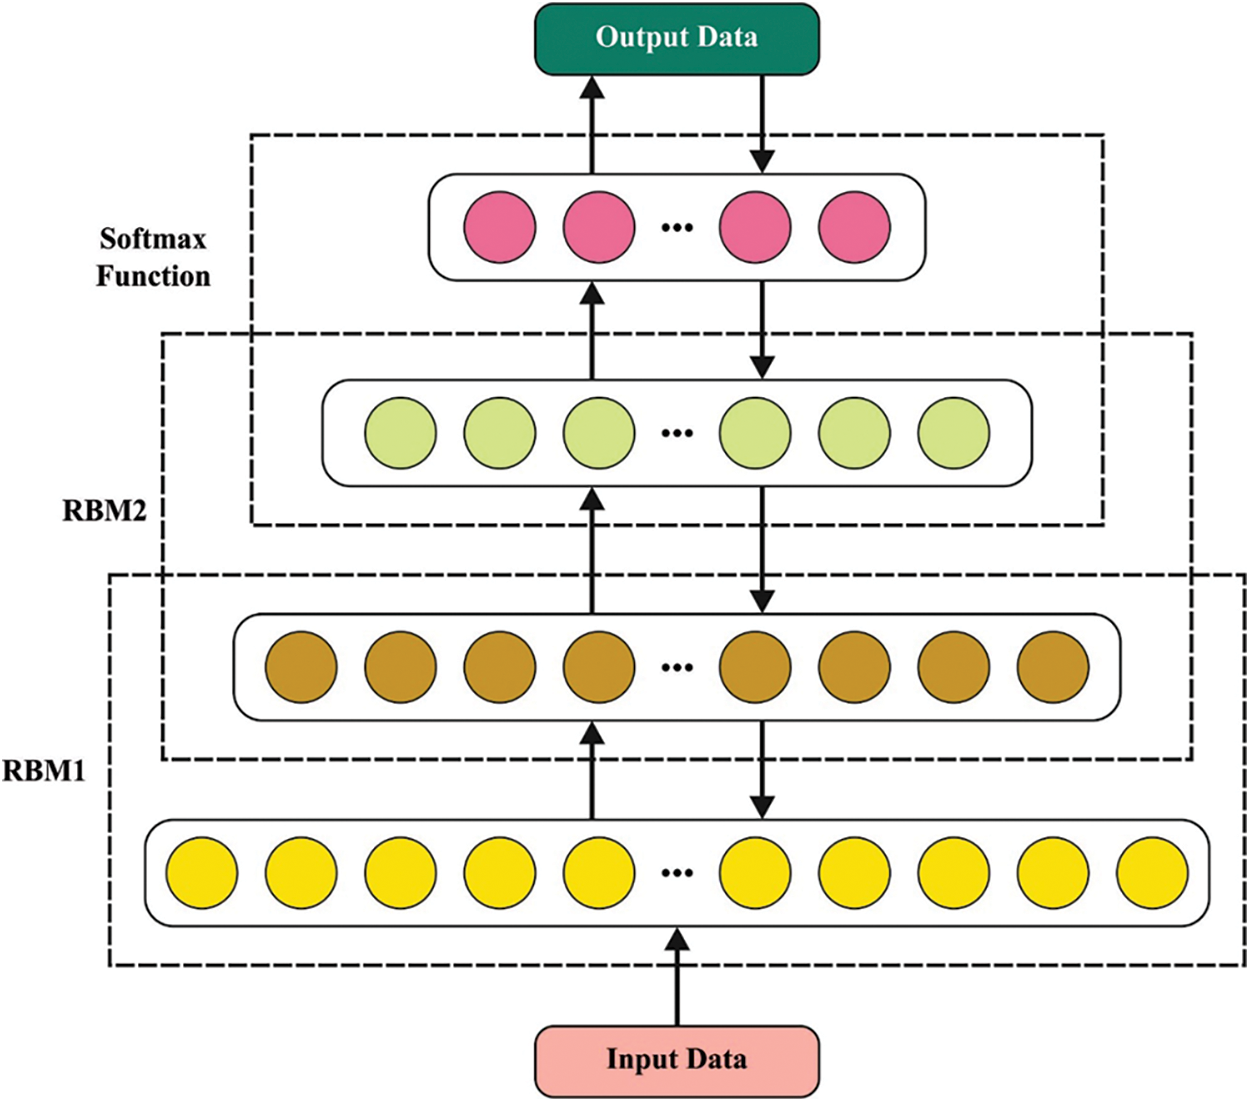
Figure 2: Structure of DBN model
3.3 Hyperparameter Tuning Process
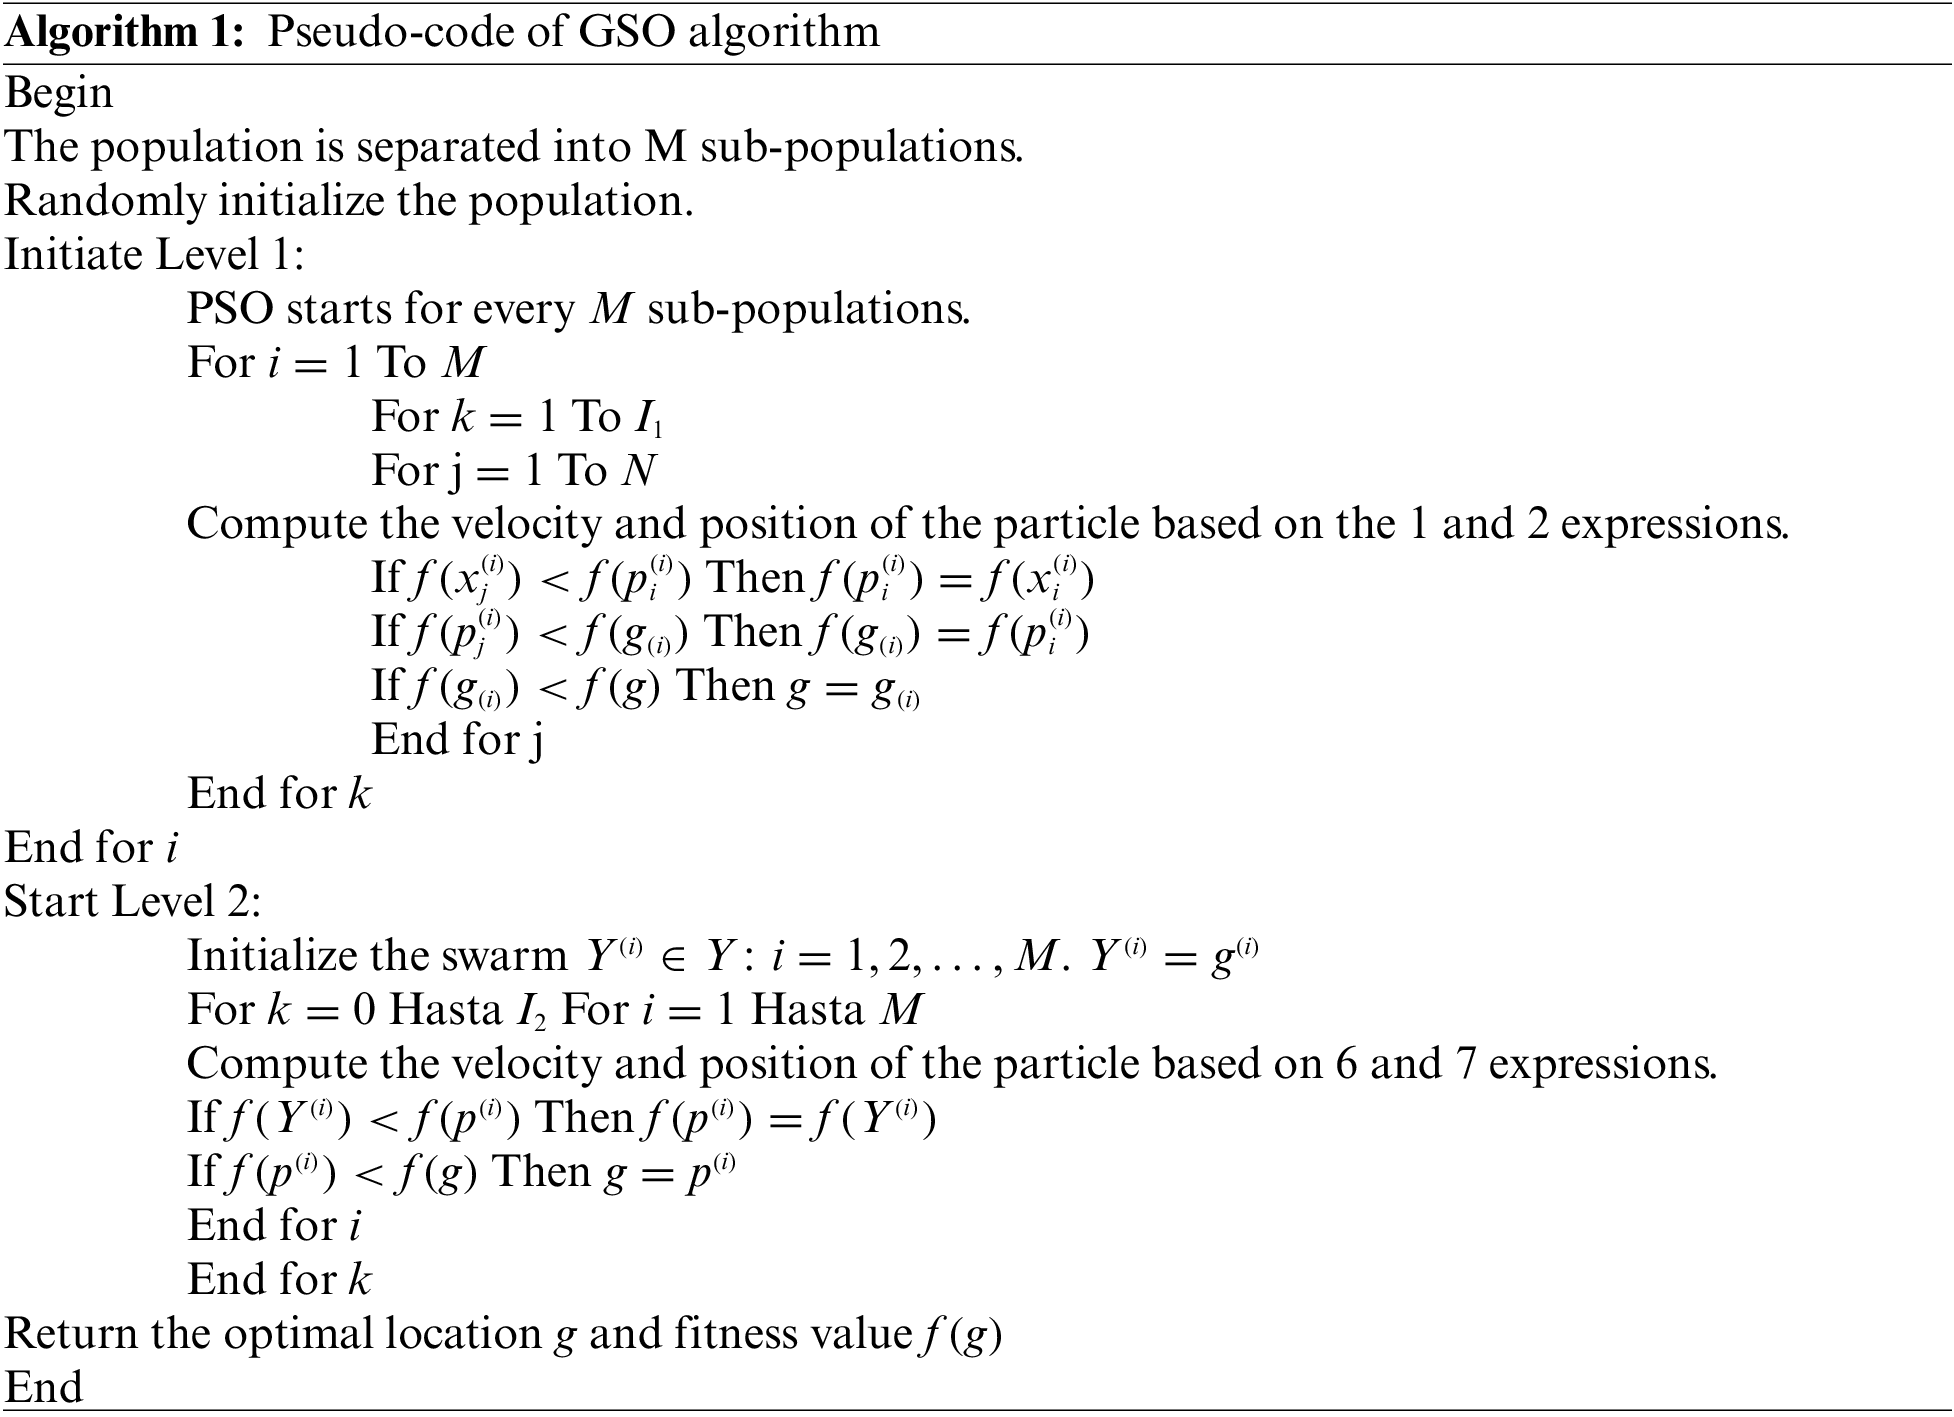
Subbulakshmi et al. [23] propose Global Galactic Swarm Optimization. GSO is inspired by stars, motion clusters, and superclusters. In GSO, algorithm stars orbit the galaxy. Superclusters revolve cosmically. Each cosmic system presented the global-best solutions, and GSO had many algorithms to mimic a solution search, starting in a random area. GSO investigates the behaviour of supercluster stars. First, PSO uses exploration and exploitation cycle patterns to find better and new solutions. GSO uses real-life issues and global advancements to test the effectiveness of its algorithms.
First, GSO is affected by gravity, pulling stars toward other stars with strong gravity. Based on this idea, the growth of stars in the universe is the growth of cosmic systems that can be used to make GSO calculations.
• Individual systems led to greater ones (better arrangements) in the universe. PSO calculates fascination.
• Globally, the best cosmic systems are treated as a super swarm. PSO uses another time to calculate super swarm particle growth. The GSO Algorithm presents Muthiah-Nakarajan’s GSO pseudocode.
For improving the forecasting output of the DBN model, the GSO algorithm has been utilised for the hyper-parameter tuning process. Muthiah-Nakarajan et al. developed a GSO algorithm that has been shown to act properly when confronting multi-modal problems and with a higher number of dimensions. Meanwhile, it exhibits multiple cycles of exploitation and exploration that increase the chance of getting the best solution and not getting trapped in local minimal. In GSO [24,25], a set
The purpose of having numerous swarms exploring simultaneously is to result in a good exploration of probable solutions because every sub-swarm individually explores the searching region [29,30]. The GSO approach begins the iteration by evaluating the velocity and location of the particle.
From the equation, the present velocity is
The present iteration is
Here, the global optimal solution is of greater significance because they participated in the supercluster formation, we have a super-swarm
Like level 1, here the velocity and location of the particles are evaluated by the PSO approach. The equation shows small modifications different from those utilised in level 1:
Here,
Here, the sub-swarm movement in level 1 primarily comprises of the exploration phase and level 2 comprises of the exploitation phase, such that the algorithm substitutes amongst the exploitation and exploration. The process of GSO is summarised in the following. In this case, the GSO technique was projected for tuning the hyper-parameters of the DBN method. The GSO approach develops a fitness function (FF) utilising the minimised mean square error (MSE) as provided under. The mean square deviation between expected and observed data is determined using the MSE. The average difference between projected and actual values is known as the mean absolute error, or MAE. The correlation coefficient shows how strong and in which direction two variables are related in a linear way.
where as
This section examines the PVPG prediction outcomes of the GSODBN-PPGF model on two typical PV plants, namely plant 1 and plant 1. In addition, the PVPG values are predicted for a duration of three months in both plants, namely April, May, and June.
The PVPG prediction outcomes of the GSODBN-PPGF model with other prediction models on plant 1 for the April month are provided in Table 1 and Fig. 3. The experimental results indicated that the GSODBN-PPGF model has accomplished effective predicted outcomes under varying hours of operation. For instance, with 10 hrs and an observed value of 0.465, the GSODBN-PPGF model has predicted a closer value of 0.440, whereas the ARMA, LSTM, and KNN models have obtained PVPG values of 0.349, 0.488, and 0.478, respectively. Besides, with 40 hrs and an observed value of 0.057, the GSODBN-PPGF model has foreseen a closer value of 0.029, whereas the ARMA, LSTM, and KNN models have attained the PVPG values of 0.109, 0.179, and 0.008 respectively.
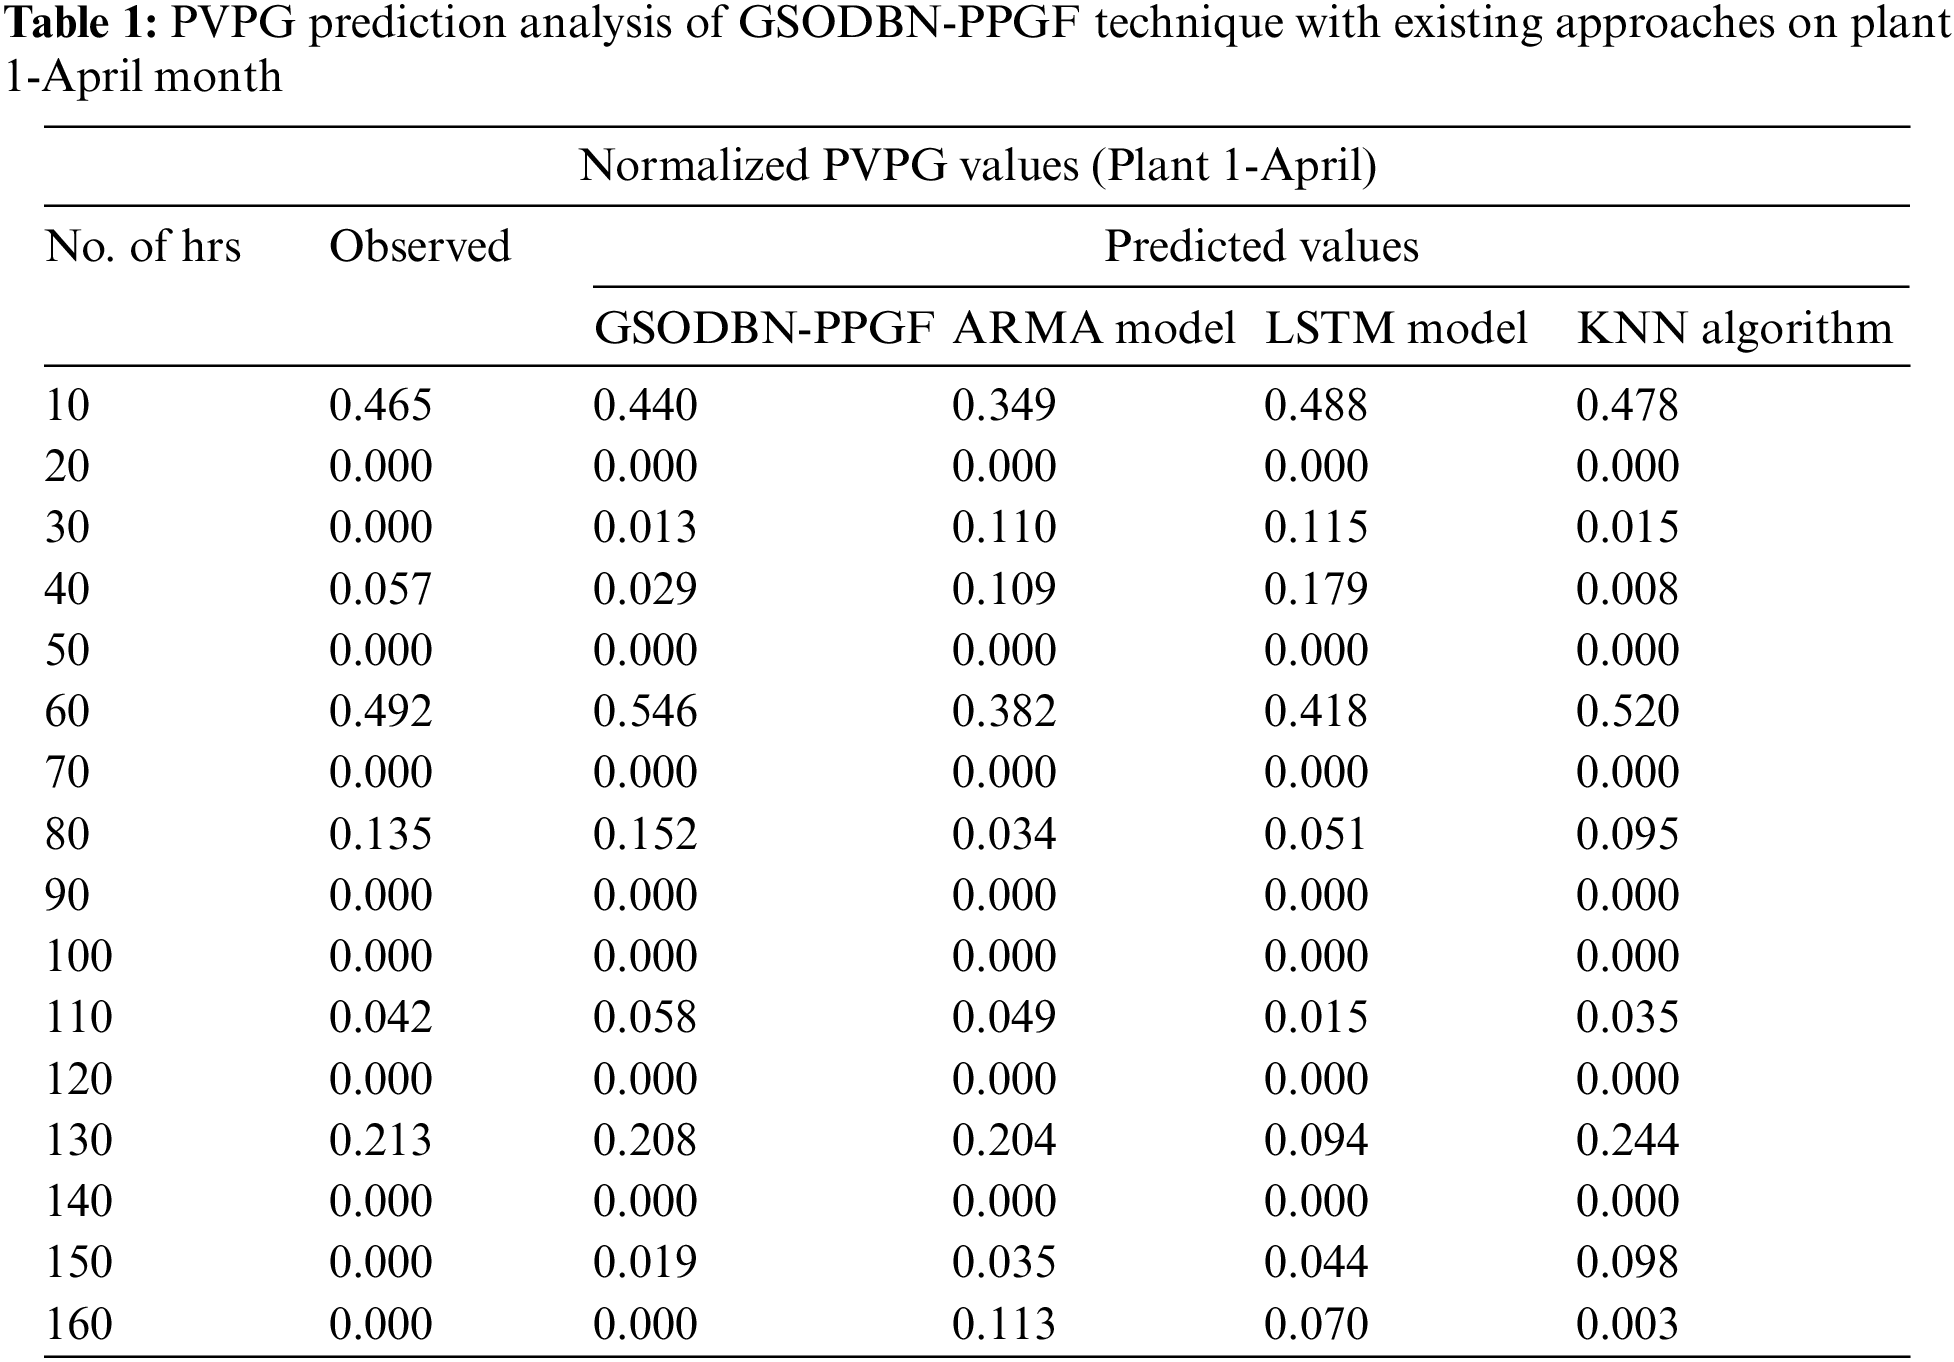
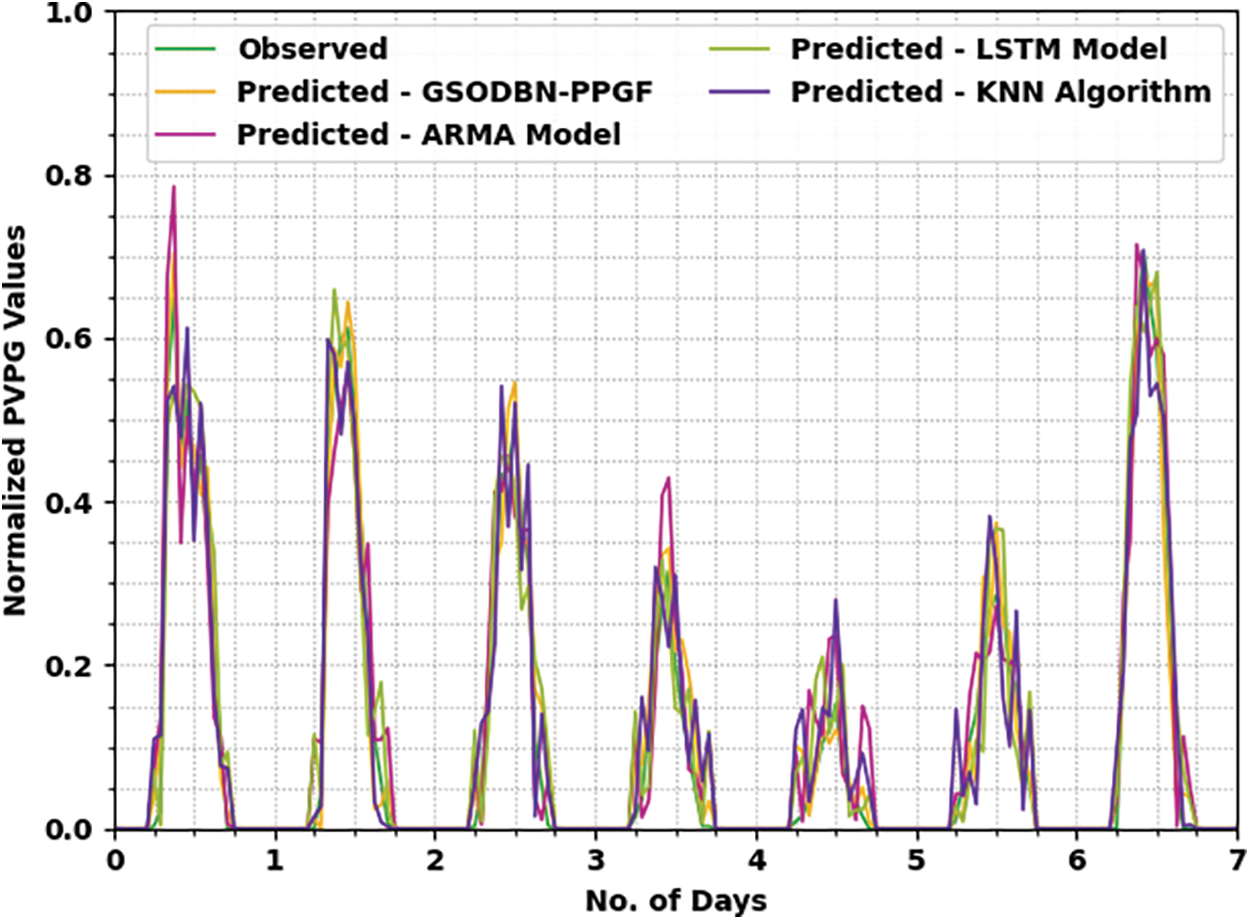
Figure 3: PVPG prediction analysis of GSODBN-PPGF technique on plant 1-April month
The PVPG prediction outcomes of the GSODBN-PPGF model with other prediction models on plant 1-May month are provided in Table 2 and Fig. 4. The experimental results indicated that the GSODBN-PPGF model has accomplished effective predicted outcomes under varying hours of operation. For instance, with 10 hrs and an observed value of 0.516, the GSODBN-PPGF model has predicted a closer value of 0.569, whereas the ARMA, LSTM, and KNN models have obtained PVPG values of 0.541, 0.552, and 0.609, respectively. Besides, with 40 hrs and an observed value of 0.038, the GSODBN-PPGF model has foreseen a closer value of 0.061, whereas the ARMA, LSTM, and KNN models have attained the PVPG values of 0.176, 0.101, and 0.102, respectively.
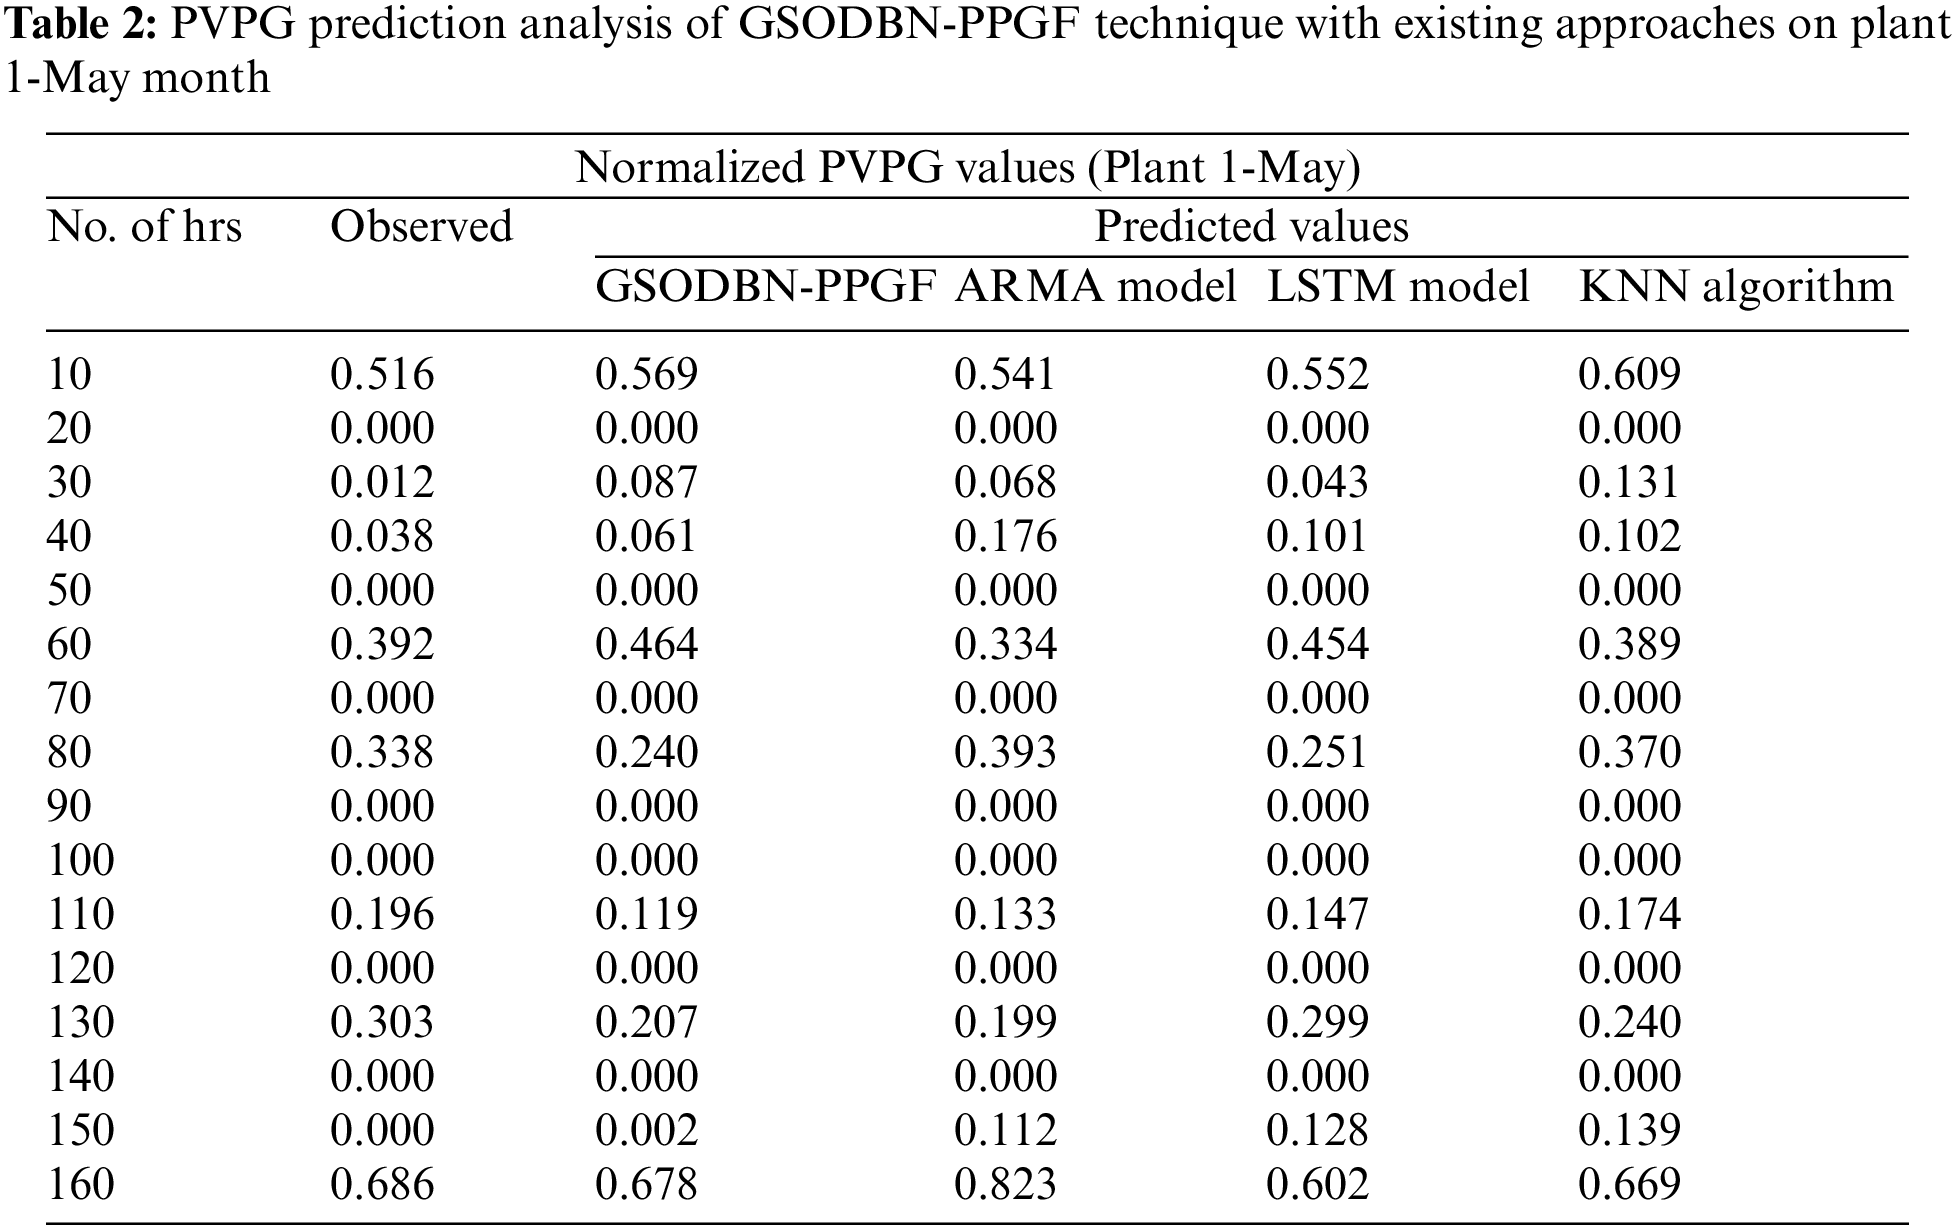

Figure 4: PVPG prediction analysis of GSODBN-PPGF technique on plant 1-May month
The PVPG prediction outcomes of the GSODBN-PPGF technique with other prediction methodologies on plant 1-June month are offered in Table 3 and Fig. 5. The experimental outcomes demonstrate that the GSODBN-PPGF system has established effective predicted outcomes under varying hours of operation. For example, with 10 h and an observed value of 0.585, the GSODBN-PPGF approach has predicted a closer value of 0.541, whereas the ARMA, LSTM, and KNN methods have reached the PVPG values of 0.671, 0.553, and 0.715 correspondingly. Also, with 40 hrs and an observed value of 0.024, the GSODBN-PPGF method has foreseen a closer value of 0.085, whereas the ARMA, LSTM, and KNN algorithms have reached the PVPG values of 0.080, 0.098, and 0.013 correspondingly.


Figure 5: PVPG prediction analysis of GSODBN-PPGF technique on plant 1-June month
Table 4 and Fig. 6 present the PVPG prediction results of the GSODBN-PPGF system with other prediction techniques on plant 2-April month. The experimental outcomes represented by the GSODBN-PPGF method have established effective predicted outcomes under varying hours of operation. For instance, with 10 hrs and an observed value of 0.558, the GSODBN-PPGF approach has predicted a closer value of 0.547, whereas the ARMA, LSTM, and KNN models have gained the PVPG values of 0.653, 0.445, and 0.478 correspondingly. In addition to this, with 40 hrs and an observed value of 0.112, the GSODBN-PPGF methodology has foreseen the closer value of 0.160, whereas the ARMA, LSTM, and KNN algorithms have acquired the PVPG values of 0.238, 0.225, and 0.220 correspondingly.
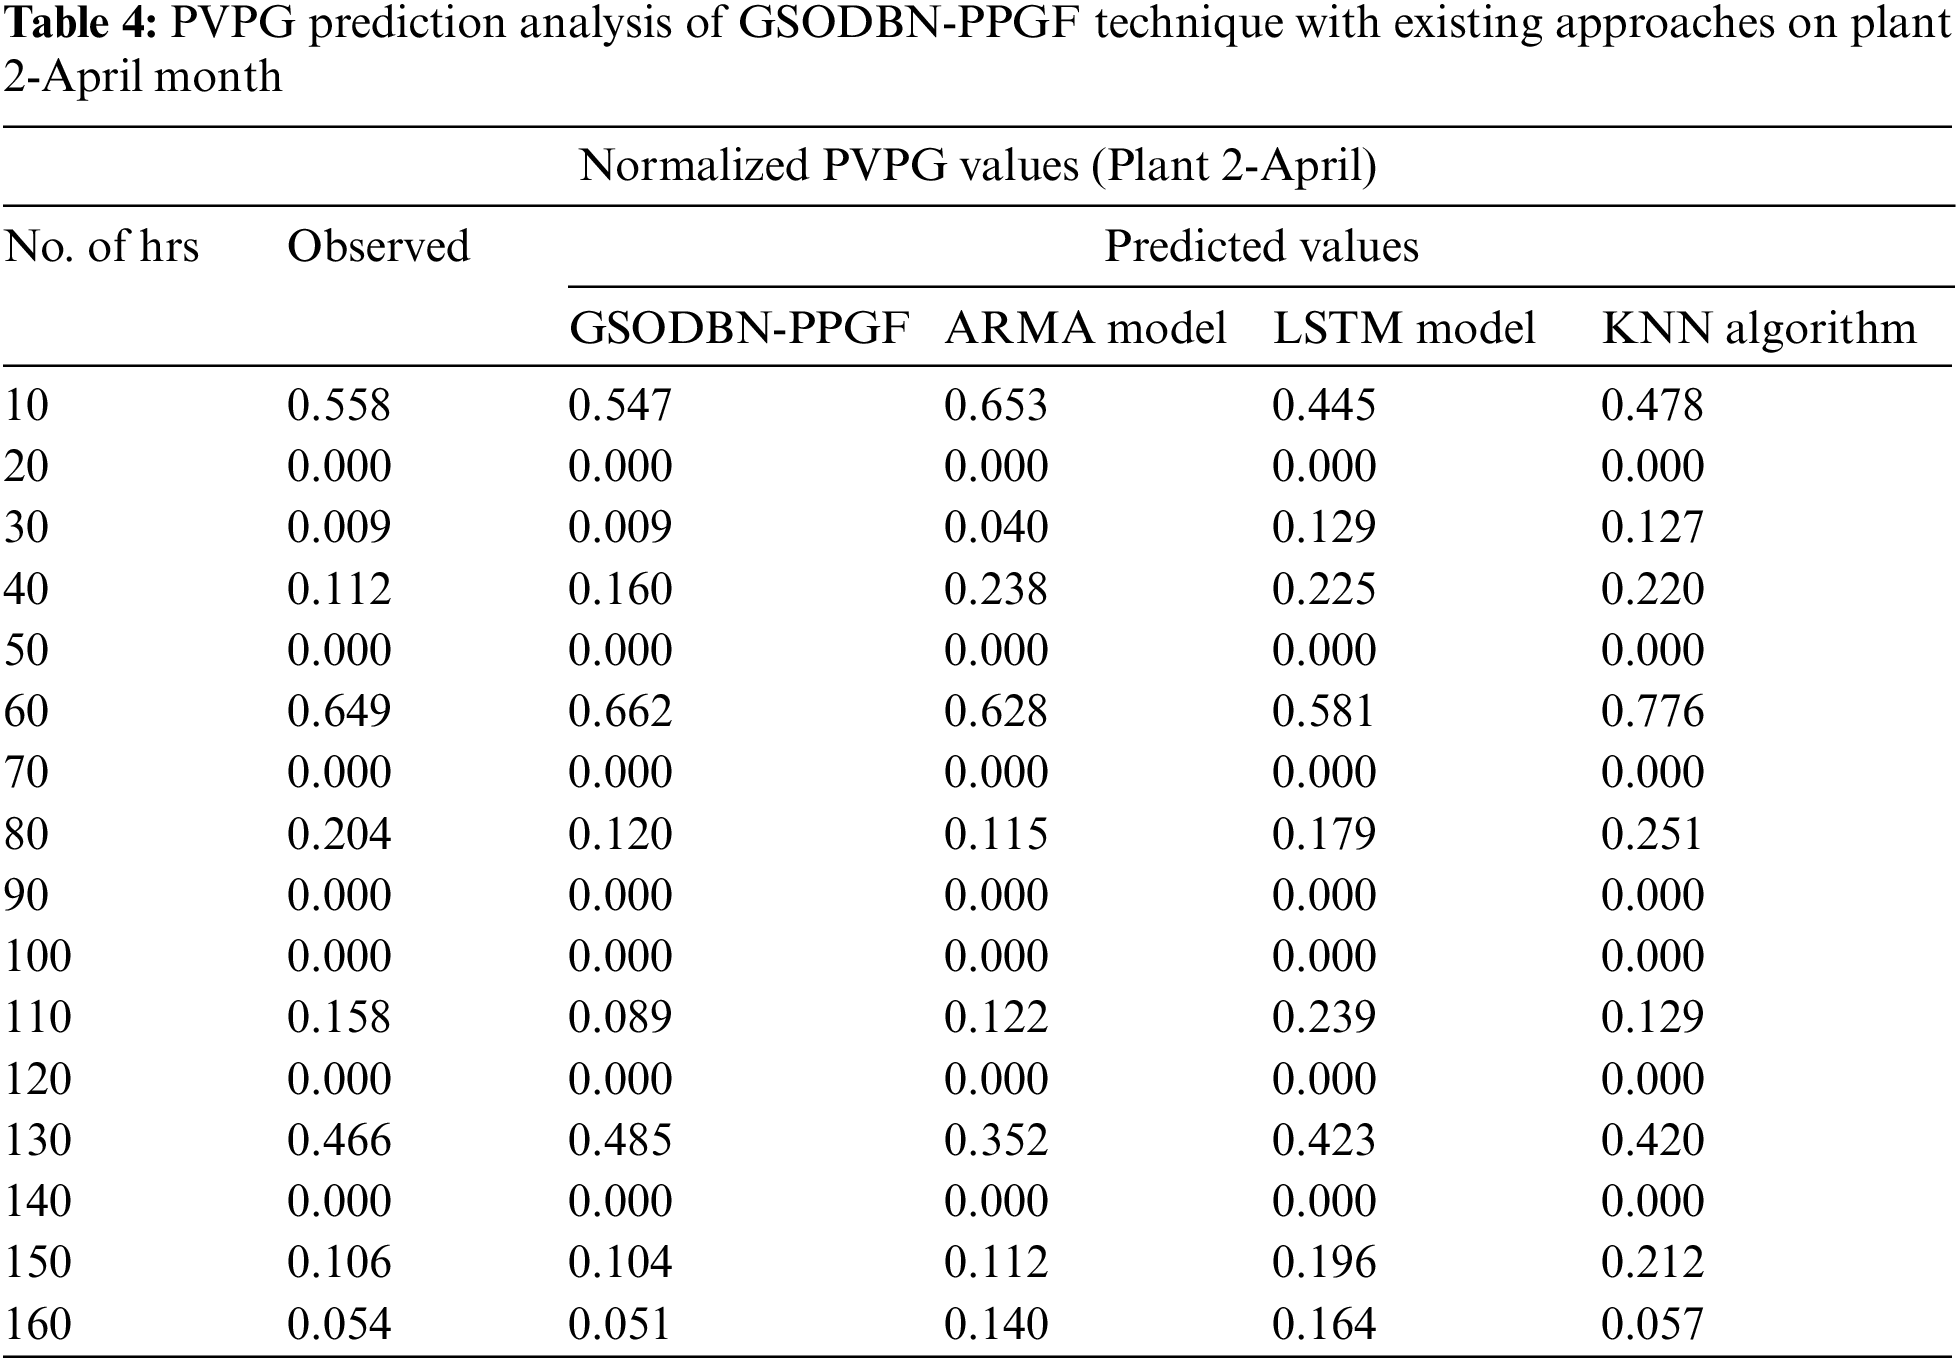

Figure 6: PVPG prediction analysis of GSODBN-PPGF technique on plant 2-April month
The PVPG prediction outcomes of the GSODBN-PPGF system with other prediction models on plant 1-May month are shown in Fig. 7 and Table 5. The experimental results show the GSODBN-PPGF method has established effective predicted outcomes under varying hours of operation. For example, with 10 hrs and an observed value of 0.589, the GSODBN-PPGF algorithm has predicted a closer value of 0.611, whereas the ARMA, LSTM, and KNN models have gained the PVPG values of 0.485, 0.619, and 0.679 correspondingly.
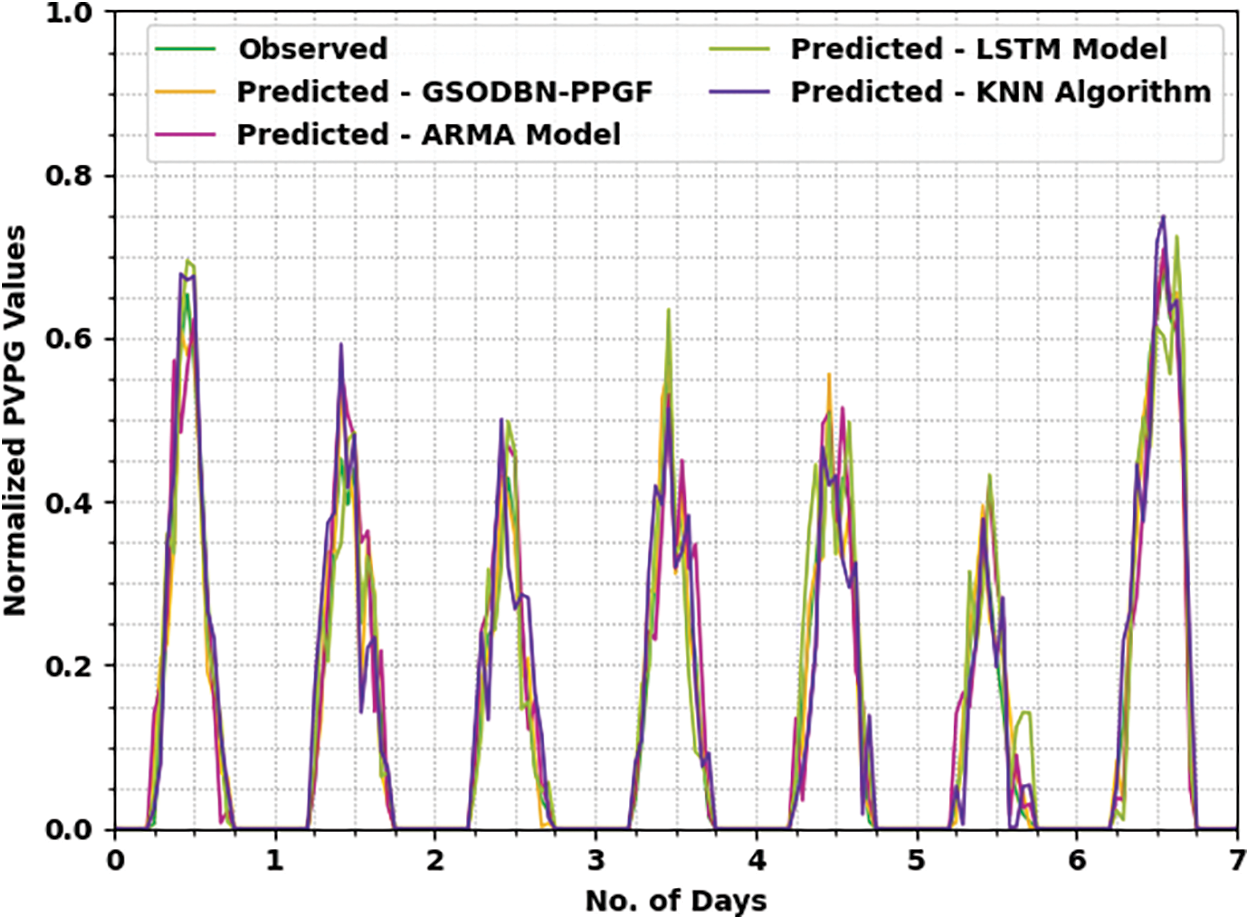
Figure 7: PVPG prediction analysis of GSODBN-PPGF technique on plant 2-May month
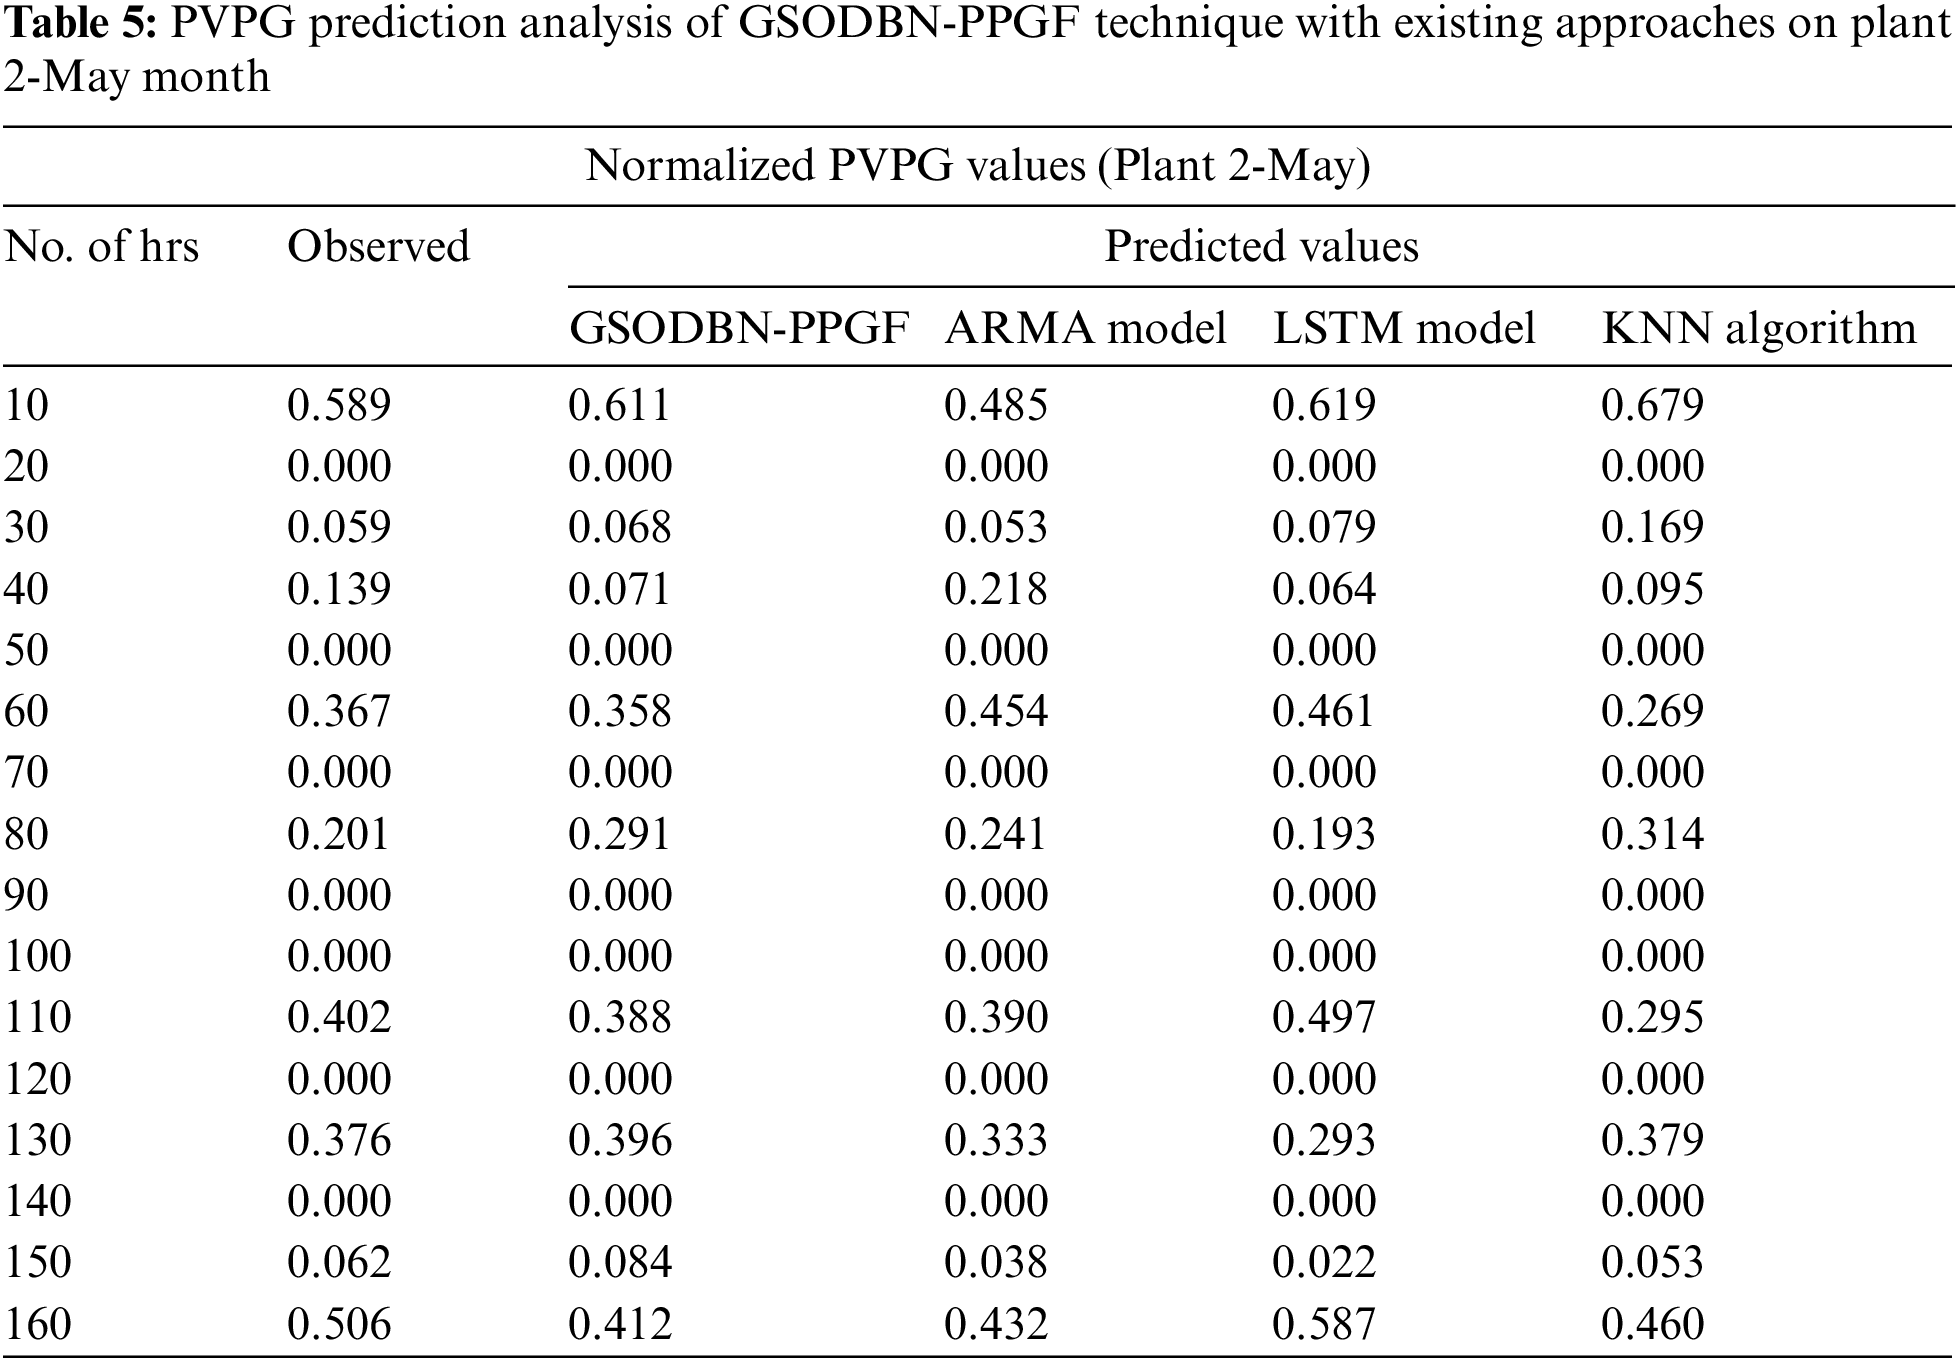
Also, with 40 h and an observed value of 0.139, the GSODBN-PPGF method has foreseen a closer value of 0.071, whereas the ARMA, LSTM, and KNN methodologies have gained PVPG values of 0.218, 0.064, and 0.095 correspondingly.
In this study, a novel GSODBN-PPGF technique has been developed for the prediction of PV power output generation. The presented GSODBN-PPGF model primarily utilised a min-max normalization-based data scaling technique to normalise the data into a uniform format. In addition, the DBN model is applied to forecast the PV power generation output. To boost the forecasting output of the DBN model, the GSO algorithm has been utilized. The experimental validation of the GSODBN-PPGF model is assessed against existing methods. An extensive set of simulation analyses highlighted the improved performance of the GSODBN-PPGF model over recent approaches. There is a discrepancy between what the algorithm anticipated (0.002) and what was observed (0.063) after 40 h. As revealed by the experiments, the GSODBN-PPGF model beat the other PVPG prediction models. Thus, the GSODBN-PPGF technique can be applied for effectual PVPG prediction outcomes. In the future, the proposed GSODBN-PPGF model can be extended to the design of ensemble voting-based fusion models. Increasing PV plant penetration as a source of electricity has brought attention to forecasting their power output across different time horizons. Due to PV’s intermittent nature, it’s hard to anticipate short-term output for operations planning. This work proposes integrating a data pre-processing based on grey theory and a DBN with supervised learning to forecast 24-h PV output. Observing test results, the suggested model’s forecast accuracy is better than the DBN model alone, especially when PV output changes widely. The suggested model's forecast accuracy and computational efficiency are superior to other models.
Applications of these techniques include solar-powered transportation systems such as buses and cars. The technologies required to run such a system are in continuous development. The parameters that need to be assessed and examined do not only include the PV capabilities but also aspects that are related to the vehicles, such as power requirements, utility patterns, the required acceleration and deceleration rate, and the type and capacity of the storage modules, among many others. To expand the applicability of the presented model, future research will examine novel strategies that integrate the DBN for multi-area, large-scale PV power output projections while accounting for PV output changes caused by meteorological and geographical variables. Thus, the overall PV output may be adjusted more precisely to improve system operation planning and maintain dependability requirements.
Funding Statement: This research project was funded by the Deanship of Scientific Research, Princess Nourah bint Abdulrahman University, through the Program of Research Project Funding after publication, Grand No. PRFA-P-42-16.
Conflicts of Interest: The authors declare that they have no conflicts of interest to report regarding the present study.
References
1. M. N. Akhter, S. Mekhilef, H. Mokhlis and N. Mohamed Shah, “Review on forecasting of photovoltaic power generation based on machine learning and metaheuristic techniques,” IET Renewable Power Generation, vol. 13, no. 7, pp. 1009–1023, 2019. [Google Scholar]
2. B. M. Hardas, “Optimization of peak to average power reduction in OFDM,” Journal of Communications Technology and Electronics, vol. 62, no. 4, pp. 1388–1395, 2017. [Google Scholar]
3. K. Mahmud, S. Azam, A. Karim, S. Zobaed, B. Shanmugam et al., “Machine learning based PV power generation forecasting in alice springs,” IEEE Access, vol. 9, no. 6, pp. 46117–46128, 2021. [Google Scholar]
4. Y. Alotaibi, S. Alghamdi, O. I. Khalaf and S. Ulaganathan, “Improved metaheuristics-based clustering with multihop routing protocol for underwater wireless sensor networks,” Sensors, vol. 22, no. 3, pp. 1–22, 2022. [Google Scholar]
5. A. Khandakar, M. EH Chowdhury, M. Khoda Kazi, K. Benhmed, F. Touati et al., “Machine learning based photovoltaics (PV) power prediction using different environmental parameters of Qatar,” Energies, vol. 12, no. 14, pp. 2782, 2019. [Google Scholar]
6. S. Theocharides, G. Makrides, A. Livera, M. Theristis, P. Kaimakis et al., “Day-ahead photovoltaic power production forecasting methodology based on machine learning and statistical post-processing,” Applied Energy, vol. 268, no. 1, pp. 1–15, 2020. [Google Scholar]
7. P. Mohan and R. Thangavel, “Resource selection in grid environment based on trust evaluation using feedback and performance,” American Journal of Applied Sciences, vol. 10, no. 8, pp. 924–930, 2013. [Google Scholar]
8. M. Khodayar, M. E. Khodayar and S. M. J. Jalali, “Deep learning for pattern recognition of photovoltaic energy generation,” The Electricity Journal, vol. 34, no. 1, pp. 1–15, 2021. [Google Scholar]
9. A. Agga, A. Abbou, M. Labbadi, Y. El Houm and I. H. O. Ali, “CNN-LSTM: An efficient hybrid deep learning architecture for predicting short-term photovoltaic power production,” Electric Power Systems Research, vol. 208, no. 2, pp. 1–15, 2022. [Google Scholar]
10. M. Sundaram, S. Satpathy and S. Das, “An efficient technique for cloud storage using secured de-duplication algorithm,” Journal of Intelligent & Fuzzy Systems, vol. 42, no. 2, pp. 2969–2980, 2021. [Google Scholar]
11. P. Subbulakshmi and P. Mohan, “Mitigating eavesdropping by using fuzzy based MDPOP-Q learning approach and multilevel Stackelberg game theoretic approach in wireless CRN,” Cognitive Systems Research, vol. 52, no. 4, pp. 853–861, 2018. [Google Scholar]
12. M. Mishra, P. B. Dash, J. Nayak, B. Naik and S. K. Swain, “Deep learning and wavelet transform integrated approach for short-term solar PV power prediction,” Measurement, vol. 166, no. 2, pp. 1–15, 2020. [Google Scholar]
13. M. Rana and A. Rahman, “Multiple steps ahead solar photovoltaic power forecasting based on univariate machine learning models and data re-sampling,” Sustainable Energy Grids and Networks, vol. 21, no. 2, pp. 1–12, 2020. [Google Scholar]
14. S. Theocharides, G. Makrides, G. E. Georghiou and A. Kyprianou, “Machine learning algorithms for photovoltaic system power output prediction,” in 2018 IEEE Int. Energy Conf. (ENERGYCON), Limassol, Cyprus, pp. 1–6, 2018. [Google Scholar]
15. S. Sambit, A. Padthe, M. Chandra Trivedi, V. Goyal and K. B. Bidyut, “Method for measuring supercapacitor’s fundamental inherent parameters using its own self-discharge behavior: A new steps towards sustainable energy,” Sustainable Energy Technologies and Assessments, vol. 53, no. 10, pp. 1–7, 2022. [Google Scholar]
16. B. Zazoum, “Solar photovoltaic power prediction using different machine learning methods,” Energy Reports, vol. 8, no. 2, pp. 19–25, 2022. [Google Scholar]
17. A. Dairi, F. Harrou, Y. Sun and S. Khadraoui, “Short-term forecasting of photovoltaic solar power production using variational auto-encoder driven deep learning approach,” Applied Sciences, vol. 10, no. 23, pp. 53–64, 2020. [Google Scholar]
18. K. Wang, X. Qi and H. Liu, “A comparison of day-ahead photovoltaic power forecasting models based on deep learning neural network,” Applied Energy, vol. 251, no. 4, pp. 113315, 2019. [Google Scholar]
19. I. O. Nour-eddine, B. Lahcen, O. H. Fahd, B. Amin and O. Aziz, “Power forecasting of three silicon-based PV technologies using actual field measurements,” Sustainable Energy ad Technologies Assessment, vol. 43, no. 6, pp. 1–13, 2021. [Google Scholar]
20. L. Olatomiwa, S. Mekhilef, S. Shamshirband and D. Petkovic, “Potential of support vector regression for solar radiation prediction in Nigeria,” Natural Hazards, vol. 77, no. 2, pp. 1055–1068, 2015. [Google Scholar]
21. P. Santhosh Kumar, B. Sathya Bama, D. Chiranjit Dutta and B. Vijendra, “Green energy aware and cluster-based communication for future load prediction in IoT,” Sustainable Energy Technologies and Assessments, vol. 52, no. 6, pp. 1–13, 2022. [Google Scholar]
22. N. Subramani, A. Youseef, A. Saleh and I. K. Osamah, “An efficient metaheuristic-based clustering with routing protocol for underwater wireless sensor networks,” Sensors, vol. 22, no. 2, pp. 1–15, 2022. [Google Scholar]
23. P. Subbulakshmi and V. Ramalakshmi, “Honest auction based spectrum assignment and exploiting spectrum sensing data falsification attack using stochastic game theory in wireless cognitive radio network,” Wireless Personal Communications-An International Journal, vol. 102, no. 2, pp. 799–816, 2018. [Google Scholar]
24. D. Paulraj and P. Ezhumalai, “A deep learning modified neural network (dlmnn) based proficient sentiment analysis technique on twitter data,” Journal of Experimental & Theoretical Artificial Intelligence, vol. 34, pp. 1–20, 2022. [Google Scholar]
25. M. Prakash and T. Ravichandran, “An efficient resource selection and binding model for job scheduling in grid,” European Journal of Scientific Research, vol. 81, no. 4, pp. 450–458, 2012. [Google Scholar]
26. C. Pretty Diana Cyril, J. Rene Beulah, A. Harshavardhan and D. Sivabalaselvamani, “An automated learning model for sentiment analysis and data classification of Twitter data using balanced CA-SVM,” Concurrent Engineering: Research and Applications, vol. 29, no. 4, pp. 386–395, 2021. [Google Scholar]
27. D. Ming, W. Lei and B. Rui, “Short-term prediction model of output power of photovoltaic power generation system based on improved BP neural network,” Power System Protection and Control, vol. 40, no. 11, pp. 93–99, 2012. [Google Scholar]
28. S. H. Oudjana, A. Hellal and I. H. Mahamed, “Short term photovoltaic power generation forecasting using neural network,” in Proc. of the 11th Int. Conf. on Environment and Electrical Engineering (EEEIC), Venice, Italy, pp. 706–711, 2012. [Google Scholar]
29. B. T. Geetha, A. K. Nanda, A. M. Metwally, M. Santhamoorthy and M. S. Gupta, “Metaheuristics with deep transfer learning enabled detection and classification model for industrial waste management,” Chemosphere, vol. 308, no. 7, pp. 1–20, 2022. [Google Scholar]
30. S. B. Pokle, “Analysis of OFDM system using DCT-PTS-SLM based approach for multimedia applications,” Cluster Computing, vol. 22, no. 2, pp. 4561–4569, 2019. [Google Scholar]
Cite This Article
 Copyright © 2023 The Author(s). Published by Tech Science Press.
This work is licensed under a Creative Commons Attribution 4.0 International License , which permits unrestricted use, distribution, and reproduction in any medium, provided the original work is properly cited.
 Downloads
 Citation Tools