
 Submit a Paper
 Propose a Special lssue
 Open Access
ARTICLE

An Improved Granulated Convolutional Neural Network Data Analysis Model for COVID-19 Prediction
1 The Artificial Intelligence College, Chongqing Technology and Business University, Chongqing, 400067, China
2 Chongqing Key Laboratory of IntelliSense and Blockchain Technology, Chongqing, 400067, China
* Corresponding Author: Lianggui Tang. Email:
Intelligent Automation & Soft Computing 2023, 37(1), 179-198. https://doi.org/10.32604/iasc.2023.036684
Received 09 October 2022; Accepted 13 December 2022; Issue published 29 April 2023
 View Full Text
 Download PDF
Abstract
As COVID-19 poses a major threat to people’s health and economy, there is an urgent need for forecasting methodologies that can anticipate its trajectory efficiently. In non-stationary time series forecasting jobs, there is frequently a hysteresis in the anticipated values relative to the real values. The multilayer deep-time convolutional network and a feature fusion network are combined in this paper’s proposal of an enhanced Multilayer Deep Time Convolutional Neural Network (MDTCNet) for COVID-19 prediction to address this problem. In particular, it is possible to record the deep features and temporal dependencies in uncertain time series, and the features may then be combined using a feature fusion network and a multilayer perceptron. Last but not least, the experimental verification is conducted on the prediction task of COVID-19 real daily confirmed cases in the world and the United States with uncertainty, realizing the short-term and long-term prediction of COVID-19 daily confirmed cases, and verifying the effectiveness and accuracy of the suggested prediction method, as well as reducing the hysteresis of the prediction results.Keywords
The World Health Organization has classified the COVID-19 virus as a public health emergency of global concern since it is now spreading quickly around the world [1]. Global public health is directly at risk from COVID-19 [2,3]. especially in light of the current influenza pandemic and the spread of other respiratory viruses. Although countries’ capacities for preventing, identifying, and managing outbreaks vary widely, the spread of COVID-19 will continue for the foreseeable future [4,5].
Kumari et al. [6] applied correlation coefficients and multiple linear regression for prediction and predicted the number of confirmed, recovered, and fatal cases caused by COVID-19 in India, suggesting that confinement and social alienation are two important factors that could help curb the increasing rate of COVID-19 transmission. In COVID-19 prediction studies, several attempts and efforts have been made, including the prediction of COVID-19 trends by taking into account border control mechanisms [7], stochastic transmission models [8], survival models [9], particle swarm optimization algorithms [10], improved Fuzzy C-Means (FCM) with the principle of refined justifiable granularity [11], interval dominance degree (IDD) and interval overlap degree (IOD) [12]. the mode-dependent average impulsive interval and induction method [13]. The SEIR model incorporated population mobility data with the most recent COVID-19 epidemiological data, and the model was trained using artificial intelligence on SARS data to anticipate outbreaks [14], the SEIR model equations were adjusted to include the impacts of the blockade, vaccination, and reinfection [15]. The susceptible, infected, and recovered (SIR) model and the SEIR model are two of the epidemic models that current researchers have created to predict short- and long-term epidemics [16–18]. The main distinction between SIR [19] and SEIR models [20] is that SEIR takes into account the new coronavirus transmission, which is more in line with COVID-19’s transmission characteristics. The amended SEIR model can accurately match the data for the novel coronavirus by modeling the effects of the blockade and other influencing variables on COVID-19 transmission. The SEIR model can fit any data for given states and anticipate the development of COVID-19 infection in a particular population thanks in part to a genetic algorithm that was created to adapt these population-dependent parameters [21].
For machine learning, the COVID-19 prediction used a combination of an artificial neural network and an autoregressive integrated moving average (ARIMA) model [22]. Additionally, the epidemiological pattern of COVID-19 prevalence and incidence was predicted using the ARIMA model with a high degree of accuracy [23], demonstrating the value of epidemiological monitoring. A novel hybrid prediction model based on gradient optimizer variational pattern decomposition, extreme learning machine, and ARIMA was developed to increase the prediction accuracy of cumulative verified COVID-19 instances [24]. To examine the relationship between the number of infections and mortality over time, ARIMA and Nonlinear Autoregressive Neural Network (NARNN) were integrated [25].
Convolutional Neural Network (CNN) is one of the most commonly used methods in deep learning, and the improvement [26] and application [27] for the convolutional neural network is also one of the current research hotspots, not only for the Classification of COVID-19 CT Scan Images [28], CNN is also used for COVID-19 prediction. Due to the intricacy of infection transmission, Chandra noted that almost all of the well-known computational and mathematical models are inaccurate for COVID-19 prediction. Any such modeling attempts are also rendered inaccurate by the absence of data collection and reporting, and the issue has to be reviewed using the most up-to-date data sources and complete prediction models [29]. To get strong prediction results on the COVID-19 prediction task, a novel model integrating CNN and LSTM models was developed [30]. Verma et al. [31] designed vanilla LSTM, stacked LSTM, ED_LSTM, BiLSTM, CNN, and hybrid CNN + LSTM models to capture the complex trends of COVID-19 outbreak and performed 7, 14, 21 days COVID-19 daily for India and its four most affected states confirmed case prediction, showing that stacked LSTM and hybrid CNN + LSTM models perform best.
Qu et al. [32] pointed out that fluctuations in COVID-19 data series are significant and effective COVID-19 epidemic trend prediction remains a complex and challenging problem. Using only individual forecasting methods for epidemic modeling, ignoring the combination of advantages of different forecasting methods, has made most of the previous studies limited, and they developed a novel ensemble paradigm based on multiple neural networks and a novel heuristic optimization algorithm, and the results of the study showed that different neural network models have different performance in various complex epidemic forecasting scenarios. The presented models are mostly predictable and suitable for large populations, although models like SEIR and SIR can anticipate the spread of illnesses [33]. Epidemiological models may be used for decision-making to maximize the best possible control of infectious illnesses and aid to understand the dynamic tendencies of pandemics. These mathematically based epidemiological models might not be able to forecast the actual pandemic scenario. Machine learning prediction models can perform predictions better than mathematical models, however, they may make ARIMA models unstable when observations change [34]. Only linear interactions, not nonlinear ones, are naturally captured by the ARIMA model. However, because most studies are based on cumulative cases and the predicted curves show linearity, deep learning cannot be relied upon to perform well in the COVID-19 time series prediction task. On the other hand, deep learning has been used successfully in the COVID-19 prediction task due to its powerful nonlinear fitting ability.
In this paper, an improved multilayer deep-time convolutional neural network is proposed for COVID-19 prediction. The main contributions of this paper are given as follows:
(1) This study use statistical approaches to discover seasonality and non-stationarity in the daily confirmed case data for COVID-19 using the COVID-19 statistics from Johns Hopkins University.
(2) This research proposes MDTCNet, which not only decreases prediction hysteresis but also increases accuracy on the COVID-19 prediction task and accomplishes short-and long-term prediction of COVID-19 development trends.
(3) On real-time series data of COVID-19 with non-stationary and uncertainty, a reliable prediction of non-stationary time series was made, expanding the prediction model for the COVID-19 prediction task in terms of prediction of daily confirmed cases and demonstrating the promise of COVID-19 prediction up to sixty days by artificial intelligence methods.
The remainder of this essay is structured as follows: The suggested MDTCNet prediction model in this study is described in Section 2. The experiments and comments are included in Sections 3 and 4, respectively. The study for this paper is concluded in Section 5, along with recommendations for further research.
This section examines the characteristics of COVID-19 time-series data and conducts the corresponding data processing; specifically, the difference operation and reconstruction of the data set are included. The difference operation can better reflect the variable volatility pattern within the data, and the reconstruction can reproduce the latent characteristics of COVID-19 that cause the data features to be hidden for multi-step prediction.
Time series data are typically divided into smooth and non-smooth time series, and the current practice for forecasting non-smooth time series is to convert non-smooth time series into smooth time series. However, most of our real-world time series are non-smooth, such as the closing prices of some stocks, and the time series of COVID-19 is no exception because of the pathogenic Due to the pathogenesis, man-made environment, and other factors that affect COVID-19 spread, there is a significant difference in the number of new diagnoses made each day, which causes significant data fluctuations and contains a lot of anomalous information, causing the COVID-19 data to exhibit non-stationarity.
Along with the COVID-19 virus’s ability to spread on its own, the human policy-based intervention also contributes to COVID-19’s unpredictability, which is represented in the virus’ time series data. Because the deterministic factor decomposition approach cannot completely extract useful information from the observation series, the precision of the model fitting is typically not adequate. The first difference in the dataset is accomplished in this research using the following formula, which Cox and Jenkins demonstrated to be a relatively straightforward and efficient information extraction approach [35].
where t indicates the time,
The latent nature of COVID-19 makes it extremely difficult to anticipate the actual number of COVID-19 cases. In light of this, this work suggests a reconstruction technique for multi-step prediction by using Takens Theorem [36] for time series of case data for a collection of measured observations:
It is possible to build an m-dimensional vector set:
where T indicates the sample time, m refers to the embedding dimension,
For the complicated characteristics of COVID-19, the MDTCNet model is suggested in this research as a means of forecasting the daily number of confirmed cases. The multilayer deep temporal convolutional network and the feature fusion network make up the bulk of the model’s structure. In particular, the COVID-19 time series is fed into the MDTCNet model, which has four hidden layers, as illustrated in Fig. 1. Taking into account the drawbacks of null causal convolution and one-dimensional convolution for handling COVID-19 time series with complicated characteristics, A multilayer deep time convolution network is created between the hidden layers to enhance the feature learning capabilities. The prediction hysteresis brought on by the issue of information continuity loss is addressed by the feature fusion network to obtain long-time series dependence and increase accuracy.
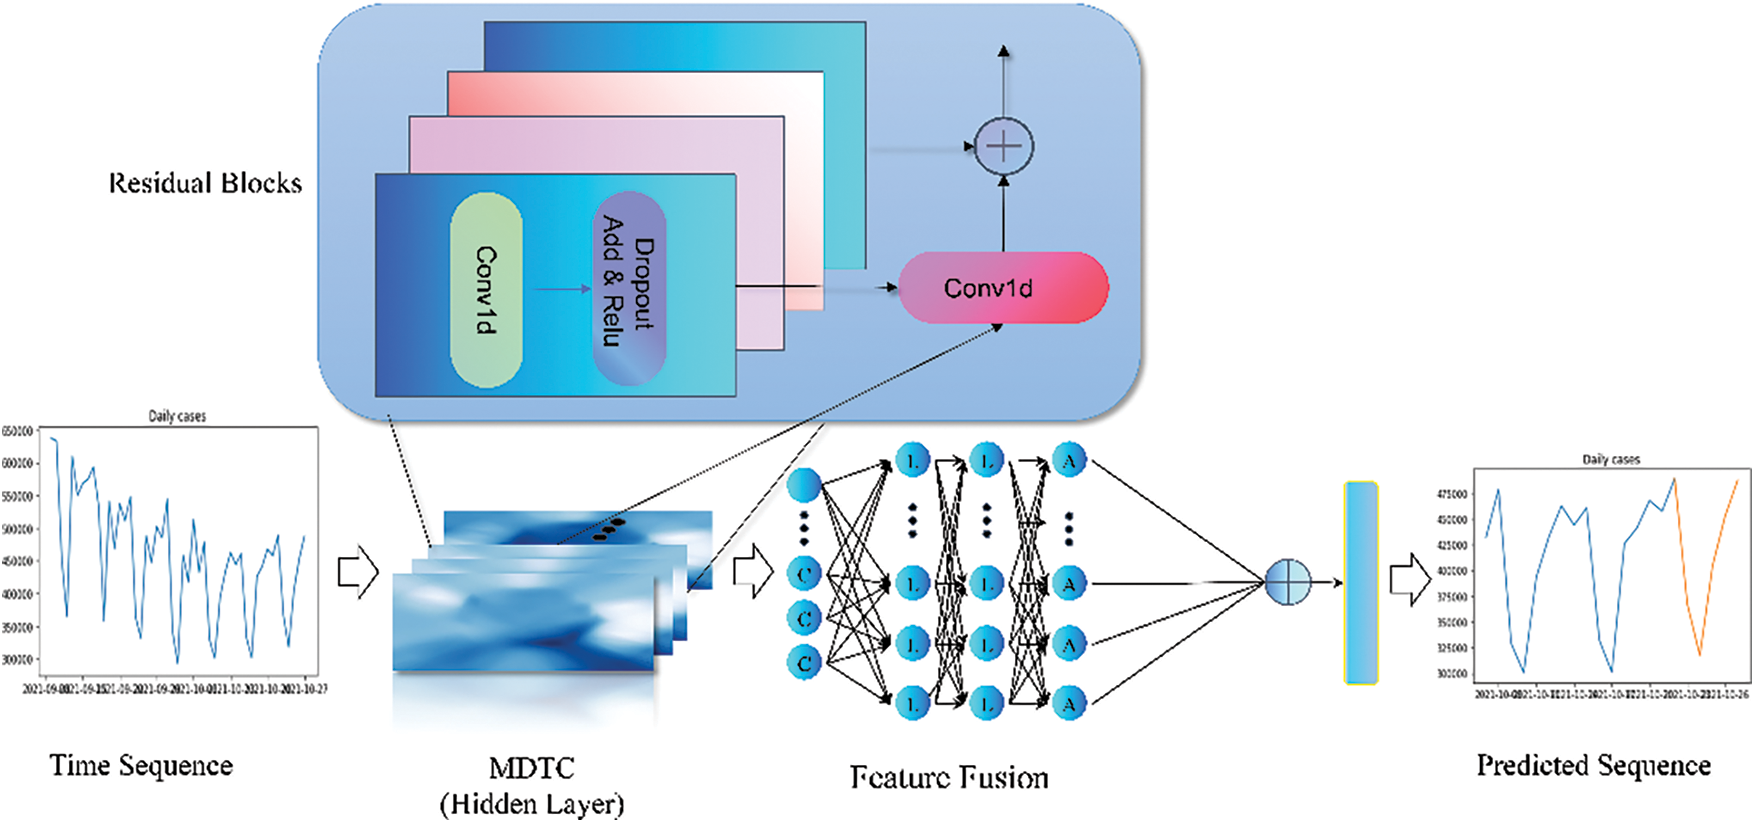
Figure 1: MDTCNet network structure diagram
2.2.1 Multi_Layer Deep Time Convolution
Recurrent neural networks and their derivatives are frequently employed in time series research, but while processing sequences they experience gradient explosion, disappearance, or memory scarcity. The model is designed using convolutional networks, which overcome the flaws in recurrent neural networks while allowing parallel processing, significantly increasing the efficiency of sequence processing. Bai et al. [37] introduced TCN for processing sequence tasks. TCN models have now been incorporated into adjacent study fields [38–40].
Time series forecasting often involves modeling past data and using that model to predict future data. Mathematical formulas can be used to describe the specific form.
where
The feed-forward neural network CNN is used. The ability of CNN to identify straightforward patterns in data is widely recognized, particularly when there is little connection between the placements of the segments of the data. To analyze signal data with fixed-length cycles (such as audio signals), 1D CNN (1D Convolution Neural Network) can be used effectively. However, it is challenging to use 1D CNN’s effect on data pattern recognition when dealing with COVID-19 time series data that contain complex patterns and uncertainty. It is difficult to conduct its pattern recognition, however, to the point that feature extraction is insufficient when dealing with COVID-19 time series data with complicated and ambiguous patterns.
2.2.3 Dilated Causal Convolution
On the one hand, the TCN structure’s causal convolution limits its capacity to learn long-term historical data even if it guarantees the order of the series. Although the TCN structure employs dilated causal convolution to address the learning problem of lengthy historical information, the following issues will arise when multiple 3 * 3 convolution kernels with a 2× expansion rate are stacked: (1) The continuity of information is lost because not all information is used in the computation, which results in the loss of the continuity of information. Strong continuity in a sequence of data is lethal; (2) non-correlation of data; in some cases, where a sequence of data has fixed-length periods, an appropriate expansion rate may be determined experimentally. However, for sequence data with uncertainty or randomness, an expansion rate that is too high will result in the network learning irrelevant data features, while an expansion rate that is too low will result in insufficient learning of relevant features, both of which will negatively impact the prediction effect.
However, as the CNN is constrained by the perceptual field, which is difficult to capture long-range features and sensitive to local but not global signals, the hysteresis may also be brought on by the properties of CNN in the TCN structure. Although the enlarged causal convolution introduced in the TCN network appears to address this issue, it only manages to perform global feature learning within a specific range, and for the presence of noise, The forecast of the real case number of COVID-19 is an excellent illustration of how poorly time series with significant data changes or uncertainty may be predicted.
This research solves the aforementioned issue by enhancing the learning capabilities of features to lessen the hysteresis of TCN in COVID-19 prediction to retain the efficiency of CNN processing sequences. In this study, a multilayer deep-time convolutional extension of the residual network structure is developed by upgrading the TCN structure and is motivated by the ResNet network structure. This structure gains significantly longer distance and deeper temporal characteristics increasing the information extraction capacity between each concealment and deepening the dilation causal convolution layers between hidden layers. The idea behind this is that for time series with complicated patterns, the feature extraction power of each time series convolutional fragment may be increased to acquire deeper temporal features and dependencies and improve the ability to express nonlinear features in non-stationary time series. A jump connection is added between each hidden layer to address the issues of insufficient feature extraction of one-dimensional full convolution, loss of data information continuity, and non-correlation of the null causal convolution, which reduces the hysteresis of prediction and prevents the gradient from disappearing as a result of the deep network.
Google used MLP-Mixer to demonstrate that even a simple structure like a multilayer perceptron (MLP) can achieve the best model performance so far [41]. The problem of optimizing the structure of neural networks has been a hot topic in research, and self-attention has consistently been proposed by researchers to improve the performance of the algorithm.
It is discovered in this study that the TCN model employs linear regression as the output component of the prediction results through the breakdown of the TCN network. The argument made in this paper is that using linear regression as the output component of the prediction results after feature extraction cannot effectively use the features extracted by the temporal convolutional network, especially because it may result in the loss of nonlinear features, resulting in unsatisfactory fitting accuracy to non-stationarity time series. To further improve the fusion of the features extracted by the multilayer deep time convolutional network for the output and to enhance the expression of nonlinear features and the feature capability of handling non-stationarity uncertain sequence data, this paper, inspired by the Self-Attention structure, replaces linear regression in MDTCNet with a multilayer perceptron. It is demonstrated through a series of iterations that the input layer size is 256, that Sigmoid is used as the activation function, that batch normalization is introduced in the first layer as well as bias in each layer to improve performance and stability, and that the two hidden layers are set at 128, 64, and that
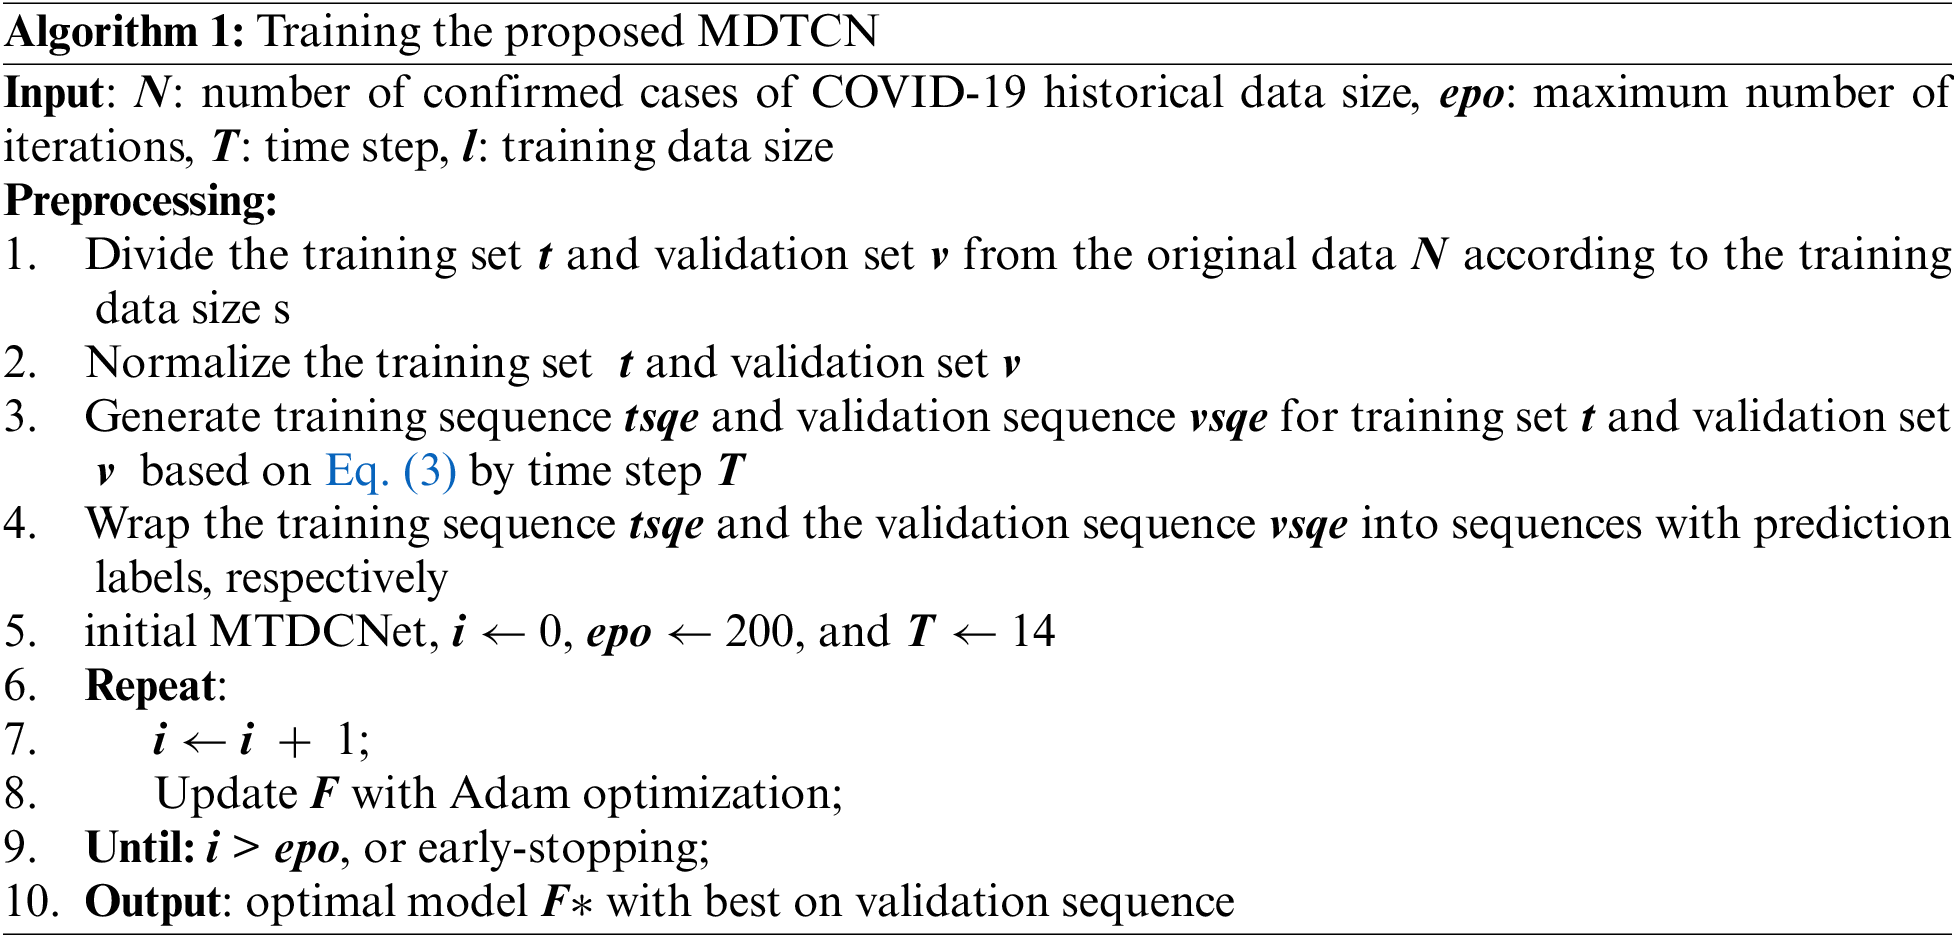
To sum up, the procedures for training the proposed MDTCNet are shown in algorithm 1.
This part serves as an introduction to the data utilized for analysis, visualization, and experimentation. The analysis findings in this area will also be used to identify the ideal parameters to aid modeling. This study makes use of daily confirmed case data from Johns Hopkins University that has been published both internationally and domestically. Refer to Table 1.

Compared to the previous studies, which only smoothed the curves of cumulative cases, this work predicts the trend of COVID-19 more directly by analyzing the real-world cumulative case dataset with differential operations to predict new cases daily.
Figs. 2 and 3 show the time series decomposition of the global and U.S. confirmed incremental case data, which shows that the global and U.S. COVID-19 time series data have seasonal factors, the long-term trend fluctuates upward, showing irregular waves, and the residual deviations show random fluctuations, which indicates that the COVID-19 time series data have uncertainty and non-smoothness, and uncertainty for traditional mathematical prediction model prediction, The moving mean and standard deviation of the time series data in Table 1 are shown in Figs. 4 and 5. The Augmented Dickey-Fuller test (ADF) cannot rule out the hypothesis since the data has a unit root, which denotes that the time series data is not stationary, non-stationarity is also a difficult challenge for deep learning prediction research.
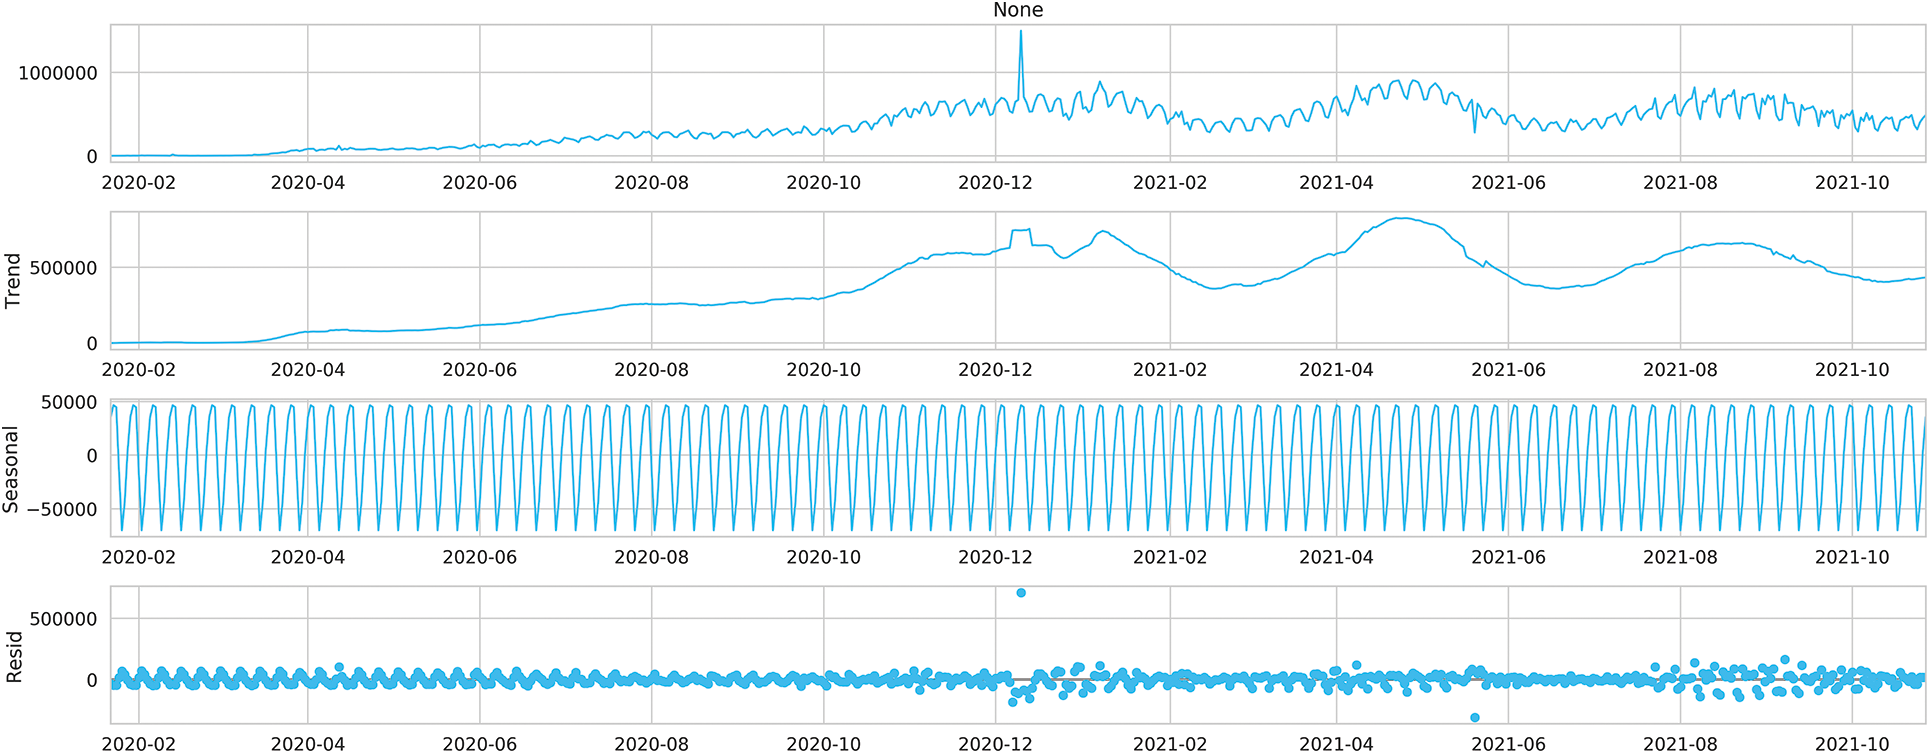
Figure 2: Time series decomposition of the global daily number of cases
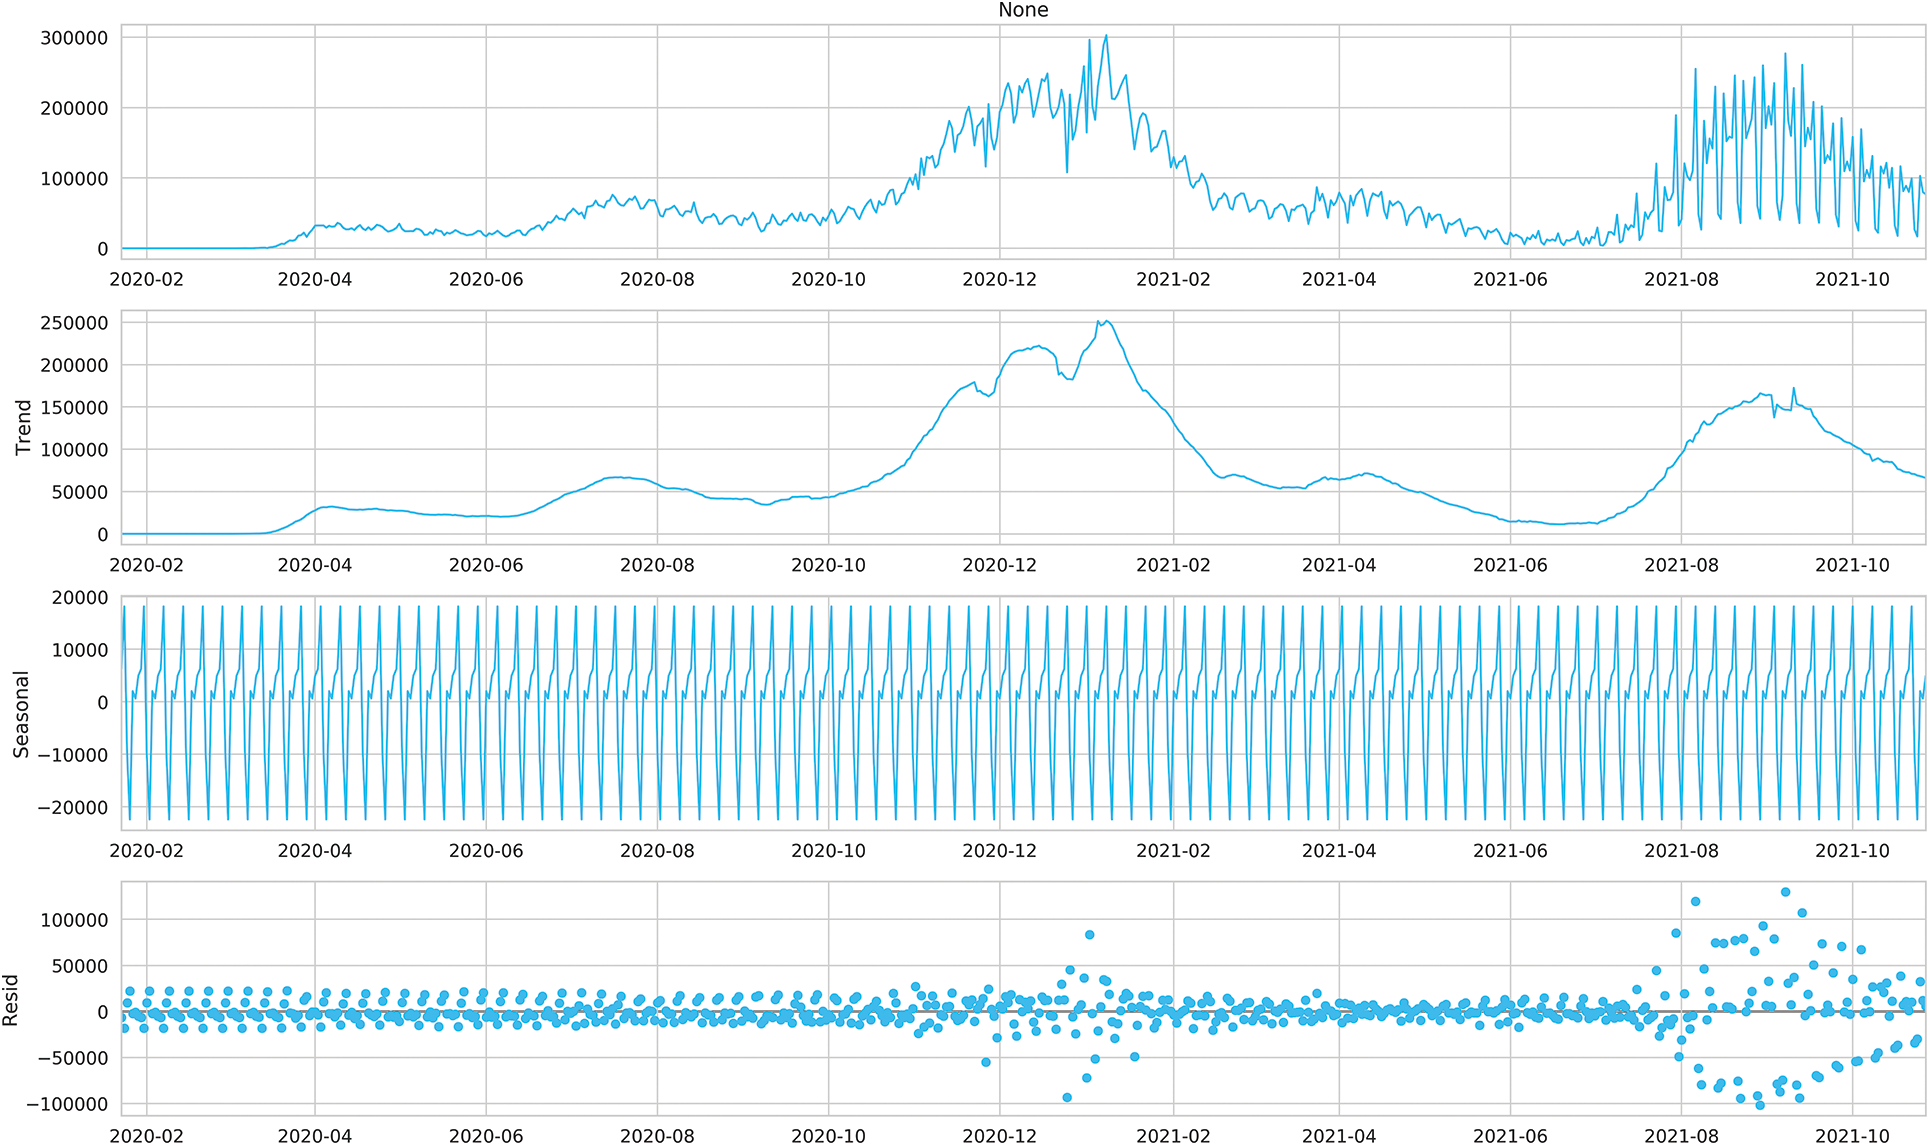
Figure 3: Time series decomposition of the number of daily cases in the United States
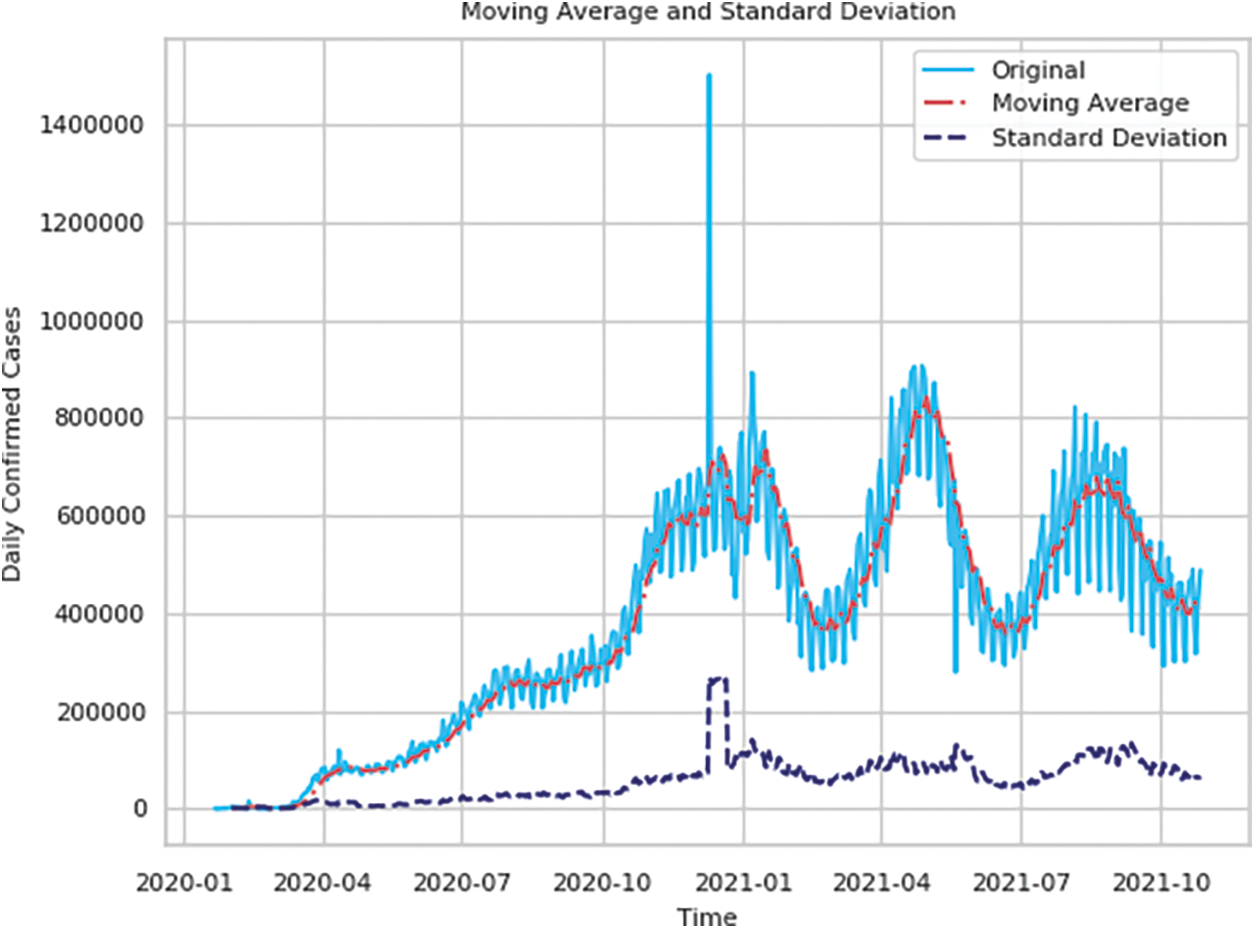
Figure 4: Moving average and standard deviation of the global daily number of confirmed cases
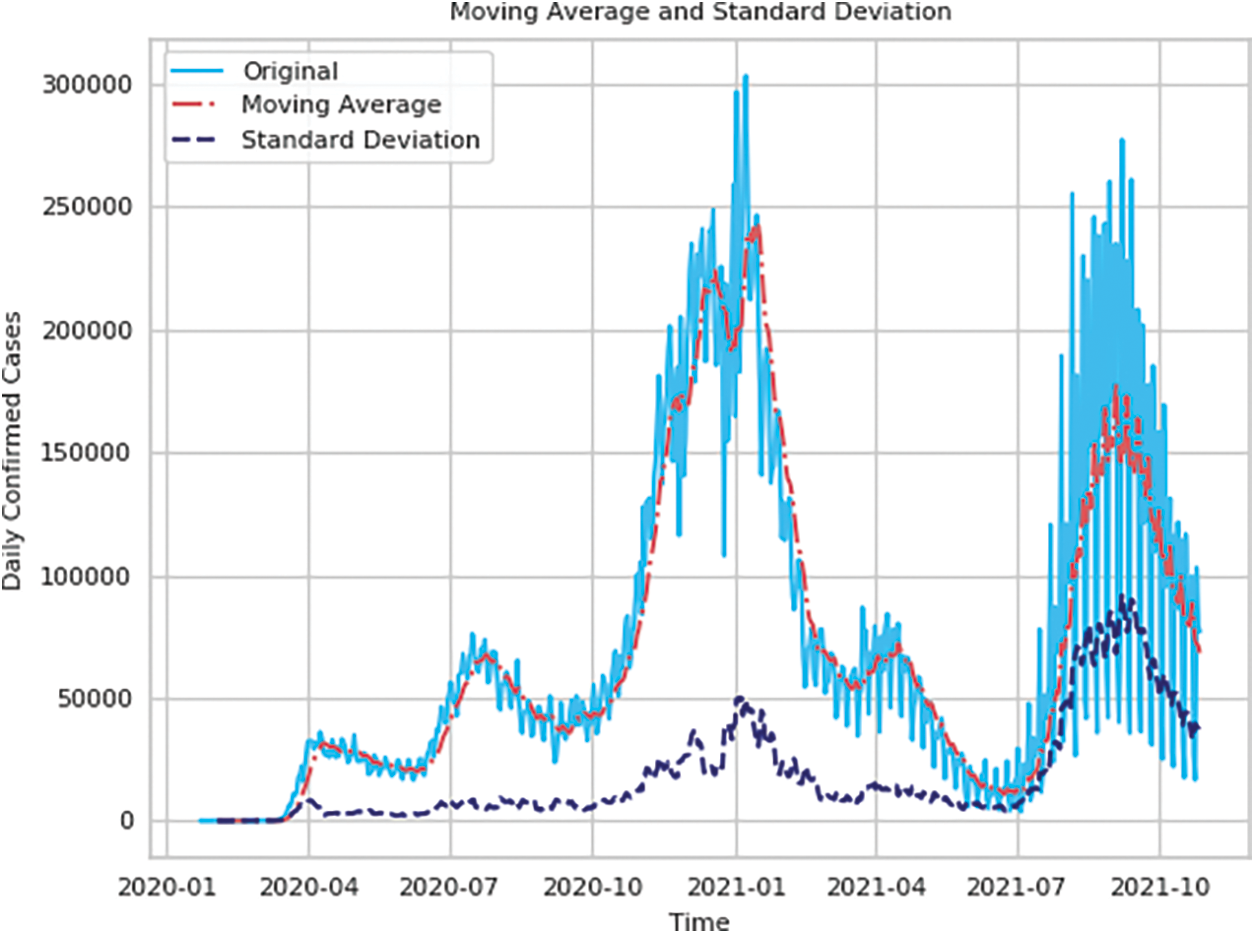
Figure 5: Moving average and standard deviation of the daily number of confirmed cases in the United States
In this study, we evaluate the outcomes of the aforementioned trials using a variety of metrics, with a focus on Mean Absolute Percentage Error (MAPE), Symmetric Mean Absolute Percentage Error (SMAPE), Root Mean Square Error (RMSE), and Root Mean Square Error (RMSE) (RMSE). Square Root Error (RMSE). For the statistical forecasting techniques used in time series forecasting, MAPE is employed as a measure of prediction accuracy and trend estimation. When comparing observed values to actual values, RMSE is employed to describe the difference. Here are the RMSE, MAPE, and SMAPE formulae.
Based on the latent properties of COVID-19 and the creation of hysteresis in the time series at each time step, the experimental single version employs a single quantity for multi-step prediction while taking into account the real scenario. To prevent the hysteresis effect of the time step, the tests established three steps of 10, 14, and 21 to forecast the number of daily instances in the upcoming 7 and 14 days, respectively. To discuss the long-term prediction performance of the MDTCNet model, up to 60 days of predictions were made while the epoch was set to 200, batch_size was set to 32, and the learning rate was set to 0.01.
To find the optimal parameters, the key parameters

To better compare the proposed prediction model in this paper, as well as to display and compare the prediction results of COVID-19 cases globally and in the United States, as well as to compare evaluation metrics, the MDTCNet neural network model is compared with the TCN model and the current prediction models frequently used in COVID-19 prediction studies.
The time steps of 10, 14, and 21 days are shown in Figs. 6 and 7 to forecast the number of daily confirmed cases in the following 7 days for the world and US populations, respectively. The figure makes it clear that there is an obvious hysteresis between the TCN model and the real value. This hysteresis can make it difficult to grasp the development trend of COVID-19 infection cases and prevent the formulation of scientific and reasonable control strategies to address changes in the trend of COVID-19 development in a timely and effective manner, leading to an unnecessarily high number of confirmed cases and financial harm. In comparison to TCN, the MDTCNet proposed in this paper not only forecasts the overall trend but also has a much smaller hysteresis between predicted and actual values. This helps medical professionals and government decision-makers to predict the COVID-19 development trend, analyze the strain of confirmed cases on medical beds, medical supplies, etc., and develop more prompt response plans. To develop more prompt reaction plans and more wisely distribute medical resources, medical practitioners and government decision-makers can use this information to study the COVID-19 trend and assess the strain of confirmed cases on medical beds, medical supplies, etc. Additionally, the MDTCNet model greatly outperforms the TCN model in its ability to match the aberrant information points of the curve, demonstrating that it is better suited for the task of forecasting COVID-19 and more accurate than the TCN model at doing so.
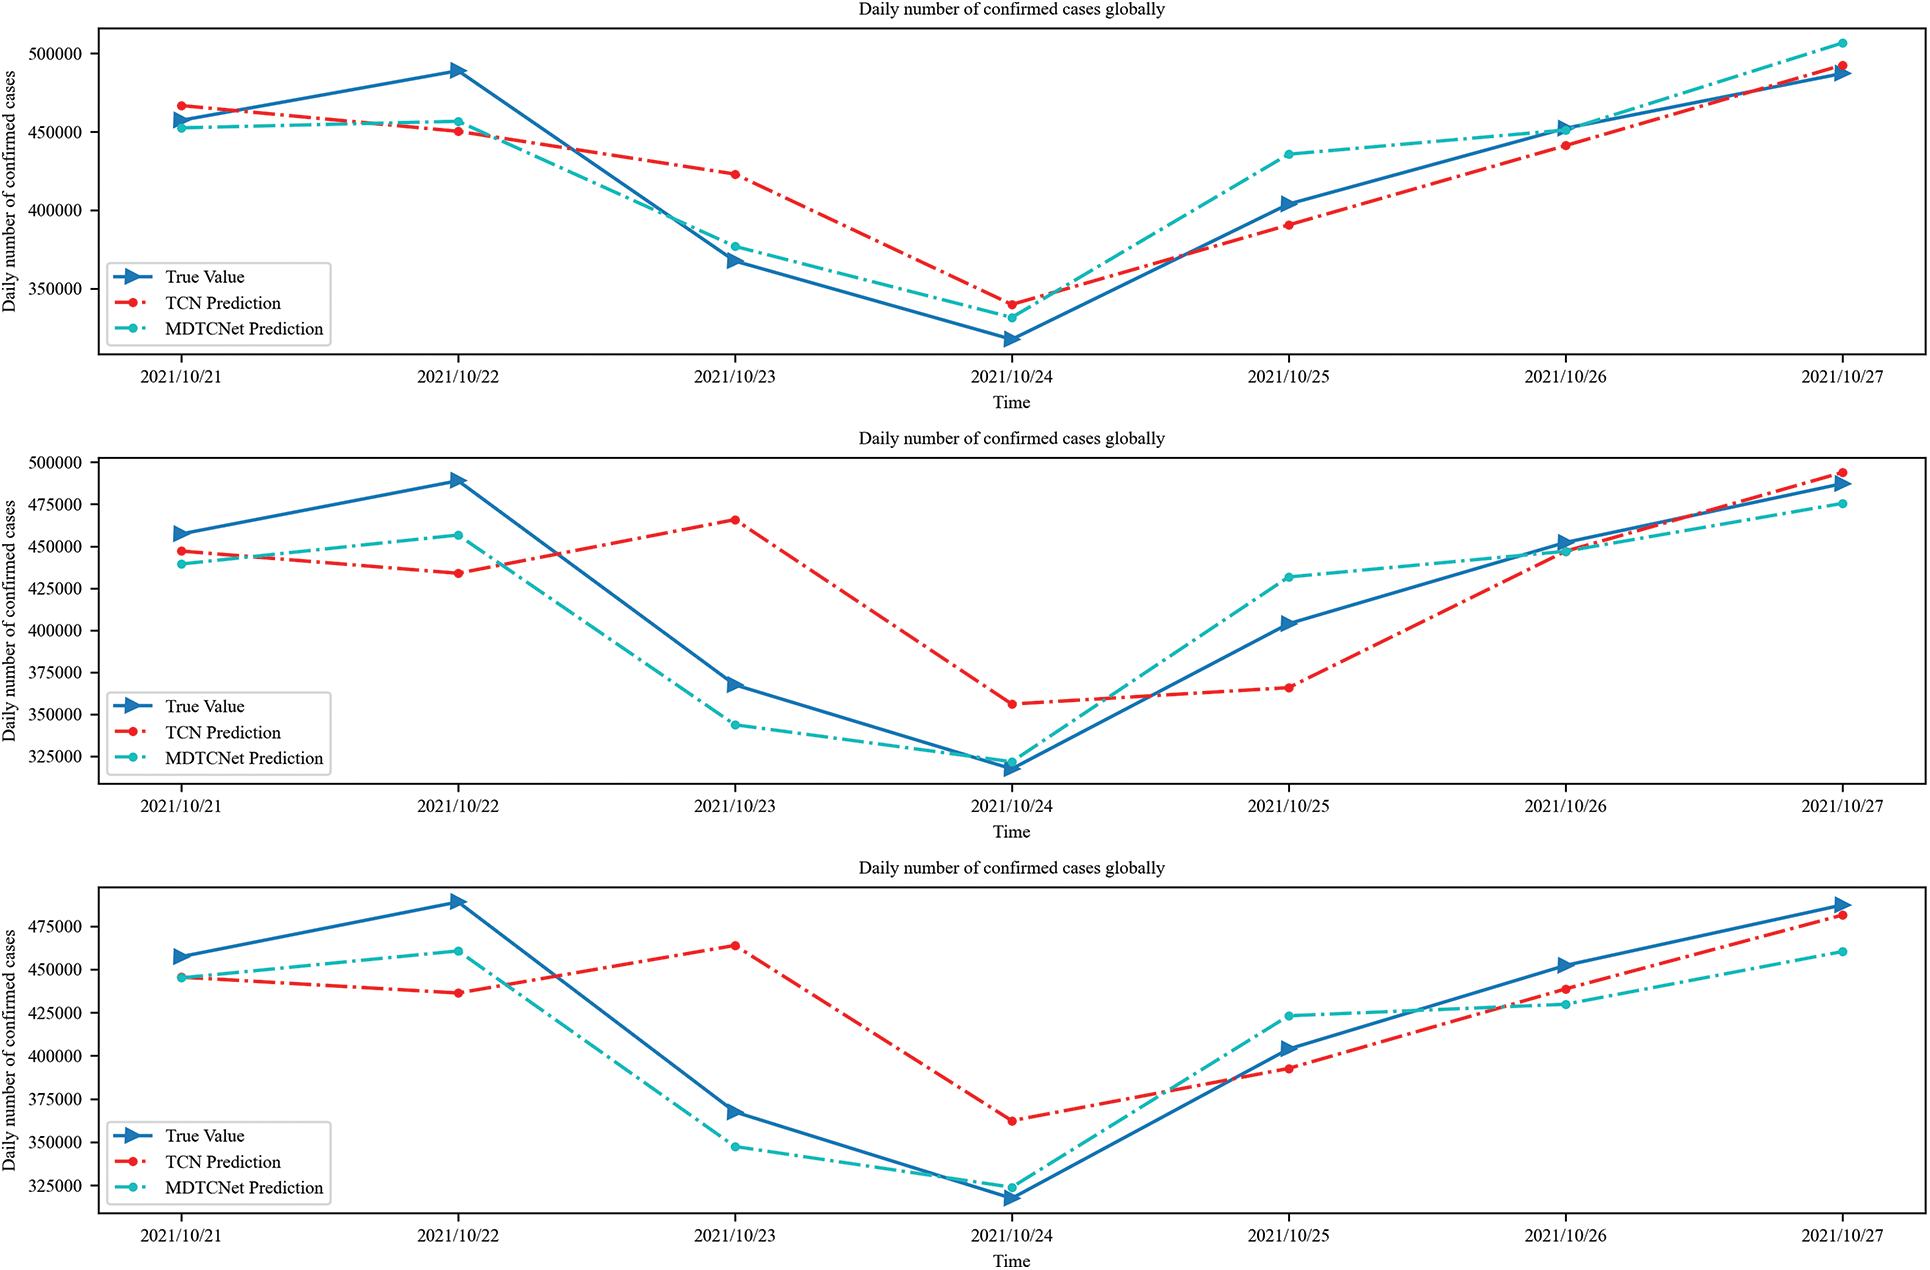
Figure 6: Time steps 10, 14, and 21 predict confirmed cases in the next 7 days globally

Figure 7: Time steps 10, 14, and 21 predict confirmed cases in the next 14 days globally
The number of daily confirmed cases in the following 14 days for the globe and the U.S., respectively, may be predicted using time steps of 10, 14, and 21 days, as shown in Figs. 8 and 9. Combining Figs. 6 and 7, it can be seen that the MDTCNet model outperforms the TCN model in terms of hysteresis and fit even when making predictions for a longer period. This indicates that the analysis and enhancement of the network structure of the TCN model in this paper were accurate and successful.
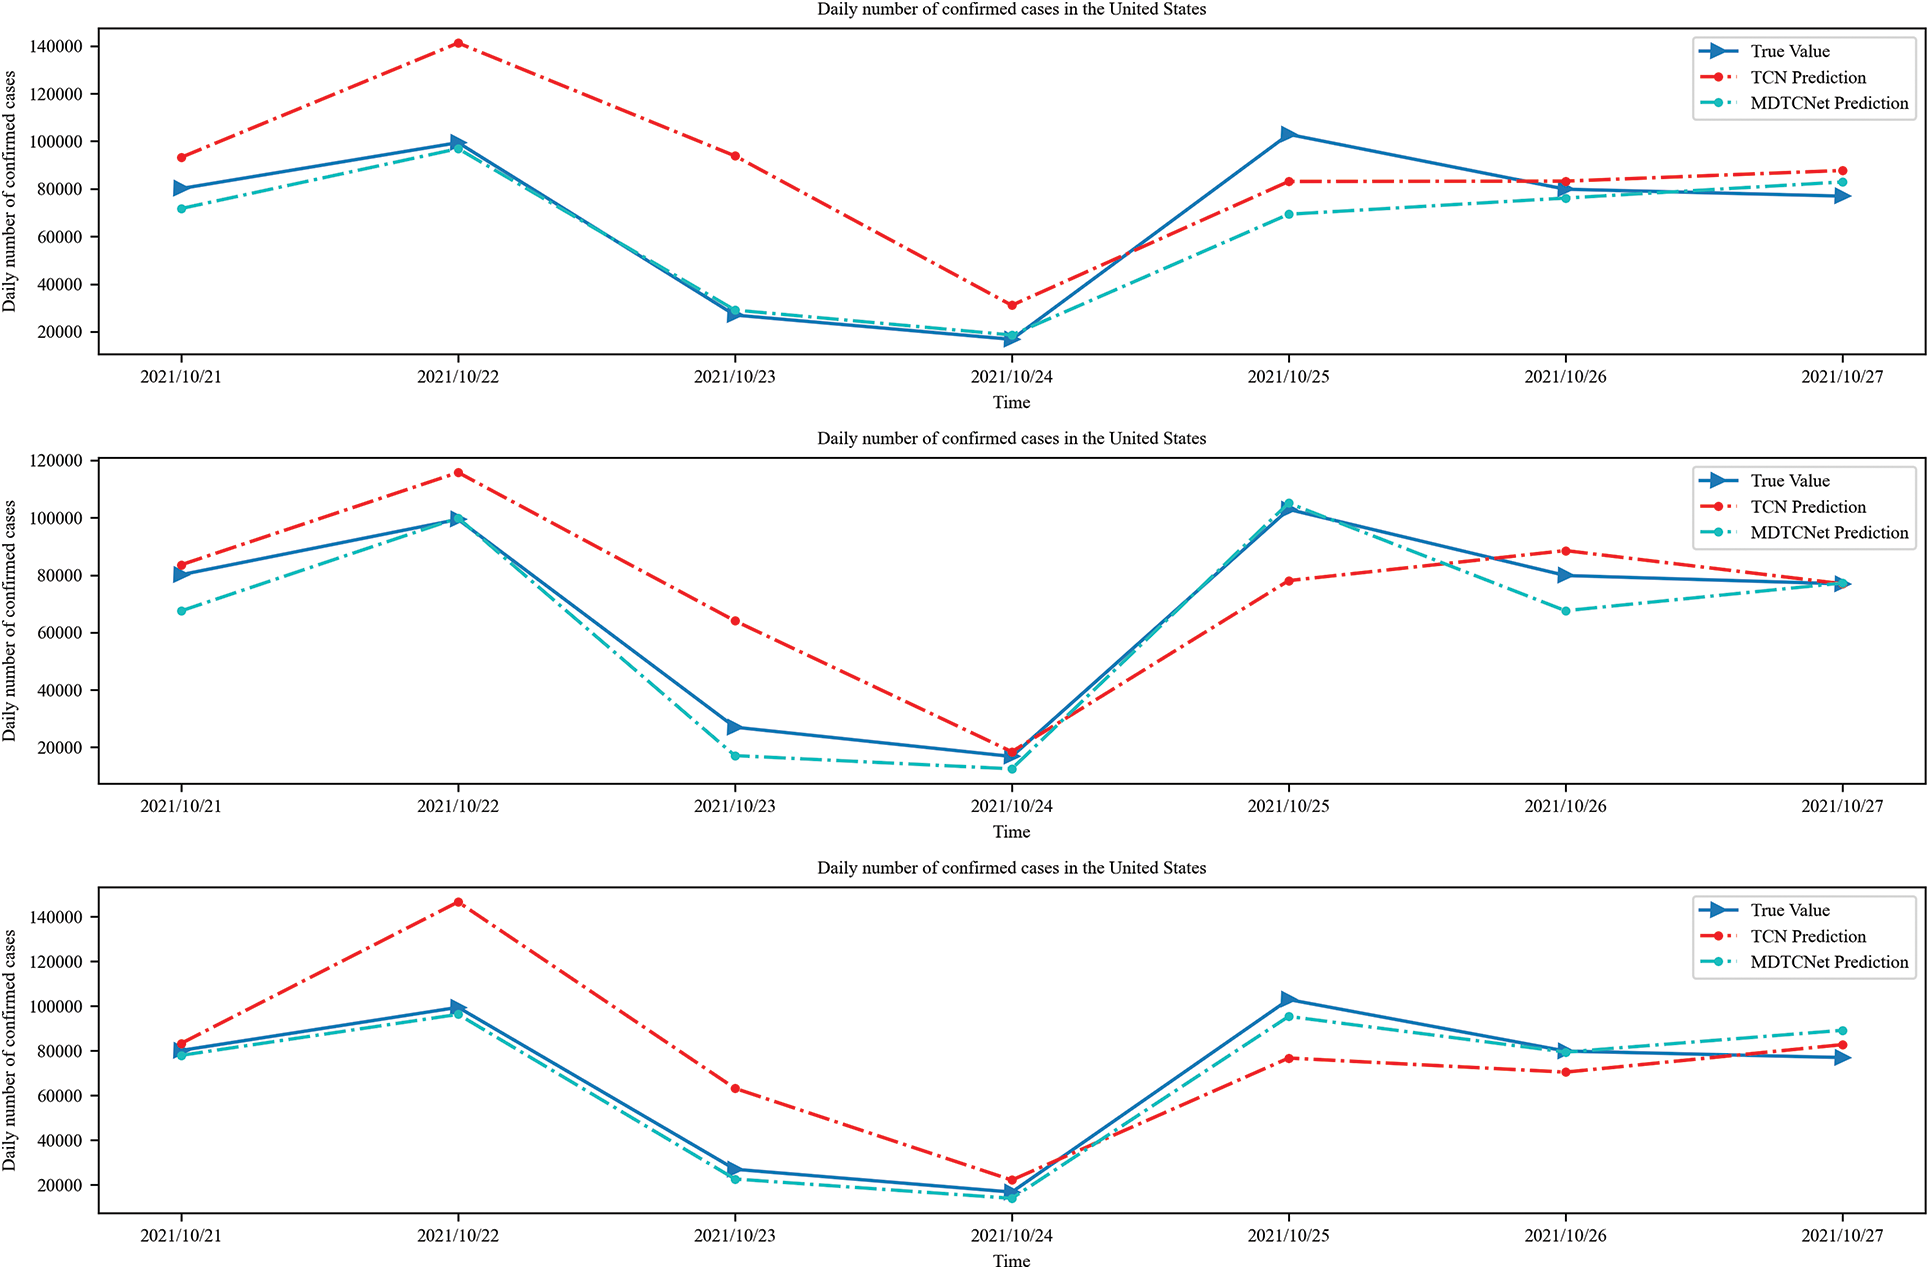
Figure 8: Time steps 10, 14, and 21 predict confirmed cases in the next 7 days in the United States
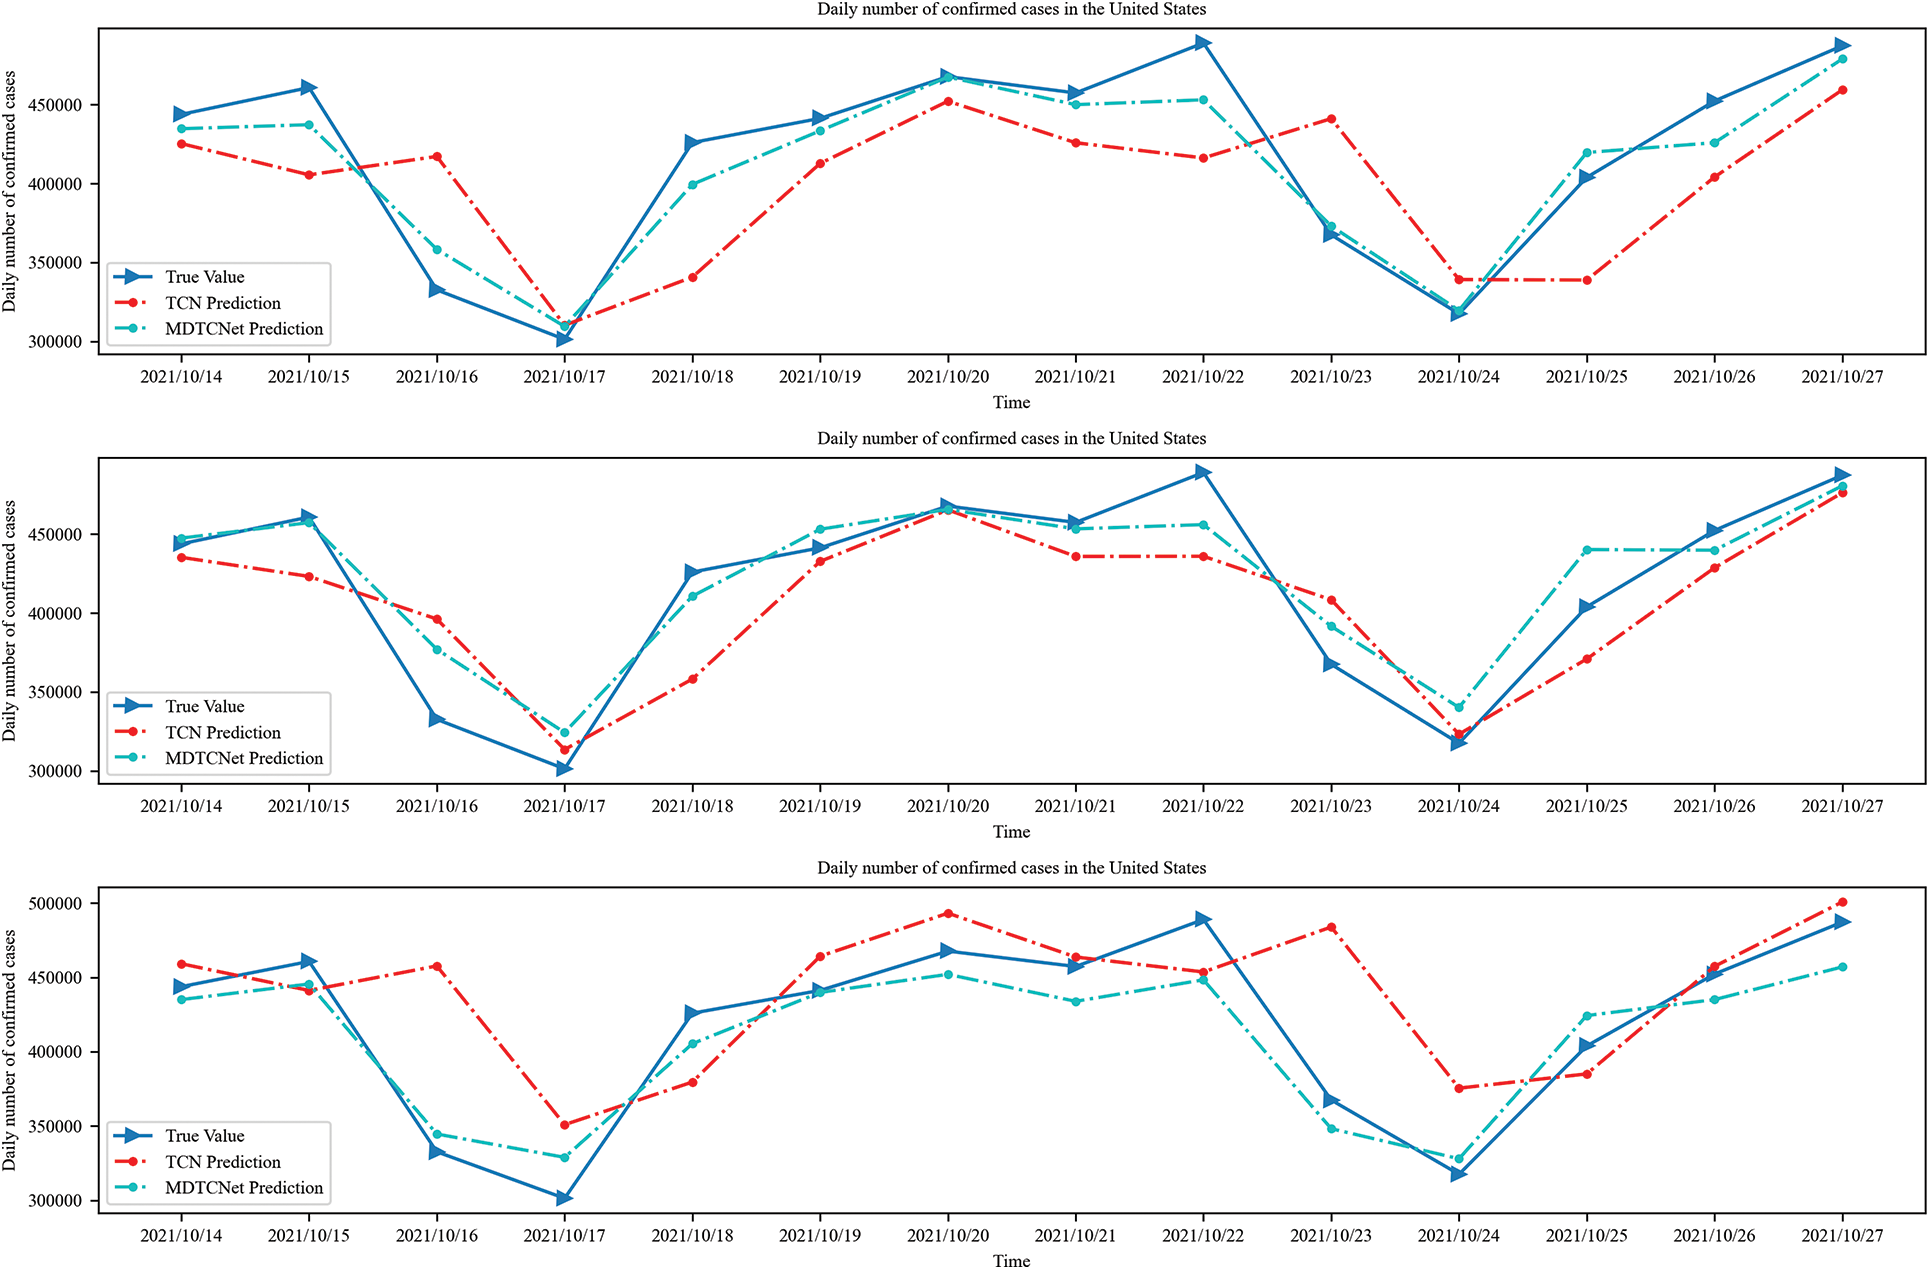
Figure 9: Time steps 10, 14, and 21 predict confirmed cases in the next 14 days in the United States
The variations in MAPE situations for the TCN and MDTCNet models at various epochs are shown in Fig. 10. It is clear that MAPE declines as the epoch rise, and when the epoch is equal to 200, the MAPE does not noticeably change. The MAPE of MDTCNet is consistently lower than that of the TCN model.
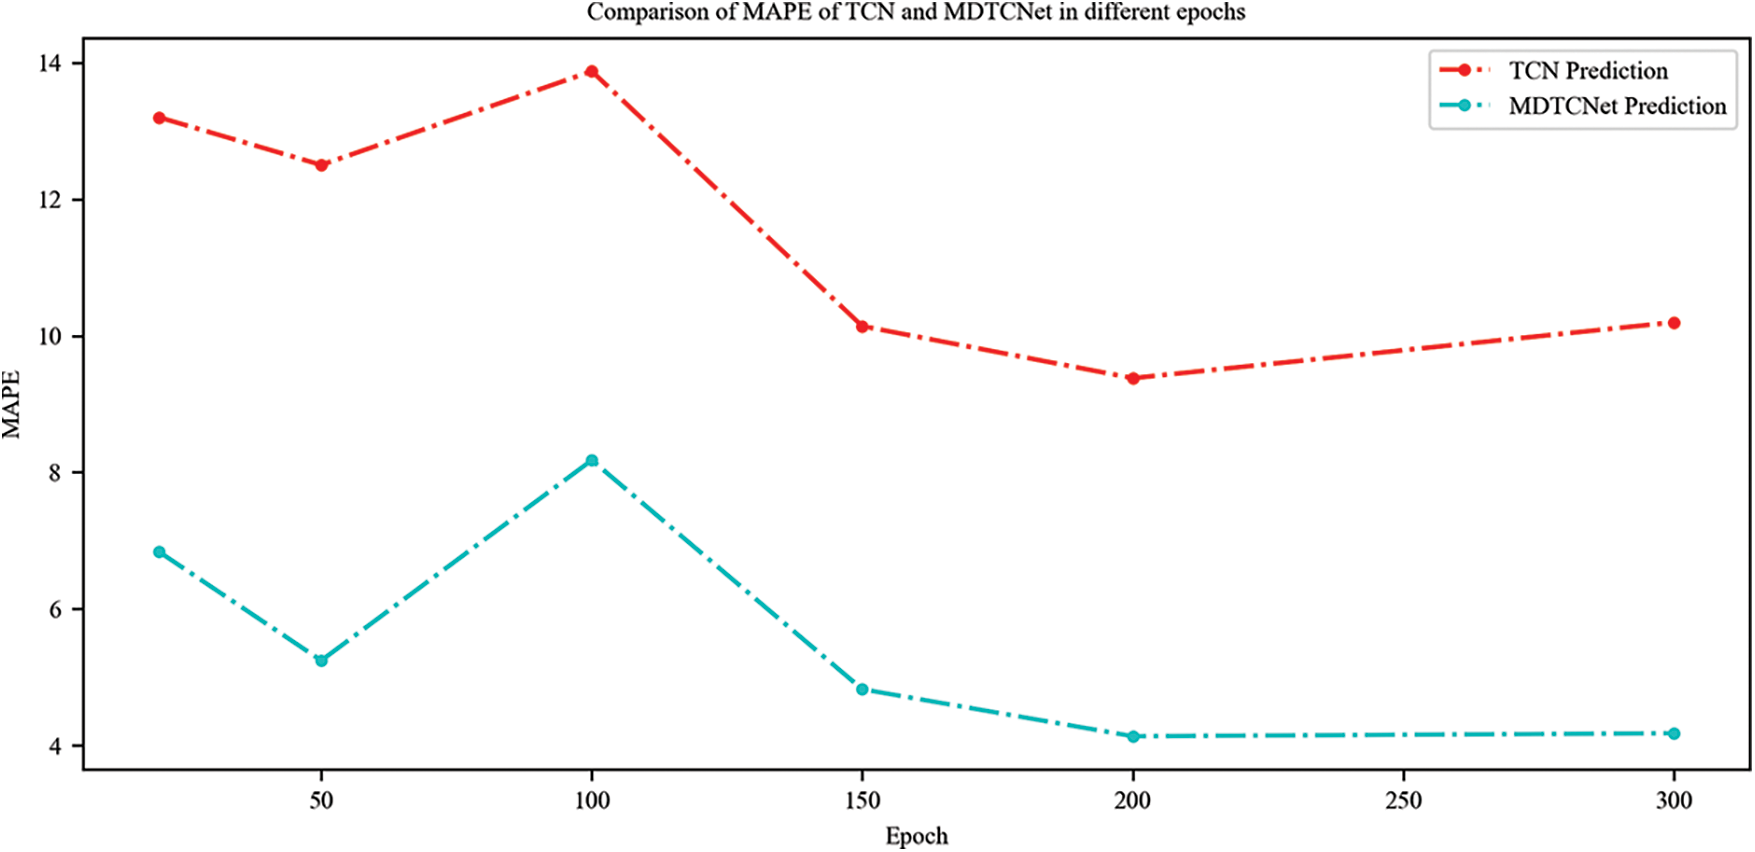
Figure 10: Comparison of MAPE of TCN and MDTCNet in different epochs
The MDTCNet, TCN, and current LSTM, Logistic Regression, and ARIMA prediction models typically employed in COVID-19 prediction research provided in this study illustrate the prediction findings for the number of daily confirmed cases in the following 21 days globally and the United States. To get the greatest prediction performance, all prediction models were refined through data analysis and literature reviews. For the COVID-19 non-stationarity time-series data with uncertainty, it is evident from Fig. 11 that Logistics Regression does not learn the time series characteristics at all for both the global and American data, and the prediction bias is significant. The time series uncertainty has an impact on the LSTM, and the prediction performance is unsatisfactory. ARIMA outperforms The TCN model and picks up on the time series’ properties, but because of the substantial hysteresis, the forecast accuracy is subpar. Even though the causes of hysteresis are numerous and challenging to eliminate, the MDTCNet model suggested in this paper not only learns the time series’ characteristics under the influence of noise and large data fluctuations but also picks up longer time dependence, which significantly reduces hysteresis and provides the best prediction performance. Table 3 displays the findings for the three most often used time series prediction evaluation metrics, MAPE, SMAPE, and RMSE.
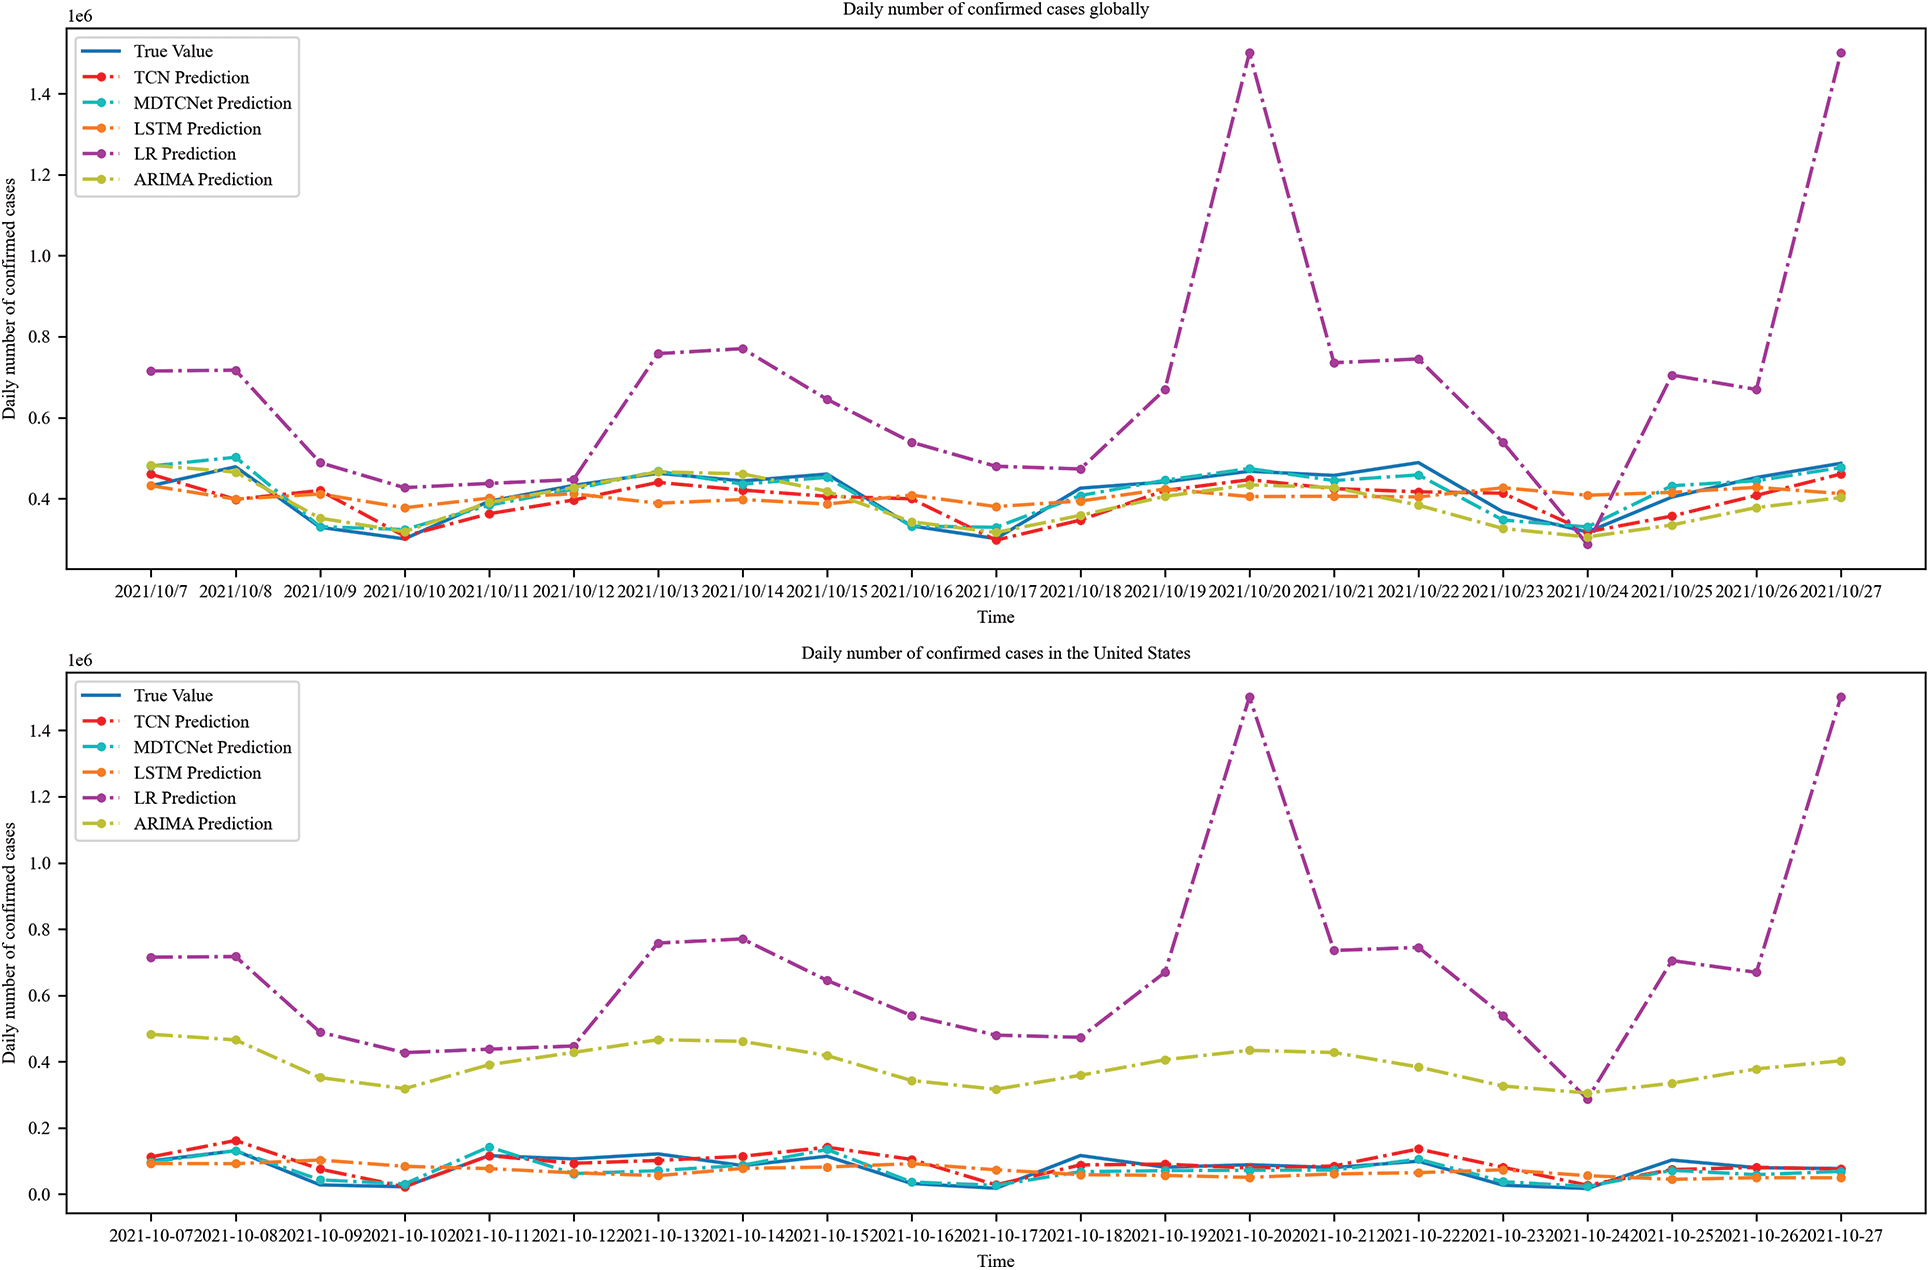
Figure 11: Comparison of prediction values and values of real confirmed cases
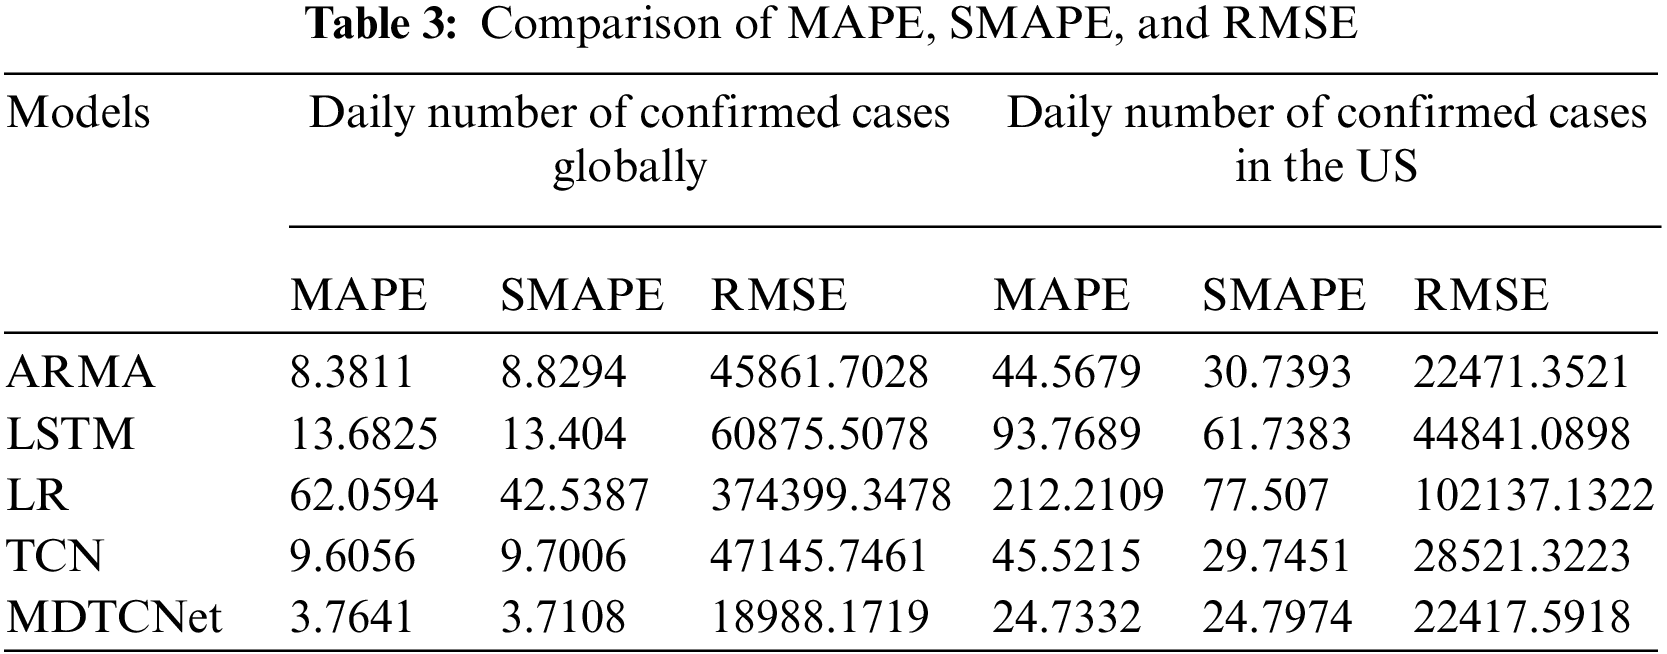
As can be seen, the MDTCNet model performs better than the other models in each of the evaluation metrics. As a result, the studies demonstrate that the MDTCNet model achieves reliable prediction performance when given the job of forecasting COVID-19’s non-smooth time series with uncertainty.
To account for the effect of time steps on hysteresis, the number of cases in various future periods was predicted in this study using various time steps. At the same time, commonly used evaluation metrics are chosen to compare the current COVID-19 prediction model, which has been experimentally shown to perform better than other models at predicting the number of daily cases for both the global and US markets. The results show that the hysteresis of prediction can be successfully reduced by the residual network module with multilayer deep-time convolution presented in this article.
The TCN and MDTCNet models anticipate the number of daily cases over the next 60 days for both the world and the U.S., as shown in Fig. 12. In this study, a time step of 10 days was shown to be the most suitable for predicting the number of daily cases throughout the next 60 days. Fig. 9 shows that, compared to the TCN model, the MDTCNet model more precisely predicts the COVID-19 development pattern with a considerable reduction in hysteresis. The demonstration in sixty-day prediction experiment demonstrates that the proposed model achieves a long-term low-hysteresis COVID-19 prediction effect and also shows that the long-term prediction of COVID-19 is promising. The proposed model in this paper outperforms the TCN model in both hysteresis and prediction accuracy.
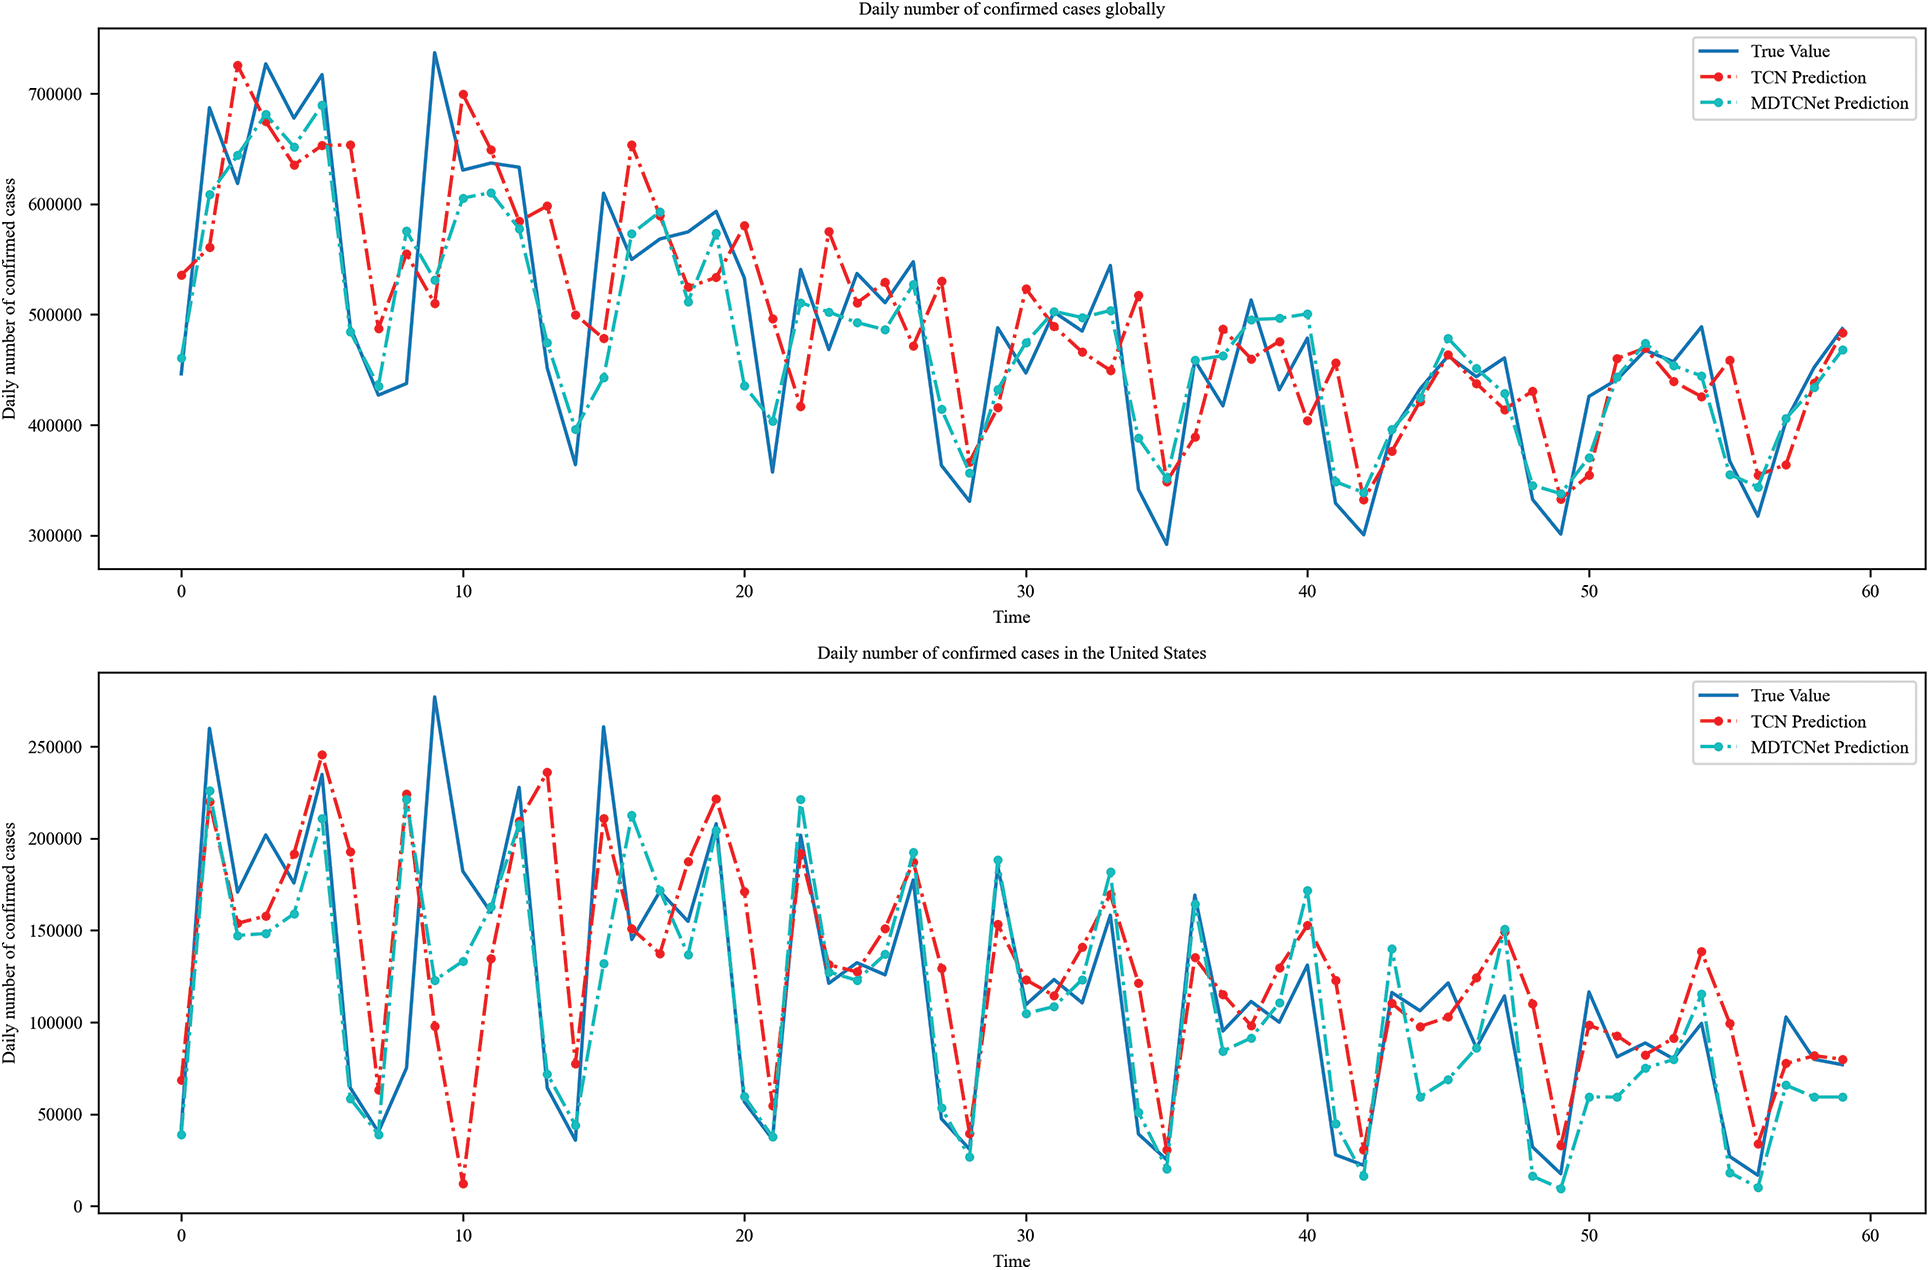
Figure 12: TCN and MDTCNet models predict daily confirmed cases for the next 60 days globally and in the US
The majority of the current COVID-19 prediction research effort is effective for short-term predictions within 10 days, and only a small number of prediction models can accomplish long-term predictions within up to 60 days. The MDTCNet prediction model suggested in this study can accomplish both accurate short-term forecasts and long-term predictions, which addresses the present issue that COVID-19 prediction models can only predict the short- or long-term. The short-term prediction can assist the epidemic control staff in understanding the current COVID-19 changes and in making prompt adjustments to the isolation and control policies, while the long-term prediction can assist in determining the future COVID-19 development trend over a longer time. The resilience of the MDTCNet model was demonstrated by the fact that, for modifications in time steps of 10 to 21 days, the prediction performance of the model did not vary considerably. The best prediction outcomes were obtained using both worldwide and American daily case data, demonstrating some generalizability of the MDTCNet model.
We present the MDTCNet model for COVID-19 daily verified case number prediction in this study, which increases prediction accuracy while lowering the hysteresis of prediction. We also enhance the TCN model structure on the prediction job of COVID-19. On two different COVID-19 time-series data sets, this paper also verifies the MDTCNet model’s efficacy in lowering hysteresis and enhancing prediction accuracy. To prevent the effects of the time step’s hysteresis, the study additionally takes into account the latent properties of COVID-19. As a result, MDTCNet can predict the COVID-19 trend both in the short term and the long term. In terms of the assessment metrics MAPE, SMAPE, and RMSE, MDTCNet performs better than TCN, LSTM, ARIMA, and Logistic Regression.
The current analysis of this paper’s relatively straightforward evaluation of COVID-19’s propagation has certain limitations. However, the prediction with reduced hysteresis will give useful information for promptly catching and inhibiting COVID-19. Future research will incorporate other variables into the model, such as population migration and recovery situations. This study also calls for more standardized datasets and publicly accessible data to aid in the development of better disease prediction models while maintaining individual privacy.
Acknowledgement: The research work of this paper is supported by the major scientific and technological research project of Chongqing Education Commission (KJZD-M202000802), The first batch of Industrial and Informatization Key Special Fund Support Projects in Chongqing in 2022(2022000537).
Funding Statement: The research work of this paper is supported by the major scientific and technological research project of Chongqing Education Commission (KJZD-M202000802), The first batch of Industrial and Informatization Key Special Fund Support Projects in Chongqing in 2022(2022000537).
Conflicts of Interest: The authors declare that they have no conflicts of interest to report regarding the present study.
References
1. D. Cucinotta and M. Vanelli, “WHO declares COVID-19 a pandemic,” Acta Biomed., vol. 91, no. 1, pp. 157–160, 2020. [Google Scholar] [PubMed]
2. S. A. Ali, M. Baloch, N. Ahmed, A. A. Ali and A. Iqbal, “The outbreak of coronavirus disease 2019 (COVID-19)-an emerging global health threat,” J. Infect Public Health, vol. 13, no. 4, pp. 644–646, 2020. [Google Scholar]
3. C. Wang, P. W. Horby, F. G. Hayden and G. F. Gao, “A novel coronavirus outbreak of global health concern,” Lancet, vol. 395, no. 10223, pp. 470–473, 2020. [Google Scholar] [PubMed]
4. N. Kandel, S. Chungong, A. Omaar and J. Xing, “Health security capacities in the context of COVID-19 outbreak: An analysis of international health regulations annual report data from 182 countries,” Lancet, vol. 395, no. 10229, pp. 1047–1053, 2020. [Google Scholar] [PubMed]
5. T. P. Sheahan and M. B. Frieman, “The continued epidemic threat of SARS-CoV-2 and implications for the future of global public health,” Curr. Opin. Virol., vol. 40, pp. 37–40, 2020. [Google Scholar] [PubMed]
6. R. Kumari, S. Kumar, R. C. Poonia, V. Singh, L. Raja et al., “Analysis and predictions of spread, recovery, and death caused by COVID-19 in India,” Big Data Mining and Analytics, vol. 4, no. 2, pp. 65–75, 2021. [Google Scholar]
7. L. Gardner, A. Zlojutro, D. Rey and E. Dong, “Modeling the spread of 2019-nCoV,” Jan 26, 2020. [Online]. Available: https://systems.jhu.edu/wp-content/uploads/2020/01/Gardner-JHU_nCoV-Modeling-Report_Jan-26.pdf [Google Scholar]
8. O. J. Watson, G. Barnsley, J. Toor, A. B. Hogan, P. Winskill et al., “Global impact of the first year of COVID-19 vaccination: A mathematical modelling study,” Lancet Infect Dis., vol. 22, no. 9, pp. 1293–1302, 2022. [Google Scholar] [PubMed]
9. W. Liang, J. Yao, A. Chen, Q. Lv, M. Zanin et al., “Early triage of critically ill COVID-19 patients using deep learning,” Nat. Commun., vol. 11, no. 1, pp. 1–7, 2020. [Google Scholar]
10. S. Putra and Z. K. Mutamar, “Estimation of parameters in the SIR epidemic model using particle swarm optimization,” American Journal of Mathematical and Computer Modelling, vol. 4, pp. 83–93, 2019. [Google Scholar]
11. W. Li, S. Zhai, W. Xu, W. Pedrycz, Y. Qianet et al., “Feature selection approach based on improved fuzzy C-means with principle of refined justifiable granularity,” IEEE Transactions on Fuzzy Systems (Early Access), pp. 1–15, 2022. [Google Scholar]
12. W. Li, H. Zhou, W. Xu, X. Z. Wang and W. Pedrycz, “Interval dominance-based feature selection for interval-valued ordered data,” IEEE Transactions on Neural Networks and Learning Systems (Early Access), pp. 1–15, 2022. [Google Scholar]
13. T. Zhan, S. Ma, W. Li and W. Pedrycz, “Exponential stability of fractional-order switched systems with mode-dependent impulses and its application,” IEEE Transactions on Cybernetics, vol. 52, no. 11, pp. 11516–11525, 2022. [Google Scholar] [PubMed]
14. Z. Yang, Z. Zeng, K. Wang, S. S. Wong, W. Liang et al., “Modified SEIR and AI prediction of the epidemics trend of COVID-19 in China under public health interventions,” J. Thorac. Dis., vol. 12, no. 3, pp. 165–174, 2020. [Google Scholar] [PubMed]
15. S. Sampath and J. Bose, “Modeling effect of lockdowns and other effects on India COVID-19 infections using SEIR model and machine learning,” in Proc. of the 13th Int. Conf. on Soft Computing and Pattern Recognition (SoCPaR 2021Lecture Notes in Networks and System, vol. 417, Seattle, WA, United States, pp. 268–278, 2022. [Google Scholar]
16. S. Dil, N. Dil and Z. H. Maken, “COVID-19 trends and forecast in the eastern Mediterranean region with a particular focus on Pakistan,” Cureus, vol. 12, pp. e8582, 2020. [Google Scholar] [PubMed]
17. C. Zhao, B. Tepekule, N. G. Criscuolo, P. D. W. Garcia, M. P. Hilty et al., “Icumonitoring.ch: A platform for short-term forecasting of intensive care unit occupancy during the COVID-19 epidemic in Switzerland,” Swiss Med. Wkly, vol. 150, pp. w20277, 2020. [Google Scholar] [PubMed]
18. D. Fanelli and F. Piazza, “Analysis and forecast of COVID-19 spreading in China, Italy and France,” Chaos Solitons Fractals, vol. 134, no. 109761, pp. 960–779, 2020. [Google Scholar]
19. I. Cooper, A. Mondal and C. G. Antonopoulos, “A SIR model assumption for the spread of COVID-19 in different communities,” Chaos Solitons Fractals, vol. 139, no. 110057, pp. 960–779, 2020. [Google Scholar]
20. S. Mwalili, M. Kimathi, V. Ojiambo, D. Gathungu and R. Mbogo, “SEIR model for COVID-19 dynamics incorporating the environment and social distancing,” BMC Res. Notes, vol. 13, pp. 352, 2020. [Google Scholar] [PubMed]
21. P. Yarsky, “Using a genetic algorithm to fit parameters of a COVID-19 SEIR model for US states,” Math. Comput. Simul., vol. 185, pp. 687–695, 2021. [Google Scholar] [PubMed]
22. L. Moftakhar, M. Seif and M. S. Safe, “Exponentially increasing trend of infected patients with COVID-19 in Iran: A comparison of neural network and ARIMA forecasting models,” Iranian Journal of Public Health, vol. 49, pp. 92–100, 2020. [Google Scholar] [PubMed]
23. S. Roy, G. S. Bhunia and P. K. Shit, “Spatial prediction of COVID-19 epidemic using ARIMA techniques in India,” Model Earth Syst. Environ., vol. 7, pp. 1385–1391, 2021. [Google Scholar] [PubMed]
24. G. Li, K. Chen and H. Yang, “A new hybrid prediction model of cumulative COVID-19 confirmed data,” Process Safety and Environmental Protection, vol. 157, pp. 1–19, 2022. [Google Scholar] [PubMed]
25. S. Prajapati, A. Swaraj, R. Lalwani, A. Narwal, K. Verma et al., “Comparison of traditional and hybrid time series models for forecasting COVID-19 cases,” Research Square, vol. 2105, pp. 3266, 2021. [Google Scholar]
26. E. Petoku, R. Takahashi and G. Capi, “Improving the convolutional neural network performance through transfer learning for brain-machine interface systems,” International Journal of Innovative Computing, Information and Control, vol. 18, no. 5, pp. 1587–1600, 2022. [Google Scholar]
27. A. F. Siregar and T. Mauritsius, “Ulos fabric classification using android-based convolutional neural network,” International Journal of Innovative Computing, Information and Control, vol. 17, no. 3, pp. 753–766, 2021. [Google Scholar]
28. K. R. Ummah, T. Karlita, R. Sigit, E. M. Yuniarno, I. K. E. Purnama et al., “Effect of image pre-processing method on convolutional neural network classification of COVID-19 CT scan images,” International Journal of Innovative Computing, Information and Control, vol. 18, no. 6, pp. 1895–1912, 2022. [Google Scholar]
29. R. Chandra, A. Jain and D. S. Chauhan, “Deep learning via LSTM models for COVID-19 infection forecasting in India,” PLoS ONE, vol. 17, pp. e0262708, 2022. [Google Scholar] [PubMed]
30. L. Xu, R. Magar and F. A. Barati, “Forecasting COVID-19 new cases using deep learning methods,” Comput. Biol. Med., vol. 144, pp. 105342, 2022. [Google Scholar] [PubMed]
31. H. Verma, S. Mandal and A. Gupta, “Temporal deep learning architecture for prediction of COVID-19 cases in India,” Expert Syst. Appl., vol. 195, pp. 116611, 2022. [Google Scholar] [PubMed]
32. Z. Qu, Y. Li, X. Jiang and C. Niu, “An innovative ensemble model based on multiple neural networks and a novel heuristic optimization algorithm for COVID-19 forecasting,” Expert Systems with Applications, vol. 212, no. 118746, pp. 957–4174, 2023. [Google Scholar]
33. M. S. Bartlett, “Measles periodicity and community size,” Journal of the Royal Statistical Society. Series A (General), vol. 120, no. 1, pp. 48–60, 1957. [Google Scholar]
34. S. Makridakis and M. Hibon, “ARMA models and the Box-Jenkins methodology,” Journal of Forecasting, vol. 16, no. 3, pp. 147–163, 1997. [Google Scholar]
35. P. Young and S. Shellswell, “Time series analysis forecasting and control,” IEEE Transactions on Automatic Control, vol. 17, no. 2, pp. 281–283, 1972. [Google Scholar]
36. F. Takens, “Detecting strange attractors in turbulence,” in Lecture Notes in Mathematics, Berlin Heidelberg: Springer, pp. 366–381, 1981. [Google Scholar]
37. S. Bai, J. Z. Kolter and V. Koltun, “An empirical evaluation of generic convolutional and recurrent networks for sequence modeling,” ArXiv, vol. abs/1803.01271, 2018. [Google Scholar]
38. C. Lea, M. D. Flynn, R. Vidal, A. Reiter and G. D. Hager, “Temporal convolutional networks for action segmentation and detection,” in 2017 IEEE Conf. on Computer Vision and Pattern Recognition (CVPR2017), Honolulu, Hawaii, USA, pp. 1003–1012, 2017. [Google Scholar]
39. Y. Chen, Y. Kang, Y. Chen and Z. Wang, “Probabilistic forecasting with temporal convolutional neural network,” Neurocomputing, vol. 399, pp. 491–501, 2020. [Google Scholar]
40. J. Yan, L. Mu, L. Wang, R. Ranjan and A. Y. Zomaya, “Temporal convolutional networks for the advance prediction of ENSO,” Scientific Reports, vol. 10, no. 1, pp. 1–15, 2020. [Google Scholar]
41. I. O. Tolstikhin, N. Houlsby, A. Kolesnikov, L. Beyer, X. Zhai et al., “Mlp-mixer: An all-mlp architecture for vision,” Advances in Neural Information Processing Systems, vol. 34, pp. 24261–24272.19, 2021. [Google Scholar]
Appendix A
COVID-19 Corona Virus Disease 2019
MDTCNet Multilayer Deep Time Convolutional Neural network
SIR Susceptible, Infected, and Recovered
SEIR Susceptible, Exposed, Infected, and Recovered
ARIMA AutoRegressive Integrated Moving Average
ARMA Autoregressive Moving Average Model
NARNN Nonlinear Autoregressive Neural Network
LSTM Long Short-Term Memory
LR Logistic Regression
TCN Temporal Convolutional Network
CNN Convolutional Neural Network
1D CNN 1D Convolution Neural Network
Cite This Article
 Copyright © 2023 The Author(s). Published by Tech Science Press.
This work is licensed under a Creative Commons Attribution 4.0 International License , which permits unrestricted use, distribution, and reproduction in any medium, provided the original work is properly cited.
 Downloads
 Citation Tools