
 Submit a Paper
 Propose a Special lssue
 Open Access
ARTICLE

Forecasting the Municipal Solid Waste Using GSO-XGBoost Model
1 B.S. Abdur Rahman Crescent Institute of Science and Technology, GST Road, Vandalur, Chennai, 600048, Tamil Nadu, India
2 Pondicherry University, Chinna Kalapet, Kalapet, Puducherry, 605014, India
* Corresponding Author: Arun Raj Lakshminarayanan. Email:
Intelligent Automation & Soft Computing 2023, 37(1), 301-320. https://doi.org/10.32604/iasc.2023.037823
Received 17 November 2022; Accepted 16 January 2023; Issue published 29 April 2023
 View Full Text
 Download PDF
Abstract
Waste production rises in tandem with population growth and increased utilization. The indecorous disposal of waste paves the way for huge disaster named as climate change. The National Environment Agency (NEA) of Singapore oversees the sustainable management of waste across the country. The three main contributors to the solid waste of Singapore are paper and cardboard (P&C), plastic, and food scraps. Besides, they have a negligible rate of recycling. In this study, Machine Learning techniques were utilized to forecast the amount of garbage also known as waste audits. The waste audit would aid the authorities to plan their waste infrastructure. The applied models were k-nearest neighbors, Support Vector Regressor, ExtraTrees, CatBoost, and XGBoost. The XGBoost model with its default parameters performed better with a lower Mean Absolute Percentage Error (MAPE) of 8.3093 (P&C waste), 8.3217 (plastic waste), and 6.9495 (food waste). However, Grid Search Optimization (GSO) was used to enhance the parameters of the XGBoost model, increasing its effectiveness. Therefore, the optimized XGBoost algorithm performs the best for P&C, plastics, and food waste with MAPE of 4.9349, 6.7967, and 5.9626, respectively. The proposed GSO-XGBoost model yields better results than the other employed models in predicting municipal solid waste.Keywords
Every year, the world population increases by 1.05% hence, the amount of global waste generation would also increase enormously [1]. The total waste generated includes all the resources, that were recycled or discarded in landfills. Due to urbanization, the lifetime of a product is minimized while the dismantling time is maximized. Sustainable waste management is to increase the usability of the product or material to the maximum extent thereby decreasing the amount of waste discarded. Sustainability involves the economy, environment, and society to solve the issues of the globe created by humans [2]. The determinants of sustainability such as consumption, production and distribution should be utilized wisely. According to the saying of Mahatma Gandhi, “the earth would have enough to meet the requirements of everyone but not the avaricious of a single person” [3]. Therefore, a shift in the pattern of determinants is required to arrive at a long-term fix.
Waste has a variety of forms, including Municipal Solid Waste (MSW), biomedical waste, chemical waste, inert waste, radioactive waste, sewage, etc. Compared to other wastes, municipal solid waste is produced in vast quantities. The world bank estimates that human activity generated 2.01 billion tonnes [4] of solid waste worldwide in 2016. Solid waste includes trash from homes, businesses, schools, construction sites, city streets, gardens, leather, and other places. The garbage produced by these sectors is separated, gathered, recycled, or processed, transported, and finally discarded [5]. The most common methods of dealing with MSW are incineration, gasification, pyrolysis, open burning, composting, sanitary landfills, controlled dumps, and bioreactor landfills [6]. The improper disposal of municipal solid waste would result in vector-borne diseases.
The goal of this study was to examine the quantity of solid waste generation in Singapore. Air quality in the city-state declined in September 1997 due to the increasing number of industrial movements [7], which in turn exacerbated the waste management crisis. National Environmental Agency (NEA) is developed for managing a clean and sustainable environment in Singapore [8]. Thus, waste treatment capabilities are an integral part of the NEA system. The volume of municipal solid waste has roughly increased sevenfold as a result of the growing population and thriving economy. Disposal rates have increased from about 1260 metric tonnes per day in 1970 to around 8443 metric tonnes per day in 2017 [9]. During the Pandemic of 2020, solid waste production decreased by 19% [10]. Since fewer buildings were being built and demolished, less ferrous metal and construction debris were produced during the pandemic. Recycling rates were lowered as well, falling from 59% in 2019 to 52% in 2020 [11].
Discarded materials are regularly burnt at the Semakau landfill after being recycled or treated [12]. The toxic gases released from the incineration plants were filtered out, therefore the air released into the environment is quite pure. Furthermore, the ash is deposited in the water of the man-made island, which does not touch the ocean and thus has no negative influence. The heat from incineration plants is used to generate electricity for thousands of households. Though Singapore manages the waste in a structured way, the sole landfill would reach its capacity by 2035. Moreover, there is no room to create a second landfill in the tiny city-state [13]. Hence, there is an urgency to build sustainable waste management regulations. To overcome this problem the decision-makers should be aware of the amount of waste generated.
The rest of the paper is organized as follows: The second section highlights the latest research achievements in predicting the quantity of waste using Machine Learning (ML) methods. Section 3 summarizes the features of the data set. In Section 4, the results of the exploratory analysis are presented. The fifth section outlines the proposed model and experimental results. In Section 6, the article finishes with the proposed direction for further research.
A comprehensive overview of several subfields of the MSW over the past two decades was presented by Xia et al. [14]. Classification, control, and optimization of the landfill, bin detection, and optimum route planning were all considered for the analysis. Other topics covered were trash generation prediction, leachate gas, heating value, and compost maturity. Gradient Boost Regression was instigated in conjunction with other characteristics such as precipitation, population density, and temperature to develop a waste generation forecast model [15]. By achieving R2 score of 0.93, it surpassed all other existing systems. Guo et al. [16] and Zhang et al. [17] made projections for MSW generation rates in China. They exploited the influential socio-economic factors along with the amount of solid waste produced. It is evident from both studies that the population and GDP are highly correlated with the quantity of trash spawned. In Bahrain, annual trash generation rates were analysed using population, tourism, CO2 emissions, and Gross Domestic Product (GDP) as explanatory variables [18]. Support vector regression (SVR) and Multi-layered Perceptron (MLP) were applied. The best R2 value was found for SVR-RBF, at 0.97, making it the most effective method.
Physical composition (PC) drifts of MSW were predicted using Artificial Neural Network-Bayesian Optimization with ensemble learning [19]. Each PC is predicted to show collinearity using a unique set of metrics. Forecasts indicate that by the year 2030, Malaysia would generate around 42,873 tonnes of trash daily. A case study was conducted in Johannesburg to scrutinize the effects of seasonal variation on the physical composition of solid waste using the Adaptive Neuro-Fuzzy Inference Systems (ANFIS) model [20]. In addition, three clustering models namely grid partitioning (GP), subtractive clustering (SC), and fuzzy c-means (FCM), and two optimization techniques Genetic Algorithm (GA) and Particle Swarm Optimization (PSO) were employed. The PSO-ANFIS-SC model obtained the cluster radius (CR) and squash factor (SF) of 0.25 and 1.3 respectively for paper while the GA-ANFIS-SC model acquired the CR of 0.35 and SF of 1.2. Utilizing the optimized neural network, the generation of solid waste in Poland was examined. The Artificial Neural network (ANN) model along with the PSO approach outperformed the classic ANN model, achieving a Pearson coefficient of 0.96 and an efficiency coefficient of 0.92 [21]. On the other hand, Wu et al. [22] used a conventional ANN model to shed light on the regional differences found in the MSW of China. In the South, the ANN model had R2 of 0.968, while in the North it was 0.946 and, in the West, it was 0.943.
The proportion of garbage in the city of Akola, a region of Maharashtra, was evaluated using four distinct Machine Learning methods: Decision Tree (DT), Multiple Linear Regression (MLR), Random Forest, and XGBoost. Rathod et al. found that Random Forest provided superior results, with R2 of 0.6758 and Root Mean Square Error (RMSE) of 0.1544 [23]. Sharma et al. established a framework for the solid waste management decision support system [24]. The k-means clustering technique was implemented to analyse the data. Random Forest (RF) model worked well in predicting the amount of Construction and Demolition (C&D) trash generated [25]. Sensor information was also used to determine how recycling bins are emptied. The RF algorithm achieved 99.1% accuracy [26] when filling levels were measured at regular intervals Camero et al. devised a deep neuro-evolutionary technique to proactively generate a deep network that incorporates the behavior of all 217 South Spanish containers [27]. The Recurrent Neural Network (RNN) model was commissioned to predict solid waste with an error rate of 0.028. The weekly MSW consumption of paper, reuse, and plastic/glass were predicted using the Gradient Boosting Technique (GBRT). The GBRT model was more successful, with R2 of 0.8 [28]. Younes et al. [29] determined the annual amount of garbage produced using an ANN feedforward neural network with exogenous inputs (NARX). The R2 value for this model was the highest (0.97). In this study, we attempted to predict the quantity of MSW using ML models.
3 Dataset and Proposed Methodology
National Environmental Agency (NEA) was established to strategize, improve, and direct the management of solid and hazardous waste in Singapore. The NEA provides permits and regulatory control for waste management businesses to guarantee legitimate garbage collection, sorting, and disposal. Singapore’s solid waste dataset which spans from 2003–2021, was utilized in this study. The quantity of waste could be calibrated from many stages of waste disposal that include, generation, collection, transportation, treatment, and disposal. The statistics regarding waste are retrieved from the website data world [30]. The dataset includes the year, waste category, total waste created, recycling rate, total recyclable waste, and total tonnes of trash dumped. The following categories of solid waste that are included: Paper and Cardboard (P&C), Construction and Demolition debris (C&D), Ferrous Metals (FM), plastics, food waste, used slag, wood and timber, horticultural waste, stones, ceramics, rubber, ash and sludge, textiles and leather, nonferrous metals, glass, and scrap tyres. Prior to analysis, the dataset was preprocessed to remove irrelevant variables, such as recycling rate, total trash recycled, and total waste discharged after recycling. Fig. 1 represents the systematic approach of this study. Table 1 details the characteristics used in this analysis.
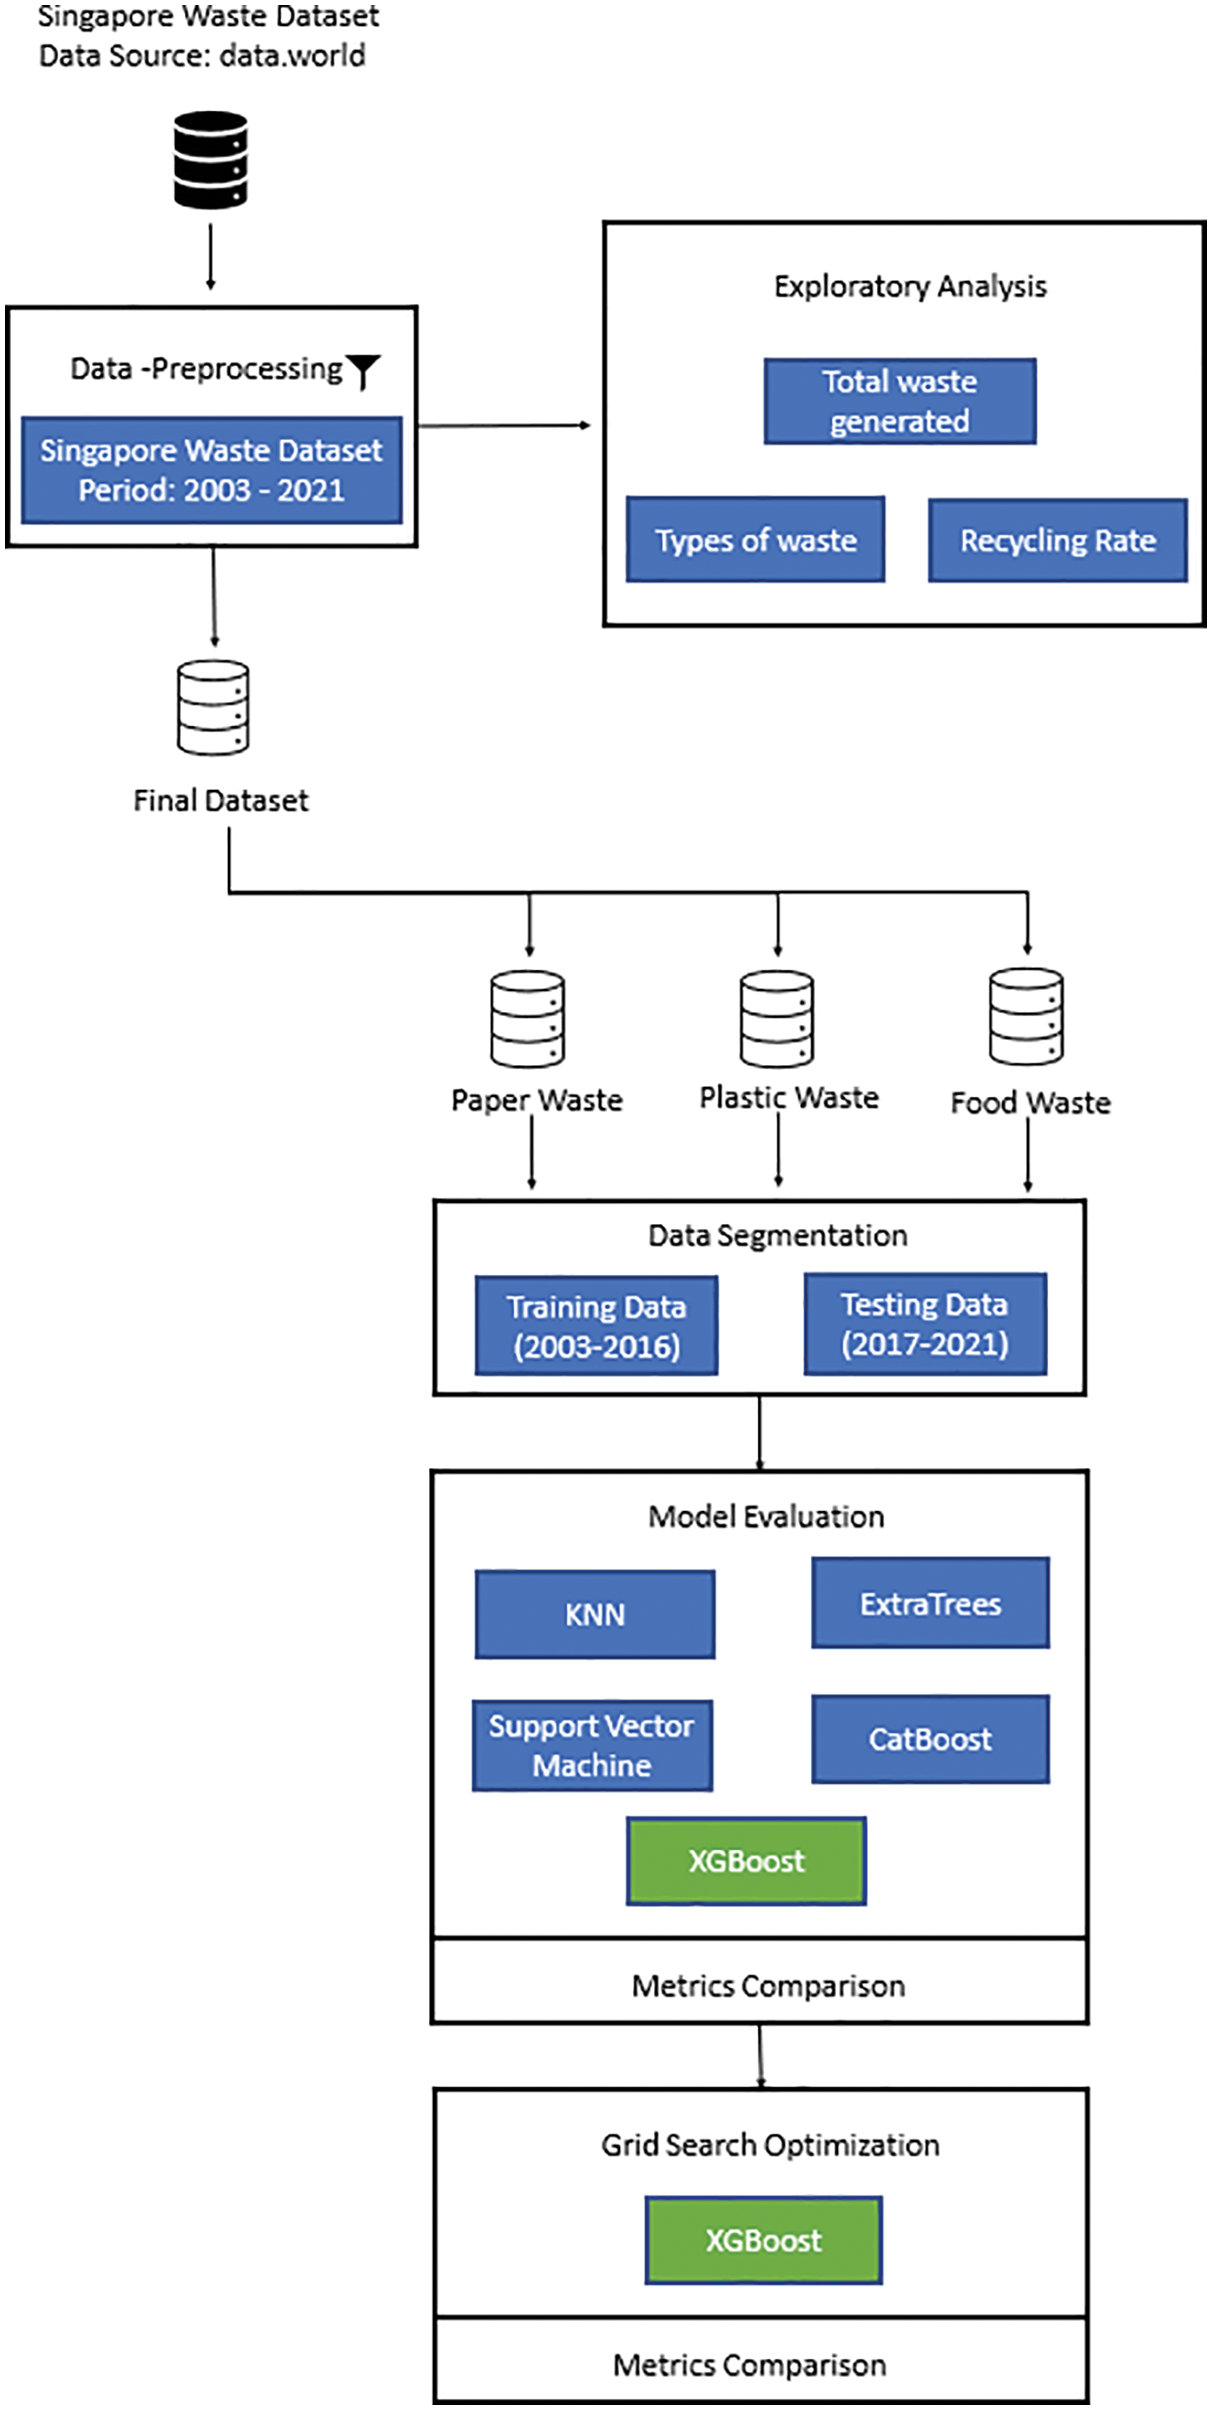
Figure 1: Flow diagram of the proposed model
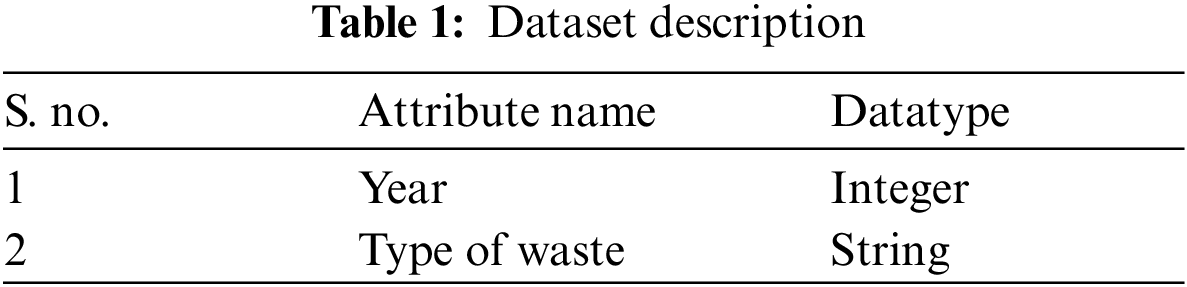
The different forms of solid trash are arranged in ascending order based on the sum of their typical garbage generation from 2003 to 2021, as shown in Fig. 2. When compared to other waste categories, scrap tyres are the most efficient waste. It is also estimated that over 82% of used tyres are recycled. Consequently, there is a negligible rate of scrap tyre disposal. Sustainable practices are becoming the norm; therefore, most people and businesses now use glass containers instead of plastic products. Glass has a recycling rate of approximately 16%, which is double that of plastic. However, 16% of the recycling rate is insignificant, resulting in an enormous volume of garbage disposal in landfills. Therefore, people need to find suitable plastic substitutes, such as ferrous or non-ferrous metals. Larger quantities of non-ferrous metals, such as copper, aluminum, brass, bronze, etc., were being executed in several companies and automobiles. As they have an 87% recycling rate the waste disposed of is comparatively low.
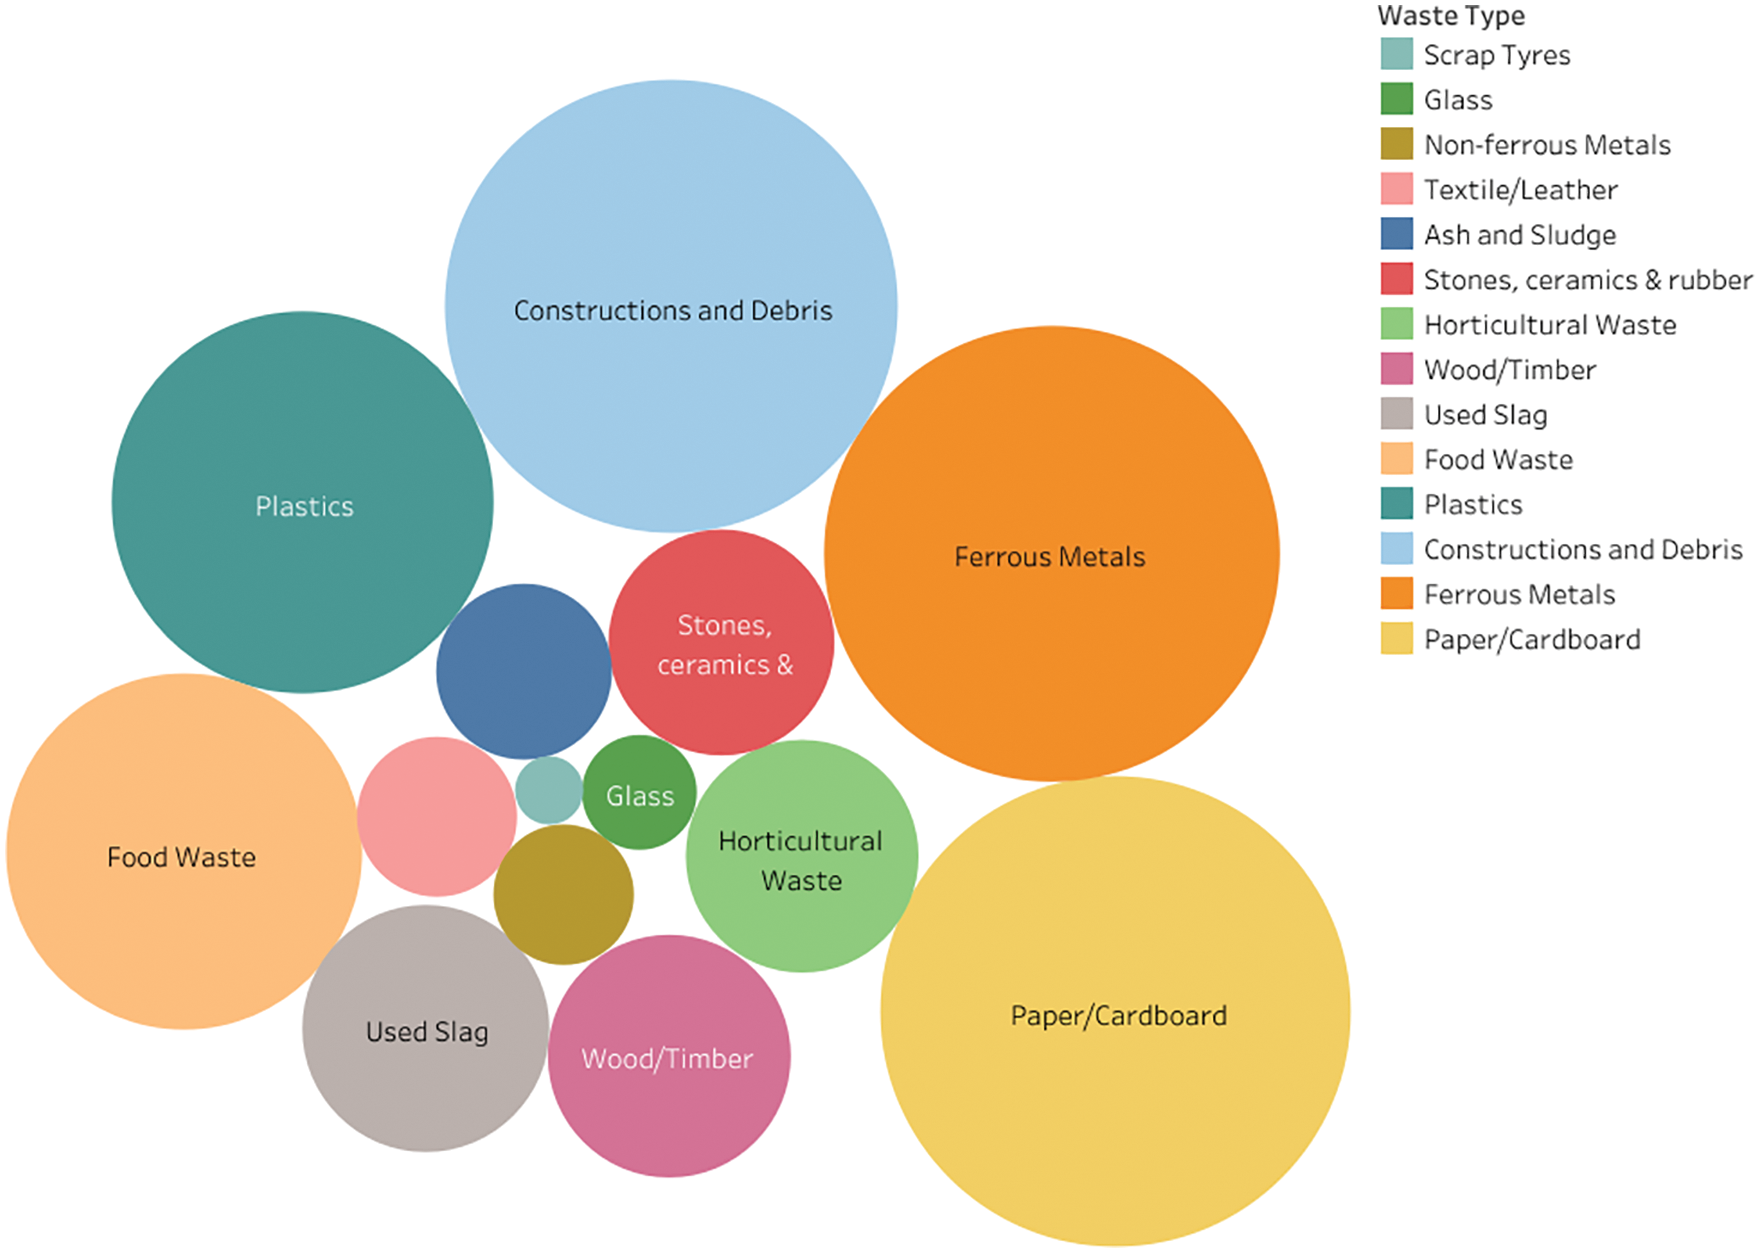
Figure 2: Different forms of solid waste
Once textiles and leather were considered luxurious products which were unaffordable. However, in the past 18 years around 133 million tonnes (Mt) of textile and leather waste was generated. The recycling rate of this type of waste is only 7%. Singapore is ranked twenty-sixth of the 136 nations whose poverty levels are examined [31]. Around one million families live without basic needs, hence the country could consider the practice of reusability into account. This could also lower the amount of waste generated. Ash and sludge could not be disregarded as a by-product of waste treatment facilities and similar sectors. A mere 4% of ash and sludge are recycled annually on average. Around 2.74 Mt were comprised of stones, ceramics, and rubber from various industrial and other sources. This waste category has the lowest recycling rate, at 3%. The land loses its fertility when these wastes are dumped on it.
The horticultural waste consists of the parts of plants and trees that are removed during maintenance and discarded. The average quantity of horticultural waste produced was around 2.87 Mt, of which 53% could be recycled and the remaining waste would get decomposed since it is organic waste. The disintegration of horticultural waste takes place in a matter of months if it is treated properly, but it might take as long as 18 months if it is not. However, if left alone, wood and lumber waste would take between fifty and one hundred years to decompose. Hence, the wood might be repurposed in the furniture industry after being whittled down. The entire amount of wood and timber waste disposal would be 1.09 Mt, with 62% of that being recyclable. Slag is an oxide mixture that is produced when metals are refined from their ores. The average quantity of spent slag produced is 3.34 Mt per year, although 96% of that is recycled. Only four percent of garbage is sent to landfills, the rest is recycled into concrete.
It is evident from Fig. 2 that P&C, FM, C&D, Plastics, and Food waste were the five major solid wastes produced in a significant volume. Figs. 3–5 display the progression of primary MSW from 2003 to 2021 in Singapore. There is a massive quantity of P&C trash generated every year. However, the same situation does not exist for many years. Since 105 Common Era (CE), paper is the means of mass communication. Water and wood pulp are the primary raw materials for making paper. The paper has seen extensive use in both homes and commercial establishments. Hence, more amount of paper waste has been generated each year. Paper items such as cardboard, envelopes, and wrappers, among others, are utilized in business in addition to standard printer paper. During the considered year of the study, approximately 118 Mt of paper and cardboard were discarded. Between the years 2003 and 2011, the paper was the most frequently discarded material in the employed data. Later, industrialization led to a rise in the proportion of ferrous waste and C&D. The recycling rate for paper and cardboard was between 38% and 58%, even though these materials are recyclable and biodegradable. Approximately 50% of the remaining waste ended up in the landfill in Singapore which is around 1.06 Mt.
Figure 3: Total wastes generated (tonne)–2003–2008
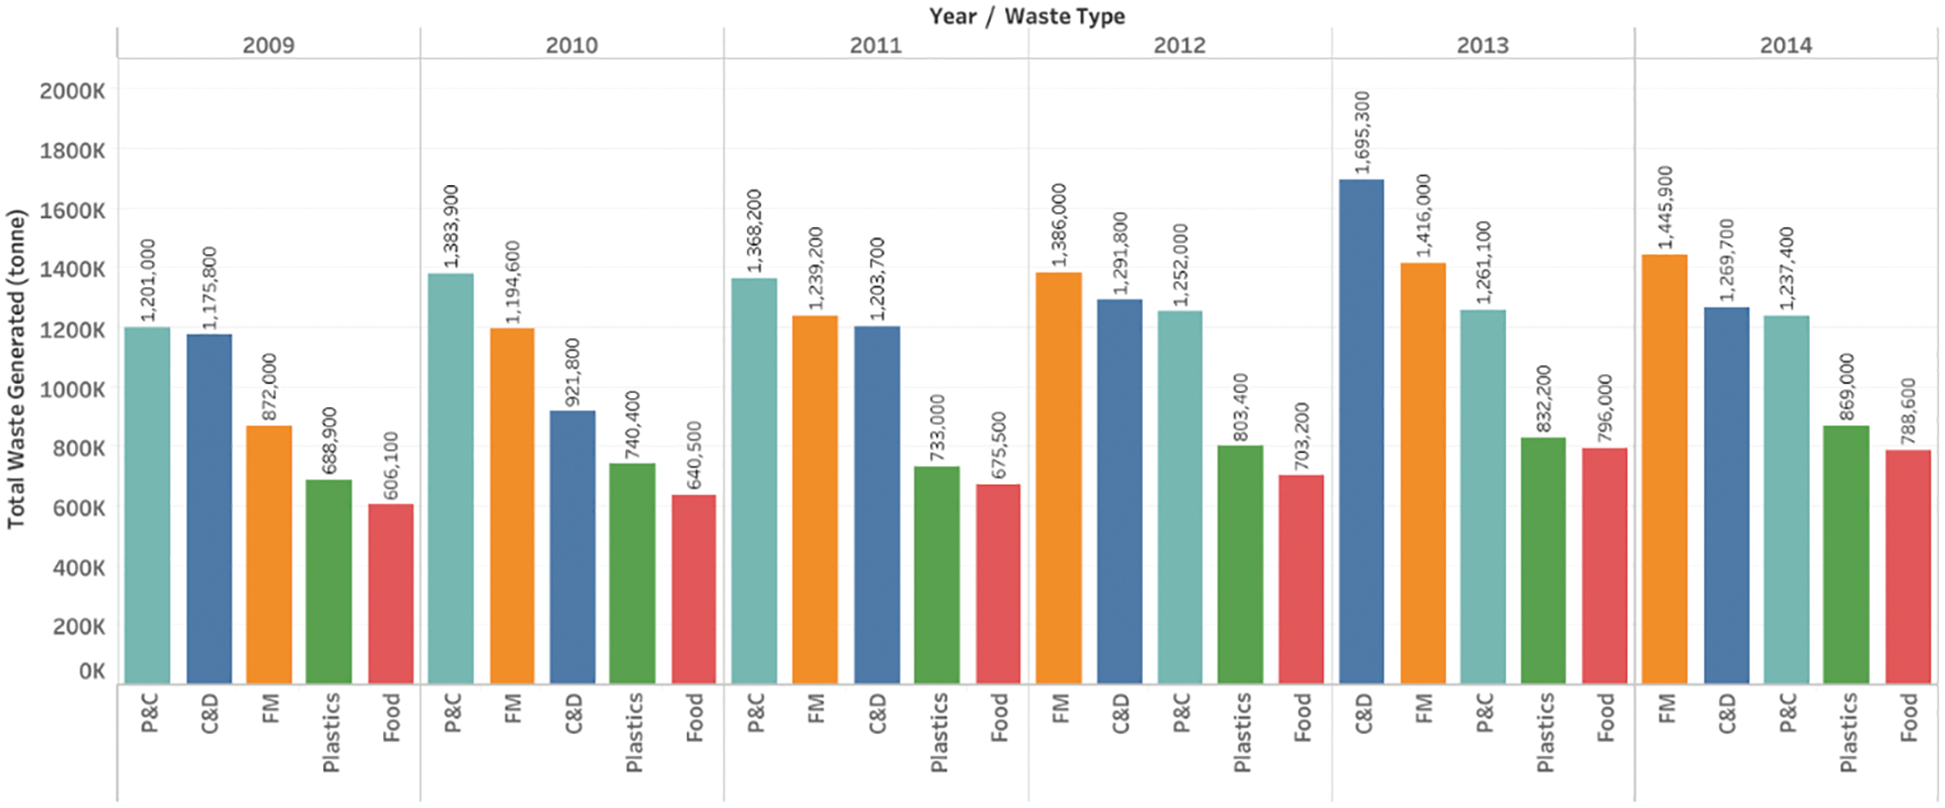
Figure 4: Total wastes generated (tonne)–2009–2014
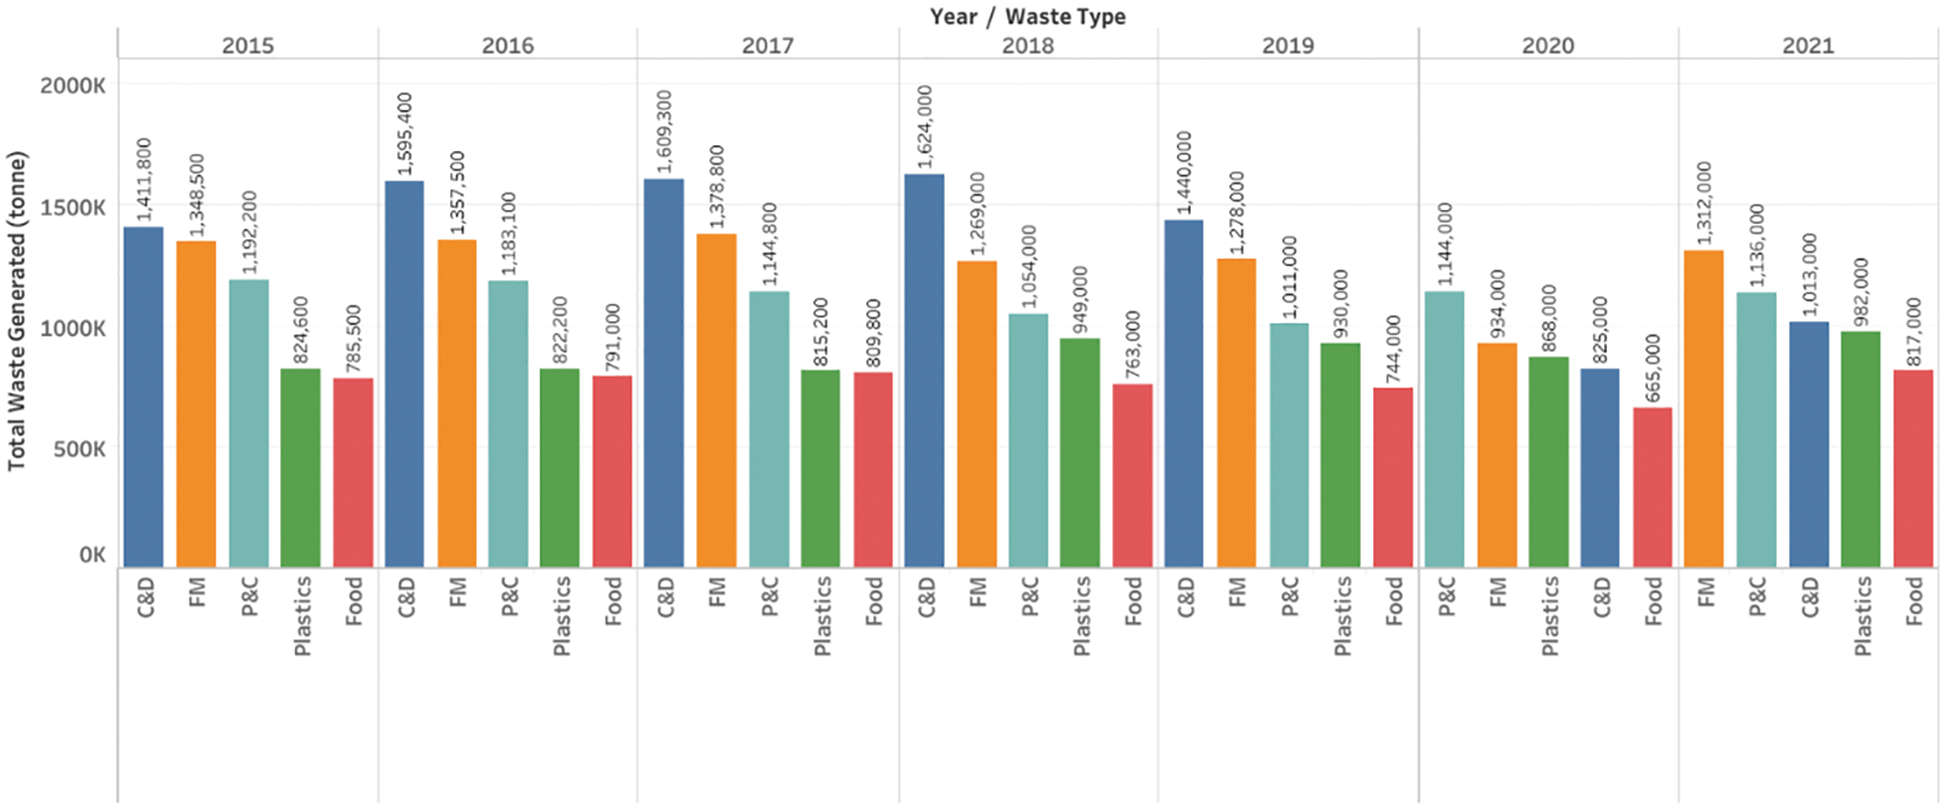
Figure 5: Total wastes generated (tonne)–2015–2021
The aggregated quantity of the ferrous metal waste was around 110 Mt. However, FM wastes were recycled at a rate of 90%–99%. Therefore, when compared to other waste categories, the annual rate of 44,000 tonnes of garbage dumped is quite low. In 2003, building and demolition waste amounted to roughly 422 Mt as a direct result of rising urbanization. Even though C&D waste has grown over time, between 93% and 99% of it is recycled. C&D generates the least garbage (14,000 tonnes annually) among the top five waste generators. Due to the lack of building in the pandemic scenario, C&D wastes were once again lowered in 2021.
Over the course of the 18 years covered by this study, there was no discernible change in the total amount of plastic trash. Although it ranks lower than the first three, plastic waste accounts for between 579 and 949 Mt of all trash generated each year. Plastic recycling only accounts for about 8 percent of all recyclable materials. Due to its non-biodegradability and low recycling rate, 1.38 Mt of plastic garbage is sent to landfills annually. One in ten Singaporeans has trouble affording necessities like food and shelter. However, in the same state, food waste amounted to 5–8 Mt which would feed around two bowls of rice per person each day. On average, the recycling rate of food waste is approximately 12% which is feeble. Increased food waste would result in the utilization of resources in a greater amount which might affect sustainability.
Though FM and C&D wastes were among the top five streams of waste they could be reused and recycled. According to Fig. 6, the percentage of recycling for both FM and C&D wastes is approximately 99%. The pandemic also contributed to a significant drop in FM and C&D garbage. Therefore, they were removed from the scope. P&C, Plastic, and Food waste are the most pervasive of the top five MSW. This was also reflected in the low rate at which it was recycled. Consequently, from 2003 to 2021, this study focused on these three types of garbage.
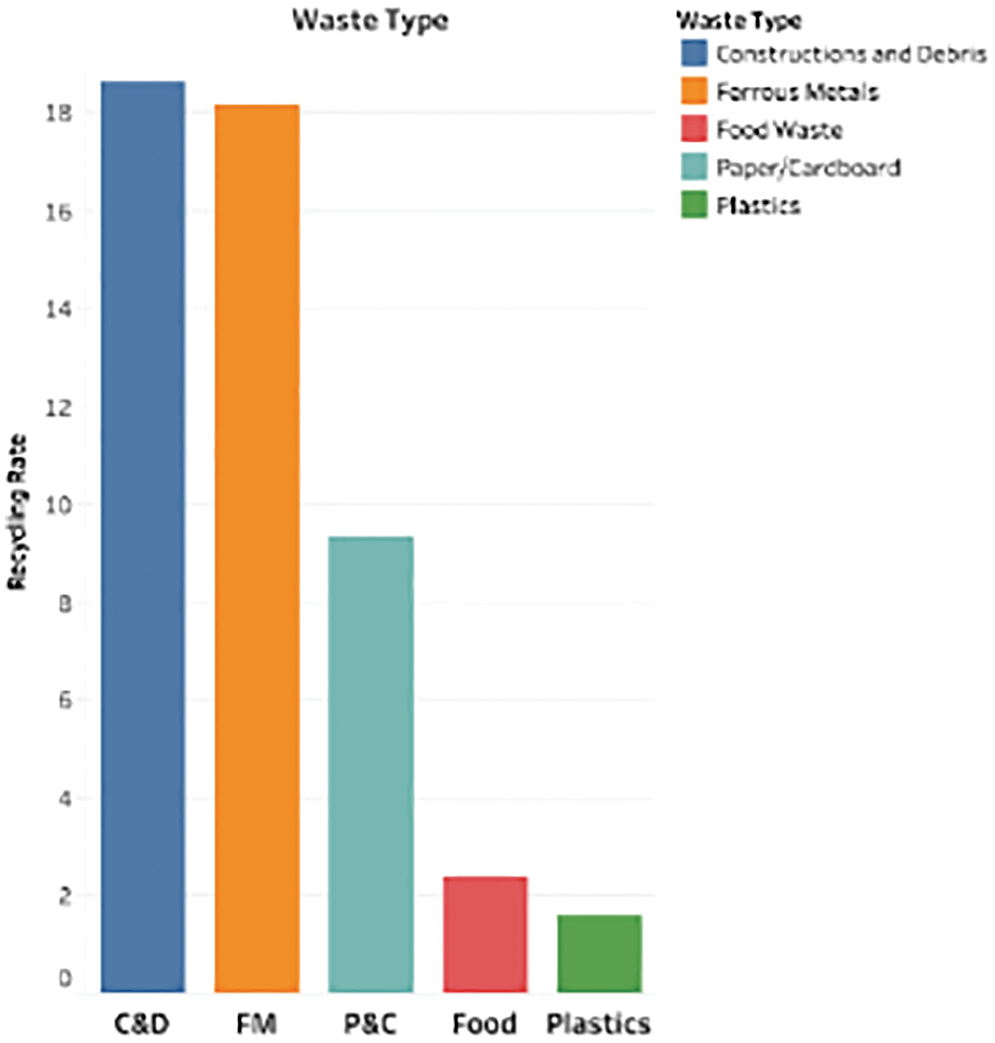
Figure 6: Recycling rate
The P&C, plastics, and food waste datasets were divided into 13 years (2003–2016) as a training set and 5 years (2017–2021) as testing data. The trend of all three employed datasets seems to be declined due to digitization and Covid-19. However, they still contribute a major part to the generation of MSW. The most common types of MSW, including paper and cardboard, plastic, and food scraps, were analysed with the help of Machine Learning techniques including k-nearest neighbors (KNN), Support Vector Regressor (SVR), ExtraTrees, CatBoost (CB), and XGBoost (XGB). Even though ML models perform better, optimizing them would minimize the cost function, resulting in improved performance. More specifically, tweaking the XGBoost model's hyperparameters yielded significant improvements. The hyperparameters are the values of the learning process; by optimizing them, the maximum performance of XGBoost could be achieved. Compared to the XGBoost model trained with the default settings, the optimized model produced superior results. Kartik Budholiya et al. utilized the optimized XGB model to predict heart disease [32]. In comparison to RF and ExtraTree, the proposed model achieved a 3.28% higher accuracy rate. Though the XGBoost model produced better results, Jiang et al. augmented the XGB model and achieved an AUC of 0.99 [33]. To forecast the load, Wang et al. hyperparameterized the XGBoost model and ran it through a series of experiments with a wide range of industrial clients [34]. The studies show that the enhanced XGBoost produced better results. Therefore, we combined Grid Search Optimization (GSO) with XGBoost in this investigation. Algorithm 1 provides the corresponding GSO-XGBoost pseudocode.
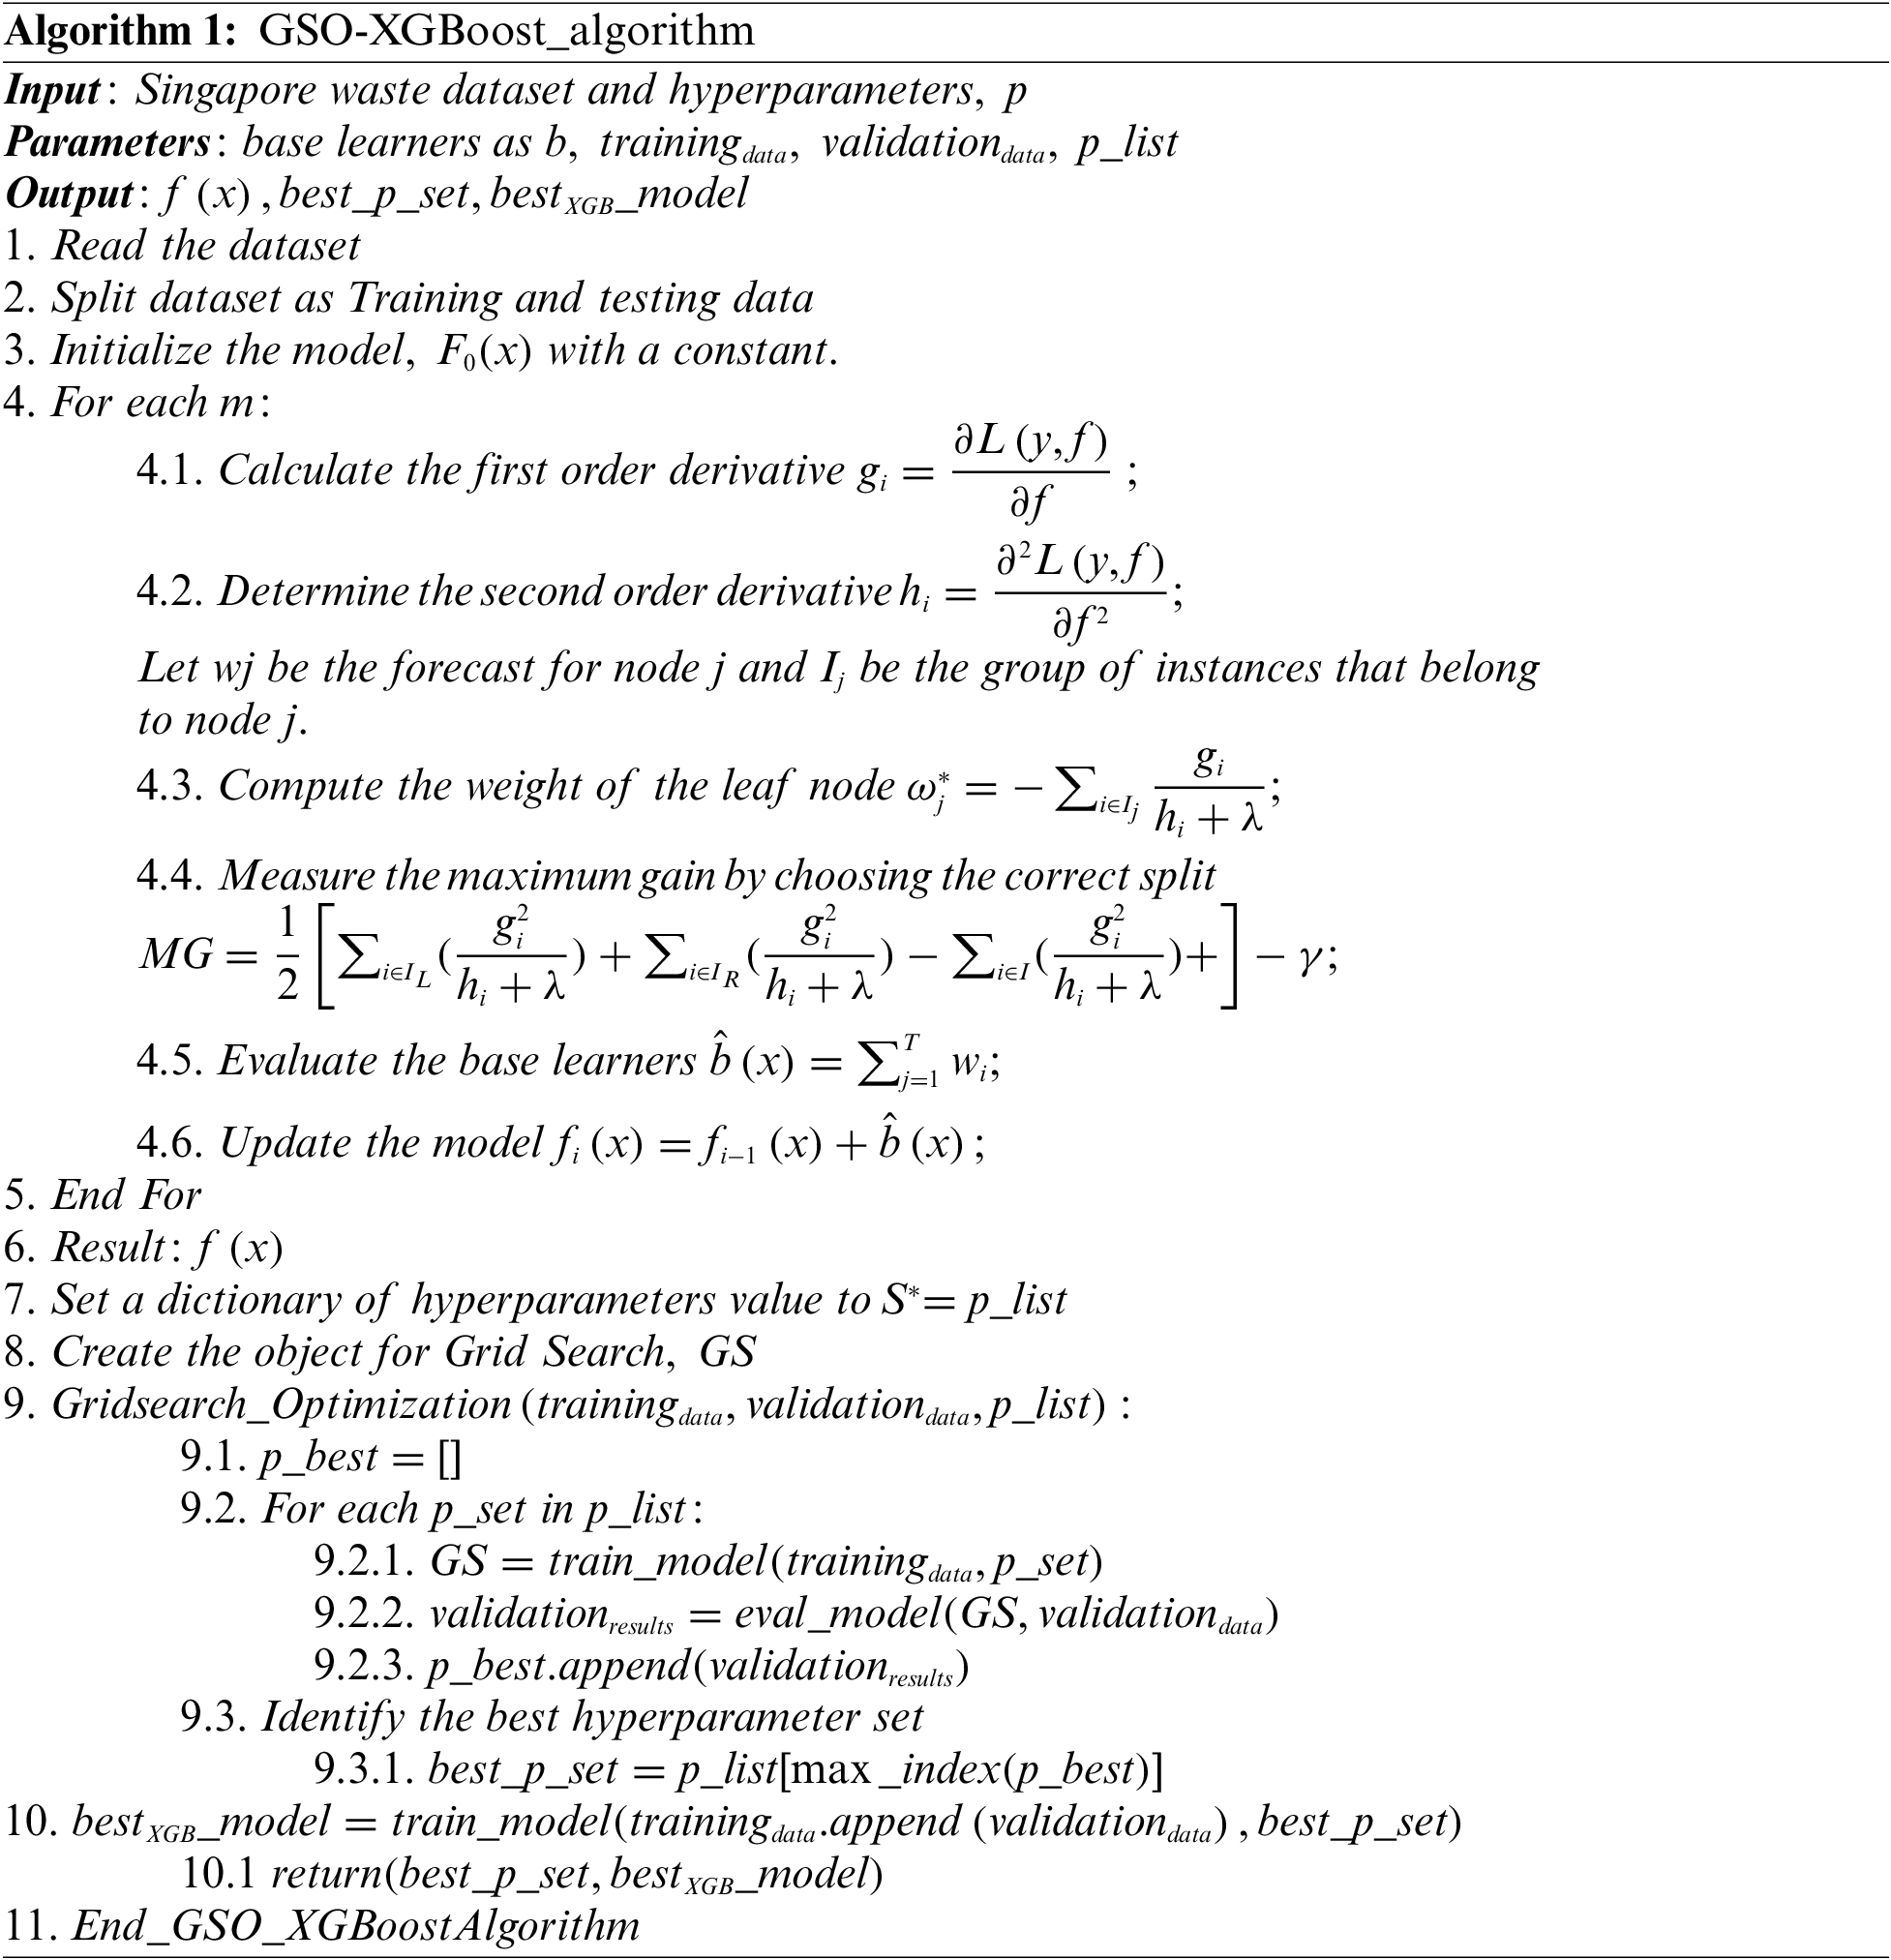
The eXtreme Gradient Boosting (XGBoost) is a model that uses a gradient descent framework to execute the principle of enhancing weak learners. Specifically, it uses Classification and Regression Tree (CART) as it is a weak learner. This could be mathematically defined as follows.
Regression trees link each input data point to a leaf assigned a continuous score [35]. It determines the slope direction using gradients of the second order. XGBoost also uses both regularizations (L1 − λ and L2 − λ2) to prevent overfitting. The objective function of the XGBoost is represented in Eq. (2). The complexity of trees is determined by the number of leaves and the L2 normalization of leaf scores, as depicted in Eq. (3).
where L(t)–objective function,
where T-number of leaves, w-weights of leaves.
The objective function L(t) comprises a loss function and a penalty term for the model’s complexity. The model is trained continuously with the inclusion of new trees that forecast the residuals or errors of previous trees, which are then integrated with earlier trees to provide the final prediction. Gradient boosting is so-called because it employs a gradient descent technique to minimize the loss caused by adding new models.
XGBoost is noted for its rapid and effective computation [36]. It has been used by Ogunleye et al. [37], Dhaliwal et al. [38], and Biswas [39]. to detect chronic renal disease, detect intrusions, and forecast crimes. The XGB model was therefore used to make predictions about Singapore's MSW in this investigation.
The grid search optimization (GSO) model would analyse every possible combination of hyperparameters and evaluate each model. It provides better results for the datasets with a minimal number of parameters. Hence, in this study, the GSO model was used to enhance the XGBoost model to improve the efficacy of the model with ten cross-validations.
Let
The dictionary of the grid search parameters would contain a list of lower bound
Eqs. (5) and (6) depict the lower bound and upper bound of Eq. (4). Parameters like max depth and n_estimators were tuned to obtain optimum efficacy. If the max depth option is set too high, the size of decision trees would be constrained. The default setting for the XGBoost max depth parameter is six. The n_estimator variable represents the number of trees needed for the forecast. Tree complexity increases as the number of nodes in the model increases. The grid search compares all the values set for the parameters. Thus, using grid search one could create an n-dimensional grid of unique hyperparameter combinations, where n is the number of hyperparameters utilized to optimize the model. For the employed datasets, the grid search provided that XGBoost (Max depth = 3, n estimators = 100) is optimal. Hence, these hyperparameter values were applied to the XGBoost model to decrease the error rate.
This research makes use of the Key Performance Indicators (KPI) of Mean Absolute Percentage Error (MAPE), Mean Absolute Error (MAE), and Root Mean Square Error (RMSE).
where
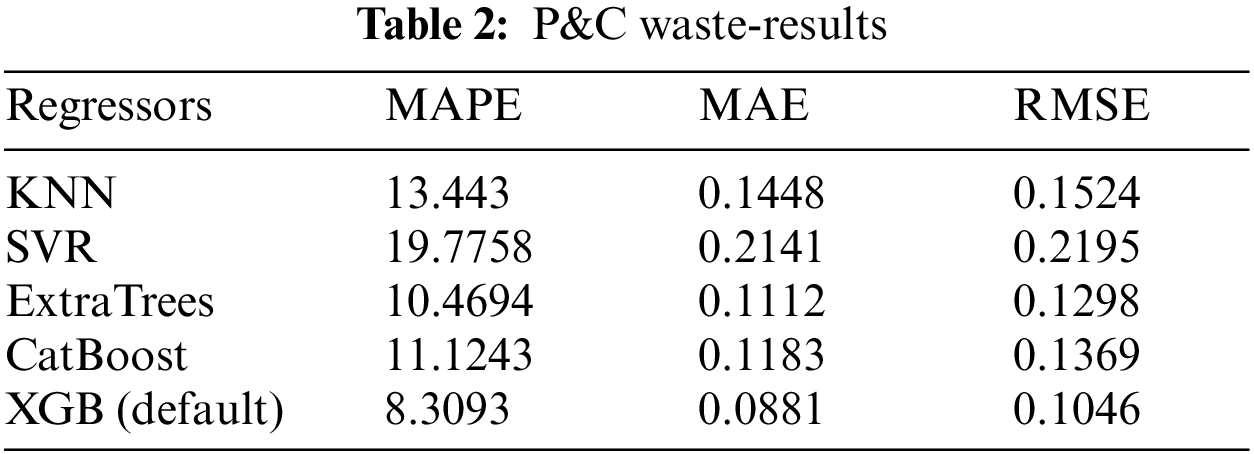
P&C garbage constitute the majority of municipal solid waste. As indicated in Fig. 7, the paper waste data pattern is complex, and the trends of all applied models are displayed. The SVR performed the worst with MAPE of 19.7758. The KNN and CatBoost models yielded mediocre results, with MAPE of 13.443 and 11.1243, respectively. It is obvious from Table 2 that the XGBoost model with its default parameters beats the other methods with MAPE of 8.3093, MAE of 0.0881, and RMSE of 0.1046. ExtraTrees is the second-best model for predicting paper waste.
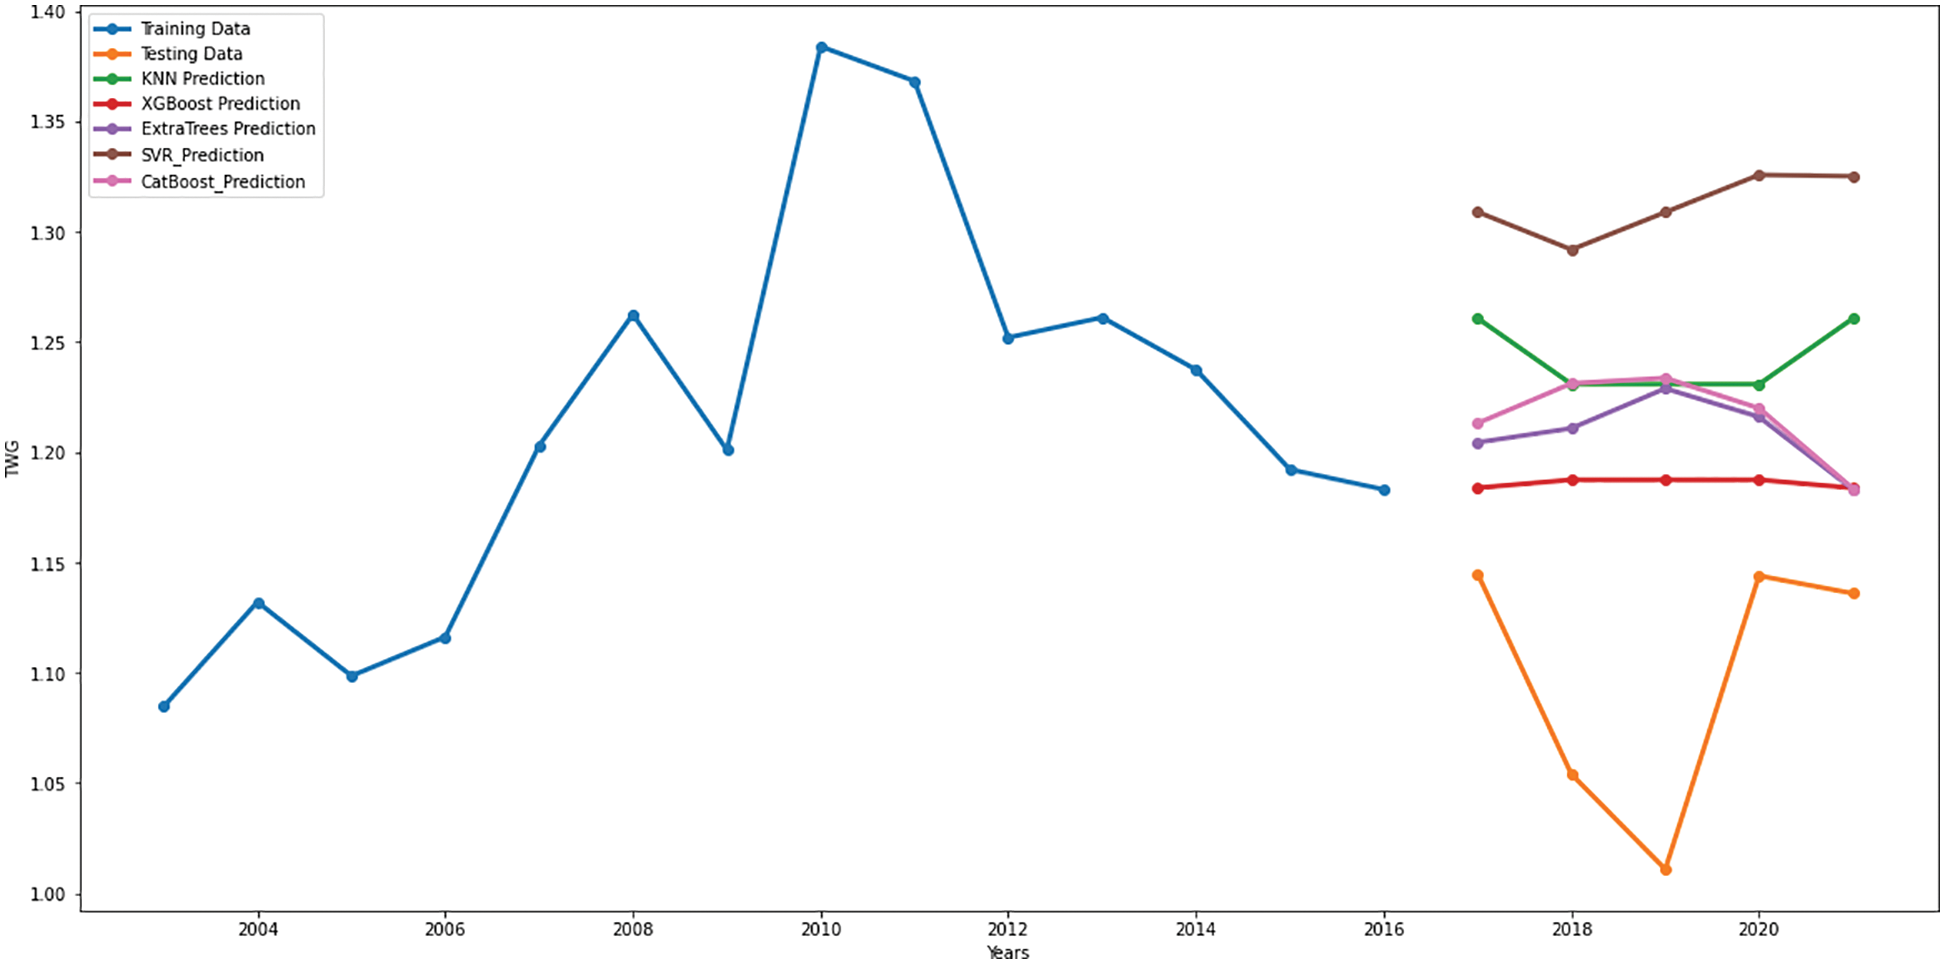
Figure 7: P&C waste–trend of the models
Even though the XGBoost model functioned well with the predetermined parameters, it has been tweaked to enhance its effectiveness. The grid search approach is employed to tune the XGBoost model. According to the GSO, the XGBoost model is yielded with max_depth as 3, and n_estimators as 100 would be optimal. Thus, the hyperparameterized XGBoost is applied to the paper waste dataset. As a result, Fig. 8, and Table 3 depict that the percentage of errors has decreased by around 41%. The results obtained by the employed models are represented in Figs. 9a–9c. Hence, with MAPE of 4.9349 and RMSE of 0.0556, the hyperparameterized XGBoost model produced the best result for Singapore's paper waste.
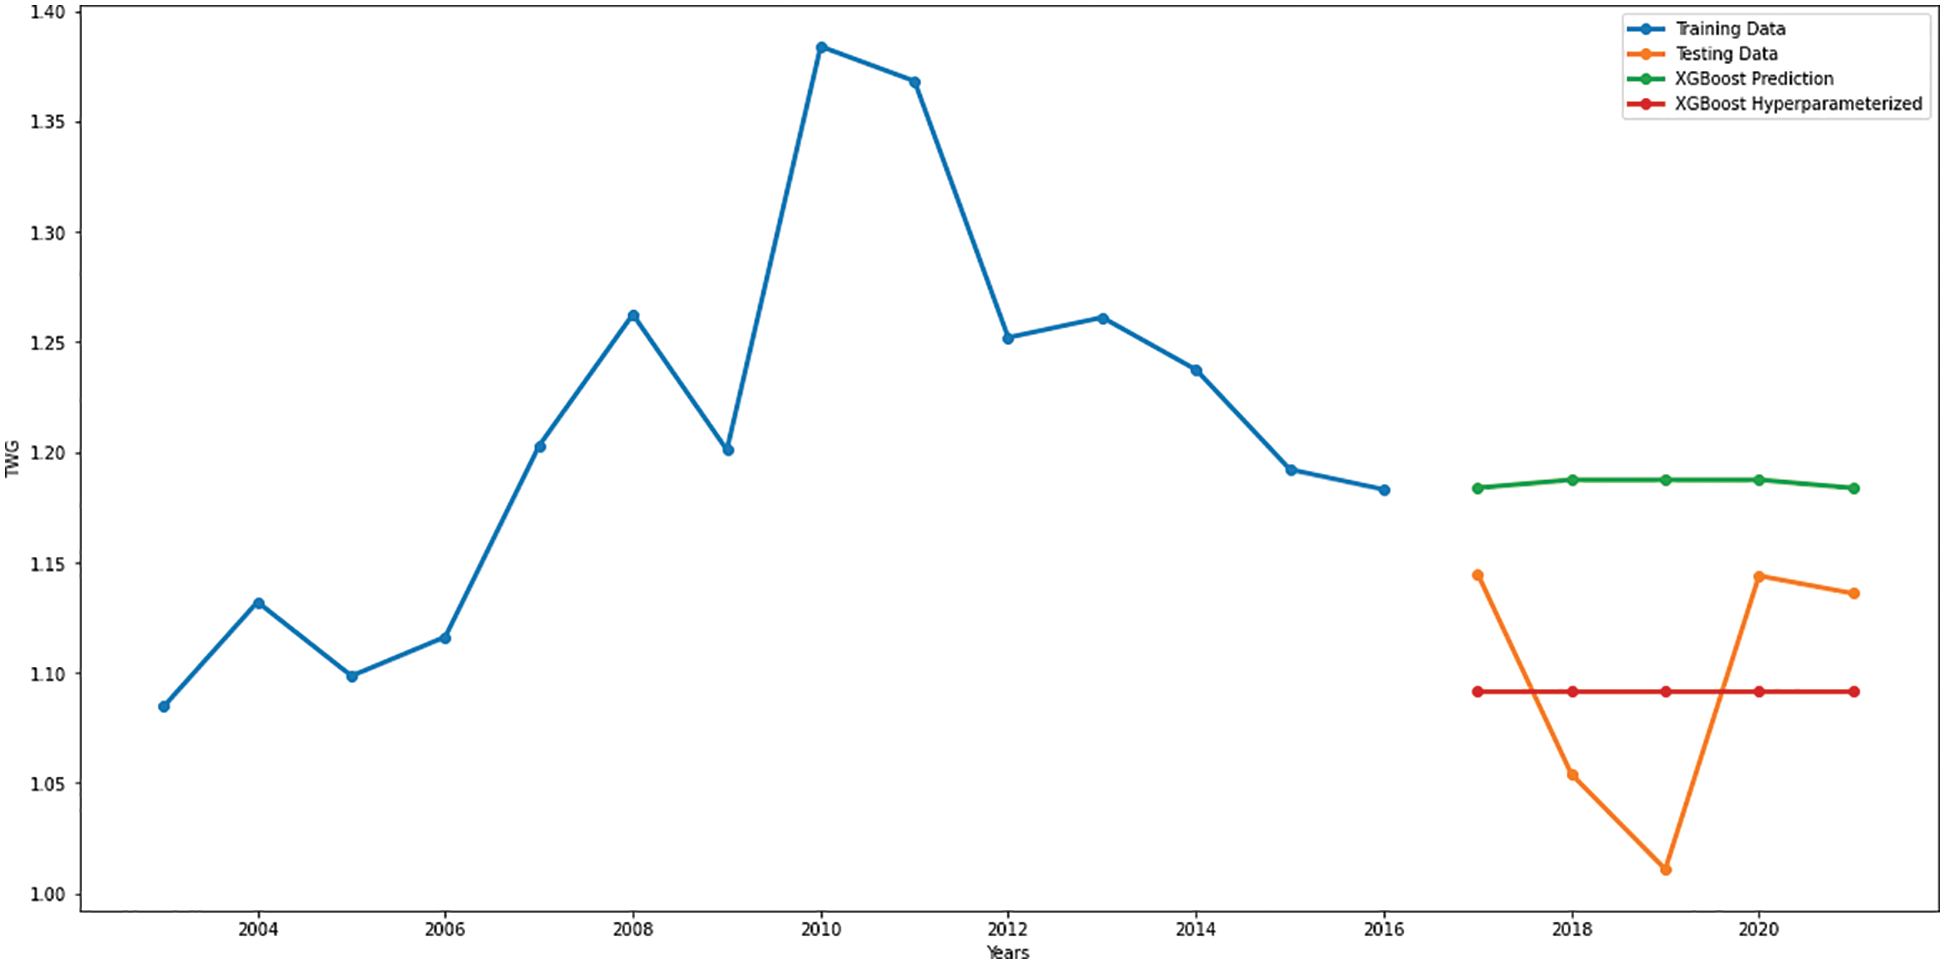
Figure 8: P&C waste–trend of XGB and optimized XGB
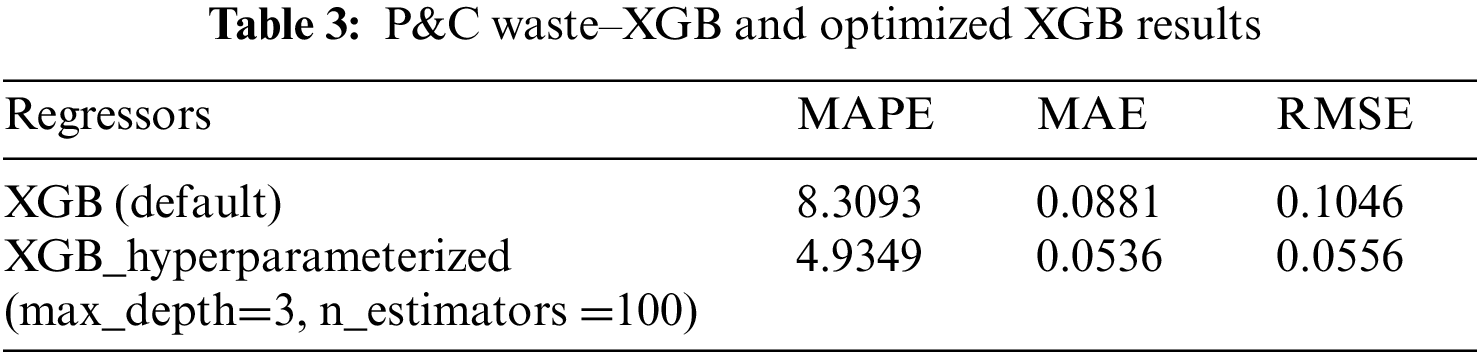
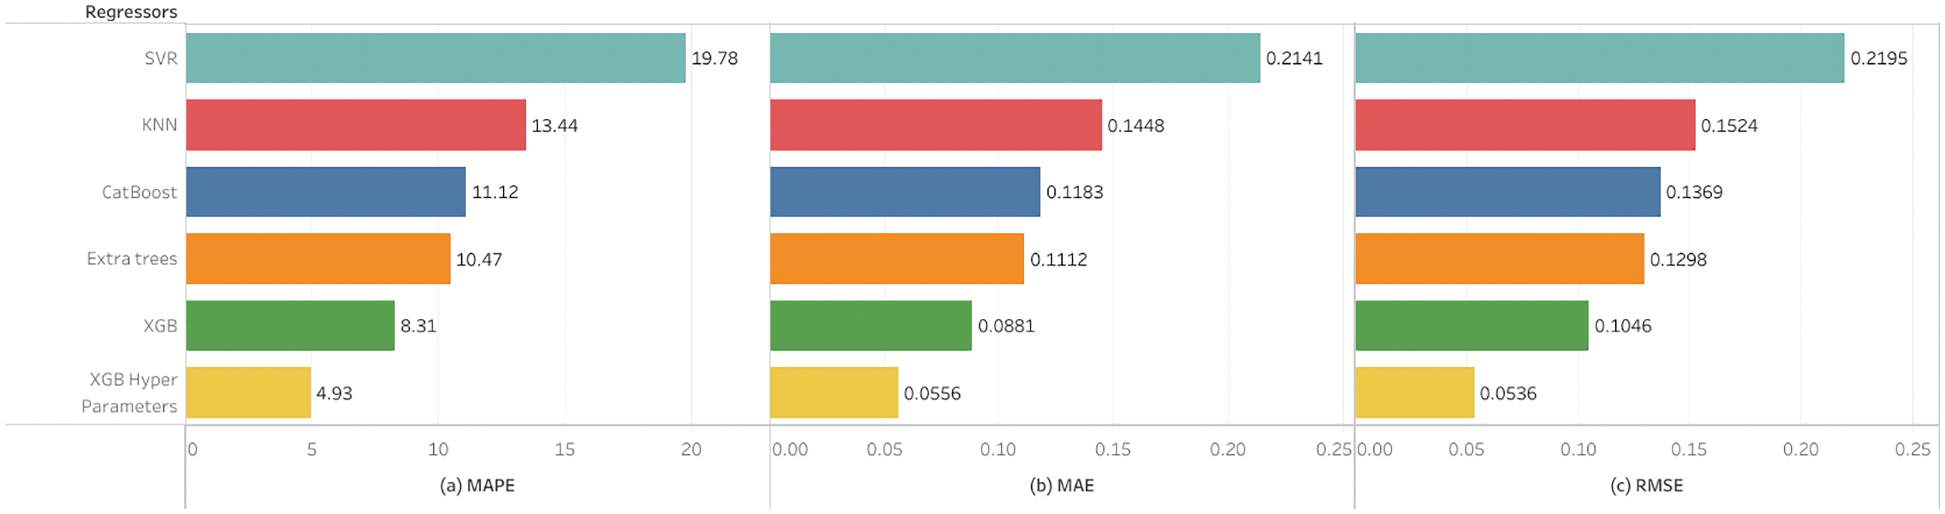
Figure 9: P&C waste- (a) MAPE (b) MAE (c) RMSE
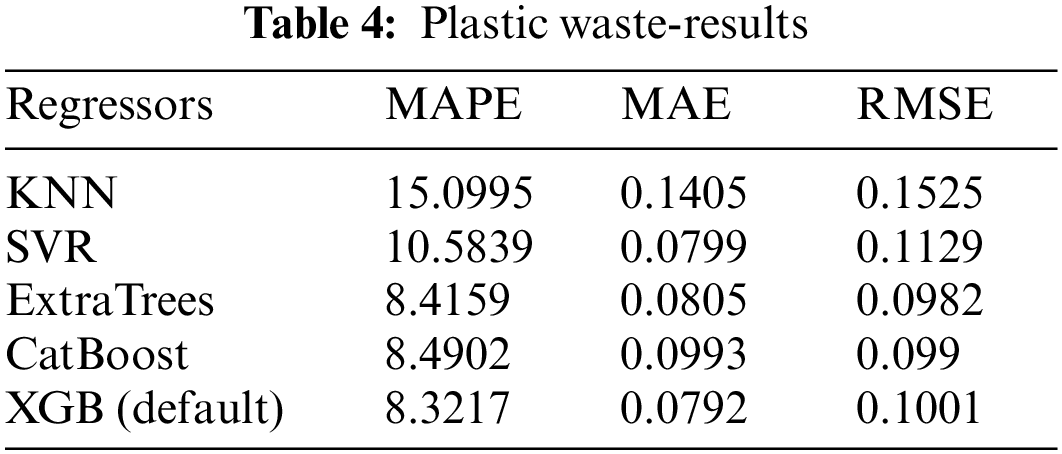
The segmentation of the training and testing portion of the dataset and the trend of the utilized models are depicted in Fig. 10. The graph demonstrates that the KNN model is the worst performer for the plastics dataset, with MAPE and RMSE values of 15.0995 and 0.1525, respectively. ExtraTrees model took second place by delivering MAPE of 8.4159. However, the CatBoost model has an infinitesimally small variation with the MAPE of 8.4902 when compared with the ExtraTrees model. Though the SVR model had obtained a lower MAE of 0.0799 when compared with CatBoost and ExtraTrees, it is an average performer with MAPE of 10.584 and RMSE of 0.1129. Table 4 indicates that the XGBoost model outstripped all other algorithms by acquiring MAPE of 8.322, MAE of 0.0792, and RMSE of 0.1001.
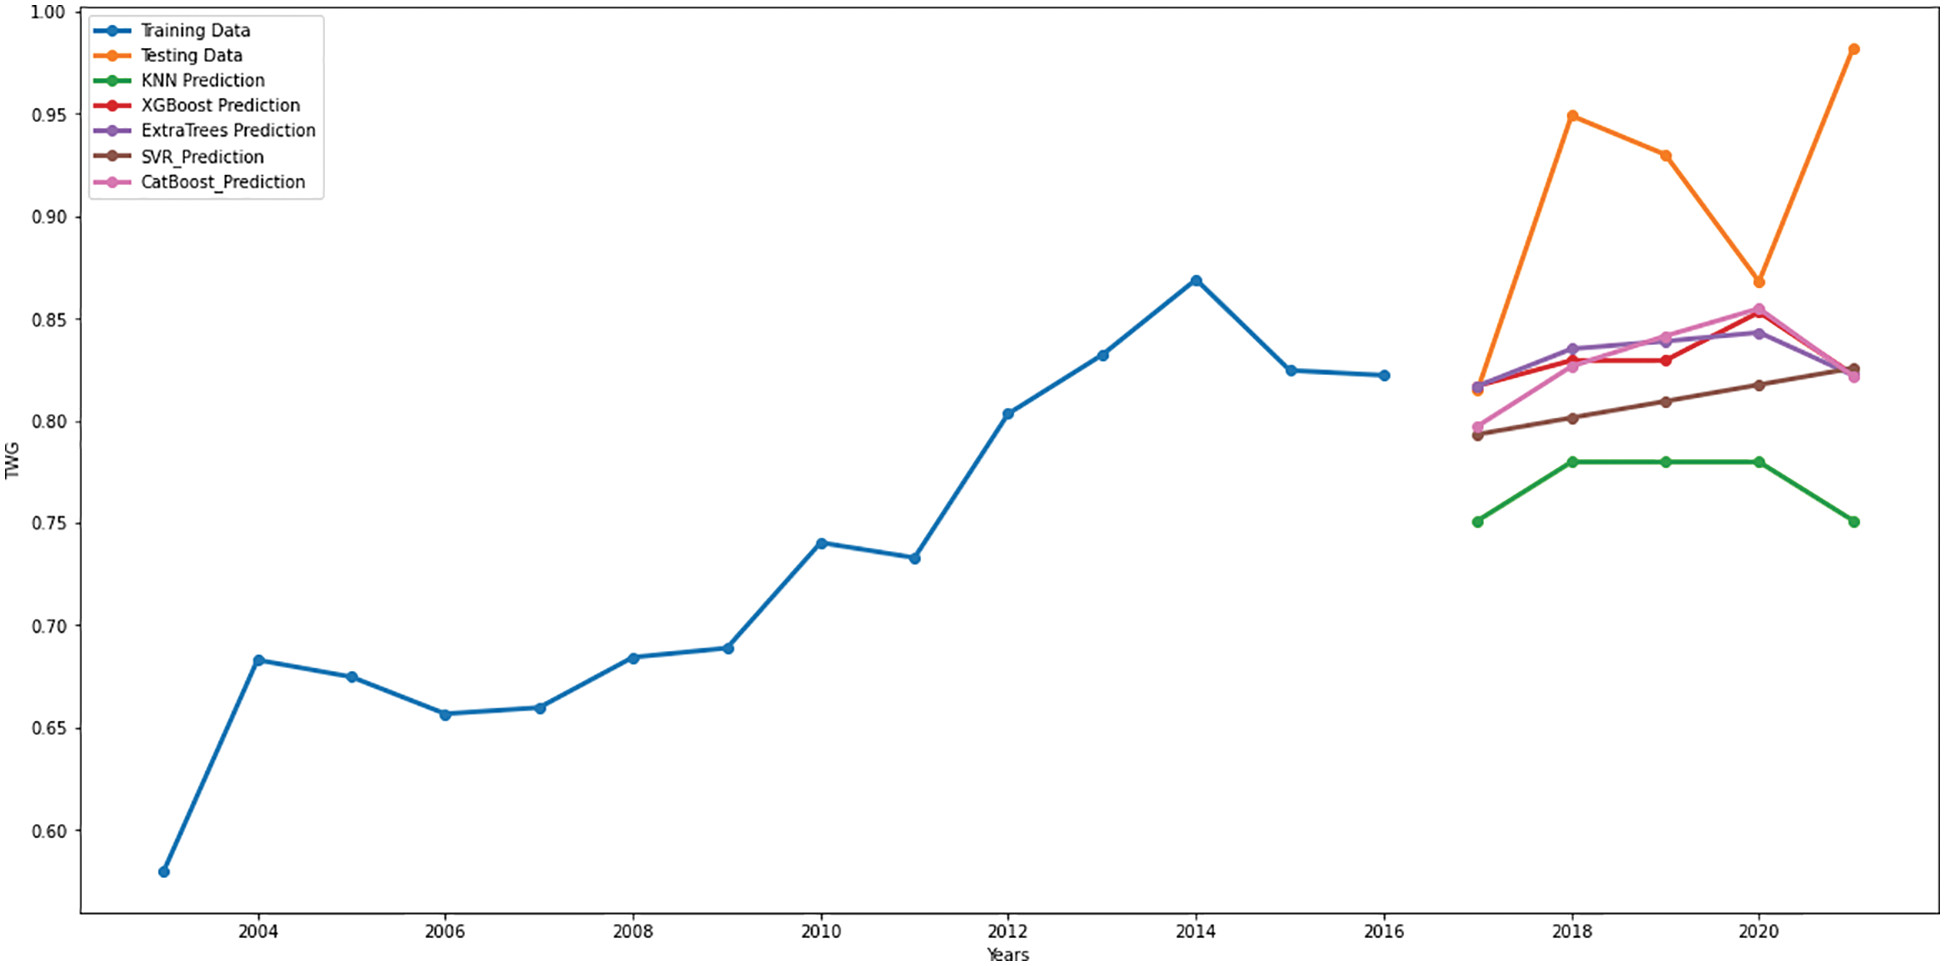
Figure 10: Plastic waste – trend of the models
The XGBoost model with the default parameters achieved a lower MAPE, but its RMSE is larger than those of CatBoost and ExtraTrees (ref. Table 5). Hence, the hyperparameterized XGBoost model with max_depth of 3 and n_estimator of 100 was implemented on the plastic waste dataset. The trend of the XGB and hyperparameterized XGB are portrayed in Fig. 11. Applying the XGBoost model with boosting parameters reduced error by 18%. The GSO-XGB model produced the lowest MAPE of 6.7967, MAE of 0.0651, and RMSE of 0.0871, as shown in Fig. 12.
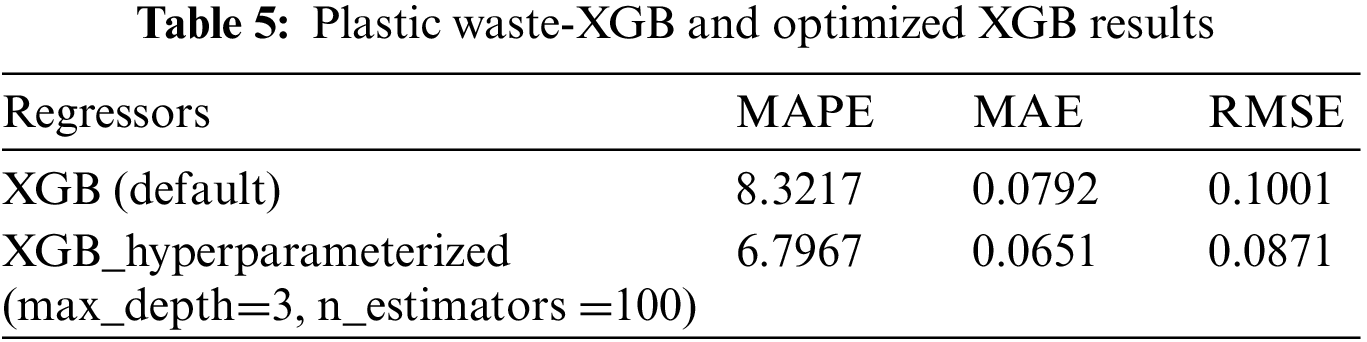
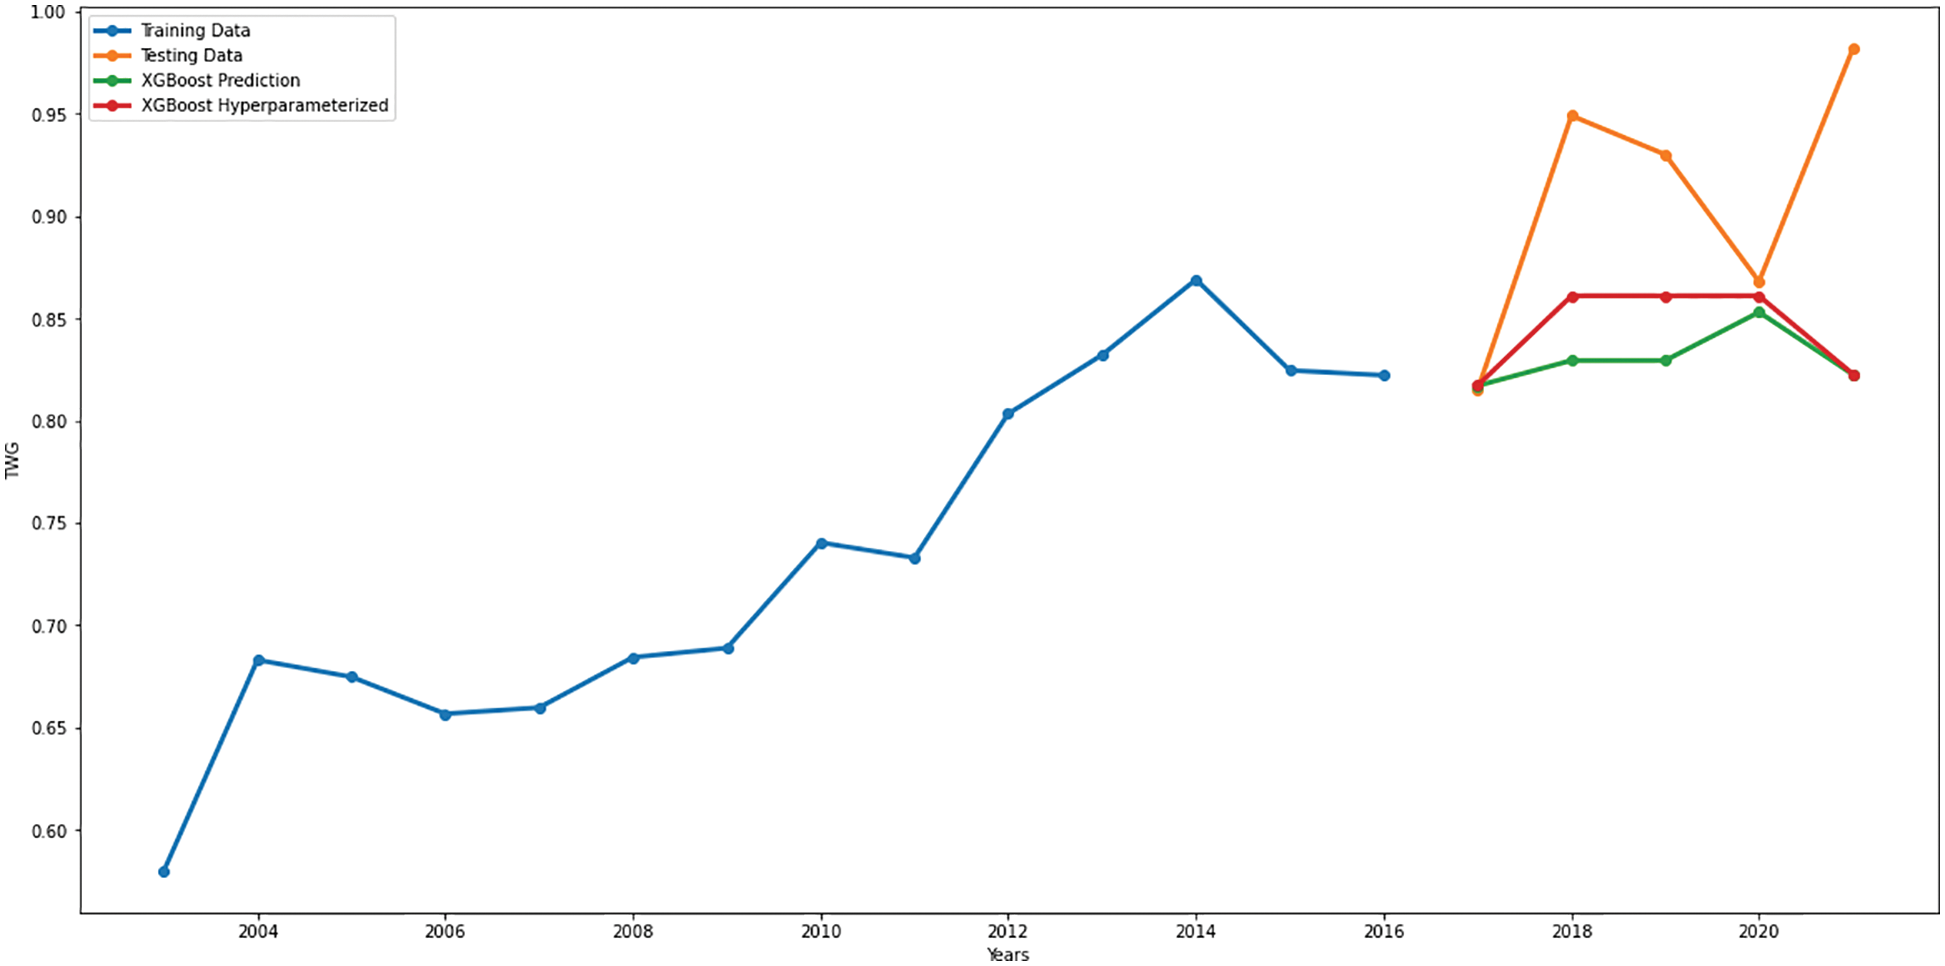
Figure 11: Plastic waste–trend of XGB and optimized XGB
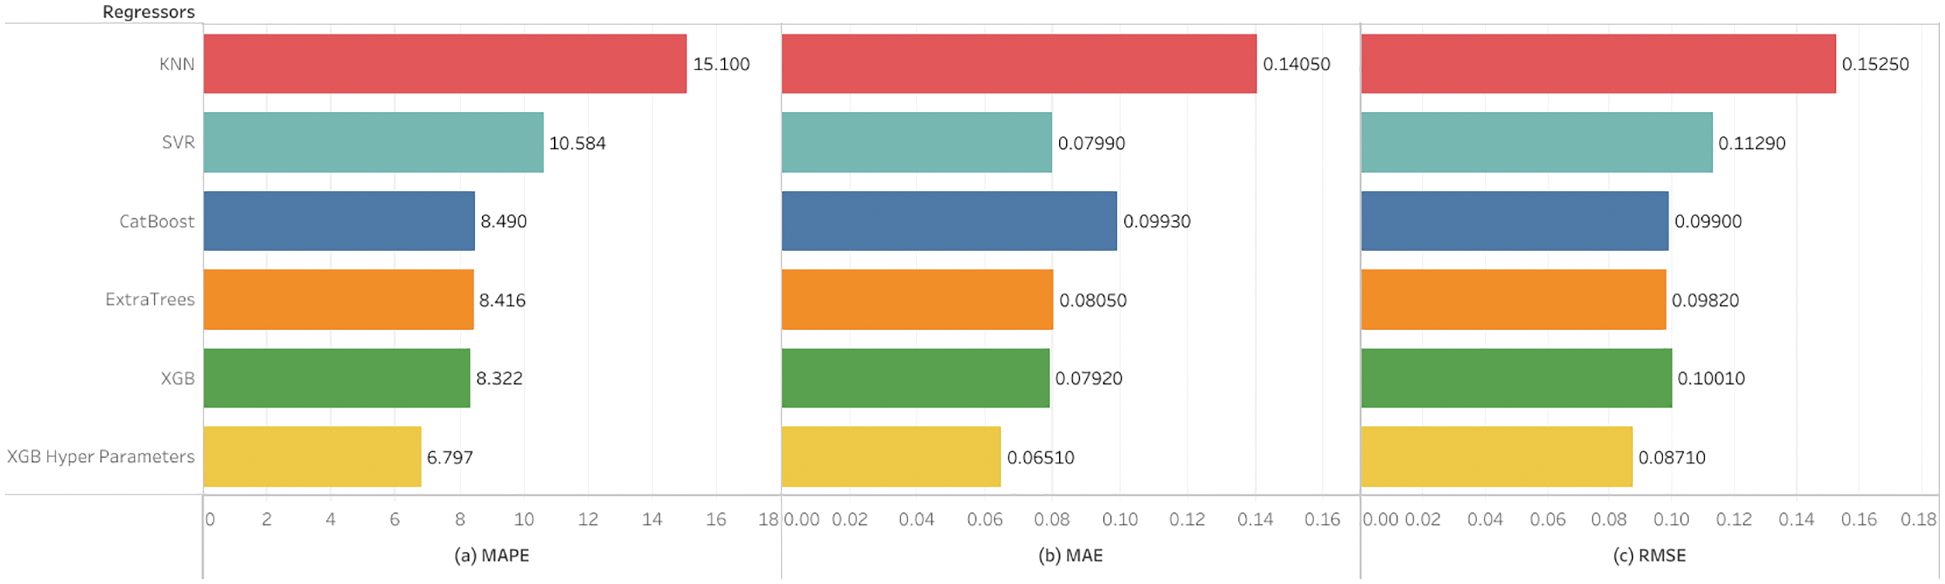
Figure 12: Plastic waste- (a) MAPE (b) MAE (c) RMSE
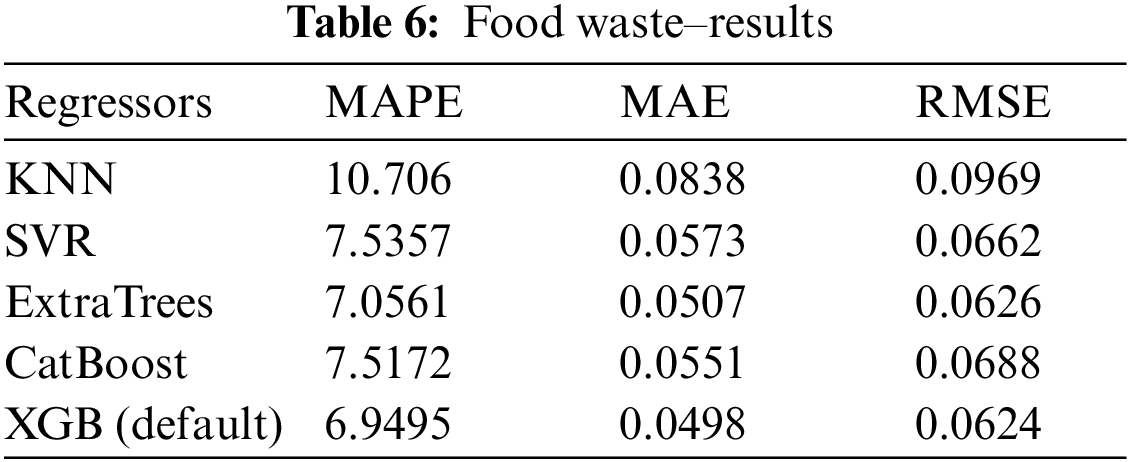
The food waste is in a beta distribution pattern as portrayed in Fig. 13. The pattern of all the utilized models was depicted in the same figure. The CatBoost and SVR model performed ambiguously with a negligible difference in the MAPE of 7.517 and 7.5357. However, the ExtraTrees model is better than the above two models with a lower MAPE of 7.056 and RMSE of 0.0688. Among the employed models, KNN is the meagre performer with a higher error rate of 10.706 (MAPE). It is obvious from Table 6 that the best performer is the XGBoost with MAPE of 6.9495, MAE of 0.0498, and RMSE of 0.0624.
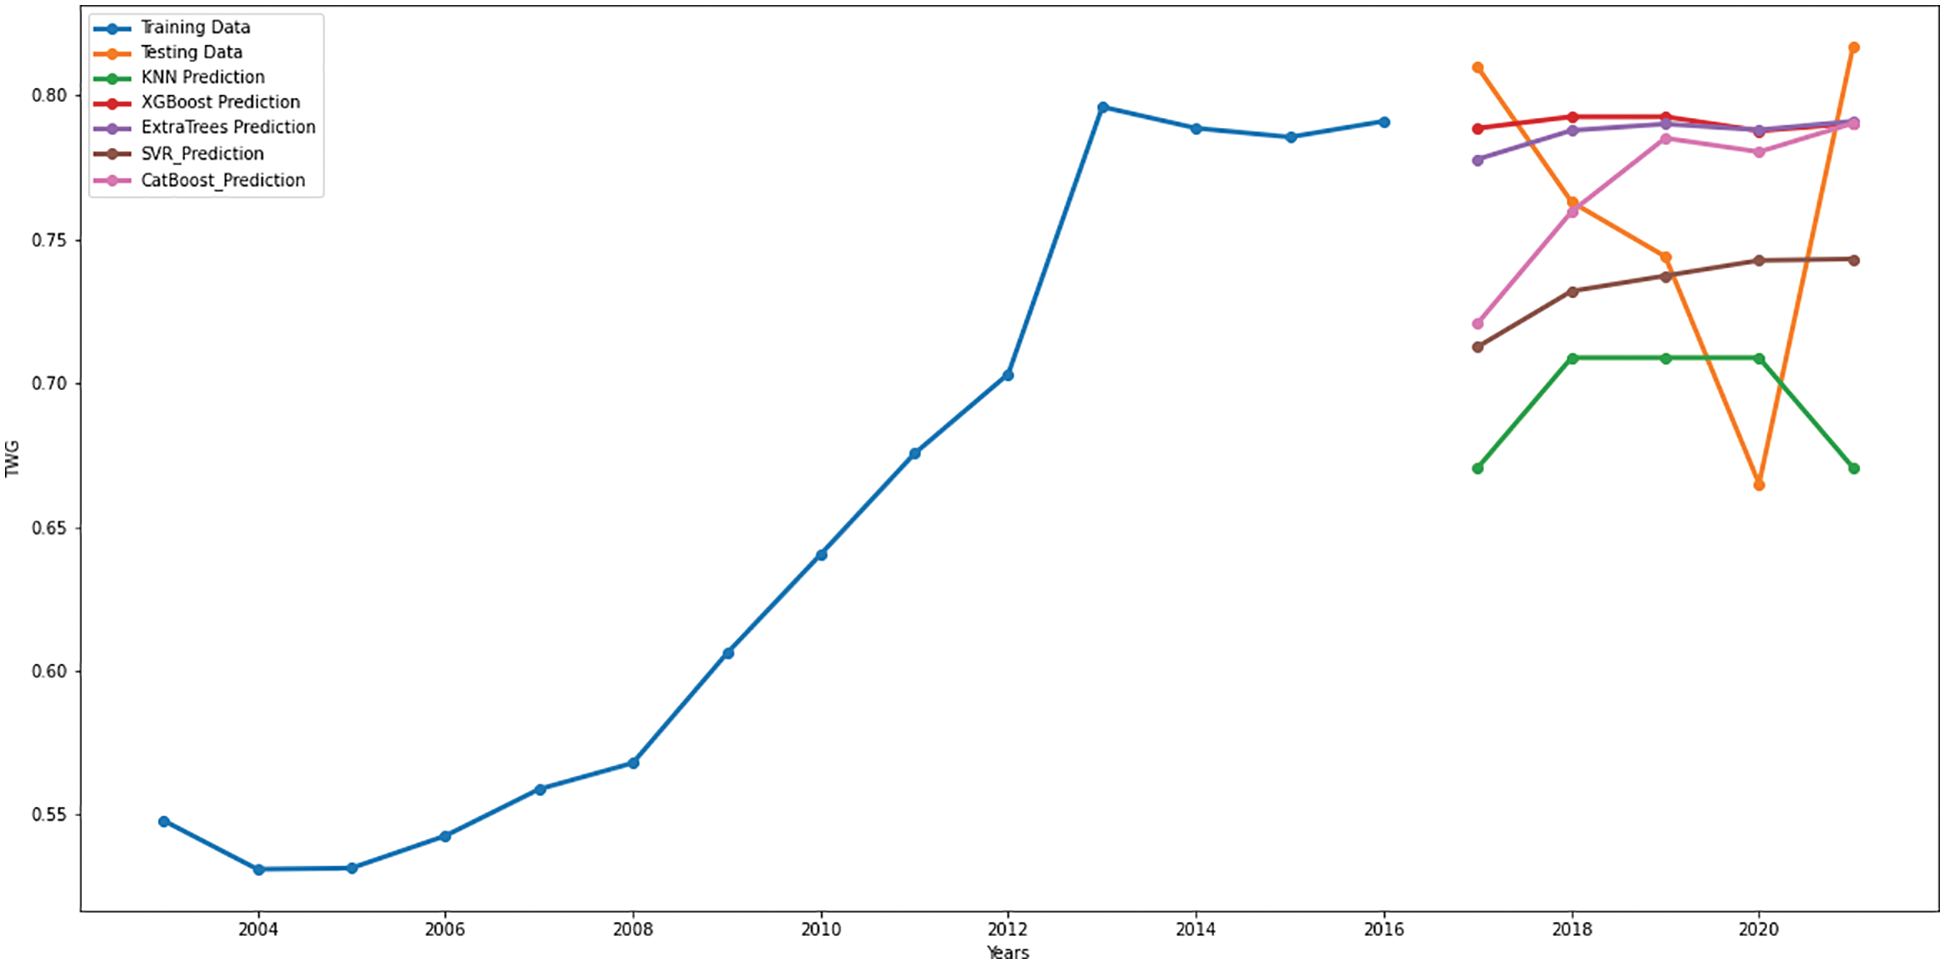
Figure 13: Food waste–trend of the models
To increase the efficiency of the XGBoost model, the parameters of the same are optimized. The boosted parameters of XGBoost such as max_depth of 3 and n_estimator of 100 are executed to the food waste dataset of Singapore. Fig. 14 and Table 7 depict that the tuned XGB model outstripped all other models yielding the least error rate. The GSO-XGB model produced the least MAPE, MAE, and RMSE of 5.9626, 0.05495, and 0.0437 respectively (Fig. 15).
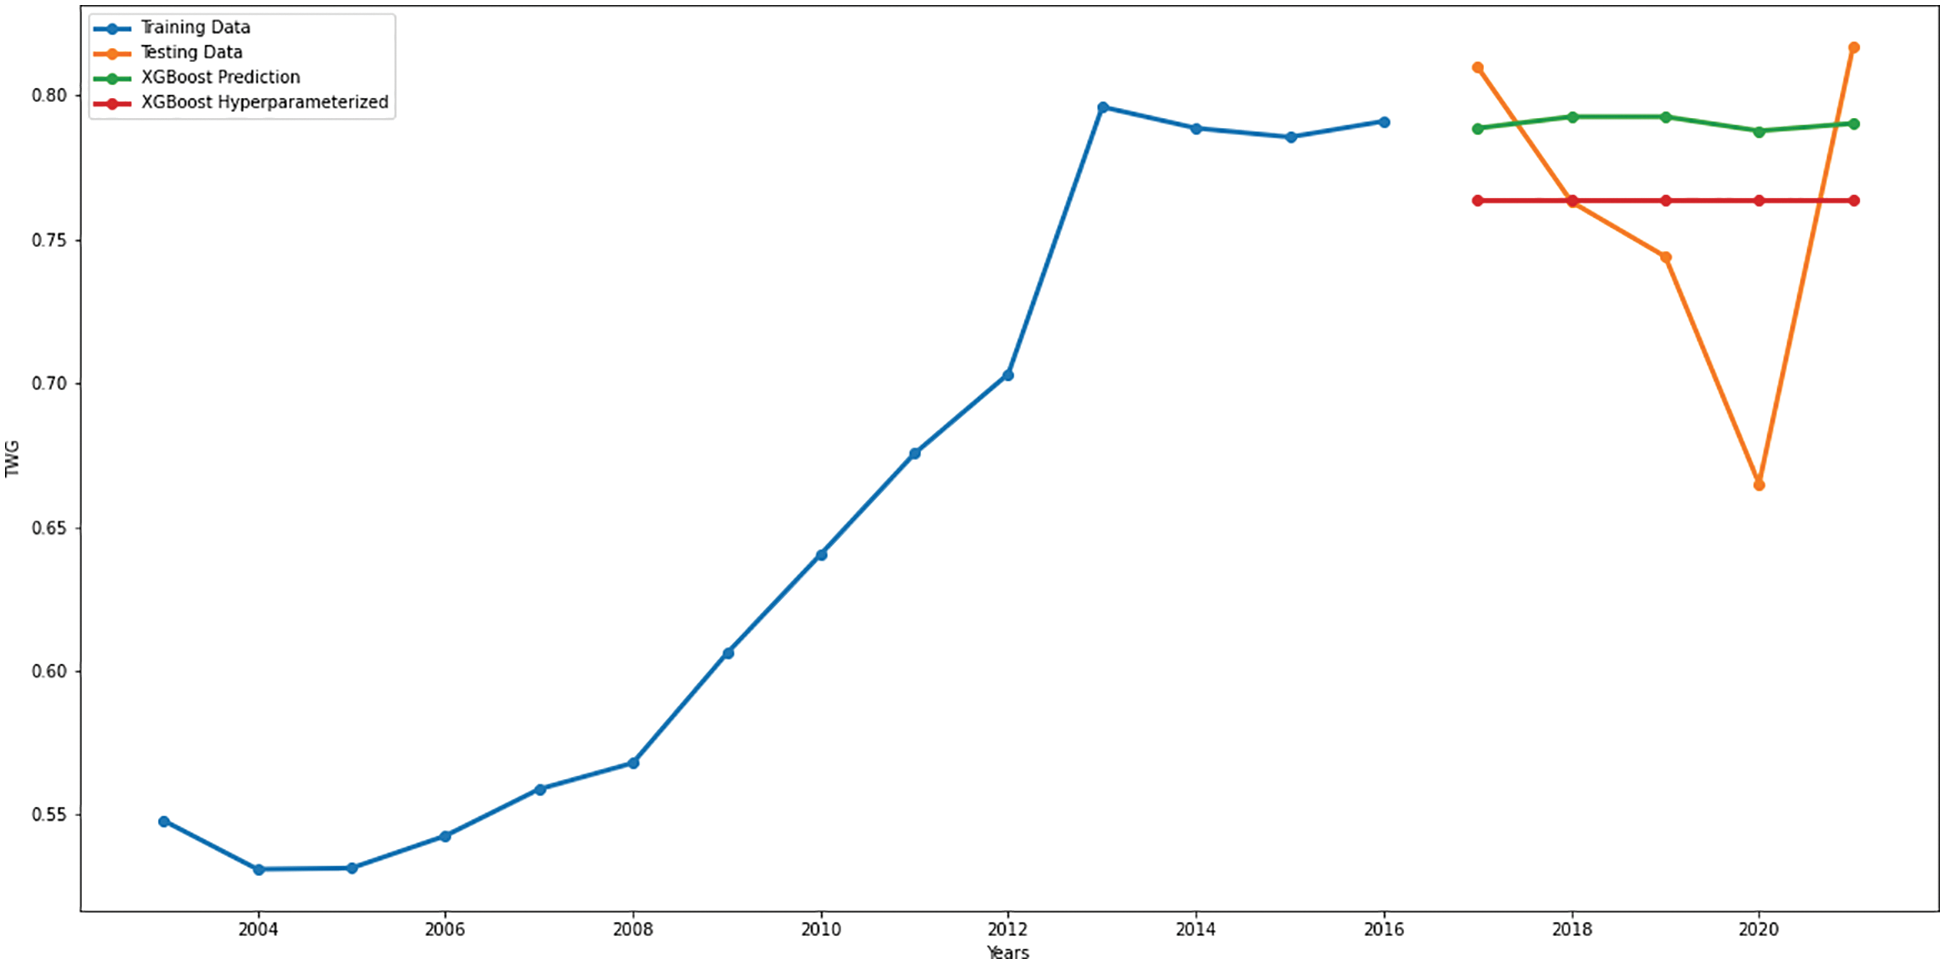
Figure 14: Food waste–trend of XGB and optimized XGB
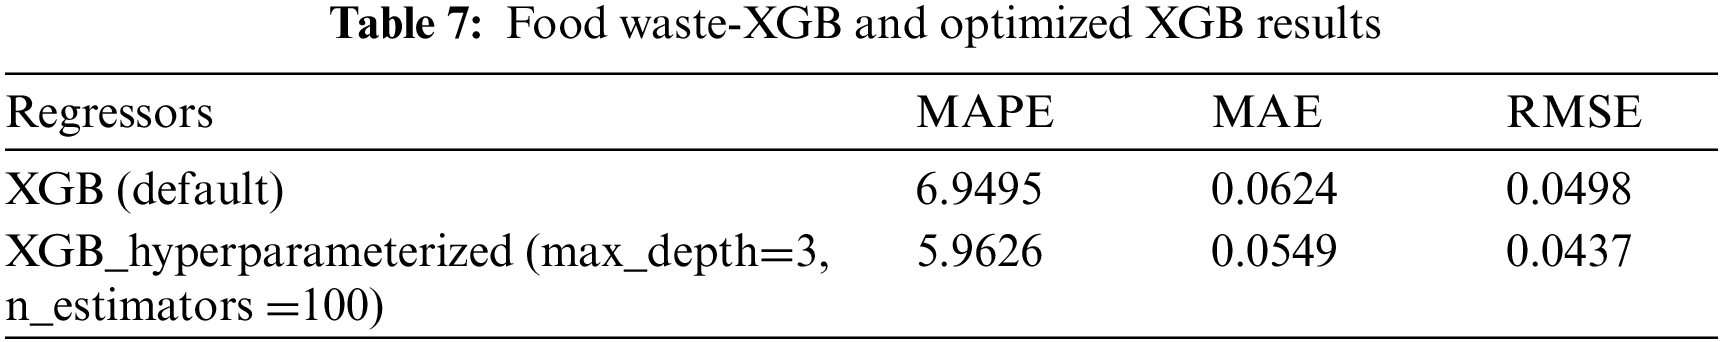
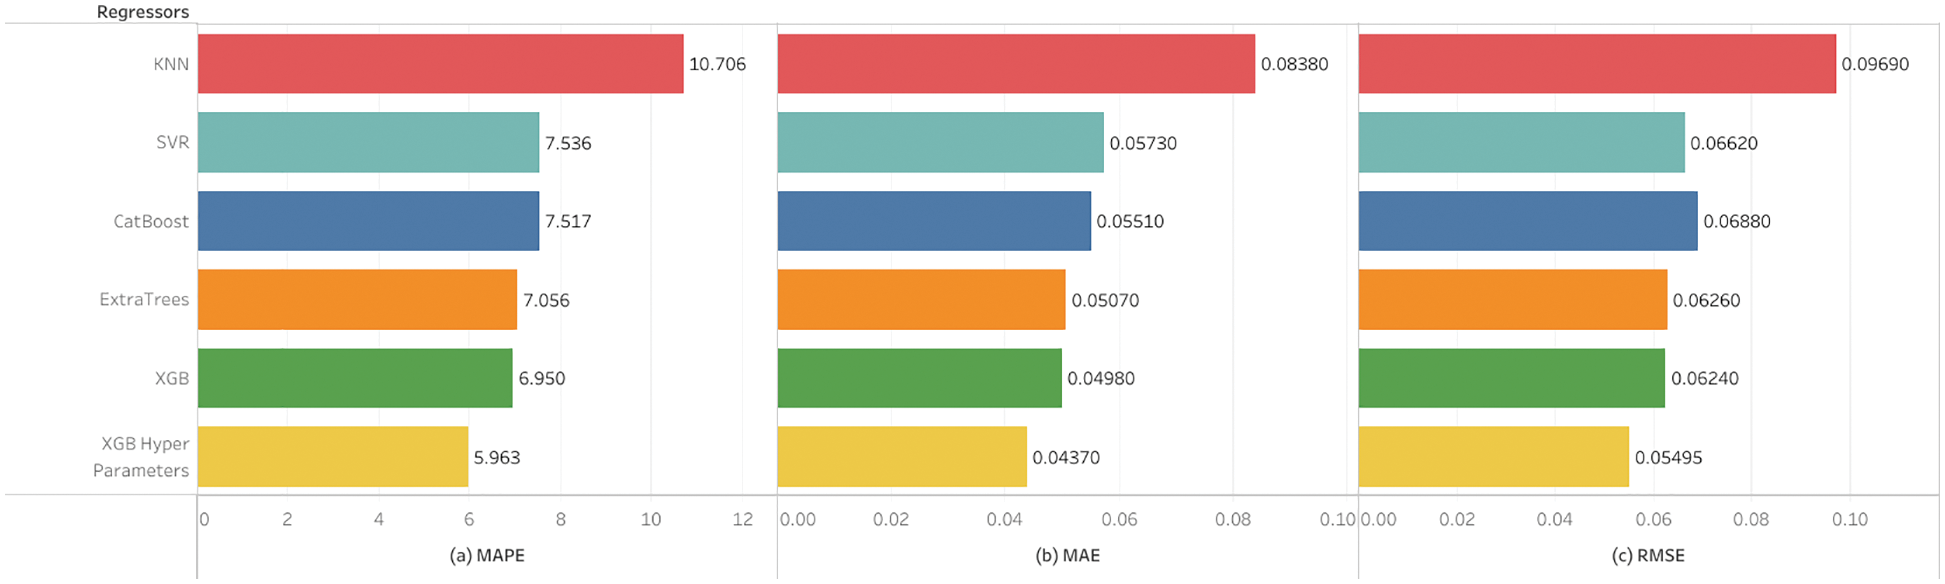
Figure 15: Plastic waste- (a) MAPE (b) MAE (c) RMSE
The improper management of waste leads to many problems such as pollution, loss of habitats, diseases, climate change, etc. To combat these issues, Singapore established the National Environment Agency (NEA), a government agency charged with maintaining a healthy and livable ecosystem in the country. Disposal is handled by NEA through means of source-separated garbage collection. It had also constructed an island named Semakau for the incineration of garbage that could not be repurposed or recycled. However, by 2035 the island would be at its full capacity. Consequently, there is no longer enough time to manage the trash sustainably.
This research used Machine Learning methods to forecast MSW generation from 2003 to 2021. There were thirteen different categories of trash, and we examined the three most common ones: paper and cardboard, plastic, and food. The XGBoost model outperformed all three waste categories. Though the model yielded a decent result, its parameters were boosted to improve its performance. Hence the model was optimized by using the grid search method. The proposed GSO-XGBoost model produced the best results, with MAPEs of 4.9349, 6.7967, and 5.9626 for paper, plastics, and food, respectively. We intend to improve our ability by utilizing the other waste datasets on the proposed model to compare the results. In the future, we plan to estimate waste generation rates by integrating the garbage dataset with its socioeconomic characteristics and employing deep learning methods.
Funding Statement: The authors received no specific funding for this study.
Conflicts of Interest:: The authors declare that they have no conflicts of interest to report regarding the present study.
References
1. Current World Population, “Worldometer,” 2022. [Online]. Available: https://www.worldometers.info/world-population/ [Google Scholar]
2. T. Strange and A. Bayley, “Sustainable Development: Linking Economy, Society, Environment,” OECD Insights, OECD Publishing, Paris, 2008. [Online]. Available: https://books.google.com/books/about/OECD_Insights_Sustainable_Development_Li.html?id=IgbWAgAAQBAJ [Google Scholar]
3. J. D. Sachs, “The Earth provides enough to meet everyone’s needs,” The National, 2021. [Online]. Available: https://www.thenationalnews.com/opinion/comment/the-earth-provides-enough-to-meet-everyone-s-needs-1.426562 [Google Scholar]
4. K. Silpa, Y. Lisa, P. Bhada-Tata and F. V. Woerden, “What a Waste 2.0: A Global Snapshot of Solid Waste Management to 2050,” In: Urban Development. Washington, DC: World Bank, 2018. [Online]. Available at: http://hdl.handle.net/10986/30317 [Google Scholar]
5. India Water Portal, “Solid Waste,” https://www.indiawaterportal.org/topics/solid-waste [Google Scholar]
6. LiveAbout, “Waste Treatment and Disposal Methods,” 2019. [Online]. Available: https://www.liveabout.com/waste-treatment-and-disposal-methods-2878113 [Google Scholar]
7. A. Heil and J. Goldammer, “Smoke-haze pollution: A review of the 1997 episode in Southeast Asia,” Regional Environmental Change, vol. 2, pp. 24–37, 2001. [Google Scholar]
8. The National Environment Agency, “National Environment Agency,” 2002. [Online]. Available: https://www.nea.gov.sg/ [Google Scholar]
9. The National Environment Agency, “3R guidebook for offices-national environment agency,” 2020. [Online]. Available: https://www.nea.gov.sg/docs/default-source/default-document-library/3r-guidebook-for-offices.pdf [Google Scholar]
10. Fiona Tan, “S’pore’s recycling rate in 2020 fell by 7% due to Covid-19 impact,” Singapore, Asia and Around the World, Mothership.SG–News, 2021. [Online]. Available: https://mothership.sg/2021/05/singapore-recycling-rate-2020/ [Google Scholar]
11. The National Environment Agency, “Waste Statistics and Overall Recycling,” 2022. [Online]. Available: https://www.nea.gov.sg/our-services/waste-management/waste-statistics-and-overall-recycling [Google Scholar]
12. R. Hicks, “How will Singapore defuse a 16-year waste timebomb?.” Eco-Business, 2019. [Online]. Available: https://www.eco-business.com/news/how-will-singapore-defuse-a-16-year-waste-timebomb/ [Google Scholar]
13. L. Youjin, “No time to waste in dealing with Singaporean’s mounting trash problem,” Livemore, DBS, 2019. [Online]. Available: https://www.dbs.com/livemore/community/trash-talk-no-time-waste-dealing-singapores-mounting-trash-problem.html [Google Scholar]
14. W. Xia, Y. Jiang, X. Chen and R. Zhao, “Application of machine learning algorithms in municipal solid waste management: A mini review,” Waste Management & Research, vol. 40, no. 6, pp. 609–624, 2022. [Google Scholar]
15. W. Lu, W. Huo, H. Gulina and C. Pan, “Development of machine learning multi-city model for municipal solid waste generation prediction,” Frontiers of Environmental Science & Engineering, vol. 16, no. 9, pp. 1–10, 2022. [Google Scholar]
16. R. Guo, H. M. Liu, H. H. Sun, D. Wang, H. Yu et al., “Forecasting of municipal solid waste generation in China based on an optimized grey multiple regression model,” Journal of Material Cycles and Waste Management, vol. 24, no. 6, pp. 2314–2327, 2022. [Google Scholar]
17. C. Zhang, H. Dong, Y. Geng, H. Liang and X. Liu, “Machine learning based prediction for China’s municipal solid waste under the shared socioeconomic pathways,” Journal of Environmental Management, vol. 312, no. 1, pp. 114918, 2022. [Google Scholar] [PubMed]
18. M. S. Jassim, G. Coskuner and M. Zontul, “Comparative performance analysis of support vector regression and artificial neural network for prediction of municipal solid waste generation,” Waste Management & Research, vol. 40, no. 2, pp. 195–204, 2022. [Google Scholar]
19. Z. X. Hoy, K. S. Woon, W. C. Chin, H. Hashim and Y. Van Fan, “Forecasting heterogeneous municipal solid waste generation via Bayesian-optimised neural network with ensemble learning for improved generalization,” Computers & Chemical Engineering, vol. 166, pp. 107946, 2022. [Google Scholar]
20. O. Adeleke, S. Akinlabi, T. C. Jen and I. Dunmade, “A machine learning approach for investigating the impact of seasonal variation on physical composition of municipal solid waste,” Journal of Reliable Intelligent Environments, vol. 36, no. 1, pp. 1–20, 2022. [Google Scholar]
21. N. Elshaboury, E. Mohammed Abdelkader, A. Al-Sakkaf and G. Alfalah, “Predictive analysis of municipal solid waste generation using an optimized neural network model,” Processes, vol. 9, no. 11, pp. 2045, 2021. [Google Scholar]
22. F. Wu, D. Niu, S. Dai and B. Wu, “New insights into regional differences of the predictions of municipal solid waste generation rates using artificial neural networks,” Waste Management, vol. 107, no. 9, pp. 182–190, 2020. [Google Scholar] [PubMed]
23. T. Rathod, M. Hudnurkar and S. Ambekar, “Use of machine learning in predicting the generation of solid waste,” PalArch's Journal of Archaeology of Egypt/Egyptology, vol. 17, no. 6, pp. 4323–4335, 2020. [Google Scholar]
24. N. Sharma, R. Litoriya and A. Sharma, “Application and analysis of k-means algorithms on a decision support framework for municipal solid waste management,” in Proc. Int. Conf. on Advanced Machine Learning Technologies and Applications, Singapore, pp. 267–276, 2020. [Google Scholar]
25. G. W. Cha, H. J. Moon, Y. M. Kim, W. H. Hong, J. H. Hwang et al., “Development of a prediction model for demolition waste generation using a random forest algorithm based on small datasets,” International Journal of Environmental Research and Public Health, vol. 17, no. 19, pp. 6997, 2020. [Google Scholar] [PubMed]
26. D. Rutqvist, D. Kleyko and F. Blomstedt, “An automated machine learning approach for smart waste management systems,” IEEE Transactions on Industrial Informatics, vol. 16, no. 1, pp. 384–392, 2019. [Google Scholar]
27. A. Camero, J. Toutouh, J. Ferrer and E. Alba, “Waste generation prediction in smart cities through deep neuroevolution,” in Proc. Ibero-American Congress of Smart Cities, Soria, Spain, pp. 192–204, 2018. [Google Scholar]
28. N. E. Johnson, O. Ianiuk, D. Cazap, L. Liu, D. Starobin et al., “Patterns of waste generation: A gradient boosting model for short-term waste prediction in New York City,” Waste Management, vol. 62, no. 1, pp. 3–11, 2017. [Google Scholar] [PubMed]
29. M. K. Younes, Z. M. Nopiah, N. E. Basri, H. Basri, M. F. Abushammala et al., “Prediction of municipal solid waste generation using the nonlinear autoregressive network,” Environmental Monitoring and Assessment, vol. 187, no. 12, pp. 1–10, 2015. [Google Scholar]
30. Hxchua, “Waste in Singapore-dataset by hxchua, data.world,” 2022. [Online]. Available: https://data.world/hxchua/waste-in-singapore [Google Scholar]
31. J. Philipp, “Poverty in Singapore: A New National Priority,” The Borgen Project, 2022. [Online]. Available: https://borgenproject.org/tag/poverty-in-singapore/ [Google Scholar]
32. K. Budholiya, S. K. Shrivastava and V. Sharma, “An optimized XGBoost based diagnostic system for effective prediction of heart disease,” Journal of King Saud University-Computer and Information Sciences, vol. 34, no. 7, pp. 4514–4523, 2020. [Google Scholar]
33. Y. Jiang, G. Tong, H. Yin and N. Xiong, “A pedestrian detection method based on genetic algorithm for optimize XGBoost training parameters,” IEEE Access, vol. 7, pp. 118310–118321, 2019. https://doi.org/10.1109/ACCESS.2019.2936454 [Google Scholar] [CrossRef]
34. Y. Wang, S. Sun, X. Chen, X. Zeng, Y. Kong et al., “Short-term load forecasting of industrial customers based on SVMD and XGBoost,” International Journal of Electrical Power & Energy Systems, vol. 129, pp. 106830, 2021. https://doi.org/10.1016/j.ijepes.2021.106830 [Google Scholar] [CrossRef]
35. S. Bag, “The complete XGBoost therapy with python,” Python in plain English, Medium, 2022. [Online]. Available: https://python.plainenglish.io/the-complete-xgboost-therapy-with-python-87c8cffcb71f [Google Scholar]
36. M. Galarnyk, “How to speed up XGBoost model training,” Anyscale, 2021. [Online]. Available: https://www.anyscale.com/blog/how-to-speed-up-xgboost-model-training [Google Scholar]
37. A. Ogunleye and Q. G. Wang, “XGBoost model for chronic kidney disease diagnosis,” IEEE/ACM Transactions on Computational Biology and Bioinformatics, vol. 17, no. 6, pp. 2131–2140, 2019. [Google Scholar]
38. S. S. Dhaliwal, A. A. Nahid and R. Abbas, “Effective intrusion detection system using XGBoost,” Information-An International Interdisciplinary Journal, vol. 9, no. 7, pp. 149, 2018. [Google Scholar]
39. A. A. Biswas and S. Basak, “Forecasting the trends and patterns of crime in Bangladesh using machine learning model,” in Proc. 2nd Int. Conf. on Intelligent Communication and Computational Techniques (ICCT), Jaipur, Rajasthan, India, pp. 114–118, 2019. [Google Scholar]
Cite This Article
 Copyright © 2023 The Author(s). Published by Tech Science Press.
This work is licensed under a Creative Commons Attribution 4.0 International License , which permits unrestricted use, distribution, and reproduction in any medium, provided the original work is properly cited.
 Downloads
 Citation Tools