
 Submit a Paper
 Propose a Special lssue
 Open Access
ARTICLE

A Novel Fuzzy Inference System-Based Endmember Extraction in Hyperspectral Images
School of Electronics Engineering, Vellore Institute of Technology, Vellore, 632051, India
* Corresponding Author: S. Kalaivani. Email:
Intelligent Automation & Soft Computing 2023, 37(2), 2459-2476. https://doi.org/10.32604/iasc.2023.038183
Received 30 November 2022; Accepted 12 April 2023; Issue published 21 June 2023
 View Full Text
 Download PDF
Abstract
Spectral unmixing helps to identify different components present in the spectral mixtures which occur in the uppermost layer of the area owing to the low spatial resolution of hyperspectral images. Most spectral unmixing methods are globally based and do not consider the spectral variability among its endmembers that occur due to illumination, atmospheric, and environmental conditions. Here, endmember bundle extraction plays a major role in overcoming the above-mentioned limitations leading to more accurate abundance fractions. Accordingly, a two-stage approach is proposed to extract endmembers through endmember bundles in hyperspectral images. The divide and conquer method is applied as the first step in subset images with only the non-redundant bands to extract endmembers using the Vertex Component Analysis (VCA) and N-FINDR algorithms. A fuzzy rule-based inference system utilizing spectral matching parameters is proposed in the second step to categorize endmembers. The endmember with the minimum error is chosen as the final endmember in each specific category. The proposed method is simple and automatically considers endmember variability in hyperspectral images. The efficiency of the proposed method is evaluated using two real hyperspectral datasets. The average spectral angle and abundance angle are used to analyze the performance measures.Keywords
The spectral processing of images plays an extensive role in the field of image processing. The main advantage of using spectral information is that it immensely facilitates auto-processing, as compared to spatial processing. With the help of airborne or spaceborne sensor systems, spectrometers capture an area as several planes and synthesize data cubes commonly known as hyperspectral images. The limited spatial and spectral resolution inherent to sensors leads to the concept of spectral unmixing. The goal of spectral unmixing is to find different materials present in the image known as endmembers, noting that their occupied area is known as abundance fractions. Almost every field, including agriculture [1], mining and geology [2], environmental monitoring [3], chemical detection [4], and astronomy, uses hyperspectral image analysis [5].
Several endmember extraction methods discussed in the literature [6] differ in their assumptions concerning mixing between pixels. A few of these methods assume the existence of only pure pixels and are known as Linear Mixing Models (LMM) [7]. Some methods assume pixels are highly mixed; these are commonly known as Non-Linear Mixing Models (NLMM) [8]. LMM methods include the Pixel Purity Index (PPI) [9], Vertex Component Analysis (VCA) [10], successive projection algorithms [11], N-FINDR [12], and Orthogonal Subspace Projections (OSP) [12]. These methods assume that pixels exist only in the vertex of the region and extract those pixels as endmembers [13]. When endmembers are highly mixed, a statistical approach termed Minimum Volume Constraint-Nonnegative Matrix Fraction (MVC-NMF) is one of the best iterative algorithms to extract endmembers [14,15]. Still, the need for detailed prior knowledge about the materials mixed and the non-linear function of the mixed environment makes non-linear unmixing a complicated algorithm; therefore, most of the methods that have been proposed are linear spectral unmixing as opposed to non-linear spectral unmixing [16]. All the methods discussed above assume the endmembers are pure pixels with unique spectral signatures and fail to consider the variability among the endmembers. Theoretically, an ideal spectral signature for any given material does not exist, and its portion of variability depends on location, surrounding material, sensor noise material composition, and variations in atmospheric factors [17]. Also, few endmembers have the same spectral reflectance and can be differentiated only in a particular wavelength band. One way to overcome this problem, as addressed in the literature, is to treat endmembers as sets or bundles and endmembers as statistical distributions [17]. The methods which ignore such spectral variability have led to poor abundance estimates, as indicated in earlier studies [18].
In the literature, methods such as Multiple Endmember Spectral Mixture Analysis (MESMA) [19], Automated Monte Carlo Unmixing [20], and Automatic Endmember Extraction (AEE) [21] addressed the endmember variability problem in hyperspectral images. The MESMA and Automated Monte Carlo Unmixing methods require a large spectral library that contains all possible spectra variations for endmembers. AEE overcomes this limitation, but the final decision is made with the help of the Fully Least Square Constrained (FCLS) or MESMA methods. Many endmember bundle extraction methods [22,23] have been discussed so far, but the experiments fail to work when the sub-region contains no pure pixels. Furthermore, clustering algorithms are used to obtain endmember bundles [24], such as K-means, which works better for interclass variability than intraclass variability. Consequently, clustering performance on grouping endmembers will not be fair and also fails to consider the spectral variability among endmembers [25].
In summary, most of the existing endmember extraction methods adopt the occurrence of a pure pixel and extract endmember from single standard spectrum for a certain pixel as well as do not consider the endmember variability in hyperspectral images. To overcome this concern, a new approach is proposed to extract endmembers from endmember bundles using Fuzzy Inference System (FIS). This process generates multiple spectra for a single endmember and also duly considers the endmember variability in hyperspectral images. The main contributions of our work are as follows.
(1) Hyperspectral images are abundant in spectral information and are divided into image subsets where only redundant bands are removed with dimension reduction.
(2) Endmembers are extracted from each set of images in a particular wavelength range, to improve the accuracy of estimation of endmembers, since a few of the endmembers differ only in a particular wavelength band. For example, endmembers of dirt and road have a similar spectral reflectance curve but differ only in the wavelength range of 100–150 nm [26]. This type of error can be observed only in the end result. Extraction of spectral reflectance curves from multiple sub-bands helps to minimize this type of errors in the divide and conquer method.
(3) The Fuzzy Inference System (FIS) processes the extracted endmembers to obtain endmember bundles using spectral matching parameters.
(4) Spectral matching is adopted to identify spectral similarity measures between endmembers which automatically account for the illumination change effects [27].
(5) Hyperspectral images are of high dimensionality, so implementing the algorithm in parallel minimizes the memory requirement [28].
The proposed method extracts endmember bundles by combining unmixing algorithms and a rule-based fuzzy inference system by employing spectral matching parameters. The proposed method consists of five stages: (1) Image subset generation; (2) Dimension reduction; (3) Endmember extraction; (4) Fuzzy Inference System (FIS); (5) Final endmember selection.
The proposed method is illustrated in Fig. 1.
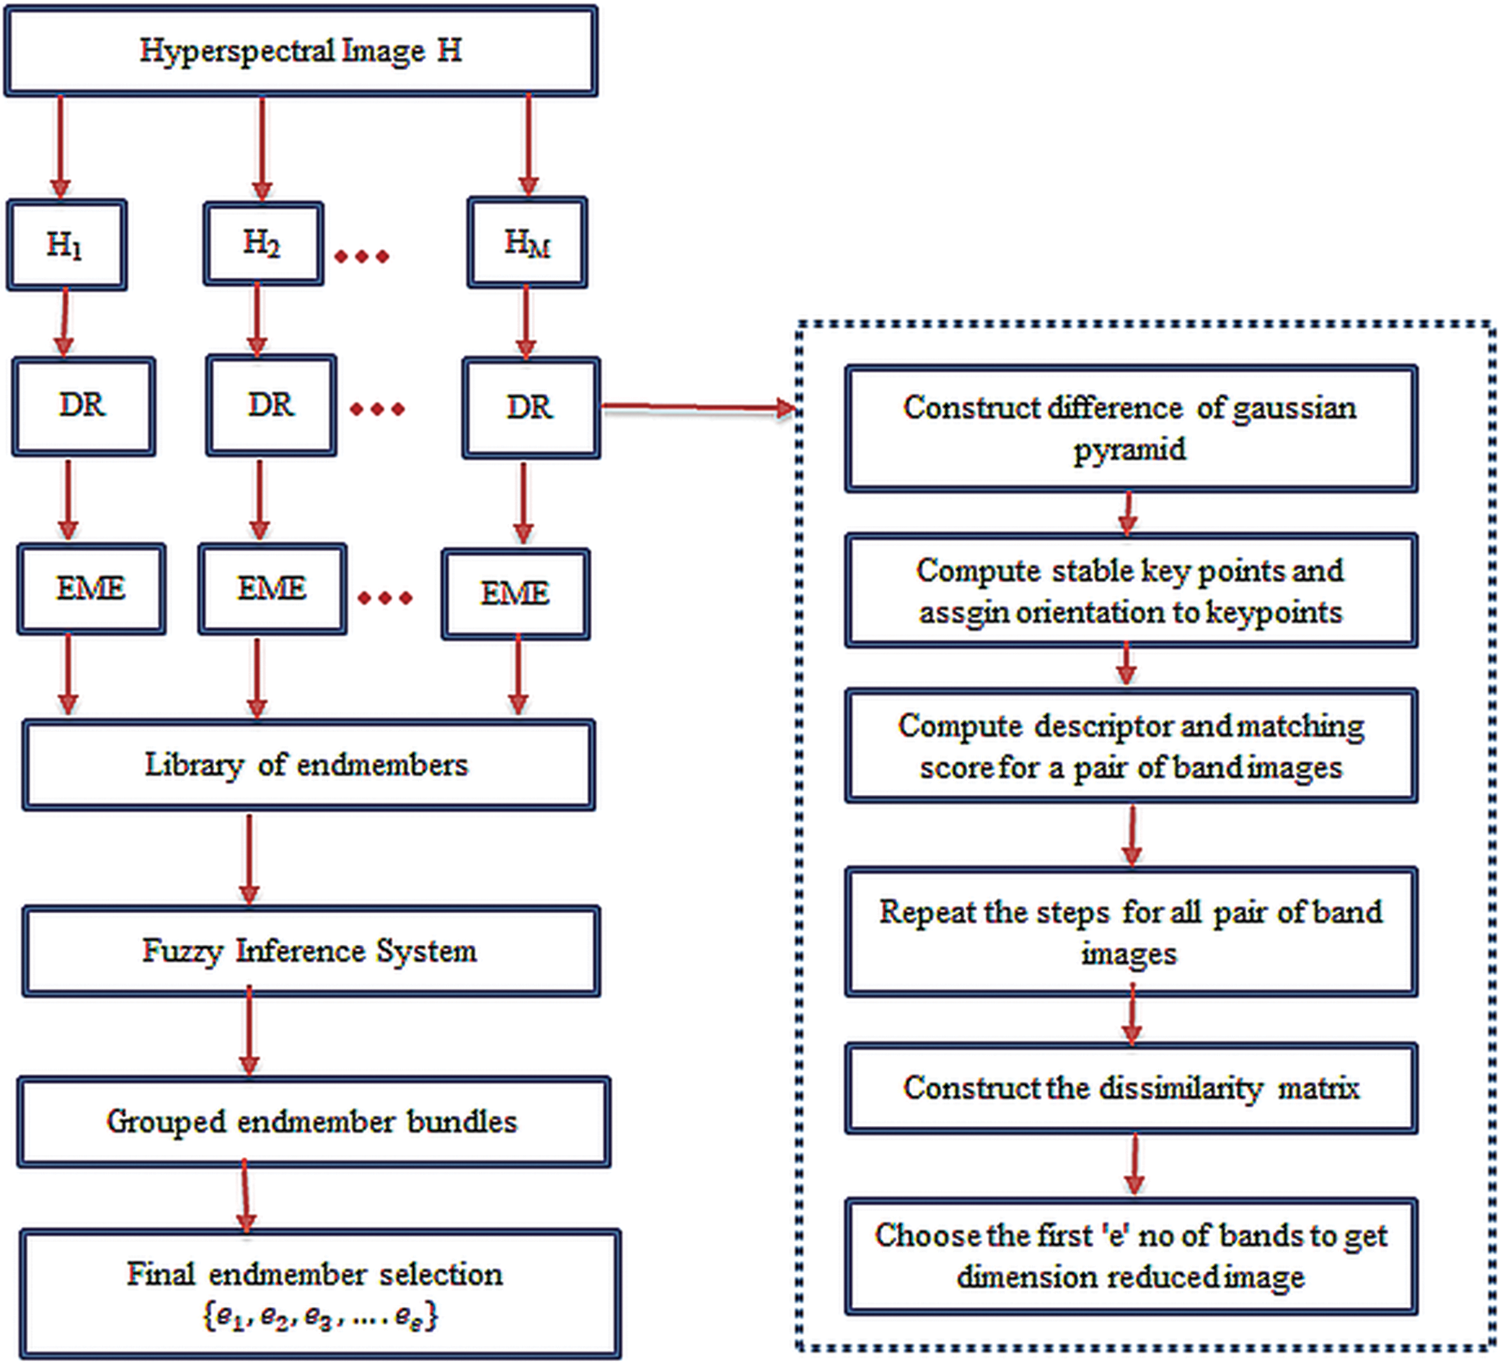
Figure 1: Block diagram of the proposed methodology
The original hyperspectral image
The huge dimensions and memory needed to process a hyperspectral image in any field increase the complexity of the post-processing steps [29]. This problem is resolved in two ways in the proposed methodology. In the first step, the original hyperspectral image is divided into an image subset of 20 bands. Second, dimension reduction is performed on image subsets to process only the informative bands [30]. Therefore, bands with maximum non-redundant information are chosen using a Scale Invariant Feature Transform (SIFT) [31]. The SIFT extracts highly distinct invariant keypoints for all bands in hyperspectral images. A distinct invariant keypoints is obtained for each pixel in an image as a feature vector which comprises of its location in original and scaled image using gaussian function, in terms of gradient magnitude and orientation. This feature vector helps to find the candidate matching using euclidean distance. Let
The matrix
Endmember estimation is a challenging task since the spectral reflectance curves are strongly correlated to each other, resulting in a highly mixed matrix of endmembers
Basically, VCA is based on decreasing or increasing the volume of pixels to find the endmember. N-FINDR is applied on non-redundant bands to extract endmembers. N-FINDR is evaluated on each pixel to estimate endmembers. A pixel that contributes the maximum volume is chosen as an endmember. The procedure is repeated for all pixels until there is no replacement that qualifies as an endmember. The algorithm is applied to all image subsets, and endmembers are extracted. The endmembers extracted from all image subsets are combined as a single spectral library of endmembers, which consists of spectra of different endmember materials in hyperspectral images.
The extracted endmembers need to be matched with ground truth to identify it in a particular category of an endmember. This can be done automatically with the help of spectral matching algorithms. Furthermore, the spectral similarity measures used for identifying an endmember, automatically consider the illumination change effects.
In essence, fuzzy logic is an extension of multi-valued logic [36] and provides results better than crisp classification methods in grouping endmembers. In this paper, two spectral matching parameters are chosen, namely Spectral Information Divergence (SID) and combined Spectral Similarity Value (SSV) to group endmembers with the help of the Fuzzy Inference System (FIS).
Let
The spectral matching parameter SID is derived from divergence information theory [37]. Its performance in discrimination is better than spectral angle and gives spectral discrimination values based on the probability value between the target and reference spectral signatures. The parameter is more effective in expressing the spectral variability between two spectral signatures [38]. SID can be denoted mathematically as:
where
And
Obtained from the probability vectors
The next parameter chosen is the combined Spectral Similarity Value (SSV). The SSV parameter gives a combined measure value of spectral correlation and euclidean distance [39]. Thus, SSV utilizes shape and distance to measure the similarity between ground truth and the extracted spectra. SSV can be denoted as:
where EDS is the Euclidean distance similarity and is defined as:
The parameter
where
These two parameters defined in Eqs. (2) and (3) are calculated and taken as input to the fuzzy inference system. The Sugeno Fuzzy Inference system is used to group the endmembers with the help of spectral matching parameters. There are two inputs; the output is the number of endmembers
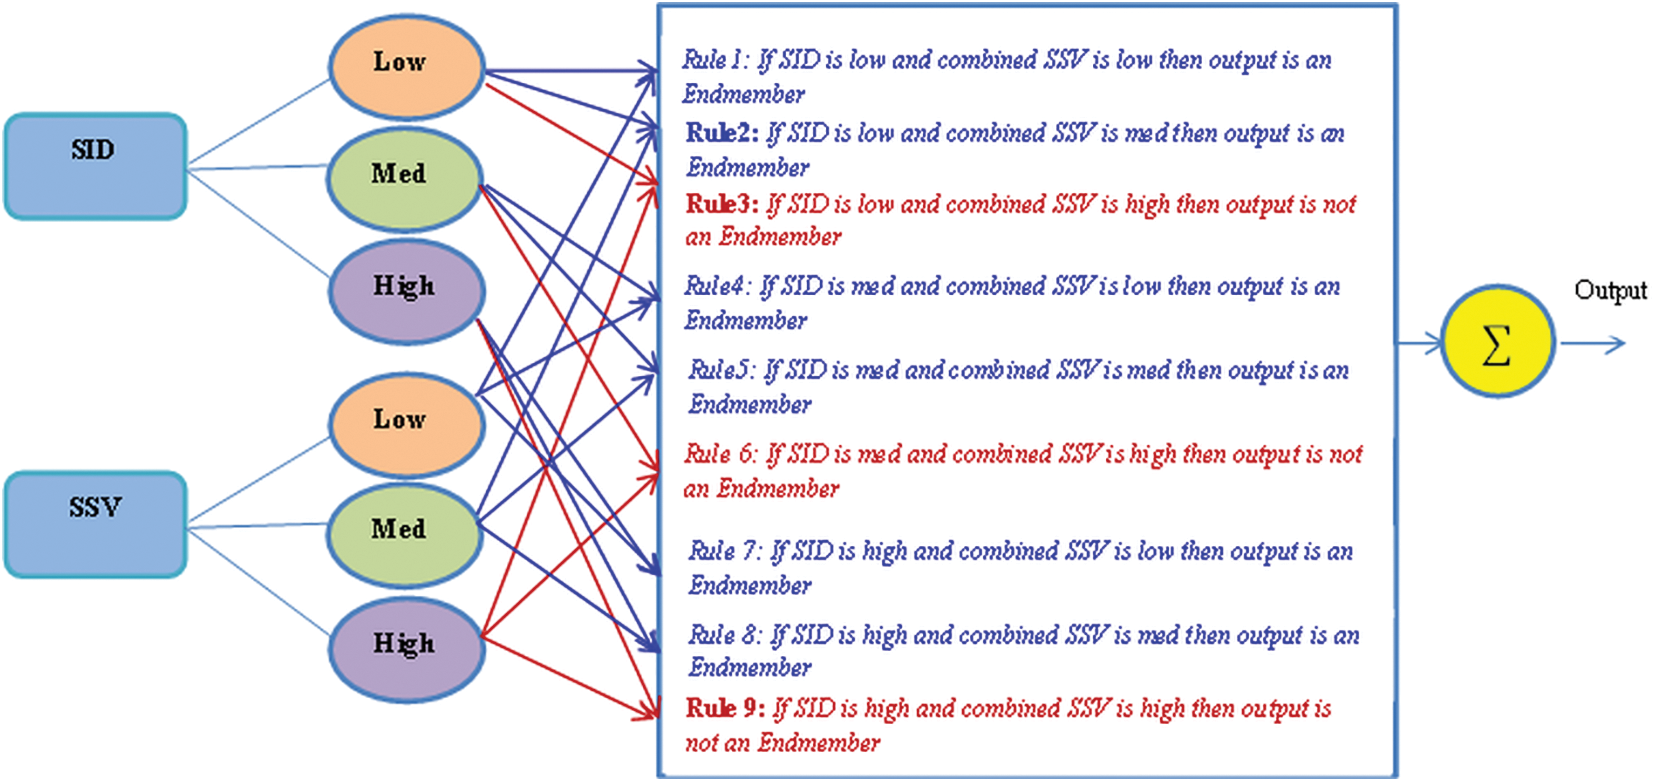
Figure 2: The proposed fuzzy inference system to extract endmember bundles
The extracted endmembers are grouped with the help of the fuzzy inference system to obtain endmember bundles. The endmember with the minimum SID and SSV is chosen as the final endmember.
The steps to implement the proposed methodology are explained in detail below.
Step 1: The hyperspectral image (
Step 2: The Scale Invariant Feature Transform (SIFT) is used to select the non-redundant bands from all image subsets.
Step 3: Endmembers are extracted from the dimension-reduced image subsets with the help of VCA and N-FINDR algorithms.
Step 4: The endmembers extracted in step 3 are collected as a single library of endmembers.
Step 5: All the endmembers are compared with ground truth endmembers and grouped in a particular category using spectral matching parameters as inputs to the fuzzy inference system. The output of the fuzzy inference system is the set of endmembers grouped in a particular category.
Step 6: An endmember from each category with a minimum or moderate value of two spectral matching parameters is chosen as the final endmember of that category.
Step 7: Further, abundance maps are generated from the extracted endmembers using a Fully Constrained Least Squares algorithm (FCLS) [41] to analyze the performance of the proposed methodology.
This section outlines the experiments performed on two real datasets. The performance of the proposed method is justified by comparing the results with other typical methods. The performance measures adopted to analyze the results are listed in Table 1.
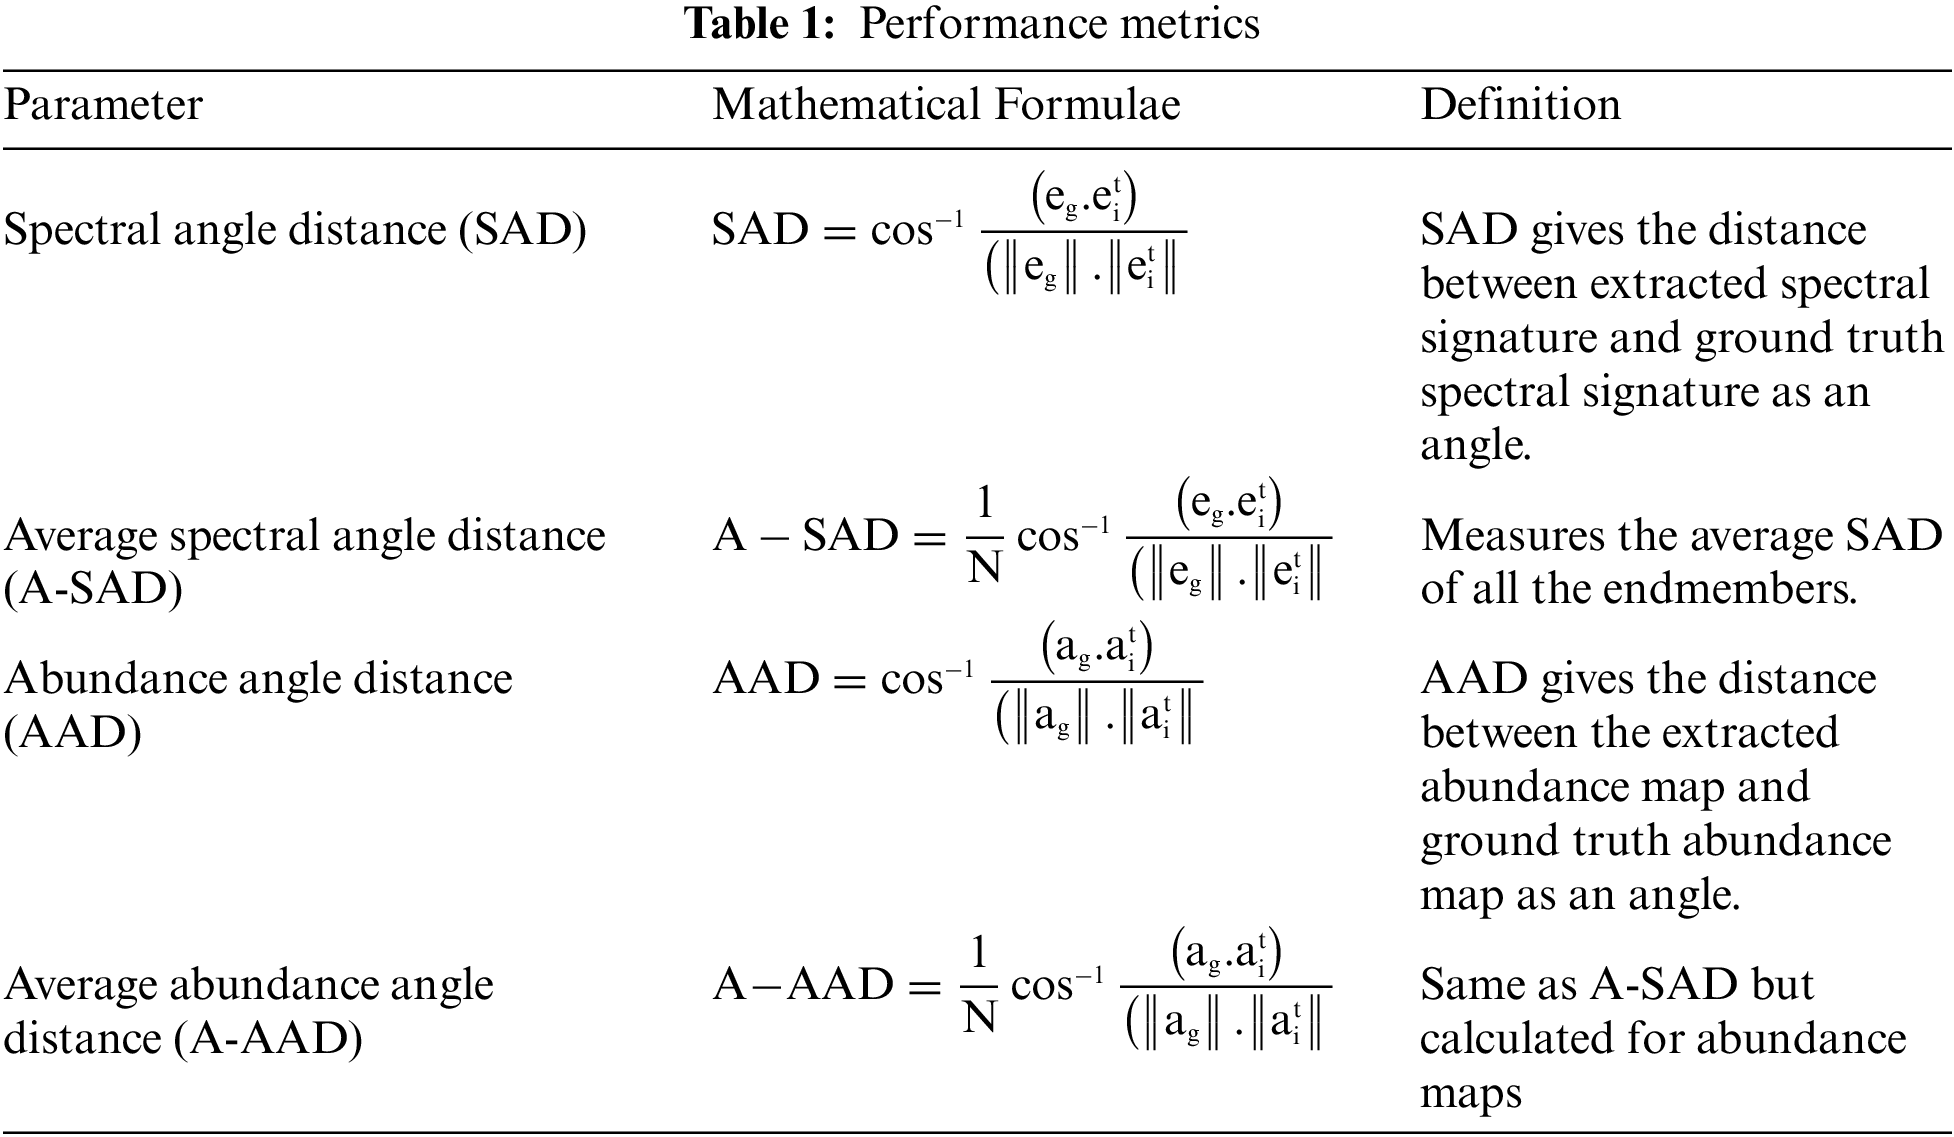
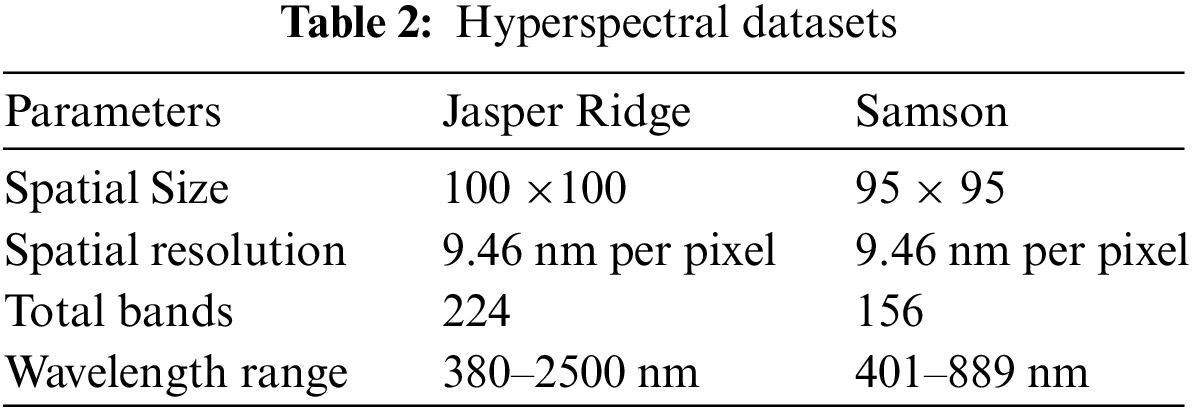
The spectral angle distance is used to validate endmembers, and the abundance angle distance is utilized to validate abundance maps. The details of real hyperspectral datasets used for experimentation are listed in Table 2.
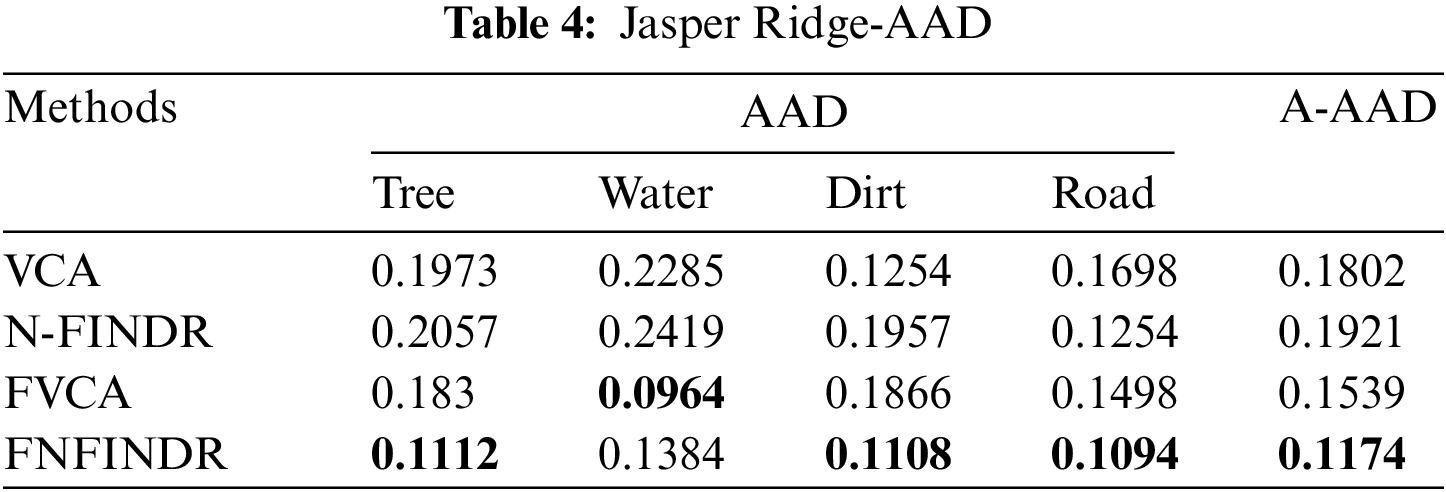
Jasper Ridge is one of the most popular datasets used to evaluate unmixing results. Jasper Ridge is an example of data with a complex distribution of several features. The endmembers in this dataset are Tree, Water, Dirt, and Road. In the state of art methods, two of the most widely-used methods to unmix the data that is also used for initialization of many complex algorithms are VCA and N-FINDR. Therefore, the proposed method has been implemented using these two methods and abbreviated as Fuzzy Vertex Component Analysis (FVCA) and Fuzzy N-FINDR (FNFINDR). Furthermore, the proposed method is also compared with a recent method, Maximum Distance Analysis (MDA) [42], and with traditional VCA. NFINDR methods are discussed in the literature. Fig. 3 displays the comparative results of the Jasper Ridge image in terms of SAD and A-SAD.
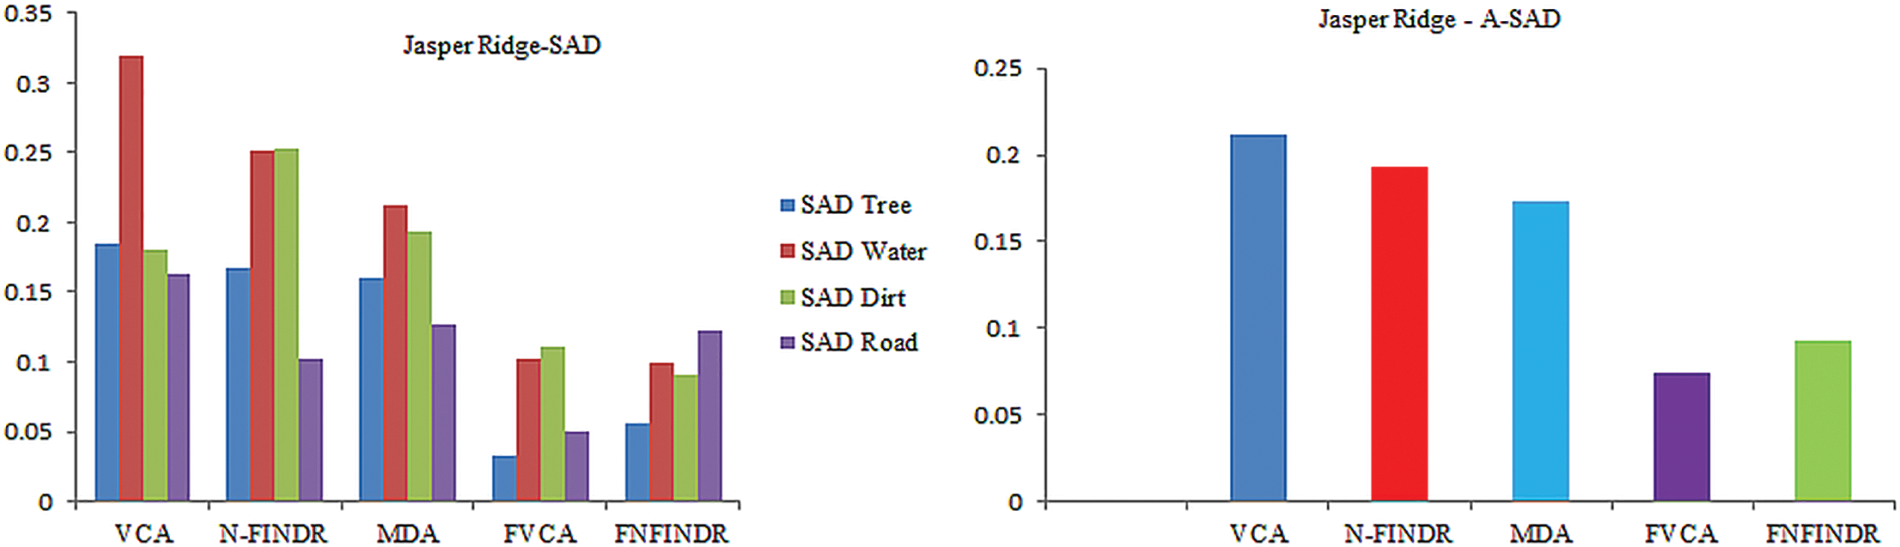
Figure 3: Performance comparison of SAD and A-SAD values for the Jasper Ridge dataset
Figs. 4 and 5 show the extracted endmembers and abundance maps generated for the Jasper Ridge dataset. The performance of the proposed methods FVCA and FNFINDR, has been improved compared with traditional VCA and NFINDR methods resulting in minimum error values. The extracted endmembers of FVCA, FNFINDR are more similar to the ground truth endmember. In the case of FVCA, the extracted endmembers, Water, Dirt, and Road, are consistent with ground truth endmembers. In the case of FNFINDR, the extracted endmembers, Tree, Dirt, and Road, are consistent with the ground truth endmembers. The proposed method results are comparable with the recent endmember extraction method, MDA. The minimum SAD values and their average are listed in Table 3. The bold value indicated the best performance. The abundance map AAD values are tabulated in Table 4, with the best performances highlighted in bold. The high accuracy of AAD values indicated that abundance maps generated by the proposed method are the same as the reference abundance maps.
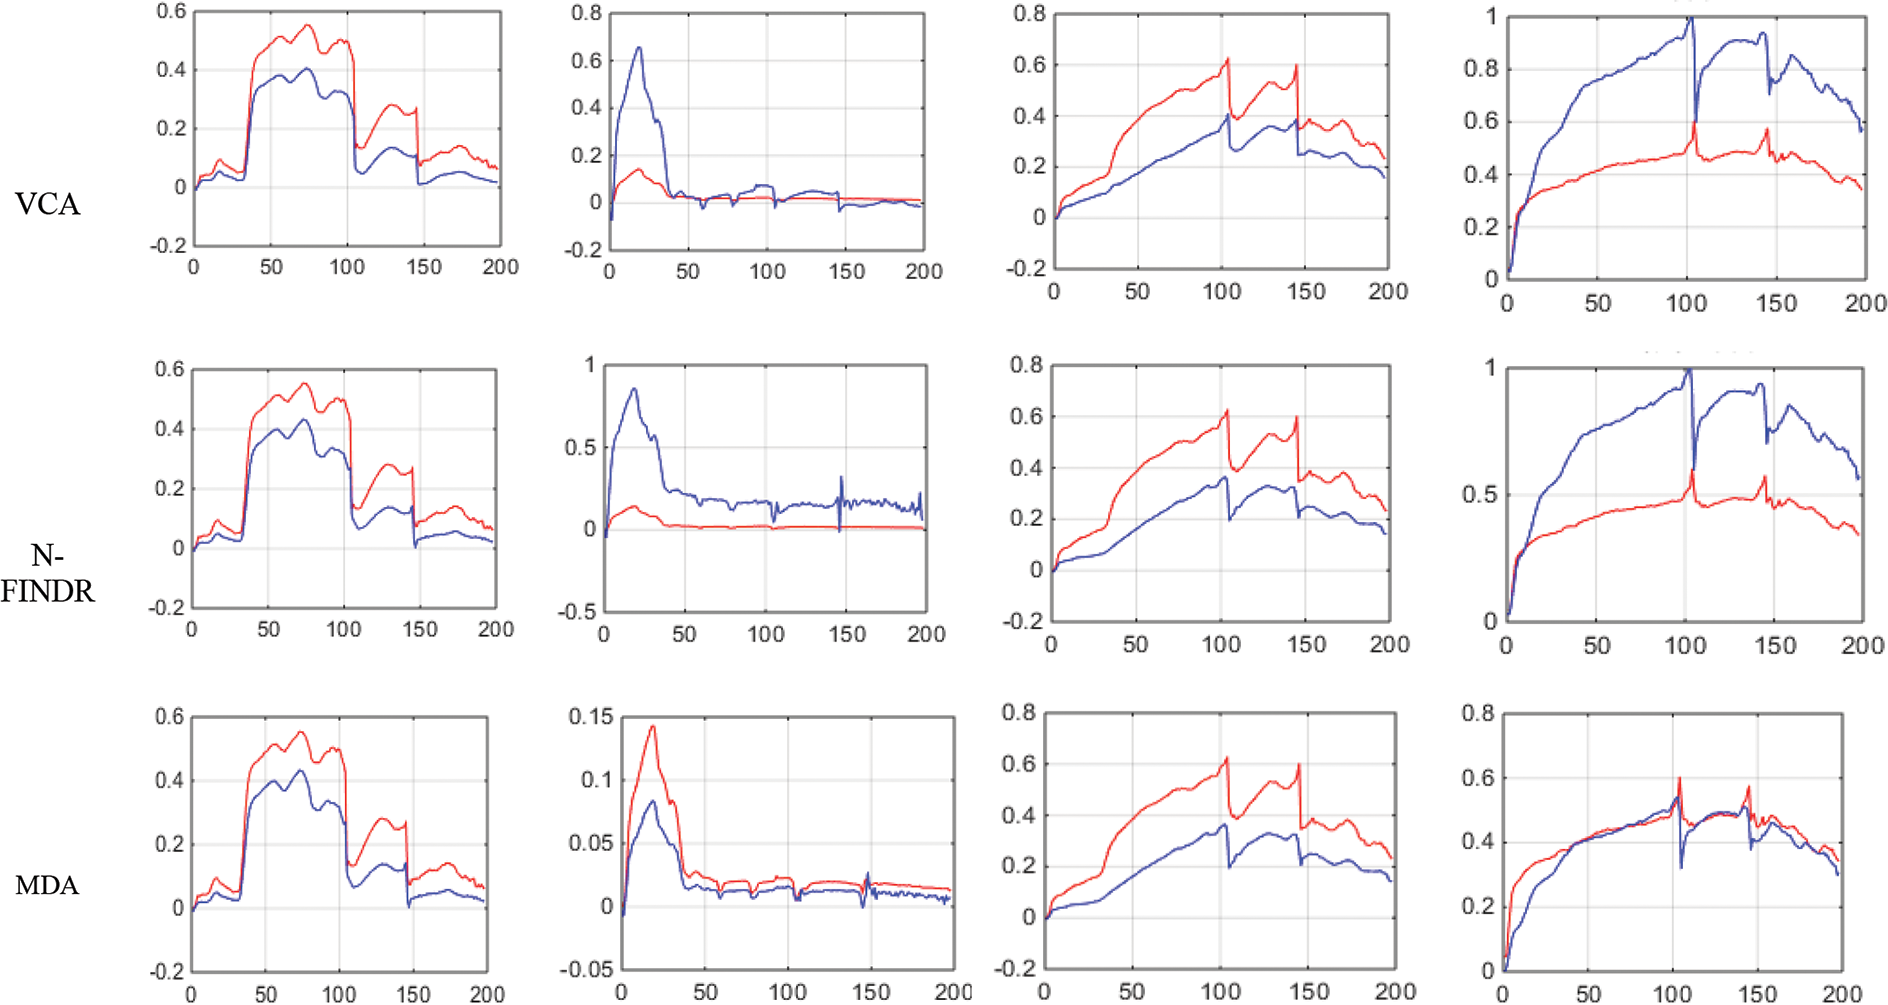
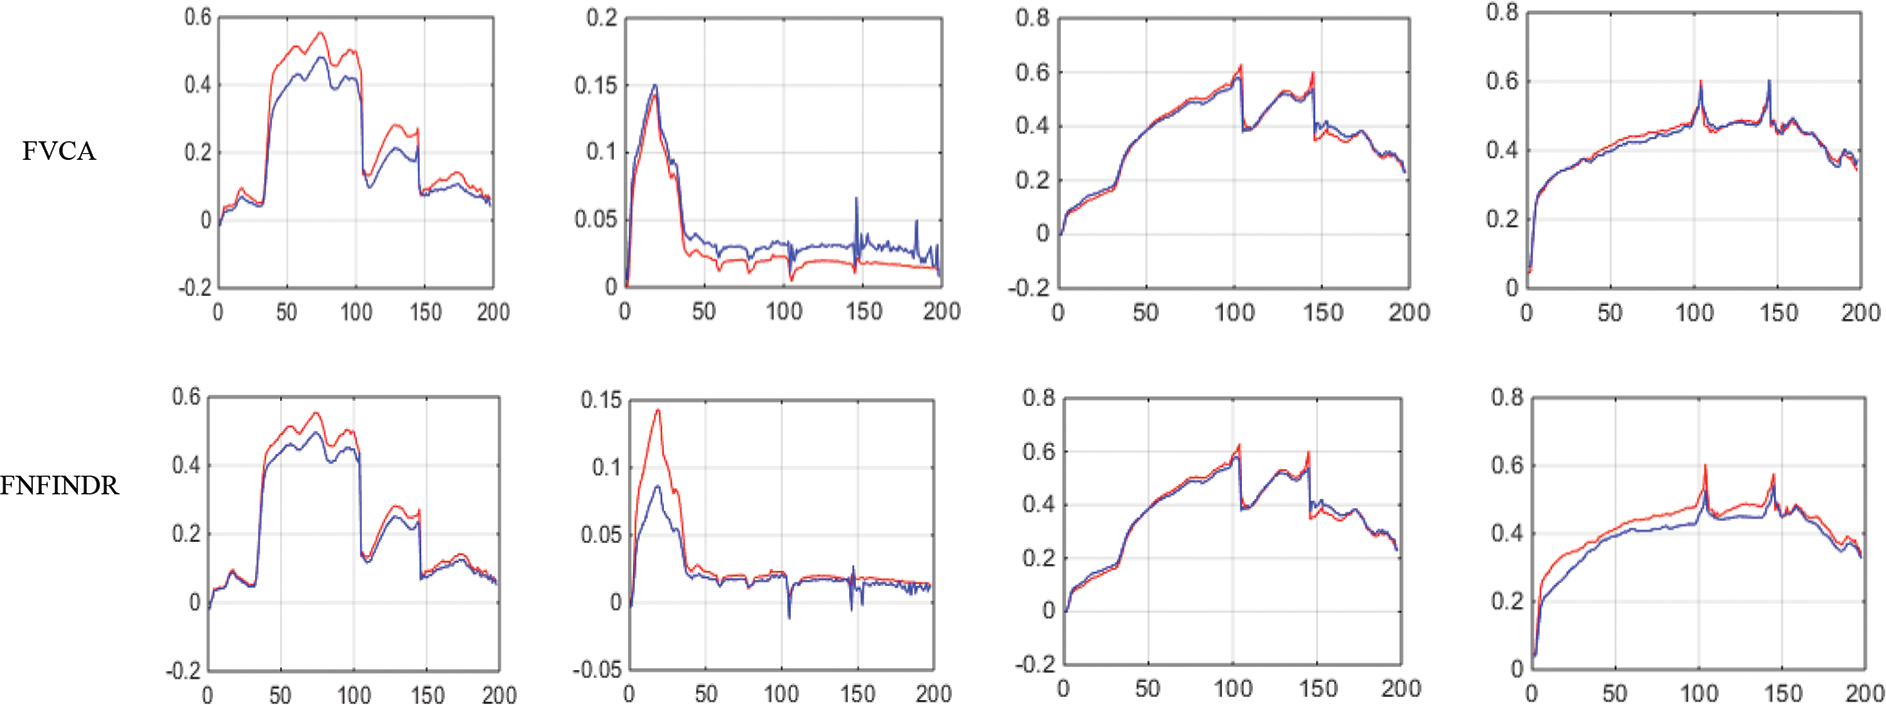
Figure 4: Results of endmember extraction methods (X axis-Reflectance, Y axis-Wavelength). The extracted spectra of the proposed FVCA method are more similar to ground truth spectra (Red-ground truth, Blue-extracted)
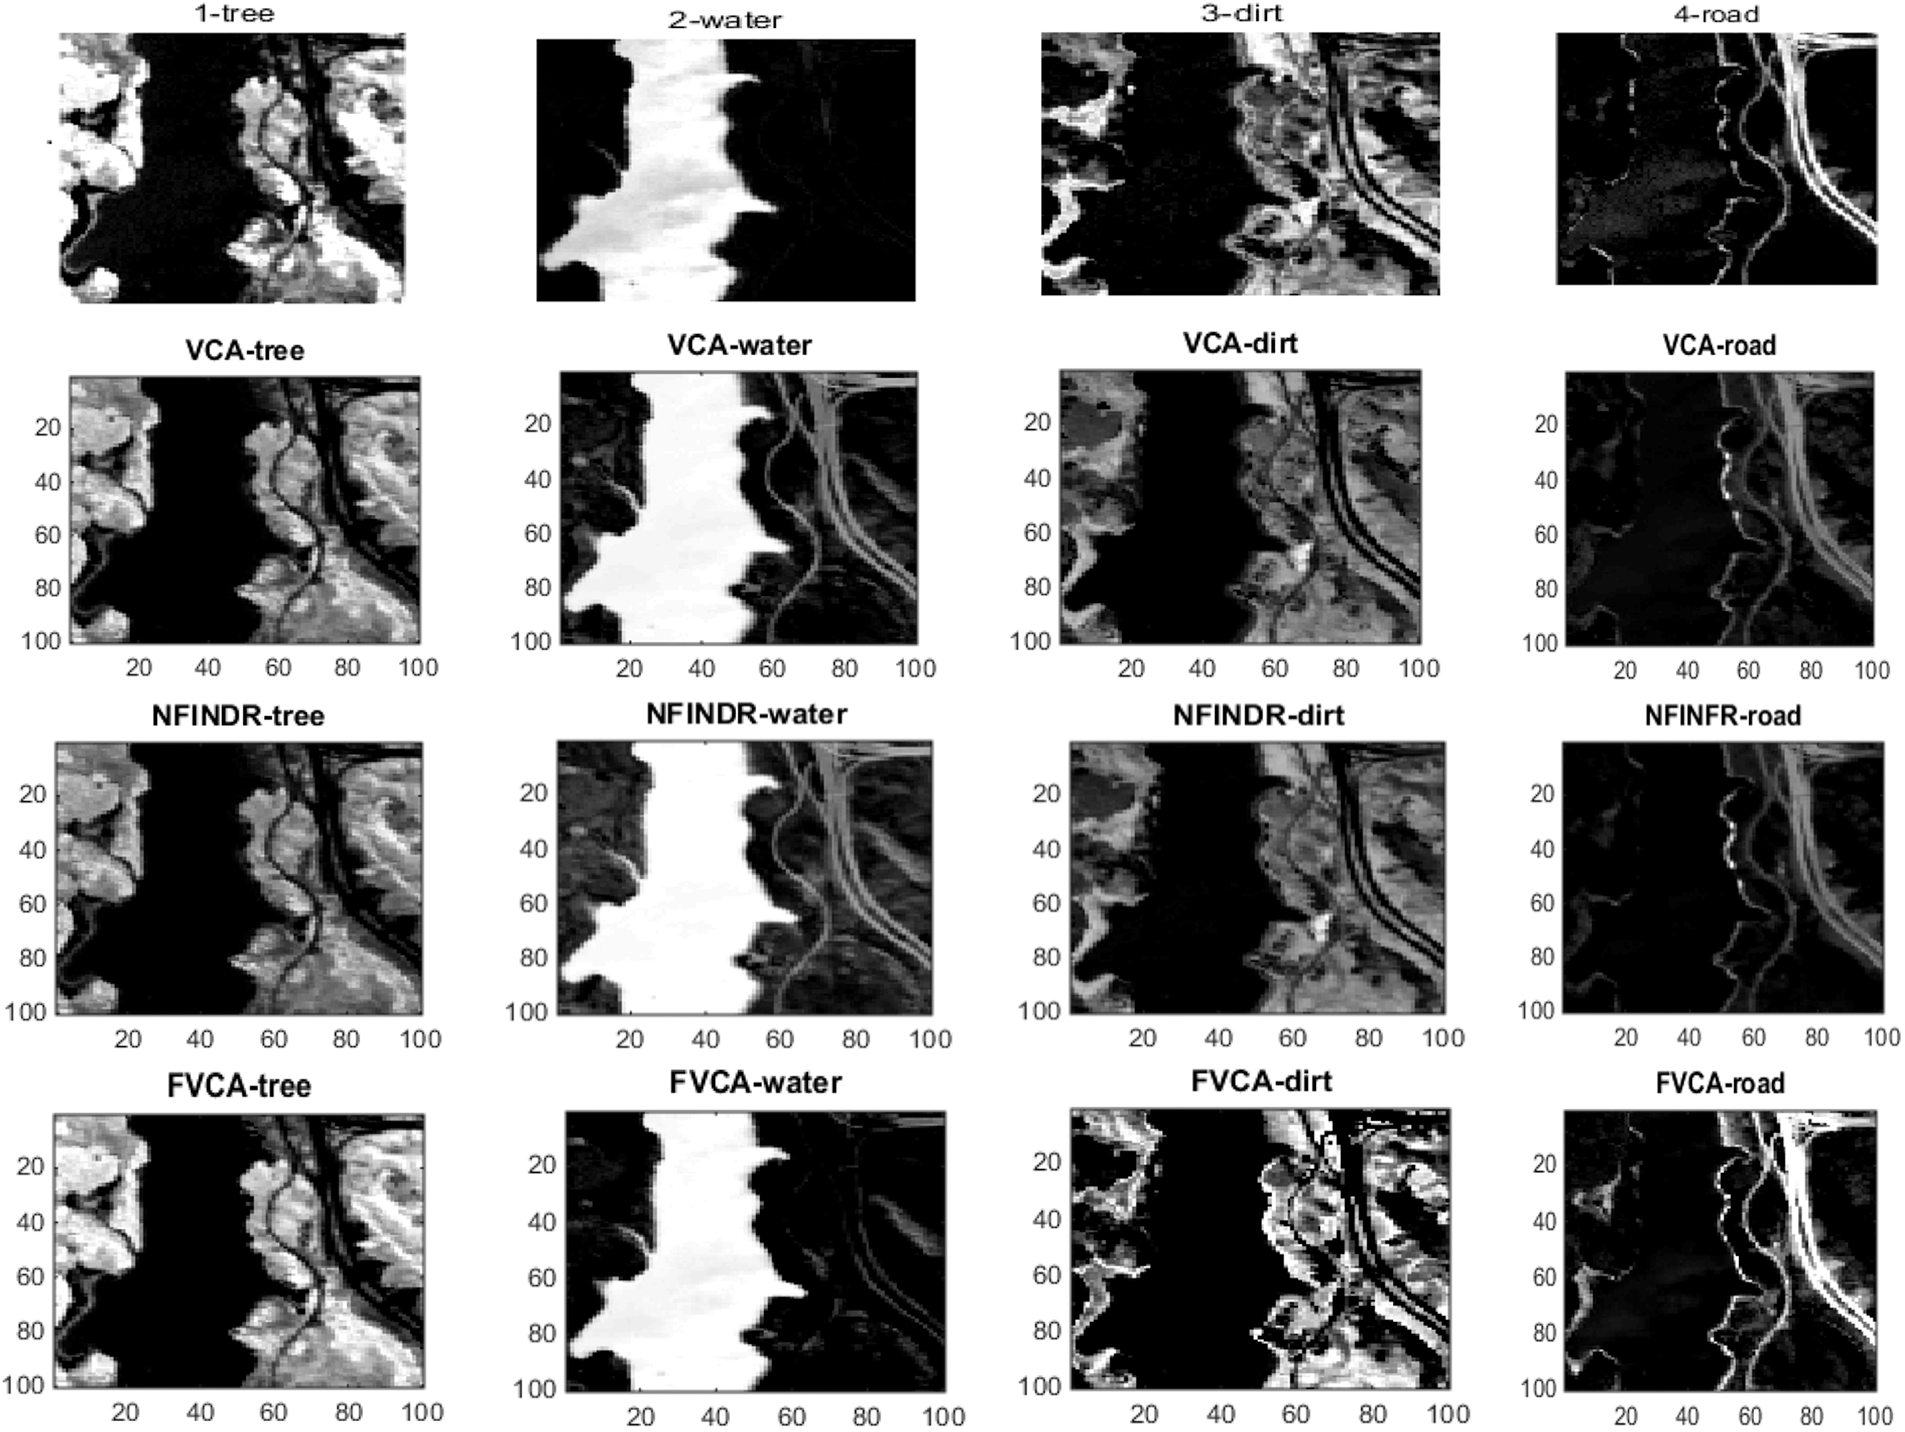
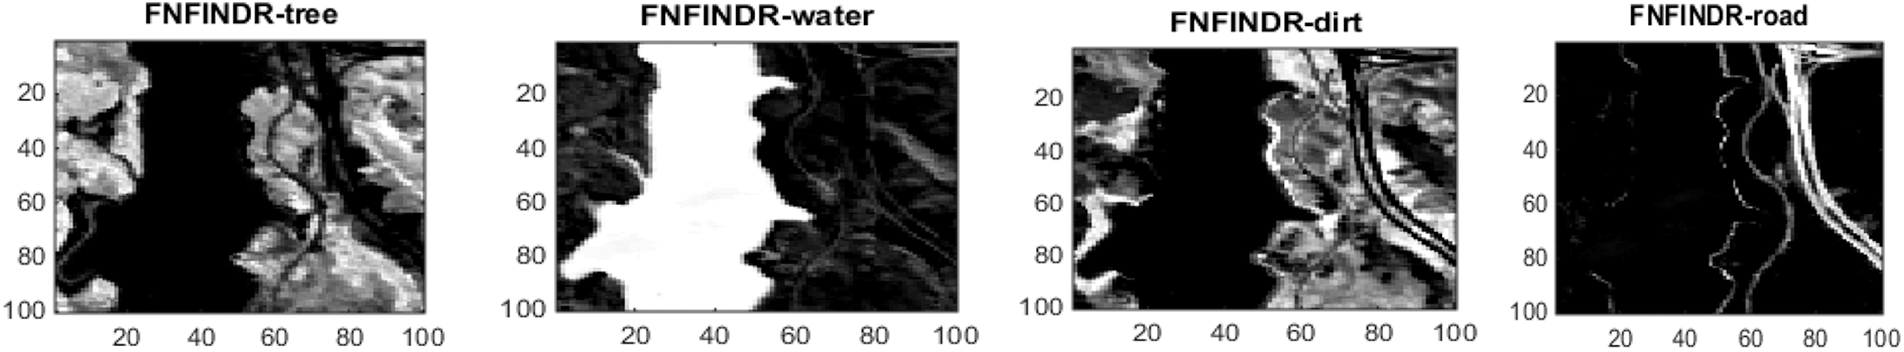
Figure 5: Results of abundance maps generated from the Jasper Ridge dataset. FVCA and FNFINDR maps are more consistent with ground truth maps
Since the existing VCA and NFINDR algorithms extract endmembers globally, to justify the performance of the proposed divide-and-conquer-based endmember extraction method using the fuzzy inference system, abundance maps were generated, and the results were analyzed. The abundance maps generated by the proposed method are better than existing methods, as shown in Fig. 5.
The second real dataset used is the Samson image. The Samson dataset contains three endmembers Rock, Tree, and Water. The divide-and-conquer-based proposed methodology results are better than traditional VCA and NFINDR. Also, the results from the proposed method are more comparable to the recent endmember extraction method, MDA. Fig. 6 displays the comparative results of SAD and A-SAD values for extracted endmembers in Samson image.

Figure 6: Performance comparison of SAD and ASAD values using the samson dataset
The high accuracy of SAD values in Table 5 indicates that the best performance came from the proposed method. The generated abundance maps agree well with reference abundance maps for the proposed method. The MDA and the proposed method perform equally for the Samson image as validated in Table 6.
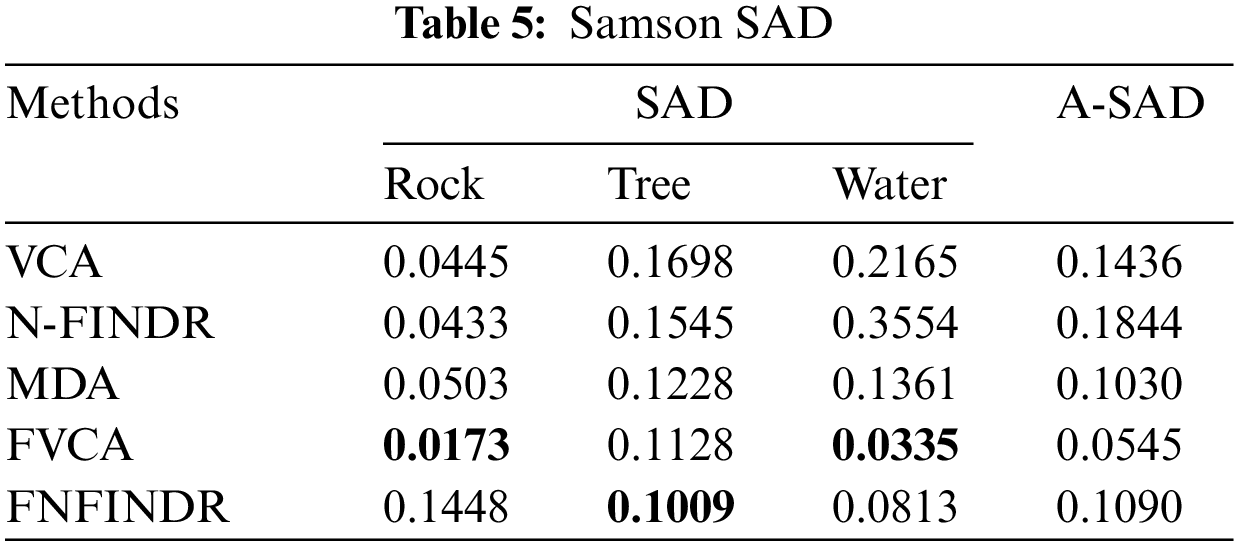
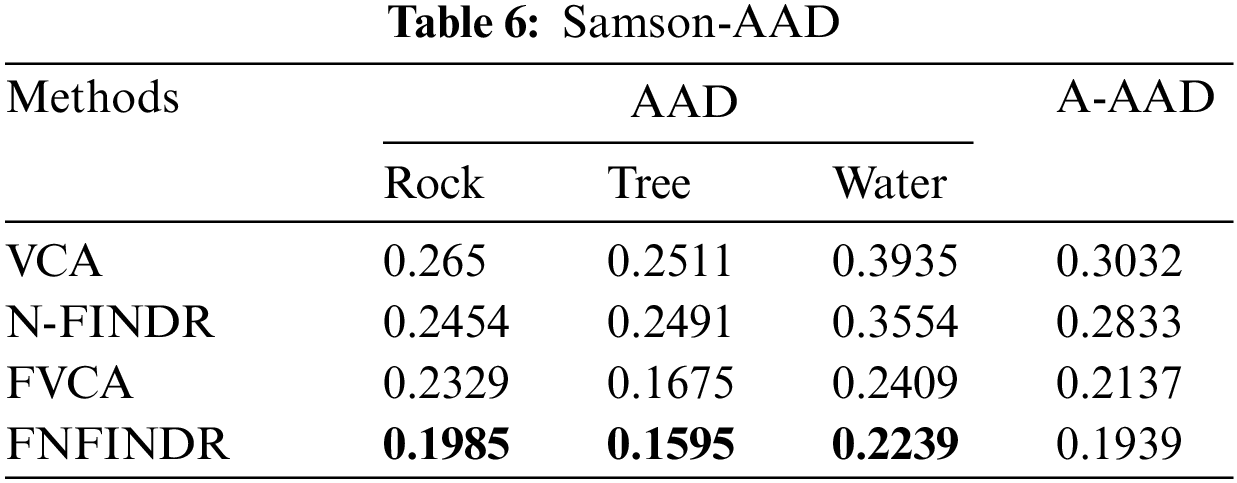
Fig. 7 displays the accuracy of A-AAD values for the two real datasets under experimentation. The minimum value was achieved for the proposed methods, FVCA and FNFINDR.
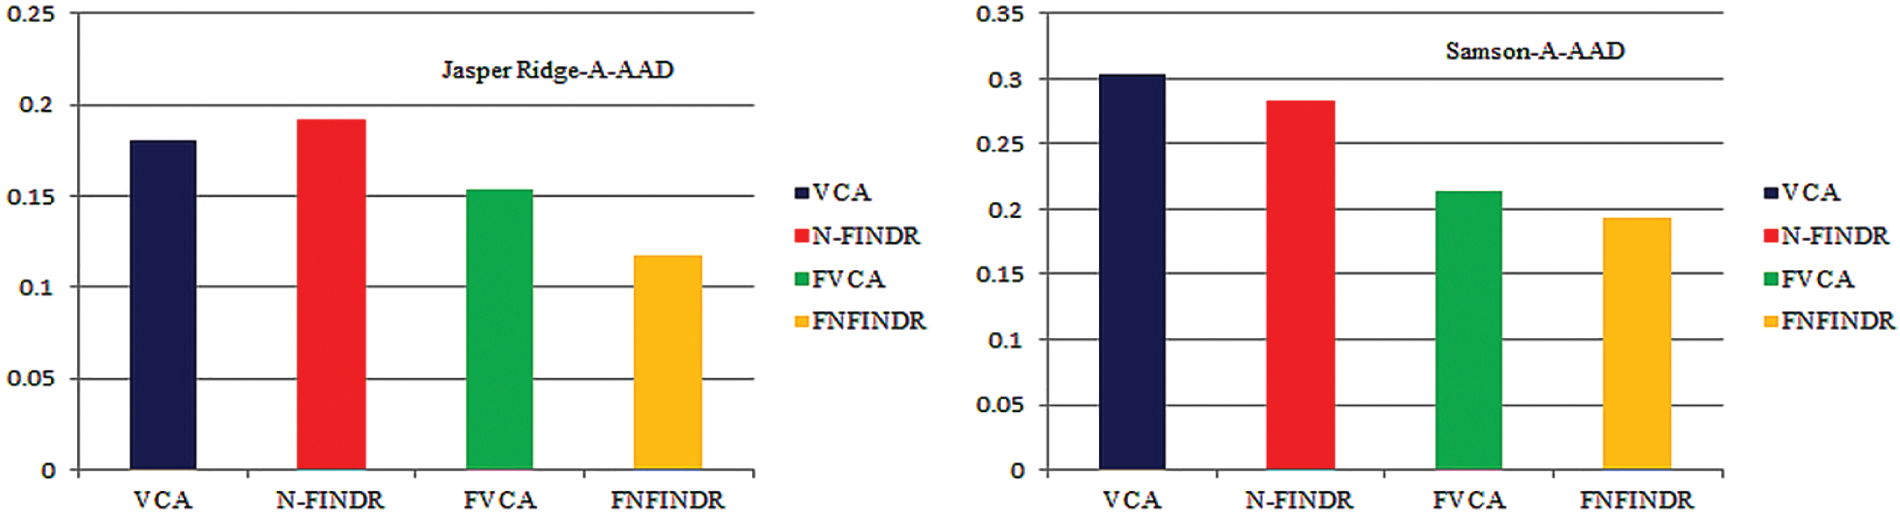
Figure 7: Performance comparison of A-AAD values for the Jasper Ridge and samson images
Figs. 8 and 9 show the extracted endmembers and abundance maps generated for the Samson dataset.
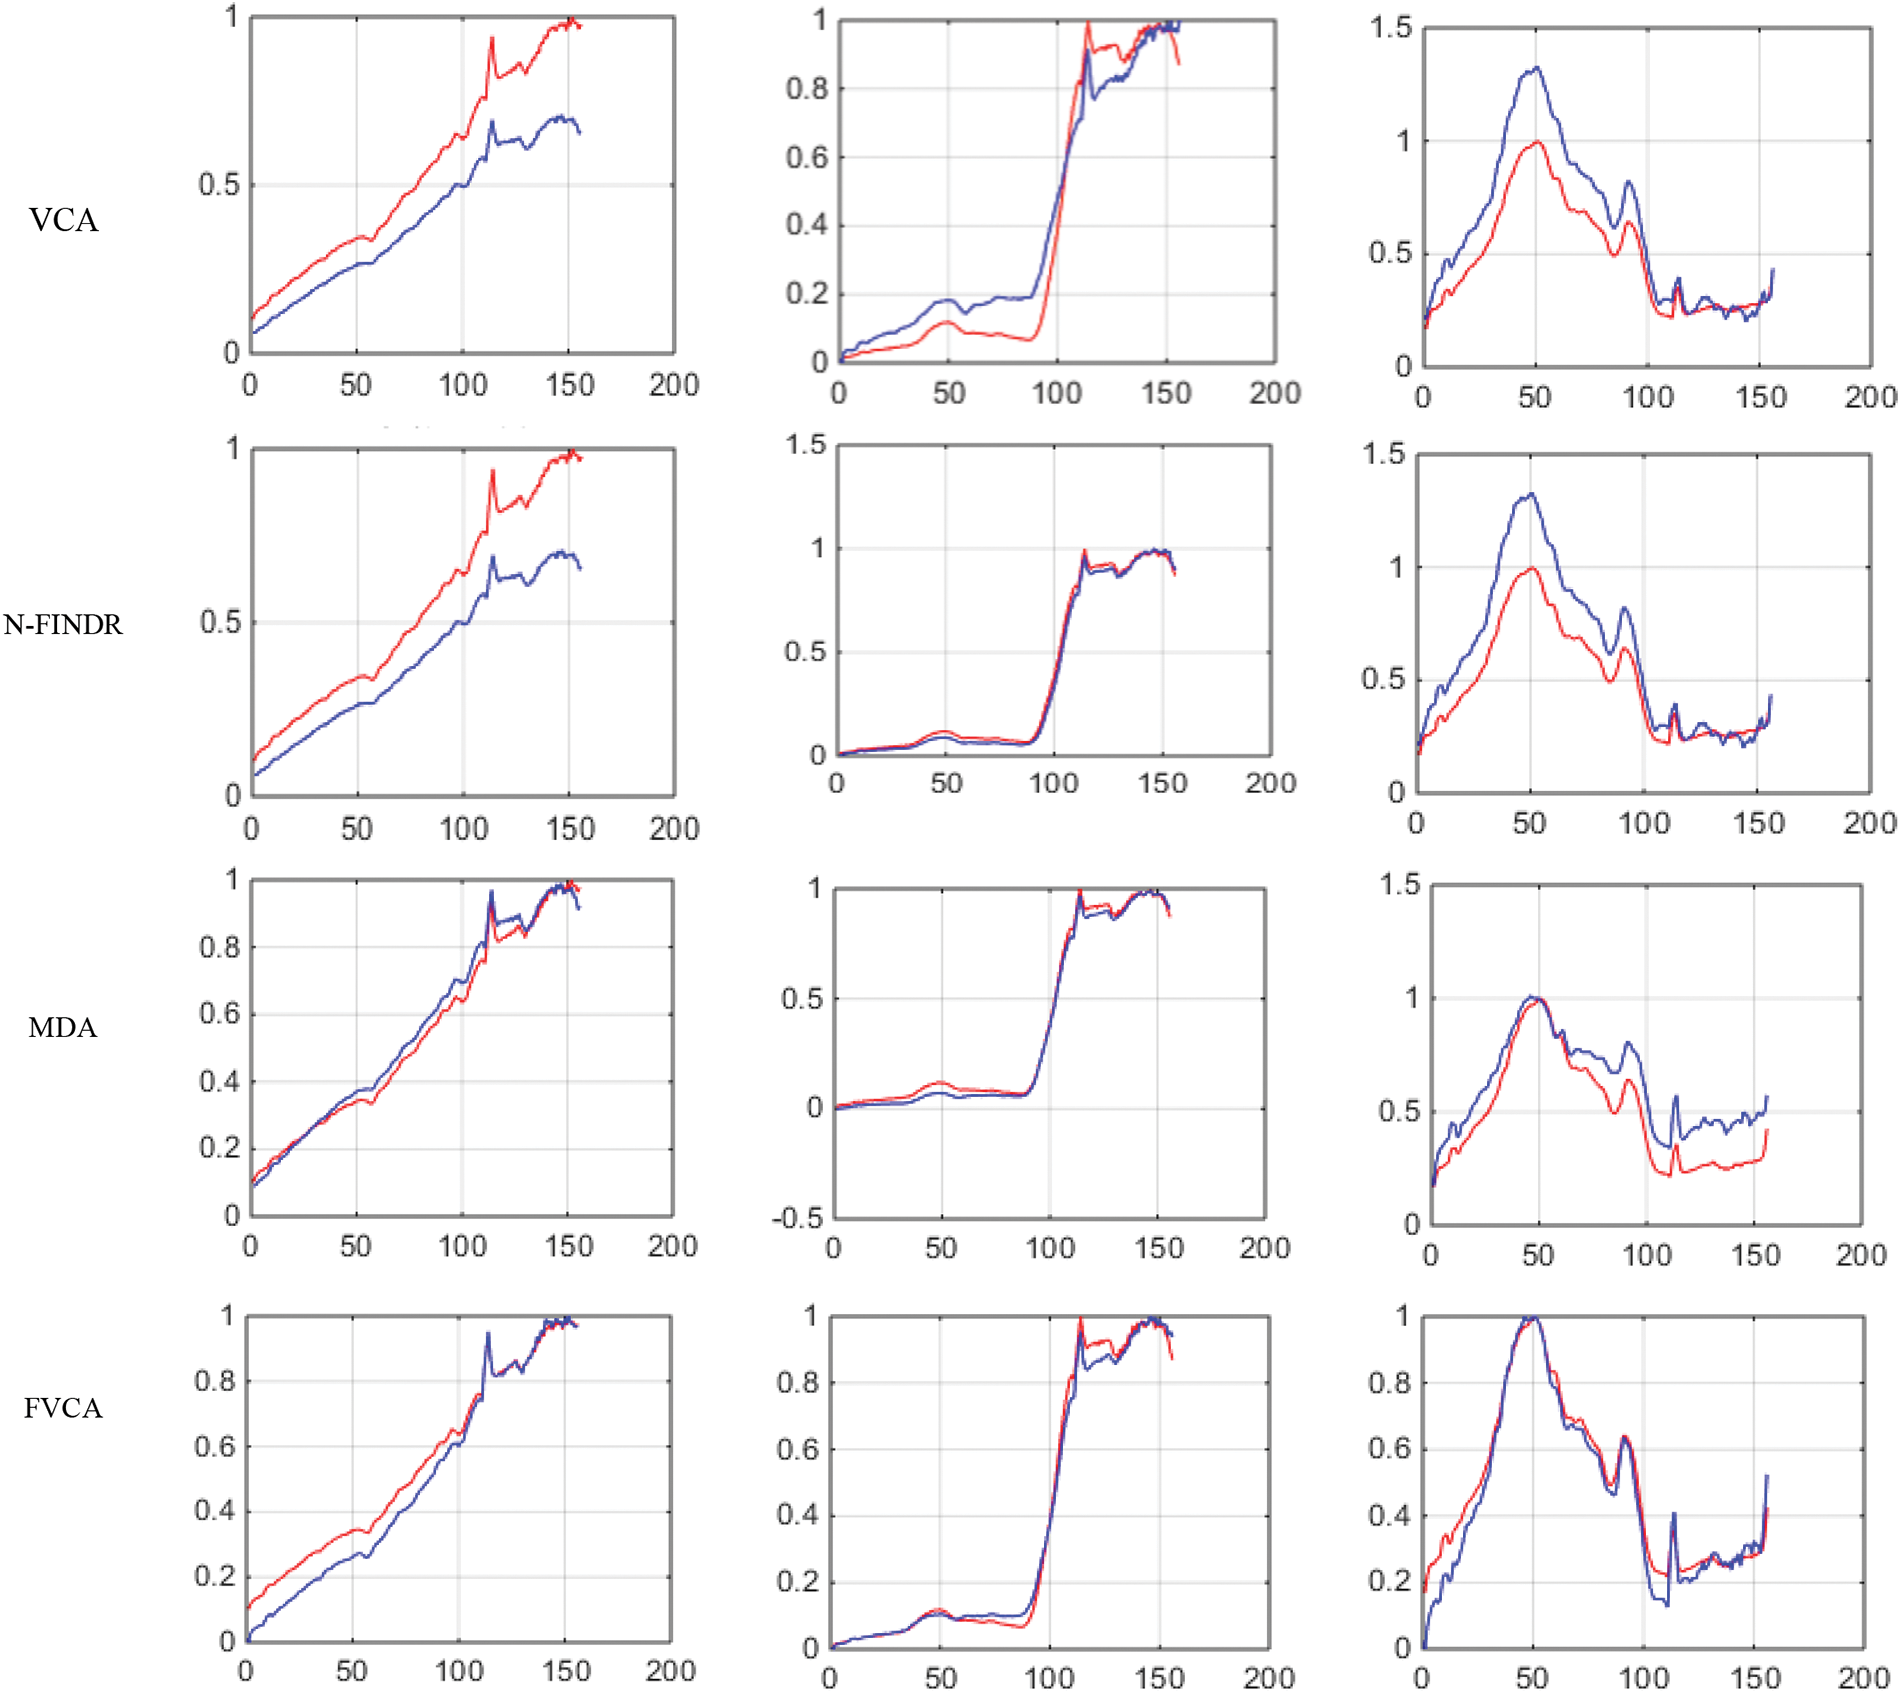
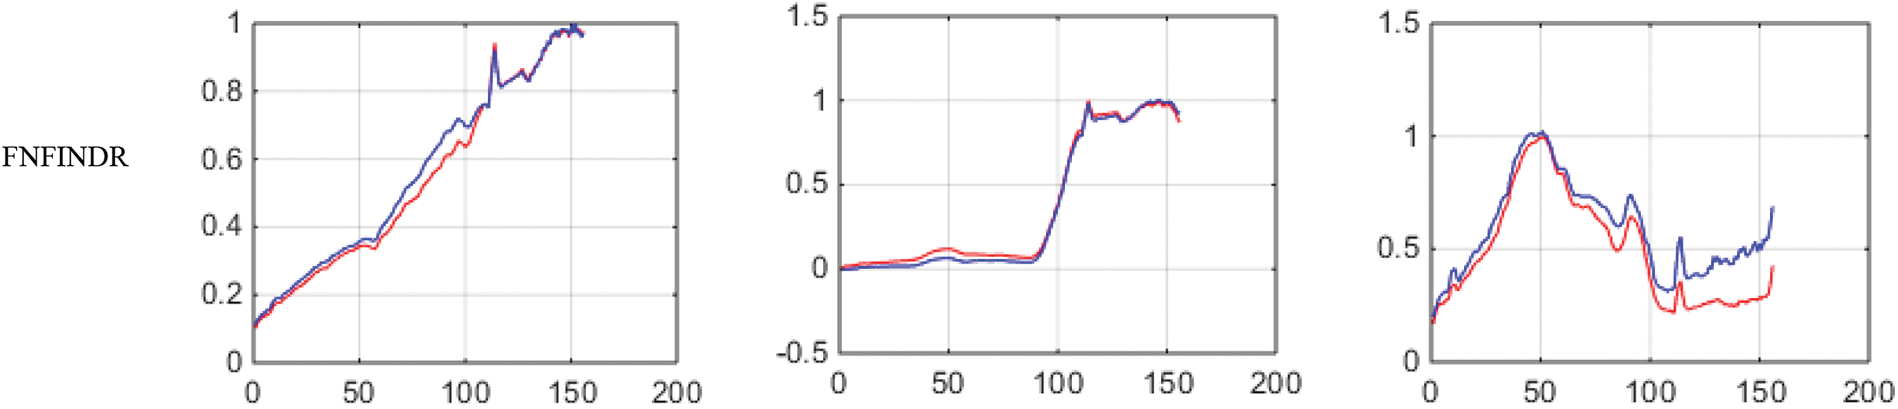
Figure 8: Results of endmember extraction methods (X axis-Reflectance, Y axis-Wavelength). The extracted spectra of the proposed FVCA method are more similar to ground truth spectra (Red-ground truth, Blue-extracted)
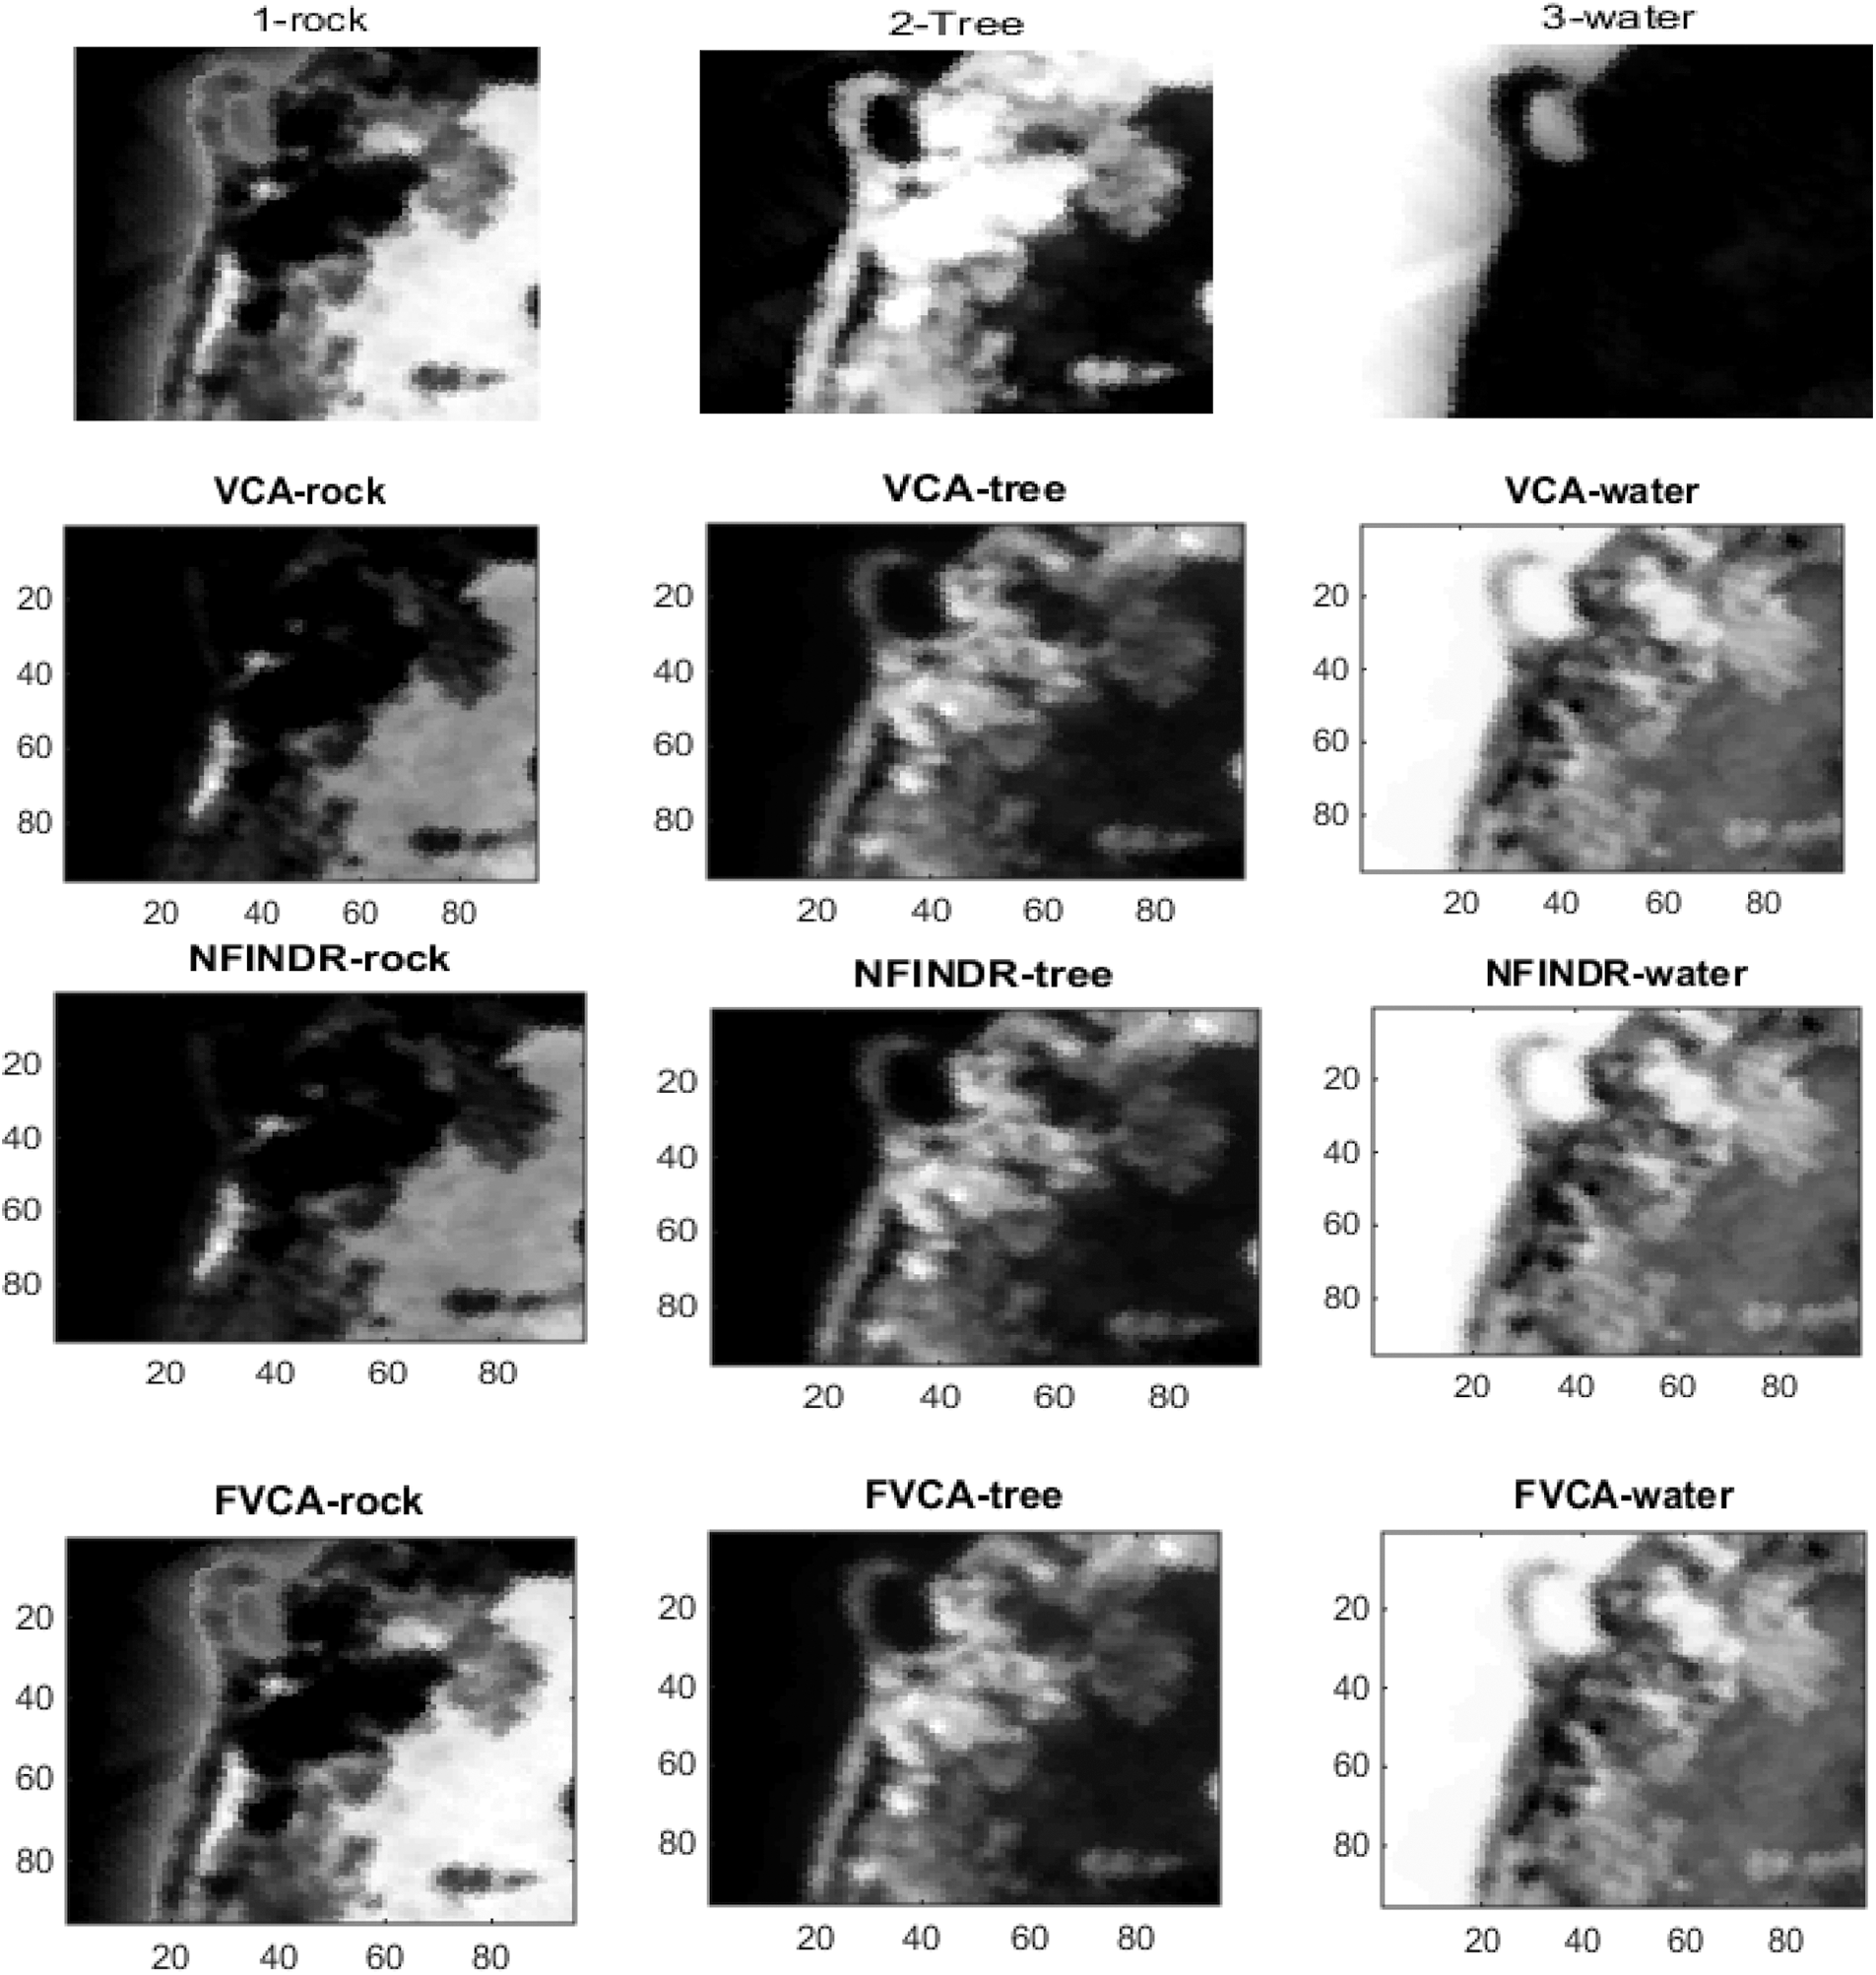
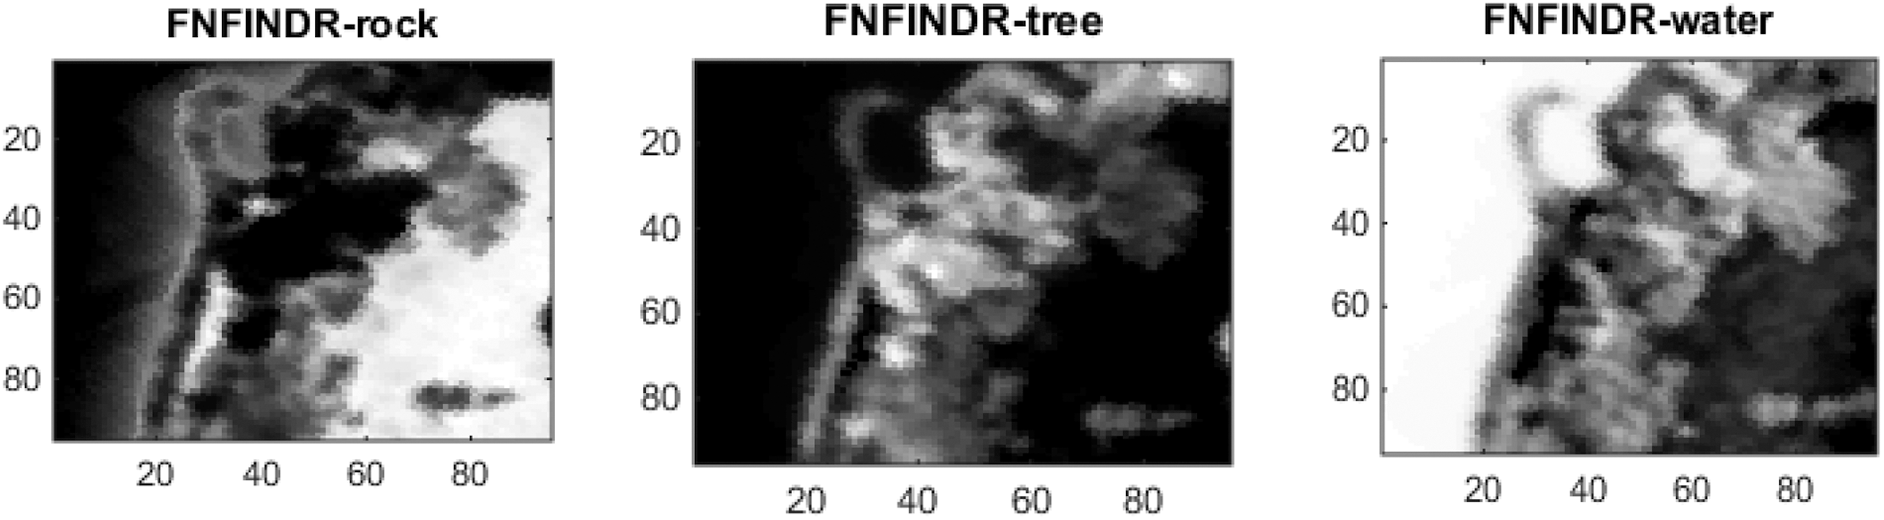
Figure 9: Results of abundance maps generated from the Samson dataset
The above experiments on two real datasets show that the proposed method based on the divide-and-conquer strategy has extracted endmembers more similar to ground truth endmembers. This premise is further justified considering the lower SAD and A-SAD values for the extracted endmembers. The library of endmembers, extracted before selecting the final endmember before categorizing using FIS, is shown in Fig. 10. Also, the generated abundance maps generated are more consistent with ground truth abundance maps, and these have been validated in terms of lower AAD and A-AAD values. The performance of the proposed method has been analyzed with the help of two different feature distributions from real datasets. Jasper Ridge is a scene with a complex distribution of features, whereas Samson is a scene with a less complex distribution of features. Still, the performance of the proposed method is good for both datasets.
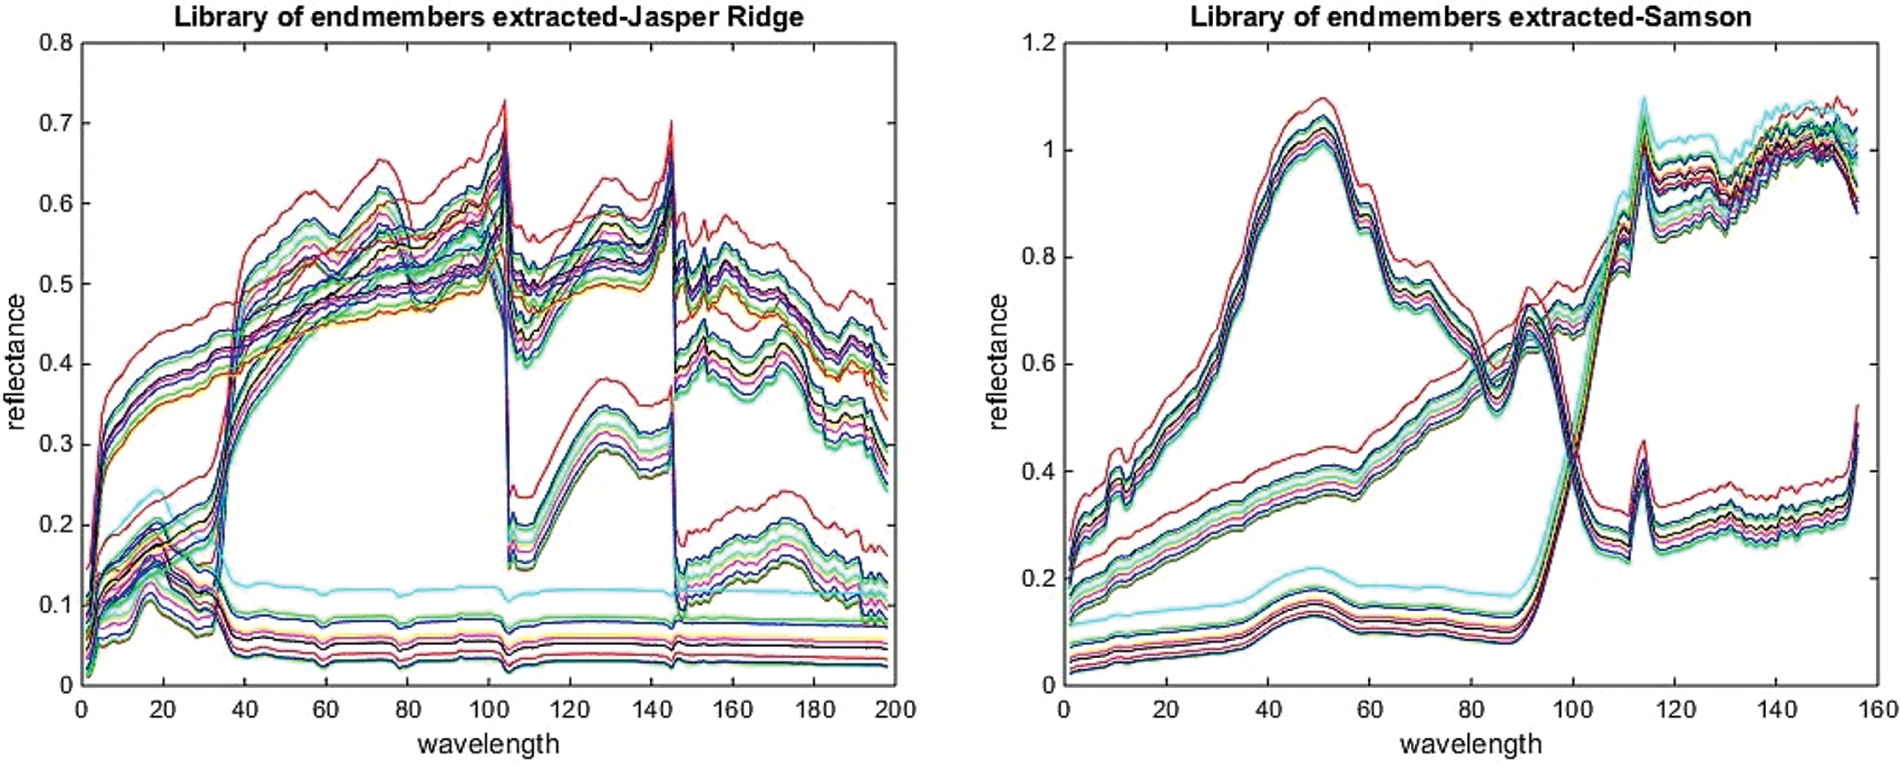
Figure 10: Library of extracted endmembers for the jasper ridge and Samson datasets
There are still some unresolved issues in the proposed method. First, considering that the original hyperspectral data is divided into image subsets of 20 bands, the dividing stage is still a complicated problem, as indicated in the literature, and a stable algorithm will need to be devised for similar efforts in the future. Second, additional spectral matching parameters need to be included in the fuzzy inference system to generate endmember bundles. In the future, the proposed method needs to be tested on data with variable noise levels, and its performance subsequently analyzed.
Although many spectral unmixing techniques are available to analyze remote sensing hyperspectral data, most methods assume endmembers as pure pixels and fail to consider endmember variability and generate spectra from a single point. The proposed method considers these factors and extracts endmember bundles, thereby improving the estimation of abundance maps. In the first stage, the full hyperspectral data is divided into image subsets, and then extracts the endmembers using an existing algorithm. The extracted endmembers from different image subsets are conquered using a library of spectra. The fuzzy inference system using spectral parameters is applied to extract endmember bundles by comparing a single spectrum with all ground truth spectra. The proposed method is simple and automatically considers the endmember variability in the hyperspectral image. The proposed method aims to extract endmember bundles, and their abundance fractions are obtained using FCLS. The proposed method has been tested on datasets with different complexities and feature distributions, and the results are promising for both datasets. In terms of quality measures, the proposed method has achieved minimum SAD and AAD values compared with the state-of-the-art methods. Future work includes generating abundance maps from endmembers of multi-temporal images to detect and analyze changes in mangrove forests caused by natural disasters and anthropogenic disturbances.
Funding Statement: The authors received no specific funding for this study.
Conflicts of Interest: The authors declare that they have no conflicts of interest to report regarding the present study.
References
1. L. M. Dale, A. Thewis, C. Boudry, I. Rotar, P. Dardenne et al., “Hyperspectral imaging applications in agriculture and agro-food product quality and safety control: A review,” Applied Spectroscopy Reviews, vol. 48, no. 2, pp. 142–159, 2013. [Google Scholar]
2. X. Jia, B. C. Kuo and M. M. Crawford, “Feature mining for hyperspectral image classification,” Proceedings of the IEEE, vol. 101, no. 3, pp. 676–697, 2013. [Google Scholar]
3. M. Moroni, E. Lupo, E. Marra and A. Cenedese, “Hyperspectral image analysis in environmental monitoring: Setup of a new tunable filter platform,” Procedia Environmental Sciences, vol. 19, no. 6, pp. 885–894, 2013. [Google Scholar]
4. R. E. Warren and D. B. Cohn, “Chemical detection on surfaces by hyperspectral imaging,” Journal of Applied Remote Sensing, vol. 11, no. 1, pp. 1–18, 2017. [Google Scholar]
5. E. K. Hege, D. O. Connell, W. Johnson, S. Basty and E. L. Dereniak, “Hyperspectral imaging for astronomy and space surveillance,” SPIE Proceedings: Imaging Spectrometry IX, vol. 5159, pp. 380–391, 2004. [Google Scholar]
6. J. M. Bioucas-Dias, A. Plaza, N. Dobigeon, M. Parente, Q. Du et al., “Hyperspectral unmixing overview: Geometrical, statistical, and sparse regression-based approaches,” IEEE Journal of Selected Topics in Applied Earth Observations and Remote Sensing, vol. 5, no. 2, pp. 354–379, 2012. [Google Scholar]
7. N. Dobigeon, Y. Altmann, N. Brun and S. Moussaoui, “Linear and nonlinear unmixing in hyperspectral imaging,” Data Handling in Science and Technology, vol. 30, no. 12, pp. 185–224, 2016. [Google Scholar]
8. N. Dobigeon, J. Y. Tourneret, C. Richard, J. C. Bermudez, S. McLaughlin et al., “Nonlinear unmixing of hyperspectral images: Models and algorithms,” IEEE Signal Processing Magazine, vol. 31, no. 1, pp. 82–94, 2013. [Google Scholar]
9. Z. Hua, X. Li and L. Zhao, “Endmember bundle extraction based on pure pixel index and super-pixel segmentation,” in IGARSS 2019-2019 IEEE Int. Geoscience and Remote Sensing Symp., Yokohama, Japan, pp. 2131–2134, 2019. [Google Scholar]
10. J. M. P. Nascimento and J. M. Bioucas-Dias, “Vertex component analysis: A fast algorithm to unmix hyperspectral data,” IEEE Transactions on Geoscience and Remote Sensing, vol. 43, no. 4, pp. 898–910, 2005. [Google Scholar]
11. J. Zhang, B. Rivard and D. M. Rogge, “The successive projection algorithm (SPAan algorithm with a spatial constraint for the automatic search of endmembers in hyperspectral data,” Sensors, vol. 8, no. 2, pp. 1321–1342, 2008. [Google Scholar] [PubMed]
12. J. C. Harsanyi and C. I. Chang, “Hyperspectral image classification and dimensionality reduction: An orthogonal subspace projection approach,” IEEE Trancations on Geoscience. Remote Sensing, vol. 32, no. 4, pp. 779–785, 1994. [Google Scholar]
13. N. Keshava, “A survey of spectral unmixing algorithms,” Lincoln Laboratory Journal, vol. 14, no. 1, pp. 55–78, 2003. [Google Scholar]
14. X. R. Geng, L. Y. Ji and K. Sun, “Non-negative matrix factorization based unmixing for principal component transformed hyperspectral data,” Frontiers of Information Technology & Electronic Engineering, vol. 17, no. 5, pp. 403–412, 2016. [Google Scholar]
15. K. Mahajan, U. Garg, N. Mittal, Y. Nam, B. Kang et al., “Non-negative minimum volume factorization (nmvf) for hyperspectral images (hsi) unmixing: A hybrid approach,” Computers, Materials & Continua, vol. 73, no. 2, pp. 3705–3720, 2022. [Google Scholar]
16. J. Wei and X. Wang, “An overview on linear unmixing of hyperspectral data,” Mathematical Problems in Engineering, vol. 2020, pp. 12, 2020. [Google Scholar]
17. A. Zare and K. C. Ho, “Endmember variability in hyperspectral analysis: Addressing spectral variability during spectral unmixing,” IEEE Signal Processing Magazine, vol. 31, no. 1, pp. 95–104, 2014. [Google Scholar]
18. B. Somers, M. Zortea, A. Plaza and G. P. Asner, “Automated extraction of image-based endmember bundles for improved spectral unmixing,” IEEE Journal of Selected Topics in Applied Earth Observations and Remote Sensing, vol. 5, no. 2, pp. 396–408, 2012. [Google Scholar]
19. D. A. Roberts, M. Gardner, R. Church, S. Ustin, G. Scheer et al., “Mapping chaparral in the santa monica mountains using multiple endmember spectral mixture models,” Remote Sensing of Environment, vol. 65, no. 3, pp. 267–279, 1998. [Google Scholar]
20. G. Asner and D. Lobell, “A biogeophysical approach for automated SWIR unmixing of soils and vegetation,” Remote Sensing Environment, vol. 74, no. 1, pp. 99–112, 2000. [Google Scholar]
21. M. Xu, L. Zhang, B. Du and L. Zhang, “An image-based endmember bundle extraction algorithm using reconstruction error for hyperspectral imagery,” Neurocomputing, vol. 173, no. 1, pp. 397–405, 2016. [Google Scholar]
22. C. Andreou, D. Rogge, B. Rivard and R. Müller, “A novel approach for endmember bundle extraction using spectral space splitting,” in Proc. of the 2015 7th Workshop on Hyperspectral Image and Signal Processing: Evolution in Remote Sensing (WHISPERS), Tokyo, Japan, pp. 1–4, 2015. [Google Scholar]
23. C. Ye, S. Liu, M. Xu, B. Du, J. Wan et al., “An endmember bundle extraction method based on multiscale sampling to address spectral variability for hyperspectral unmixing,” Remote Sensing, vol. 13, no. 19, pp. 3941, 2021. [Google Scholar]
24. T. Uezato, R. J. Murphy, A. Melkumyan and A. Chlingaryan, “A novel endmember bundle extraction and clustering approach for capturing spectral variability within endmember classes,” IEEE Transcations on Geoscience. Remote Sensing, vol. 54, no. 11, pp. 6712–6731, 2016. [Google Scholar]
25. M. Xu, L. Zhang and B. Du, “An image-based endmember bundle extraction algorithm using both spatial and spectral information,” IEEE Journal of Selected Topics in Applied Earth Observations and Remote Sensing, vol. 8, no. 6, pp. 2607–2617, 2015. [Google Scholar]
26. M. V. Devi and S. Kalaivani, “Feature extraction-based hyperspectral unmixing,” In: B. Gulyás, P. Padmanabhan, A. Fred, T. Kumar and S. Kumar (Eds.ICTMI 2017, pp. 185–197, Vellore, Tamil Nadu, India: Springer, 2019. [Google Scholar]
27. S. Shanmugam and P. Srinivasa Perumal, “Spectral matching approaches in hyperspectral image processing,” International Journal of Remote Sensing, vol. 35, no. 24, pp. 8217–8251, 2014. [Google Scholar]
28. G. Mei, J. Zhang, N. Xu and K. Zhao, “A simple implementation for parallelizing Divide-and-Conquer algorithms on the GPU,” Heliyon, vol. 4, no. 1, pp. 1–28, 2018. [Google Scholar]
29. N. Keshava and J. F. Mustard, “Spectral unmixing,” IEEE Signal Processing Magazine, vol. 19, no. 1, pp. 44–57, 2002. [Google Scholar]
30. M. R. Vimala Devi and S. Kalaivani, “Band selection using SIFT in hyperspectral images,” International Journal of Engineering & Technology, vol. 7, no. 4, pp. 28–33, 2018. [Google Scholar]
31. D. G. Lowe, “Distinctive image features from scale invariant keypoints,” International Journal of Computer Vision, vol. 60, no. 2, pp. 91–110, 2004. [Google Scholar]
32. X. Wu, B. Huang, A. Plaza, Y. Li and C. Wu, “Real-time implementation of the pixel purity index algorithm for endmember identification on GPUs,” IEEE Geoscience and Remote Sensing Letters, vol. 11, no. 5, pp. 955–959, 2013. [Google Scholar]
33. M. E. Winter, “N-FINDR: An algorithm for fast autonomous spectral end-member determination in hyperspectral data,” in SPIE’s Int. Symp. on Optical Science, Engineering, and Instrumentation, Bellingham, WA, USA, vol. 3753, pp. 266–275, 1999. [Google Scholar]
34. J. H. Gruninger, A. J. Ratkowski and M. L. Hoke, “The sequential maximum angle convex cone (SMACC) endmember model,” in Proc. 5425, Algorithms and Technologies for Multispectral, Hyperspectral, and Ultraspectral Imagery X, Orlando, Florida, United States, vol. 5425, pp. 1–14, 2004. [Google Scholar]
35. J. Li and J. M. Bioucas-Dias, “Minimum volume simplex analysis: A fast algorithm to unmix hyperspectral data,” in IGARSS 2008-2008 IEEE Int. Geoscience and Remote Sensing Symp., Boston, Massachusetts, USA, pp. III-250–III-253, 2008. [Google Scholar]
36. J. Kaur and P. Sethi, “Evaluation of fuzzy inference system in image processing,” International Journal of Computer Applications, vol. 68, no. 22, pp. 1–4, 2013. [Google Scholar]
37. S. R. Vishnu, R. R. Nidamanuri and R. Bremananth, “Spectral material mapping using hyperspectral imagery: A review of spectral matching and library search methods,” Geocarto International, vol. 28, no. 2, pp. 171–190, 2013. [Google Scholar]
38. C. Chang, “An information-theoretic approach to spectral variability, similarity, and discrimination for hyperspectral image analysis,” IEEE Transactions on Information Theory, vol. 46, no. 5, pp. 1927–1932, 2000. [Google Scholar]
39. P. S. Thenkabail, R. A. O. Gangadhara, T. W. Biggs, M. Krishna and H. Turral, “Spectral matching techniques to determine historical landuse/land-Cover (LULC) and irrigated areas using time-series 0.1 degree AVHRR pathfinder datasets,” Photogrammetric Engineering & Remote Sensing, vol. 73, pp. 1029–1040, 2007. [Google Scholar]
40. D. Baran and N. Apostolescu, “A virtual dimensionality method for hyperspectral imagery,” Procedia Engineering, vol. 100, pp. 460–465, 2015. [Google Scholar]
41. D. C. Heinz, “Fully constrained least squares linear spectral mixture analysis method for material quantification in hyperspectral imagery,” IEEE Transactions on Geoscience and Remote Sensing, vol. 39, no. 3, pp. 529–545, 2001. [Google Scholar]
42. X. Tao, M. E. Paoletti, J. M. Haut, P. Ren, J. Plaza et al., “Endmember estimation with maximum distance analysis,” Remote Sensing, vol. 13, no. 4, pp. 713, 2021. [Google Scholar]
Cite This Article
 Copyright © 2023 The Author(s). Published by Tech Science Press.
This work is licensed under a Creative Commons Attribution 4.0 International License , which permits unrestricted use, distribution, and reproduction in any medium, provided the original work is properly cited.
 Downloads
 Citation Tools